- GBP/USD Price Analysis: Surges toward 1.2700 on US Dollar weakness
Notícias do Mercado
GBP/USD Price Analysis: Surges toward 1.2700 on US Dollar weakness
- GBP/USD up 0.40%, boosted as the US Dollar Index (DXY) hits a new two-day low.
- Technical outlook neutral to slightly bearish, with RSI signaling bearish momentum.
- Key support levels at 100-DMA (1.2664), 50-DMA (1.2627), 1.2600, and 200-DMA (1.2553).
- Resistance at 1.2700 and 1.2750, with less likelihood of being tested in the near term.
The Pound Sterling climbs sharply against the US Dollar as US Treasury bond yields remain unchanged, but the Greenback remains softer as it falls to a fresh two-day low, as depicted by the US Dollar Index (DXY). With the DXY dropping below 105.50, the GBP/USD rose and traded at 1.2691, up 0.40%.
GBP/USD Price Analysis: Technical outlook
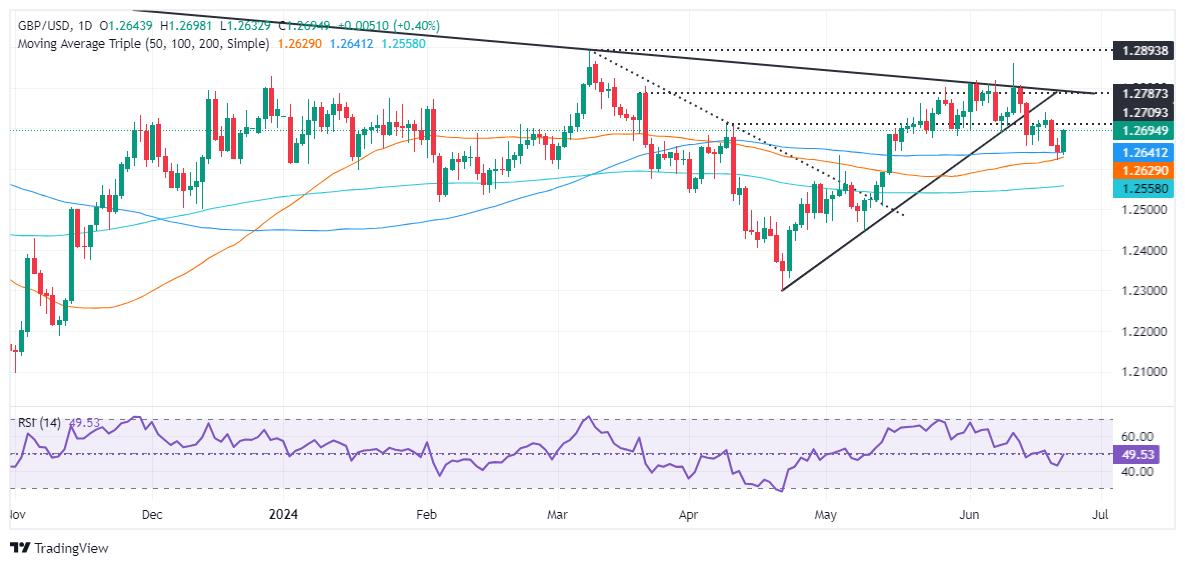
From a daily chart perspective, the GBP/USD is neutral to slightly downward biased, even though the exchange rate trades above the daily moving averages (DMA).
The Relative Strength Index (RSI) turned bearish, hinting that sellers are in charge. It is eyeing a break of key support levels, which, once cleared, could cause the GBP/USD to re-test year-to-date (YTD) lows.
The first support would be the 100-DMA at 1.26643, ahead of the 50-DMA at 1.2627. A further downside lies beneath at 1.2600, exposing the 200-DMA at 1.2553 once surpassed. A breach of the latter, the pair will test 1.2500.
Conversely, and the less likely path in the near term, the GBP/USD first resistance level would be 1.2700. Once hurdle, the next stop would be 1.2750.
GBP/USD Price Action – Daily Chart
