- USD/JPY Price Forecast: Breaks higher, extends counter-trend recovery rally
Notícias do Mercado
USD/JPY Price Forecast: Breaks higher, extends counter-trend recovery rally
- USD/JPY breaks above a critical level and extends its bullish advance.
- Bullish momentum could signal an extension.
- Alternatively it may have completed a three-wave correction which could eventually roll over.
USD/JPY breaks clearly above the 147.24 October 3 high on an intraday basis which suggests a continuation of the short-term uptrend with a tentative target at 149.40, the August 15 high.
USD/JPY Daily Chart
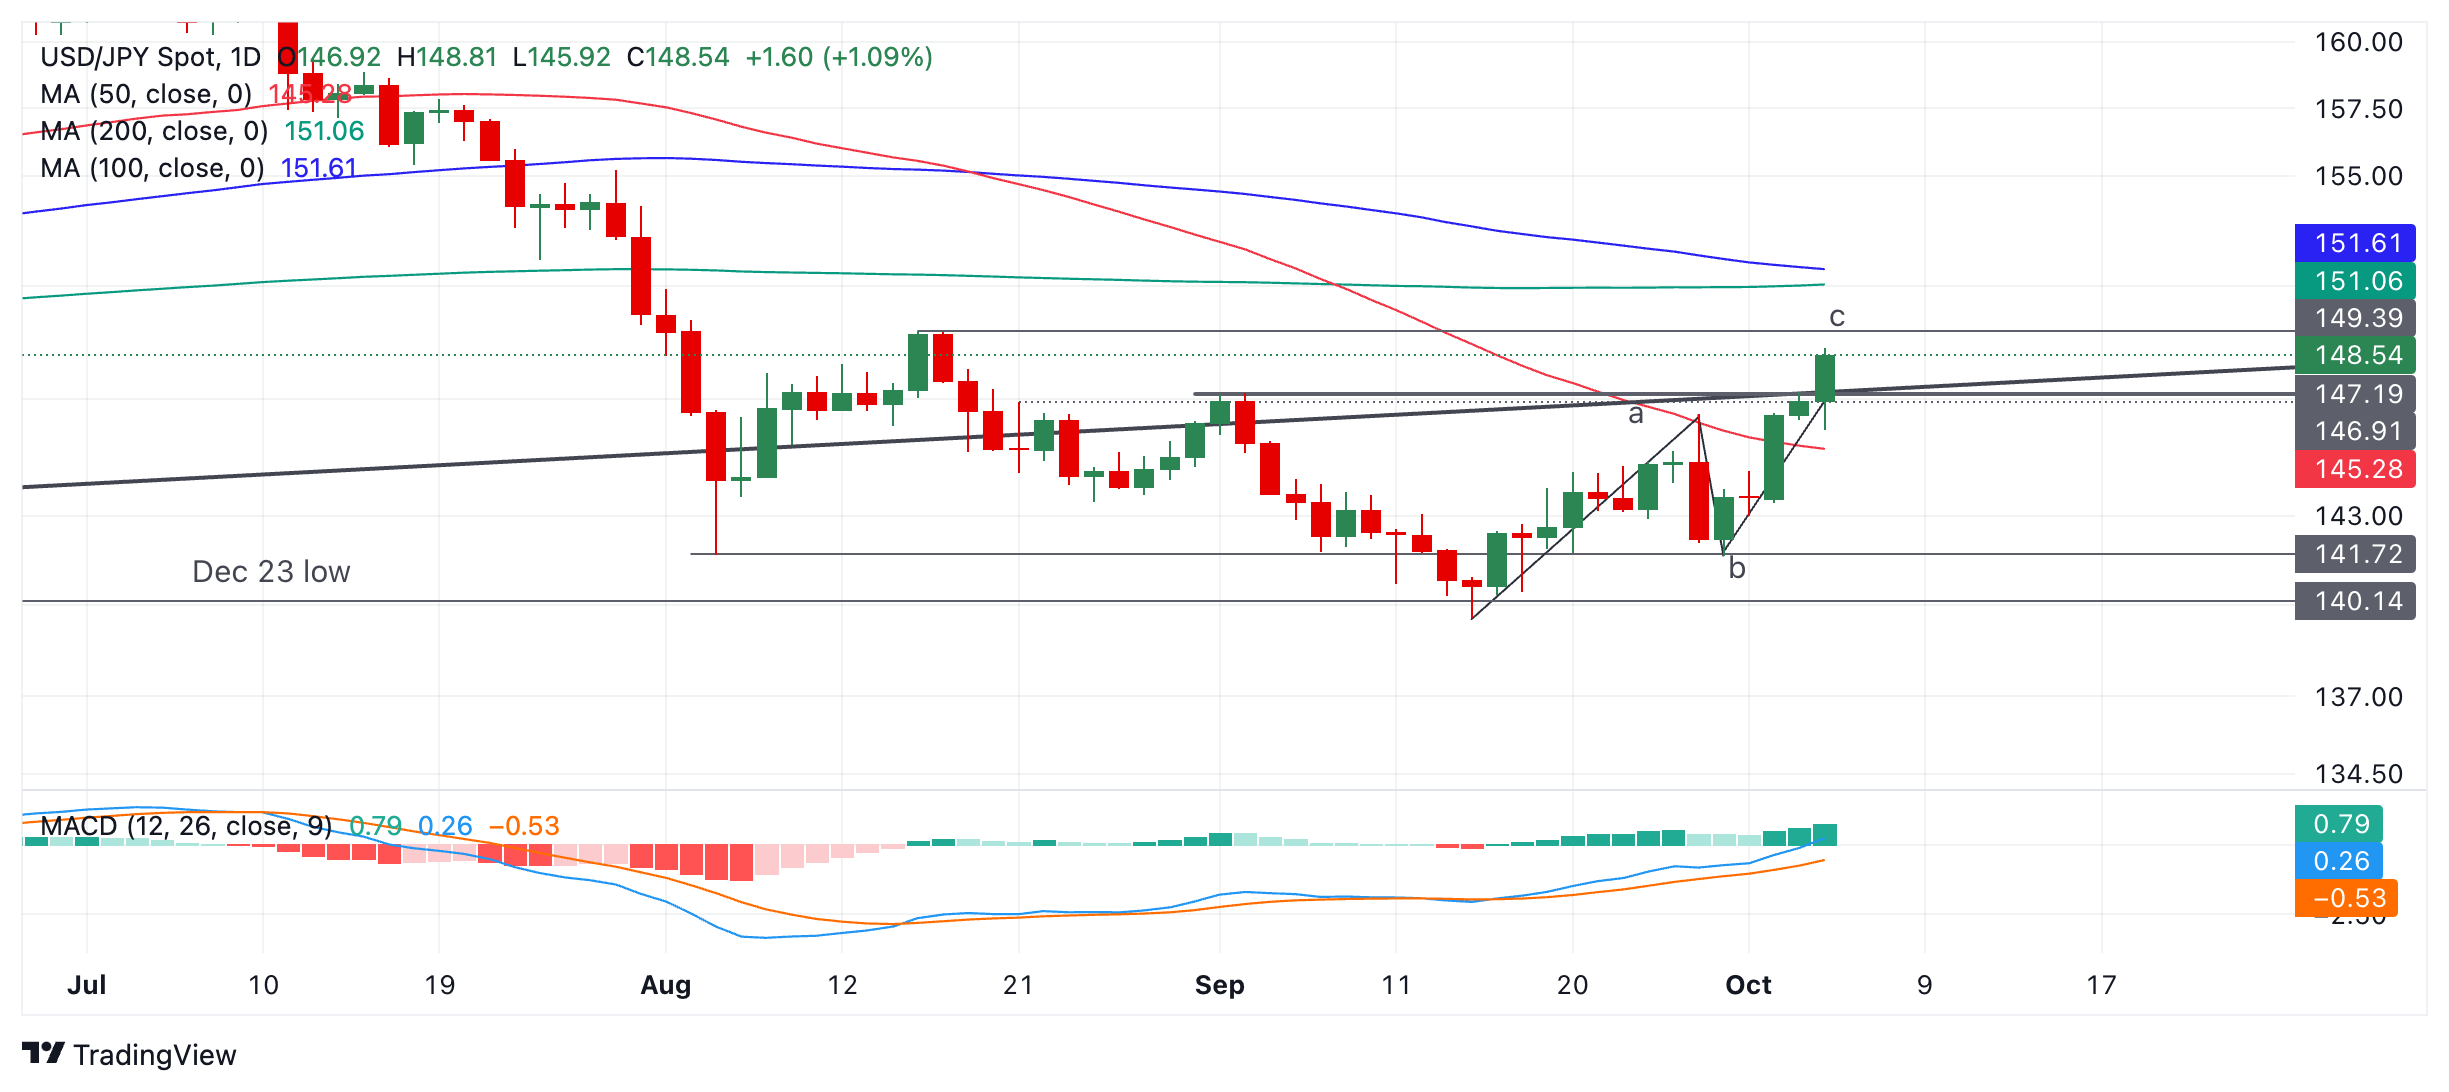
The strong bullish momentum since the August bottom, as measured by the Moving Average Convergence Divergence (MACD) indicator could indicate the start of a new, longer uptrending move.
In addition, the robust recovery from the December ‘23 and September lows – which has taken price back above the major trendline for two days and the key September 2 highs – is further evidence of bullishness.
Alternatively, the pair might also look like it is close to completing an “abc” three-wave corrective pattern of the down move that began after prices rolled over following the July peak.
A close below the 50-day Simple Moving Average (SMA) at 145.24 would probably indicate a resumption of the medium-term downtrend from the summer. Such a move would be expected to reach the wave B lows at around 141.72.