- USD/JPY Price Forecast: Break out fails to follow-through, trend ambiguous
Notícias do Mercado
USD/JPY Price Forecast: Break out fails to follow-through, trend ambiguous
- USD/JPY broke out of its Wedge pattern but failed to fall far and has recovered.
- Underlying weakness shows up in the RSI’s divergence with price and could be a precursor to more weakness.
USD/JPY broke down and out of its Rising Wedge pattern on Friday but has since recovered and returned back inside.
The trend is at a delicate point and it is ambiguous. It is possible that the uptrend could be resuming and pushing price back up in a “last hurrah”.
USD/JPY 4-hour Chart
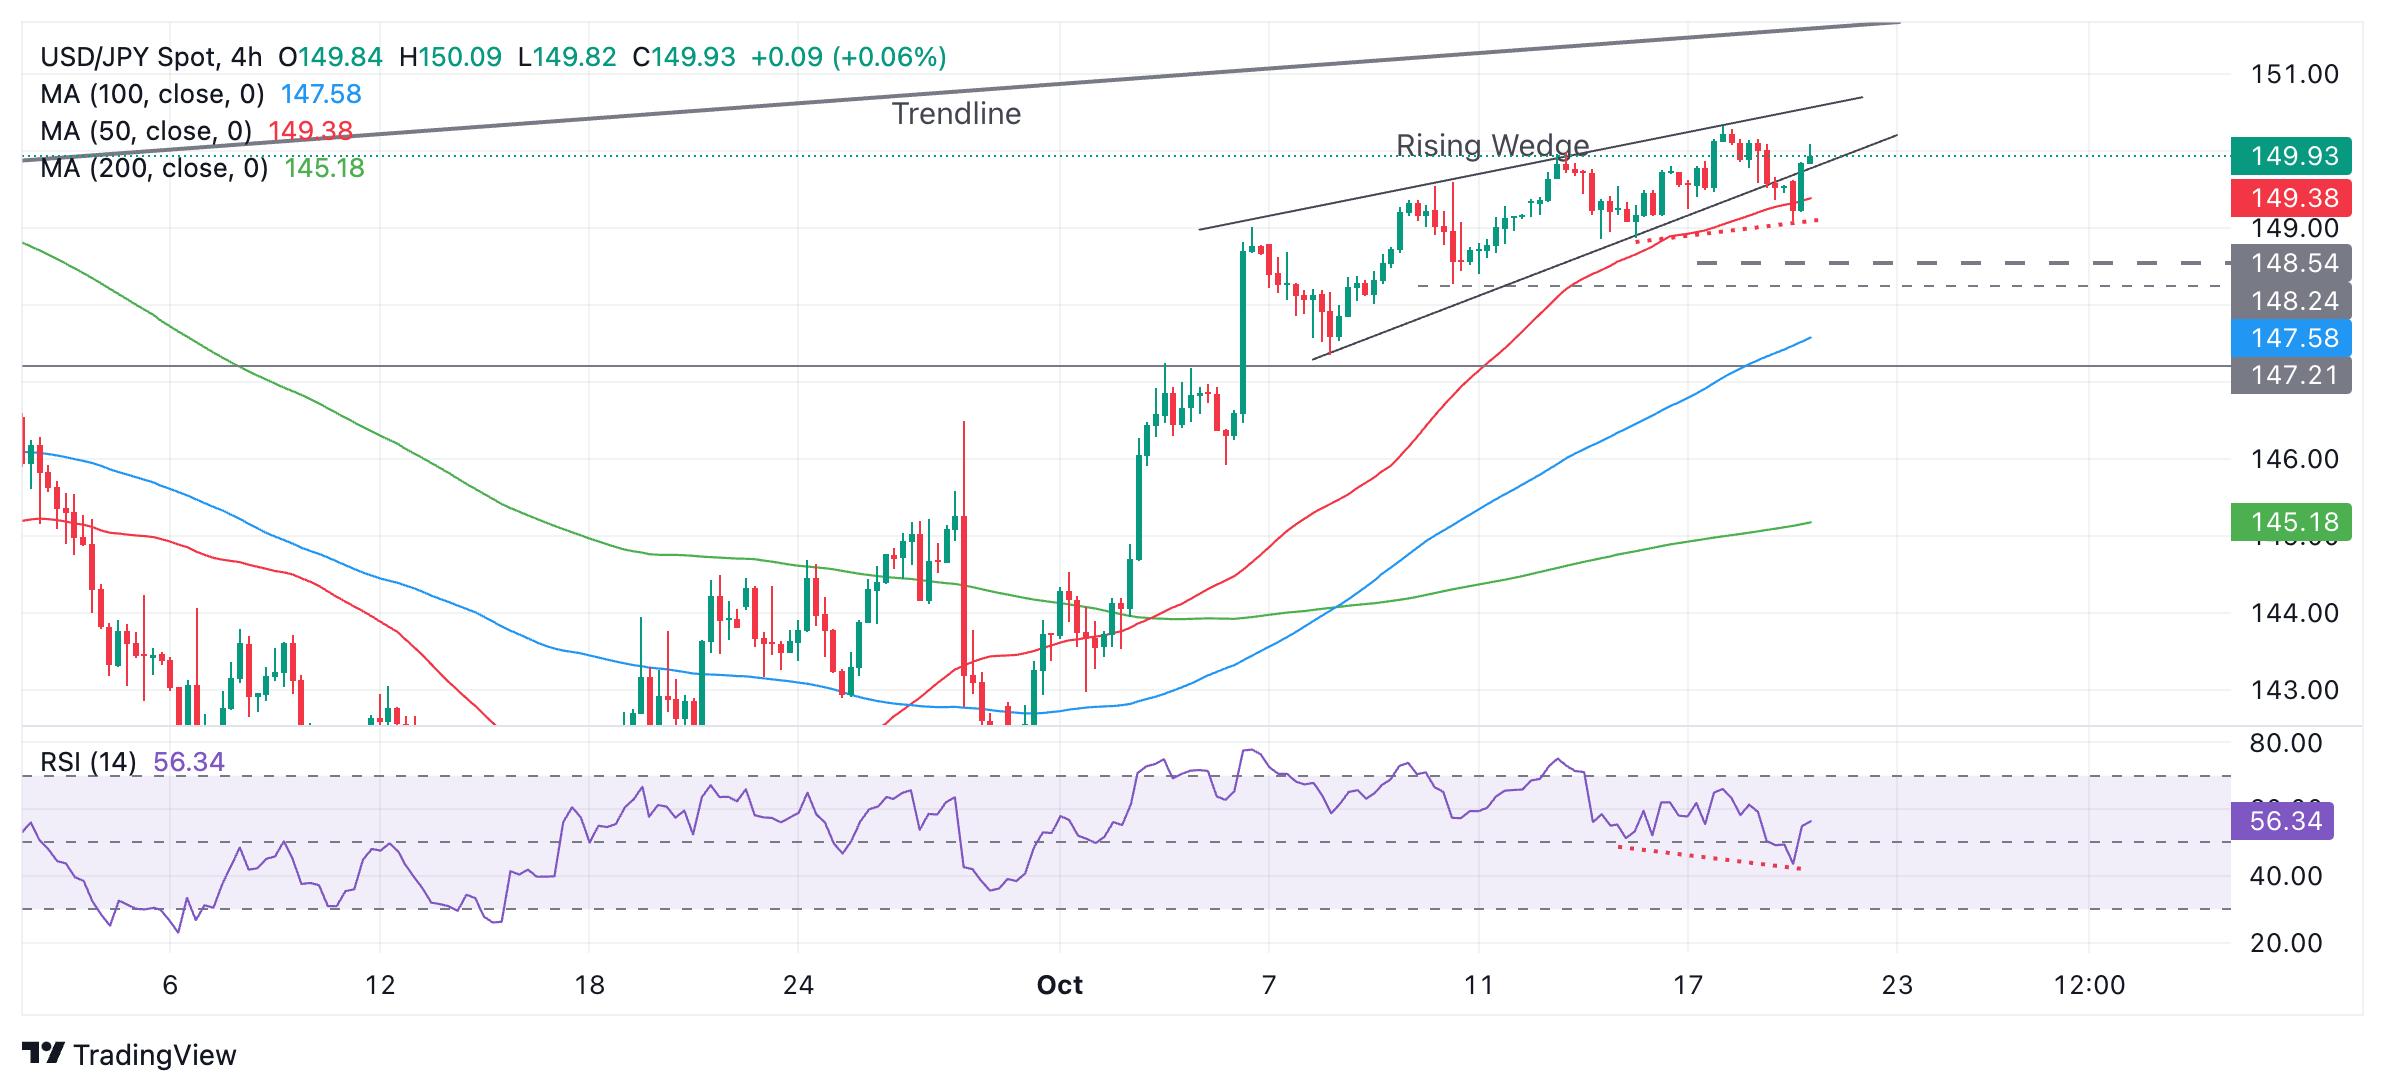
Alternatively, the bearish divergence between the Relative Strength Index (RSI) momentum indicator and price (red dotted lines) when comparing the October 16 and 21 lows is indicative of underlying bearish pressure, which, in turn, could suggest the pair could roll over and begin weakening again.
A break below the 149.09 low formed after the breakout would provide confirmation of more weakness and a change in the short-term trend. This would probably lead to a target at 148.40 as a minimum, which is the 61.8% Fibonacci extrapolation of the height of the wedge lower.
More downside could lead to support at 148.27 (October 10 low) or 147.23 (September 2 high).