Notícias do Mercado
-
23:42
USD/CHF fades bounce off three-month low near 0.9150 ahead of Fed
- USD/CHF struggles to extend the biggest run-up in seven weeks.
- Firmer Swiss inflation data, upbeat equities joined softer Treasury yields to portray corrective bounce off multi-day low.
- Pre-Fed trading lull probes bulls, US ADP Employment Change, ISM Services PMI can entertain traders.
USD/CHF grinds higher around 0.9150, following the notable bounce off a three-month low. That said, the quote consolidates the biggest daily jump since mid-September amid the pre-Fed anxiety and a lack of major data/events.
The risk barometer pair jumped heavily the previous day following Switzerland’s upbeat Consumer Price Index (CPI) and Retail Sales data for October and September respectively. The headline inflation figure cross 1.1% market consensus to 1.2% YoY whereas the Retail Sales jumped past upwardly revised 0.8% previous readouts to 2.5% on the yearly basis.
Other than the strong data at home, mildly optimistic market sentiment, mainly led by the firmer equities, also underpinned the USD/CHF run-up. The Wall Street benchmarks posted a positive daily closing with the fresh record highs of DJI30 and S&P 500. Behind the moves could be the upbeat earnings and hopes that the US Federal Reserve (Fed) may rethink before announcing a heavy consolidation to the easy money policies.
That being said, the S&P 500 Futures print mild losses amid the cautious mood before the Fed meeting. The same joins an absence of major catalysts to move the markets. S&P 50 Futures, on the other hand, adds 0.7 basis points (bps) around 1.55% by the press time.
Moving on, US ADP Employment Change and ISM Services PMI for October may entertain USD/CHF traders ahead of the Fed’s verdict. While the US data prints are likely to arrive as mixed, market players anticipate a $15 billion tapering from the US central bank, any mismatch can propel the quote.
Read: Fed Interest Rate Decision Preview: Inflation, employment and interest rates
Technical analysis
In addition to the 200-DMA level surrounding 0.9155, a downward sloping trend line from October 12, close to 0.9175, also challenge USD/CHF buyers.
-
23:21
Silver Price Analysis: 50-DMA probes XAG/USD bears on the way to $22.80
- Silver bears take a breather following the heaviest fall in five weeks.
- Pre-Fed trading lull allows 50-DMA to question further downside.
- Clear break of a multi-day-old support line, bearish MACD favor sellers.
Silver (XAG/USD) struggles to defend the bounce off a three-week low, recently sidelined around $23.50, during Wednesday’s Asian session.
That said, the 50-DMA level surrounding $23.40 probes the bright metal’s immediate downside amid cautious sentiment ahead of the US Federal Reserve (Fed) meeting.
Even so, a successful break of an ascending trend line from October 29 and a bearish cross by the MACD line keep silver sellers hopeful to visit a horizontal area comprising multiple levels marked since August 20, around $22.90-80.
It should be noted, however, that the metal’s weakness past $22.80 may find multiple supports near above $22.00, a break of which will direct the quote towards the yearly bottom surrounding $21.42.
Meanwhile, corrective pullback needs to cross the support-turned-resistance line, at $24.05 by the press time, to recall the buyers.
Following that, October’s high of $24.82 and September’s peak near $24.85 will be in focus.
Silver: Daily chart
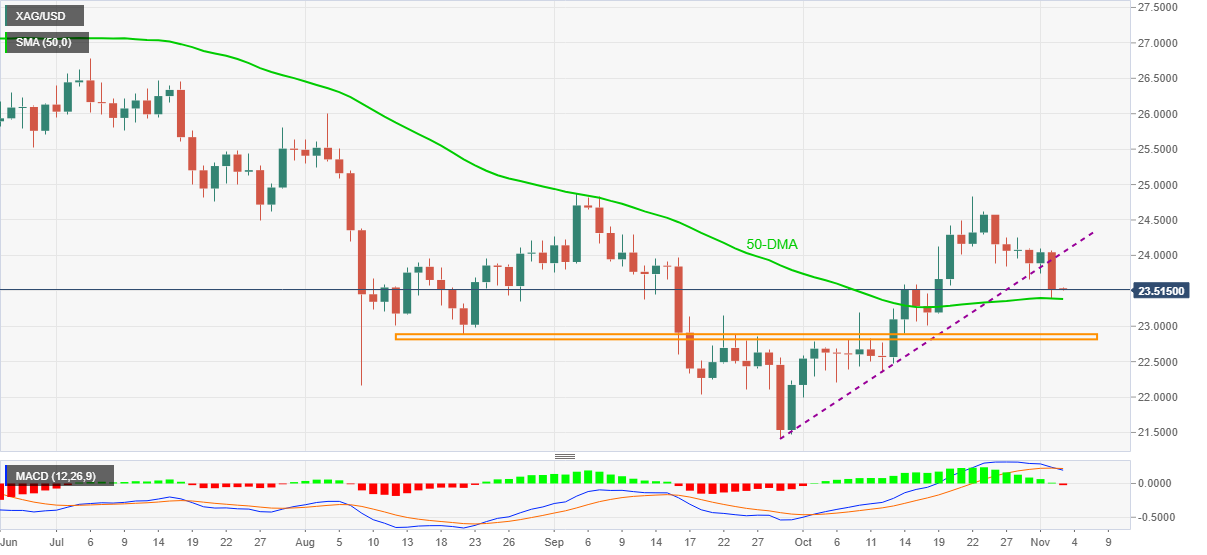
Trend: Further weakness expected
-
23:20
EUR/JPY recovers well from sell-off into the FOMC
- EUR/JPY holds steady ahead of the main FOMC event today.
- Eurozone data is also in focus and so too will be equities.
EUR/JPY rallied in Europe from a low of 131.47 to a high of 132.10 recovering from the drop in EUR/USD that slipped from 1.1610 to 1.1580. Equity market sentiment remained upbeat, the Russell 2000 joining the S&P 500 in printing record highs which helped to keep the equity tracking cross supported. At the time of writing, EUR/JPY is trading at 131.98 and is exte to remain subdued with Japanese holidays and the forthcoming conclusion of the Federal Open Market Committee meeting.
In data overnight, Manufacturing was slightly weaker than expected in October for the euro area. Manufacturing slowed in Germany and France but lifted in Italy. The main weakness in the series last month was in output, which fell 2.4pts to 53.3. Meanwhile, the Markit Services PMIs for Europe and the UK will be the final release for the month. September’s Euro Area unemployment rate report will reflect continued recovery.
FOMC in focus
As for the main event, the FOMC has the market positioned for a tapering announcement following guidance from the central bank which has managed expectations perfectly in terms of preparing the markets for what is likely to be speed tapering.
'Most officials seem to agree that it’s better to get tapering over as quickly as possible in order to leave the Fed maximum flexibility to hike rates when needed,'' analysts at Brown Brothers Harriman explained. ''We believe that the most likely path for tapering has already been flagged by the Fed, which would reduce asset purchases by $15 bln per month ($10 bln UST and $5 bln MBS).''
Equities will be a key component to the performance in EUR/JPY today and the outcome of the Fed will be crucial in terms of things of a rate hike and the implications for stock markets built up on cheap money. With that being said, there could be more fireworks in US jobs data this week. The employment component of 52.0 is the highest since July when 57k manufacturing jobs were added out of 1.09 mln total NFP gain. All in all, this was a very solid report,'' analysts at Brown Brothers Harriman said. ISM services PMI will be reported Wednesday and so too will the ADP jobs report. The current consensus is 450k and we suspect it will creep higher.
-
23:16
AUD/NZD marching towards 1.0400 after positive NZ economic data
- New Zealand Unemployment Rate fell 0.5%, down to 3.4%.
- Australian PMI’s figures were better than expected, though overshadowed by the NZ employment numbers.
- AUD/NZD dipped to 1.0417 on the release of the NZ employment figures.
As the Asian session begins, the AUD/NZD slumps 0.15% during the day, trading at 1.0430 at the time of writing. Better than expected macroeconomic data out of New Zealand and Australia is the driver of the session, favoring the prospects of the New Zealand dollar.
New Zealand Unemployment Rate fell 0.5%, down to 3.4%, matching 2007 record low
On Wednesday, Statistics of New Zealand revealed employment figures for the third quarter. Employment Change rose by 2%, higher than the 0.4% estimated, whereas the Unemployment Rate for the same period increased to 3.4%, better than the 3.9% foreseen by analysts.
“The number of unemployed fell by 18,000 over the quarter to 98,000, which, combined with 54,000 more people in employment, drove the unemployment rate down,” Statistics of NZ said.
The drop in the unemployment figure would likely exert pressure on the RBNZ to raise rates faster, after a jump in inflation to 4.9% in the September reading.
At the same time, the RBNZ Governor Adrian Orr was hosting a media conference on financial stability, as the employment figures crossed the wires, declining to comment on the implications for monetary policy. He said that “labor market data, and economic data in general, was highly volatile at present.”
In the meantime, the Australian economic docket featured Markit PMI’s for October. The Services PMI came at 51.8 versus a 45.5 in September. For the same period, the Markit Composite PMI expanded to 52.2, higher than the 46.5 seen in the previous month.
FX Market Implications
The AUD/NZD dropped 36 pips, from 1.0453 to 1.0417, once New Zealand employment figures crossed the wires.
-
23:01
AUD/USD steadies above 0.7400 after RBA-led slump, focus on Fed
- AUD/USD seesaws in a 15-pip trading range after the biggest daily fall in five months.
- RBA’s rejection to rate hike before 2024, YCC move pleased bears earlier.
- Pre-Fed trading lull battles firmer equities, gold’s retreat.
- Second-tier Aussie data will join US ADP Employment Change, ISM Services PMI to entertain traders.
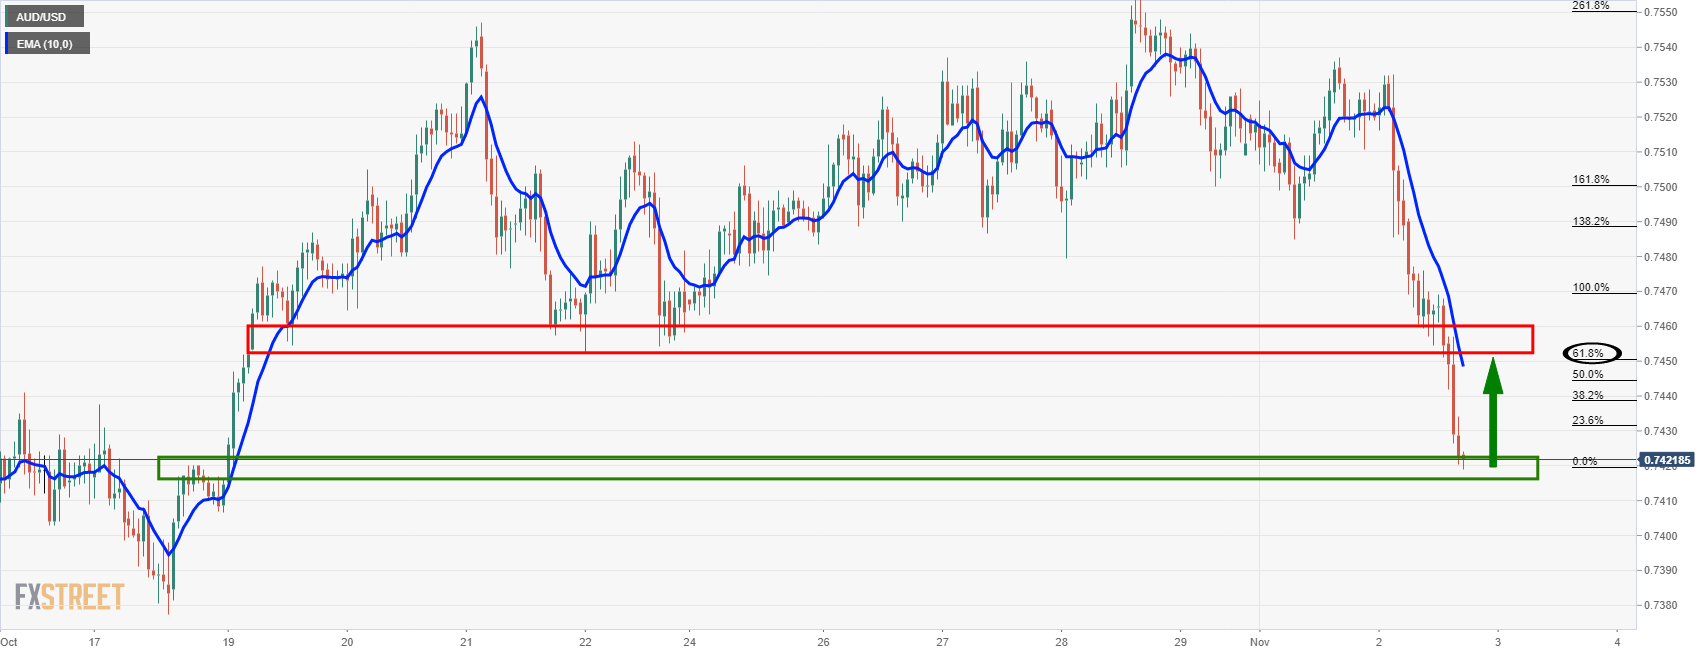
AUD/USD remains sidelined above 0.7400, recently retreating from 0.7430, following the heaviest daily slump since June. That said, the quote stays within a 15-pip trading range between 0.7420 and 0.7435 during the initial Asian session on Wednesday.
With the Reserve Bank of Australia’s (RBA) double whammy of attacks on the hawks, AUD/USD prices dropped heavily post monetary policy decision. Adding to the bearish sentiment were chatters surrounding China’s indirect warning of bad winter and market fears ahead of the US Federal Reserve (Fed) meeting, up for moving markets during today’s North American session.
RBA not only dropped the Yield Curve Control (YCC) but also pushed back the rate hikes till 2024 during the previous day’s monetary policy meeting, allowing traders to consolidate October’s heavy gains. On the other hand, China’s Commerce Ministry urged families to have enough storage of food during the winter on Tuesday.
On the contrary, US stimulus chatters and easing covid numbers in Australia allowed AUD/USD to stabilize around a three-week low. Also putting a floor under the prices was the firmer equities, on the back for strong earnings, as well as downbeat US Treasury yields.
It’s worth noting that the market’s cautious mood ahead of the Fed meeting and an absence of major data/events in Australia helps the Aussie traders to lick their wounds of late.
Looking forward, the quote is likely to remain sidelined, may witness corrective pullback on firmer second-tier housing data at home, ahead of the Fed’s verdict. Though, expectations of Fed tapering may keep exerting the downside pressure on the prices and may please bears should the announcement crosses the $15 billion trimming per the market consensus.
Read: Fed Interest Rate Decision Preview: Inflation, employment and interest rates
Before the Fed, US ADP Employment Change for October and ISM Services PMI for the said month may also entertain traders.
Technical analysis
AUD/USD confirmed a rising wedge bearish chart pattern following the RBA’s verdict to give up the bond yield targeting, as well as pushing back any rate hikes until 2024. Also confirming the quote’s further weakness is the bear’s dominance past convergence of 0.7460 level, comprising the 100-SMA and an ascending trend line from September 29. Looking ahead, three-week-old horizontal support near 0.7380 will precede the 200-SMA level near 0.7360 to lure the sellers.
-
22:50
Australia Commonwealth Bank Composite PMI fell from previous 52.2 to 52.1 in October
-
22:50
Australia Commonwealth Bank Services PMI below expectations (52) in October: Actual (51.8)
-
22:23
Australia AiG Performance of Construction Index rose from previous 53.3 to 57.6 in October
-
22:20
RBNZ’s Orr: The labor market data is extremely volatile at the moment
Reserve Bank of New Zealand (RBNZ) Governor Adrian Orr gave his opinion on the recently released strong Q3 NZ jobs report while speaking on the bi-annual Financial Stability Review (FSR).
“The labor market data is extremely volatile at the moment,” said the RBNZ Boss..
RBNZ's Orr also said, per Reuters, "GDP figures becoming increasingly difficult to understand given COVID-19 volatility."
Adding to that were the comments from the RBNZ Deputy Governor Geoff Bascand suggesting if risks are low, debt-to-income limitations may not be necessary.
FX reaction
NZD/USD remains inactive despite the strong data and comments from RBNZ officials as the pre-Fed trading lull dominates the market sentiment.
Read: NZD/USD stays around 0.7100 despite strong New Zealand Q3 Employment data
-
22:07
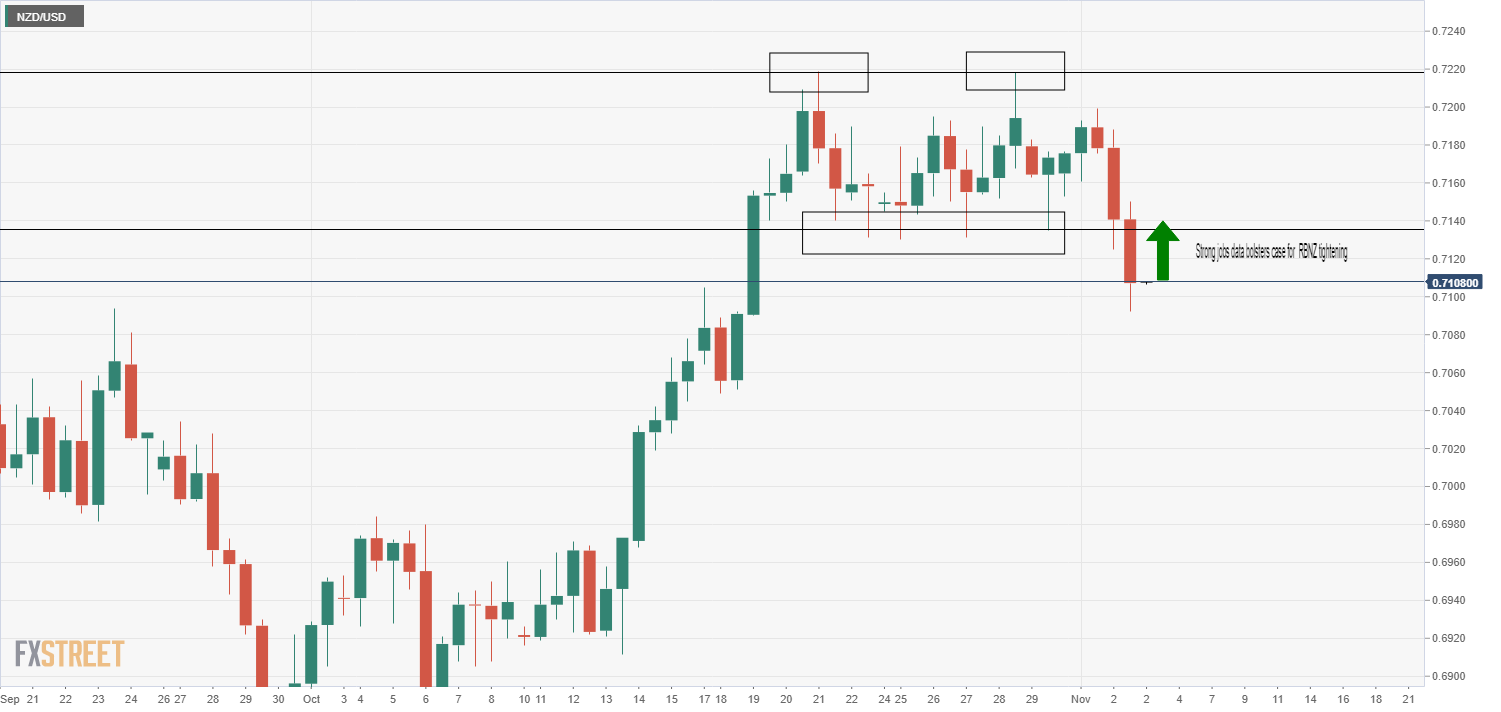
NZD/USD stays around 0.7100 despite strong New Zealand Q3 Employment data
- NZD/USD consolidates the heaviest daily fall in five weeks.
- New Zealand Unemployment Rate dropped to 3.4%, Employment Change rose 2.0% in Q3.
- Pre-Fed sentiment may offer dull markets but US ADP, ISM Services PMI can offer intermediate moves.
NZD/USD pays a little heed to the strong Q3 New Zealand (NZ) jobs data, licking wounds near a two-week low surrounding 0.7100. That said, the kiwi pair dropped the most in five weeks the previous day before the bears took a breather during the early Wednesday morning in Asia.
That said, NZ Q3 Employment Change provided a strong beat to the 0.4% expected and 1.0% prior with the 2.0% figures while the Unemployment Chang also dropped heavily past 4.0% previous readouts and 3.9% market consensus to 3.4% during the stated period.
Read: New Zealand Unemployment beats forecasts, NZD firms
Earlier in the day, the Reserve Bank of New Zealand’s bi-annual Financial Stability Review (FSR) report said, “We expect banks to be more cautious about high debt-to-income loans given the risks of rising interest rates and the economic outlook.”
It’s worth mentioning that New Zealand’s fortnightly release of the GDT Price Index jumped 4.3% versus 2.2% prior.
The Kiwi pair’s refrain from reacting to the upbeat fundamentals at home could be linked to the RBNZ’s already announced rate hike and the Reserve Bank of Australia’s (RBA) firm commitment to hold the benchmark rates unchanged before 2024, as announced the previous day. On the same line could be the market’s wait for the US Federal Reserve’s (Fed) monetary policy announcement amid tapering tantrums. Furthermore, China’s appeal to local governments to help families store enough foods for this winter pushed the traders towards skepticism and weighed on the NZD/USD prices. Alternatively, firmer equities and hopes of US stimulus restrict immediate declines of the Kiwi pair, not to forget upbeat fundamentals at home.
Amid these plays, the Wall Street benchmarks closed positive with the DJI 30 and S&P 500 refreshing record top while the US 10-year Treasury yields dropped to 1.55%.
Looking forward, the pre-Fed trading lull could challenge the NZD/USD moves but monthly releases of the US ADP Employment Change and ISM Services PMI may entertain intraday traders. Should the Fed announce a higher-than-expected $15 billion per month tapering, the Kiwi pair has further south to trace.
Read: Fed Interest Rate Decision Preview: Inflation, employment and interest rates
Technical analysis
NZD/USD not only broke a two-week-old trading range but also slipped below 61.8% Fibonacci retracement (Fibo.) of May-August downside, around 0.7120, which in turn suggests further downside by the pair. However, the 200-DMA level near 0.7100 becomes a tough nut to crack for the bears before targeting August month’s high and 50% Fibonacci retracement, respectively around 0.7090 and 0.7060. Alternatively, the 61.8% Fibo. level near 0.7120 will precede the lower end of the stated range, close to 0.7130, will probe the NZD/USD pair’s short-term rebound. Following that, September’s high of 0.7171 could lure the bulls.
-
21:47
USD/CAD reclaims 1.2400 amid risk-on market sentiment, ahead of the Fed
- USD/CAD bounces off 1.2350 daily lows, trimming Monday’s losses.
- Risk-on market sentiment in equity markets, in the FX market, safe-haven assets have the upper hand.
- USD/CAD bullish above 1.2528, otherwise sellers are in control.
USD/CAD climbs during the New York session, up 0.30%, trading at 1.2406 at the time of writing. As the North American session winds down, the market sentiment is upbeat, with the S&P 500 and the Dow Jones Industrial printing new all-time highs, while the Nasdaq Composite finished in the green.
Earlier in the Asian session, the USD/CAD pair was changing hands around the 1.2350 area, Tuesday’s low. But once European traders got to their desks, the pair broke to the upside, printing a daily high at 1.2420, retreating later, settling at current levels.
That said, FX markets dynamics were more risk-averse in contrast to equity markets. Safe-haven currencies like the greenback and the Japanese yen got a boost as investors got ready for the Federal Reserve meeting.
Investors expect a bond taper announcement by the US central bank, as telegraphed by the parade of Fed speakers in the last month. Also, Fed Chairman Jerome Powell, in a Bank of International Settlements virtual event, said that “I do think its time to taper.” Furthermore, Powell added: “I don’t think it is time to raise rates,” pushing back the expectations of a hike rate.
In the outcome of a hawkish Federal Reserve, an upward move in the USD/CAD pair would be capped because the Bank of Canada (BoC) is one step ahead of the Fed, as the BoC ended its QE program, as it gets ready for hiking rates.
USD/CAD Price Forecast: Technical outlook
Daily chart
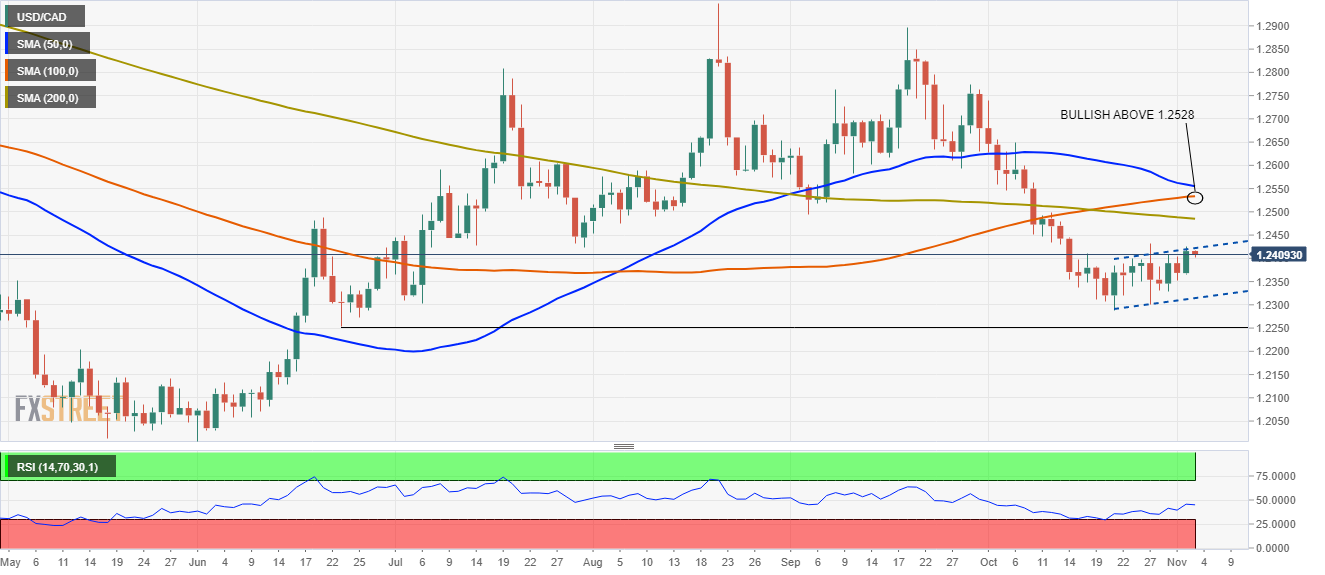
The USD/CAD depicts the pair is under some buying pressure, as witnessed by the loonie testing the top of a bearish flag pattern around 1.2406, which would invalidate the pattern in case of being upward broken. Furthermore, the daily moving averages (DMA’s) are above the spot price, with the longer time frame 200-DMA, beneath the short time-frame ones.
For USD bulls, a break above the channel’s top would immediately expose the 200-DMA at 1.2483. The next resistance level would be the 100-DMA at 1.2528.
On the flip side, USD/CAD bull’s failure at 1.2400 leave sellers in control. To accelerate the downward trend, they need a break below 1.2300. Once that is achieved, the next stop on the way south would be the June 23 low at 1.2252.
-
21:47
New Zealand Unemployment beats forecasts, NZD firms
New Zealand Unemployment beat forecasts which are supporting the NZD/USD rate that trades 0.15% on the day so far.
The New Zealand Unemployment rate for the third quarter (Q3) arrived at 3.4% vs the estimated 3.9% and previous 4.0%.
The New Zealand Employment Change (Q/Q) Q3 came in at 2.0% vs the estimated 0.4% and the prior 1.0%; with the previous revised to 1.1%).
Meanwhile, the New Zealand Average Hourly Earnings (Q/Q) Q3 came in at 1.2% vs the estimated 1.5% and the previous 0.7%.
The Kiwi started the day off lower as the currency tracked a lower Aussie following the Reserve Bank of Australia saying that it was prepared to be patient.
''That looks to have caught a market looking for a more upbeat tone off guard, and the AUD slipped. From here on in, it’s up to the data, and the outlook could change quickly, as it did here,'' analysts at ANZ Bank said.
However, this labour market data is likely going to help stop the rot in NZD for the session ahead, especially with the Participation Rate jumping to 71.2% from 70.5% prior.
About the Unemployment Rate
The Unemployment Rate released by the Statistics New Zealand is the number of unemployed workers divided by the total civilian labor force. If the rate is up, it indicates a lack of expansion within the New Zealand labor market. As a result, a rise leads to weaken the New Zealand economy. A decrease of the figure is seen as positive (or bullish) for the NZD, while an increase is seen as negative (or bearish).
-
21:46
New Zealand Employment Change came in at 2%, above expectations (0.4%) in 3Q
-
21:46
New Zealand Labour Cost Index (QoQ) came in at 0.7% below forecasts (0.8%) in 3Q
-
21:46
New Zealand Labour Cost Index (YoY) below expectations (2.6%) in 3Q: Actual (2.5%)
-
21:46
New Zealand Participation Rate above expectations (70.6%) in 3Q: Actual (71.2%)
-
21:45
New Zealand Unemployment Rate below expectations (3.9%) in 3Q: Actual (3.4%)
-
21:45
New Zealand: Unemployment Rate, Quarter III 3.4% (forecast 3.9%)
-
21:45
New Zealand: Employment Change, q/q, Quarter III 2% (forecast 0.4%)
-
21:35
GBP/USD Price Analysis: Bears bracing for a bumpy road to 1.3570
- GBP/USD grinds lower around mid-October lows after three-day downtrend.
- Bearish MACD, sustained trading below 50-DMA favor sellers.
- Horizontal supports from August and July test immediate downside.
GBP/USD licks its wounds around 1.3620, the lowest level in three weeks as traders brace for the key Wednesday morning in Asia.
Although a clear downside break of 50-DMA and bearish MACD signals back the GBP/USD sellers, nearness to the key support zones and the RSI line’s proximity to the oversold area can put a floor under the prices.
That being said, a horizontal area comprising multiple lows marked since August 20, around 1.3600-3610 acts as an immediate challenge for the pair bears before targeting another support region surrounding 1.3575-70, stretched from July.
Should the quote refrain from bouncing off 1.3570, the 1.3500 threshold may offer an intermediate halt before dragging the quote to the yearly bottom close to 1.3410.
On the contrary, an upside clearance of 50-DMA level of 1.3710 isn’t a green pass to the GBP/USD buyers as the late September’s swing high close to 1.3750 and October’s peak of 1.3833 could challenge the bulls before giving them controls.
To sum up, GBP/USD remains weak but has strong supports on the downside to limit the short-term declines.
GBP/USD: Daily chart
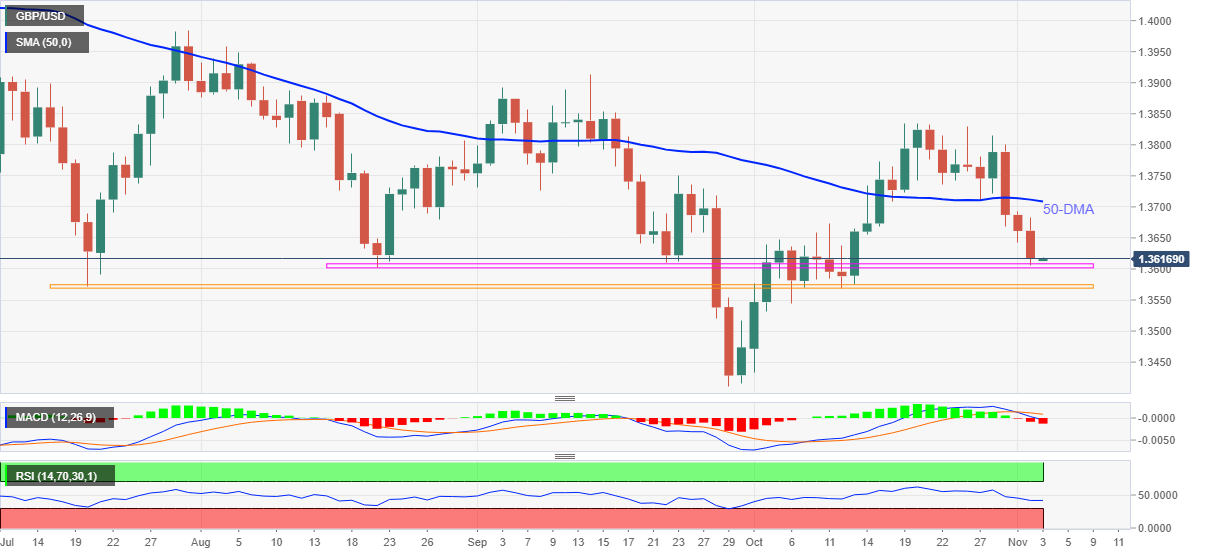
Trend: Further weakness expected
-
21:30
Australia: AiG Performance of Construction Index, October 57.6
-
21:27
When is the New Zealand Q3 employment data and how could it affect NZD/USD?
New Zealand quarterly employment report overview
Early Wednesday in Asia, at 21:45 GMT Tuesday the world over, the global market sees the second-quarter (Q3) 2021 employment data from Statistics New Zealand.
Although the Reserve Bank of New Zealand (RBNZ) has already announced the much-awaited interest rate hike, the anticipated strength in the jobs report may propel the Kiwi central bank towards some more, which in turn makes today’s decision the key.
Market consensus suggests a reduction in the headline Unemployment Rate to 3.9% from 4.0% and a softer Employment Change figure of 0.4% versus 1.0% previous readouts. Further, the Participation Rate may also inch up from 70.5% to 70.6%, per forecasts.
Ahead of the data, ANZ said,
New Zealand wage growth is expected to be impacted by inflation and contribute to inflation. The ‘great resignation’ in NZ details how the churn in our labor market slowed last year, but is expected to take off again this year. The tight labor market is providing workers with plenty of options and these are readily being taken up, following limited movement of workers last year. Today’s labor market data will provide a steer on wage inflation, the participation rate and unemployment.
How could it affect the NZD/USD?
NZD/USD edges lower around 0.7100 ahead of the key NZ data during Wednesday’s Asian session. In doing so, the Kiwi pair bears the burden of the Reserve Bank of Australia’s (RBA) firm commitment to wait for a rate hike until 2024, coupled with the pre-Fed caution.
The RBNZ has already hinted towards a firmer employment scenario and is ready to act as and when needed. This joins the job market's previous weakness to keep NZD/USD bulls hopeful of firmer data and the pair’s rebound. However, expectations surrounding the Fed’s tapering and a speech by the RBNZ Governor Adrian Orr following the data will keep the Kiwi traders guessing.
Technically, a clear downside break of a two-week-old trading range directs NZD/USD towards the 61.8% Fibonacci retracement of the May-August downside and the 200-DMA, respectively around 0.7120 and 0.7100 but further weakness will be challenged by the RSI conditions.
Key Notes
NZD/USD slips below key support, consolidates at 200DMA ahead of key NZ jobs report
RBNZ: Higher global interest rates could prove to be a headwind to asset prices
About New Zealand unemployment rate and employment change
The quarterly report on New Zealand's unemployment rate and employment change is being released by Statistics New Zealand.
The unemployment rate is the number of unemployed workers divided by the total civilian labor force. If the rate is up, it indicates a lack of expansion within the New Zealand labor market. As a result, a rise leads to weaken the New Zealand economy. A decrease of the figure is seen as positive (or bullish) for the NZD, while an increase is seen as negative (or bearish).
On the other hand, employment change is a measure of the change in the number of employed people in New Zealand. Generally speaking, a rise in this indicator has positive implications for consumer spending which stimulates economic growth. A high reading is seen as positive (or bullish) for the NZ dollar, while a low reading is seen as negative (or bearish).
-
21:01
Gold Price Analysis: Bulls run into a wall of resistance at the 61.8% golden ratio
- Gold is meeting a critical level of resistance ahead of the FOMC outcome on Wednesday.
- Technicians will be looking for a downside continuation from a daily perspective.
The price of gold fell some 0.3% to $1,786.45/oz overnight from a high of $1,796.43 while market participants stayed focused on the Federal Open Market Committee meeting which is now underway. The US dollar is firmly holding the 94 figure as per the DXY, an index that measure's the greenback vs a number of rival and major currencies.
FOMC in focus
In the interim, the US markets were buoyed by positive earnings data while awaiting the Federal Reserve Governor Jerome Powell’s post FOMC presser that will focus on a more evenly balanced assessment of inflation risks. The market has fully priced in the Fed's expected tapering announcement and will be looking for any clues as to when the central bank will begin raising rates, similar to last week's European Central Bank meeting.
'Most officials seem to agree that it’s better to get tapering over as quickly as possible in order to leave the Fed maximum flexibility to hike rates when needed,'' analysts at Brown Brothers Harriman explained. ''We believe that the most likely path for tapering has already been flagged by the Fed, which would reduce asset purchases by $15 bln per month ($10 bln UST and $5 bln MBS).''
The Fed will start tapering this month so that QE effectively ends by mid-2022, according to the analysts at BBH. The market has taken that process a step further and is pricing in around 50% odds for liftoff in Q2. ''Q3 liftoff is already fully priced in,'' they explained, ''followed by another hike fully priced in for Q4. This is much more aggressive than what the Fed itself anticipates, at least in the current Dot Plots. We suspect the Fed will try to push back a bit against such aggressive tightening expectations, but we are not sure that the market will listen.''
US jobs market a key event
Meanwhile, US data will be a key focus this week also. Yesterday, October ISM Manufacturing PMI came in strongly at 60.8 vs. 60.5 expected and 61.1 in September. Readings above 60 are rare and yet here we are above 60 for 8 of the past 11 months. Looking at the components, employment came in at 52.0 vs. 50.2 in September, which could be symbolic of a healthy Nonfarm Payrolls report at the end of the week where forex volatility could be highest, depending on the outcome.
''Employment component of 52.0 is the highest since July, when 57k manufacturing jobs were added out of 1.09 mln total NFP gain. All in all, this was a very solid report,'' analysts at Brown Brothers Harriman said. ISM services PMI will be reported Wednesday and so too will the ADP jobs report. The current consensus is 450k and we suspect it will creep higher.
Analysts at TD Securities argued that the US Nonfarm Payrolls likely reaccelerated in October, consistent with a fading of Delta's drag as well as a smaller education-related drop in government jobs than in September. ''We reiterate that pricing for Fed hikes remains far too hawkish, but the outlook for hikes will become increasingly dependent on the Fed's jobs mandate, setting up this week's nonfarm payroll number as a show-stealer.''
''With that said'', the analysts added, ''despite the keen focus on pricing the Fed's exit, recent pressure on gold has abated, prompting CTAs to begin to cover some of their short positions. Furthermore, a potential break higher would bring the $1830/oz level into sight, which represents a key level to shift momentum toward a notable uptrend.
Gold technical analysis

The price of the yellow metal has found the resistance of the M-formation's neckline that meets the dynamic trendline resistance also. This reinforces the prospects of a downward continuation having hit the 61.8% golden Fibonacci retracement level.
-
21:00
South Korea FX Reserves registered at 469.21B, below expectations (471.08B) in October
-
20:56
EUR/JPY holds above key short-term support at 131.50 ahead of Lagarde speech
- EUR/JPY held above last week’s lows around 131.50 after bouncing from its 21DMA on Tuesday.
- ECB President Lagarde delivers a speech on Wednesday that could be market moving.
Ahead of the close of Tuesday FX market trade, EUR/JPY has been able to remain supported above last week’s lows in the 131.50 region. Early on during Tuesday’s European session, the pair was probing the recent lows, but after briefly touching its 21DMA (at 131.47 at the time, now at 131.53), buyers came in to push the pair back towards the 132.00 level, where is has spent most of the rest of the session trading.
There isn't much by way of important European or Japanese economic or central bank events for the remainder of the week, aside from a speech at 1015GMT on Wednesday from ECB President Christine Lagarde. In wake of last week’s ECB meeting, EUR rate markets saw further hawkish repricing (futures markets point to roughly 60bps worth of tightening by the end of 2022), after markets deemed Lagarde’s pushback against the idea of rate hikes in 2022 as insufficiently dovish. She may want to use the speech to rectify that mistake and send a more clear cut message that, in light of the ECB’s recently adopted strategy review which saw the bank raise its inflation target to a 2.0% symmetric one from “close to but just below 2.0%”, the ECB will not be hiking interest rates in 2022.
Otherwise, EUR/JPY is likely to be left to trade off of global dynamics; Wednesday’s Fed meeting, Thursday’s BoE meeting and Friday’s US October labour market report will be the main events to watch. Any signs that these events are giving a boost to long-term US and European bond yields could broadly weigh on JPY and could thus help propel EUR/JPY back towards last week’s highs close to 133.00. Conversely, if support at 131.50 does go, that could open the door to a move lower the next area of support at 130.70 (the 3 September high) and the 50DMA at 130.40. However, if US (and global) equities remain as well supported as they currently are, it seems unlikely that the safe-haven JPY will be able to muster sufficient strength for such a move.
-
20:46
United States API Weekly Crude Oil Stock: 3.594M (October 29) vs 2.318M
-
20:39
S&P 500 posts fourth consecutive record close, Dow clinches 36K level
- All three major US indices posted record closes on Tuesday, the fourth in a row to the S&P 500.
- Strong earnings are being cited the major factor underpinning the ongoing rally.
It was another day of cheer for US equity markets, with all three major bourses clinching fresh record closing levels; the S&P 500 gained 0.4% to close above 4630, the Dow rose by the same amount to close above the 36K level for the first time ever, while the Nasdaq 100 overcame pre-market losses to also post 0.4% on the day gain, though the index did fall ever so slightly short of conquering the 16K level. For the S&P 500, Tuesday’s close was a fourth consecutive all-time high close in a row. Equity analysts continue to attribute the ongoing rally (the S&P 500 is up more than 8.0% from the early October lows) to the strong Q3 earnings season.
Earnings
Shares of US pharmaceutical giant Pfizer rose over 4.0% on Tuesday after the company revealed in its Q3 earnings report that 2021 vaccine sales were expected to exceed $36B. More than 60% of the 320 S&P 500 companies to report Q3 earnings thus far have beaten analyst forecasts and, according to Reuters, aggregate S&P 500 company earnings are now expected to have risen more than 40% when compared to Q3 2020.
There was a particular focus on the Dow Jones Transportation Average index, which surged to fresh record highs (and is up 25% from September lows) amid a 180% spike in rental/car sharing company Avis Budget Groups share price after a strong earnings report. Avis shares (ticker CAR) seems to have joined the “meme stock” category for the day, and was one of the top trending shares on stocktwits.com, reported Reuters.
Stocks rise despite hawkish central bank shift, inflation risks
Strong earnings have underpinned US equity markets in recent weeks despite a distinct hawkish repricing of expectations for interest rate hikes in 2022 (or sooner) from most of the major G10 central banks, which has in large part been driven by a sharp rise in upside inflation risks due to higher energy prices and further evidence that it might take some time for inflationary supply chain disruptions and shortages to clear. The fact that major G10 central banks like the Fed and BoE are expected to keep long-term interest rates at historic lows (i.e. they are expected to hike a percent or two, but not back up to pre-crisis levels of 4-5% or above) seems to be one factor helping keep equity investors calm at the start of a synchronised global hiking cycle, whilst the notion that companies are largely able to pass on higher input costs to price-insensitive consumers (a theme alluded to in recent business surveys and earnings), thus maintaining high margins is another.
Equity investors may have their tolerance for the ongoing hawkish shift in global central bank policy put to the test this week as the Fed announces policy on Wednesday (they will probably announce plans to reduce QE purchases by $15B per month) and the BoE announces policy on Thursday (if they want to avoid a hit to their credibility, they ought to implement a 15bps rate hike). Otherwise, US data in the form of the October ISM Services PMI survey and the October labour market report should show that US economic growth remains robust in the first month of Q4, if not hampered somewhat by supply chain issues and labour shortages.
-
20:25
RBNZ: Higher global interest rates could prove to be a headwind to asset prices
Reuters acknowledged that New Zealand's financial system remains resilient despite the challenges presented by COVID-19, the central bank governor Adrian Orr said on Wednesday.
''But the more recent Delta outbreak was creating stresses for some industries and regions - particularly in Auckland, Orr said in the Reserve Bank of New Zealand's financial stability report.
The bank said it we will soon consult on implementing debt servicing restrictions to address housing risks and also intends to increase the minimum core funding ratio (CFR) requirement for banks to its previous level of 75% from January.''
Key notes
The financial system is well-placed to support economic recovery despite uncertainty and risks.
A more recent delta outbreak is creating stress for some industries and regions - particularly in Auckland.
With the risk of global inflation heightened, already stretched asset prices are facing headwinds from rising global interest rates.
Supply chain bottlenecks and inflation are adding to stresses in some sectors.
The transition towards living with covid-19 in the community as a managed, endemic disease is changing consumer behaviour.
Strong demand for housing has pushed house prices above their sustainable level, increasing the chance of a correction.
Recent buyers are borrowing more relative to their income, and maybe vulnerable to higher mortgage rates or a fall in house prices.
Will soon consult on the merits of implementing debt servicing restrictions to lean against these housing risks
Intend to increase the minimum core funding ratio (CFR) requirement to its previous level of 75 per cent on 1 January 2022.
Intend to increase minimum CFR requirement to its previous level of 75% on 1 Jan 2022, subject to no significant worsening in econ condition.
Intend to increase min core funding ratio requirement to the previous level of 75% on 1 Jan 2022, subject to no significant worsening in economic conditions.
Capital requirements for banks to progressively increase from 1 July 2022; is encouraging to see them increasing ahead of these requirements.
Higher global interest rates could prove to be a headwind to asset prices.
We expect banks to be more cautious about high debt-to-income loans given the risks of rising interest rates and the economic outlook.
Activity uncertain, given novel nature of the shock, and risk of further variants developing/return to tighter restrictions.
Impacts of climate change becoming common, meaning increasing claims for insurers; greater risk to properties that banks use to secure lending.
Building consents data suggest a pipeline of new houses becoming available by next year, which should suppress rent and house price inflation.
-
19:49
S&P 500 Price Analysis: Reaches a new all-time high around 4,635.30 ahead of the Fed meeting
- The S&P 500 advances 0.34% during the New York session amid risk-on market sentiment.
- S&P 500 Sectorwise: Lifted by real-estate, health, and technology, while energy is the laggard.
- S&P 500: In case of a correction lower, 4,550 is the first support, followed by 4,400.
The S&P 500 extends its rally during the New York session, up some 0.34%, sitting at 4,631.60 at the time of writing. Market sentiment throughout the North American session has improved, portrayed by US stock indices rising. The heavy-tech Nasdaq Composite and the Dow Jones Industrial climb 0.19% and 0.39%, respectively.
Sectorwise in the S&P 500, the winners are real-estate up 1.04%, health rising 0.85%, and technology gaining 0.77%. Contrarily, the main loser is energy, falling 1.05%.
In the meantime, the US Dollar Index, which measures the buck’s performance against a basket of six currencies, advances 0.23%, sits at 94.08, while the US T-bond 10-year benchmark note falls three basis points, down to 1.544%, ahead of the FOMC meeting.
S&P 500 Price Forecast: Technical outlook
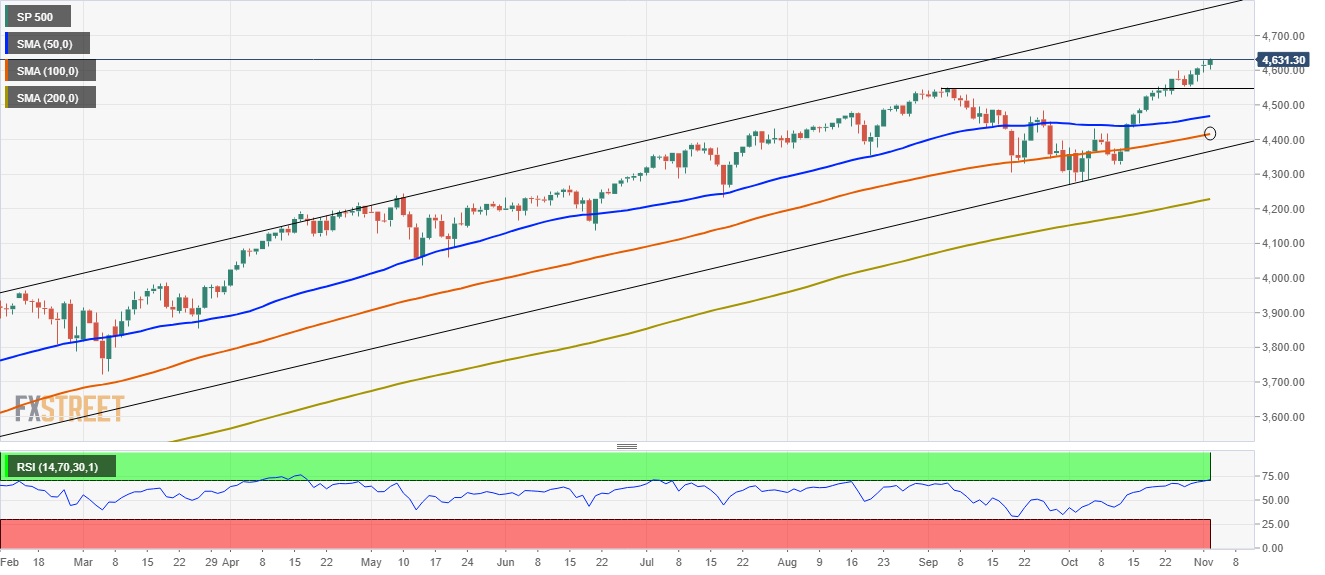
The S&P 500 daily chart shows the index has a strong upward bias, approaching the top of an ascending channel that has capped any upside moves, keeping a steady trend in the index. The daily moving averages (DMA’s) are located below the price action, with a rising slope, confirming the uptrend.
However, the Relative Strength Index (RSI), a momentum indicator, is at 71 in overbought levels, indicating the S&P 500 could be headed towards a correction.
In the case of that outcome, the first support level would be 4,550. However, if the index corrects 5%, as the dip from mid-September to mid-October of 2021, the 4,400 area would be the next support. -
19:40
Forex Today: All eyes on the looming Fed’s decision
What you need to know on Wednesday, November 3:
The greenbacks strengthened against most of its major rivals, only stable against those considered safe-havens. The AUD and the GBP were the worst performers, the first hit by a dovish Reserve Bank of Australia, the second hit by Brexit jitters and uncertainty related to the Bank of England, scheduled to meet this week. AUD/USD trades around 0.7420 while GBP/USD hovers near 1.3600.
The EUR/USD pair is trading around 1.1580, with demand for the shared currency undermined by Markit´s final readings of its October Manufacturing PMIs. The German index was downwardly revised to 57.8 from 58.2, while that for the Union was confirmed at 58.3, below the preliminary estimate of 58.5. According to the official report, “supply bottlenecks remained a major hindrance to Germany's manufacturers at the start of the fourth quarter.”
Commodities shed some ground but held within familiar levels. Spot gold settled at $1,787 a troy ounce while WTI trades around $83.60 a barrel.
Japanese markets will be closed amid a local holiday on Wednesday, most likely exacerbating range trading ahead of the US Federal Reserve monetary policy announcement. Market participants anticipate US policymakers will decide to reduce the monthly purchases of Treasuries and mortgage-backed securities by $15 billion per month, to finalize it mid-2022. If the Fed announces a larger monthly reduction of facilities, the dollar may reach fresh 2021 highs vs the common currency.
Wall Street advanced, with the DJIA and the S&P closing at record levels. The Nasdaq also edged higher, while government bond yields ticked lower.
Market participants are taking off some of their bets on soon-to-come rate hikes within major economies.
Top 3 Price Prediction Bitcoin, Ethereum, XRP: The next crypto bullish expansion phase has begun
Like this article? Help us with some feedback by answering this survey:
Rate this content -
19:35
NZD/USD slips below key support, consolidates at 200DMA ahead of key NZ jobs report
- NZD/USD has dropped sharply on Tuesday from the upper 0.7100s to the 200DMA at 0.7100.
- If New Zealand Q3 jobs data, set for release shortly, is strong, the pair could retest prior support at 0.7130.
The New Zealand dollar has seen significant selling pressure on Tuesday, with the currency seemingly being dragged lower in tandem with its cross Tasman sea peer the Aussie; AUD has been selling off in wake of Tuesday’s Asia Pacific session RBA meeting, at which RBA Governor Philip Lowe delivered a stronger than an expected dose of pushback against hawkish money market pricing than markets had likely been expecting (he criticised the notion of rates being hike as soon as 2022), though the RBA did admittedly open the door to a potential first rate hike in 2023. Either way, AUDUSD is down about 1.2% on the day and, subsequently, NZDUSD is down about 1.0%.
Whilst it is normal to expect AUD underperformance to exert some drag on the highly correlated NZD, the extent of the sell-off in NZD on Tuesday has been somewhat perplexing. Technical selling, once the pair dropped below key resistance in the 0.7130 area, will have exacerbated things (perhaps a few stops were blown through). The pair now trades around the 0.7100 level, which also coincides with its 200-day moving average, marking a roughly 100 pip turnaround from last week’s highs above 0.7200.
Key NZ jobs data set for release at 2145GMT
Perhaps some pre-positioning ahead of the release of very important New Zealand economic data has also been at play; at 2145GMT, Q3 labour market data is released. In Q2, the Household Labour Force Survey unemployment rate stood at 4.0%, a level the RBNZ deems as consistent with full employment and a key justification (alongside above-target inflation for the same quarter) for starting off their rate hiking cycle in October. Some local banks are calling for the unemployment rate to drop under 4.0% in Q3, which would take it to its lowest level since 2008 (prior to the global financial crisis). Such an outturn would strengthen the case for the RBNZ to lift rates swiftly in order to mitigate upside inflation risks and would support NZD/USD, perhaps allowing it to recover and retest prior support (now resistance) around 0.7130. NZD traders will also keep an eye on alternative labour market indicators such as the Participation Rate (expected to fall a little due to the lockdowns in New Zealand in Q3) and the Labour Cost Index.
Note that the RBNZ will also be releasing its Financial Stability Report at 2000BST, where high housing costs and the associated implications will be a key theme. With the RBNZ already on the path towards acting decisively to lift rates, this report will likely not garner too much attention now more kiwi dollar markets too much.
-
19:23
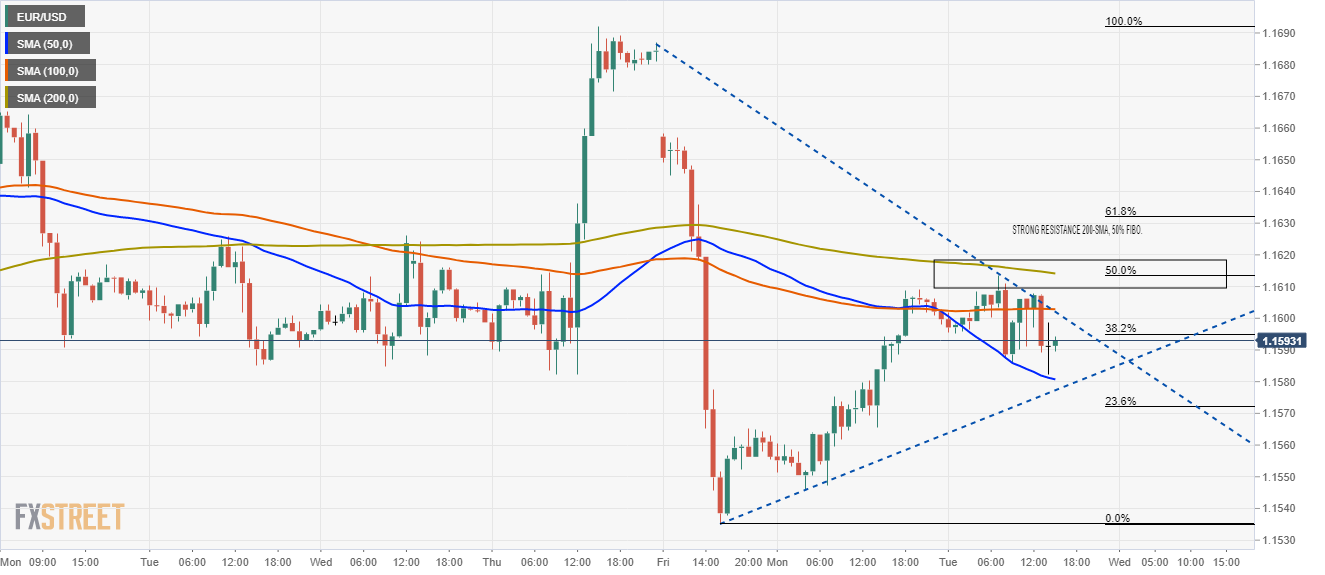
EUR/USD Price Analysis: Bears seeking a break below 1.15 the figure
- EUR/USD is under pressure on a fractal basis and eyes are on a break below 1.15 the figure.
- Day traders will be looking for an optimal entry to scalp the larger move from lower time frames.
EUR/USD is a compelling bearish scenario and the following technical analysis illustrate the various time frames, from the weekly to the H1 charts.
EUR/USD weekly chart
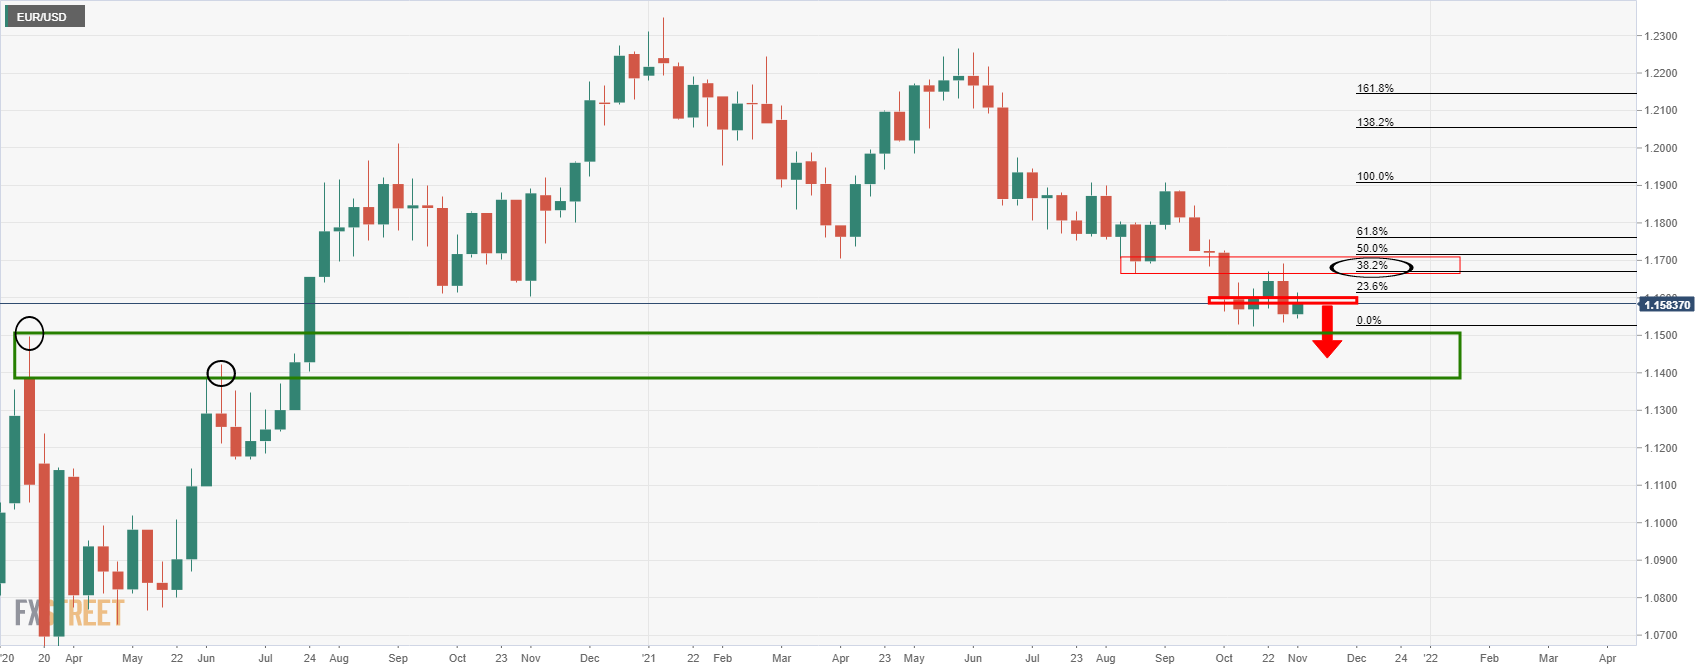
The weekly chart is bearish as the price has already corrected some of the imbalance of price following the weekly bearish impulse. A test into the weekly fractal highs of the spring and summer below 1.15 the figure is in focus.
EUR/USD daily bearish engulfing candle
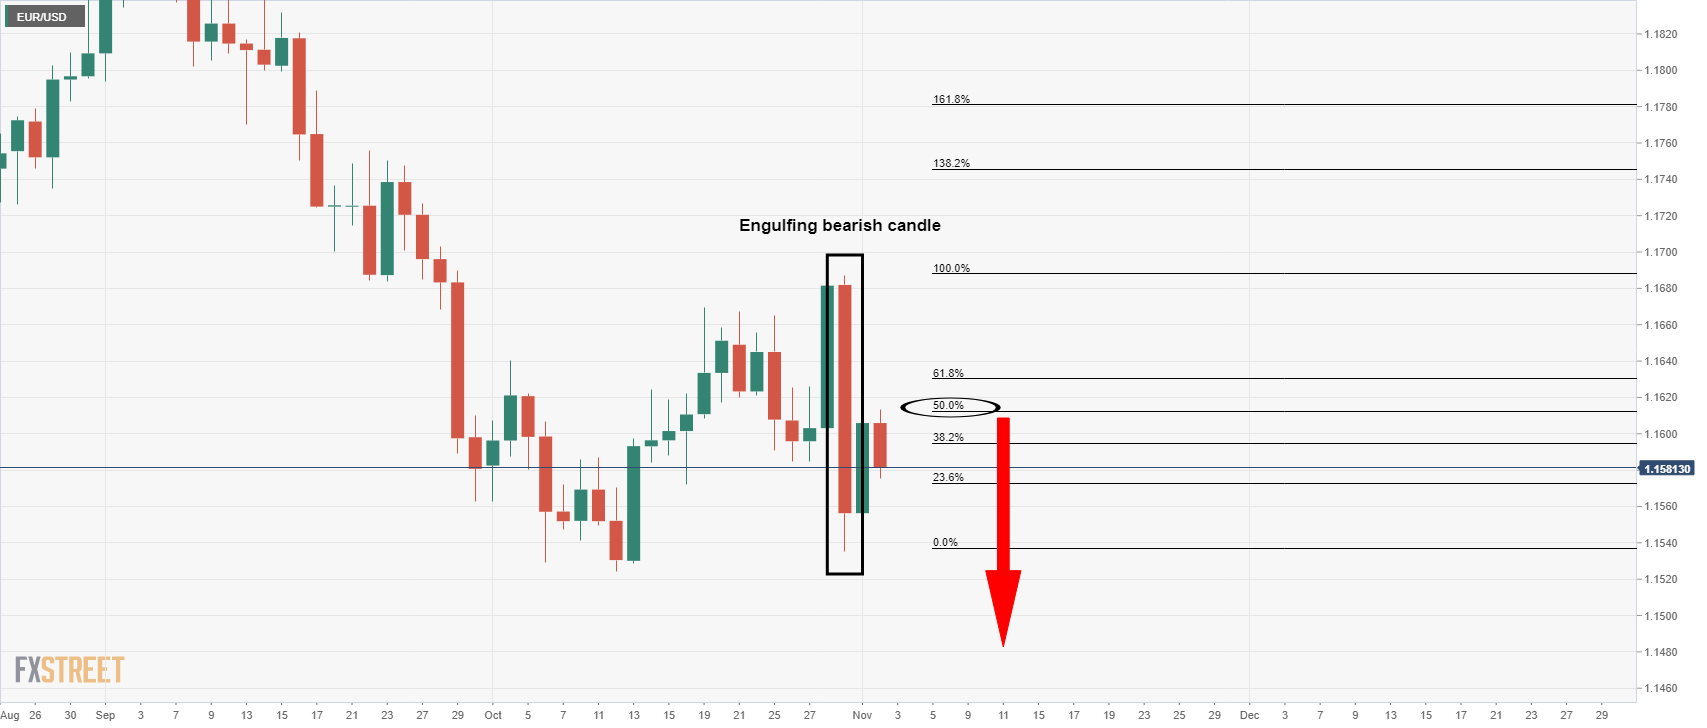
We have seen a strong momentum candle in the last few days which is yet to lead to a lower low. The price has instead corrected 50% of the imbalance in a phase of mitigation and a retest of liquidity. The price has since been rejected which would now be expected to lead to further downside.
EUR/USD H1 chart
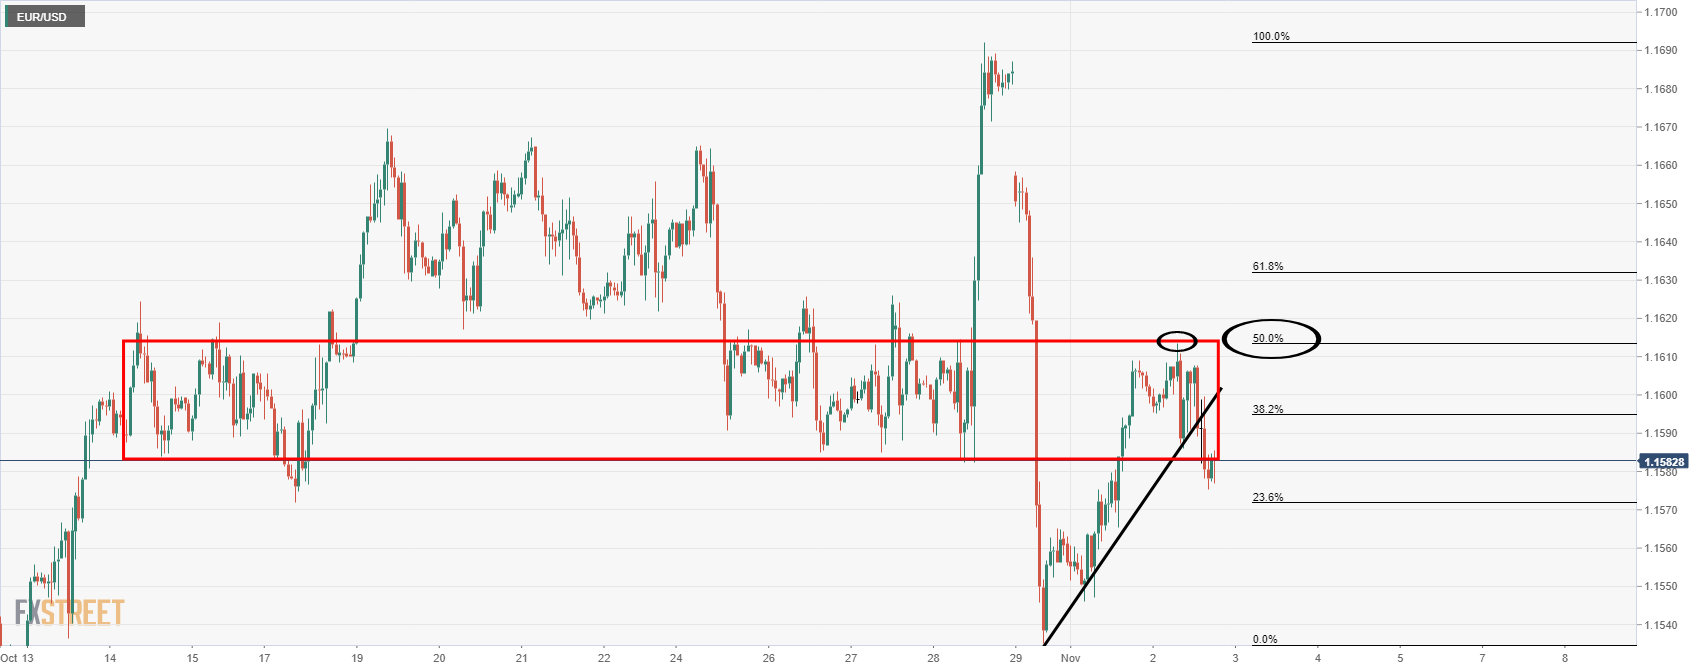
meanwhile, from an intraday trading perspective, the price has corrected a significant portion of the drop and the focus is now back on the downside:
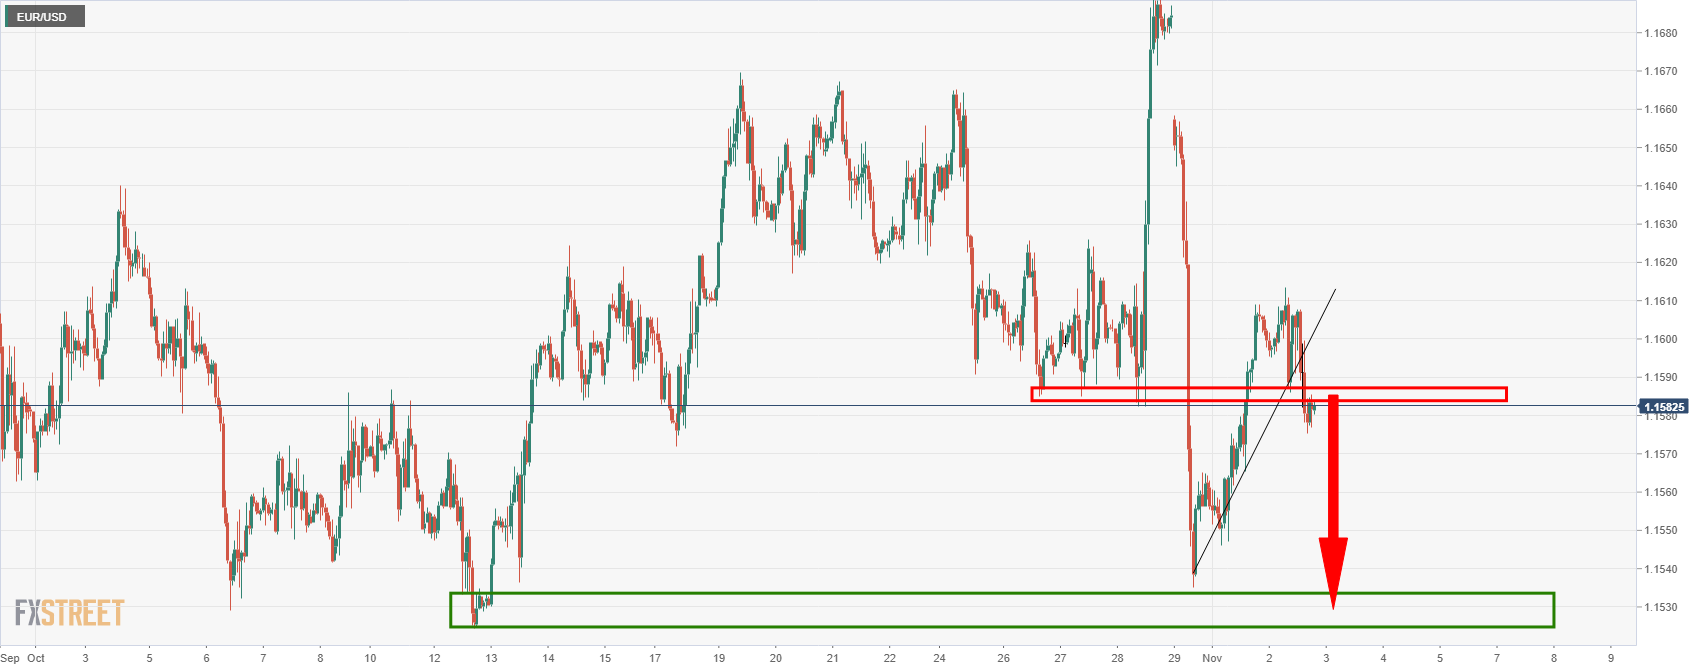
There is now room to go and test the Oct lows in the 1.1520s.
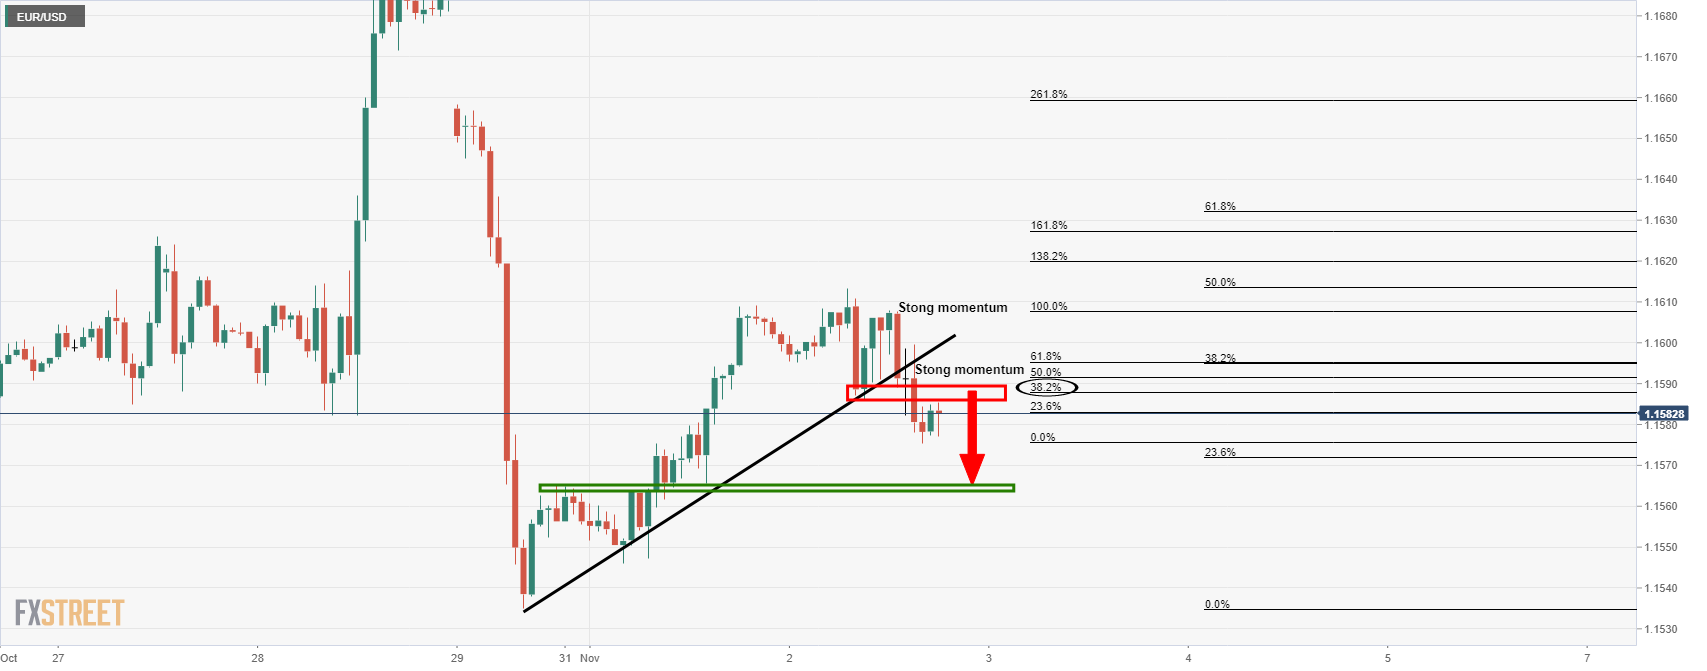
Meanwhile, however, there could be some more correction to go into the 38.2% Fibonacci of the breakout below the trendline that would be expected to act as a counter-trendline on a restest beyond the 38.2%. This would offer a reasonable area for placement of a stop loss to protect short entries in order to target the 1.1560s and beyond.
-
19:10
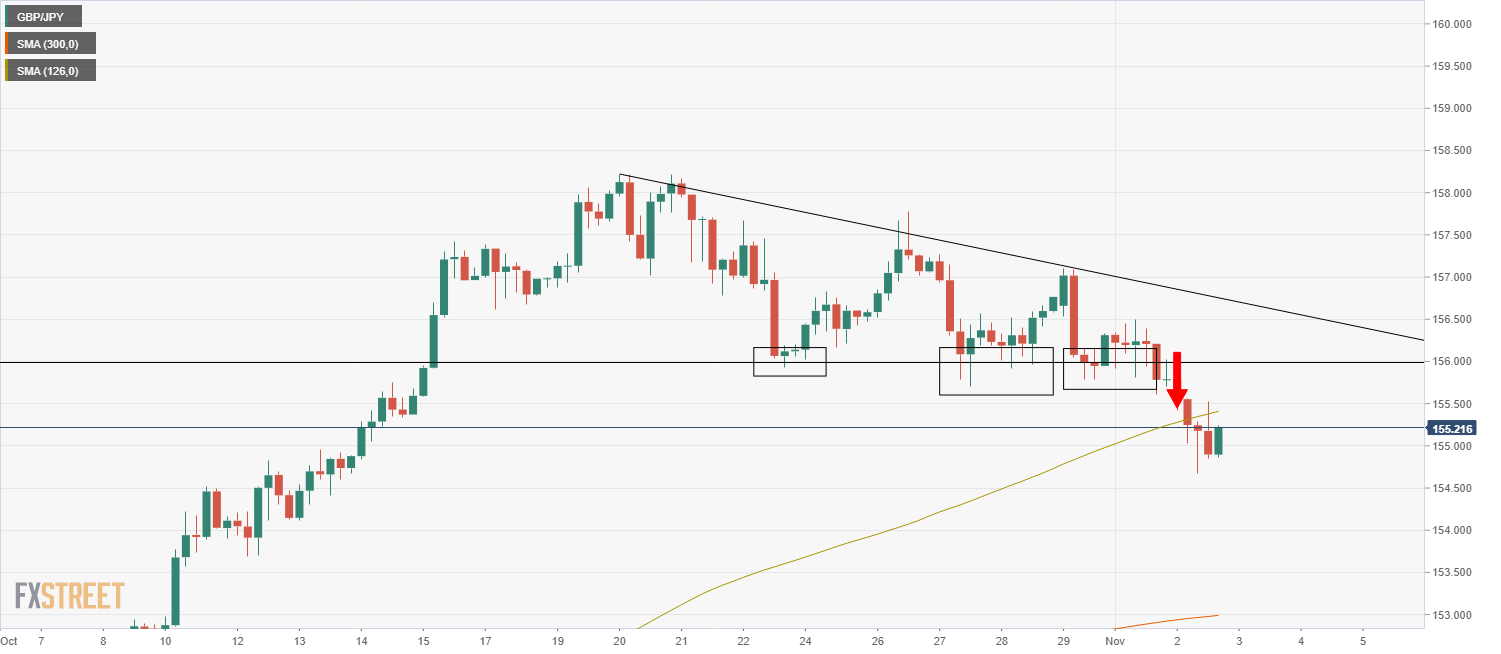
GBP/JPY consolidates in low 155.00s after technical selling, BoE meeting looms
- GBP/JPY is consolidating between 155.00 and its 21DMA.
- The pair broke to the downside of a descending triangle formation recently.
- The Bank of England meeting could spark volatility on Thursday.
GBP/JPY has spent the majority of Tuesday’s session consolidating close to the 155.00 level and its 21-day moving average at 155.35. Since slipping below support at the 156.00 level on Monday, the pair has been trading with a negative bias, although the downside seen on Tuesday has more to do with broad yen strength rather than on Monday, which had more to do with broad GBP weakness at the time as a result of Brexit tensions and uncertainty regarding this week’s Bank of England rate decision.
As to why the yen is performing well on Tuesday (it is the best performing G10 currency on the day), it it probably because long-term bond yields across developed markets (particularly in Europe) have been on the back foot, thus putting downwards pressure on rate differentials with Japanese bonds. For reference, US 10-year yields are consolidating close to recent lows around 1.55%, while 10-year German yields have dropped back sharply from above -0.10% on Monday to current levels around -0.17%.
For the GBP/JPY pair, some technical selling might also be at play; the pair formed a descending triangle in recent weeks, with support coming in at 156.00 and a downtrend linking the 20, 26 and 29 October highs. Such patterns are often indicative that a downside break is in the offing.
Bank of England in the spotlight
Looking ahead to the rest of the week, the fundamentals will once again take precedent; the main event for GBP this week is the Thursday Bank of England meeting. While UK money markets pricing suggests a rate hike of at least 15bps is almost a certainty, economists are more divided, as seemingly is the BoE’s rate-setting committee (called the Monetary Policy Committee or MPC).
To sum up the differences in opinion; hawkish BoE members (including Governor Andrew Bailey and Chief Economist Huw Pill) have expressed concern that if the BoE does start taking its foot of the “accelerator” (i.e. start unwinding ultra-accommodative policy) with YoY rates of Consumer Price Inflation hitting multi-year highs (and likely to go above 5.0% in 2022) and the output gap now closed (i.e. the economy having recovered to its pre-pandemic size), medium-term inflation expectations risk becoming de-anchored. Conversely, the dovish members have argued the bank should until December so the bank can properly observe the impact that the end of the government furlough scheme had on the labour market.
A few analysts have pointed out that, given recent hawkish rhetoric from the BoE Governor and others that has pumped market expectations for rate hikes as soon as November, the bank might face credibility issues if it fails to live up to these expectations. The vote on interest rates is likely to be split with the four known hawks voting for an immediate 15bps rise, while the three known doves might vote to hold rates at 0.1%. That leaves two MPC members who can decide the outcome, with only one needing to vote for the hike to set it in stone. Note that the bank will vote on whether or not to continue its bond-buying programme until the year’s end.
The BoE will release its quarterly Monetary Policy Report, which contains its latest economic forecasts. Some have suggested that there is a risk that the new long-term inflation forecasts might suggest a less aggressive hiking cycle from the BoE than money markets are currently pricing; short sterling futures suggest more than 100bps of rate hikes in 2022. Some have suggested the bank might try to play down the aggressiveness with which it plans on hiking interest rates over the coming years verbally as a way to bring the more dovish MPC members on side.
Either way, the higher than usual uncertainty surrounding the meetings suggests that the reaction in GBP pairs like GBP/JPY could be very choppy. Note that Thursday also sees UK Brexit Minister David Frost and the French Secretary of State for European Affairs getting together to talk fish, as both sides try to avoid tensions escalating into a full-blown trade/legal battle.
-
18:42
USD/JPY retreats below 114.00 amid mild risk-on market sentiment
- USD/JPY pares some of its Monday losses, approaches 114.00 on dismal market sentiment.
- Falling US T-bond yields drag the USD/JPY pair with it, despite broad greenback strength across the board.
- USD/JPY: An upside break above a downward slope trendline around 114.20 could propel the pair towards 116.00.
The USD/JPY trims some of Monday’s losses, edges lower 0.07%, trading at 113.92 during the New York session at the time of writing. The market sentiment is mild risk-on, portrayed by US equity indices rising between 0.26% and 0.39%. Nevertheless, the Japanese yen appreciated as traders got ready for the Federal Reserve November meeting.
On Monday, the USD/JPY pair fell 0.44% due to a risk-off market mood spurred by three central banks reviewing their monetary policy conditions. Furthermore, as US third-quarter corporate earnings wane, market participants' focus turns on central banks, macroeconomic developments, and higher inflation.
In the meantime, the US 10-year Treasury yield is falling four basis points, sitting at 1.533%, following the USD/JPY footsteps. Meanwhile, the US Dollar Index, which tracks the greenback’s performance versus a basket of its peers, advances 0.25%, currently at 94.09, clinging to the 94 handle, for the second consecutive day.
In the Asian session, the Bank of Japan Governor Haruhiki Kuroda and Japanese Finance Minister Shunichi Suzuki, and Economic Minister Yamagiwa held a meeting. They discussed the economy and the financial situation of the country.
Before the reunion, some market speculation was that the newly formed Japanese government and the BoJ might review the joint statement and the 2% goal, per Reuters.
On the US economic docket, the IBD/TIPP Economic Optimism for November fell for the fifth consecutive month to 43.9, lower than the 46.8 October figure.
USD/JPY Price Forecast: Technical outlook
Daily chart
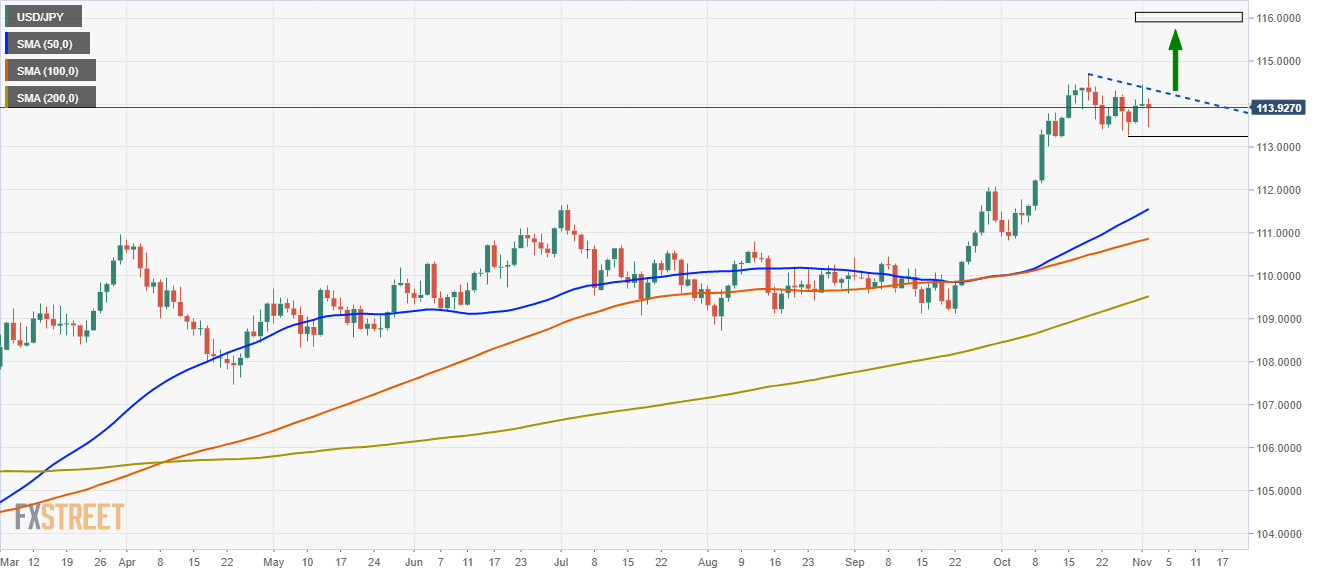
The USD/JPY daily chart shows the pair found strong support at the October 28 low at 113.25. The daily moving averages remain below the spot price, confirming the upward bias. Furthermore, Tuesday’s price action portrays some mild USD buying pressure around 113.50, depicted by a large bottom wick of the candlestick.
For USD bulls to resume the upward bias, they will need an upside break above the downslope trendline that travels from October 20 to November 1 high. In the case of that outcome, the USD/JPY pair could rally towards 116.00.
Therefore, as the USD/JPY lacks catalyst at press time, investors might refrain to open fresh bets, as the Federal Reserve meeting, lies ahead. Instead would be prudent to wait for further forward guidance, that could give direction to the pair.
-
18:05
United States 52-Week Bill Auction rose from previous 0.09% to 0.16%
-
18:00
AUD/USD Price Analaysis: A countertrend trader's setup in the making?
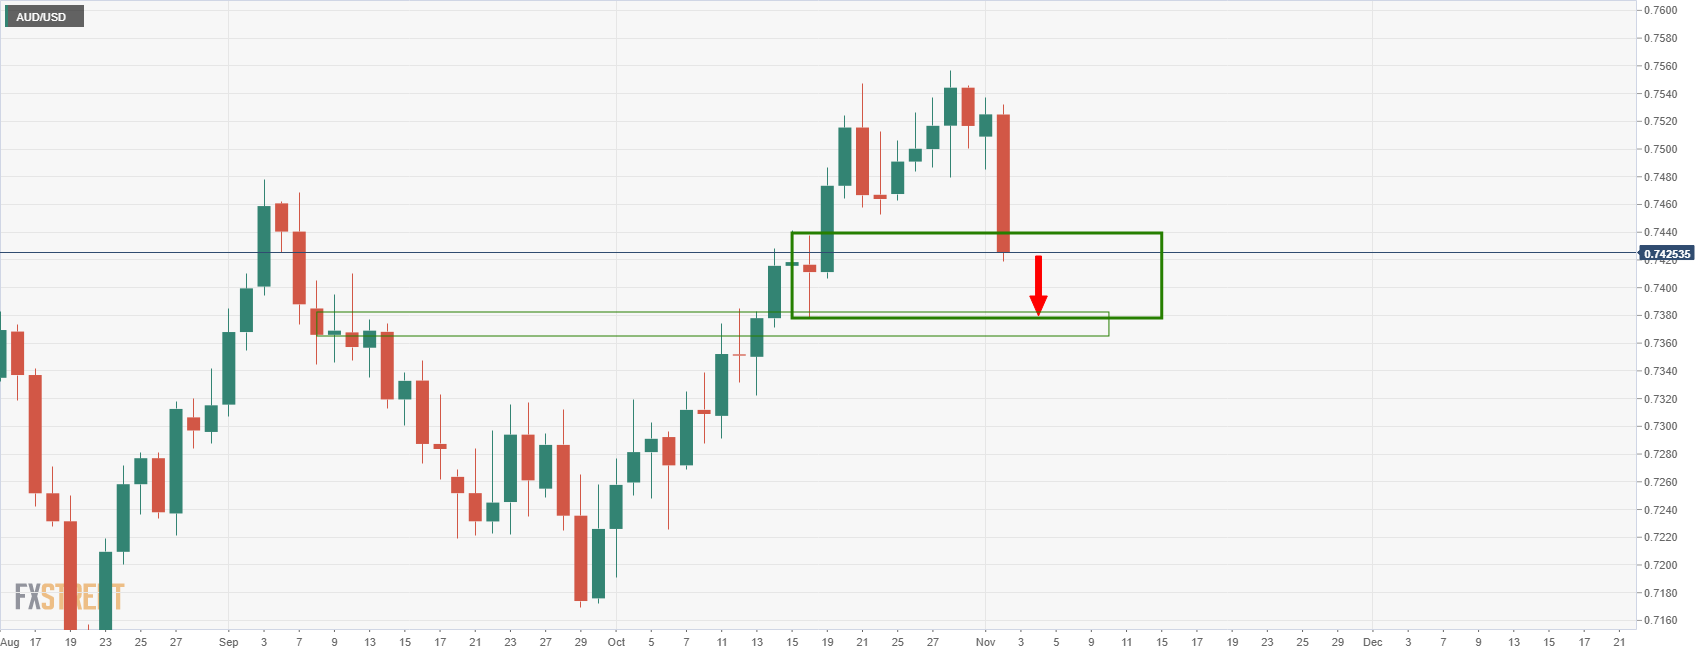
- AUD/USD bears have taken over, but there are bullish prospects from here.
- The price would now be expected to correct a significant portion of the drop in the sessions ahead.
The price has run into what would be expected to be a strong area of support and given the imbalance, a correction is the most probable next scenario. Looking back at the price action, it would appear that there is a huge imbalance all the way back to the 0.7450s. This also coincides with a 61.8% Fibonacci as well as a smoothed 200 hourly moving average.
That is not to say that the price can necessarily reach that far immediately, but bulls will be aware of that area of liquidity and will potentially want to target there in due course.
From a 15-min perspective, the 0.7440s is a more probable level that could be more easily achieved in the short term:
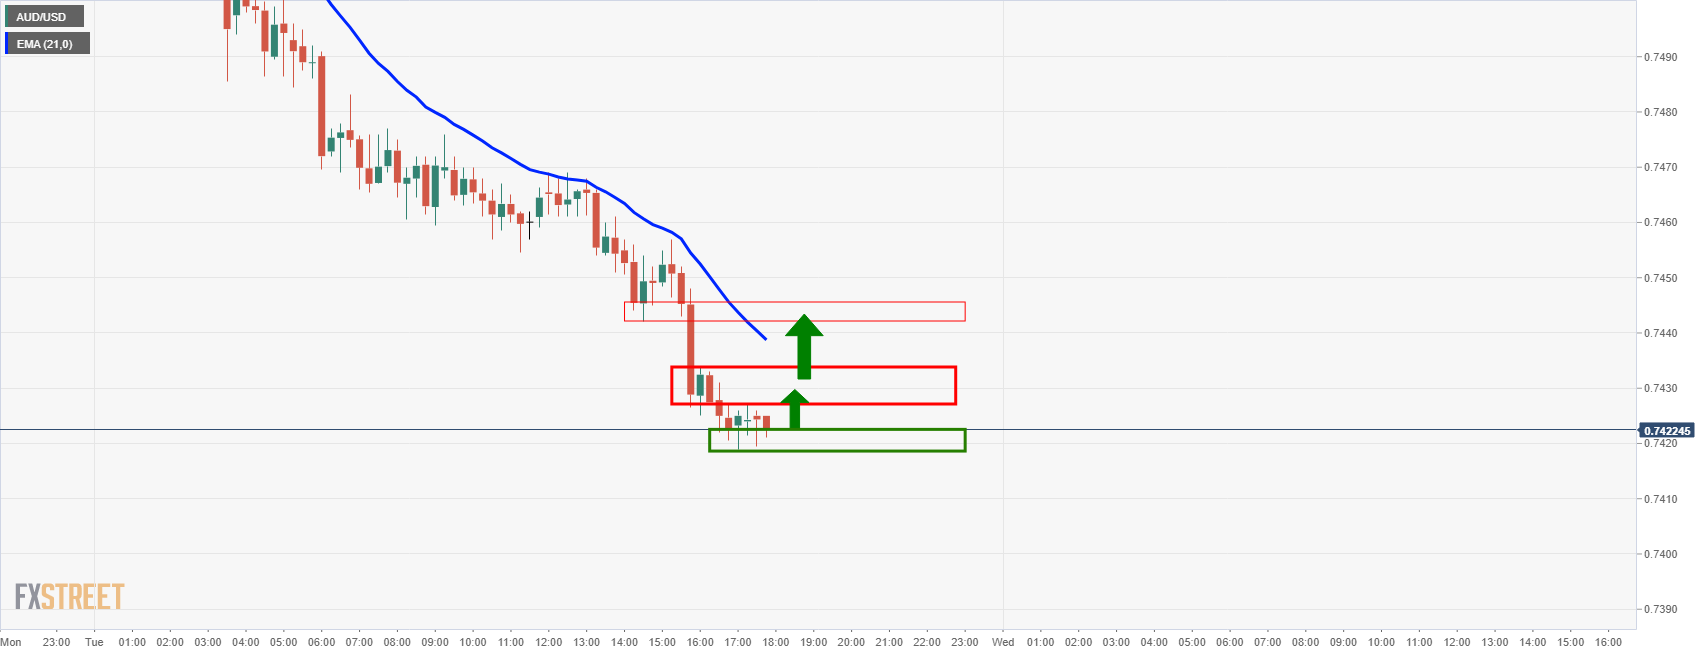
As illustrated, the 21-EMA meets with this area of potential interest and the drop from there was sudden, so there is some mitigation that needs to happen which most probably would lead to a restest of the 21-EMA in the coming sessions.
With that being said, a break of daily support opens risk to the 0.7380s:
-
17:15
USD/CHF rallies back to 200DMA at 0.9150, despite strong Swiss data
- USD/CHF is sharply higher on Tuesday and has returned to its 200DMA at 0.9150.
- Strong Swiss Retail Sales and inflation numbers have not prevented the Swiss franc from selling off.
- USD/CHF traders are focused on key risk events in the US as the next key driver.
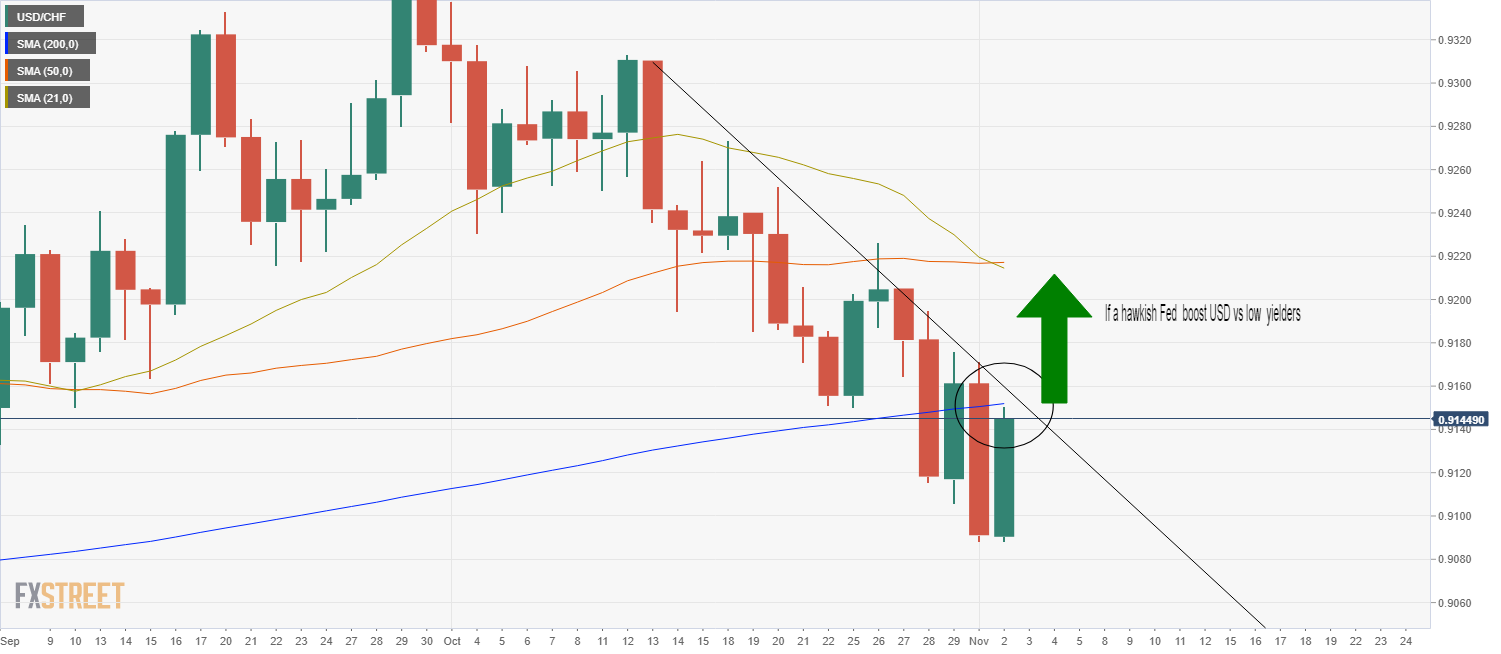
USD/CHF is up sharply on Tuesday, with the Swiss franc having depreciated 0.6% on the session versus the buck. That translates to a roughly 0.6% rebound for USD/CHF on the day from Asia Pacific session lows nuder 0.9100 to current levels around 0.9150, where, incidentally, the 200-day moving average resides. Indeed, the key long-term moving average may well halt USD/CHF’s rebound in its tracks, though the currency pair hasn’t paid too much attention to the level in recent days.
Tuesday’s upside marks a sharp reversal of the trend towards gradual depreciation seen over the last few weeks; since the start of October, USD/CHF has dropped from above 0.9300 to before printing lows under 0.9100 on Monday. The rebound to 0.9150 doesn’t yet mark a trend reversal, however, as the key downtrend that has been suppressing the price action in recent weeks remains intact.
Strong Swiss data
CHF weakness on Tuesday flies in the face of strong Swiss economic data released during Tuesday’s European morning; firstly, the October Consumer Price Inflation report was much hotter than expected with the MoM rate of CPI coming in at 0.3% versus forecasts for 0.1% and the YoY rate rising to 1.2% from 0.9% in September, more than the expected rise to 1.1%. The September Retail Sales report also showed an acceleration in consumer spending, with the YoY rate of sales growth rising to 2.5% from an upwardly revised 0.8% in August.
Rest of the week
Looking ahead to the rest of the week; state-side events will likely be the dominant driver of price action, with the most notable events the release of the ISM Services PMI at 1400GMT, the release of the Fed’s latest monetary policy decision at 1800GMT and then the post-meeting press conference with Fed Chair Jerome Powell at 1830GMT on Wednesday, followed by the release of the October Labour Market report at 1230GMT on Friday. FX strategists have argued in recent weeks that if the Fed does continue to signal more hawkish policy guidance/tone, then the currencies most at risk of depreciating versus the US dollar are those where the central banks are substantially behind the Fed in terms of monetary normalisation.
That means the Swiss franc, given that, at present, there is no end in sight to the SNB’s ultra-accommodative stance which is at this point now mainly geared around trying to fight long-term CHF strength. Should the Fed deliver hawkish undertones and US jobs data come in strong, this may trigger a break above the recent downtrend and send USD/CHF back towards 0.9200.
-
16:36
GBP/USD threatens a break below 1.3600
- GBP/USD is under pressure ahead of both the Fed and Boe this week.
- Markets could be readjusting their GBP length ahead of an uncertain outcome.
GBP/USD is being pressured at the start of the week, down some 0.3% at the time of writing after sliding from a high of 1.3669 to a low of 1.3608 so far and staying close to a three-week low. Central banks are the focus for the week with uncertainty as to whether the Bank of England will raise interest rates and if the US Federal Reserve will start tapering this month.
FOMC meeting underway
Firstly, the two-day Federal Open Market Committee meeting kicked off today. The market has positioned for a tapering announcement following guidance from the central bank which has managed expectations perfectly in terms of preparing the markets for what is likely to be speed tapering.
''Most officials seems to agree that it’s better to get tapering over as quickly as possible in order to leave the Fed maximum flexibility to hike rates when needed,'' analysts at Brown Brothers Harriman explained. ''We believe that the most likely path for tapering has already been flagged by the Fed, which would reduce asset purchases by $15 bln per month ($10 bln UST and $5 bln MBS).''
The analysts also believe that the Fed will start tapering this month so that QE effectively ends by mid-2022. The market has taken that process a step further and is pricing in around 50% odds for liftoff in Q2. ''Q3 liftoff is already fully priced in,'' they explained, ''followed by another hike fully priced in for Q4. This is much more aggressive than what the Fed itself anticipates, at least in the current Dot Plots. We suspect the Fed will try to push back a bit against such aggressive tightening expectations, but we are not sure that the market will listen.''
Meanwhile, US data will be a key focus this week also. Yesterday, October ISM Manufacturing PMI came in strongly at 60.8 vs. 60.5 expected and 61.1 in September. Readings above 60 are rare and yet here we are above 60 for 8 of the past 11 months. Looking at the components, employment came in at 52.0 vs. 50.2 in September, which could be symbolic of a healthy Nonfarm Payrolls report at the end of the week where forex volatility could be highest, depending on the outcome.
''Employment component of 52.0 is the highest since July, when 57k manufacturing jobs were added out of 1.09 mln total NFP gain. All in all, this was a very solid report,'' analysts at Brown Brothers Harriman said. ISM services PMI will be reported Wednesday and so too will the ADP jobs report. The current consensus is 450k and we suspect it will creep higher.
BoE in focus
Casting minds back, sterling rose to a 20-month high versus the euro in late October and added around 3% for the same month vs the greenback for the same month amid expectations for a BoE interest rate hike. Inflation risks have surged, but there are growing doubts around what the central bank will actually do at its policy meeting on Thursday. Three of the nine Monetary Policy Committee members, including the BoE Governor Andrew Bailey, have been voicing concerns around inflation and the need to act.
It is a close call whether the Bank of England (BoE) hikes on Thursday or not, so should there be a hike, it could well be a dovish one with the BoE saying that the hiking cycle will be "gradual and limited". Market pricing is pretty aggressive as it is pricing in a total of 125bp rate hikes until year-end 2022 and hence traders could be rethinking and adjusting some of its lengths into the meeting this week.
-
16:32
EUR/GBP reclaims 0.8500 amid mild risk-off market sentiment
- EUR/GBP edges higher on the back of a weaker Sterling across the board.
- EUR/GBP: As long as the EUR/GBP pair remains below 0.8530, the cross-currency has a downward bias.
The EUR/GBP reclaims the 0.8500 level, climbing to fresh two-week highs up 0.12% during the New York session, trading at 0.8506 at the time of writing. The market sentiment remains subdued as three central banks will review their current monetary policy conditions. That, in part, spurred a sell-off of risk-sensitive currencies, like the British pound, which at press time, the GBP/USD pair threatens to break below the 1.3600 figure.
Last Thursday, the European Central Bank (ECB) reviewed its monetary policy stance. The ECB decided to keep rates unchanged. Further, despite high inflation readings, with the Eurozone CPI expanding by 4.1%, it maintained its dovish stance, pushing backward investors’ intentions of a rate hike until late 2023.
Meanwhile, the Bank of England (BoE) is heading into their monetary policy meeting this week, where investors already priced in a 15-basis point hike rate on November 4. A rate rise in the UK would be the first one since the pandemic. Furthermore, it responds to surging inflation readings, as BoE members Michael Saunders and Governor Andrew Bailey expressed.
On the macroeconomic front, Eurozone PMI’s for October hit the wires. The German Markit Manufacturing PMI came at 57.8 lower than the 58.2 estimated. Furthermore, the Eurozone Markit Manufacturing PMI increased to 58.3, worse than the 58.5 foreseen by analysts.
Despite being lower than expected readings, production remained strong but was affected by supply chain bottlenecks and logistical problems. Alongside those abovementioned, the shortage of truck drivers continued to hurt the manufacturing sector.
EUR/GBP Price Forecast: Technical outlook
Daily chart
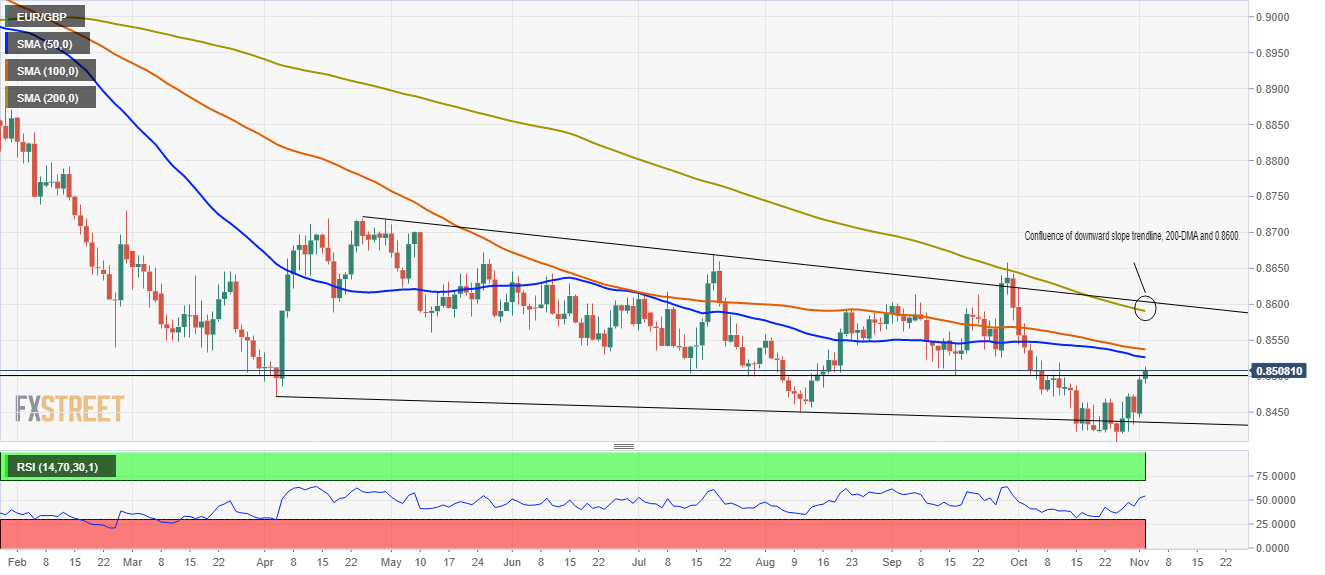
The EUR/GBP cross-currency pair has a downward bias, as shown by the directionless daily moving averages (DMA’s) located above the spot price. At press time, the pair is approaching the confluence of the 50 and the 100-DMA around the 0.8520-40 area, which would oppose strong resistance for EUR buyers. However, the Relative Strength Index (RSI) at 54 aims higher, a bullish signal that diverges with price action.
To extend the downward trend, EUR/GBP sellers will need to hold the price below the September 16 low at 0.8500. In that outcome, EUR sellers could push the pair towards a renewed re-test of 0.8402, which is 2021 low.
For EUR/GBP buyers to confirm its upward bias, they will need a daily close above 0.8530. In that outcome, the following resistance would be the 200-DMA at 0.8588.
-
16:15
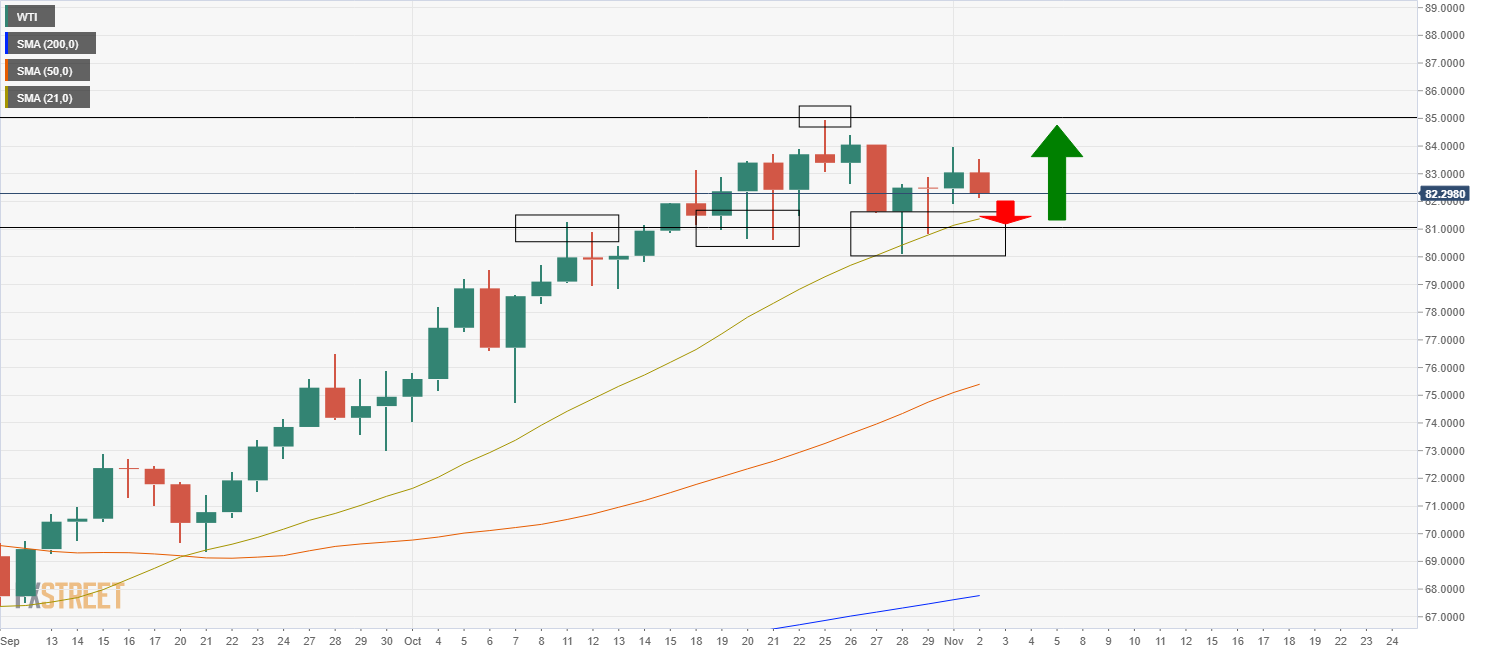
WTI ebbing lower but within recent ranges ahead of key OPEC+ get-together
- WTI has slipped back to $83.00 in recent trade but remains well within the rough $81.00-$85.00 range of recent weeks.
- OPEC+ are widely expected not to deviate from plans to hike output at a rate of 400K bdp/ month.
- Most analysts remain bullish on oil’s near-term prospects with the global supply/demand imbalance set to persist.
The price of front-month future contracts for the delivery of the American benchmark of sweet light crude oil, West Texas Intermediary (often referred to as WTI), has been ebbing lower in recent trade as traders refrain from placing big bets ahead of this week’s OPEC+ meeting. Ahead of the Thursday gathering, where the group is widely expected not to deviate from its current plan to increase output at a rate of 400K barrels per day each month, most traders are likely to keep their powder dry, meaning WTI may well continue to undulate within recent ranges, as has been the case since the start of the week. At present, front-month futures are trading in the mid-$83.00s per barrel, about $1.50 below Monday’s high at just under $84.00. But that leaves prices well within the $81.00-$85.00ish range of the past few weeks.
In terms of oil-relevant macro updates; there haven't been many notable developments as of late. There has been some chatter about the struggles that some OPEC+ members (mainly in Africa) have been having in lifting output as the cartel’s output curbs have eased in recent months, which has resulted in aggregate over-compliance of the cartel to its own self-imposed output restrictions OPEC+. This adds to the idea that OPEC+ is not increasing output quickly enough to match the rebound in global oil demand, which according to some big US and European oil companies who reported earnings this week has now returned to pre-pandemic levels, has been a key factor underpinning the more than 20% surge in oil prices since the start of September. The return of global oil demand to pre-pandemic levels has happened faster than many analysts anticipated back then because the surge in global natural gas prices has encouraged energy companies to switch to using relatively cheaper derivatives of crude oil as a power source.
Given the above, most analysts remain bullish on WTI’s near-term prospects. If OPEC+ does deliver on expectations and some post-event profit-taking is seen, look out for support in the $81.00 area, where resides a few recent lows and the 21-day moving average. Dip-buyers may see a pullback here may be an attractive opportunity for dip-buyers, which could potentially set the stage for a push back towards annual highs around $85.00 or even beyond.
-
16:05
Silver Price Analysis: XAG/USD drops more than 2.5%, to the $23.35 area
- Silver having the worst day since late September amid a stronger USD ahead of FOMC.
- XAG/USD is back below the 20-day moving average.
Silver (XAG/USD) is falling significantly on Tuesdays, even as gold prices drop only marginally. Recently it bottomed at $23.38, the lowest level since October 19.
The metal remains near the lows, under pressure and falling 2.61% during the day, the worst day since September. The sharp decline pushed the price under the 20-day moving average and is testing the 55-day.
The extension of the reversal from levels near $25.00 that reached two weeks ago deteriorated the technical outlook. Below $23.40, the next support is seen at $23.15 and then $22.80.
On the upside, $23.75 is the immediate resistance, followed by $23.95 and $24.10. A recovery above $24.00 should alleviate the bearish momentum and could even be a sign of more gains ahead.
Despite current technical factors, Wednesday’s FOMC meeting could be a market mover triggering sharp moves in metals, particularly gold. The yellow metal is under $1,790/oz, down just 0.26%.
XAG/USD daily chart
-637714658716724905.png)
-
16:00
Denmark Currency Reserves: 491.9B (October) vs previous 501.7B
-
15:51
USD/MXN Price Analysis: Upside eases after six-day of gains, finds resistance near 21.00
- USD/MXN peaks at 20.91, the highest level since March.
- Mexican peso recovers from some losses, amid a holiday in Mexico.
- US dollar mixed ahead of the FOMC meeting.
The USD/MXN is falling for the first time in more than a week on Tuesday after the pair found resistance at 20.90. A holiday in Mexico and some profit-taking weighed on the pair that retreated to the 20.70 area.
The bias in USD/MXN still points to the upside. In order to clear the way to more gains, the dollar needs to consolidate above 20.90. The next area to watch is 21.00 with the next resistance at 21.05 followed by 21.45.
The correction of USD/MXN could extend to 20.60/65 without negating the current bullish bias. Below around 20.45 is the next critical area, horizontal support and the 20-day moving average. A slide below would alleviate the pressure, leaving the Mexican peso stronger.
USD/MXN daily chart
-637714650255969017.png)
-
15:23
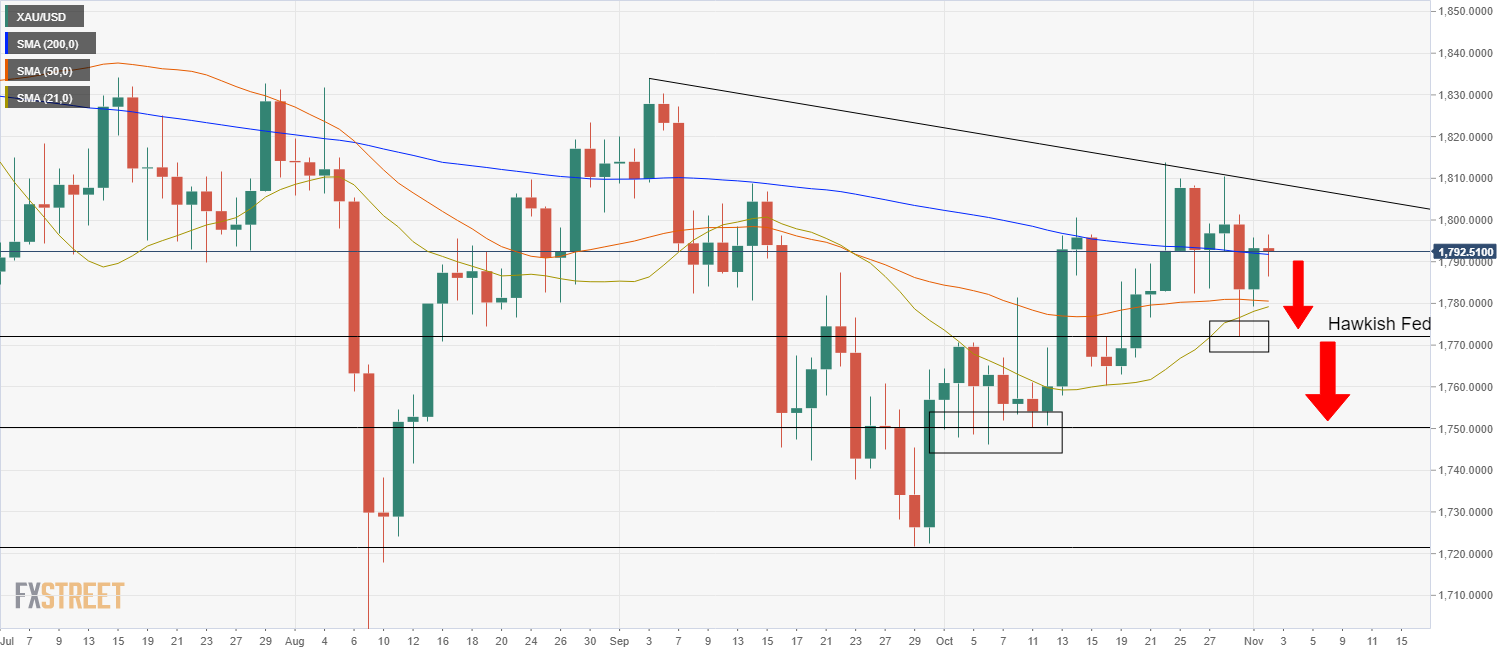
Gold Price Analysis: XAU/USD sticks close to 200DMA ahead of key Fed announcement
- The 200DMA just above $1790 has been acting like a magnet for spot gold prices on a quiet trading day.
- The main focus for gold traders is Wednesday’s Fed meeting, which carries hawkish risks.
Spot gold (XAU/USD) prices trade marginally lower on Tuesday, having gradually ebbed in recent hours from Asia Pacific session highs in the mid-$1790s to current levels around $1790. That means spot prices have been undulating either side of the 200-day moving average (currently at $1792.40). A lack of notable economic data points or scheduled events for the remainder of the European and US trading sessions suggests that lackluster trading conditions may persist and that the 200DMA may continue to act as a magnet for XAU/USD.
Fed meeting looms
Currency, bond and (by virtue) precious metal markets are in wait and see mode ahead of tomorrow’s Fed policy meeting and Friday’s US labour market report; at present, the DXY is around the 94.00 level and well within recent ranges and the same can be said for US bond yields, with the nominal 10-year close to 1.55% and the 10-year TIPS close to -1.0%. With regards to the Fed meeting, there are a few key focal points of interest to market participants; 1) the timing/pace of the bank’s QE taper plans (Fed officials have said they plan to announce taper plans at this meeting) – markets currently expect the Fed to reduce the monthly pace of purchases at a rate of $15B per month, taking eight months to taper net monthly purchases to zero from the current $120B, 2) any new guidance on when the bank might potentially start lifting interest rates, given that markets are now pricing a strong likelihood of lift-off in early H2 2022 and 3) any further recognition that upside inflation risks have grown.
Some analysts have suggested that there are upside risks to market expectations for a monthly QE taper pace of $15B. Danske Bank said in a recent note that they see a strong risk that the Fed opts to taper at a rate of $20B per month, meaning that (assuming the taper begun in November) QE purchases would be reduced to zero by April. This might be taken as a hawkish signal by markets; the Fed has previously said it does not want to lift interest rates before its QE taper has concluded, so a move to end the QE taper more quickly might be seen as the Fed giving itself more optionality to lift rates earlier if required. This may reflect a growing fear within the FOMC that their (up until only very recently) strongly held conviction that the current spike in inflation is “transitory” is under threat. Indeed, the recent spike in gas prices, combined with continued pro-inflationary supply bottlenecks are hitting consumer pockets, and rising inflation expectations and an already very tight US labour market risk embedding expectations for a more prolonged period of high inflation, all risks that recent rhetoric from Fed members has suggested they are growing increasingly worried about.
A hawkish Fed meeting could send real yields higher and would likely give the DXY the impetus that it needs to break above recent highs in the mid-94.00s, which would not be a good combo for gold. In this case, XAU/USD could well slip back below its 21 and 50DMAs around $1780 and to a retest of recent lows in the $1770s, ahead of a more protracted move back towards support in the $1750 area.
-
15:21
EUR/NOK: Limited downside potential as Norway's December rate hike is priced in – ING
In the view of economists at ING, Norges Bank will this week reiterate its intention to hike rates in December – they expect that to be followed by a further three rate rises next year. The krone has already seen the benefits of the hawkish re-pricing, so EUR/NOK has limited further downside potential in 4Q.
NOK already embedding hawkish expectations
“We expect a December rate hike and most likely three further increases through 2022.”
“We expect this week’s Norges Bank meeting to generate a quite contained market impact, as we should merely see a confirmation that interest rates will be raised again in December, a prospect that is already very much priced in by markets.”
“We think that more benefits for NOK stemming from the Norges Bank's tightening cycle should come through a carry advantage (which should play out in the longer run) rather than from the central bank surprising on the hawkish side.”
“We see only limited downside room for EUR/NOK in 4Q, and we expect 9.70 as a year-end value.”
-
15:18
EUR/USD breaks below 1.1600 amid subdued market sentiment
- The shared currency fell below 1.1600 on mild US dollar strength.
- Central banks: The RBA disappoints investors, despite dropping the YCC, dampening the market optimism.
- Eurozone PMI’s in expansion territory, though lower than expected due to supply bottlenecks and transportation problems.
The EUR/USD retreats from daily tops around 1.1600, down 0.10%, trading at 1.1593 during the New York session at the time of writing. Due to three central banks reviewing their monetary policy stances, the market sentiment is subdued, not risk-on or off, as market participants prepare for the Federal Reserve monetary policy meeting.
On Tuesday in the Asian session, the first one of the three central banks, the Reserve Bank of Australia, maintained rates on hold, dropped the Yield Curve Control and expressed the possibility of a hike rate in 2023. The market sentiment dampened once the decision crossed the wires, as witnessed by the rising Japanese yen and US Dollar, with market participants flying to safe-haven assets.
Meanwhile, the US Dollar Index reclaims the 94.00 threshold, up 0.19% at 94.04 amid lower US bond yields, with the 10-year Treasury yield falling one basis point, sitting at 1.556%
On the macroeconomic front, Eurozone PMI’s for October hit the wires. The German Markit Manufacturing PMI came at 57.8 lower than the 58.2 estimated. Furthermore, the Eurozone Markit Manufacturing PMI increased to 58.3, worse than the 58.5 foreseen by analysts.
Despite being lower than expected readings, production remained strong but was affected by supply chain bottlenecks and logistical problems. Alongside those abovementioned, the shortage of truck drivers continued to hurt the manufacturing sector.
Across the pond, the IBD/TIPP Economic Optimism for November fell for the fifth consecutive month to 43.9, lower than the 46.8 October figure.
EUR/USD Price Forecast: Technical outlook
1-hour chart
The EUR/USD chart shows the pair bounced off 1.1534, towards the 50% Fibonacci retracement at 1.1611, which confluences with Monday’s high and the 100-simple moving average. That area would oppose strong resistance to the pair, and if EUR bulls would like to regain near-term control, they will need to reclaim the 200-SMA at 1.1614.
In the case of that outcome, it would expose the confluence of the 78.6% Fibonacci retracement and the R2 pivot level around 1.1650. On the flip side, failure at 1.1600 would expose the 2021 low at 1.1524.
Therefore, the pair would be trading at narrow ranges ahead of the Federal Reserve. Significant upward or downward moves would be capped around the 1.1543-1.1610 range.
-
15:10
NZD/USD falls to two-week lows to test 0.7100
- Kiwi under pressure during the American session, among worst performers
- NZD/USD breaks the two-week range to the downside; the 20-day moving average awaits at 0.7080.
- Wednesday: NZ employment report, FOMC announcement.
The NZD/USD is falling sharply on Tuesday amid a stronger dollar and ahead of the FOMC meeting and the New Zealand employment report. The pair broke a range and tumbled to 0.7106, reaching the lowest level since October 19.
NZD losses strength on US hours
The kiwi dropped against its G10 rivals during the American session, probably weakened by the rebound in AUD/NZD. The US dollar rose across the board, pushing NZD/USD further to the downside. The greenback gained momentum even as US yields dropped modestly and the fact that stocks were higher on Wall Street. The AUD/NZD bottomed hours ago following the Reserve Bank of Australia at 1.0403, the lowest in a month and as of writing, is at 1.0470.
Early on Wednesday, the employment report is due in New Zealand. “We are more hawkish on the Q3 NZ labour market report and expect it to show that the labour market has turned even tighter despite most parts of NZ being in lockdown in Q3. We expect the Q3 unemployment rate to fall to 3.5% from 4.0% in Q2 (cons: 3.9%),” wrote TD Securities analysts. They point out employment growth is likely to be strong again, “up 1.0% q/q (cons: 0.4%, Q2:1.1%) with Stats NZ's monthly employment indicator showing filled jobs rising 1.3% q/q at the end of Q3.”
Then, during the second half of the American session, the Federal Reserve will announce its monetary policy decision. No change in rates is seen; an announcement regarding the purchase program is expected. Volatility in the bond and currency markets will likely rise around the event. Previously, price action could remain sideways.
Technical levels
-
15:02
USD/TRY extends the range bound theme near 9.6000
- USD/TRY resumes the upside after Monday’s retracement.
- The upbeat tone in the greenback weighs on the EM FX space.
- Turkey’s key inflation figures will be published on Wednesday.
The soft stance in the Turkish currency prompts USD/TRY to regain upside traction and leave behind Monday’s uptick.
USD/TRY now looks to key CPI data
USD/TRY resumes the upside on Tuesday and extend the multi-session consolidative mood at the same time, all amidst the rebound in the greenback and investors’ speculations ahead of the release of key inflation figures in Turkey (Wednesday).
In fact, the greenback regains some composure after Monday’s decline and push the US Dollar Index (DXY) back to the 94.00 region on the back of rising cautiousness ahead of the FOMC event on Wednesday, all despite the move lower in US yields.
The lira, in the meantime, gives away part of Monday’s gains after a positive meeting between President Erdogan and his US counterpart Biden on the purchase of fighter jets by Ankara.
Later in the week, TRY is expected to remain under scrutiny in light of the release of Turkish inflation figures during October (+20% YoY exp.) as well as the FOMC event and US Nonfarm Payrolls.
USD/TRY key levels
So far, the pair is gaining 0.54% at 9.5802 and a drop below 9.4128 (weekly low Oct.26) would aim for 9.2979 (20-day SMA) and finally 9.1965 (weekly low Oct.21). On the other hand, the next up barrier lines up at 9.8395 (all-time high Oct.25) followed by 10.0000 (psychological level).
-
14:42
China: Economic outlook deteriorates further – UOB
Economist at UOB Group Ho Woei Chen, CFA, assesses the latest PMI results in the Chinese economy.
Key Takeaways
“China’s official manufacturing Purchasing Manager’s Indexes (PMI) stayed in contraction for the second straight month as the reading fell to 49.2 in October from 49.6 in September. This is below Bloomberg’s consensus estimate of 49.7 and the lowest reading since the early period of the pandemic in February 2020. Supply-side constraints such as energy crunch, higher commodity prices and supply chain disruption have dampened outlook despite resilient global demand which would likely receive further lift due to seasonal factors.”
“The official non-manufacturing PMI remained in expansion (above 50) but also fell by a larger than expected pace in October, down 0.8 points to 52.4 from 53.2 in September (Bloomberg est: 53.0).”
“We retain our forecast for China’s 4Q21 GDP growth to slow further to 3.5% y/y from 4.9% y/y in 3Q21 for full-year 2021 growth at 7.9%. Risks continue to stem from electricity shortages affecting industrial production, supply bottlenecks, tighter COVID-19 restrictions and a softer real estate market. Conversely, expectation of some easing in the government’s regulatory crackdown, policy support as well as measures to maintain stability of energy supplies in the winter months amidst the growth slowdown may help to lift sentiment.”
-
14:37
EUR/USD Price Analysis: A test of 2021 low not ruled out
- EUR/USD comes under pressure and falters above 1.1600.
- A deeper move to the YTD low at 1.1524 is not discarded.
EUR/USD remains on the defensive and returns to the sub-1.1600 area on Tuesday.
EUR/USD’s earlier bullish attempt ran out of steam just past 1.1600 the figure and forced the pair to refocus on the downside and on another potential visit to the 2021 low at 1.1524 (October 12) at the same time.
In the meantime, the near-term outlook for EUR/USD is seen on the negative side below the key 200-day SMA, today at 1.1898.
EUR/USD daily chart
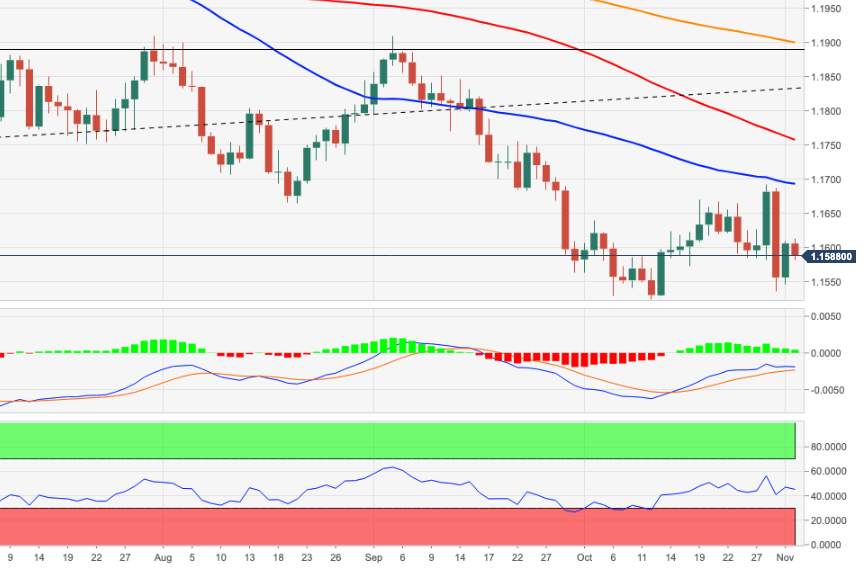
-
14:26
US Dollar Index Price Analysis: Interim hurdle lines up at 94.30
- DXY resumes the upside following Monday’s pullback.
- Next target for bulls comes at the 94.30 region.
The index trades on the positive territory and leaves behind the daily pullback recorded at the beginning of the week.
Further recovery is now predicted to challenge last week’s tops around 94.30. A move further north from there could pave the way for another visit to the 2021 high at 94.56 (October 12) in the relatively near term.
Looking at the broader picture, the constructive stance on DXY is seen unchanged above the 200-day SMA at 91.99.
DXY daily chart

-
14:25
USD/CAD back at 1.2400 after brief test of 21DMA
- USD/CAD is back at the 1.2400 level having briefly tested its 21DMA above 1.2420.
- This week, the pair is focused on the OPEC+ and Fed meetings, as well as US and Canadian jobs data.
USD/CAD is currently flirting with the 1.2400 level, up about 0.2% on the day, amid a lack of notable fundamental catalysts in recent hours. The pair at one point changed hands as high as 1.2420, coming within a whisker of its 21-day moving average at 1.2422, but has come off these highs. Canadian Building Permits data from September was released earlier in the session and was a little better than expected, up 4.3% MoM versus forecasts of a 3.1% rise, but the data has offered little support for the loonie on Tuesday, with USD/CAD trading more as a function of broader currency market dynamics. Despite buoyancy in global equities, FX markets reflect a somewhat more risk-averse tone, with risks sensitive currencies like AUD, NZD and NOK performing the worst in the G10, while the safe-haven JPY and USD do the best.
Data and central banks
The main focus for FX markets this week is on the outcome of Wednesday’s FOMC and Thursday’s BoE policy meetings, as well as on US data in the form of October ISM Services PMI on Wednesday and the October jobs report on Friday. Canadian jobs data is also released on Friday alongside the US report. A more hawkish than expected outturn from the Fed and BoE might support the USD and GBP, but it may also get the juices flowing for similar hawkish policy turns from the likes of the BoC, who most analysts suspect will stay a few steps ahead of the Fed in terms of monetary policy normalisation, which could in turn limit any CAD downside. Indeed, if this week’s Canadian labour market report supports the case for early BoC rate hikes, the stage is set for the loonie to be one of the better G10 performers.
OPEC+ meet this week
CAD traders must also, as ever, keep one eye firmly fixed on oil market dynamics; OPEC+ meet on Thursday and a Bloomberg survey out earlier on Tuesday showed that all surveyed analysts expect the cartel to stick to their existing pact which stipulates that oil production will be lifted by 400K barrels per day per month until output cuts have been fully unwound in mid-2022. OPEC+’s cautious stance in bringing supply back online slowly has faced strong international blowback and oil strategists expect that over the coming months, global oil consumption is set to outstrip oil production by a significant margin (perhaps as much as 2M barrels per day), thus contributing to tight market conditions and prices remaining well supported. WTI is on Tuesday trading in the $83.00s per barrel, within ranges of recent weeks. Should prices resume their recent march higher, this could be the impetus that loonie traders had been waiting for to send USD/CAD back towards recent lows around 1.2300, or even back towards a test of annual lows around 1.2000.
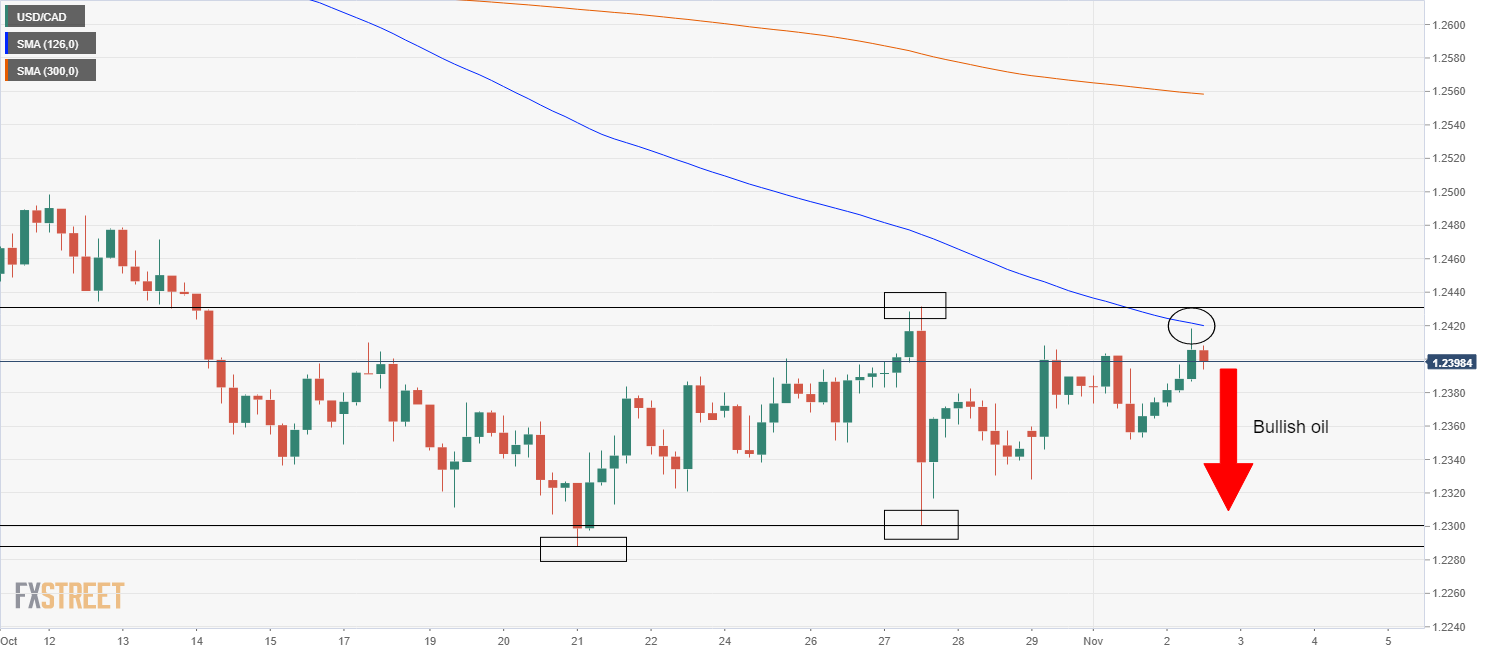
-
14:11
EUR/JPY Price Analysis: Solid contention remains around 131.50
- EUR/JPY leaves behind Monday’s gains and retests 131.50.
- Further losses await on a breach of the mid-131.00s.
Sellers returned to the market and dragged EUR/JPY back to the negative territory on turnaround Tuesday.
The cross fades Monday’s constructive price action and refocuses instead once again on the 131.50 area, which still emerges as quite a strong support area. This zone is also reinforced by a Fibo level (of the October’s rally) at 131.51. The loss of this area is expected to meet the next level at another Fibo at 130.97.
In the broader scenario, while above the 200-day SMA at 130.26, the outlook for the cross is expected to remain constructive.
EUR/JPY daily chart
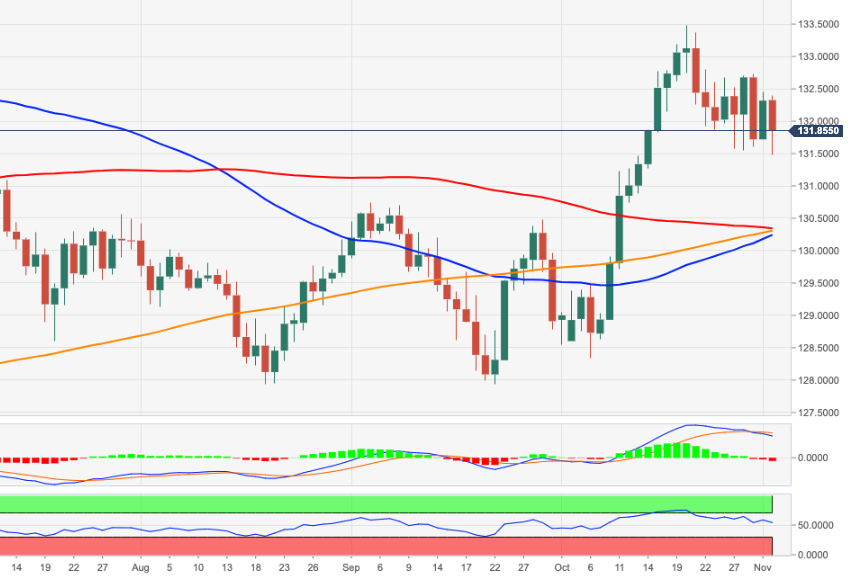
-
14:05
GBP/USD is on course to challenge the 1.36 level – Scotiabank
Cable is on a four-day losing streak – its longest since late-Sep – ahead of Thursday’s Bank of England (BoE) decision. Economists at Scotiabank expect GBP/USD to suffer minor downward drift toward 1.36 owing to the chance that the bank holds.
GBP to slip as markets consider BoE tightening risks
“We think the odds that the BoE holds have risen. A rate hike this year still seems likely but the BoE may want to rein in expectations for 2022 – and hiking at the same time makes this a complicated message.”
“GBP/USD looks on track for a test of 1.36 that should stand as firm support and see it bought on dips below the figure until ~1.3585. A break below the mid-figure zone does leave the GBP at a clear risk of re-testing the low 1.34s where it traded in late-September.”
“Resistance is ~1.3670 and then the 1.37 zone with the 50-day MA at 1.3712.”
-
14:02
New Zealand GDT Price Index registered at 2.2% above expectations (0.6%)
-
14:01
United States IBD/TIPP Economic Optimism (MoM) declined to 43.9 in November from previous 46.8
-
14:00
USD/CAD to see another leg lower after a brief rebound – Scotiabank
The Canadian dollar slips but holds range. In the view of economists at Scotiabank, the broader backdrop remains positive for the loonie.
USD to remain firmer as investors look ahead to the Fed outcome
“CAD weakness looks somewhat excessive relative to modest losses in crude and still very supportive spreads.”
“The USD may stay relatively elevated ahead of the FOMC but the fundamental support for the CAD remains strong, in our opinion, and we still rather favour looking to fade modest USD gains.”
“Price action retains a very modest upward tilt but the pattern of trade on the daily chart suggests a brief pause in the broader USD decline ahead of another leg lower (bear flag formation).”
“Resistance is 1.2440/45. Support is 1.2315.”
-
13:59
S&P 500 Index opens modestly higher, energy stocks underperform
- Major equity indexes in the US edge higher after the opening bell.
- Technology stocks post strong gains in the early trade.
- Energy shares underperform pressured by falling crude oil prices.
Wall Street's main indexes opened modestly higher after closing in the positive territory on Monday. As of writing, the S&P 500 was trading at a new record high of 4,623, rising 0.22% on a daily basis. Meanwhile, the Dow Jones Industrial Average was virtually unchanged on the day at 35,904 and the Nasdaq Composite was up 0.2% 15,622.
Among the 11 major S&P 500 sectors, the Technology Index is up 0.62% as the biggest gainer after the opening bell. On the other hand, the Energy Index is losing 0.4% pressured by falling crude oil prices.
There won't be any high-tier macroeconomic data releases in the remainder of the day. Investors are awaiting the US Federal Reserve to announce its policy decisions on Wednesday.
S&P 500 chart (daily)
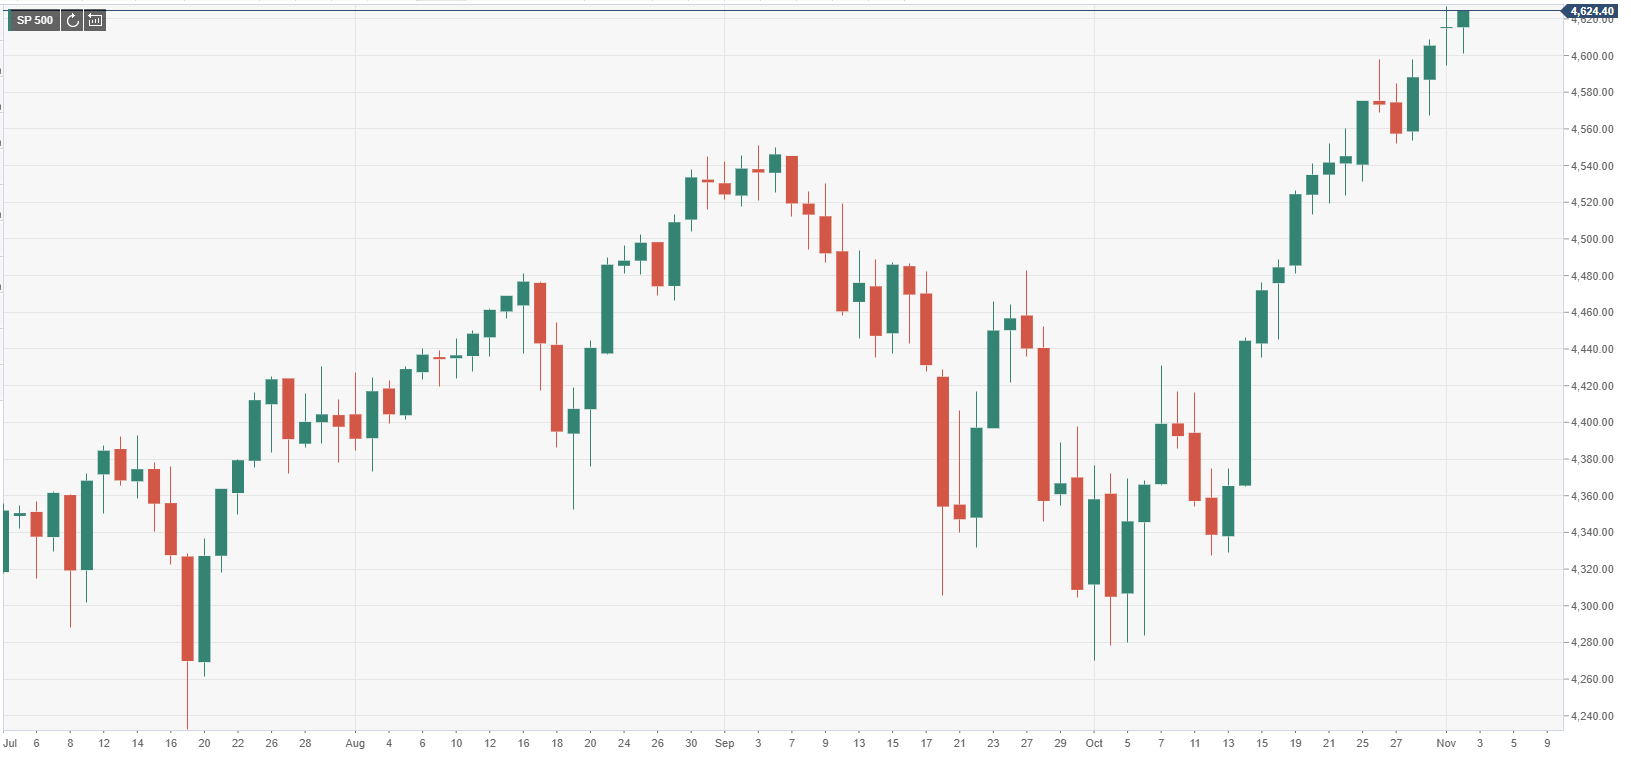
-
13:54
USD/IDR faces strong resistance at 14,280 – UOB
Further upside in USD/IDR is likely to meet a tough barrier at the 14,280 level, according to Quek Ser Leang at UOB Group’s Global Economics & Markets Research.
Key Quotes
“We highlighted last Monday (25 Oct, spot at 14,180) that ‘there is room for the rebound to extend but a break of the solid resistance at 14,250 (declining trend-line that sits close to the 55-day exponential moving average) would come as a surprise’. Our view was not wrong as USD/IDR rose to 14,205 last Thursday (28 Oct). However, USD/IDR soared earlier today and took out the declining trend-line resistance and is currently holding around the moving average.”
“Upward momentum has improved and USD/IDR could strengthen this week. That said, overbought shorter-term conditions suggest that any advance is likely limited to a test of 14,280.”
-
13:32
AUD/USD stabilises just above 0.7450, still worst G10 performer on the day
- The pace of Tuesday’s pullback in AUD/USD has slowed in recent trade, with some support being found at 0.7450.
- The Aussie is the worst G10 performer amid a drop in iron ore prices and after a dovish RBA.
Though it remains the worst-performing currency in the G10 on the day, AUD/USD downside has abated in recent trade, with the pair seemingly finding some support at the 21 and 22 October lows just above the 0.7450 mark.
The Aussie has been weighed heavily thus far on Tuesday by two key factors; 1) the governor of the Reserve Bank of Australia (RBA) Philip Lowe delivered a stronger than expected pushback against the hawkish pricing of Australian money markets that sees rate hikes coming as soon as 2022 and 2) a sharp decline in Chinese iron ore prices that saw futures on the Dalian exchange drop 10% and hit their “limit down” amid panic about weak demand as molten iron output is curbed as power is conserved for the coming winter heating season and with a view to ensuring air quality for the winter Olympics – remember, one of Australia’s key exports to China is iron ore.
RBA Recap
Just to quickly recap last night’s RBA event; the bank held interest rates at 0.1% and maintained the pace of weekly bond-buying at A$ 4B, as expected. The bank also announced an end to its yield curve control policy, where it had been attempting to keep the yields on all government bonds maturing until April 2024 at 0.1%, saying the policy had become inefficient – the real reason it because markets were forcing them to abandon the policy, with the yield on the April 2024 surging last week to well above 0.1%, leaving the RBA in a situation where they would have to purchase billions in order to defend the yield target, a cost they seemingly decided it was not worth incurring. This move was expected after the RBA refrained from preventing the yield spike last week.
The RBA does seem to have surprised investors, however, with the strength of the pushback against the market’s aggressive pricing for near-term rate hikes. RBA Governor Lowe was incredulous towards the prospect of a rate hike as soon as 2022 and was critical of the market pricing as an “overreaction” to global inflation data. The RBA did concede that it could now see hiking rates as soon as 2023, though a first-rate hike in 2024 also remains very possible and the outlook for rates is now more uncertain than before. This is because, whilst global inflationary pressures have clearly risen, the extent to which that affects Australia remains unknown and that wage growth (which the RBA sees as a key long-term driver of inflation) is still forecasted to remain subdued until at least 2023.
What next for AUD?
AUD/USD traders now await major economic events in the US, including Wednesday’s FOMC meeting and Friday’s US jobs report, but will also be on notice for the release of the RBA’s Statement on Monetary Policy (and new economic forecasts) during Friday’s Asia Pacific session.
ING think that AUD is yet to reflect the extent of the recent move higher in short-end Australian rates (to reflect hawkish RBA bets), and is thus undervalued, despite money markets modestly dialing down these hawkish bets in wake of last night’s RBA announcement. The bank argues that this undervaluation combined with the fact that, according to the latest CFTC positioning data, the market remains very short AUD, means there are upside risks for the Aussie in the near term. MUFG disagree, with last night’s RBA meeting emphasising to them that the central bank is set to lag the Fed, RBNZ, BoE, BoC and Norges Bank in terms of monetary policy normalisation, which may weigh on the Aussie in the coming weeks, which, when combined with negative technical pressures after AUD/USD failed to break above its 200DMA, means risks are tilted to the downside.
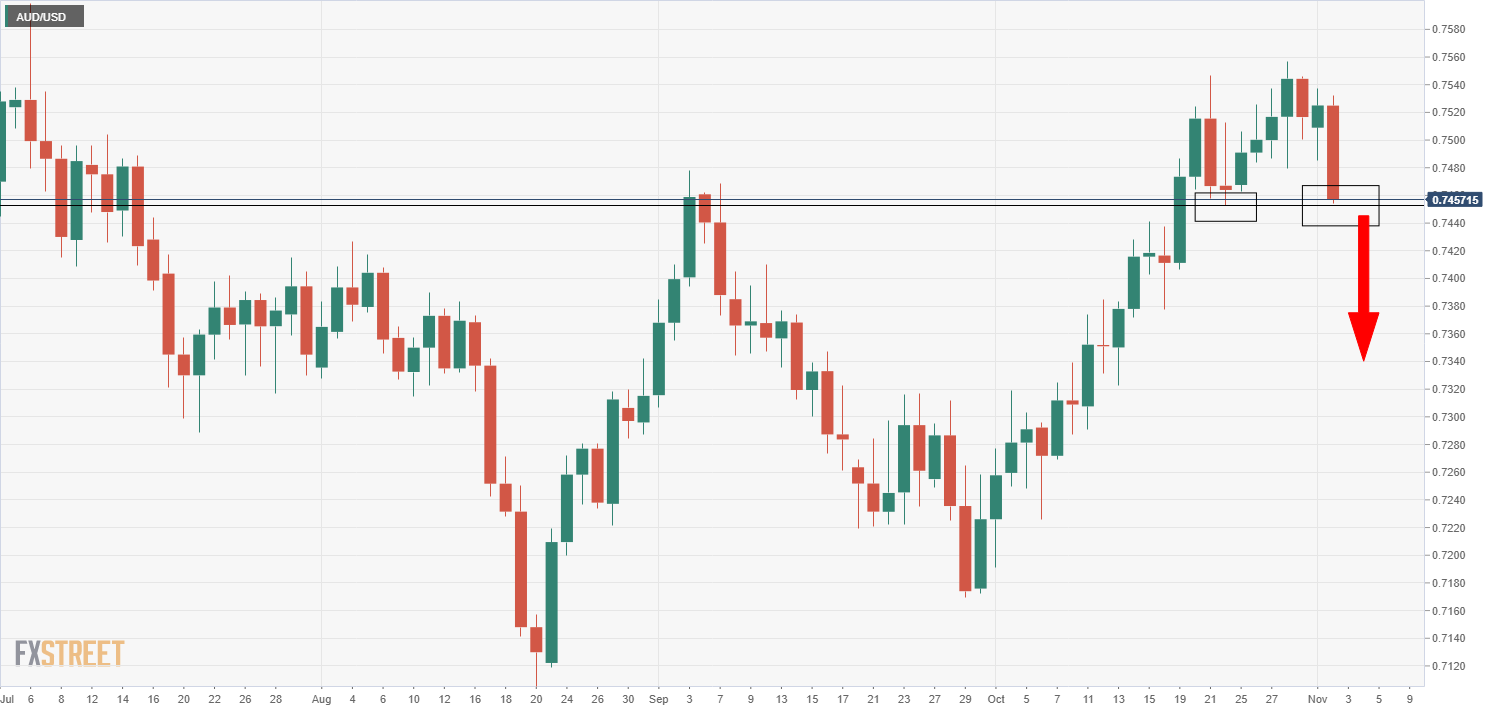
-
13:00
Chile Unemployment rate down to 8.4% in September from previous 8.5%
-
13:00
Singapore Purchasing Managers Index came in at 50.8, above expectations (50.6) in October
-
12:57
South Africa Total New Vehicle Sales: 41035 (October) vs previous 43130
-
12:55
United States Redbook Index (YoY) climbed from previous 15.6% to 16.9% in October 29
-
12:50
Oil can see a test of the $90 boundary – Citibank
Citi analysts upgrade their forecast for oil and expect WTI to trade at $85 with potential to see spikes to $90.
Tighter oil markets open up to spillover from tight natural gas/power this winter
“We revise the oil prices outlook up from 4Q’21 due to higher demand, lost supply, gas-to-oil switching and price contagion this winter, bringing inventories even lower before stock builds after 2Q’22.”
“We revise 4Q’21 price up to $85, with prices potentially at $90 at times. However, high supply could see prices ease after winter.”
“We expect shortages on supply chains (production, transport) may plague energy markets all winter, where prices could remain volatile.”
-
12:38
GBP/USD contained in mid-1.3600s as traders await key risk events
- GBP/USD trades subdued around the 1.3650 level amid a slightly risk-averse tone to markets.
- Traders are keeping their powder dry ahead of key events later in the week in both the UK and US.
GBP/USD continues to trade with a slight negative bias as US market participants enter the fray ahead of the start of the US trading day, though for now, the price action is subdued, in a continuation of the trading conditions observed on Monday. The pair dipped as low as the 1.3620s this morning (fresh near-three week lows), but has since recovered some poise to trade around the 1.3650 mark, which leaves it down about 0.1% on the day.
Broader market conditions are slightly risk-off, with European equities mostly lower following a downbeat Asia Pacific session handover, and crude oil and other commodity prices coming off the boil a little this morning. This seems to be lending FX havens (excluding CHF, which appears to be retracing some of its recent outperformance) some support, hence why JPY is the best G10 performer this morning, why USD is not far behind it and why the more risk-sensitive G10 currencies (AUD, NZD, NOK, CAD) are the worst performers. A risk-averse tone to markets goes a long way as to explaining why GBP/USD is subdued this morning.
Looming Risk Events
Moreover, looming risks events later in the week may be discouraging market participants from placing big bets on the GBP/USD pair, with participants perhaps opting instead for patience as they await the outcome of Thursday’s Bank of England rate decision and how UK/France fishing negotiations and UK/EU Northern Ireland Protocol talks unfold. With regards to the latest on the UK/France “fishing row” that has threatened to spill over into a trade and legal battle, the latest reports suggest that Brexit Minister Lord David Frost will be travelling to Paris for discussions with the French Minister of State for European Affairs Clement Beaune on Thursday, and it seems the French will hold off on imposing retaliatory measures against the UK over its fishing-related grievances until talks have concluded.
With regards to the Bank of England meeting; the outcome is still seen as highly uncertain. Money market pricing of future UK interst rates seems to imply a 15bps rate hike is now priced in, but economists remain divided (as do the BoE voters). The key questions that markets are awaiting answers to on Thursday are 1) will the bank hike or not? 2) what will the voting split on hiking be? 3) will the bank’s inflation forecasts justify hawkish money market pricing for further rate hikes in 2022 and 2023?
Remember also that there are key economic events this week in the US, including Wednesday’s Fed policy announcement (QE taper is expected to be announced) and Friday’s October Labour Market report that could drive volatility in GBP/USD through the US dollar channel.
-
12:37
S&P 500 Index to push higher towards the 4750 level – Credit Suisse
S&P 500 maintains its break above the psychological 4600 barrier. Analysts at Credit Suisse stay directly bullish for the beginning of its ‘typical”’ extreme now at 4632/36, with 4750 as a year-end objective.
Support stays seen at 4589
“S&P 500 extends its steady push to new record highs and we stay directly bullish for a move to the beginning of what we see as its ‘typical’ extreme (10% above the 200-day average) at 4632/36.”
“Whilst we will continue to look for a pause at 4632/36 at first, we look for a break in due course with resistance seen next at Fibonacci projection resistance at 4665/70. A fresh pullback from here will be looked for, but with this too (if indeed seen) seen as temporary ahead of further strength to trend resistance from April, now at 4713 and with 4750 our core Q4 objective.”
“Support stays seen at 4589 initially, then 4568, with an immediate upside bias seen whilst above 4552. A break can see a deeper setback to 4537, potentially 4524/20, but with fresh buyers expected here.”
-
12:30
Canada Building Permits (MoM) came in at 4.3%, above expectations (3.1%) in September
-
11:32
Chile IMACEC came in at 15.6%, above expectations (12.3%) in September
-
11:10
Further consolidation on the cards in USD/MYR – UOB
USD/MYR is likely to trade within the 4.1370-4.1600 range for the time being, noted Quek Ser Leang at UOB Group’s Global Economics & Markets Research.
Key Quotes
“Last Monday (25 Oct, spot at 4.1515), we highlighted that ‘the underlying tone has weakened somewhat USD/MYR could breach the rising trend-line support at 4.1420’. We added, ‘as downward pressure is not strong for now, any weakness is likely limited to a test of 4.1370’. Our view was not wrong as USD/MYR dipped slightly below the rising trend-line on Friday (low of 4.1400). Despite the breach of the trend-line, downward pressure has barely increased and USD/MYR is unlikely to weaken much further.”
“For this week, USD/MYR is more likely to consolidate and trade between 4.1370 and 4.1600. Looking ahead, in terms of several weeks, as long as USD/MYR does move above the 55-day exponential moving average (currently at 4.1680), there is chance for USD/MYR to edge lower towards Sep’s low at 4.1280.”
-
10:35
USD/THB remains side-lined for the time being – UOB
Quek Ser Leang at UOB Group’s Global Economics & Markets Research USD/THB still faces some consolidation in the near term.
Key Quotes
“We highlighted last Monday (25 Oct, spot at 33.27) that USD/THB ‘could dip below the month-to-date low at 33.15’ but we were of the view that ‘the next support at 33.00 is unlikely to come into the picture’. The subsequent weakness exceeded our expectations as USD/THB dip to 32.98 before rebounding quickly.”
“Downward momentum has slowed a fair bit and USD/THB is unlikely to weaken further. For this week, USD/THB is more likely to trade sideways between 33.10 and 33.60.”
-
10:32
EUR/USD remains under pressure around 1.1600
- EUR/USD fades the initial uptick to the 1.1615 area.
- German, EMU final Manufacturing PMI recedes further.
- German 1oy Bund yields reverse the recent uptrend.
After an ephemeral move to levels past the 1.1600 barrier, EUR/USD has now returned to the 1.1590 region amidst the generalized lack of clear direction in the global markets.
EUR/USD now focuses on the FOMC
EUR/USD resumes the downside following Monday’s bullish attempt against the backdrop of the generalized absence of clear direction in the global markets along with a mild improvement in the greenback.
Indeed, markets seem to have entered the usual pre-FOMC lull as the Federal Reserve’s 2-day meeting kicks in later today. On the latter, consensus among market participants remains tilted to the announcement of the start of the QE tapering this month, at a likely $15B monthly pace.
In the docket, final Manufacturing PMIs in both Germany and the broader Euroland came in a tad below the preliminary figures, which is also seems to be weighing on the shared currency on turnaround Tuesday.
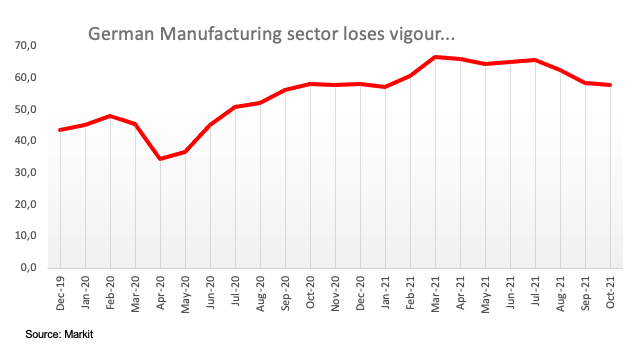
A thin US docket includes the November’s IBD/TIPP Economic Optimism Index seconded by the API’s weekly report on US crude oil inventories.
What to look for around EUR
EUR/USD plummeted well below the 1.1600 support on Friday, although it managed to regain some composure at the beginning of the week. In the meantime, spot continues to look to the risk appetite trends for direction as well as dollar dynamics, while the loss of momentum in the economic recovery in the region - as per some weakness observed in key fundamentals - is also seen pouring cold water over investors’ optimism and tempering bullish attempts in the European currency. Further out, the single currency should remain under scrutiny amidst the implicit debate between investors’ expectations of a probable lift-off sooner than anticipated and the ECB’s so far steady hand, all amidst the persevering elevated inflation in the region and prospects that it could extend further than previously estimated.
Key events in the euro area this week: Final Manufacturing PMIs (Tuesday) – ECB’s Lagarde, EMU Unemployment Rate (Wednesday) - Final Services PMIs (Thursday) – EMU Retail Sales (Friday).
Eminent issues on the back boiler: Asymmetric economic recovery post-pandemic in the region. Sustainability of the pick-up in inflation figures. Pick-up in the political effervescence around the EU Recovery Fund in light of the rising conflict between the EU, Poland and Hungary on the rule of law. ECB tapering speculations.
EUR/USD levels to watch
So far, spot is losing 0.12% at 1.1591 and faces the next up barrier at 1.1691 (55-day SMA) followed by 1.1692 (monthly high Oct.28) and finally 1.1755 (weekly high Sep.22). On the other hand, a break below 1.1535 (weekly low Oct.29) would target 1.1524 (2021 low Oct.12) en route to 1.1495 (monthly low Mar.9 2020).
-
09:57
USD/ZAR to enjoy further gains towards the 16.00 level – SocGen
USD/ZAR advances to 15.47, the highest since March. Economists at Société Générale expect the pair to extend its advance towards the 16.00 level.
Initial support seen at 15.10
“USD/ZAR has confirmed a multi month inverse Head and Shoulders denoting possibility of extension in uptrend. Daily MACD has crossed above its trigger and is in positive territory which points towards prevalence of upside momentum.”
“The pair looks poised to head higher towards the high formed earlier this year at 15.55/15.70 and projections of 16.00.”
“Immediate supports are located at the neckline near 15.10 and 14.75.”
-
09:52
USD/CNH: Downside pressure looks mitigated – UOB
Further weakness in USD/CNH seems to have now lost some momentum, suggested FX Strategists at UOB Group.
Key Quotes
24-hour view: “We expected USD to ‘consolidate and trade within a range of 6.3950/6.4100’ yesterday. USD subsequently traded between 6.3925 and 6.4091. Further consolidation appears likely even though the slightly weakened underlying tone suggests a lower range of 6.3880/6.4060.”
Next 1-3 weeks: “There is not much to add to our update from yesterday (01 Nov, spot at 6.4030). As highlighted, the recent risk for a lower USD has more or less dissipated and USD is likely to trade between 6.3800 and 6.4250 for now.”
-
09:49
Natural Gas Futures: Potential for further losses
Considering advanced prints for natural gas futures markets from CME Group, open interest reversed four consecutive daily pullbacks and rose by around 1.5K contracts at the beginning of the week. Volume followed suit and went up by around 39.1K contracts after three daily drops in a row.
Natural Gas faces initial contention around $5.00
Prices of natural gas extended the downtrend on Friday amidst rising open interest and volume, leaving the door open to the continuation of the leg lower. That said, next contention comes at the $5.00 mark per MMBtu ahead of the $4.80 region.
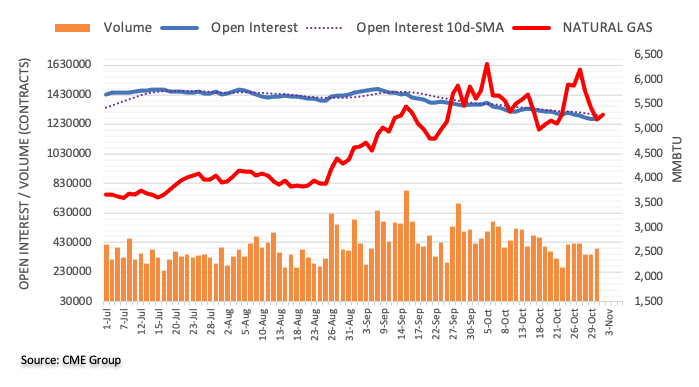
-
09:44
GBP/USD Price Analysis: Risks further falls to 1.3600 after breaching daily support line
- GBP/USD falls for the third straight day on Tuesday, 1.3600 remains at risk.
- Pre-Fed and BOE anxiety combined with Brexit concerns weigh on the pair.
- RSI edges lower below the midline, supporting the near-term bearish outlook.
GBP/USD is off the lows but remains pressured towards 1.3600, extending its bearish momentum into the third consecutive day this Tuesday.
The UK and France spar over the fishing rights in the post-Brexit transition rules, making it a nightmare for cable buyers.
Meanwhile, the overall dour market mood ahead of the critical monetary policy decisions from the Fed and the BOE keep the downside pressures intact on the spot.
The near-term technical outlook also paints a gloomy picture for GBP/USD, as the price risks falling further to test the 1.3600 barrier, having decisively breached the rising trendline support on the daily chart at 1.3678 on Monday.
If the 1.3600 support gives way, then a fresh downswing towards the horizontal trendline support, which coincides with October 12 low, at 1.3568 will be inevitable.
The 14-day Relative Strength Index (RSI) is edging lower below the midline, backing a potential move lower in the pair.
GBP/USD: Daily chart
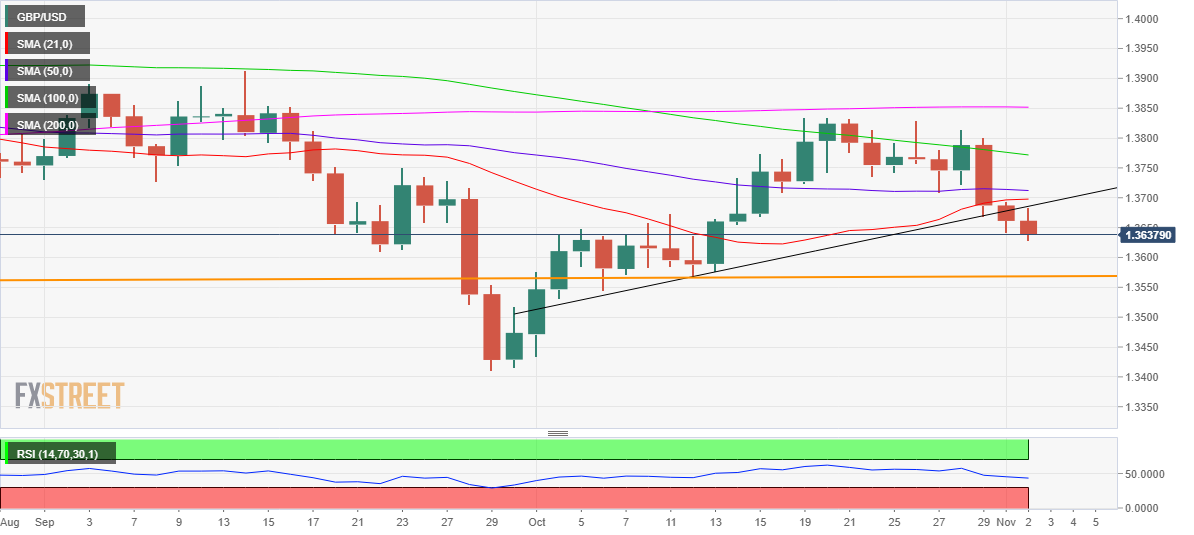
Any recovery attempt could meet the initial supply zone at 1.3686, which was the rising trendline resistance now turned into support.
Up next, 21-Daily Moving Average (DMA) at 1.3697 will restrict the additional advances. The bulls will then challenge the critical horizontal 50-DMA at 1.3712 to seek further validation to the upside.
GBP/USD: Additional levels to consider
-
09:30
EUR/NOK: Positive tailwinds for the krone to ease in the year ahead – MUFG
During October the krone strengthened against the euro from 10.107 to 9.7700. The krone has benefited from three key factors recently but economists at MUFG Bank expect the current positive fundamental tailwinds to ease in the year ahead.
Three ositive fundamentals have encouraged a stronger NOK
“Firstly, the price of oil has continued to rise with Brent moving to within touching distance of our year-end forecast of $87/barrel. The 30-day correlation between daily percentage changes in EUR/NOK and the price of Brent has averaged a record high of -0.64 over the past quarter.”
“Secondly, the krone has benefitted from the recent improvement in global investor risk sentiment. The MSCI’s ACWI global equity index has almost fully reversed September’s sell-off as heightened market concerns over downside risks to global growth from China and higher inflation have eased for now. “
“Thirdly, the krone is continuing to benefit from the Norges Bank’s hawkish plans for further policy normalization. The Norges Bank was the first G10 central bank to start raising rates, and it has indicated that it expects to raise rates at a quarterly pace going forward with the next hike likely in December. The Norwegian rate market expects the policy rate to rise towards 1.25% in the year ahead. The latest economic data from Norway has supported rate hike expectations as well.”
“While these factors are likely to remain supportive for a stronger krone in the near-term, we expect the current positive fundamental tailwinds to ease in the year ahead.”
-
09:27
USD/JPY sticks to the range bound theme – UOB
In light of the recent price action, USD/JPY is now expected to extend the consolidation in the next weeks, likely between 113.20 and 114.70.
Key Quotes
24-hour view: “Yesterday, we highlighted that ‘there is room for USD to test 114.30’. We added, ‘the major resistance at 114.70 is not expected to come into the picture’. Our view was not wrong as USD rose to 114.44 before easing off to close little changed at 113.98 (-0.02%). Upward pressure has eased and USD is unlikely to strengthen further. For today, USD is more likely to trade sideways between 113.75 and 114.25.”
Next 1-3 weeks: “We continue to view the current movement in USD as part of a consolidation phase and USD is likely to trade between 113.20 and 114.70 for now.”
-
09:18
Gold Price Forecast: XAU/USD eyes a pre-Fed bumpy ride to $1805 – Confluence Detector
- Gold price clings to the previous recovery gains below $1800.
- Falling shorter-duration yields offer support to gold price.
- XAU/USD’s drop below $1,780 an ominous sign ahead of Fed.
Gold is moving back and forth in narrow range so far this Tuesday, holding onto the previous recovery gains amid a cautious market mood. The US dollar is trading broadly subdued amid a sell-off in the shorter-duration Treasury yields, benefitting the non-yielding gold. Investors believe that the Fed will announce tapering on Wednesday but may push back the expectations of rate hikes. Looking ahead, the pre-Fed anxiety and the dynamics in the yields will continue to play amid a data-light US docket.
Read: Gold Price Forecast: XAU/USD awaits acceptance above this key hurdle, as Fed meet kicks off
Gold Price: Key levels to watch
The Technical Confluences Detector shows that gold is looking to recapture the previous day’s high of $1796 on its upward march. The Fibonacci 61.8% one-week coincides at that level.
Immediate upside barrier appears at $1798, which is the Fibonacci 23.6% one-month. Acceptance above the latter will fuel a sharp rally towards $1805, the intersection of the pivot point one-week R1 and pivot point one-day R2.
Further up, the previous week’s high of $1810 will be the level to beat for gold bulls.
Meanwhile, the SMA200 one-day at $1792 will cap any pullback in gold price.
The next strong support awaits at $1789, where the Fibonacci 38.2% one-month and SMA10 four-hour intersect.
The confluence of the SMA100 one-day and Fibonacci 38.2% one-week at $1786 will then be on the sellers’ sights.
The SMA50 one-day at $1782 is the last line of defense for gold buyers.
Here is how it looks on the tool
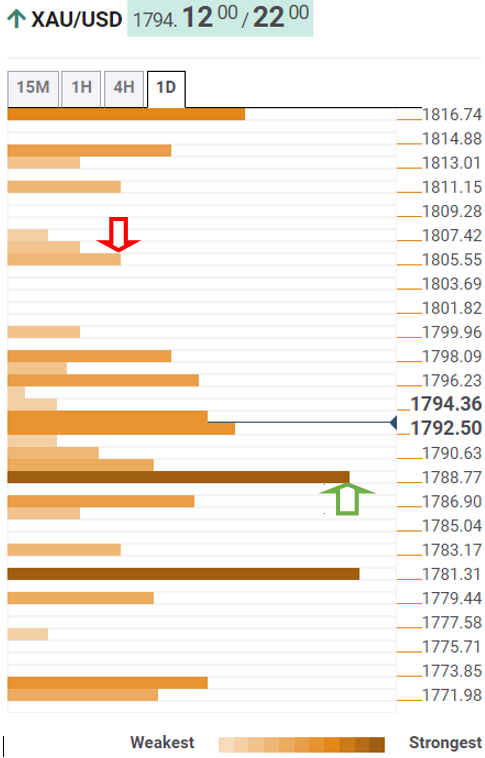
About Technical Confluences Detector
The TCD (Technical Confluences Detector) is a tool to locate and point out those price levels where there is a congestion of indicators, moving averages, Fibonacci levels, Pivot Points, etc. If you are a short-term trader, you will find entry points for counter-trend strategies and hunt a few points at a time. If you are a medium-to-long-term trader, this tool will allow you to know in advance the price levels where a medium-to-long-term trend may stop and rest, where to unwind positions, or where to increase your position size.
-
09:01
European Monetary Union Markit Manufacturing PMI came in at 58.3 below forecasts (58.5) in October
-
08:55
Germany Markit Manufacturing PMI came in at 57.8 below forecasts (58.2) in October
-
08:53
US Dollar Index struggles for direction below 94.00
- DXY trades within an inconclusive fashion below the 94.00 level.
- US yields trade on the defensive on turnaround Tuesday.
- IBD/TIPP Index, API report next on tap in the US calendar.
The greenback, in terms of the US Dollar Index (DXY), reverses the negative start of the month and hovers around the 93.90 region on Tuesday.
US Dollar Index cautious ahead of FOMC event
The index navigates slightly within the positive territory on Tuesday amidst declining US yields and generalized lack of direction in the risk appetite trends.
Indeed, US cash markets see yields in the front end and the belly of the curve extending the recent decline to the 0.48% region and the 1.55% area, respectively; while the long end adds to the recent gains and approaches 1.97%.
The dollar, in the meantime, is expected to trade in a context of rising cautiousness ahead of the key FOMC event later in the week. Indeed, consensus sees the Committee announcing the start of the tapering process as soon as in November and at a likely pace of $15B per month.
Later in the US data space, the IBD/TIPP Economic Optimism Index is due seconded by the weekly report on US crude oil supplies by the API.
What to look for around USD
Friday’s surge in the dollar catapulted the index back above the key barrier at 94.00 the figure, although Tuesday’s selling bias saw part of that move eroded. Moving forward, the upcoming FOMC event will likely dictate the price action around the buck in the very near term at least amidst firm expectations of an announcement regarding the start of the QE tapering process. Furthermore, the price action surrounding the greenback is seen closely tracking US yields and the progress of the current elevated inflation as well as views from Fed’s rate-setters regarding the probability that high prices could linger for longer, all along the performance of the economic recovery against the backdrop of unabated supply disruptions and the equally incessant raise in coronavirus cases.
Key events in the US this week: Factory Orders, ISM Non-Manufacturing, ADP Report, FOMC meeting (Wednesday) – Balance of Trade, Initial Claims (Thursday) – Nonfarm Payrolls, Unemployment Rate (Friday).
Eminent issues on the back boiler: Discussions around Biden’s multi-billion Build Back Better plan. US-China trade conflict under the Biden’s administration. Tapering speculation vs. economic recovery. Debt ceiling debate. Geopolitical risks stemming from Afghanistan.
US Dollar Index relevant levels
Now, the index is gaining 0.05% at 93.92 and a break above 94.30 (weekly high Oct.29) would open the door to 94.56 (2021 high Oct.12) and then 94.74 (monthly high Sep.24 2020). On the flip side, the next down barrier emerges at 93.27 (monthly low October 28) followed by 92.98 (weekly low Sep.23) and finally 92.93 (100-day SMA).
-
08:50
France Markit Manufacturing PMI above forecasts (53.5) in October: Actual (53.6)
-
08:50
USD/ZAR: Rand weakness amid challenging conditions for emerging markets – MUFG
October has been a volatile month for the rand. USD/ZAR fell in the first half of October hitting an intra-day low of 14.354 before quickly reversing the move lower in the final weeks of the month. As economists at MUFG bank note, a less favourable external backdrop is dampening capital flows into emerging markets, which should hurt the ZAR.
Increasing speculation that the SARB will start raising rates on 18th November
“South Africa has been running an unusual current account surplus since the pandemic began which is helping to ease their reliance on external financing and make the rand less sensitive to fluctuations in global investor risk sentiment. Still the rand has been undermined by the Fed’s more hawkish plans for a faster tightening of monetary policy.”
“We expect the Fed to begin tapering QE from mid-November, and the tapering process is likely to be brought to an end by around the middle of next year. It leaves open the door for the first rate hike in 2H 2022.”
“Global inflation concerns and the weaker rand are increasing speculation that the SARB will start raising rates as soon as their next meeting on 18th November. However, we do not expect modest rate hikes to offer much support for the rand.”
“We expect further rand weakness in the year ahead as market conditions will be challenging for EM FX.”
-
08:45
Italy Markit Manufacturing PMI came in at 61.1, above forecasts (59.7) in October
-
08:44
AUD/USD to move downward after failure at the 0.7550 level – MUFG
The Australian dollar has weakened resulting in AUD/USD falling back below the 0.7500-level with the initial reaction to the RBA’s policy announcements. Economists at MUFG Bank expect the aussie to head lower in the near-term.
RBA drops YCC but pushes back against early rate hike expectations
“The RBA will discontinue the target for the yield on the April 2024 bond. The RBA now judges that ‘it is entirely plausible that the first increase in the cash rate will not be before the maturity of the current target bond – that is, the bond with a maturity date of April 2024. But it is now also plausible that a lift in the cash rate could be appropriate in 2023’. It signals an increased likelihood that the RBA could bring forward rate hike plans but it has not yet done so.”
“The possibility of earlier rate hikes beginning in 2023 is supported by upside risks to the RBA’s updated economic outlook.”
“Overall, we still expect the RBA to lag the Norges Bank, RBNZ, BoE, BoC and Fed in raising rates, undermining the relative appeal of the Australian dollar heading into next year.”
“After failing to break above the 200-day moving average at around 0.7550, we expect the AUD/USD to correct lower in the near-term.”
-
08:37
USD/CAD to extend its slump if terminal rate pricing can be extended – HSBC
Surprisingly, the Bank of Canada (BoC) ended QE, pointing to the possibility of an earlier rate hike. The CAD strengthened immediately after the announcement, before giving back some of its gains amid lower oil prices. Further CAD gains could be sustainable over the longer term, if terminal rate pricing can be extended, in the view of economists at HSBC.
The longer-term outlook for the CAD could depend on terminal rate pricing
“The BoC’s decision is likely to provide some near-term support to the CAD, and oil prices will remain part of the equation for the CAD. It is possible for oil prices to extend a rally that has been running in earnest now for 18 months, while our oil and gas analysts see oil prices dropping next year as US supply returns.”
“If markets see the BoC’s hawkishness as a sign that terminal rate pricing can be extended, this would potentially point to more sustainable gains for the CAD.”
-
08:36
NZD/USD now moved into a consolidative phase – UOB
NZD/USD is now seen navigating within the 0.7125-0.7225 range in the near term, suggested FX Strategists at UOB Group.
Key Quotes
24-hour view: “We expected NZD to trade between 0.7140 and 0.7190 yesterday. NZD subsequently traded between 0.7161 and 0.7200. Momentum indicators are mostly neutral and NZD is likely to trade sideways. Expected range for today, 0.7155/0.7200.”
Next 1-3 weeks: “There is not much to add to our update from yesterday (01 Nov, spot at 0.7170). As highlighted, NZD has moved into a consolidation phase and is likely to trade between 0.7125 and 0.7225 for now.”
-
08:32
Crude Oil Futures: Correction lower on the cards
CME Group’s flash data for crude oil futures markets noted traders scaled back their open interest positions by just 906 contracts on Monday, reaching the eighth consecutive daily pullback. In the same direction, volume resumed the downside and dropped by nearly 77K contracts.
WTI still targets $85.00 and above
Prices of the WTI extended the positive performance for yet another session on Monday. The move, however, was on the back of shrinking open interest and volume, showing the presence of short covering behind the move and allowing for some corrective downside in the short-term horizon. Despite the likelihood of a corrective decline, crude oil prices continue to target the 2021 highs well north of the $85.00 mark per barrel for the time being.
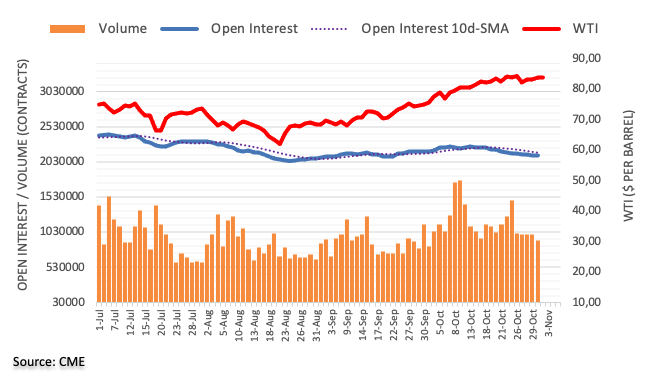
-
08:32
USD/JPY to see another leg higher towards the 115.61 mark – DBS Bank
USD/JPY’s rally from a 102.59 low has a spine and has registered a 114.70 high. The current rally could still pursue the completion of a technical price pattern, which would open up the possibility of USD/JPY moving towards the 61.8% Fibonacci retracement of the 125.86-99.02 at 115.61, Benjamin Wong, Strategist at DBS Bank, reports.
Still siding with the bull
“USD/JPY should continue to stay robust and head higher; unless it breaks under the first concrete support level around 111.52.”
“USD/JPY on its long-term quarterly chart remains mired in a large triangle setup. The price alert levels on top are 115.61, the 61.8% Fibonacci retracement of the 125.86-99.02 price grip, and the dropped-down resistance drawn from 147.66 (September 1998 significant high) that connects through 125.86 (which calibrates around 117.08).”
See: USD/JPY to peak out over the year-end and soften from 2022 – MUFG
-
08:30
Hong Kong SAR Retail Sales declined to 7.3% in September from previous 11.9%
-
08:25
USD/RUB: Rouble to stay stronger before partially reversing gains in 2022 – MUFG
USD/RUB has broken below the 70.000-level for the first time since June of last year. Fundamentals continue to favor stronger rouble but current tailwinds should ease in 2022, according to economists at MUFG Bank.
RUB benefits from rising energy prices
“We are not expecting OPEC+ members to speed up plans to increase oil production at their upcoming meeting in November despite calls from global consumers. We do however expect the price of oil to drop back in 2022 as tightness in the oil market eases which should also help ease current tailwinds in favor of a stronger rouble.”
“The CBR has signaled that it expects higher rates to be maintained for longer. The policy rate is expected to average between 7.3% and 8.3% in 2022 compared to their previous forecast of between 6.0% and 7.0%. The CBR is concerned that higher inflation will prove more persistent than initially expected.”
“We expect the rouble to remain stronger in the near-term before partially reversing gains in 2022.”
-
08:15
Spain Markit Manufacturing PMI came in at 57.4, below expectations (58.1) in October
-
08:10
AUD/USD to suffer further losses towards the 0.7437/27 support zone – Commerzbank
AUD/USD is easing back from the 200-day moving average (DMA) at 0.7556. Karen Jones, Team Head FICC Technical Analysis Research at Commerzbank, expects the aussie to challenge the 0.7437/27 support area.
AUD/USD needs to recover the 200-DMA to regain upside potential
“AUD/USD continues to consolidate just below the 200-DMA at 0.7556. We note the divergence of the daily RSI and should see some slippage.”
“Dips should find interim support at 0.7427 the 4th August high and 0.7437 (20-DMA) and this guards the 29th September low at 0.7171.”
“Above the 200-DMA lies the seven-month resistance line at 0.7607. We will need to regain this zone for further upside impetus.”
-
08:09
USD/IDR: Indonesia to continue to record trade surpluses, fueling the rupiah – MUFG
During October the Indonesian rupiah strengthened against the US dollar in terms from 14,310.0 to 14,165.0. As Indonesia’s terms of trade continuing to improve, economists at MUFG Bank expect the rupiah to enjoy further gains.
Potential downside risks looks more to be a 2022 story
“With the global supply crunch of commodities likely to keep prices elevated, including that of base metals, the terms of trade remain positive for Indonesia and should continue to lend support to the rupiah in the near-term.”
“Indonesia’s export growth remains solid with a 47.6% y/y jump in September from August’s revised 63.6% y/y. With export growth also higher in volume terms for key commodity exports, it reflects stronger external demand that should bode well for Indonesia’s merchandise trade in the near term and keep the current account deficit well-contained.”
“Potential downside risks for the rupiah would stem from the reversal of price trends of base metals and energy-related commodities like coal and natural gas when demand destruction sets in amid the slowdown in China’s economy and actions taken to limit commodity-fuelled inflation. This looks more like a 2022 story for now.”
-
07:55
GBP/USD to extend its correction lower towards the 1.3569 mark – Commerzbank
GBP/USD is on the defensive as it trades around 1.3650 after failing at the 1.3851 200-day moving average (DMA). Karen Jones, Team Head FICC Technical Analysis Research at Commerzbank, expects the cable to fall towards the 1.3569 mark.
GBP/USD to climb towards 1.3914 on a break above the 200-DMA
“GBP/USD is easing back from the 200-DMA at 1.3851. The cable has failed here for now and even though the move lower appears to be corrective, the market is on the defensive.”
“Below the market we have 1.3569, the 12th October low ahead of the 1.3411 recent low.”
“A move above the 200-DMA should see further gains to 1.3914 (mid-September high). Resistance at 1.3914 guards the more important 1.3984/1.4018 medium-term pivot.”
-
07:50
USD/JPY to peak out over the year-end and soften from 2022 – MUFG
The USD/JPY rose sharply from September, briefly hitting a four-year high of 114.69. In the view of economists at MUFG Bank, the USD/JPY could well rise further to 115-116. However, they expect the steep rise in commodity prices to abate early next year, which is likely to support a steady yen recovery.
Upside in short-term but to gradually peak
“The USD/JPY looks set to rise further given that commodity prices are likely to keep climbing. We expect it could rise to 116 (the upper side of our forecast range) within the year based on the deviation from purchasing power parity. Tight dollar supply/demand through to the end of the year is also likely to keep the dollar steady.”
“We forecast the USD/JPY will end the year below its current level as the rise in commodity prices loses steam and due to a fallback from its steep ascent.”
“We expect inflation expectations to stop rising in 2022 and forecast the USD/JPY will return to 110-111, the kick-off point for the current phase of increase, at end-FY21 (end-March 2022).”
“We have raised the overall level of our forecasts to reflect the higher starting point, but maintain our previous forecast that the USD/JPY will gradually soften in 2022 because we expect the dollar to face pressure to correct from overvalued levels and the yen to recover as inflation expectations decline.”
-
07:45
EUR/USD: Scope for a nosedive to the 1.1366 mark – Commerzbank
EUR/USD seems to have gone into a consolidation phase around 1.1600 on Tuesday. Karen Jones, Team Head FICC Technical Analysis Research at Commerzbank, expects the pair to challenge the recent low of 1.1522 and sees scope for a slump to 1.1366.
Negative below the five-month downtrend at 1.1696
“EUR/USD has recently just failed just ahead of the 55-day ma at 1.1694 and the 1.1696 five-month downtrend. The emphatic rejection from here implies that the 1.1522 recent low is exposed.”
“Below 1.1522 lies the 50% retracement of the move from 2020 and the March 2020 high at 1.1492/95.”
“Key support is the previous downtrend (from 2008) which is now located at 1.1366.”
-
07:44
USD/JPY Price Analysis: Drops towards critical 21-DMA amid weaker Treasury yields
- USD/JPY is back in the red after reaching eight-day tops on Monday.
- Bears look to challenge critical 21-DMA support at 113.43.
- RSI has turned south, backing the latest downtick in the pair.
USD/JPY is posting moderate losses so far this Tuesday, having faced rejection once above the 114.00 level.
The spot snapped its two-day uptrend, correcting sharply from eight-day highs of 114.44, as the US Treasury yields resume their recent downside heading into the critical Fed decision. The weakness in the US dollar amid repositioning also exacerbates the pain in the major.
Looking at USD/JPY’s daily chart, the price is extending the decline to test the upward-sloping 21-Daily Moving Average (DMA) at 113.43.
If the bearish momentum accelerates, then the short-term trendline support at 113.28 could be probed.
A sharp sell-off below the latter cannot be ruled out, exposing the 113.00 threshold.
USD/JPY: Daily chart
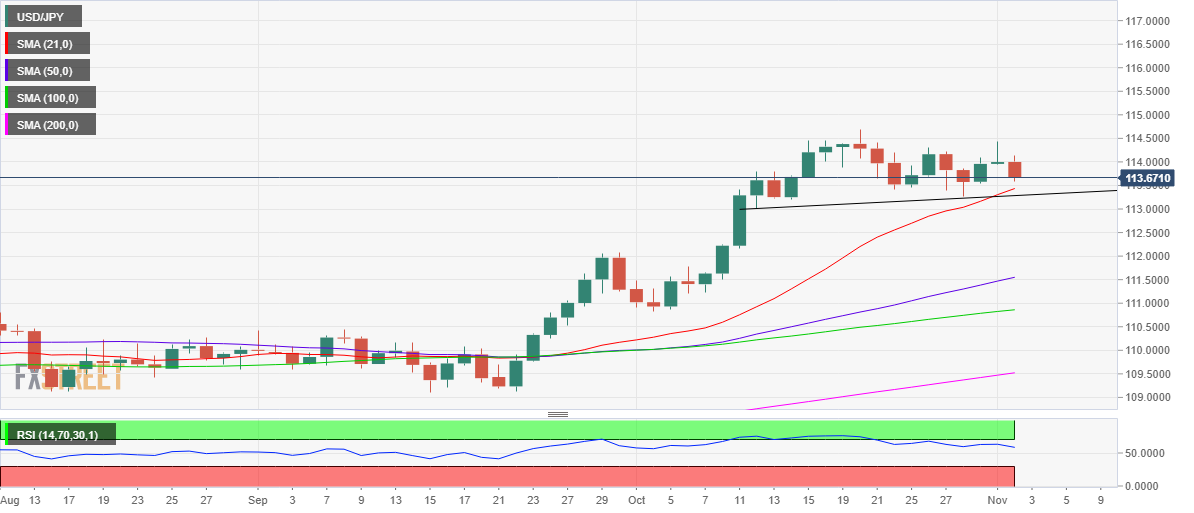
With the 14-day Relative Strength Index (RSI), however, still holding above the midline, the downside is likely to remain limited.
Acceptance above the weekly tops could call for a fresh advance towards the Oct 20 highs of 114.70.
Further up, the 115.00 psychological level will then challenge the bearish commitments.
USD/JPY: Additional levels to consider
-
07:39
NZD/USD to correct lower before staging a gradual recovery in 2022 – MUFG
During October the NZD/USD pair jumped from 0.6914 to 0.7149. Economists at MUFG Bank see downside risks initially given rate expectations could correct but RBNZ rate hike plans are set to continue encouraging demand for the kiwi next year.
RBNZ stands out and stance will support NZD
“Given we see global growth challenges persisting as supply-constraints problems are only slowly resolved, and China growth slowing the degree of monetary tightening in New Zealand is now beginning to look excessive.”
“There is some risk here of some adjustment lower to the rates curve that could see NZD correct temporarily before advancing higher on a more sustained basis.”
“We are unlikely to get the RBNZ adjusting to the market pricing so we are forecasting some brief NZD correction before gradual recovery in 2022.”
-
07:30
Switzerland Real Retail Sales (YoY) climbed from previous 0.5% to 2.5% in September
-
07:30
Switzerland Consumer Price Index (MoM) above expectations (0.1%) in October: Actual (0.3%)
-
07:30
Switzerland Consumer Price Index (YoY) came in at 1.2%, above expectations (1.1%) in October
-
07:30
USD/CHF to plunge towards June low at 0.8926 on a close below 0.9092 – Commerzbank
USD/CHF eroding the 2020-2021 uptrend at 0.9092. A close below here would open up the August and June lows at 0.9018 and 0.8926, respectively, Karen Jones, Team Head FICC Technical Analysis Research at Commerzbank, reports.
Focus is on the 2020-2021 uptrend
“USD/CHF has again sold off towards the 2020-2021 uptrend at 0.9092 and is weighing on this support.”
“Rallies are expected to find initial resistance at the 0.9211 downtrend ahead of the 0.9313 mid-October high. This guards 0.9357/69 (recent high).”
“The market will need to close below 0.9092 to confirm the end of the bull trend that we have seen throughout 2021 so far. A close below here will target the 0.9018 August low and the 0.8926 June low.”
-
07:16
FX option expiries for November 2 NY cut
FX option expiries for November 2 NY cut at 10:00 Eastern Time, via DTCC, can be found below.
- EUR/USD: EUR amounts
- 1.1495-00 1.2b
- 1.1585 1.9b
- 1.1645 811m
- 1.1675 733m
- GBP/USD: GBP amounts
- 1.3800 587m
- USD/JPY: USD amounts
- 113.50 430m
- 114.25 585m
- AUD/USD: AUD amounts
- 0.7475 367m
- USD/CAD: USD amounts
- 1.2560 690m
- EUR/GBP: EUR amounts
- 0.8440 581m
- 0.8525 440m
-
07:11
GBP/USD now seen grinding lower to 1.3625 – UOB
In opinion of FX Strategists at UOB Group, Cable could be heading towards the 1.3625 level in the next weeks.
Key Quotes
24-hour view: “We expected GBP to weaken further yesterday but we were of the view that ‘the next major support at 1.3625 is unlikely to come into the picture’. We highlighted that ‘there is another support at 1.3650’. Our view was not wrong as GBP dipped to a low of 1.3644. Downward momentum has improved a tad and the bias is still on the downside. That said, a break of the major support at 1.3625 appears unlikely for today. Resistance is at 1.3690 followed by 1.3710.”
Next 1-3 weeks: “Our view from yesterday (01 Nov, spot at 1.3675) still stands. As highlighted, GBP is likely to trade with a downward bias towards the solid support at 1.3625. GBP has to close below the solid support at 1.3625 before further sustained weakness can be expected. On the upside, a breach of the ‘strong resistance’ level at 1.3740 (level was at 1.3760 yesterday) would indicate that GBP is not ready to head lower towards 1.3625. Looking ahead, the next support below 1.3625 is at 1.3560.”
-
07:08
AUD/USD drops to fresh weekly lows below 0.7500 on dovish RBA
- AUD/USD sold-off into RBA’s dovishness despite opening doors to rate hikes.
- Pre-Fed anxiety weighs on global stocks, souring the market mood.
- A broadly subdued US dollar keeps the aussie’s downside cushioned.
AUD/USD is consolidating the steep losses near weekly lows of 0.7470, as the sentiment around the Australian dollar was hurt by the Reserve Bank of Australia (RBA) monetary policy decision.
Succumbing to the global policy unwinding pressure and rising inflation fears, the Australian central bank abandoned its 2024 April bond yield target at 0.1% while keeping the Official Cash Rate (OCR) at a record low of 0.1%.
Although the decision may appear hawkish, the central bank Governor Phillip Lowe tried his best to keep the doves happy. Lowe said, it was still “likely to take some time” for inflation to sustainably return to its target, which knocked off the short-term Australian government bond yields, reflective of the easing bets for aggressive tightening.
The aussie dollar bore the brunt of the falling short-term yields and dropped sharply against the US dollar. The divergent monetary policy outlooks between the Fed and RBA is back in play, exerting downward pressure on the major.
Meanwhile, the US dollar licks its wounds after Monday’s decline, as investors reposition their USD bets ahead of the critical US Federal Reserve (Fed) policy meeting, commencing later on Tuesday. The Fed is widely expected to announce tapering at its November meeting and could hint at sooner than expected rate hikes to counter the inflationary risks.
In the meantime, investors will continue weighing in the RBA decision while closely following the risk trends amid a data-light US docket.
AUD/USD technical levels to consider
-
07:08
Gold Futures: Further upside likely near term
Open interest in gold futures markets rose by around 6.5K contracts on Monday and extended the erratic performance seen as of late according to preliminary readings from CME Group. In the other direction, volume shrank by around 105.6K contracts.
Gold approaches $1,800
Monday’s uptick in prices of the ounce troy of the yellow metal edged higher amidst rising open interest, which is indicative that extra gains are now likely in the near term. That said, the $1,800 mark remains as the key target in gold for the time being.
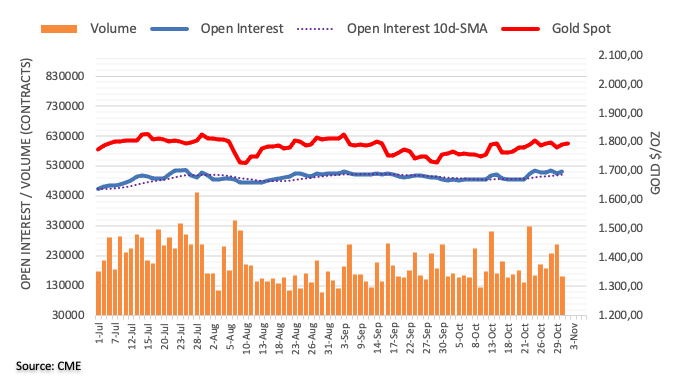
-
07:03
Gold Price Forecast: XAU/USD eyes a firm break above $1793 to target $1809 resistance
Gold price stalls Monday’s rebound as the US dollar firms up ahead of Fed. According to FXStreet’s Dhwani Mehta, a pullback in the Treasury yields could revive the bullish interests in the yellow metal.
XAU/USD awaits acceptance above the $1793 key hurdle
“With the Fed commencing its two-day monetary policy meeting and the RBA discontinuing its 2024 bond yield target, investors remain edgy and prompt a minor rebound in the greenback across the board. Therefore, gold’s upside appears capped for now. Should the US yields extend the corrective pullback, gold bulls could jump in once again, reaching out for the $1800 level.”
“Gold is clinging onto the $1793 level, which is the confluence of the 21 and 50-Simple Moving Averages (SMA) on the four-hour chart. A four-hourly candlestick closing above the latter is needed to provide more legs to Monday’s rebound. Gold bulls will then look to recapture the $1800 mark on their journey towards the falling trendline resistance at $1809.”
“The sellers eye an immediate target at the upward-sloping 100-SMA of $1783, below which Friday’s low of $1772 will come into the picture. The horizontal 200-SMA at $1769 will be the line in the sand for gold optimists.”
-
07:00
EUR/USD risks extra losses below 1.1525 – UOB
FX Strategists at UOB Group noted EUR/USD could weaken to the 1.1465 level if breaches 1.1525 in the near term.
Key Quotes
24-hour view: “The sharp rebound in EUR to 1.1609 came as a surprise (we were expecting EUR to test the support at 1.1525). The rebound appears to be running ahead of itself and EUR is unlikely to advance much further. For today, EUR is more likely to trade between 1.1570 and 1.1630.”
Next 1-3 weeks: “Yesterday (01 Nov), we highlighted that if EUR closes below the solid support at 1.1525, it is likely to weaken further to 1.1465. We added, ‘the chance for EUR to close below 1.1525 is quite high and would increase over these few days unless EUR moves above the ‘strong resistance’ level (currently at 1.1645)’. There is no change in our view for now even though after the sharp rebound to 1.1609 during NY session, the odds for EUR to close below 1.1525 have diminished. Looking ahead, a break of the ‘strong resistance’ at 1.1645 would indicate that EUR could trade in an undecided manner and within a broad range for a period of time.”
-
06:56
Forex Today: Dollar retreats modestly, investors move to sidelines ahead of key events
Here is what you need to know on Tuesday, November 2:
The positive shift witnessed in market sentiment made it difficult for the dollar to preserve its strength at the start of the week but the currency’s losses against its major rivals remained relatively limited ahead of key central bank events. IHS Markit’s final revision to October Manufacturing PMI for the euro area and Germany will be featured in the European docket ahead of the IBD/TIPP Economic Optimism data from the US. With European investors returning on Tuesday, investors will keep a close eye on the short-term bond yields and the flattening of the yield curves in major economies.
Wall Street: The S&P 500 and the Dow Jones Industrial Average Indexes posted new all-time highs on Monday fueled by surging energy stocks. However, the Shanghai Composite and the Nikkei 225 indexes are down 0.7% and 0.5%, respectively, while the US stock index futures are falling between 0.2% and 0.3%, suggesting that the mood is turning cautious.
The benchmark 10-year US Treasury bond yield stays in a consolidation phase above 1.5% after posting small losses on Monday.
Macro events: The data from the US showed on Monday that the business activity in the manufacturing sector continued to expand at a robust pace in October. However, the Prices Paid component of the ISM’s PMI survey jumped to 85.7 from 81.2 in September, revealing that input price pressures continued to increase.
The Reserve Bank of Australia (RBA) left its policy rate unchanged as expected but decided to discontinue the target of 10 basis points for the April 2024 Australian Government bond. Commenting on the policy outlook, RBA Governor Phillip Lowe said market pricing for early rate hikes was extremely unlikely.
The Bank of Japan’s (BoJ) Monetary Policy Meeting Minutes didn’t offer any surprises. Many policymakers said pent-up demand was yet to materialise in Japan. Nevertheless, the risk-averse market environment is helping the JPY stay resilient against its rivals and USD/JPY was last seen trading in the red around 113.70.
EUR/USD managed to stage a technical correction on Monday and seems to have gone into a consolidation phase around 1.1600 on Tuesday.
GBP/USD remains on the back foot despite the fact that French President Emmanuel Macron announced that he postponed planned sanctions on the UK to give more time to negotiators from both sides to work on new proposals on fishing arrangements. The pair is currently trading around 1.3650.
AUD/USD lost nearly 30 pips with the initial reaction to the RBA’s policy announcements and extended its slide toward the end of the Asian session. As of writing, the pair was down 0.6% on the day at 0.7478.
Gold ended the first trading day of the week in the positive territory but buyers might want to wait for a break above $1,800 before committing to further upside.
Cryptocurrencies: Bitcoin continues to fluctuate in a relatively tight range above $60,000. Ethereum edges higher toward $4,400 after staging a technical correction.
-
06:41
Japan’s Suzuki reaffirms that specific monetary policy is up to BOJ to decide
Japan Finance Minister Shunichi Suzuki is back on the wires now, having concluded a meeting with the Bank of Japan (BOJ) Governor Haruhiko Kuroda this Tuesday.
Key quotes
Reaffirms that specific monetary policy is up to BOJ to decide.
Reaffirms continuation of joint statement between government and BOJ.
Government and BOJ are keeping close contact with one another.
Wants BOJ to do utmost to ensure financial market stability.
No discussion on currencies in today's meeting.
In response to the meeting, the BOJ came out with a statement, citing that the two officials exchanged broad views on the economy, prices and the financial situation.
Market reaction
USD/JPY is testing lows near 113.60, falling sharply in tandem with the US Treasury yields as the risk sentiment remains tepid ahead of the key event risk.
-
05:58
USD/CHF: Ignores biggest jump of risk reversal in a week around three-month low
USD/CHF remains defensive around the lowest levels since early August, up 0.05% intraday near 0.9095, as European traders brace for Tuesday’s bell.
The Swiss currency pair dropped heavily the previous day, marking a three-month low, but the options market portrayed bullish signs as the Risk Reversal (RR), a measure of the spread between call and put prices, jumps the most in one week. That said, the RR rose 0.7000 for Monday, per the data source Reuters.
A call option gives the holder the right but not obligation to buy the underlying asset at a predetermined price on or before a specific date. A put option represents a right to sell. Hence, the latest jump in the RR hints at the bull's risk-taking play around multi-day low.
It should be noted, however, that the pre-Fed sentiment may keep weighing on the USD/CHF prices due to the CHF’s safe-haven demand and hence the options market signal should be taken with a pinch of salt.
Read: Don‘t fear risk-off
-
05:46
USD/CAD Price Analysis: Advances towards 1.2400 inside weekly triangle
- USD/CAD picks up bids to refresh intraday top.
- One-week-old symmetrical triangle restricts immediate moves above 200-HMA.
- Firmer Momentum line keeps buyers hopeful, key Fibonacci retracement levels add to the downside filters.
USD/CAD remains firmer around the day’s top of 1.2385, up 0.11% intraday ahead of the European session. That said, the quote remains inside a four-day-old symmetrical triangle by the press time of Tuesday.
It’s worth noting that the Loonie pair’s successful trading above 200-HMA and firmer Momentum line adds strength to the bullish bias.
However, a clear upside break of the triangle’s resistance line, near 1.2395, becomes necessary for the USD/CAD optimists to aim for the latest swing high near 1.2430.
In a case where the pair buyers remain dominant past 1.2430, September’s low near 1.2490 will be in focus.
Alternatively, 200-HMA tests immediate downside near 1.2365 before the triangle’s support line near 1.2360.
If at all the USD/CAD bears manage to conquer the 1.2360 support, odds of the following plunge towards October’s low, also the lowest since June 2021 around 1.2285, gains the market’s attention.
USD/CAD: Hourly chart
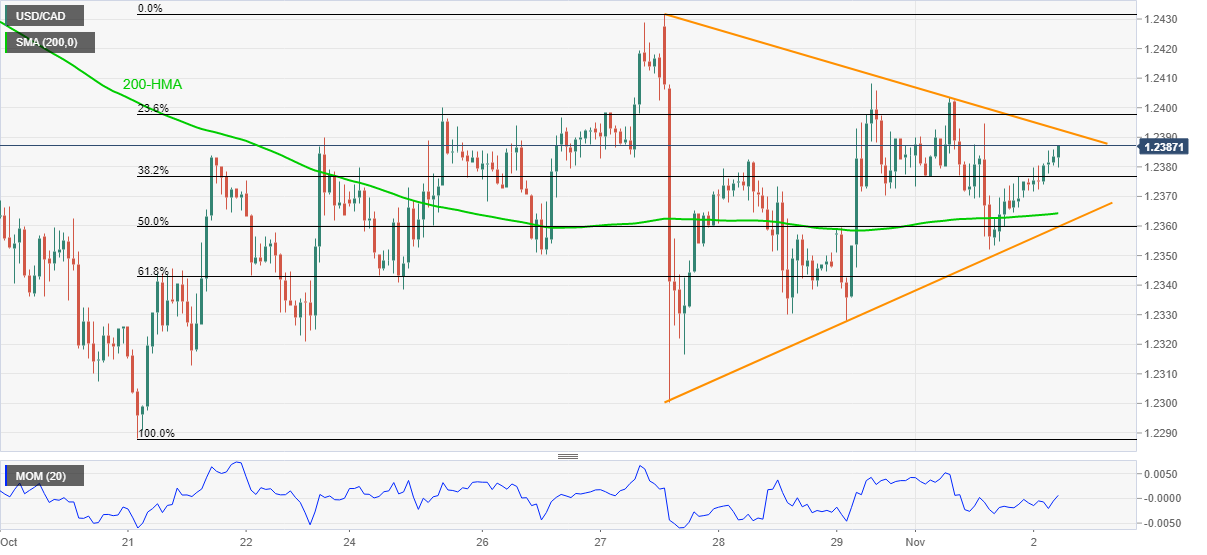
Trend: Further upside expected
-
05:30
Gold Price Forecast: XAU/USD hovers around $1,800 with eyes on India, Fed
- Gold struggles to extend week-start rebound, eases from intraday top.
- Festive demand at the world’s largest gold customer eyed, Fed’s verdict important too.
- US Treasury yields print three-day downtrend but the US dollar remains indecisive.
- Gold Price Forecast: XAU/USD awaits acceptance above this key hurdle, as Fed meet kicks off
Gold (XAU/USD) remains lackluster below $1,800, easing to $1,793 ahead of Tuesday’s European session.
In doing so, the yellow metal lacks momentum strength to stretch the previous day’s rebound amid the traders’ indecision before US Federal Reserve (Fed) meeting, up for Wednesday.
Also keeping the gold prices challenged is the ongoing festive season in India, the world’s biggest bullion buyer, in contrast to economic hardships in another major gold buyer namely China. Given the recent improvement in Indian fundamentals and the Reserve Bank of India’s (RBI) refrain from monetary policy tightening, New Delhi’s gold demand may recover from the previous year’s disappointment. “India's gold demand could strengthen significantly in the fourth quarter (Q4),” per the World Gold Council’s (WGC) latest report cited by Reuters.
Elsewhere, China’s Ministry of Commerce urged the authorities to have a good stock of food ahead of winter, raising fears amid the power-cut problems and Evergrande-led economic woes.
Elsewhere, the US Dollar Index (DXY) remains sidelined but the US 10-year Treasury yields drop for the third consecutive day as inflation expectations ease before the Fed. Also challenging the Fed hawks are the latest mixed US PMIs for October.
It’s worth noting that the equities remain mildly offered and support the rush to risk-safety ahead but a light calendar and the pre-Fed trading lull challenge gold buyers.
Technical analysis
Gold remains supported by a two-day-old ascending trend line and 200-EMA amid a firmer RSI line. The same hints at the quote’s further advances towards a weekly resistance line near the $1,800 threshold.
However, any further upside will have multiple hurdle around $1,810 and October’s peak near $1,813 before directing the bulls towards the key $1,834 resistance level, comprising tops marked during July and September.
On the contrary, a clear downside break of 200-EMA level surrounding $1,789 should recall the gold sellers targeting Friday’s bottom surrounding $1,772.
In a case where the gold bears keep reins past $1,772, the late October’s swing low near $1,760 should return to the charts.
Gold: Hourly chart
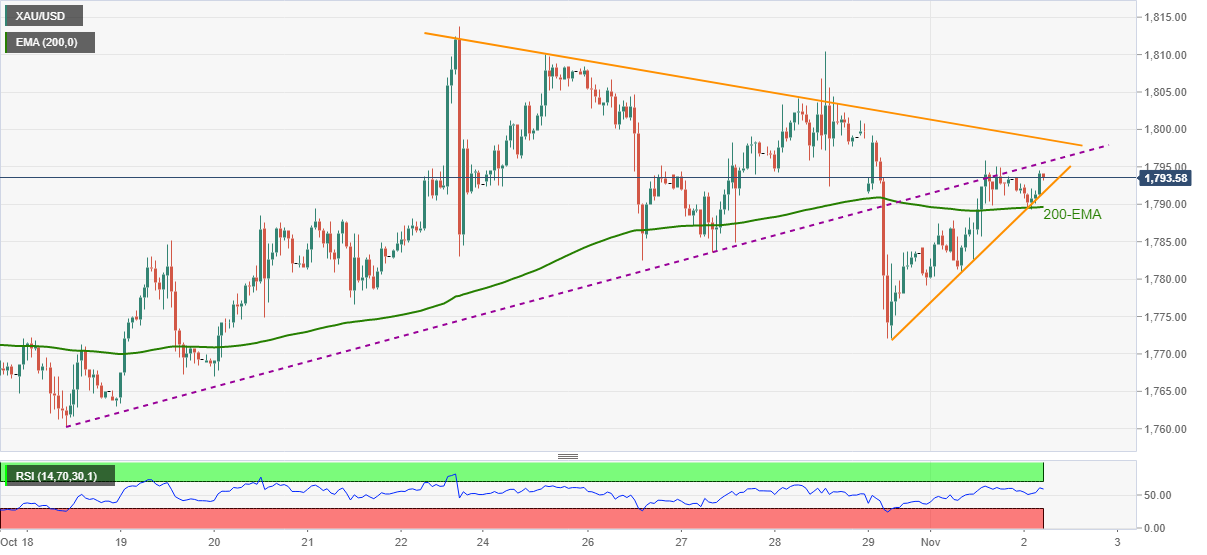
Trend: Pullback expected
-
05:23
RBA’s Lowe: Market pricing for early rate hikes extremely unlikely
More comments flowing in from the Reserve Bank of Australia (RBA) Governor Phillip Lowe, as he expresses his take on the rate hike expectations and rising price pressures.
Key quotes
Markets have over reacted to recent inflation data.
Got to be sure inflation will be sustainably in 2-3% target, market pricing of early 2022 hikes is well away from where we are now.
Decline in wages growth has been decade long, needs to change dramatically.
Inflation at the mid-point of a target would not justify higher rates.
Market reaction
AUD/USD is dropping 0.43% on the day, currently trading at 0.7491.
-
05:03
RBA’s Lowe: Effectiveness of yield target as a monetary policy tool declined
The Reserve Bank of Australia (RBA) Governor Phillip Lowe said the following in the press conference, following the central bank’s monetary policy decision announced earlier this Tuesday.
Key quotes
The yield target has been effective and has supported the recovery of the Australian economy.
But its effectiveness as a monetary policy tool declined as expectations about future interest rates shifted due to the run of data and the forecast progress towards our goals.
I want to make it clear that this decision does not reflect a view that the cash rate will be increased before 2024.
There is genuine uncertainty as to the timing of future adjustments in the cash rate.
It is still entirely possible that the cash rate will remain at its current level until 2024.
Our forward guidance is based on the state of the economy, not the calendar.
The latest data and forecasts do not warrant an increase in the cash rate in 2022.
We will be including the April 2024 bond in our regular auctions from next week.
Underlying inflation reached the midpoint of the target range for the first time in seven years does not, by itself, warrant an increase in the cash rate.
Configuration of inflation and wages growth allows the board to be patient in considering a lift in interest rates.
Board judged that it was no longer sustainable to maintain the target of 10 basis points.
Prepared to look through spikes in the inflation rate.
Market reaction
The aussie dollar is little changed on these comments, as AUD/USD keeps its range around 0.7495, down 0.43%, as of writing.
-
05:01
EUR/USD picks up bids to 1.1600 amid softer US Treasury yields
- EUR/USD extends the week’s rebound amid cautious optimism.
- Downbeat US inflation expectations, stimulus hopes favor bulls amid a quiet session.
- Second readings of the EU, German PMIs may entertain traders before Wednesday’s Fed verdict.
EUR/USD refreshes intraday top beyond 1.1600 ahead of Tuesday’s European session amid mixed concerns. Even so, the bulls hesitate to retake controls ahead of the key Federal Reserve (Fed) meeting, up for publishing on Wednesday.
With a four-day pullback from a 15-year high in the US inflation expectations, as portrayed by the 10-year breakeven inflation rate per the St. Louis Federal Reserve (FRED) data, the market’s hope of the Fed tapering and/or rate hikes take a back seat of late. However, the Fed Clevland’s version of the median PCE Inflation rate rockets higher of late, allowing the US Federal Reserve (Fed) hawks to remain hopeful.
It’s worth noting that the downbeat US PMIs jostle with China’s recent appeal to store food during winter to challenge the EUR/USD buyers, due to the US dollar’s safe-haven appeal. Though, softer Treasury yields, down 2.5 basis points (bps) to 1.549% weigh on the US Dollar Index (DXY), helping EUR/USD to extend the previous day’s rebound.
Despite firmer Treasury yields, the equity futures remain mildly offered amid cautious sentiment during the pre-Fed anxiety. Also challenging the stocks is the uncertainty over US President Joe Biden’s stimulus despite the Democratic leader’s recent optimism.
Talking about data, the US PMIs were mixed but the German Retail Sales slumped in September, helping the ECB to stand pat. Also restricting further consolidation of the easy monetary policy in the bloc is the recently higher COVID-19 infections in Germany.
Looking forward, second readings of October’s PMI for Germany and Europe may entertain EUR/USD traders. However, major attention will be given to the stimulus and inflation chatters, not forgetting the central bank headlines.
Technical analysis
Unless crossing a one-month-old ascending resistance line near 1.1695, EUR/USD bears are likely to keep the reins.
-
04:40
GBP/USD: Mildly offered near 1.3650 as Brexit optimism battles pre-Fed, BOE anxiety
- GBP/USD prints three-day downtrend near the mid-October levels.
- France halts fishing-linked sanctions on UK before Thursday’s meeting.
- BOE rate hike expectations jump to 100% amid strong inflation.
- Risk catalysts keep the driver’s seat amid a light calendar.
GBP/USD remains on the back foot around 1.3650, down 0.09% intraday heading into Tuesday’s London open. In doing so, the cable pair prints a three-day downtrend as the market prepares for the key central bank events scheduled for Wednesday and Thursday, namely the US Federal Reserve (Fed) and the Bank of England (BOE) verdicts in that order.
While the market’s anxiety ahead of the Fed and BOE helps the US dollar to remain firmer, recently positive Brexit headlines help the GBP/USD to probe bears.
Among them is the French pause to levy sanctions on the UK over the Brexit-led fishing raw. France stopped previously announced punitive measures on the British boats following the issues of nearly 50 additional licenses to French boats to fish in its waters by the government of Jersey, per The Independent. On the same line, Reuters said that France received first signals from UK authorities to speed up talks, an answer to the latest French proposals is expected by Wednesday. It’s worth noting that the UK’s Brexit Chief David Frost will head to Paris for speedy negotiations on Thursday. However, there are many challenges other than the fishing tussles, like the Northern Ireland (NI) protocol, which in turn may hinder Brexit optimism going forward.
On the other hand, CME’s BOEWatch tool shows a 100% probability of a rate hike move during the meetings in November and December. The reason could be linked to around 5.0% UK inflation, double the BOE’s target. Though a jump in the UK’s covid infections, recently to 40,077 from 38,009 reported the previous day, challenge the likely move by the “Old Lady”.
Other than the market’s anxious mood ahead of the knife-edge BOE decision, up for publishing on Thursday, mixed US PMI and China’s latest appeal to the local governments to stock food for winter weigh on the market sentiment, underpinning the US dollar’s safe-haven demand.
Moving on, the GBP/USD moves are likely to remain bearish as the greenback benefits from downbeat stock futures and risk aversion ahead of the key central bank events. Though, chatters surrounding US stimulus and Brexit headlines may entertain the pair traders.
Technical analysis
Given the GBP/USD pair’s downside break of 50-DMA, portrayed on Friday, as well as the sustained trading below 200-DMA amid bearish MACD signals, the bears are likely rushing towards a horizontal area including multiple levels marked since July 20, around 1.3575. Meanwhile, the corrective pullback may aim for a 50-DMA level of 1.3712 before the 50% Fibonacci retracement level of June-September south-run around 1.3830.
-
04:00
AUD/JPY Price Analysis: Breaks weekly support on RBA’s move, 85.10 in focus
- AUD/JPY slumps around 60 pips as RBA rejects YCC moves.
- A fortnight-old ascending triangle in focus, 86.10 holds the gate for buyers.
- Descending RSI, break of immediate support favor sellers.
AUD/JPY portrays a 60-pip fall to mid-85.00s on the Reserve Bank of Australia’s (RBA) moves during early Tuesday.
Read: RBA: Will not hike OCR until actual inflation is sustainably within the 2 to 3% target range
The pair refreshed intraday low to 85.28 on breaking the weekly support line, now resistance around 85.55, before the recent rebound to 85.45, down 0.40% intraday by the press time.
In addition to the weekly trend line break, downward sloping RSI and cautious mood in the market also weigh on the AUD/JPY prices. However, a clear break of 85.10 becomes necessary to confirm the ascending triangle bearish chart pattern.
Following that, the quote can extend the latest south-run towards an ascending support line from late September, around 83.50. During the fall, the 100-SMA level of 84.84 may act as a buffer.
Meanwhile, the cross-currency pair’s corrective pullback beyond the previous support line near 85.55 will need validation from the stated triangle’s resistance, at 86.10, to recall the AUD/JPY bulls.
To sum up, AUD/JPY sellers have knocked on the door but 85.10 serves as entry passes.
AUD/JPY: Four-hour chart

Trend: Further weakness expected
-
03:40
AUD/USD slumps 50-pips as RBA ends April 2024 bond target of 0.1%
- AUD/USD takes offers around 0.7500 following RBA’s full-stop to YCC.
- RBA matches market forecasts on rates, abandons yield curve target.
- Market sentiment dwindles amid cautious mood ahead of key central bank events, keeping USD afloat.
- Easing covid fears, softer US data and a light calendar before Fed favored buyers of late.
AUD/USD holds onto the early Asian losses, dropping over 50 pips to conquer the 0.7500 following the Reserve Bank of Australia’s (RBA) late move during Tuesday. That said, the quote prints 0.36% intraday losses while taking the offers near 0.7495, with the recently flashed intraday low of 0.7485.
The Aussie central bank matched wide market forecasts of keeping the benchmark rate unchanged at around 0.10%. However, the dumping of the Yield Curve Control (YCC) triggered the latest south-run confirming the rising wedge bearish chart pattern.
Read: Breaking: RBA leaves OCR unchanged at 0.10%, abandons yield curve target
In addition to the RBA move, cautious mood ahead of crucial central bank events and mixed economics weigh on the risk appetite, underpinning the US dollar’s safe-haven demand. The market anxiety could also be witnessed by mildly offered stock futures despite the firmer Wall Street closing and sluggish US Treasury yields.
Further, an appeal from China’s Ministry of Commerce to ensure food supplies in winter also challenges the market sentiment, dragging the AUD/USD prices. Additionally, easing prices of Australia’s main export item, iron ore also please the pair sellers. That said, Dalian iron ore slumps around 8.0% on the day, near 580 yuan per ton at the latest.
On the contrary, US Treasury Secretary Janet Yellen’s rejection of reflation fears and recently easing inflation expectations from the US, per the 10-year breakeven inflation rate per the St. Louis Federal Reserve (FRED) data, favor the AUD/USD buyers. Also on the positive side could be Australia's recently downbeat COVID-19 numbers and firmer vaccinations, not to forget easing of travel norms. Furthermore, mixed figures of the US PMI for October and Australia's latest housing and activity figures confuse the traders. However, the Fed Clevland’s version of the median PCE Inflation rate rockets higher of late, allowing the US Federal Reserve (Fed) hawks to remain hopeful and poke the Aussie bulls.
Moving on, the pre-Fed sentiment can test the AUD/USD traders but the confirmation of the bearish chart pattern keeps sellers hopeful.
Technical analysis
AUD/USD teases a bearish chart pattern confirmation, namely rising wedge, around four-month high as bulls seem to have tired of late. Also showing the bullish exhaustion are the MACD and RSI lines. Hence, a clear downside break of 0.7490 will trigger the quote’s fresh south-run targeting the theoretical level near 0.7390-80. However, the 100-SMA level of 0.7455 offers an intermediate halt. Alternatively, further recoveries of the pair may aim for the 0.7550 level before hitting the resistance line of the bearish chart pattern around 0.7560.
-
03:37
RBA: Will not hike OCR until actual inflation is sustainably within the 2 to 3% target range
Following are the key headlines from the November RBA monetary policy statement, via Reuters, as presented by Governor Phillip Lowe.
Will not increase the cash rate until actual inflation is sustainably within the 2 to 3 per cent target range
Central forecast is for GDP growth of 3 percent over 2021 and 5½ per cent and 2½ per cent over the following two years.
This will require the labour market to be tight enough to generate wages growth that is materially higher than it is currently
One important source of uncertainty continues to be the possibility of a further setback on the health front
Board is prepared to be patient, with the central forecast being for underlying inflation to be no higher than 2½ per cent at the end of 2023 and for only a gradual increase in wages growth
Central forecast is for the unemployment rate to trend lower over the next couple of years, reaching 4¼ per cent at the end of 2022 and 4 per cent at the end of 2023.
Inflation has picked up, but in underlying terms is still low, at 2.1 per cent.
While inflation has picked up, it remains low in underlying terms
Further, but only gradual, pick-up in underlying inflation is expected
Decision to discontinue the yield target reflects the improvement in the economy and the earlier-than-expected progress towards the inflation target
Central forecast is for underlying inflation of around 2¼ per cent over 2021 and 2022 and 2½ per cent over 2023.
Wage price index forecast to increase by 2½ per cent over 2022 and 3 per cent over 2023.
Bank welcomes APRA's recent decision to increase the interest rate serviceability buffer on home loans.
-
AUD/USD slumps 50-pips as RBA ends April 2024 bond target of 0.1%
-
-
03:32
Breaking: RBA leaves OCR unchanged at 0.10%, abandons yield target
The Reserve Bank of Australia (RBA) board members announced no changes to the official cash rate (OCR), leaving it at a record low of 0.10% during their November monetary policy meeting.
The board decided to discontinue the target of 10 basis points for the April 2024 Australian government bond.
The board decided to continue to purchase government securities at the rate of $4 billion a week until at least mid-February 2022.
AUD/USD reaction
The AUD/USD pair drops nearly 30-pips in a knee-jerk reaction to the RBA decision.
The spot was last seen trading at 0.7493, down 0.40% on the day.
About RBA rate decision
RBA Interest Rate Decision is announced by the Reserve Bank of Australia. If the RBA is hawkish about the inflationary outlook of the economy and rises the interest rates it is positive, or bullish, for the AUD. Likewise, if the RBA has a dovish view on the Australian economy and keeps the ongoing interest rate, or cuts the interest rate it is seen as negative, or bearish.
-
03:30
Australia RBA Interest Rate Decision meets forecasts (0.1%)
-
03:30
Australia: Announcement of the RBA decision on the discount rate, 0.1% (forecast 0.1%)
-
03:14
USD/INR Price News: Indian rupee bulls look set for further weakness below 75.00
- USD/INR grinds lower following a U-turn from two-week high.
- Sustained trading below 20-DMA, immediate resistance line joins bearish MACD signals to favor sellers.
- July’s high adds strength to 75.00-05 resistance confluence, 14-week-long horizontal area offers extra support.
USD/INR remains on a back foot around 74.85, following the week-start losses, during early Tuesday.
The Indian rupee (INR) pair jumped to the highest in two weeks before dropping back below a three-week-old resistance line and 20-DMA.
The pullback moves gain support from the bearish MACD signals to direct the sellers toward an ascending support line from early September, near 74.73.
Adding to the downside filter is a horizontal area comprising multiple tops marked since late July around 74.60-58.
Meanwhile, 20-DMA and the stated resistance line, respectively around 75.00 and 75.05, join the July month’s high to amplify the importance of the 75.00-75.05 resistance convergence.
Should the USD/INR bulls remain dominant past 75.05, the 75.30-35 area may offer an intermediate halt during the run-up to October’s peak of 75.65.
USD/INR: Daily chart
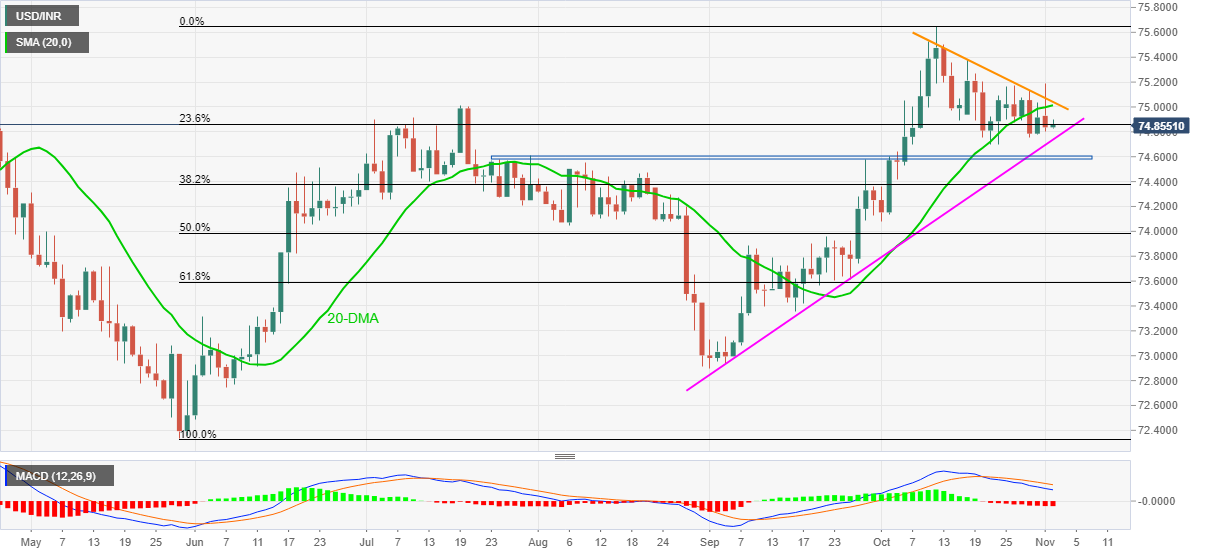
Trend: Further weakness expected
-
02:34
USD/TRY Price Analysis: Bounces-off key support near 9.50, record high back in sight
- USD/TRY attempts a bounce after Monday’s 1% sell-off.
- Erdogan-Biden talks offer a temporary reprieve to TRY bulls.
- Bullish RSI on the 4H chart re-ignites the buying momentum.
USD/TRY is picking up fresh bids on Tuesday, reversing a temporary reversal seen a day before, as the US dollar bulls are looking to regain control ahead of Wednesday’s Fed decision.
Monday’s 1% pullback in the currency pair could be attributed to a resurgent demand for the Turkish lira after the Turkish President Tayyip Erdogan and US President Joe Biden discussed a potential fighter jet deal in Rome over the weekend.
From a short-term technical perspective, USD/TRY is attempting a recovery above 9.50 levels after having confirmed a symmetrical triangle breakdown on the four-hour chart in early European hours on Monday.
The price has managed to find strong bids near 9.55, where the 50-Simple Moving Average (DMA) converges with the 21-SMA.
The next upside hurdle to the recovery momentum can be seen at Friday’s high of 9.63. Further up, the bulls will look to retest the record highs of 9.85
The Relative Strength Index (RSI) has pierced through the midline for the upside, suggesting that the renewed uptick is likely to find legs in the upcoming sessions.
USD/TRY: Four-hour chart
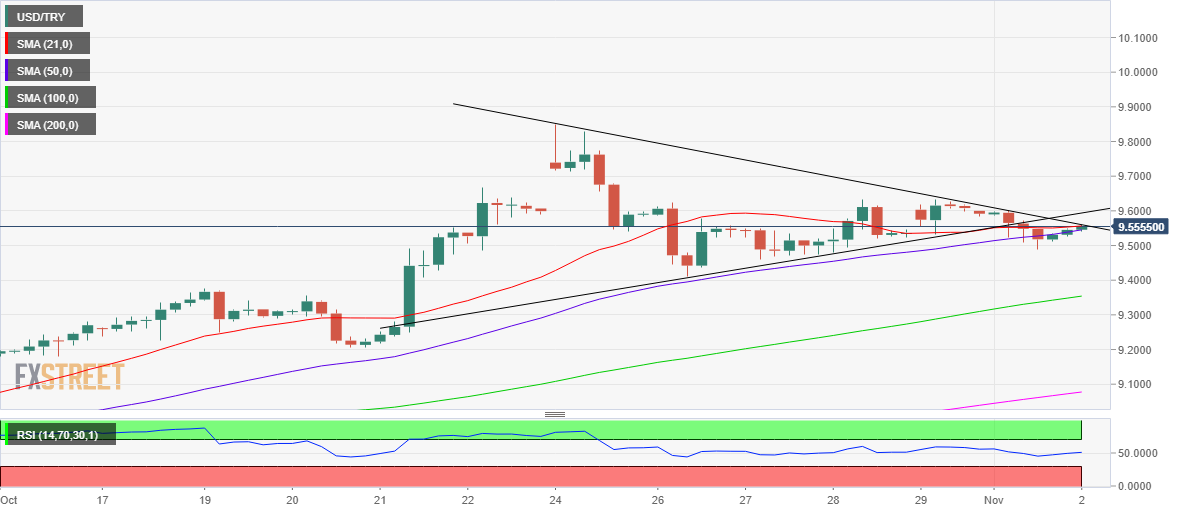
On the downside, a sustained break below the abovementioned critical support near 9.50 will trigger a fresh sell-off towards the October 26 lows of 9.41.
The upward-sloping 100-SMA at 9.35 could then come to the rescue of the bullish traders.
-
01:59
When is the RBA Interest Rate Decision and how could it affect AUD/USD?
Alike every first Tuesday of the month, the Reserve Bank of Australia (RBA) is up for conveying the latest monetary policy meeting and Interest Rate Decision around 03:30 AM GMT.
The RBA is expected to keep the benchmark interest rate unchanged around 0.10%. However, the latest jump in the Aussie inflation pushes market players to hope for the policymakers’ hawkish comments, as well as dropping the Yield Curve Control (YCC) measures, which in turn highlights today’s monetary policy meeting for the AUD/USD traders.
Following the RBA decision, Deputy Governor Guy Debelle is also up for speaking at a virtual panel discussion and will be watched for details of the policy moves, if any.
Ahead of the event TD Securities said,
We expect the RBA to announce an end to its Yield Target Framework tonight. This follows the RBA's decision to not defend the yield on the Apr'24s even after trading significantly above the 10bp target. As for QE we expect the Bank to announce QE to end in Feb'22.
On the other hand, Westpac said,
The Aussie absorbed a lot of pressure in September, as it slipped from well above 0.7400 to under 0.7200. China’s property sector was in particular focus and the US dollar was supported by an upbeat Fed and safe-haven demand. But the Aussie has rallied strongly so far in October, backed by the price squeeze on key commodity exports such as coal, metals and LNG. It is not clear how much more support A$ will garner from this source, as China's steel output finally retreats. Domestically, NSW’s Covid situation has improved dramatically in recent weeks and Australia’s unemployment rate may remain under 5.0%. But the RBA continues to insist that wages growth and inflation will remain muted, keeping the cash rate at a globally unattractive 0.1% into 2024. Near-term AUD/USD could spend some time in the 0.75-0.76 area but price action should become more two-way over Q4 and our year-end target remains 0.75. (20 October).
How could the RBA decision affect AUD/USD?
AUD/USD pokes intraday high around 0.7530 ahead of the key RBA decision during early Tuesday. The Aussie pair seems to prepare to the disappointment as firmer US Dollar Index (DXY) and mildly offered stock futures have been rejected to print the latest gains.
Although the firmer inflation and the RBA’s inaction back hawkish expectations of a YCC move, any disappointment shouldn’t be taken lightly amid a risk-off mood. However, the underlying price pressure and the recent improvement in Australia’s covid conditions, coupled with the market’s cautious mood ahead of Wednesday’s Fed verdict, can keep the AUD/USD bears challenged.
Technically, AUD/USD portrays a rising wedge bearish chart pattern near the highest levels in four months, suggesting a stronger bearish reaction should the RBA disappoints.
Key quotes
AUD/USD retreats towards 0.7500 ahead of RBA
AUD/USD Price Analysis: Rising wedge around four-month top probes bulls below 0.7550
Reserve Bank of Australia Preview: Reality check for Australian policymakers
About the RBA interest rate decision
RBA Interest Rate Decision is announced by the Reserve Bank of Australia. If the RBA is hawkish about the inflationary outlook of the economy and rises the interest rates it is positive, or bullish, for the AUD. Likewise, if the RBA has a dovish view on the Australian economy and keeps the ongoing interest rate, or cuts the interest rate it is seen as negative, or bearish.
-
01:47
Japan’s Suzuki: The yen is weakening, will continue to watch FX moves
Japan Finance Minister Shunichi Suzuki acknowledged the ongoing depreciation in the yen but refrained from commenting on the forex levels, in his appearance on Tuesday.
Key quotes
“The yen is weakening.”
“No comment on FX levels.
“Stability in currencies is important.”
“Will continue to watch FX moves.”
Market reaction
USD/JPY gyrates around 114.00, despite the rebound in the US dollar across the board, as a dour mood weighs on the spot.
-
01:42
US Dollar Index Price Analysis: DXY regains 100-SMA on morning star bullish candle
- DXY picks up bids to consolidate Monday’s losses, justifies bullish candlestick formation, MACD signals.
- 100-SMA adds to the downside filters before two-week-old horizontal support.
- Bulls eye October’s peak, monthly high can test short-term traders.
US Dollar Index (DXY) takes the bids to refresh intraday high around 94.00, up 0.09% on a day during early Tuesday. The greenback gauge reversed from a three-week top the previous day before portraying the latest bullish candlestick on the four-hour (4H) play.
In addition to the shooting star candle, bullish MACD and the pair’s ability to regain the 100-SMA status also keeps the buyers hopeful.
That said, the DXY bulls again aim for the monthly peak near 94.30 before targeting the yearly top surrounding 94.55, marked in October.
Should the US Dollar Index upside momentum remains intact past 94.55, March 2020 low near 94.70 will be in focus.
Meanwhile, DXY sellers need to refresh the weekly low, around 93.85 at the latest, to retake the controls and reject the bullish candlestick.
Following that, a horizontal area comprising multiple lows marked since late October near 93.50 will challenge the quote’s downside targeting the last month’s bottom close to 93.25.
DXY: Four-hour chart
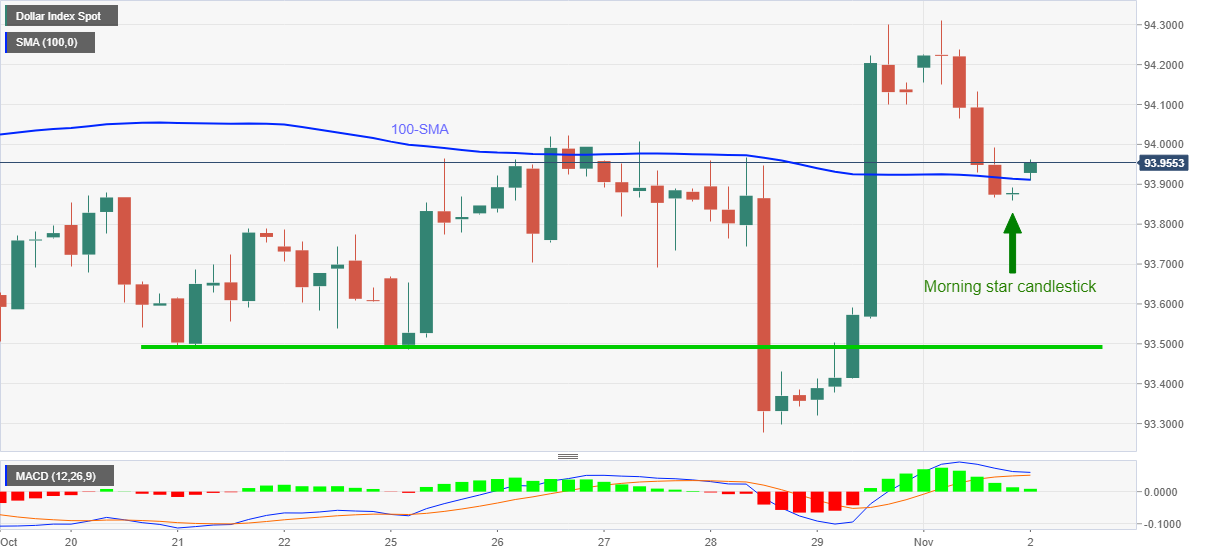
Trend: Further upside expected
-
01:34
EUR/GBP Price Analysis: Bears seeking break of 4-hour support structure
- EUR/GBP formed a weekly M-formation which has played out, but eyes now on the downside.
- The 4-hour chart offers resistance and prospects of a test of support.
EUR/GBP is on the verge of a bearish correction following a test of the neckline of the weekly M-formation. The bears will need to break 4-hour support which is illustrated in the following analysis.
EUR/GBP weekly chart
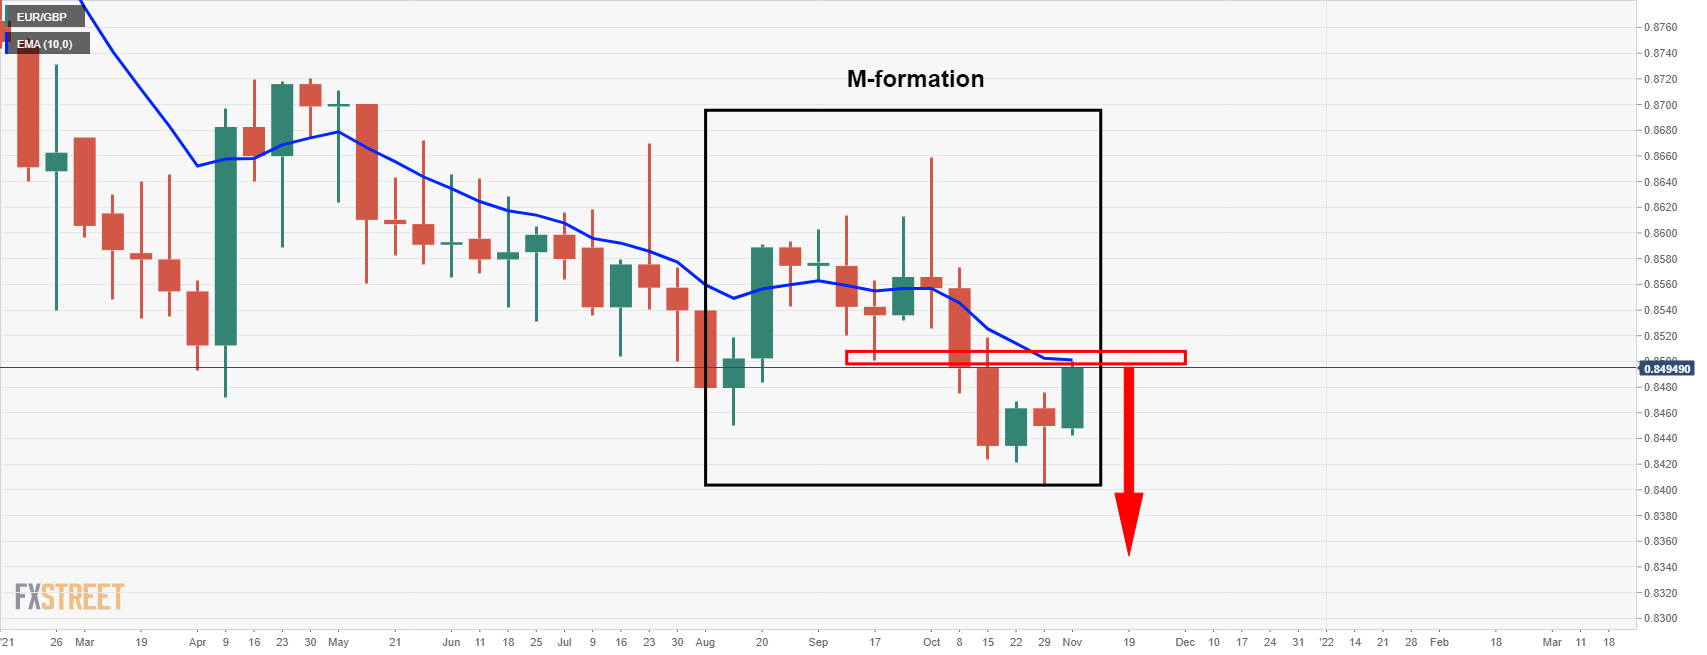
The price has moved in on the neckline of the M-formation and the 21-EMA which could act as a firm resistance and potentially lead to a downside extension in the comings weeks.
EUR/GBP 4-hour chart
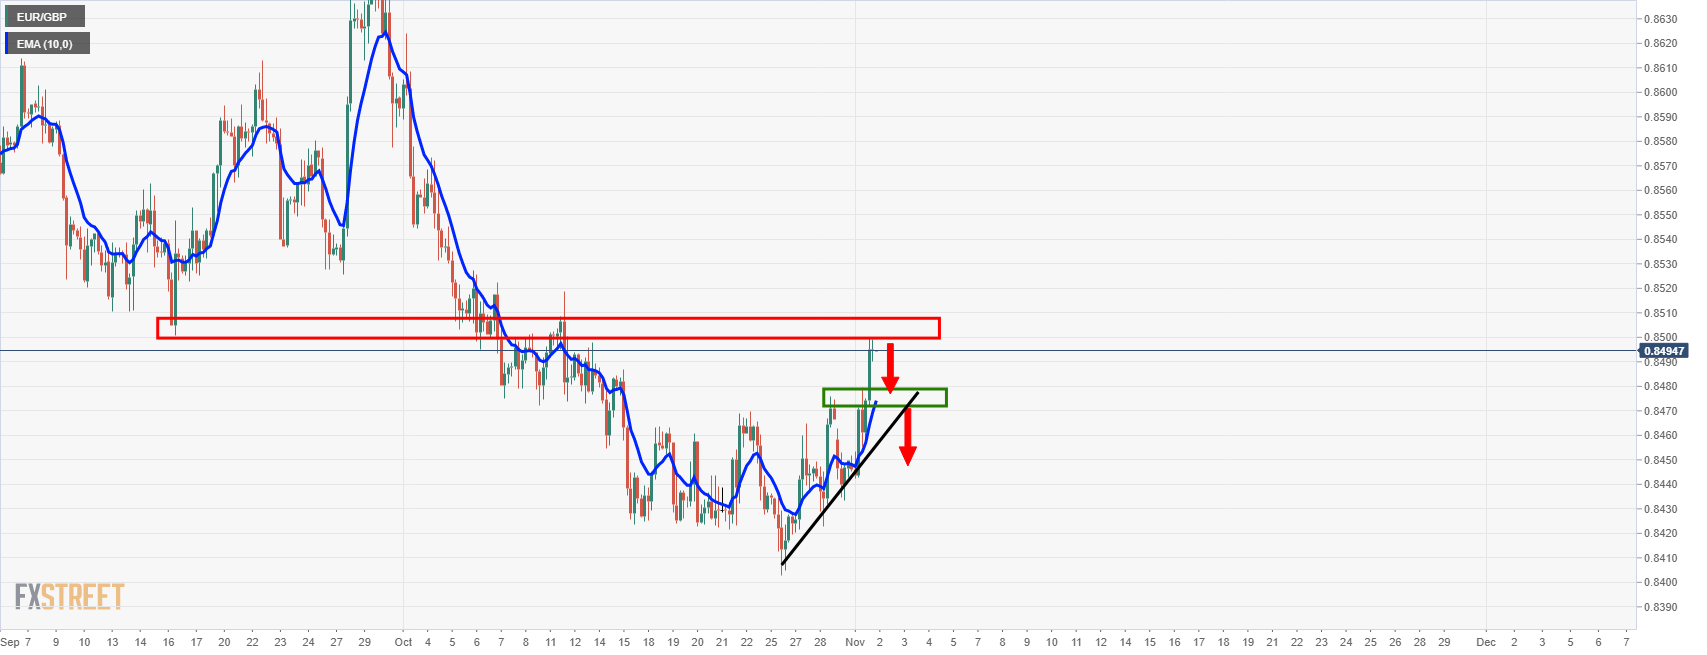
The 4-hour chart shows the price testing the resistance level and a pullback to test support could be the next stop for the price at this juncture. A break below the 21-EMA and dynamic support would likely give way to a downside extension.
-
01:24
USD/CNY fix: 6.4009 vs. the estimate of 6.4003
In recent trade today, the People’s Bank of China (PBOC) set the yuan (CNY) at 6.4009 vs. the estimate of 6.4003.
About the fix
China maintains strict control of the yuan’s rate on the mainland.
The onshore yuan (CNY) differs from the offshore one (CNH) in trading restrictions, this last one is not as tightly controlled.
Each morning, the People’s Bank of China (PBOC) sets a so-called daily midpoint fix, based on the yuan’s previous day closing level and quotations taken from the inter-bank dealer.
-
01:20
Silver Price Forecast: XAG/USD risk reversal eases after the biggest monthly jump since April
One-month risk reversal (RR), a measure of the spread between call and put prices, of silver (XAG/USD) jumped the most in six months during October, with the statistical count of +1.175 per the latest data from Reuters.
A call option gives the holder the right but not obligation to buy the underlying asset at a predetermined price on or before a specific date. A put option represents a right to sell.
That being said, the daily difference between them eased to -0.050 figure at the end of Monday’s North American trading session.
The option market moves could well be seen on the XAG/USD price chart as the quote snapped a four-month downtrend in October. The metal’s recent moves, however, remain sluggish around $24.00 amid cautious sentiment ahead of the key central bank events.
Read: Focus on various central bank meetings and withdrawal of stimulus
-
01:07
AUD/USD Price Analysis: Rising wedge around four-month top probes bulls below 0.7550
- AUD/USD picks up bids inside a bearish chart pattern heading into RBA.
- Sluggish RSI, MACD and the wedge’s position around multi-day peak keep sellers hopeful.
- 100-SMA adds to the downside filters ahead of the theoretical target.
- RBA is expected to keep monetary policy rates unchanged, forward guidance eyed.
AUD/USD recovers early Asian losses around 0.7525 ahead of the Reserve Bank of Australia (RBA) monetary policy decision on early Tuesday.
The Aussie pair’s rebound from a one-month-old support line the previous day portrayed a short-term rising wedge bearish chart pattern on the four-hour play. Also keeping the pair sellers hopeful is the stated formation’s place near the highest levels since July, as well as sluggish moves of the MACD and RSI lines.
However, the quote needs validation from the 100-SMA level of 0.7455, following a downside break of the wedge’s support near 0.7490, to confirm the bearish trajectory towards the theoretical target near 0.7390-80.
In a case where AUD/USD prices remain weak past 0.7380, the early October peaks near 0.7330 will be the key to watch.
Alternatively, further recoveries may aim for the 0.7550 level before hitting the resistance line of the bearish chart pattern around 0.7560.
If at all the AUD/USD bulls keep reins past 0.7560, the late June’s high near 0.7620 should return to the chart.
AUD/USD: Four-hour chart
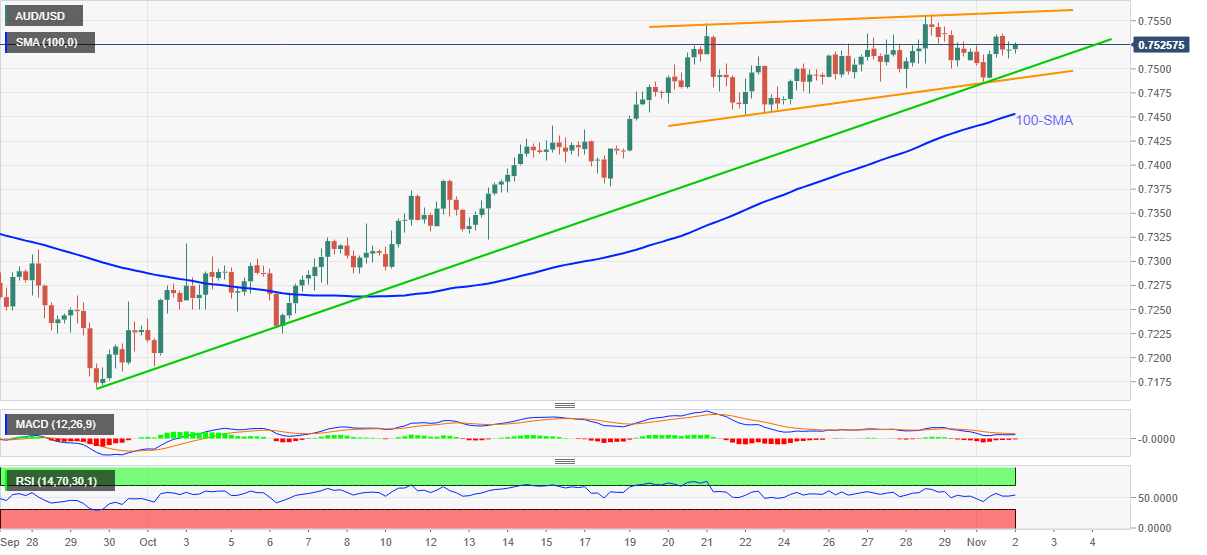
Trend: Pullback expected
-
00:45
USD/JPY struggles to defend 114.00 on anxious markets, BOJ minutes
- USD/JPY eases from fortnight top to probe a two-day uptrend.
- Risk appetite sours amid pre-central bank moves, mixed catalysts.
- BOJ minutes confirm policymakers’ readiness to take additional easing measures if covid-led hardships escalate.
- Chatters over monetary policy, inflation remain hot ahead of Wednesday’s Fed decision.
USD/JPY seesaws around 114.00, following a two-day uptrend, amid the initial Tokyo open on Tuesday. The yen pair earlier cheered the US dollar strength before the cautious mood in the market joined the Bank of Japan (BOJ) Minutes to challenge the bulls.
As per the latest BOJ Minutes, shared by Reuters, “Members shared view Japan's economy likely to improve as the impact of pandemic subsides.” “Many members said pent-up demand has yet to materialize in Japan,” adds BOJ Minute statement.
Additionally, Japan’s easing of international entry for students and business, not for tourists, helps the JPY. On the same line were concerns over Prime Minister Fumio Kishida’s spending plan after the surprise victory in the snap election.
It’s worth noting that cautious sentiment during the run-up to the key central bank meetings seems to challenge the USD/JPY of late. On Monday, US PMIs came in softer, suggesting less urgency on the part of the Fed to taper the monthly bond purchases. Additionally, citing the recently easing need for the Fed action were the reduction in the US inflation expectations and comments from US Treasury Secretary Janet Yellen stating, “I don’t think US economy is overheating.” The ex-Fed Boss Yellen hinted that the US-China Phase One trade deal and reciprocal easing of tariffs may tame inflation. The same highlights optimism towards reaching the much-awaited trade agreement among the world’s top two economies.
The mixed concerns join mildly offered S&P 500 Futures, despite upbeat Wall Street close, to probe the USD/JPY buyers. It should be observed that the US 10-year Treasury yields wobble around 1.57% whereas the US Dollar Index (DXY) reverses the previous day’s pullback from a three-week high by the press time.
Moving on, risk appetite may remain sluggish ahead of the Fed and the Bank of England (BOE) monetary policy decisions which are likely to convey the policymakers’ bullish bias. The same should recall the USD/JPY should the greenback cheer the hawkish statements.
Technical analysis
The previous support line from late September guards the short-term upside of the USD/JPY prices around 114.60. However, even short-term sellers may not take risk of entries until the quote stays above the 20-DMA level surrounding 113.55.
-
00:31
BoJ Minutes showed members said pent-up demand has yet to materialise in Japan
The Bank of Japan Minutes came out in recent trade and they showed that a few members said chip shortage, supply chain disruptions are weighing on global output, trade.
Additional key notes
Members shared view Japan's economy likely to improve as impact of pandemic subsides
Many members said pent-up demand has yet to materialise in Japan.
One member said consumption may pick up but sustainability of rebound is uncertain due to weak summer bonus payments.
One member said rises in food, energy costs could deviate from overall price index, must watch their impact on consumption.
One member said pent-up demand may not strengthen as much as expected if pandemic is not contained.
One member said supply constraints lasting longer than what many firms expected, may have bigger-than-expected negative ipmact on japan's economy.
One member said BoJ must consider phasing out pandemic-relief loan scheme if pandemic's impact on economy subsides.
One member said BoJ must respond swiftly as needed with close eye on impact china's property woes could have on global markets.
One member said BoJ must watch closely for any sign of disruption to its market operation from scheme aimed at strengthening regional banks' profitability.
-
00:30
Schedule for today, Tuesday, November 2, 2021
Time Country Event Period Previous value Forecast 01:00 (GMT) Australia MI Inflation Gauge, m/m October 0.3% 03:30 (GMT) Australia Announcement of the RBA decision on the discount rate 0.1% 0.1% 07:30 (GMT) Switzerland Retail Sales (MoM) September 1.1% 07:30 (GMT) Switzerland Retail Sales Y/Y September 0.5% 07:30 (GMT) Switzerland Consumer Price Index (MoM) October 0.0% 0.1% 07:30 (GMT) Switzerland Consumer Price Index (YoY) October 0.9% 1.1% 08:50 (GMT) France Manufacturing PMI October 55 53.5 08:55 (GMT) Germany Manufacturing PMI October 58.4 58.2 09:00 (GMT) Eurozone Manufacturing PMI October 58.6 58.5 12:30 (GMT) Canada Building Permits (MoM) September -2.1% 21:30 (GMT) Australia AiG Performance of Construction Index October 53.3 21:45 (GMT) New Zealand Employment Change, q/q Quarter III 1% 0.4% 21:45 (GMT) New Zealand Unemployment Rate Quarter III 4% 3.9% -
00:17
GBP/USD Price Analysis: Bearish impulse eyes sub-1.3600 area
- GBP/USD remains pressured for the third consecutive day.
- Sustained trading below 200-DMA, clear downside break of 50-DMA favor sellers as MACD teases bears.
- Four-month-old horizontal area in focus, early October tops probe immediate declines.
GBP/USD stays pressured around a three-week low, flashed the previous day.
That being said, the Cable pair traders near 1.3660 during Tuesday’s Asian session, extending Friday’s downside break of 50-DMA, not to forget the pair’s sustained trading below 200-DMA since September.
Given the MACD line crossing the signal line to portray a bearish impulse, coupled with the aforementioned catalysts concerning the DMAs, the GBP/USD is likely to extend the latest declines.
In doing so, a horizontal area including multiple levels marked since July 20, around 1.3575, gains market attention. However, early October tops near 1.3550-45 allow immediate rest to the GBP/USD bulls.
Should the quote remain bearish past 1.3575, it becomes vulnerable to challenge the yearly low surrounding 1.3410, marked during October.
Meanwhile, the corrective pullback may aim for a 50-DMA level of 1.3712 before the 50% Fibonacci retracement level of June-September south-run around 1.3830.
However, the 200-DMA level of 1.3851 will precede the highs marked during September, close to 1.3915, to test the GBP/USD bulls afterward.
GBP/USD: Daily chart
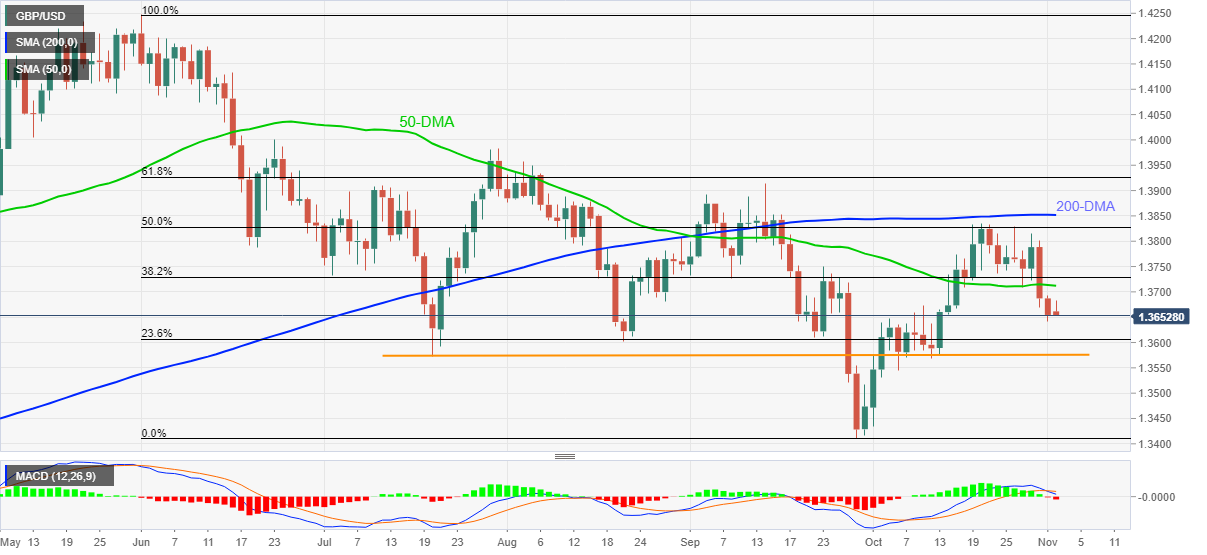
Trend: Further weakness expected
-
00:15
Currencies. Daily history for Monday, November 1, 2021
Pare Closed Change, % AUDUSD 0.75212 0.04 EURJPY 132.237 0.31 EURUSD 1.16025 0.38 GBPJPY 155.727 -0.24 GBPUSD 1.36631 -0.14 NZDUSD 0.71829 0.3 USDCAD 1.23617 -0.12 USDCHF 0.90848 -0.7 USDJPY 113.992 -0.09 -
00:09
WTI bulls stay in charge in daily resistance
- West Texas Intermediate is taking on the M-formation's neckline.
- Traders expect OPEC+ turn a blind eye to US President Joe Biden's call to add additional supply to the market.
West Texas Intermediate WTI crude oil pierced the daily resistance on Monday following a surge on the back of the market's presumption that OPEC+ will turn a blind eye to US President Joe Biden's request to add additional supply to the market when the group meets later this week. The price travelled from a low of $82.77 to a high of $84.85.
"US President Biden had called upon those countries with spare capacities to step up their oil production to a greater extent. It is doubtful whether OPEC+ will respond to this call, however. Comments made by the two leading countries in the alliance, Saudi Arabia and Russia, indicate that production in December will be increased as planned by 400,000 barrels per day," Commerzbank analysts explained.
This fits with signals from our proprietary gauge of energy supply risk, which has only managed to wobble in response to the Iran wildcard, but which has shrugged off the aggressive decline in European natural gas and Chinese coal prices, analysts at TD Securities explained. ''After all, European natural gas prices are collapsing, but balances are still expected to remain tight this winter in the absence of Nord Stream 2.''
WTI technical analysis
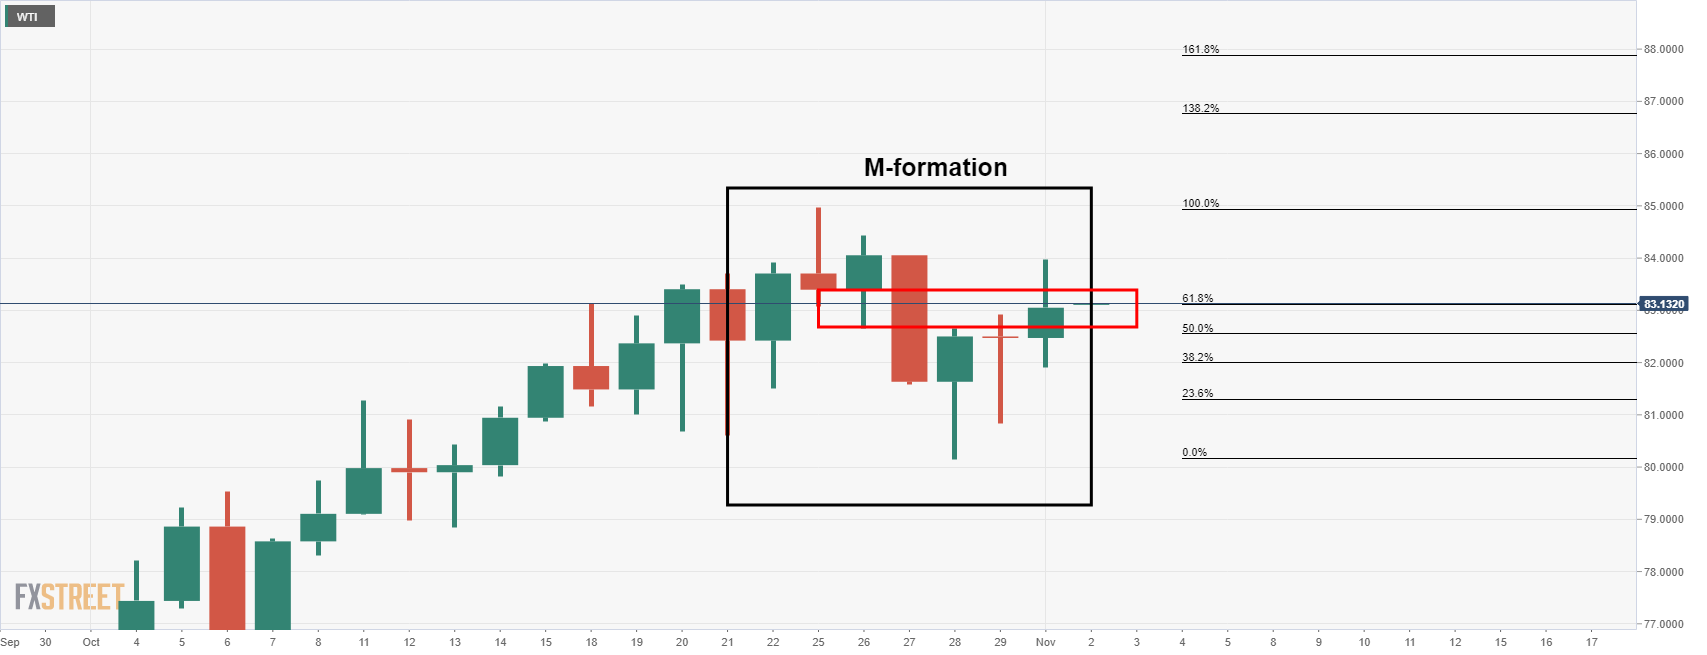
The price is testing the neckline of the M-formation that could still hold and confirming the meanwhile topping formation of the bull cycle.
-