Notícias do Mercado
-
23:59
EUR/USD soars ahead of ECB rate call
- EUR/USD scorched the charts on Wednesday, rising 1.75%.
- Markets are tilting into the bullish side ahead of the ECB’s latest rate call.
- Key US NFP figures still loom ahead, but tariff pivots are a welcome relief for markets.
EUR/USD surged on Wednesday, climbing 1.75% and knocking on the 1.0800 handle as risk sentiment rises following yet another pivot from US President Donald Trump on his own tariff strategy. President Trump is once again pumping the brakes on his own trade strategy of threatening to impose stiff import taxes on his own citizens in order to punish other countries for a litany of Donald Trump’s perceived slights.
The European Central Bank (ECB) is set to trim interest rates by another 25 bps on Thursday, taking the Main Refinancing Operations Rate down to 2.65% and dropping its Rate on Deposit Facility to 2.5%. Despite an overall tone of weak or lopsided growth permeating the EU’s economic dataset in the first quarter, rate traders have trimmed their bets of additional ECB rate cuts through the rest of the year as inflation continues to prove to be more of a problem than central planners anticipated. Rate markets now see less than 70 bps in rate cuts for the remainder of 2025.
The US ADP Employment Change for February showed only 77K new jobs, significantly below the forecast of 140K and March’s 186K. Nonetheless, the ADP results have consistently failed to correlate with Nonfarm Payrolls (NFP) since a reporting change in 2022, indicating that the weak performance holds little significance.
Read more:
US White House Press Secretary Leavitt: Trump will give auto industry an extension on tariffs
US President Donald Trump mulls exempting certain agricultural products from Canada, Mexico tariffsThis week, the Trump administration announced a one-month delay on tariffs for the automotive sector, which heavily relies on foreign trade. This exemption was retroactively declared as Trump’s team aims to impose tariffs on trading partners without negatively impacting the US economy.
This Friday’s US Nonfarm Payrolls (NFP) report is the key focus for traders this week. US net job additions are projected to rebound slightly in February to 160K, up from January’s rather unremarkable 143K figure.
EUR/USD price forecast
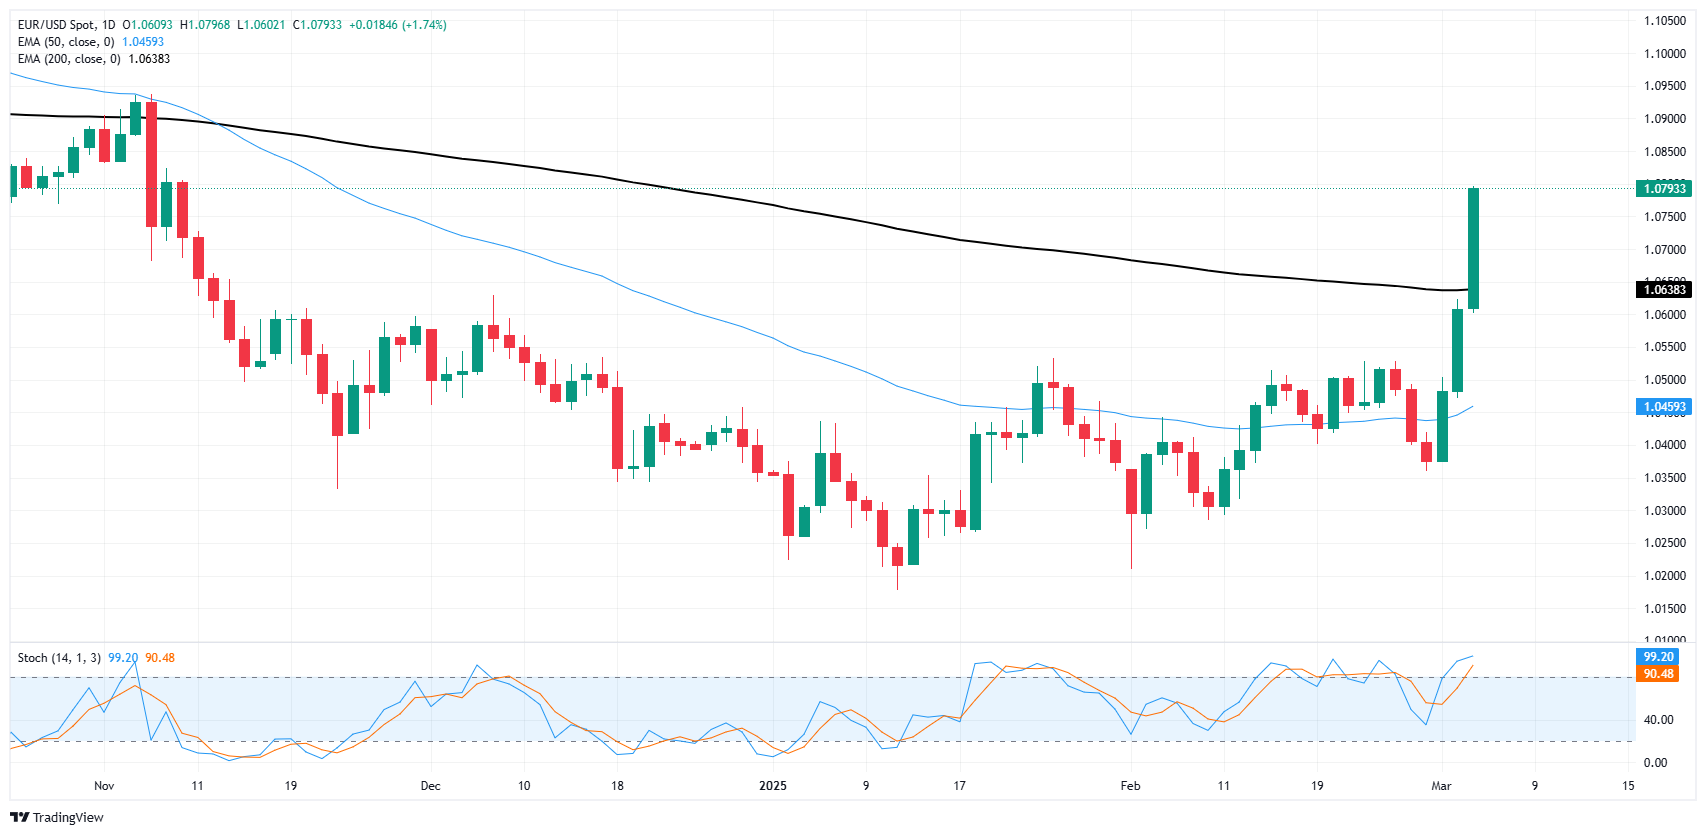
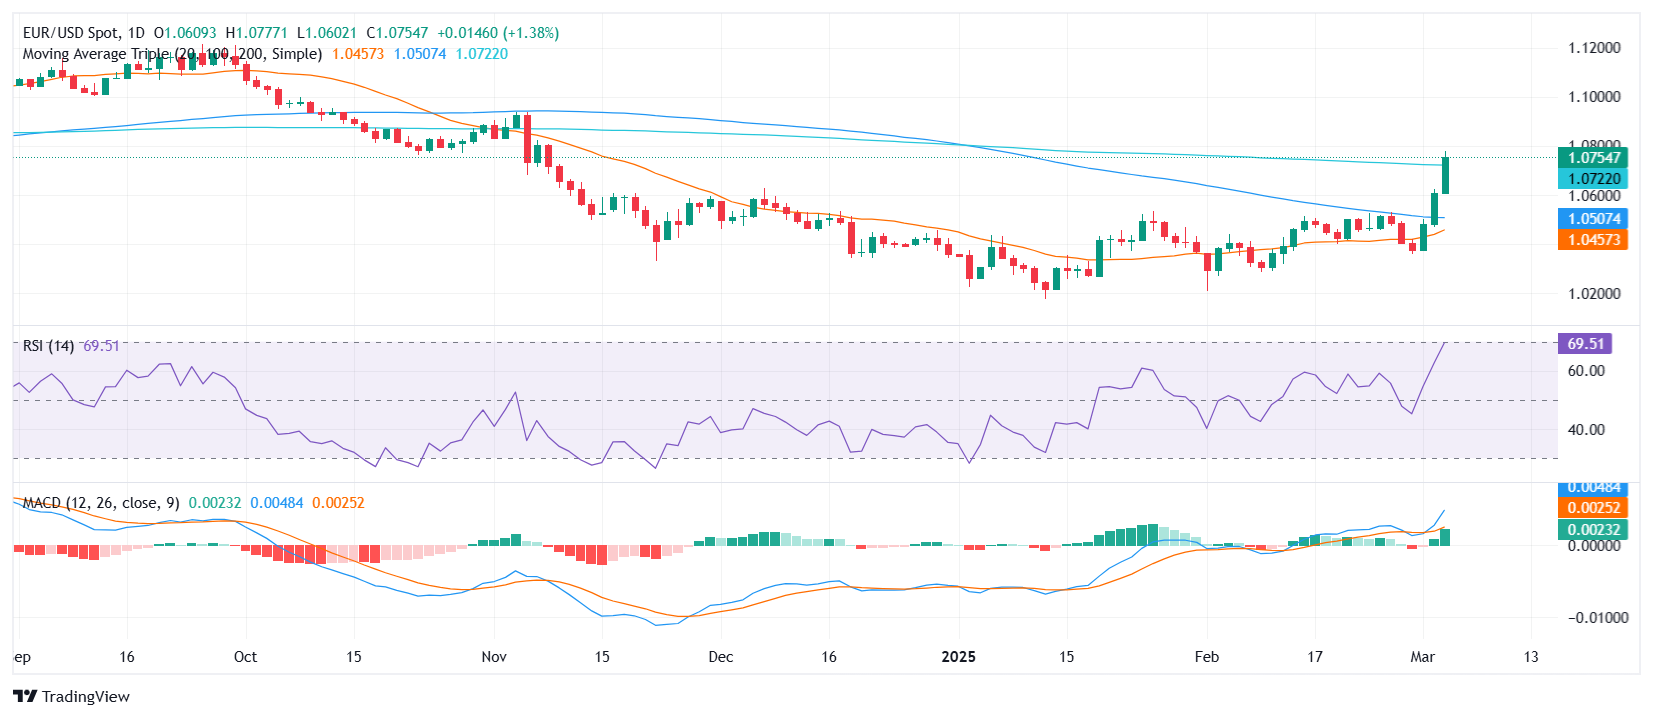
EUR/USD’s Wednesday rally saw Fiber put in its single best trading day in years, rising 185 pips in a single session and rising into touch range of the 1.0800 handle, a price level the pair hasn’t seen since early November 2024. The pair barely noticed the 200-day Exponential Moving Average (EMA) at 1.0640, with EUR/USD crashing through the key moving average on an intraday basis.
EUR/USD has risen 4% in three days, pushing into 17-week highs as price action goes one-sided this week. However, bulls could be poised to get caught with their hands in the cookie jar: technical oscillators remain in overbought territory, and a downside snap could drag bids back to the 200-day EMA before a new bullish trend is able to kickoff in earnest.
EUR/USD daily chart
Euro FAQs
The Euro is the currency for the 19 European Union countries that belong to the Eurozone. It is the second most heavily traded currency in the world behind the US Dollar. In 2022, it accounted for 31% of all foreign exchange transactions, with an average daily turnover of over $2.2 trillion a day. EUR/USD is the most heavily traded currency pair in the world, accounting for an estimated 30% off all transactions, followed by EUR/JPY (4%), EUR/GBP (3%) and EUR/AUD (2%).
The European Central Bank (ECB) in Frankfurt, Germany, is the reserve bank for the Eurozone. The ECB sets interest rates and manages monetary policy. The ECB’s primary mandate is to maintain price stability, which means either controlling inflation or stimulating growth. Its primary tool is the raising or lowering of interest rates. Relatively high interest rates – or the expectation of higher rates – will usually benefit the Euro and vice versa. The ECB Governing Council makes monetary policy decisions at meetings held eight times a year. Decisions are made by heads of the Eurozone national banks and six permanent members, including the President of the ECB, Christine Lagarde.
Eurozone inflation data, measured by the Harmonized Index of Consumer Prices (HICP), is an important econometric for the Euro. If inflation rises more than expected, especially if above the ECB’s 2% target, it obliges the ECB to raise interest rates to bring it back under control. Relatively high interest rates compared to its counterparts will usually benefit the Euro, as it makes the region more attractive as a place for global investors to park their money.
Data releases gauge the health of the economy and can impact on the Euro. Indicators such as GDP, Manufacturing and Services PMIs, employment, and consumer sentiment surveys can all influence the direction of the single currency. A strong economy is good for the Euro. Not only does it attract more foreign investment but it may encourage the ECB to put up interest rates, which will directly strengthen the Euro. Otherwise, if economic data is weak, the Euro is likely to fall. Economic data for the four largest economies in the euro area (Germany, France, Italy and Spain) are especially significant, as they account for 75% of the Eurozone’s economy.
Another significant data release for the Euro is the Trade Balance. This indicator measures the difference between what a country earns from its exports and what it spends on imports over a given period. If a country produces highly sought after exports then its currency will gain in value purely from the extra demand created from foreign buyers seeking to purchase these goods. Therefore, a positive net Trade Balance strengthens a currency and vice versa for a negative balance.
-
23:53
China warns the US it is ready for 'any type of war'
A spokesperson for the Chinese foreign ministry said late Wednesday that China is ready to fight "any type" of war after hitting back against President Donald Trump's mounting trade tariffs, per BBC.
Key quotes
If the U.S. truly wants to solve the fentanyl issue, then the right thing to do is to consult with China on the basis of equality, mutual respect and mutual benefit to address each other's concerns.
If the U.S. has other agenda in mind and if war is what the U.S. wants, be it a tariff war, a trade war or any other type of war, we're ready to fight till the end.Market reaction
At the time of writing, the AUD/USD pair is trading 0.03% lower on the day to trade at 0.6338.
US-China Trade War FAQs
Generally speaking, a trade war is an economic conflict between two or more countries due to extreme protectionism on one end. It implies the creation of trade barriers, such as tariffs, which result in counter-barriers, escalating import costs, and hence the cost of living.
An economic conflict between the United States (US) and China began early in 2018, when President Donald Trump set trade barriers on China, claiming unfair commercial practices and intellectual property theft from the Asian giant. China took retaliatory action, imposing tariffs on multiple US goods, such as automobiles and soybeans. Tensions escalated until the two countries signed the US-China Phase One trade deal in January 2020. The agreement required structural reforms and other changes to China’s economic and trade regime and pretended to restore stability and trust between the two nations. However, the Coronavirus pandemic took the focus out of the conflict. Yet, it is worth mentioning that President Joe Biden, who took office after Trump, kept tariffs in place and even added some additional levies.
The return of Donald Trump to the White House as the 47th US President has sparked a fresh wave of tensions between the two countries. During the 2024 election campaign, Trump pledged to impose 60% tariffs on China once he returned to office, which he did on January 20, 2025. With Trump back, the US-China trade war is meant to resume where it was left, with tit-for-tat policies affecting the global economic landscape amid disruptions in global supply chains, resulting in a reduction in spending, particularly investment, and directly feeding into the Consumer Price Index inflation.
-
23:50
Japan Foreign Investment in Japan Stocks climbed from previous ¥-1038B to ¥-708.3B in February 28
-
23:32
GBP/USD continues to rally, searching for 1.2900
- GBP/USD rose another 0.85% on Wednesday as the Pound rally continues.
- Greenback flows are softening as markets bet on tariff pivots.
- Cable’s three-day rally has surged around 2.6%.
GBP/USD hit the gas pedal and pumped out another strong session on Wednesday, lurching higher by another 0.85% and notching in a third straight session of firmly bullish gains. Pound markets are firmly recovering after weeks of uneasy risk appetite, pushing GBP/USD to 16-week highs.
Despite warnings that the UK economy is overall weakening, Cable markets rallied following Wednesday’s Monetary Policy Hearings from the Bank of England (BoE). According to BoE Governor Andrew Bailey, A modest uptick in inflation is expected despite weaker growth figures, causing markets to readjust their rate-cut expectations for the rest of 2025. Rate markets now see less than 50 bps of total interest rate trims for the remainder of the year.
ADP Employment Change for February showed only 77K new jobs, well below the forecast of 140K and March’s 186K. Despite this, the ADP results have consistently failed to correlate with Nonfarm Payrolls (NFP) since a reporting change in 2022, meaning the poor performance holds little significance.
Read more:
US White House Press Secretary Leavitt: Trump will give auto industry an extension on tariffs
US President Donald Trump mulls exempting certain agricultural products from Canada, Mexico tariffsThis week, the Trump administration announced a one-month delay on tariffs for the automotive sector, which relies heavily on foreign trade. This exemption was retroactively declared as Trump’s team seeks to impose tariffs on trading partners without harming the US economy.
There is little of note on the UK side of the economic data docket this week, leaving this Friday’s US Nonfarm Payrolls (NFP) as the key print for traders to worry about. US net jobs additions are expected to rebound slightly in February to 160K from January’s overwhelmingly unremarkable 143K print.
GBP/USD price forecast
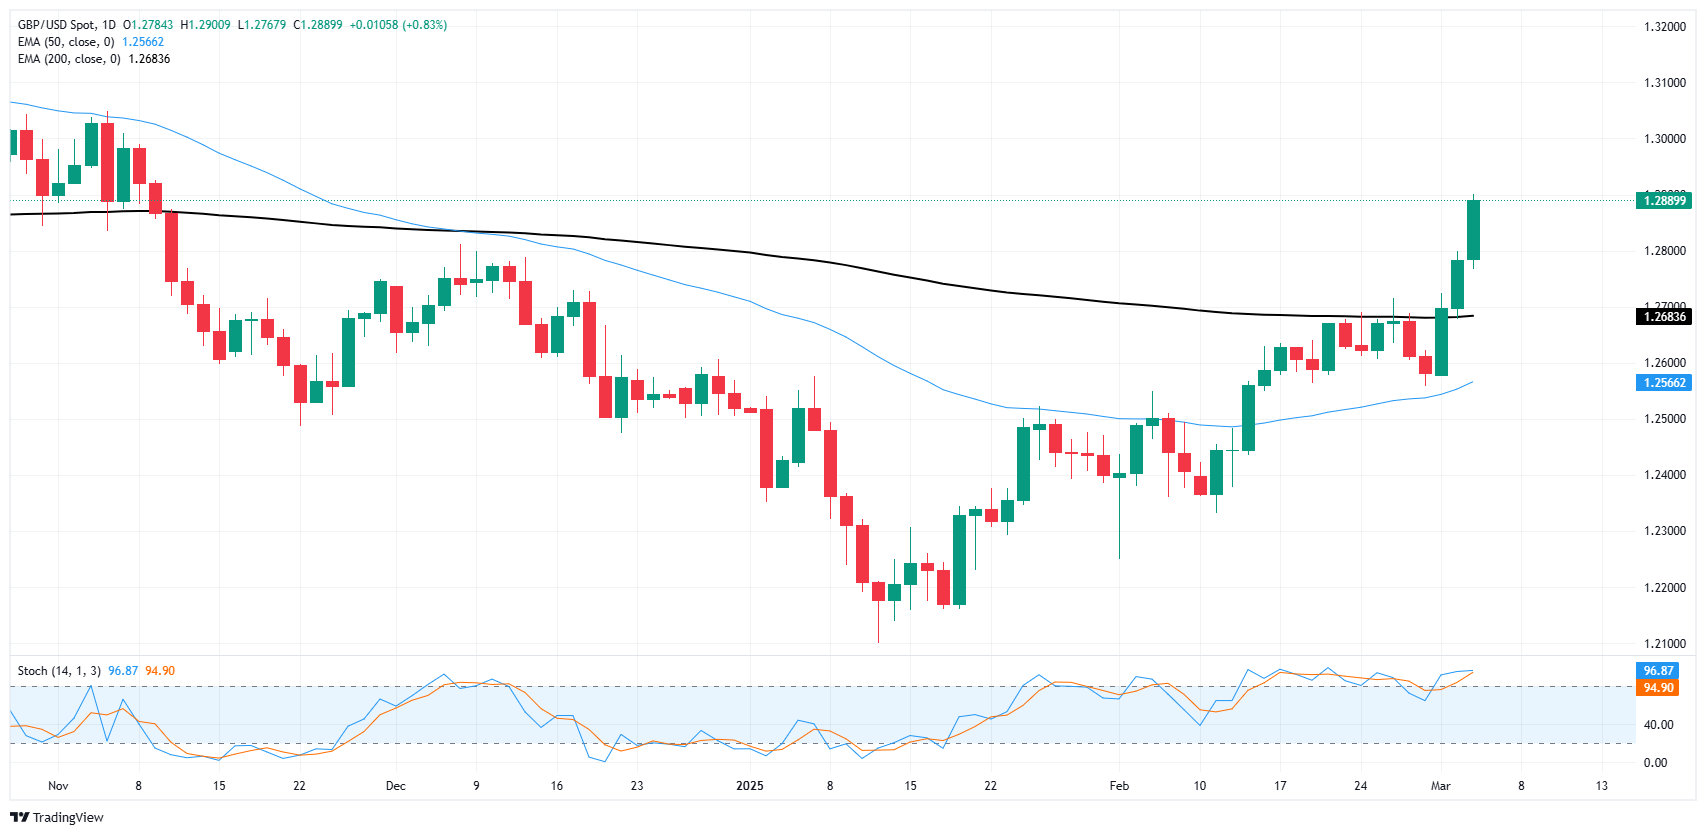
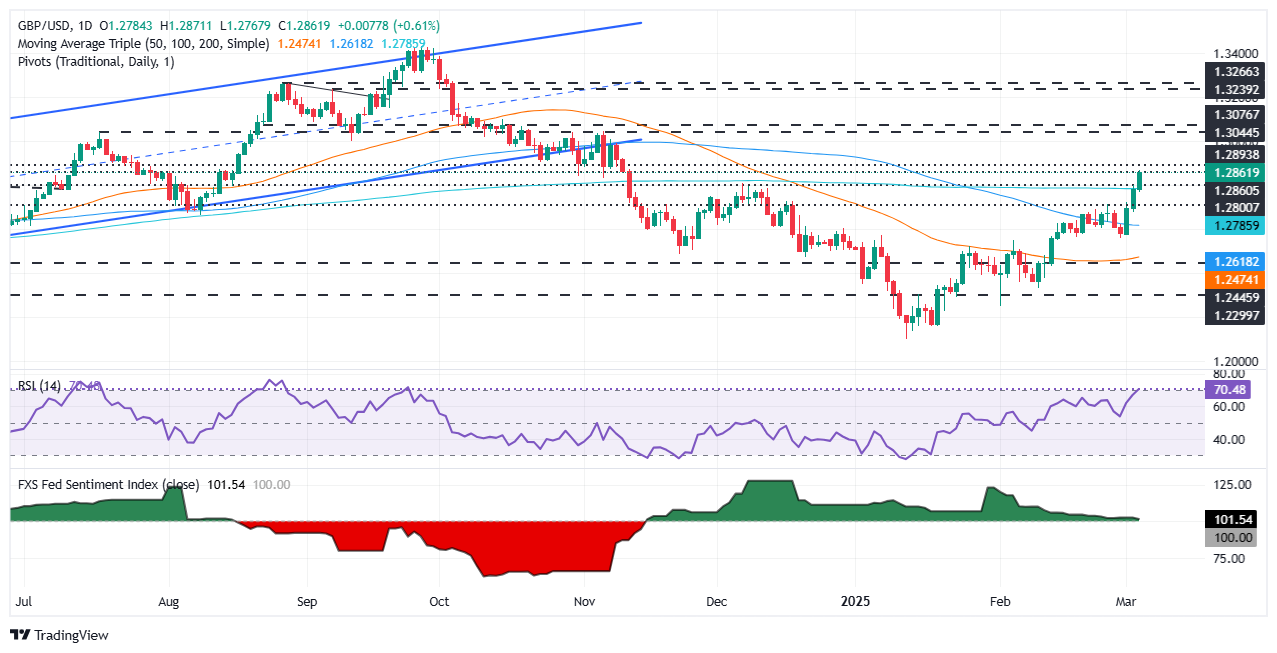
GBP/USD’s 100+ pip gain on Wednesday has pushed price action well above the 200-day Exponential Moving Average (EMA) near 1.2685. The pair could be poised for a new medium-term bull run, but a brief exhaustion play could be on the cards as technical oscillators continue to signal overbought conditions.
GBP/USD has gained 6.62% bottom-to-top since mid-January’s swing low into the 1.2100 handle. However, nearly a quarter of those gains have come in the last three days, with Cable rising over 323 pips since the start of the week, implying a general rise in volatility may lead to disappointing long-term momentum.
GBP/USD daily chart
Pound Sterling FAQs
The Pound Sterling (GBP) is the oldest currency in the world (886 AD) and the official currency of the United Kingdom. It is the fourth most traded unit for foreign exchange (FX) in the world, accounting for 12% of all transactions, averaging $630 billion a day, according to 2022 data. Its key trading pairs are GBP/USD, also known as ‘Cable’, which accounts for 11% of FX, GBP/JPY, or the ‘Dragon’ as it is known by traders (3%), and EUR/GBP (2%). The Pound Sterling is issued by the Bank of England (BoE).
The single most important factor influencing the value of the Pound Sterling is monetary policy decided by the Bank of England. The BoE bases its decisions on whether it has achieved its primary goal of “price stability” – a steady inflation rate of around 2%. Its primary tool for achieving this is the adjustment of interest rates. When inflation is too high, the BoE will try to rein it in by raising interest rates, making it more expensive for people and businesses to access credit. This is generally positive for GBP, as higher interest rates make the UK a more attractive place for global investors to park their money. When inflation falls too low it is a sign economic growth is slowing. In this scenario, the BoE will consider lowering interest rates to cheapen credit so businesses will borrow more to invest in growth-generating projects.
Data releases gauge the health of the economy and can impact the value of the Pound Sterling. Indicators such as GDP, Manufacturing and Services PMIs, and employment can all influence the direction of the GBP. A strong economy is good for Sterling. Not only does it attract more foreign investment but it may encourage the BoE to put up interest rates, which will directly strengthen GBP. Otherwise, if economic data is weak, the Pound Sterling is likely to fall.
Another significant data release for the Pound Sterling is the Trade Balance. This indicator measures the difference between what a country earns from its exports and what it spends on imports over a given period. If a country produces highly sought-after exports, its currency will benefit purely from the extra demand created from foreign buyers seeking to purchase these goods. Therefore, a positive net Trade Balance strengthens a currency and vice versa for a negative balance.
-
23:24
US President Donald Trump mulls exempting certain agricultural products from Canada, Mexico tariffs
US President Donald Trump is considering exempting certain agricultural products from tariffs imposed on Canada and Mexico, a Bloomberg reporter said on X late Wednesday.
Market reaction
At the time of writing, the USD/CAD is trading 0.05% lower on the day to trade at 1.4335.
Tariffs FAQs
Tariffs are customs duties levied on certain merchandise imports or a category of products. Tariffs are designed to help local producers and manufacturers be more competitive in the market by providing a price advantage over similar goods that can be imported. Tariffs are widely used as tools of protectionism, along with trade barriers and import quotas.
Although tariffs and taxes both generate government revenue to fund public goods and services, they have several distinctions. Tariffs are prepaid at the port of entry, while taxes are paid at the time of purchase. Taxes are imposed on individual taxpayers and businesses, while tariffs are paid by importers.
There are two schools of thought among economists regarding the usage of tariffs. While some argue that tariffs are necessary to protect domestic industries and address trade imbalances, others see them as a harmful tool that could potentially drive prices higher over the long term and lead to a damaging trade war by encouraging tit-for-tat tariffs.
During the run-up to the presidential election in November 2024, Donald Trump made it clear that he intends to use tariffs to support the US economy and American producers. In 2024, Mexico, China and Canada accounted for 42% of total US imports. In this period, Mexico stood out as the top exporter with $466.6 billion, according to the US Census Bureau. Hence, Trump wants to focus on these three nations when imposing tariffs. He also plans to use the revenue generated through tariffs to lower personal income taxes.
-
23:05
USD/CAD weakens below 1.4350 as Trump delays Canada tariffs on autos
- USD/CAD trades in negative territory near 1.4335 in Wednesday’s late American session.
- The White House said Trump will delay Canada, Mexico tariffs on autos for one month.
- Private employers added just 77,000 jobs in February, weaker than expected, ADP noted.
The USD/CAD pair extends its decline to around 1.4335 during the late American session on Wednesday. The Canadian Dollar (CAD) strengthens against the US Dollar (USD) as investors weigh the prospects of Canada's receiving some relief from US tariffs. Later on Thursday, the US Initial Jobless Claims and Canadian Ivey Purchasing Managers Index will be released.
The White House said on Wednesday that US President Donald Trump is exempting automakers from newly imposed tariffs on Mexico and Canada for one month following the implementation of Donald Trump’s bespoke tariff strategy that imposed a 25% tariff on all goods imported from Canada and Mexico. The Loonie edges higher following these developments and creates a headwind for USD/CAD.
Furthermore, concerns over the US economy weigh on the Greenback. Private sector employment in the US grew by 77K in February, compared to the previous reading of 186K (revised from 183K), according to Automatic Data Processing (ADP) on Wednesday. This figure came in weaker than initial estimates of 140K.
On the other hand, the ongoing decline in crude oil prices on reports that OPEC+ will proceed with a planned oil output increase in April might undermine the commodity-link CAD and cap the downside for the pair. It’s worth noting that Canada is the largest oil exporter to the United States (US), and lower crude oil prices tend to have a negative impact on the CAD value.Canadian Dollar FAQs
The key factors driving the Canadian Dollar (CAD) are the level of interest rates set by the Bank of Canada (BoC), the price of Oil, Canada’s largest export, the health of its economy, inflation and the Trade Balance, which is the difference between the value of Canada’s exports versus its imports. Other factors include market sentiment – whether investors are taking on more risky assets (risk-on) or seeking safe-havens (risk-off) – with risk-on being CAD-positive. As its largest trading partner, the health of the US economy is also a key factor influencing the Canadian Dollar.
The Bank of Canada (BoC) has a significant influence on the Canadian Dollar by setting the level of interest rates that banks can lend to one another. This influences the level of interest rates for everyone. The main goal of the BoC is to maintain inflation at 1-3% by adjusting interest rates up or down. Relatively higher interest rates tend to be positive for the CAD. The Bank of Canada can also use quantitative easing and tightening to influence credit conditions, with the former CAD-negative and the latter CAD-positive.
The price of Oil is a key factor impacting the value of the Canadian Dollar. Petroleum is Canada’s biggest export, so Oil price tends to have an immediate impact on the CAD value. Generally, if Oil price rises CAD also goes up, as aggregate demand for the currency increases. The opposite is the case if the price of Oil falls. Higher Oil prices also tend to result in a greater likelihood of a positive Trade Balance, which is also supportive of the CAD.
While inflation had always traditionally been thought of as a negative factor for a currency since it lowers the value of money, the opposite has actually been the case in modern times with the relaxation of cross-border capital controls. Higher inflation tends to lead central banks to put up interest rates which attracts more capital inflows from global investors seeking a lucrative place to keep their money. This increases demand for the local currency, which in Canada’s case is the Canadian Dollar.
Macroeconomic data releases gauge the health of the economy and can have an impact on the Canadian Dollar. Indicators such as GDP, Manufacturing and Services PMIs, employment, and consumer sentiment surveys can all influence the direction of the CAD. A strong economy is good for the Canadian Dollar. Not only does it attract more foreign investment but it may encourage the Bank of Canada to put up interest rates, leading to a stronger currency. If economic data is weak, however, the CAD is likely to fall.
-
23:00
South Korea Consumer Price Index Growth (YoY) above forecasts (1.95%) in February: Actual (2%)
-
23:00
South Korea Consumer Price Index Growth (MoM) above forecasts (0.2%) in February: Actual (0.3%)
-
22:52
Silver Price Forecast: XAG/USD extends rally closes to $33.00
- Silver surges past $32.00, eyeing key resistance at $33.00 and $33.20.
- RSI signals bullish strength, with price action forming higher highs and lows.
- Downside risks emerge if XAG/USD drops below $32.00, with support at $31.50 and 100-day SMA at $31.21.
Silver's price rallies continued for the third straight day since bottoming last Friday near $31.81. It gained over 2.14% late during the North American session and trades at $32.63. Broad US Dollar weakness despite falling US Treasury bond yields.
XAG/USD Price Forecast: Technical outlook
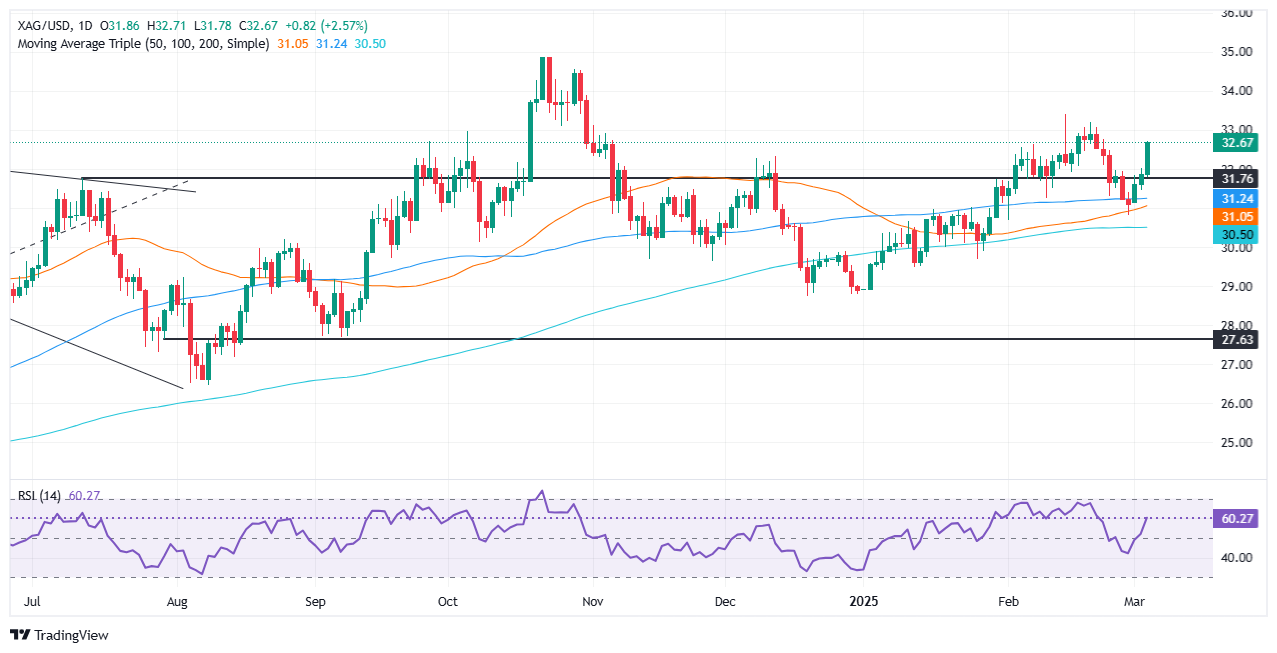
The grey metal cleared the $32.00 figure and skyrocketed towards $33.00, finishing Wednesday’s session near $32.83. Momentum is skewed to the upside, with price action registering higher highs and higher lows, while the Relative Strength Index (RSI) aims higher, towards refreshing previous peaks.
Therefore, XAG/USD's first resistance would be $33.00. On further strength, key resistance levels would be exposed, like the February 20 high at $33.20m, followed by the February 14 $33.39 cycle highs.
Conversely, if XAG/USD falls beneath $32.00, the next support would be the $31.50 area before sellers could challenge the 100-day SMA at $31.21. On further weakness, the next support would be $31.00, followed by the 200-day SMA at $30.48.
XAG/USD Price Chart – Daily
Silver FAQs
Silver is a precious metal highly traded among investors. It has been historically used as a store of value and a medium of exchange. Although less popular than Gold, traders may turn to Silver to diversify their investment portfolio, for its intrinsic value or as a potential hedge during high-inflation periods. Investors can buy physical Silver, in coins or in bars, or trade it through vehicles such as Exchange Traded Funds, which track its price on international markets.
Silver prices can move due to a wide range of factors. Geopolitical instability or fears of a deep recession can make Silver price escalate due to its safe-haven status, although to a lesser extent than Gold's. As a yieldless asset, Silver tends to rise with lower interest rates. Its moves also depend on how the US Dollar (USD) behaves as the asset is priced in dollars (XAG/USD). A strong Dollar tends to keep the price of Silver at bay, whereas a weaker Dollar is likely to propel prices up. Other factors such as investment demand, mining supply – Silver is much more abundant than Gold – and recycling rates can also affect prices.
Silver is widely used in industry, particularly in sectors such as electronics or solar energy, as it has one of the highest electric conductivity of all metals – more than Copper and Gold. A surge in demand can increase prices, while a decline tends to lower them. Dynamics in the US, Chinese and Indian economies can also contribute to price swings: for the US and particularly China, their big industrial sectors use Silver in various processes; in India, consumers’ demand for the precious metal for jewellery also plays a key role in setting prices.
Silver prices tend to follow Gold's moves. When Gold prices rise, Silver typically follows suit, as their status as safe-haven assets is similar. The Gold/Silver ratio, which shows the number of ounces of Silver needed to equal the value of one ounce of Gold, may help to determine the relative valuation between both metals. Some investors may consider a high ratio as an indicator that Silver is undervalued, or Gold is overvalued. On the contrary, a low ratio might suggest that Gold is undervalued relative to Silver.
-
22:39
Canada's Foreign Minister Joly: Potentially use oil and gas exports as a lever if US tariffs continue
Canada’s Foreign Minister Melanie Joly said late Wednesday that the country could potentially use oil and gas exports as a lever if US tariffs continue, per Reuters.
Key quotes
Canada may consider using its oil and gas exports as leverage if US tariffs on Canadian imports increase.
While Canada has pledged to impose tariffs on C$155 billion worth of US imports, it has not yet suggested cutting commodity exports.
Canada currently exports around 4 million barrels of oil per day to the US. (representing about 90% of its total crude exports).Market reaction
At the time of writing, the USD/CAD is trading 0.04% lower on the day to trade at 1.4335.
Canadian Dollar FAQs
The key factors driving the Canadian Dollar (CAD) are the level of interest rates set by the Bank of Canada (BoC), the price of Oil, Canada’s largest export, the health of its economy, inflation and the Trade Balance, which is the difference between the value of Canada’s exports versus its imports. Other factors include market sentiment – whether investors are taking on more risky assets (risk-on) or seeking safe-havens (risk-off) – with risk-on being CAD-positive. As its largest trading partner, the health of the US economy is also a key factor influencing the Canadian Dollar.
The Bank of Canada (BoC) has a significant influence on the Canadian Dollar by setting the level of interest rates that banks can lend to one another. This influences the level of interest rates for everyone. The main goal of the BoC is to maintain inflation at 1-3% by adjusting interest rates up or down. Relatively higher interest rates tend to be positive for the CAD. The Bank of Canada can also use quantitative easing and tightening to influence credit conditions, with the former CAD-negative and the latter CAD-positive.
The price of Oil is a key factor impacting the value of the Canadian Dollar. Petroleum is Canada’s biggest export, so Oil price tends to have an immediate impact on the CAD value. Generally, if Oil price rises CAD also goes up, as aggregate demand for the currency increases. The opposite is the case if the price of Oil falls. Higher Oil prices also tend to result in a greater likelihood of a positive Trade Balance, which is also supportive of the CAD.
While inflation had always traditionally been thought of as a negative factor for a currency since it lowers the value of money, the opposite has actually been the case in modern times with the relaxation of cross-border capital controls. Higher inflation tends to lead central banks to put up interest rates which attracts more capital inflows from global investors seeking a lucrative place to keep their money. This increases demand for the local currency, which in Canada’s case is the Canadian Dollar.
Macroeconomic data releases gauge the health of the economy and can have an impact on the Canadian Dollar. Indicators such as GDP, Manufacturing and Services PMIs, employment, and consumer sentiment surveys can all influence the direction of the CAD. A strong economy is good for the Canadian Dollar. Not only does it attract more foreign investment but it may encourage the Bank of Canada to put up interest rates, leading to a stronger currency. If economic data is weak, however, the CAD is likely to fall.
-
21:54
USD/JPY Price Forecast: Slips below 149.00 as sellers gather steam
- Failure to hold above 149.00 opens the door for a deeper decline.
- Next key support levels at 148.39 and YTD low of 148.09.
- Upside potential only if buyers reclaim 149.70, with resistance at 150.00 and 151.99-152.32.
The USD/JPY reversed course on Wednesday and dropped some 0.62% late during the North American session, as sellers eyed a daily close below the 149.00 figure. At the time of writing, the pair trades at 148.86.
USD/JPY Price Forecast: Technical outlook
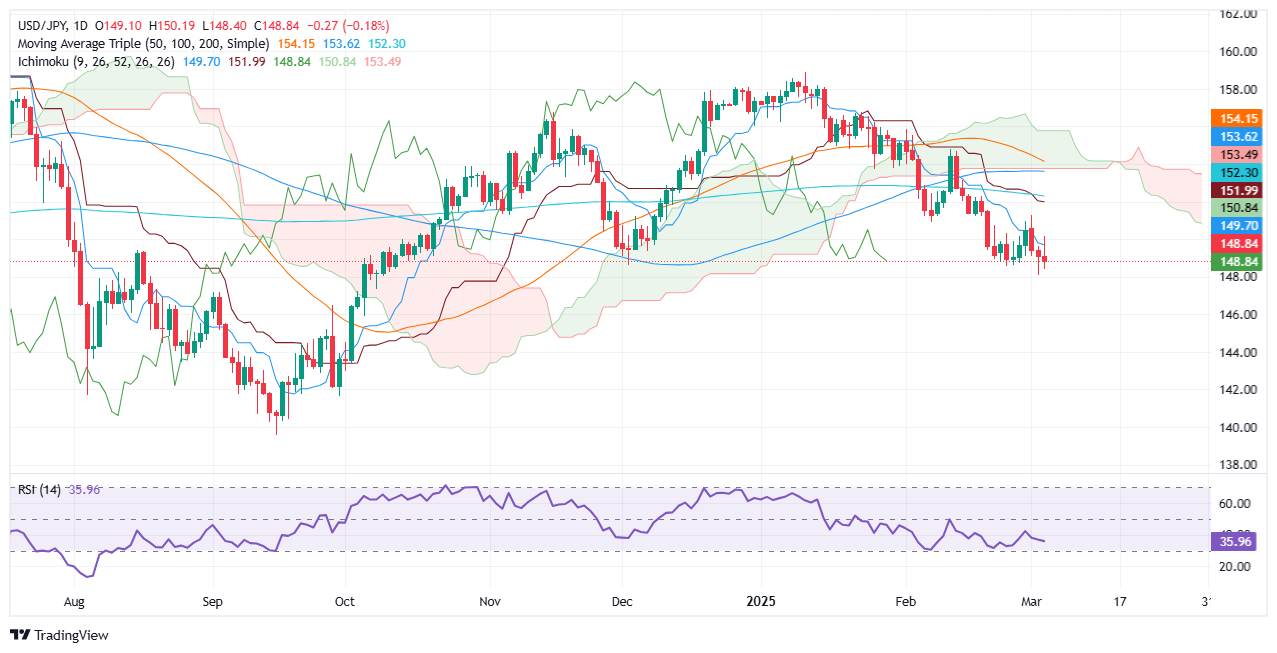
The USD/JPY downtrend remains intact despite buyers' efforts to drive the exchange rate above the Tenkan-Sen at 149.70. Nevertheless failure to do so, exacerbated the drope beneath 149.00 and opened the door for a re-test of the year-to-date (YTD) low of 148.09. A breach of the latter will expose the October 8 daily low of 148.39.
On the other hand, if USD/JPY buyers clear the 149.00 figure, up next lies the Tenkan-Sen at 149.70, Once hurdled, the next resistance is 150.00, and a daily close above the latter could cement the chance to challenge the confluence of the Kijun-Sen and the 200-day Simple Moving Average (SMA) around 151.99-152.32.
USD/JPY Price Chart – Daily
Japanese Yen FAQs
The Japanese Yen (JPY) is one of the world’s most traded currencies. Its value is broadly determined by the performance of the Japanese economy, but more specifically by the Bank of Japan’s policy, the differential between Japanese and US bond yields, or risk sentiment among traders, among other factors.
One of the Bank of Japan’s mandates is currency control, so its moves are key for the Yen. The BoJ has directly intervened in currency markets sometimes, generally to lower the value of the Yen, although it refrains from doing it often due to political concerns of its main trading partners. The BoJ ultra-loose monetary policy between 2013 and 2024 caused the Yen to depreciate against its main currency peers due to an increasing policy divergence between the Bank of Japan and other main central banks. More recently, the gradually unwinding of this ultra-loose policy has given some support to the Yen.
Over the last decade, the BoJ’s stance of sticking to ultra-loose monetary policy has led to a widening policy divergence with other central banks, particularly with the US Federal Reserve. This supported a widening of the differential between the 10-year US and Japanese bonds, which favored the US Dollar against the Japanese Yen. The BoJ decision in 2024 to gradually abandon the ultra-loose policy, coupled with interest-rate cuts in other major central banks, is narrowing this differential.
The Japanese Yen is often seen as a safe-haven investment. This means that in times of market stress, investors are more likely to put their money in the Japanese currency due to its supposed reliability and stability. Turbulent times are likely to strengthen the Yen’s value against other currencies seen as more risky to invest in.
-
21:45
Canadian Dollar recovers ground on tariff pivot
- The Canadian Dollar rebounded nearly 1% on Wednesday.
- Loonie markets are recovering as Trump administration pivots on tariffs.
- Key labor figures are due at the end of the week, and NFP looms large.
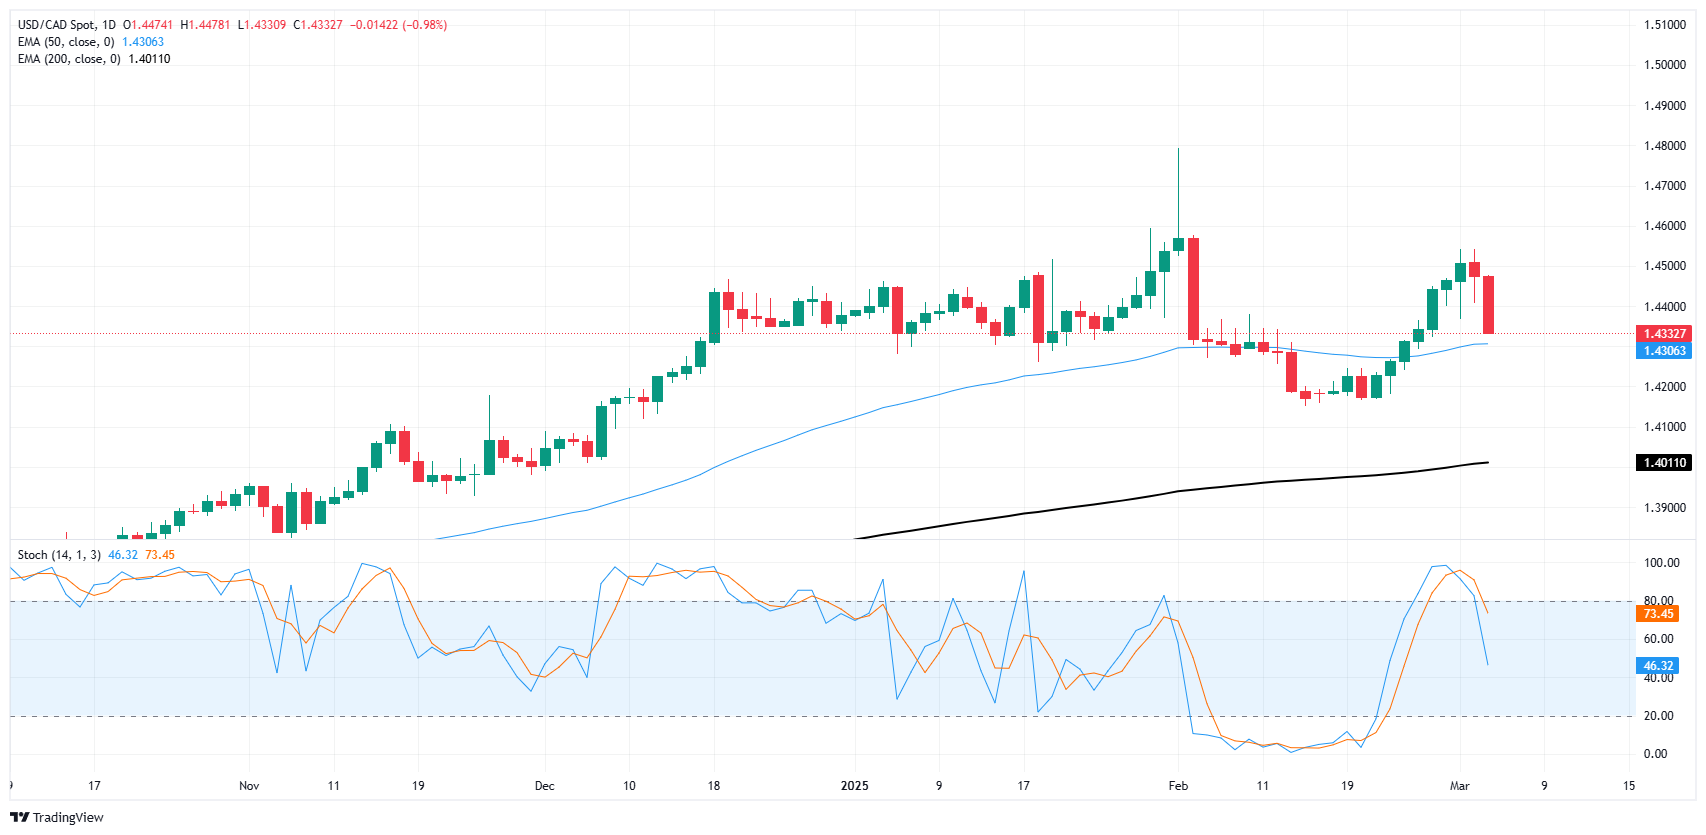
The Canadian Dollar rallied hard on Wednesday, recovering almost full percent against the US Dollar. The day’s Loonie recovery has pushed USD/CAD lower, forcing bids back into the 50-day Exponential Moving Average (EMA) near the 1.4300 handle.
It took less than 48 hours, but US President Donald Trump is already exploring avenues to provide concessions or extensions for key industries that face ruin at the hands of President Trump’s sweeping tariff agenda. The White House has issued a 30-day exemption for the US automotive industry following the implementation of Donald Trump’s bespoke tariff strategy that imposed a 25% tariff on all goods imported from Canada and Mexico.
Daily digest market movers: Tariffs bode poorly for US industries as policy pivot continues
- The Canadian Dollar pared recent losses, gaining nine-tenths of one percent on Wednesday.
- Loonie markets are recovering ground as the Trump administration begins to pivot away from its own tariff policies.
- Markets are betting on further tariff exemptions and extension in the weeks to come as the Trump administration delays tariffs on US auto makers, which are heavily reliant on foreign trade.
- The Trump team is discovering just how much the US economy relies on efficient trade.
- Key labor data still looms large at the end of the week with Canadian employment figures and another round of US Nonfarm Payrolls net jobs additions.
- Canadian job gains are expected to slow in February, while US net job gains are expected to rebound slightly.
Canadian Dollar price forecast
The Canadian Dollar’s Wednesday rebound has dragged the USD/CAD chart back down into familiar territory, for better or for worse. The prevailing trend is a slow-motion sideways grind, with the Loonie continuously testing multi-year lows against the Greenback.
USD/CAD is inching back into the 50-day EMA at the 1.4300 handle on daily candlesticks, implying the pair could once again run out of gas. However, technical oscillators are showing that Loonie bulls still have some room to run and try to drag USD-based pairs even lower.
USD/CAD daily chart
Canadian Dollar FAQs
The key factors driving the Canadian Dollar (CAD) are the level of interest rates set by the Bank of Canada (BoC), the price of Oil, Canada’s largest export, the health of its economy, inflation and the Trade Balance, which is the difference between the value of Canada’s exports versus its imports. Other factors include market sentiment – whether investors are taking on more risky assets (risk-on) or seeking safe-havens (risk-off) – with risk-on being CAD-positive. As its largest trading partner, the health of the US economy is also a key factor influencing the Canadian Dollar.
The Bank of Canada (BoC) has a significant influence on the Canadian Dollar by setting the level of interest rates that banks can lend to one another. This influences the level of interest rates for everyone. The main goal of the BoC is to maintain inflation at 1-3% by adjusting interest rates up or down. Relatively higher interest rates tend to be positive for the CAD. The Bank of Canada can also use quantitative easing and tightening to influence credit conditions, with the former CAD-negative and the latter CAD-positive.
The price of Oil is a key factor impacting the value of the Canadian Dollar. Petroleum is Canada’s biggest export, so Oil price tends to have an immediate impact on the CAD value. Generally, if Oil price rises CAD also goes up, as aggregate demand for the currency increases. The opposite is the case if the price of Oil falls. Higher Oil prices also tend to result in a greater likelihood of a positive Trade Balance, which is also supportive of the CAD.
While inflation had always traditionally been thought of as a negative factor for a currency since it lowers the value of money, the opposite has actually been the case in modern times with the relaxation of cross-border capital controls. Higher inflation tends to lead central banks to put up interest rates which attracts more capital inflows from global investors seeking a lucrative place to keep their money. This increases demand for the local currency, which in Canada’s case is the Canadian Dollar.
Macroeconomic data releases gauge the health of the economy and can have an impact on the Canadian Dollar. Indicators such as GDP, Manufacturing and Services PMIs, employment, and consumer sentiment surveys can all influence the direction of the CAD. A strong economy is good for the Canadian Dollar. Not only does it attract more foreign investment but it may encourage the Bank of Canada to put up interest rates, leading to a stronger currency. If economic data is weak, however, the CAD is likely to fall.
-
21:25
NZD/USD Price Analysis: Bulls take control as momentum shifts higher
- NZD/USD surged ahead of the Asian session, reclaiming ground near the 0.5720 zone after strong buying interest.
- The pair climbed above its 20-day SMA, signaling a potential shift in momentum as the RSI moved into positive territory.
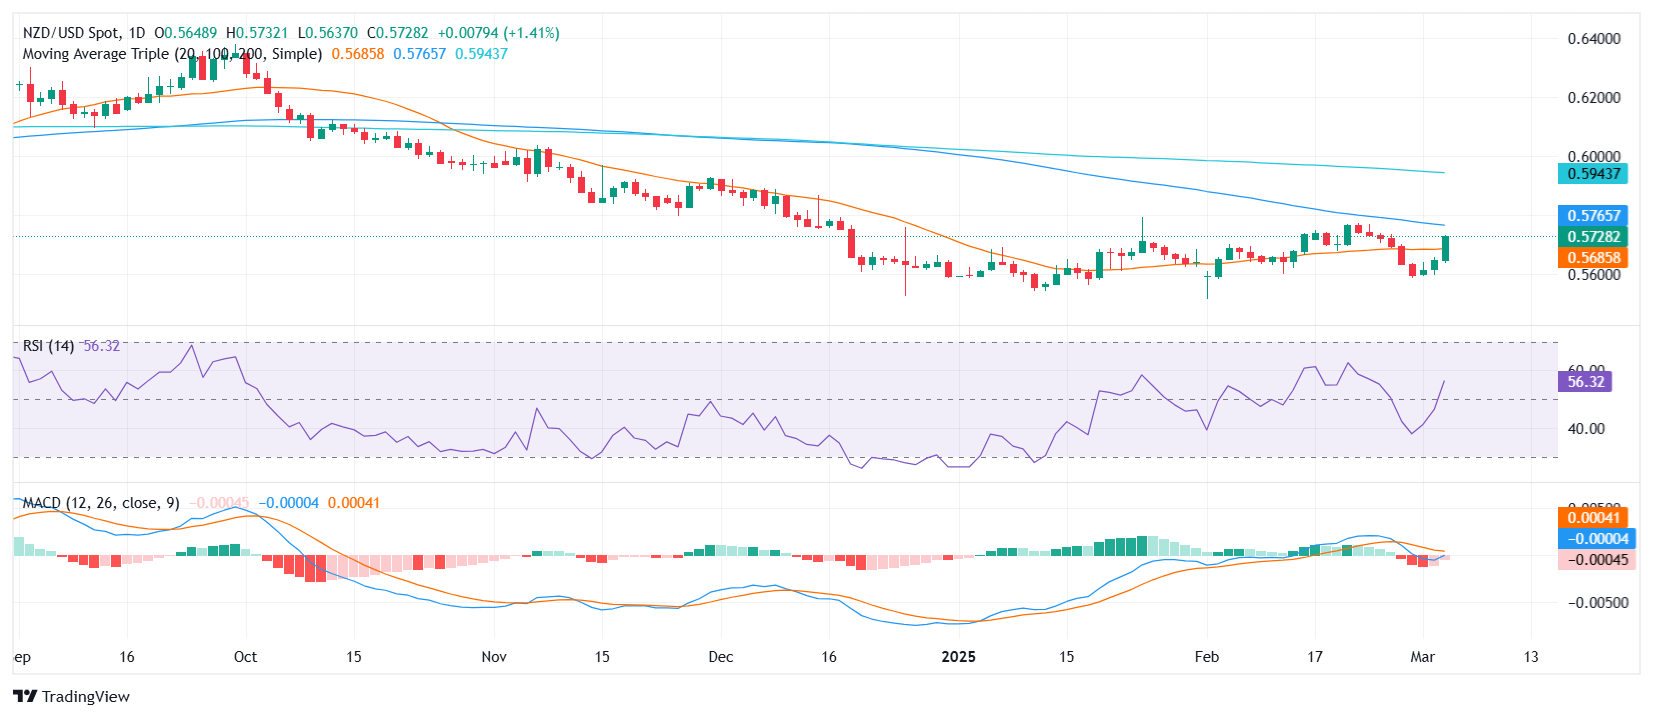
NZD/USD extended its advance on Wednesday, rallying sharply and positioning itself above a key technical level. The pair was last seen trading near the 0.5720 region ahead of the Asian session, posting strong gains as buyers regained control. After a prolonged period of selling, momentum appears to be shifting, as technical indicators suggest a more constructive outlook.
The Relative Strength Index (RSI) has moved into positive territory, reflecting increasing bullish momentum, while the Moving Average Convergence Divergence (MACD) remains in negative territory but prints flat red bars, signaling a slowdown in bearish pressure. More importantly, the pair has successfully risen above its 20-day Simple Moving Average (SMA), a key level that had previously acted as resistance.
Looking ahead, immediate resistance lies around the 0.5750 zone, with a break above this level potentially opening the door for further upside toward 0.5800. On the downside, the 20-day SMA, now acting as support near 0.5680, will be crucial. If buyers manage to keep the pair above this threshold, the bullish outlook could remain intact.
NZD/USD daily chart
-
21:13
AUD/JPY Price Analysis: Buyers take control as sellers lose steam
- AUD/JPY edged higher ahead of the Asian session, stabilizing near the 94.00 zone after recent losses.
- Tuesday’s price action suggested that sellers hit a strong support area, paving the way for a potential consolidation.
- Key resistance aligns near 95.00, while support remains at the recent low around 93.60.
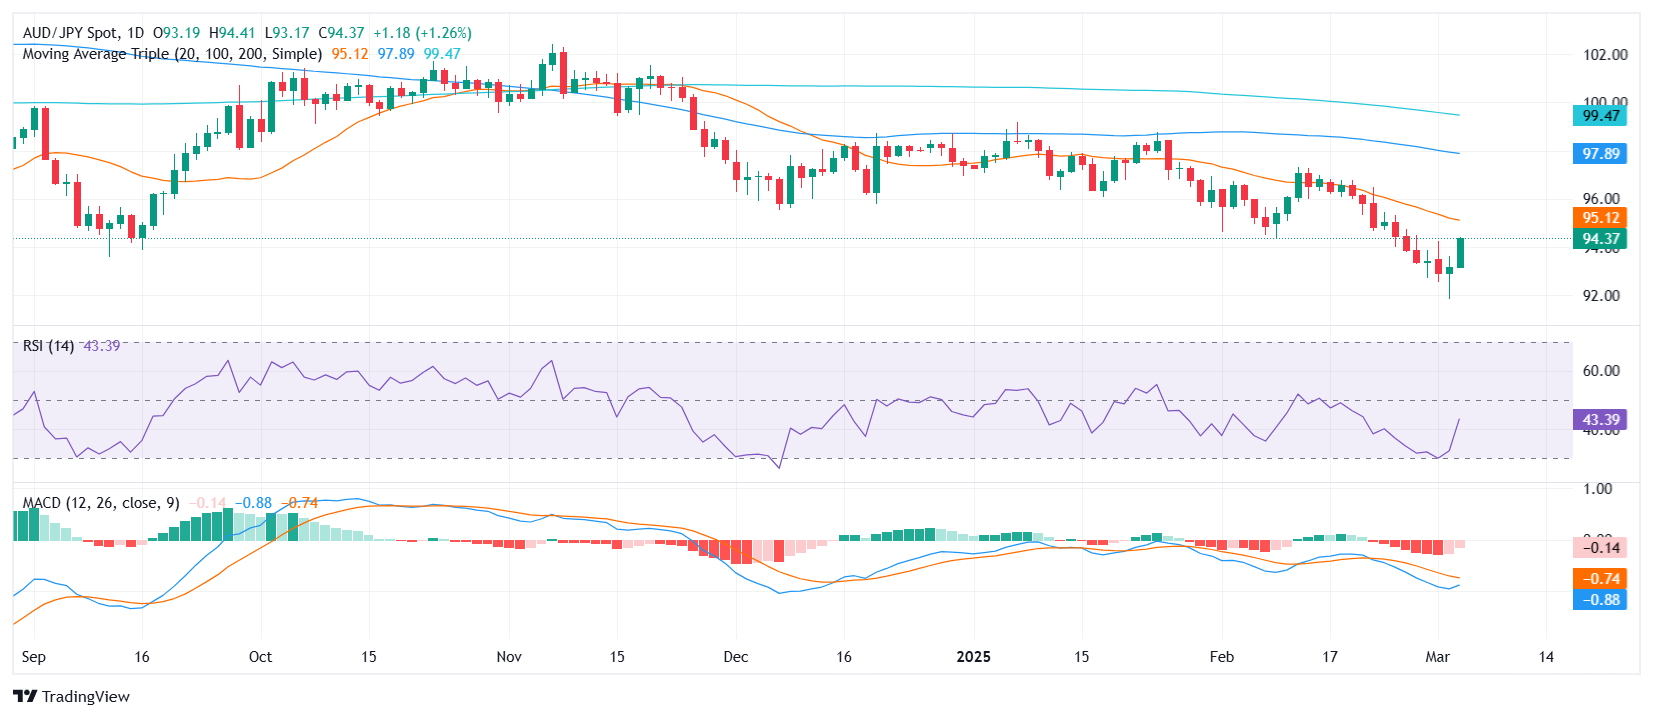
AUD/JPY showed signs of recovery on Wednesday, inching higher after a prolonged bearish run. The pair was last seen trading around the 94.50 region ahead of the Asian session, attempting to regain ground following a steep decline. Sellers dominated earlier sessions, but Tuesday’s price action indicated exhaustion as they failed to drive prices lower. This shift has given buyers an opportunity to step in, potentially setting up a consolidation phase.
Technical indicators reflect this transition. The Relative Strength Index (RSI) is rebounding sharply from negative territory, suggesting that selling momentum is easing. Meanwhile, the Moving Average Convergence Divergence (MACD) is still printing decreasing red bars, indicating that downside pressure remains but is gradually fading. If bullish momentum builds, a test of the 94.50-95.00 resistance could follow.
From a technical perspective, immediate resistance is seen near 95.00, aligning with a previous reaction zone. A breakout above this level could push the pair toward the 95.00 handle. On the downside, initial support is located around 93.60, with a move below this threshold potentially reigniting bearish pressure. However, given the signs of stabilization, the near-term outlook appears to favor sideways trading as the market digests recent losses.
AUD/JPY daily chart
-
21:00
South Korea FX Reserves fell from previous 411B to 409.21B in February
-
20:52
Gold price steadies as markets weigh tariff uncertainty, Fed outlook
- XAU/USD holds firm as speculation grows over Trump’s potential tariff rollback.
- Gold fluctuates around $2,910 amid mixed economic signals and policy uncertainty.
- US ADP jobs data disappoints, while ISM Services PMI shows inflation risks persist.
- Traders eye US Nonfarm Payrolls data Friday for Fed rate-cut clues.
Gold price remains firm on Wednesday amid speculation that the President of the United States (US), Donald Trump, could roll back some tariffs, at least duties on automobiles linked to the USMCA free trade agreement. Nevertheless, uncertainty remains, and XAU/USD trades at $2,919, virtually unchanged.
Bullion prices had been seesawing around the $2,910 mark during the North American session as the news flow continued. The Federal Reserve (Fed) revealed the Beige Book in anticipation of the upcoming monetary policy, stating that overall economic activity rose, yet prices are higher amid Trump trade policies.
Data-wise, ADP revealed that private hiring in February slowed sharply compared to January’s figures. Meanwhile, according to February's latest ISM Services PMI, businesses continued to expand healthily. Despite this, fears that inflation could reaccelerate remained, as Prices Paid, a sub-component of the PMI, jumped above the 60 level, hinting that producers are paying higher prices, which could stoke a second round of inflation.
Meanwhile, recently revealed US data sparked recessionary fears. The Atlanta Fed GDPNow Model projects the Gross Domestic Product (GDP) for Q1 2025 at -2.8%, down from 1.6% estimated on Monday.
Regarding geopolitics, an aide of Ukraine President Zelensky discussed steps to achieve peace with the US National Security Advisor as Ukraine and the US agreed on a meeting soon.
This could push Gold prices lower, alongside higher US Treasury bond yields. Traders will be eyeing Friday's release of February’s Nonfarm Payrolls figures, with analysts projecting 160K jobs added to the workforce.
Daily digest market movers: Gold price consolidates amid mixed US data
- The US 10-year Treasury note climbs four basis points (bps) to 4.28%.
- US real yields, as measured by the US 10-year Treasury Inflation-Protected Securities (TIPS) yield, are rising four and a half bps up to 1.935%.
- The ADP National Employment Change report showed that US private sector hiring increased by 77K in February, significantly missing the 140K forecast and falling well below January’s strong 186K gain.
- Meanwhile, the ISM Services PMI expanded to 53.5 in February, exceeding expectations of 52.6 and improving from January’s 52.8, signaling continued growth in the services sector.
- Money market traders had priced in 71.5 basis points of easing in 2025, down from Tuesday’s 81 bps, via data from the Prime Market Terminal.
Source: Prime Market Terminal
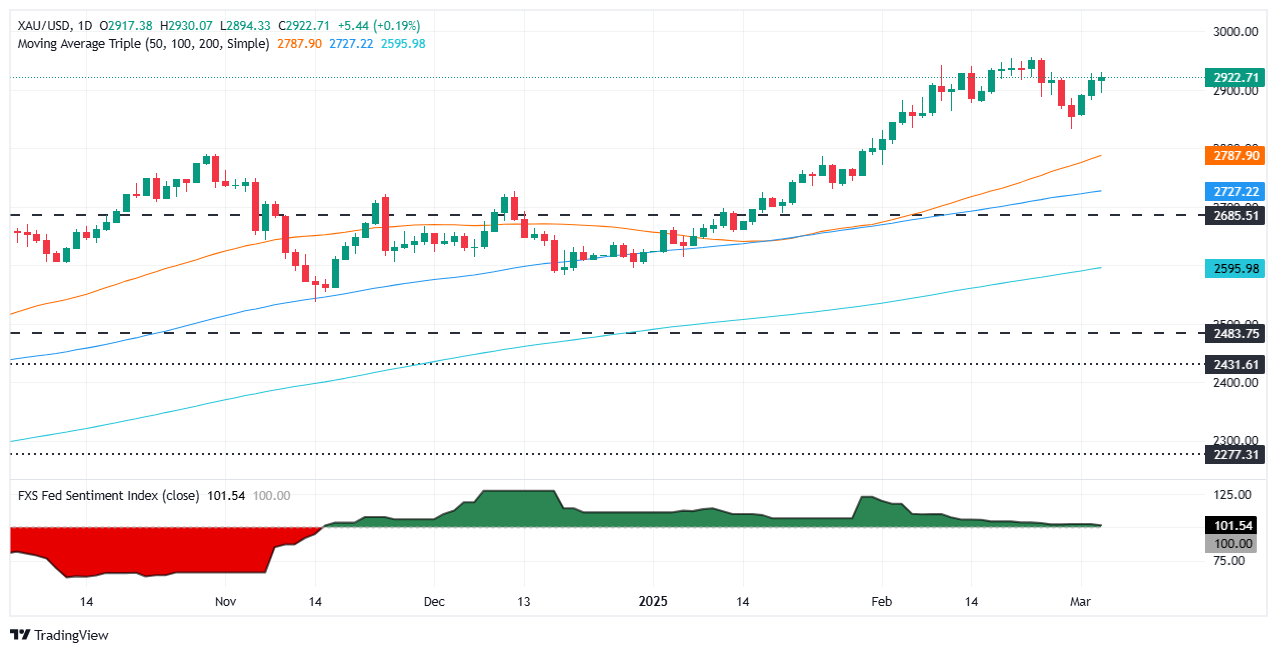
XAU/USD technical outlook: Gold price holds firm above $2,900
Gold prices stalled on Wednesday after registering two consecutive bullish days. Nevertheless, momentum is shifted to the upside, with the Relative Strength Index (RSI) trending up in bullish territory. That said, Bullion’s path of least resistance is a continuation of the uptrend.
XAU/USD next resistance would be $2,950, followed by the record high at $2,954. A breach of the latter can expose the $3,000 mark. On the other hand, a daily close below $2,900, could put the uptrend at risk and open the door for a “healthy” pullback.
That said, Gold’s first support would be the February 28 low of $2,832, followed by the $2,800 figure.
Gold FAQs
Gold has played a key role in human’s history as it has been widely used as a store of value and medium of exchange. Currently, apart from its shine and usage for jewelry, the precious metal is widely seen as a safe-haven asset, meaning that it is considered a good investment during turbulent times. Gold is also widely seen as a hedge against inflation and against depreciating currencies as it doesn’t rely on any specific issuer or government.
Central banks are the biggest Gold holders. In their aim to support their currencies in turbulent times, central banks tend to diversify their reserves and buy Gold to improve the perceived strength of the economy and the currency. High Gold reserves can be a source of trust for a country’s solvency. Central banks added 1,136 tonnes of Gold worth around $70 billion to their reserves in 2022, according to data from the World Gold Council. This is the highest yearly purchase since records began. Central banks from emerging economies such as China, India and Turkey are quickly increasing their Gold reserves.
Gold has an inverse correlation with the US Dollar and US Treasuries, which are both major reserve and safe-haven assets. When the Dollar depreciates, Gold tends to rise, enabling investors and central banks to diversify their assets in turbulent times. Gold is also inversely correlated with risk assets. A rally in the stock market tends to weaken Gold price, while sell-offs in riskier markets tend to favor the precious metal.
The price can move due to a wide range of factors. Geopolitical instability or fears of a deep recession can quickly make Gold price escalate due to its safe-haven status. As a yield-less asset, Gold tends to rise with lower interest rates, while higher cost of money usually weighs down on the yellow metal. Still, most moves depend on how the US Dollar (USD) behaves as the asset is priced in dollars (XAU/USD). A strong Dollar tends to keep the price of Gold controlled, whereas a weaker Dollar is likely to push Gold prices up.
-
20:47
Australian Dollar holds gains as US Dollar remains subdued after ISM Services PMI and jobs data
- The pair advanced by roughly 0.75% during Wednesday’s American session, trading in the mid-0.6300 zone following fresh US data.
- The Aussie is up nearly 1.40% intraday, contending with the 20-day moving average that could shift the near-term outlook if reclaimed.
- President Donald Trump’s 10% tariff on China, along with earlier duties, poses a risk to the Australian Dollar’s upside.
The Australian Dollar (AUD) strengthened on Wednesday, with the AUD/USD pair gaining traction after the United States (US) reported mixed ISM Services PMI and softer ADP Employment Change figures. The US Dollar (USD) remains under pressure amid concerns over slowing economic momentum, keeping the Aussie buoyed.
Daily digest market movers: Post-ISM, ADP data shape currency flows amid tariff warnings
- Renewed US tariffs on Chinese imports add more strain to global risk sentiment. The 10% levy from President Donald Trump compounds earlier duties and the potential for Chinese retaliation remains high, particularly concerning for commodity-linked currencies like the Aussie, given China’s status as Australia’s largest trade partner.
- On the US data front, the ISM Services PMI showed continued expansion at 53.5, while the ADP report indicated softer private-sector job gains compared to forecasts. These mixed signals weigh on the US Dollar, as traders assess the likelihood of Federal Reserve (Fed) policy adjustments in response to possible economic headwinds.
- The Reserve Bank of Australia (RBA) has held off announcing more rate cuts since lowering the Official Cash Rate by 25 basis points to 4.10% in February, reiterating concerns about inflation. Market expectations for additional easing remain uncertain, depending on upcoming data.
- Investors cautiously evaluate riskier assets as the US Dollar’s softness fails to spark a strong Aussie rally. Demand for Australian commodity exports could suffer if trade conflicts escalate. Meanwhile, the Aussie retains some bullish impetus on the back of the subdued Greenback.
Technical analysis: Pair challenges 20-day SMA amid momentum shift
The AUD/USD pair advanced by about 1.40% to roughly 0.6333 on Wednesday’s American session, recovering from intraday lows following the release of the ISM Services PMI and ADP reports. The Moving Average Convergence Divergence (MACD) prints decreasing red bars, indicating ebbing seller strength, while the Relative Strength Index (RSI) lies in the upper 50s, climbing sharply from lower levels.
With the Aussie up nearly 1.40% on the day, reclaiming the 20-day moving average would mark an improvement in its short-term prospects. However, if new tariff developments undermine risk appetite, the pair may retreat toward support around the 0.6250 region, with a more robust floor near 0.6200. Resistance emerges above 0.6350, where any breach could bolster near-term bullish momentum.
Australian Dollar FAQs
One of the most significant factors for the Australian Dollar (AUD) is the level of interest rates set by the Reserve Bank of Australia (RBA). Because Australia is a resource-rich country another key driver is the price of its biggest export, Iron Ore. The health of the Chinese economy, its largest trading partner, is a factor, as well as inflation in Australia, its growth rate and Trade Balance. Market sentiment – whether investors are taking on more risky assets (risk-on) or seeking safe-havens (risk-off) – is also a factor, with risk-on positive for AUD.
The Reserve Bank of Australia (RBA) influences the Australian Dollar (AUD) by setting the level of interest rates that Australian banks can lend to each other. This influences the level of interest rates in the economy as a whole. The main goal of the RBA is to maintain a stable inflation rate of 2-3% by adjusting interest rates up or down. Relatively high interest rates compared to other major central banks support the AUD, and the opposite for relatively low. The RBA can also use quantitative easing and tightening to influence credit conditions, with the former AUD-negative and the latter AUD-positive.
China is Australia’s largest trading partner so the health of the Chinese economy is a major influence on the value of the Australian Dollar (AUD). When the Chinese economy is doing well it purchases more raw materials, goods and services from Australia, lifting demand for the AUD, and pushing up its value. The opposite is the case when the Chinese economy is not growing as fast as expected. Positive or negative surprises in Chinese growth data, therefore, often have a direct impact on the Australian Dollar and its pairs.
Iron Ore is Australia’s largest export, accounting for $118 billion a year according to data from 2021, with China as its primary destination. The price of Iron Ore, therefore, can be a driver of the Australian Dollar. Generally, if the price of Iron Ore rises, AUD also goes up, as aggregate demand for the currency increases. The opposite is the case if the price of Iron Ore falls. Higher Iron Ore prices also tend to result in a greater likelihood of a positive Trade Balance for Australia, which is also positive of the AUD.
The Trade Balance, which is the difference between what a country earns from its exports versus what it pays for its imports, is another factor that can influence the value of the Australian Dollar. If Australia produces highly sought after exports, then its currency will gain in value purely from the surplus demand created from foreign buyers seeking to purchase its exports versus what it spends to purchase imports. Therefore, a positive net Trade Balance strengthens the AUD, with the opposite effect if the Trade Balance is negative.
-
19:59
Forex Today: No surprises expected at the ECB meeting
The downtrend in the US Dollar gathered extra steam on Wednesday, fuelled by concerns over the US economy and some renewed hopes that the Trump administration could delay some planned tariffs.
Here is what you need to know on Thursday, March 6:
The US Dollar Index (DXY) broke below the 105.00 support, reaching news four-month lows amid further concerns over the US economy. The January Balance of Trade results are due, seconded by Challenger Job Cuts, the usual weekly Initial Jobless Claims, and Unit Labor Costs. In addition, the Fed’s. Waller and Harker are due to speak.
EUR/USD extended its solid performance to the vicinity of the 1.0800 barrier, or new four-month peaks. The ECB’s interest rate decision will take centre stage, along with Lagarde’s press conference. Data wise, the HCOB Construction PMI in Germany and the euro area will be released along with Retail Sales in the whole bloc.
GBP/USD climbed to just pips away from the key barrier at 1.2900 the figure, or multi-month tops. The S&P Global Construction PMI will be the sole release across the Channel, followed by the speech by the BoE’s Mann.
USD/JPY resumed its downtrend and revisited the low-148.00s following the sharp pullback in the Greenback. The weekly Foreign Bond Investment figures will be published.
AUD/USD rose markedly, advancing for the third straight day and reclaiming the area beyond the 0.6300 hurdle. The Balance of Trade results are expected, seconded by flash prints of Building Permits and Private House Approvals.
Prices of the barrel of WTI dropped to new lows near the $65.00 mark in response to an increased in US crude oil supplies, tariff concerns and the expected OPEC+ intention to increase the oil output in April.
Gold prices hit their third straight day of gains, retesting the $2,920 zone following the sharp decline in the US Dollar. Silver prices rallied further north of the $32.00 mark per ounce, flirting with eight-day highs.
-
19:43
Fed's Beige Book: Price increases ahead of tariffs could spell trouble for inflation
The Federal Reserve's (Fed) Summary of Commentary on Current Economic Conditions by Federal Reserve District, colloquially known as the Beige Book, is a collection of anecdotal information regarding inflation, employment, and general economic conditions within each Fed Bank's district. The Beige Book is collected and publicized eight times per year, released roughly two weeks before each Fed rate decision.
The Beige Book is broadly considered the least-impactful of the three 'Books' distributed by the Fed, however the Beige Book is the only version that is publicly-available. Normally a no-noteworthy release, March's Beige Book is carrying additional weight as US President Donald Trump's trade war aspirations are starting to produce cracks within the US economy well before they've reached their full effect, or even fully implemented.
Key highlights
Overall expectations for economic activity over the coming months were slightly optimistic.
Prices increased moderately in most districts, but several districts reported an uptick in the pace of increase relative to the previous reporting period.
US economic activity rose slightly since mid-January.
Employment was slightly higher on balance, with stricts mixed.
Wages rose at a modest to moderate pace, prices went up moderately.
Contacts in most districts expected potential tariffs on inputs would lead them to raise prices, with isolated reports of firms raising prices preemptively.
-
19:03
US White House Press Secretary Leavitt: Trump will give auto industry an extension on tariffs
According to US White House Press Secretary Karoline Leavitt, US President Donald Trump is granting the US automotive industry, which is incredibly dependent on foreign trade, a one-month exemption from this week's stiff 25% tariffs imposed on Canada and Mexico.
The White House administration has also tilted toward other possible exemptions or delays as the Trump team continues to prove markets right and pivots once again on the majority of its own threats to impose stiff import taxes on its own citizens.
Key highlights
Trump spoke with the heads of the big three automakers.
Reciprocal tariffs still going into effect April 2nd.
Trump is open to hearing about additional tariff exemptions.
The Trump administration is doing everything they can on inflation.
National Security Adviser Waltz has been talking to his Ukrainian counterparts.
Reconsidering funding for Ukraine.
Talks on the mineral deal are happening.
US/Ukraine talks are happening as we speak.
-
18:23
US Dollar extends losing streak as weak labor data fuels selloff
- DXY drops over 2.5% this week as selling pressure intensifies.
- ADP employment data misses expectations, showing hiring slowdown.
- ISM Services PMI beats forecasts, signaling economic resilience.
- Technical indicators suggest further downside as key support levels break.
The US Dollar Index (DXY), which tracks the Greenback’s performance against six major currencies, is extending its decline for the third consecutive day on Wednesday. The weaker-than-expected labor market data, coupled with rising trade tensions and policy uncertainty, is pushing the US Dollar further down.
While the services sector remains robust, the market is focusing on the ADP employment shortfall, reinforcing expectations of a slowing economy. So far, the DXY has depreciated over 2.5% this week, with no immediate signs of reversal.
Daily digest market movers: US Dollar weakens amid labor concerns
- DXY plunges below key levels, marking the lowest point since November 2024.
- ADP employment report shows the US private sector added only 77K jobs, missing expectations of 140K.
- On the positive side, ISM Services PMI rises to 53.5, exceeding forecasts and showing continued economic expansion.
- That being said, inflationary pressures persist, with the Prices Paid Index climbing to 62.6 from 60.4.
- Employment Index within ISM data improves, rising to 53.9 from 52.3.
- CME FedWatch Tool indicates increased rate cut expectations for later this year and investors may start betting on 100bps of easing in 2025.
DXY technical outlook: Bearish momentum intensifies
The US Dollar Index (DXY) continues to slide, falling below both the 20-day and 100-day Simple Moving Averages (SMA), which are nearing a bearish crossover around 107.00. The completion of this pattern could reinforce further downside pressure, leaving the US Dollar vulnerable to further declines.
The Relative Strength Index (RSI) and Moving Average Convergence Divergence (MACD) continue pointing lower, confirming bearish momentum. With the index now at levels not seen since November 2024, a sustained break below 106.00 could open the door for a move toward 105.50 and beyond.
Employment FAQs
Labor market conditions are a key element in assessing the health of an economy and thus a key driver for currency valuation. High employment, or low unemployment, has positive implications for consumer spending and economic growth, boosting the value of the local currency. Moreover, a very tight labor market – a situation in which there is a shortage of workers to fill open positions – can also have implications on inflation levels because low labor supply and high demand leads to higher wages.
The pace at which salaries are growing in an economy is key for policymakers. High wage growth means that households have more money to spend, usually leading to price increases in consumer goods. In contrast to more volatile sources of inflation such as energy prices, wage growth is seen as a key component of underlying and persisting inflation as salary increases are unlikely to be undone. Central banks around the world pay close attention to wage growth data when deciding on monetary policy.
The weight that each central bank assigns to labor market conditions depends on its objectives. Some central banks explicitly have mandates related to the labor market beyond controlling inflation levels. The US Federal Reserve (Fed), for example, has the dual mandate of promoting maximum employment and stable prices. Meanwhile, the European Central Bank’s (ECB) sole mandate is to keep inflation under control. Still, and despite whatever mandates they have, labor market conditions are an important factor for policymakers given their significance as a gauge of the health of the economy and their direct relationship to inflation.
-
18:19
Mexican Peso surges as rumors swirl over tariff rollback
- Mexican Peso rebounds 0.92% after hitting a four-week high at 20.99
- Trump administration reportedly considering a one-month tariff delay for automakers.
- Mexico’s economy weakens, with Banxico’s GDP forecast cut to 0.81%.
- Goldman Sachs warns Mexico’s GDP could shrink by up to 4% if tariffs remain.
The Mexican Peso (MXN) is recovering some ground against the US Dollar (USD) on Wednesday, on rumors that tariffs imposed by the United States (US) since March 4 could be rolled back or at least adjusted, according to US Commerce Secretary Howard Lutnick. Therefore, the USD/MXN pair retraced after hitting a four-week high of 20.99, trading at 20.38, down over 0.92%.
Bloomberg reported that the Trump administration could be considering another one-month delay of tariffs for automakers in Mexico and Canada, according to people familiar with the matter. The emerging market currency recovered after weakening 2.61% on Tuesday, clawed back, and is up 0.67% in the week, as USD/MXN tests the 100-day Simple Moving Average (SMA) at 20.32.
On Tuesday, 25% tariffs became effective for Mexican imports and sent the Peso plunging. Nevertheless, it seems discussions continued while Mexican President Claudia Sheinbaum said that retaliations will be unveiled on Sunday.
Meanwhile, data shows the Mexican economy continues to deteriorate as Gross Fixed Investment fell in December on monthly and yearly readings. Banco de Mexico’s (Banxico) private analysts' survey revealed that economists project the economy to grow 0.81%, down from a 1% estimate in January 2025.
According to El Financiero, Mexico’s economy is in the midst of a recession, and the Gross Domestic Product (GDP) could contract up to 4% if Trump’s tariffs remain.
Alberto Ramos, Chief Economist for Latin America at Goldman Sachs, stated that even in a scenario with a combined impact of trade policy uncertainty and partial retaliation, Mexico's GDP could shrink by 3% to 3.5%, and inflation could reaccelerate.
However, the Mexican Peso gained steam on Wednesday, a relief rally as traders await an update on tariffs on Mexico.
The Institute for Supply Management (ISM) Services PMI for February revealed that business activity improved. Meanwhile, US jobs data was dismal across the border, spurring fears of a possible recession.
Daily digest market movers: Mexican Peso rallies amid soft US Dollar
- Mexico’s Gross Fixed Investment in December dropped from 0.1% to -2.6% MoM. In the twelve months to December, the figures deteriorated further from -0.7% to -4%.
- Banco de Mexico's (Banxico) private economists' showed that headline inflation is forecast to end at 3.71%, slightly lower than the previous 3.83%, while core CPI is expected to finish at 3.75%, unchanged from the prior estimate.
- Economists now predict the USD/MXN pair exchange rate to close in 2025 at 20.85, slightly lower than the 20.90 projection in the previous survey. However, for 2026, they anticipate a sharper depreciation of the Peso, well beyond the 21.30 level expected in January’s poll.
- In the US, the ADP National Employment Change showed that private hiring rose by 77K, less than estimates of 140K and well below January’s outstanding 186K increase.
- The ISM Services PMI in February expanded by 53.5, above forecasts of 52.6, up from January’s 52.8.
- Hence, money market traders had priced in 81 basis points of easing in 2025, up from last week’s 70 bps, via data from the Chicago Board of Trade (CBOT).
- Trade disputes between the US and Mexico remain front and center. If countries could come to an agreement, it could pave the way for a recovery of the Mexican currency. Otherwise, further USD/MXN upside is seen, as US tariffs could trigger a recession in Mexico.
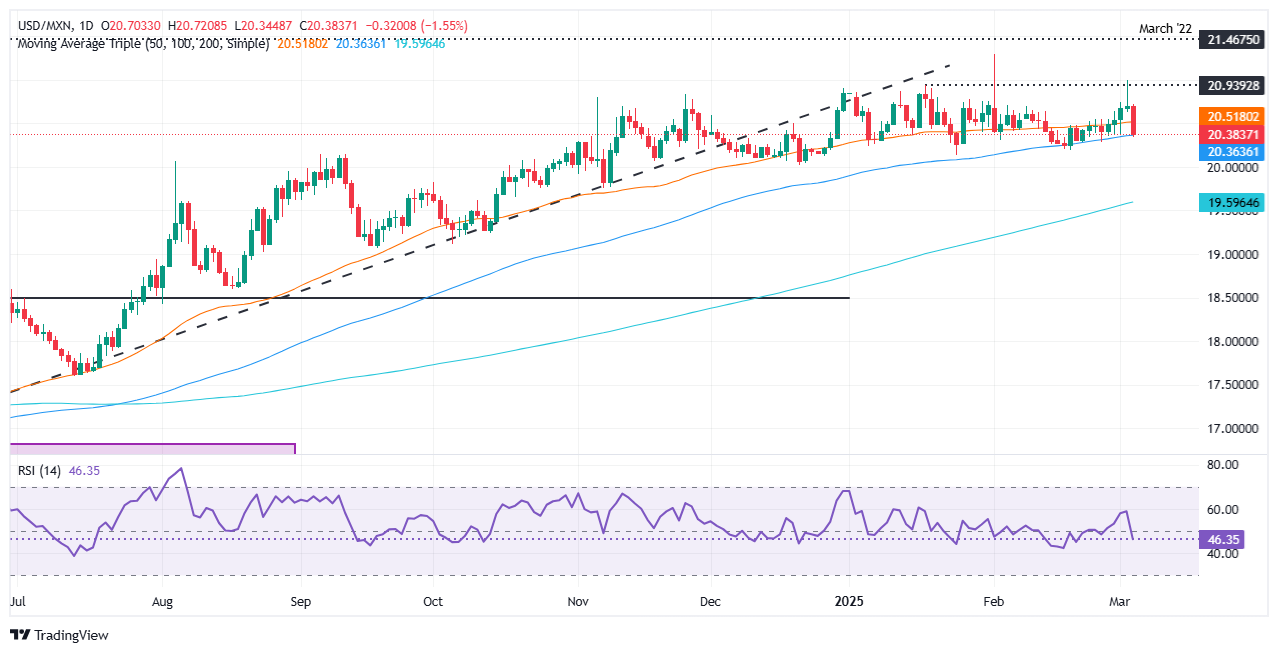
USD/MXN technical outlook: Mexican Peso surges as USD/MXN drops below 20.40
The Peso recovery has driven the USD/MXN pair towards the 100-day SMA, which if cleared, could pave the way for testing the 20.00 psychological barrier. Due to trade headlines suggesting a “possible” delay on tariffs, momentum shifted bearish as seen in the Relative Strength Index (RSI). That said, the path of least resistance near-term favors further appreciation for the Mexican currency.
The next support would be 20.00. If surpassed, the next demand zone would be the 200-day SMA at 19.54. Otherwise, if USD/MXN climbs past 20.50, it could exacerbate a rally towards the March 4 peak at 20.99. Up next lies the year-to-date (YTD) peak of 21.28.
Mexican Peso FAQs
The Mexican Peso (MXN) is the most traded currency among its Latin American peers. Its value is broadly determined by the performance of the Mexican economy, the country’s central bank’s policy, the amount of foreign investment in the country and even the levels of remittances sent by Mexicans who live abroad, particularly in the United States. Geopolitical trends can also move MXN: for example, the process of nearshoring – or the decision by some firms to relocate manufacturing capacity and supply chains closer to their home countries – is also seen as a catalyst for the Mexican currency as the country is considered a key manufacturing hub in the American continent. Another catalyst for MXN is Oil prices as Mexico is a key exporter of the commodity.
The main objective of Mexico’s central bank, also known as Banxico, is to maintain inflation at low and stable levels (at or close to its target of 3%, the midpoint in a tolerance band of between 2% and 4%). To this end, the bank sets an appropriate level of interest rates. When inflation is too high, Banxico will attempt to tame it by raising interest rates, making it more expensive for households and businesses to borrow money, thus cooling demand and the overall economy. Higher interest rates are generally positive for the Mexican Peso (MXN) as they lead to higher yields, making the country a more attractive place for investors. On the contrary, lower interest rates tend to weaken MXN.
Macroeconomic data releases are key to assess the state of the economy and can have an impact on the Mexican Peso (MXN) valuation. A strong Mexican economy, based on high economic growth, low unemployment and high confidence is good for MXN. Not only does it attract more foreign investment but it may encourage the Bank of Mexico (Banxico) to increase interest rates, particularly if this strength comes together with elevated inflation. However, if economic data is weak, MXN is likely to depreciate.
As an emerging-market currency, the Mexican Peso (MXN) tends to strive during risk-on periods, or when investors perceive that broader market risks are low and thus are eager to engage with investments that carry a higher risk. Conversely, MXN tends to weaken at times of market turbulence or economic uncertainty as investors tend to sell higher-risk assets and flee to the more-stable safe havens.
-
18:19
Dow Jones Industrial Average tries to get off the mats on Wednesday
- The Dow Jones gained 300 points from Tuesday’s tumble.
- Equities remain tepid as investors hope for signs of easing trade war tensions.
- Services PMI figures beat the street, but ADP payrolls figures missed the mark.
The Dow Jones Industrial Average (DJIA) bounced from this week’s steep two-day plunge, recovering slim ground as investors try to prop the market back up. Equities took a hit after United States (US) President Donald Trump finally let his own tariffs on Canada, Mexico, and China take effect, but investors are hoping for another round of concessions and delays to ease trade war pressures.
USD ADP Employment Change payroll changes came in far below expectations, showing far fewer new jobs in February than median market forecasts. ADP showed just 77K net new job additions in February, well below March’s revised print of 186K, and flubbing the forecast of 140K. Despite the downside print, not all hope is lost for this week’s Nonfarm Payrolls (NFP) jobs report: the monthly ADP Employment Change has suffered a terrible run of non-correlation with NFP results ever since ADP changed their reporting and measurement methodology in 2022, so a bad or good print fails to signal much of anything at all.
Rumors are swirling that President Trump is all set to begin pivoting on his own tariff packages. The Trump administration is reportedly weighing a one month tariff exclusion for the entire automotive industry, and the ongoing cycle of talking tough but delay and concede looks set to continue in the near term.
Dow Jones news
Most of the Dow Jones’ listed securities are testing into the high side on Wednesday, looking to stage a recovery following this week’s tariff-inspired weakness. Chevron (CVX) fell 1.8%, slipping below $150 per share after the Trump administration stripped away the energy conglomerate’s license to operate in Venezuela. Ostensibly, the Trump team feels Venezuelan President Nicolás Maduro has not done enough to reform the country’s electorate in the US’ image and is not generally willing to accept deported migrants who may or may not actually be Venezuelan.
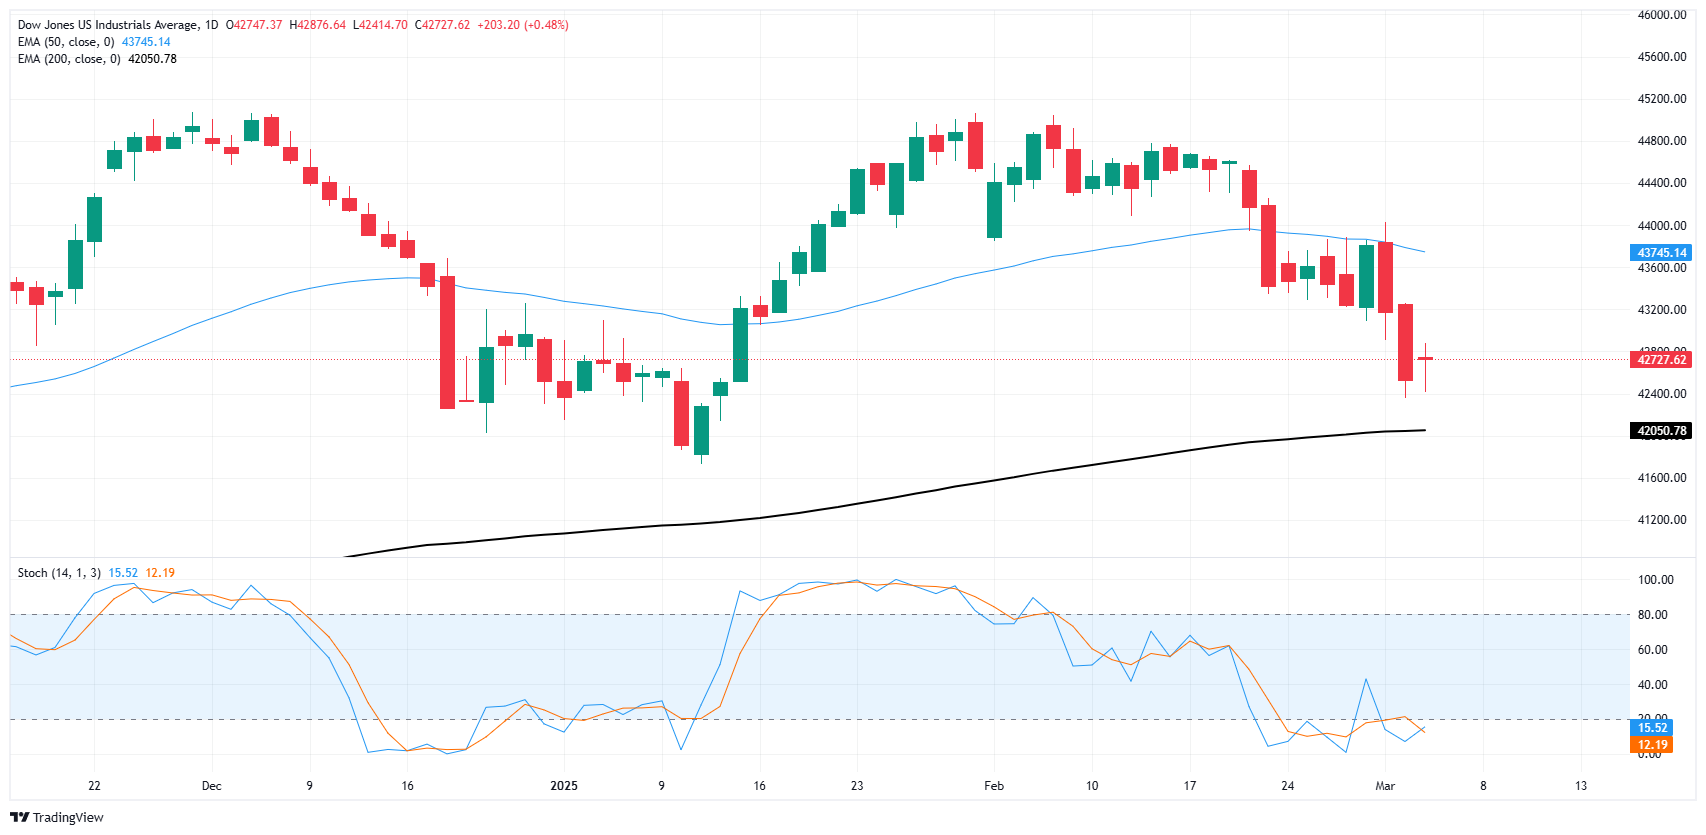
Dow Jones price forecast
The Dow Jones managed to stop the bleeding this week, at least for now. Price action is battling it out to try and keep a foothold in the 43,000 level after catching a rough bounce from the 42,400 level.
The DJIA is dangerously close to making physical contact with the 200-day Exponential Moving Average (EMA) for the first time in over two years. However, the 200-day EMA is beginning to show signs of slowing, which could give bidders a chance to gather their feet beneath them and carry on the trend of outrunning the key moving average.
Dow Jones daily chart
Dow Jones FAQs
The Dow Jones Industrial Average, one of the oldest stock market indices in the world, is compiled of the 30 most traded stocks in the US. The index is price-weighted rather than weighted by capitalization. It is calculated by summing the prices of the constituent stocks and dividing them by a factor, currently 0.152. The index was founded by Charles Dow, who also founded the Wall Street Journal. In later years it has been criticized for not being broadly representative enough because it only tracks 30 conglomerates, unlike broader indices such as the S&P 500.
Many different factors drive the Dow Jones Industrial Average (DJIA). The aggregate performance of the component companies revealed in quarterly company earnings reports is the main one. US and global macroeconomic data also contributes as it impacts on investor sentiment. The level of interest rates, set by the Federal Reserve (Fed), also influences the DJIA as it affects the cost of credit, on which many corporations are heavily reliant. Therefore, inflation can be a major driver as well as other metrics which impact the Fed decisions.
Dow Theory is a method for identifying the primary trend of the stock market developed by Charles Dow. A key step is to compare the direction of the Dow Jones Industrial Average (DJIA) and the Dow Jones Transportation Average (DJTA) and only follow trends where both are moving in the same direction. Volume is a confirmatory criteria. The theory uses elements of peak and trough analysis. Dow’s theory posits three trend phases: accumulation, when smart money starts buying or selling; public participation, when the wider public joins in; and distribution, when the smart money exits.
There are a number of ways to trade the DJIA. One is to use ETFs which allow investors to trade the DJIA as a single security, rather than having to buy shares in all 30 constituent companies. A leading example is the SPDR Dow Jones Industrial Average ETF (DIA). DJIA futures contracts enable traders to speculate on the future value of the index and Options provide the right, but not the obligation, to buy or sell the index at a predetermined price in the future. Mutual funds enable investors to buy a share of a diversified portfolio of DJIA stocks thus providing exposure to the overall index.
-
16:27
Gold Price Forecast: XAU/USD trades around $2,930 amid escalating trade war
XAU/USD Current price: $2,929.08
- Trade war tensions and poor United States data put the USD into sell-off mode.
- The European Central Bank will announce its monetary policy decision on Thursday.
- XAU/USD resumed its advance and aims to retest record highs.
XAU/USD trades near a fresh weekly high of $2,929.65, with higher highs in sight. The bright metal benefited from the broad US Dollar’s (USD) weakness, the latter affected by tepid United States (US) data and President Donald Trump’s massive tariffs in trade partners.
President Trump addressed Congress late on Tuesday and played down the potential negative effects of his latest round of tariffs. “. There'll be a little disturbance, but we're okay with that. It won't be much,” Trump said, adding that reciprocal tariffs on trading partners will come into effect on April 2
Still, US Commerce Secretary Howard Lutnick suggested Trump’s administration may reduce or even roll back tariffs on the two neighbouring countries, spurring risk appetite throughout the first half of the day and harming the USD.
The Greenback fell further after the release of the US ADP Employment Change report, showing that the private sector added 77K new positions in February, much worse than the previous 183K or the expected 140K. The ISM Services Purchasing Managers’ Index (PMI), on the other contrary, jumped to 53.5 in February from 52.8 in the previous month while surpassing expectations of 52.6.
The focus now shifts to the European Central Bank (ECB) expected to deliver another 25 basis points (bps) interest rates cut when it announces its decision on monetary policy on Thursday. Other than that, investors will keep an eye on trade-war developments.
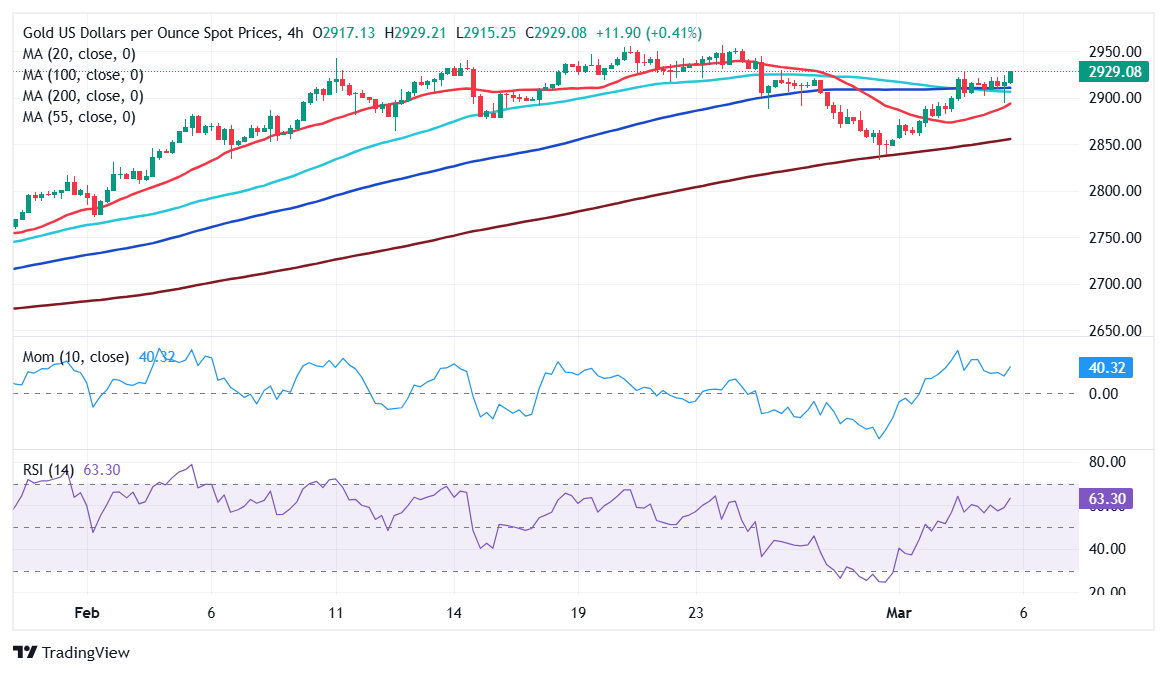
XAU/USD short-term technical outlook
The daily chart for XAU/USD shows it trades around its daily opening, while an intraday dip was quickly reverted, suggesting buyers are taking advantage of dips. The same chart shows Gold develops above all its moving averages, with a flat 20 Simple Moving Average (SMA) providing near-term support at around $2,906.25. Technical indicators, in the meantime, have turned directionless, with the Momentum indicator stuck around its 100 level.
The near-term picture shows the risk skews to the upside. In the 4-hour chart, XAU/USD pair is holding at the upper end of its recent range while advancing above all its moving averages. A bullish 20 SMA provides intraday support in the $2,890 area, while advancing below a still flat 100 SMA. Finally technical indicators turned firmly north within positive levels, reflecting persistent buying interest.
Support levels: 2,894.25 2,876.90 2,858.70
Resistance levels: 2,927.90 2,941.40 2,956.10
-
16:00
Russia Unemployment Rate came in at 2.4%, above expectations (2.3%) in January
-
15:38
EUR/USD Price Analysis: Bulls tighten grip as pair surges to multi-month highs
- EUR/USD extended its rally after the European session, trading near fresh multi-month highs above key moving averages.
- The pair has surged more than 3.70% in the week, shifting the outlook decisively in favor of buyers.
EUR/USD gained significant ground on Wednesday, pushing further into bullish territory after an already strong performance in recent sessions. The pair saw renewed demand during the European session, soaring to its highest level since November. With price action now firmly above the 20, 100, and 200-day Simple Moving Averages (SMAs), buyers appear to be in control, reinforcing an upward bias.
Technical indicators reflect this bullish momentum. The Relative Strength Index (RSI) is rising sharply and hovers near overbought territory, suggesting strong buying pressure. Meanwhile, the Moving Average Convergence Divergence (MACD) has printed a fresh green bar, further confirming the shift in sentiment. Given the magnitude of recent gains, a period of consolidation or mild pullback cannot be ruled out in the short term.
Looking at key levels, immediate resistance is seen near 1.0730, a zone that could determine whether the bullish run extends further. On the downside, initial support lies around 1.0505, with stronger buying interest expected near the 100-day SMA. A move below these levels could indicate a pause in bullish momentum, though the broader outlook remains positive as long as price action holds above key trend-defining SMAs.
EUR/USD daily chart
-
15:32
BoE’s Pill: Size and pace of further easing will hinge on inflation
BoE’s Chief Economist Huw Pill spoke before lawmakers in Parliament.
Key Quotes
We do need to remain vigilant to new shocks that might hurt path back to 2% inflation.
Evidence points against more rapid cuts in bank for me.
Further progress in disinfaltion would permit further cuts this year.
Size and pace of cuts will depend on how inflation risks evolve.
-
15:30
United States EIA Crude Oil Stocks Change above forecasts (-0.29M) in February 28: Actual (3.614M)
-
15:21
GBP/USD surges as weak US data fuels Fed rate-cut bets
- US ADP Employment misses expectations, adding just 77K jobs in February.
- ISM Services PMI improves to 53.5, but rising prices fuel inflation concerns.
- BoE officials signal caution on rate cuts, keeping GBP supported.
The Pound Sterling extended its gains versus the US Dollar on Wednesday, as market participants punished the latter. Market participants priced in additional monetary policy easing by the Federal Reserve. US data shows the economy is weakening, with businesses and consumers turning pessimistic, mostly on trade policies. The GBP/USD trades at 1.2864, up over 0.55%.
Sterling jumps 0.55% to 1.2864 as traders punish the US Dollar
The US jobs market continues to slow down, as depicted by the ADP Employment Change for February. Companies added 77K people to the workforce, missing estimates of 140K and well below the 188K hired in January.
In the meantime, the ISM Services PMI in February rose by 53.5, up from 52.8, exceeding forecasts of 52.6, an indication of business expansion. The Prices Paid sub-component rose sharply from 60.4 in January to 62.6, with New Orders and the Employment Index following suit.
GBP/USD traders have ignored the recent US data so far. Nevertheless, interest rate traders had priced in 74.5 basis points of Fed easing in 2025, down from the 81 bps expected a day ago.
Meanwhile, some Bank of England (BoE) members are crossing wires. Megan Greene commented that inflation is unlikely to persist and that it would fade at its own pace, though she added that policy needs to remain restrictive. BoE MPC member Alan Taylor said every meeting would be live for rate moves.
In the meantime, BoE Governor Bailey said they expect a pick-up in inflation. BoE Chief Economist Huw Pill added they need to remain vigilant and that evidence points against more rapid cuts in the Bank Rate.
The GBP/USD retreated somewhat on the headlines but remains within the 1.2850 – 1.2870 range.
GBP/USD Price Forecast: Technical outlook
The GBP/USD shifted from neutral to upward biased after clearing the 200-day Simple Moving Average (SMA) at 1.2786. A daily close would cement the uptrend and pave the way to challenge the 1.3000 mark. Otherwise, failure to close above the 200-day SMA will clear the way to test the 1.2700 figure.
Pound Sterling FAQs
The Pound Sterling (GBP) is the oldest currency in the world (886 AD) and the official currency of the United Kingdom. It is the fourth most traded unit for foreign exchange (FX) in the world, accounting for 12% of all transactions, averaging $630 billion a day, according to 2022 data. Its key trading pairs are GBP/USD, also known as ‘Cable’, which accounts for 11% of FX, GBP/JPY, or the ‘Dragon’ as it is known by traders (3%), and EUR/GBP (2%). The Pound Sterling is issued by the Bank of England (BoE).
The single most important factor influencing the value of the Pound Sterling is monetary policy decided by the Bank of England. The BoE bases its decisions on whether it has achieved its primary goal of “price stability” – a steady inflation rate of around 2%. Its primary tool for achieving this is the adjustment of interest rates. When inflation is too high, the BoE will try to rein it in by raising interest rates, making it more expensive for people and businesses to access credit. This is generally positive for GBP, as higher interest rates make the UK a more attractive place for global investors to park their money. When inflation falls too low it is a sign economic growth is slowing. In this scenario, the BoE will consider lowering interest rates to cheapen credit so businesses will borrow more to invest in growth-generating projects.
Data releases gauge the health of the economy and can impact the value of the Pound Sterling. Indicators such as GDP, Manufacturing and Services PMIs, and employment can all influence the direction of the GBP. A strong economy is good for Sterling. Not only does it attract more foreign investment but it may encourage the BoE to put up interest rates, which will directly strengthen GBP. Otherwise, if economic data is weak, the Pound Sterling is likely to fall.
Another significant data release for the Pound Sterling is the Trade Balance. This indicator measures the difference between what a country earns from its exports and what it spends on imports over a given period. If a country produces highly sought-after exports, its currency will benefit purely from the extra demand created from foreign buyers seeking to purchase these goods. Therefore, a positive net Trade Balance strengthens a currency and vice versa for a negative balance.
-
15:16
BoE’s Bailey: Second round inflation effects look less likely
BoE’s Governor Andrew Bailey testified before the Treasury Select Hearing.
Key Quotes
We do expect a pick-up in inflation, it will be nothing like a few years ago.
I think it's less likely we will get 2nd round inflation effects due to weakening economy.
-
15:05
US ISM Services PMI rises to 53.5 in February vs. 52.6 expected
- ISM Services PMI improved to 53.5 in January.
- US Dollar stays under heavy selling pressure despite the upbeat PMI report.
The economic activity in the US service sector continued to expand an accelerating pace in February, with the ISM Services PMI rising to 53.5 from 52.8 in January. This reading came in above the market expectation of 52.6.
Other details of the report showed that the Prices Paid Index, the inflation component, rose to 62.6 from 60.4, while the Employment Index improved to 53.9 from 52.3.
Market reaction
The US Dollar struggles to benefit from the upbeat ISM Services PMI data. At the time of press, the US Dollar Index was down 0.9% on the day at 104.55.
-
15:00
United States Factory Orders (MoM) above expectations (1.6%) in January: Actual (1.7%)
-
15:00
United States ISM Services Prices Paid came in at 62.6, above forecasts (60) in February
-
15:00
United States ISM Services PMI above expectations (52.6) in February: Actual (53.5)
-
15:00
United States ISM Services Employment Index climbed from previous 52.3 to 53.9 in February
-
15:00
United States ISM Services New Orders Index increased to 52.2 in February from previous 51.3
-
14:45
United States S&P Global Composite PMI came in at 51.6, above forecasts (50.4) in February
-
14:45
United States S&P Global Services PMI came in at 51, above forecasts (49.7) in February
-
14:41
Silver Price Forecast: XAG/USD struggles around $32.40 while global trade war intensifies
- Silver price strives to break above $32.40, getting support from the global trade war consistently.
- Growing concerns over the US economic outlook have weighed on the US Dollar.
- Soft ADP Employment data for February would prompt Fed dovish bets.
Silver price (XAG/USD) struggles to extend its upside above the key resistance of $32.40 in Wednesday’s North American session. The white metal remains broadly firm as United States (US) President Donald Trump-led-global trade war has intensified due to counter-tariffs on China, Canada, and Mexico.
Escalating trade war tensions have increased uncertainty over the global economic outlook. Such a scenario improves the appeal of precious metals such as Silver.
Meanwhile, a sharp sell-off in the US Dollar (USD) is also a favorable scenario for the Silver price. The US Dollar Index (DXY), which tracks the Greenback’s value against six major currencies, plunges to near 104.50, the lowest level seen in almost four months. The Greenback weakens as investors worry about the US economic outlook due to escalating tariff war.
During North American trading hours on Wednesday, weak US ADP Employment Change data for February has also weighed on the US Dollar. The ADP reported that private employers added 77K fresh workers, lower than estimates of 140K and the former release of 186K. Soft labor demand in the US private sector is expected to prompt Fed dovish bets, which had already increased lately.
According to the CME FedWatch tool, the likelihood for the Fed to reduce interest rates in June has increased to 85% from 70% recorded a week ago.
Silver technical analysis
Silver price moves higher to near the key resistance of $32.40 plotted from the December 12 high. The asset climbs above the 20-day Exponential Moving Average (EMA), which trades around $31.85.
The 14-day Relative Strength Index (RSI) oscillates inside the 40.00-60.00 range, suggesting a sideways trend.
Looking down, the upward-sloping trendline from the August 8 low of $26.45 will act as key support for the Silver price around $30.00. While, the February 14 high of $33.40 will be the key barrier.
Silver daily chart
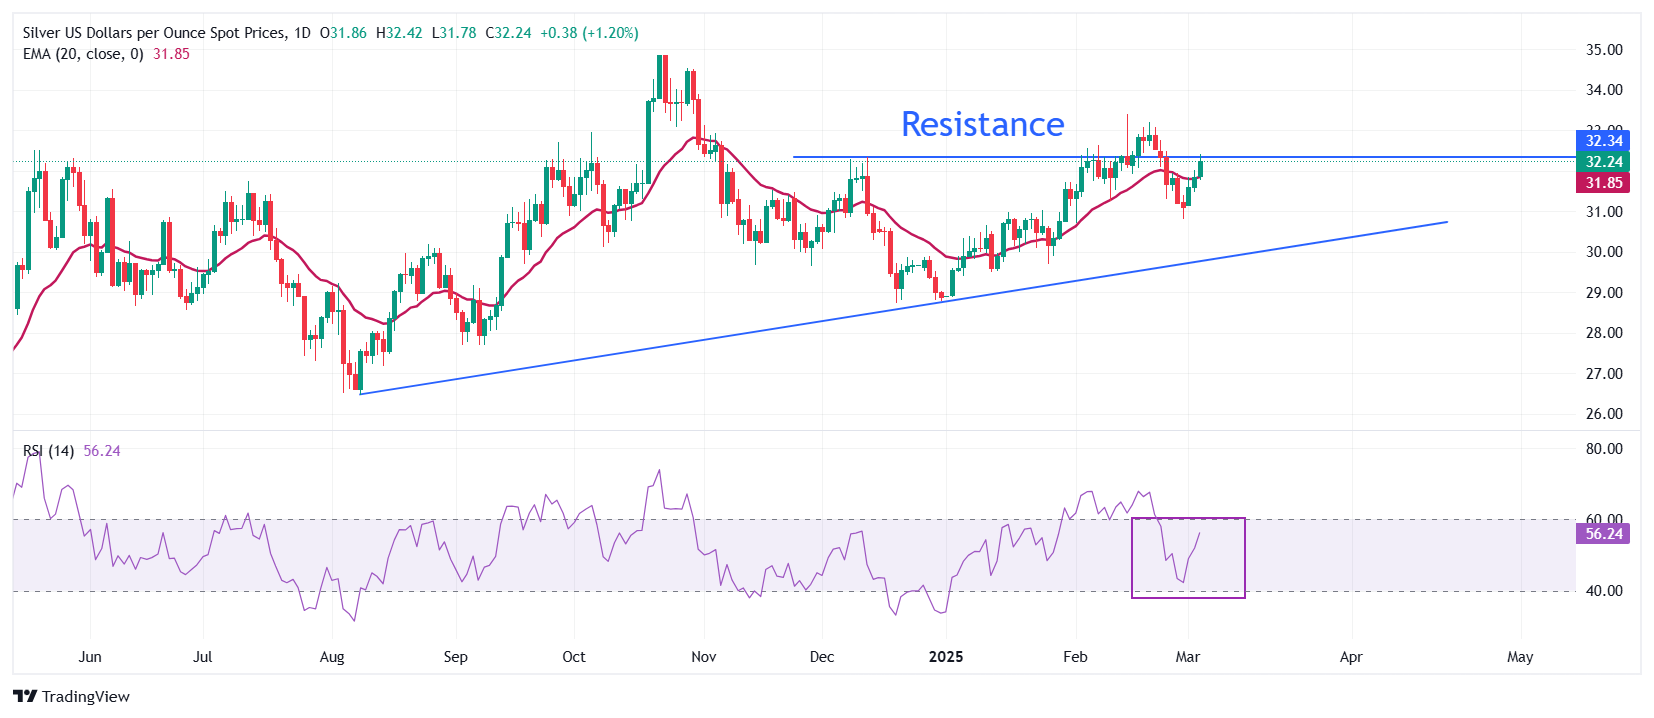
Silver FAQs
Silver is a precious metal highly traded among investors. It has been historically used as a store of value and a medium of exchange. Although less popular than Gold, traders may turn to Silver to diversify their investment portfolio, for its intrinsic value or as a potential hedge during high-inflation periods. Investors can buy physical Silver, in coins or in bars, or trade it through vehicles such as Exchange Traded Funds, which track its price on international markets.
Silver prices can move due to a wide range of factors. Geopolitical instability or fears of a deep recession can make Silver price escalate due to its safe-haven status, although to a lesser extent than Gold's. As a yieldless asset, Silver tends to rise with lower interest rates. Its moves also depend on how the US Dollar (USD) behaves as the asset is priced in dollars (XAG/USD). A strong Dollar tends to keep the price of Silver at bay, whereas a weaker Dollar is likely to propel prices up. Other factors such as investment demand, mining supply – Silver is much more abundant than Gold – and recycling rates can also affect prices.
Silver is widely used in industry, particularly in sectors such as electronics or solar energy, as it has one of the highest electric conductivity of all metals – more than Copper and Gold. A surge in demand can increase prices, while a decline tends to lower them. Dynamics in the US, Chinese and Indian economies can also contribute to price swings: for the US and particularly China, their big industrial sectors use Silver in various processes; in India, consumers’ demand for the precious metal for jewellery also plays a key role in setting prices.
Silver prices tend to follow Gold's moves. When Gold prices rise, Silver typically follows suit, as their status as safe-haven assets is similar. The Gold/Silver ratio, which shows the number of ounces of Silver needed to equal the value of one ounce of Gold, may help to determine the relative valuation between both metals. Some investors may consider a high ratio as an indicator that Silver is undervalued, or Gold is overvalued. On the contrary, a low ratio might suggest that Gold is undervalued relative to Silver.
-
14:39
BoE’s Greene: Appropriate to maintain cautious approach to removing monetary restrictiveness
While testifying before the U Treasury Select Committee on Wednesday, Bank of England (BoE) policymaker Megan Greene said it is appropriate to maintain a cautious and gradual approach to removing monetary restrictiveness, as reported by Reuters.
"It's likely inflation persistence will fade on its own accord," Greene added and reiterated that it is more likely the monetary policy will need to remain restrictive.
Market reaction
GBP/USD preserves its bullish momentum and trades at its highest level since early November above 1.2850.
Pound Sterling FAQs
The Pound Sterling (GBP) is the oldest currency in the world (886 AD) and the official currency of the United Kingdom. It is the fourth most traded unit for foreign exchange (FX) in the world, accounting for 12% of all transactions, averaging $630 billion a day, according to 2022 data. Its key trading pairs are GBP/USD, also known as ‘Cable’, which accounts for 11% of FX, GBP/JPY, or the ‘Dragon’ as it is known by traders (3%), and EUR/GBP (2%). The Pound Sterling is issued by the Bank of England (BoE).
The single most important factor influencing the value of the Pound Sterling is monetary policy decided by the Bank of England. The BoE bases its decisions on whether it has achieved its primary goal of “price stability” – a steady inflation rate of around 2%. Its primary tool for achieving this is the adjustment of interest rates. When inflation is too high, the BoE will try to rein it in by raising interest rates, making it more expensive for people and businesses to access credit. This is generally positive for GBP, as higher interest rates make the UK a more attractive place for global investors to park their money. When inflation falls too low it is a sign economic growth is slowing. In this scenario, the BoE will consider lowering interest rates to cheapen credit so businesses will borrow more to invest in growth-generating projects.
Data releases gauge the health of the economy and can impact the value of the Pound Sterling. Indicators such as GDP, Manufacturing and Services PMIs, and employment can all influence the direction of the GBP. A strong economy is good for Sterling. Not only does it attract more foreign investment but it may encourage the BoE to put up interest rates, which will directly strengthen GBP. Otherwise, if economic data is weak, the Pound Sterling is likely to fall.
Another significant data release for the Pound Sterling is the Trade Balance. This indicator measures the difference between what a country earns from its exports and what it spends on imports over a given period. If a country produces highly sought-after exports, its currency will benefit purely from the extra demand created from foreign buyers seeking to purchase these goods. Therefore, a positive net Trade Balance strengthens a currency and vice versa for a negative balance.
-
13:34
AUD/USD struggles to perform despite sheer weakness in US Dollar
- AUD/USD is marginally higher even though the US Dollar has faced strong selling pressure.
- The US private sector added fewer job-seekers in February.
- The US-China trade war has exerted significant pressure on the Australian Dollar.
The AUD/USD pair is slightly higher to near 0.6280 in North American trading hours on Wednesday. The Aussie pair is trading higher while the US Dollar (USD) plunges due to multiple headwinds, such as an intensifying trade war and escalating Federal Reserve (Fed) dovish bets.
The Australian Dollar (AUD) is facing significant selling pressure amid a trade war between China and the United States (US). China has announced retaliatory tariffs on the US, resulting in an escalation in trade war between them. Earlier, US President Donald Trump had imposed an additional 10% tariff on China, along with 25% on Canada and Mexico, for pouring drugs into the US economy.
The Aussie Dollar is also the victim of the US-China trade war, knowing that the Australian economy relies heavily on exports to China. Higher tariffs on China have made Chinese products less competitive globally.
Domestically, the Reserve Bank of Australia (RBA) is unlikely to cut interest rates again soon as its battle against inflation is not over. RBA's minutes for the February policy meeting showed that it reduced the Official Cash Rate (OCR) by 25 basis points (bps) to 4.10%.
Meanwhile, soft ADP Employment data for February is expected to exert more pressure on the US Dollar. The ADP reported that private employers added 77K fresh workers, lower than estimates of 140K and the former release of 186K. Soft labor demand in the US private sector is expected to prompt Fed dovish bets, which had already increased due to weak Personal Spending data for January.
For more information about the current status of US employment, investors will focus on the Nonfarm Payrolls (NFP) data for February, which will be released on Friday.
Australian Dollar FAQs
One of the most significant factors for the Australian Dollar (AUD) is the level of interest rates set by the Reserve Bank of Australia (RBA). Because Australia is a resource-rich country another key driver is the price of its biggest export, Iron Ore. The health of the Chinese economy, its largest trading partner, is a factor, as well as inflation in Australia, its growth rate and Trade Balance. Market sentiment – whether investors are taking on more risky assets (risk-on) or seeking safe-havens (risk-off) – is also a factor, with risk-on positive for AUD.
The Reserve Bank of Australia (RBA) influences the Australian Dollar (AUD) by setting the level of interest rates that Australian banks can lend to each other. This influences the level of interest rates in the economy as a whole. The main goal of the RBA is to maintain a stable inflation rate of 2-3% by adjusting interest rates up or down. Relatively high interest rates compared to other major central banks support the AUD, and the opposite for relatively low. The RBA can also use quantitative easing and tightening to influence credit conditions, with the former AUD-negative and the latter AUD-positive.
China is Australia’s largest trading partner so the health of the Chinese economy is a major influence on the value of the Australian Dollar (AUD). When the Chinese economy is doing well it purchases more raw materials, goods and services from Australia, lifting demand for the AUD, and pushing up its value. The opposite is the case when the Chinese economy is not growing as fast as expected. Positive or negative surprises in Chinese growth data, therefore, often have a direct impact on the Australian Dollar and its pairs.
Iron Ore is Australia’s largest export, accounting for $118 billion a year according to data from 2021, with China as its primary destination. The price of Iron Ore, therefore, can be a driver of the Australian Dollar. Generally, if the price of Iron Ore rises, AUD also goes up, as aggregate demand for the currency increases. The opposite is the case if the price of Iron Ore falls. Higher Iron Ore prices also tend to result in a greater likelihood of a positive Trade Balance for Australia, which is also positive of the AUD.
The Trade Balance, which is the difference between what a country earns from its exports versus what it pays for its imports, is another factor that can influence the value of the Australian Dollar. If Australia produces highly sought after exports, then its currency will gain in value purely from the surplus demand created from foreign buyers seeking to purchase its exports versus what it spends to purchase imports. Therefore, a positive net Trade Balance strengthens the AUD, with the opposite effect if the Trade Balance is negative.
-
13:33
US Commerce Secretary Lutnick: We expect rates to come down if we balance the budget
In an interview with Bloomberg TV on Wednesday, US Commerce Secretary Howard Lutnick said that they will make an announcement on Canada and Mexico tariffs later in the day, adding that they will be "in the middle somewhere."
Key takeaways
"If Canada can stop fentanyl, US President Donald Trump is open-minded."
"Trump is thinking about what sectors he can maybe consider giving Canada relief."
"Trump will make the decision. It will be 25% but maybe some categories will be left out."
"Not seeing companies put plans on hold because of tariffs."
"We have to do our work before we announce reciprocal tariff plan on April 2."
"Some tariffs will come on right away, others will come in due course."
"We expect interest rates to come down if we balance the budget."
Market reaction
The US Dollar (USD) stays under selling pressure following these comments. At the time of press, the USD Index was down 0.6% on the day at 104.90.
-
13:30
Canada Labor Productivity (QoQ) meets forecasts (0.6%) in 4Q
-
13:15
United States ADP Employment Change registered at 77K, below expectations (140K) in February
-
13:02
GBP pulled through 200-day MA by softer USD tone – Scotiabank
Pound Sterling (GBP) is enjoying the ride provided by the generally softer USD and the additional tow from the EUR lifting its European peers, Scotiabank's Chief FX Strategist Shaun Osborne notes.
Sterling gains push through Cable’s 200-day MA
"UK PMI data was left largely unchanged from the preliminary reports; February Services activity was marked down a tenth to 51.0 while the Composite index was left unchanged at 50.5."
"Sterling gains have pushed through Cable’s 200-day MA (1.27896) and retracement resistance at 1.2764 (50% Fib of the September/January decline). Look for support on dips to the upper 1.27s from here and a further push on towards 1.29."
-
13:00
EUR jumps on the day – Scotiabank
The EUR advance has extended today as Germany’s fiscal reset promises massive spending increases on defence and infrastructure, Scotiabank's Chief FX Strategist Shaun Osborne notes.
Eurozone yields surge on higher German government spending
"Ramped up spending means higher government borrowing and higher domestic yields; 10Y bund yields jumped more than 20bps today before easing back slightly, dragging broader European yields along for the ride."
"The sudden emergence of a possible Ukraine/US minerals deal late yesterday added to positive EUR sentiment. EZ/US 2Y spreads have narrowed to –179bps, thew narrowest since October when spot was trading around 1.08. There may be a little more upside in the EUR to come."
"Spot gains have extended quickly this week to test the EUR’s 200-day MA (1.0722) as expected. Spot gains have moderated after testing the 200-day benchmark, however and may settle back in the short run to digest recent gains. There is solid underlying momentum behind EUR gains on the short-term oscillators, however, which suggests limited downside potential and more upside risk (towards 1.08) in the short run. Look for firm support on dips to the 1.06 area."
-
12:57
CAD holds range on the day – Scotiabank
So, the 25% tariff regime might have had a very short shelf life after all and we might be looking at low double digit border tariffs now, Scotiabank's Chief FX Strategist Shaun Osborne notes.
Market awaits developments
"That’s still not great, only relatively less painful. But it might be about where markets have priced broader tariff risks into the Canadian Dollar (CAD) at this point which means downward pressure on the CAD may ease as we assess the outlook for additional tariffs moving forward. The CAD has gained little in overnight trade after rallying into the close yesterday and may struggle to push much higher while tariff uncertainty persists."
"A rebound in risk appetite and narrower US/ Canada spreads are modest tailwinds for the CAD but rightsizing spot to its estimated fair value equilibrium (currently 1.4224) may have to wait for clarity on what the ultimate tariff regime facing Canada looks like. Note markets have pared expectations for next week’s BoC policy decision somewhat, pricing in 18-19bps of cuts, from all but fully pricing in a 1/4 -point cut yesterday."
"Spot has swung sharply between 1.4370 and 1.4545 since the start of the week, defining near-term ranges. Those ranges are holding this morning, with the market reluctant to lean too hard on USD/CAD. A break under 1.4350/70 should drive spot lower, potentially towards 1.4200/50 on a range extension trade, however."
-
12:54
USD trades broadly lower – Scotiabank
After Tariffs Tuesday, we’ve arrived at Walkback Wednesday, it would seem. Commerce Sec. Lutnick provided some relief for markets last night when he suggested that President Trump might offer concessions to Canada and Mexico, perhaps 'meeting them halfway' on 25% border tariffs today. That follows this week’s stock market slump and the president’s comment in his remarks to Congress last night that tariffs would cause a little 'disturbance' for Americans, Scotiabank's Chief FX Strategist Shaun Osborne notes.
The US hints at concessions on border tariffs
"This is no 'all clear' on tariffs, at least not yet. And it remains to be seen whether Lutnick has the president’s ear or not. Even if 25% tariffs are rolled back somewhat today, additional steel/aluminum and reciprocal tariff action is likely in the next few weeks. Messaging from markets and US industry about the consequences of punishing border tariffs just might be resonating with the White House, however."
"Stocks have rallied and strongly so in Europe with gains turbocharged by the shift in fiscal policy in Germany while the USD continues to track its 2017/Trump 1.0 experience with another sharp fall today. Along with a jump in European stocks, Eurozone bonds have tumbled, driving yields significantly higher on Germany’s increased spending plans."
"There is plenty of headline risk to focus on at the moment, but we are also getting to the meatier part of the week for US data releases—ADP, ISM and factory orders today, ahead of NFP on Friday. US growth concerns are rising and it seems only a matter of time before forecasts start to reduce expectations materially. Softening growth trends plus resilient inflation risks may be reflected in the Beige Book release this afternoon."
-
12:43
US Dollar correction continues with DXY Index at four-month low
- The US Dollar drops against most major peers for a third day in a row.
- Traders are selling the US Dollar in favor of the Euro amid economic developments in the US.
- The US Dollar Index DXY faces over 2% devaluation so far this week.
The US Dollar Index (DXY), which tracks the performance of the US Dollar (USD) against six major currencies, extends its decline for the third day in a row this week and trades near 105.00 at the time of writing on Wednesday, the lowest level since early November. The downward move comes as traders further unwind their overall Dollar exposure now that several analysts are calling the end of the United States (US) exceptionalism amid concerns that US President Donald Trump’s tariffs could damage economic growth. The move comes ahead of the European Central Bank (ECB) rate decision on Thursday and the US Nonfarm Payrolls report for February on Friday.
On the economic data front, more negativeness for the US Dollar could be on the horizon. The Institute for Supply Management (ISM) is set to release its report on the Services sector on Wednesday. At the start of the week on Monday, the ISM report on the Manufacturing sector set in motion the correction in the Greenback, which only accelerated further since then.
Daily digest market movers: Services sector to save the day?
- At 13:15 GMT, the usual appetizer ahead of the Nonfarm Payrolls is due with the ADP Employment Change number for February. Expectations are for 140,000 new employees in the private sector, below the 183,000 in January.
- At 14:45 GMT, S&P Global will release its final reading for the Purchasing Managers Index (PMI) on the Services sector. Expectations are for a steady 49.7.
- At 15:00 GMT, the ISM is ready to release its PMI report on the Services sector for February:
- Services PMI is expected to come in at 52.6, a touch softer than the previous 52.8.
- The economic calendar does not show expectations regarding the Employment component, which was 52.3 in January.
- The New Orders component has no consensus view and was at 51.3 previously.
- At 18:00 GMT, Federal Reserve Bank of Richmond President Thomas Barkin delivers a speech titled "Inflation Then and Now" at the Fredericksburg Regional Alliance in Fredericksburg, United States.
- At 19:00 GMT, the Federal Reserve will release the Beige Book, which reports on the current US economic situation.
- Equities are on the rebound, with green spurts across the board from Asia over Europe and into the US futures.
- The CME Fedwatch Tool projects a 21.0% chance that interest rates will remain at the current range of 4.25%-4.50% in June, with the rest showing a possible rate cut.
- The US 10-year yield trades around 4.26%, off its near five-month low of 4.10% printed on Tuesday.
US Dollar Index Technical Analysis: DXY not a fan of tariffs
The US Dollar Index (DXY) is not enjoying this week, that is for sure. The DXY sees bulls exiting the premises, which gives the US Dollar bears good cards to run the Greenback into the ground. With more and more calls for lower US rates while US economic data further deteriorates, it looks like the DXY might be on its way even to 103.00 in the near term if this selling pressure keeps persisting.
On the upside, the first upside target to recover is the pivotal level at 105.53. Once through there, a heavy job awaits with pivotal levels at 105.89 and 106.52 before bulls start to consider a visit to the 100-day Simple Moving Average (SMA) at 106.87.
On the downside, the 200-day SMA at 105.03 is identified as the first support level, which is being tested at the time of writing. Should that level snap, a long stretch opens up towards 104.00. Even 103.00 could come under consideration in case US yields roll off further.
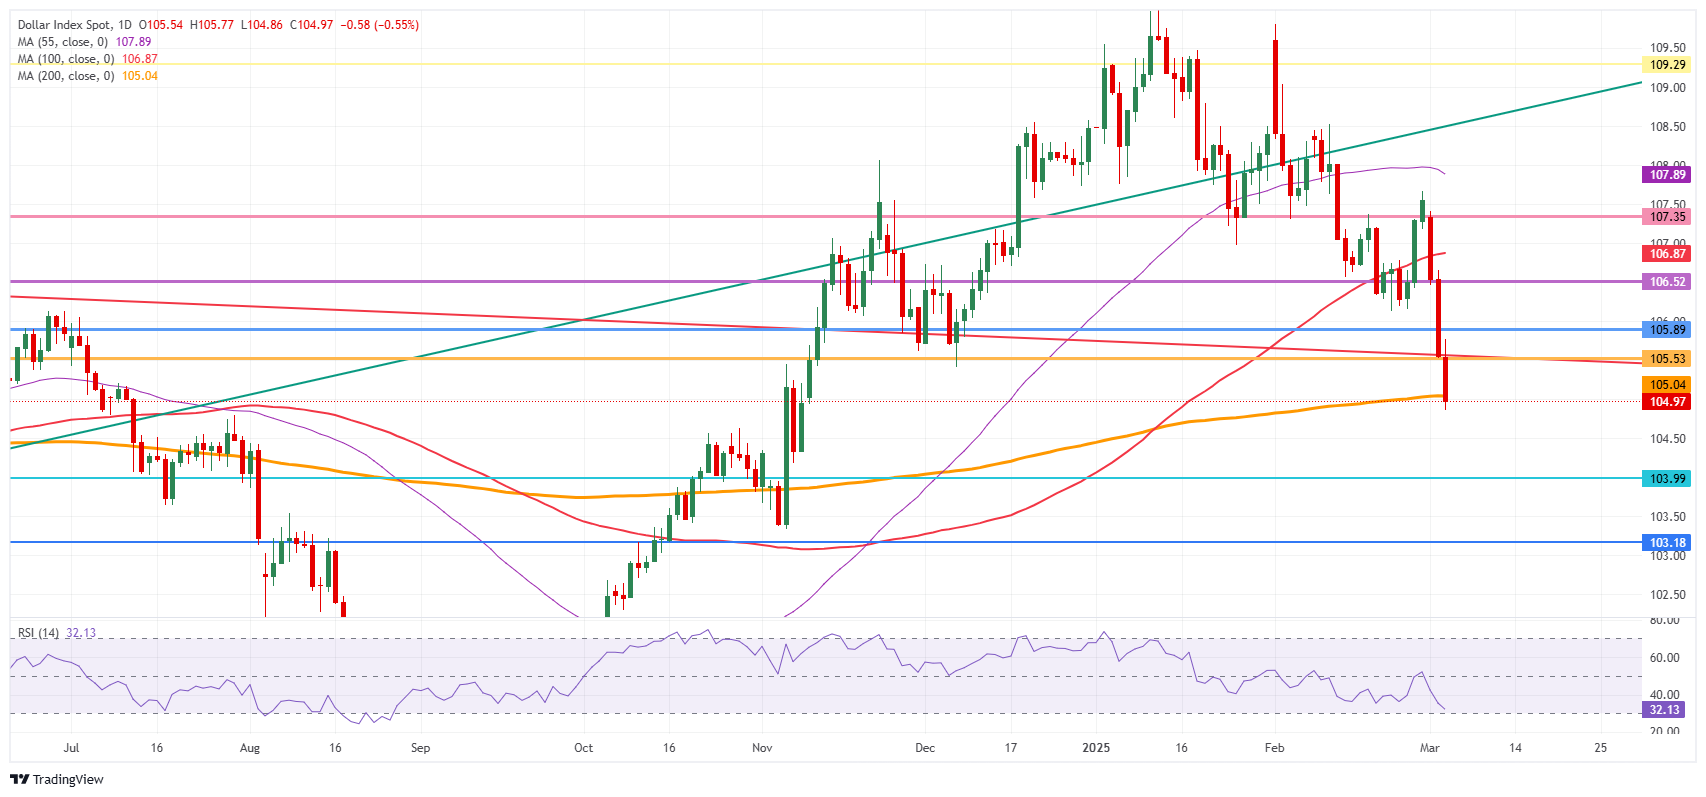
US Dollar Index: Daily Chart
US-China Trade War FAQs
Generally speaking, a trade war is an economic conflict between two or more countries due to extreme protectionism on one end. It implies the creation of trade barriers, such as tariffs, which result in counter-barriers, escalating import costs, and hence the cost of living.
An economic conflict between the United States (US) and China began early in 2018, when President Donald Trump set trade barriers on China, claiming unfair commercial practices and intellectual property theft from the Asian giant. China took retaliatory action, imposing tariffs on multiple US goods, such as automobiles and soybeans. Tensions escalated until the two countries signed the US-China Phase One trade deal in January 2020. The agreement required structural reforms and other changes to China’s economic and trade regime and pretended to restore stability and trust between the two nations. However, the Coronavirus pandemic took the focus out of the conflict. Yet, it is worth mentioning that President Joe Biden, who took office after Trump, kept tariffs in place and even added some additional levies.
The return of Donald Trump to the White House as the 47th US President has sparked a fresh wave of tensions between the two countries. During the 2024 election campaign, Trump pledged to impose 60% tariffs on China once he returned to office, which he did on January 20, 2025. With Trump back, the US-China trade war is meant to resume where it was left, with tit-for-tat policies affecting the global economic landscape amid disruptions in global supply chains, resulting in a reduction in spending, particularly investment, and directly feeding into the Consumer Price Index inflation.
-
12:28
India M3 Money Supply: 9.6% (February 17) vs previous 9.8%
-
12:00
United States MBA Mortgage Applications up to 20.4% in February 28 from previous -1.2%
-
11:11
NZD/USD gains to near 0.5680 as US Dollar continues to underperform
- NZD/USD bounces back and turns positive to near 0.5680 as the US Dollar faces a strong sell-off.
- Investors assess the US economic outlook amid an escalating global trade war.
- RBNZ Adrian Orr resigned before the completion of his second five-year term
The NZD/USD pair recovers its intraday losses and turns positive in European trading hours on Wednesday. The Kiwi pair rises to near 0.5680 as the US Dollar (USD) extends its downside, with investors assessing the United States (US) economic outlook amid intensifying President Donald Trump-led-global trade war.
The US Dollar Index (DXY), which tracks the Greenback’s value against six major currencies, slumps to near 105.00. Investors expect the inflationary impact of Trump’s tariffs will reduce the purchasing power of individuals. Such a scenario would weigh on economic growth.
China has announced retaliatory tariffs on the US for imposing an additional 10% levies on them, which went into effect on Tuesday. The consequences of escalation in trade war between China and the US will also be borne by the New Zealand (NZ), given its significant reliance on exports to China.
In the domestic region, Reserve Bank of New Zealand (RBNZ) Adrian Orr resigned three years before the completion of his second five-year term.
In Wednesday’s session, investors will focus on the US ADP Employment and the ISM Services PMI data for February, which will be published in the North American session. Economists expect private employers to have 140K fresh workers, lower than 183K payrolls seen in January. The Services OMI, which gauges activities in the services sector, is estimated to have fallen to 52.6 from 52.8 in January. The US economic data will influence market expectations for the Federal Reserve’s (Fed) monetary policy outlook.
New Zealand Dollar FAQs
The New Zealand Dollar (NZD), also known as the Kiwi, is a well-known traded currency among investors. Its value is broadly determined by the health of the New Zealand economy and the country’s central bank policy. Still, there are some unique particularities that also can make NZD move. The performance of the Chinese economy tends to move the Kiwi because China is New Zealand’s biggest trading partner. Bad news for the Chinese economy likely means less New Zealand exports to the country, hitting the economy and thus its currency. Another factor moving NZD is dairy prices as the dairy industry is New Zealand’s main export. High dairy prices boost export income, contributing positively to the economy and thus to the NZD.
The Reserve Bank of New Zealand (RBNZ) aims to achieve and maintain an inflation rate between 1% and 3% over the medium term, with a focus to keep it near the 2% mid-point. To this end, the bank sets an appropriate level of interest rates. When inflation is too high, the RBNZ will increase interest rates to cool the economy, but the move will also make bond yields higher, increasing investors’ appeal to invest in the country and thus boosting NZD. On the contrary, lower interest rates tend to weaken NZD. The so-called rate differential, or how rates in New Zealand are or are expected to be compared to the ones set by the US Federal Reserve, can also play a key role in moving the NZD/USD pair.
Macroeconomic data releases in New Zealand are key to assess the state of the economy and can impact the New Zealand Dollar’s (NZD) valuation. A strong economy, based on high economic growth, low unemployment and high confidence is good for NZD. High economic growth attracts foreign investment and may encourage the Reserve Bank of New Zealand to increase interest rates, if this economic strength comes together with elevated inflation. Conversely, if economic data is weak, NZD is likely to depreciate.
The New Zealand Dollar (NZD) tends to strengthen during risk-on periods, or when investors perceive that broader market risks are low and are optimistic about growth. This tends to lead to a more favorable outlook for commodities and so-called ‘commodity currencies’ such as the Kiwi. Conversely, NZD tends to weaken at times of market turbulence or economic uncertainty as investors tend to sell higher-risk assets and flee to the more-stable safe havens.
-
10:48
China: Domestic demand prioritised to offset tariffs – Standard Chartered
NPC set targets for growth at 5%, inflation 2%, official budget deficit 4% of GDP, largely as we expected. We expect the announced fiscal stimulus to partially offset the impact of US tariffs announced so far. We maintain our 2025 growth forecast at 4.5%; downside risk to be mitigated by additional stimulus, Standard Chartered's economists note.
Stimulus to be frontloaded, may be boosted if necessary
"The National People's Congress (NPC) meetings started today; Primer Li Qiang outlined China's economic and policy priorities for 2025 in the Government Work Report. Most of the announced numerical targets (Figure 1) were in line with our expectations. A supportive policy tone was maintained, consistent with the Central Economic Work Conference last December."
"Fiscal policy remains the focus of the market. While the official fiscal deficit was widened to 4% of GDP for 2025, the government bond issuance quota (CNY 11.86tn) was slightly lower than we expected. Pending further details on the budget report (especially other deficit-financing items), our forecast broad deficit remains 8.4% of GDP, c.1.3ppt higher than the 2024 implemented broad deficit. We think the current stimulus plan is insufficient to offset the latest US tariff hikes, and expect additional stimulus to be rolled out if H1 growth momentum indicates significant downside risks."
"The government emphasised its support for household consumption and income. In addition, it pledged to stabilise the property and stock markets, while keeping tech and green development as priorities. On the external front, the government plans to continue its ‘one way’ opening, despite rising protectionism globally."
-
10:47
Gold steadies after hints on possible tariff relief
- Gold tries to turn positive on the day after earlier losses in the Asian trading session.
- US Commerce Secretary Howard Lutnick hinted at some relief on the recent tariffs.
- US yields recovered a touch, though they still have a long road to recovery.
Gold’s price (XAU/USD) recovers its earlier losses in the Asian trading session and trades around $2,920 at the time of writing on Wednesday. With tariffs still in place and several more tariffs to come for Europe and other countries, Gold will remain the place to be in terms of safe haven.
However, some surprising comments from United States (US) Commerce Secretary Howard Lutnick overnight hinted that tariffs could already be eased or fully unwinded for Mexico and Canada. This pressures the upside for Gold for now.
Daily digest market movers: Already off again?
- Bullion was near $2,912 an ounce — about $40 shy of the all-time peak reached last week. Trump doubled tariffs on China and imposed 25% levies against Canada and Mexico. However, US Commerce Secretary Howard Lutnick hinted at some relief for the US’s two neighbors, telling Fox Business there could be a path to reduce some of the duties, Bloomberg reports.
- Zimbabwe’s Gold output jumped to 2,568 kg last month from 1,854 kg in the year-earlier period, Fidelity Gold Refinery says in an emailed statement, Reuters reports.
- Gold's extreme price dislocations are fading as tightness in the physical market eases, indicating a rush to ship bullion to America may have run its course, Bloomberg reports.
Technical Analysis: Riding into the ground
Bullion might face some pressure on Wednesday after its two-day strong recovery this week. The comments from Secretary Lutnick are putting longer-term safe haven flow for Gold a bit on loose screws. Traders will want to trim their positions in the idea that the US could, at any moment, unwind those tariffs, which would spark profit-taking in the precious metal.
While Gold trades near $2,920 at the time of writing, the daily Pivot Point at $2,909 and the daily R1 resistance at $2,936 are the levels to watch for this Wednesday, with the daily Pivot Point already back in the hands of the bulls. In case Gold sees more inflows, the daily R2 resistance at $2,955 will possibly be the final cap ahead of the all-time high of $2,956 reached on February 24.
On the downside, the S1 support at $2,890 converges with Monday’s high. That will be the vital support for this Wednesday. If Bullion bulls want to avoid another leg lower, that level must hold. Further down, the daily S2 support at $2,863 should be able to catch any additional downside pressure.
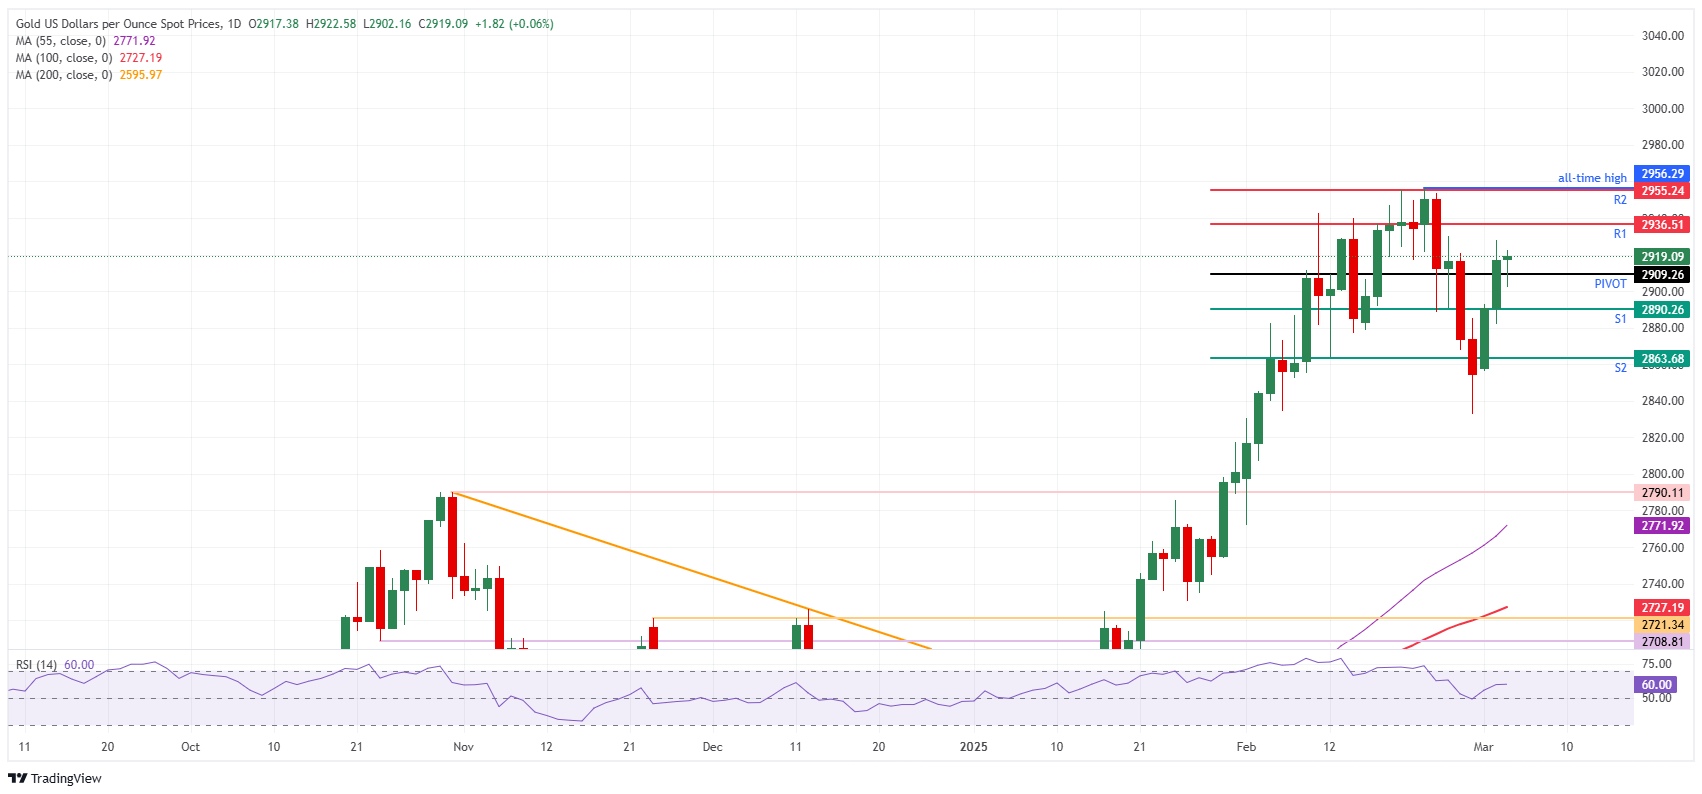
XAU/USD: Daily Chart
Gold FAQs
Gold has played a key role in human’s history as it has been widely used as a store of value and medium of exchange. Currently, apart from its shine and usage for jewelry, the precious metal is widely seen as a safe-haven asset, meaning that it is considered a good investment during turbulent times. Gold is also widely seen as a hedge against inflation and against depreciating currencies as it doesn’t rely on any specific issuer or government.
Central banks are the biggest Gold holders. In their aim to support their currencies in turbulent times, central banks tend to diversify their reserves and buy Gold to improve the perceived strength of the economy and the currency. High Gold reserves can be a source of trust for a country’s solvency. Central banks added 1,136 tonnes of Gold worth around $70 billion to their reserves in 2022, according to data from the World Gold Council. This is the highest yearly purchase since records began. Central banks from emerging economies such as China, India and Turkey are quickly increasing their Gold reserves.
Gold has an inverse correlation with the US Dollar and US Treasuries, which are both major reserve and safe-haven assets. When the Dollar depreciates, Gold tends to rise, enabling investors and central banks to diversify their assets in turbulent times. Gold is also inversely correlated with risk assets. A rally in the stock market tends to weaken Gold price, while sell-offs in riskier markets tend to favor the precious metal.
The price can move due to a wide range of factors. Geopolitical instability or fears of a deep recession can quickly make Gold price escalate due to its safe-haven status. As a yield-less asset, Gold tends to rise with lower interest rates, while higher cost of money usually weighs down on the yellow metal. Still, most moves depend on how the US Dollar (USD) behaves as the asset is priced in dollars (XAU/USD). A strong Dollar tends to keep the price of Gold controlled, whereas a weaker Dollar is likely to push Gold prices up.
-
10:33
Venezuelan oil supply at risk – ING
The oil market came under pressure again yesterday, with ICE Brent settling a little more than 0.8% lower. WTI is trading lower in early morning trading today, ING’s commodity analysts Warren Patterson and Ewa Manthey notes.
The oil market is currently under pressure
"The prospect of rising OPEC+ supply, combined with intensifying uncertainty over tariffs, hit oil market sentiment. Overnight, there were suggestions that the Trump administration is considering some tariff relief on imports from Canada and Mexico. But heightened uncertainty is sending investors to the sidelines. This is evidenced by a reduction in speculative positioning in both WTI and Brent in recent weeks."
"On the sanction front, the US administration has given Chevron until 3 April to wind down operations in Venezuela. Despite sanctions, Chevron previously had a license to operate in the country and export crude oil to the US. As production stops, 200k b/d of supply is at risk. This will leave US refiners looking for alternative heavy grades of crude oil just as other suppliers — Canada and Mexico — face tariffs."
"Numbers overnight from the American Petroleum Institute show US crude oil inventories fell by 1.5m barrels over the last week. On the product side, gasoline stocks declined by 1.2m barrels and distillate inventories increased by 1.1m barrels. It was a fairly neutral release. Even so, the market is more focused on tariffs at the moment."
-
10:32
USD/CNH: China's 2025 fiscal deficit target is highest in over three decades – BBH
USD/CNH is consolidating near recent lows around 7.2600. China boosts fiscal spending. In line with consensus, China raised its 2025 fiscal deficit target to the highest in over three decades to around 4% of GDP vs. 3% of GDP in 2024 and left its 2025 GDP growth target unchanged at around 5%, BBH's FX analysts report.
China boosts fiscal spending
"As part of the plan, China will sell 1.3 trillion yuan worth of special sovereign bonds vs. 1.0 trillion in 2024. The extra 300 billion yuan for 2025 will be used to finance a subsidy program for residents’ purchases of consumer goods, double the amount from 2024. China also announced 4.4 trillion yuan in local government special bonds for infrastructure and other public investments. This up from 4 yuan trillion in 2024."
"China reiterated its vague pledge to 'vigorously' boost consumption by increasing income and strengthening the social security system. But did not offer specific details. Rebalancing the economy away from investment toward domestic consumption has been an explicit goal of China since the December 2004 Central Economic Work Conference."
"However, three major structural constraints have prevented any meaningful effort to boost the role consumption plays in the economy: low household income levels, high precautionary savings, and high levels of household debt."
-
10:28
Pound Sterling demonstrates strength ahead of BoE Bailey’s testimony
- The Pound Sterling rises ahead of BoE Andrew Bailey’s testimony before Parliament's Treasury Committee.
- Investors worry that US President Trump’s tariff agenda could weigh on the US economic growth.
- Bloating Fed dovish bets have weighed on the US Dollar.
The Pound Sterling (GBP) trades higher against its major peers on Wednesday ahead of Bank of England (BoE) Governor Andrew Bailey’s testimony before Parliament's Treasury Committee scheduled at 14:30 GMT. Investors will pay close attention to Bailey’s testimony to get cues about the BoE’s monetary policy outlook.
In February’s policy meeting, the BoE reduced its borrowing rates by 25 basis points (bps) to 4.5% but guided a ‘cautious and gradual’ interest rate cut approach. The BoE warned that inflationary pressures could accelerate in the third quarter of the year due to higher energy prices before returning to the 2% path.
Traders expect the BoE to follow a moderate policy-easing cycle amid fears of inflationary pressures remaining persistently higher and see the central bank cutting interest rates two times more this year. Fears of elevated price pressures are based on the assumption that business owners will pass on the impact of higher employment cost in the face of an increase in employers’ contribution to National Insurance (NI) announced by Chancellor of the Exchequer Rachel Reeves in the Autumn Budget.
On the global front, market participants expect a nominal impact of United States (US) President Donald Trump’s tariffs on the United Kingdom (UK) economy, given that Britain has a trade surplus against the US. Also, after meeting with UK Prime Minister Keir Starmer last week, Trump said that a trade deal could be made "pretty quickly" where tariffs “wouldn't be necessary".
Daily digest market movers: Pound Sterling outperforms US Dollar
- The Pound Sterling jumps to near 1.2850 against the US Dollar (USD) in European trading hours on Wednesday, the highest level seen since November 12. The GBP/USD pair extends its winning streak for the third trading day due to continuous underperformance from the US Dollar. The US Dollar Index (DXY), which tracks the Greenback’s value against six major currencies, slumps to near 105.00.
- The US Dollar weakens as it loses its risk premium stemming from US President Trump’s tariff agenda. On Tuesday, 25% tariffs on Canada and Mexico, and an additional 10% on China came into effect for pouring drugs into the US economy.
- Market experts believe Trump’s tariffs could weaken households' overall spending, assuming that higher levies will be borne by US importers, who would pass on to end consumers. Such a scenario would diminish the purchasing power of individuals, forcing them to cut spending significantly.
- Meanwhile, escalating Federal Reserve (Fed) dovish bets have also contributed to weakness in the US Dollar. Fed dovish bets have swelled after a slew of weak US economic data. According to the CME FedWatch tool, the likelihood for the Fed to reduce interest rates in June has increased to 80% from 70% recorded a week ago.
- For more guidance on interest rates, investors will focus on the US Nonfarm Payrolls (NFP) data for February, which will be released on Friday. In Wednesday’s session, market participants will pay attention to the US ADP Employment Change and the ISM Services PMI for February, which will be published during the North American session.
Technical Analysis: Pound Sterling jumps above 50% Fibo retracement
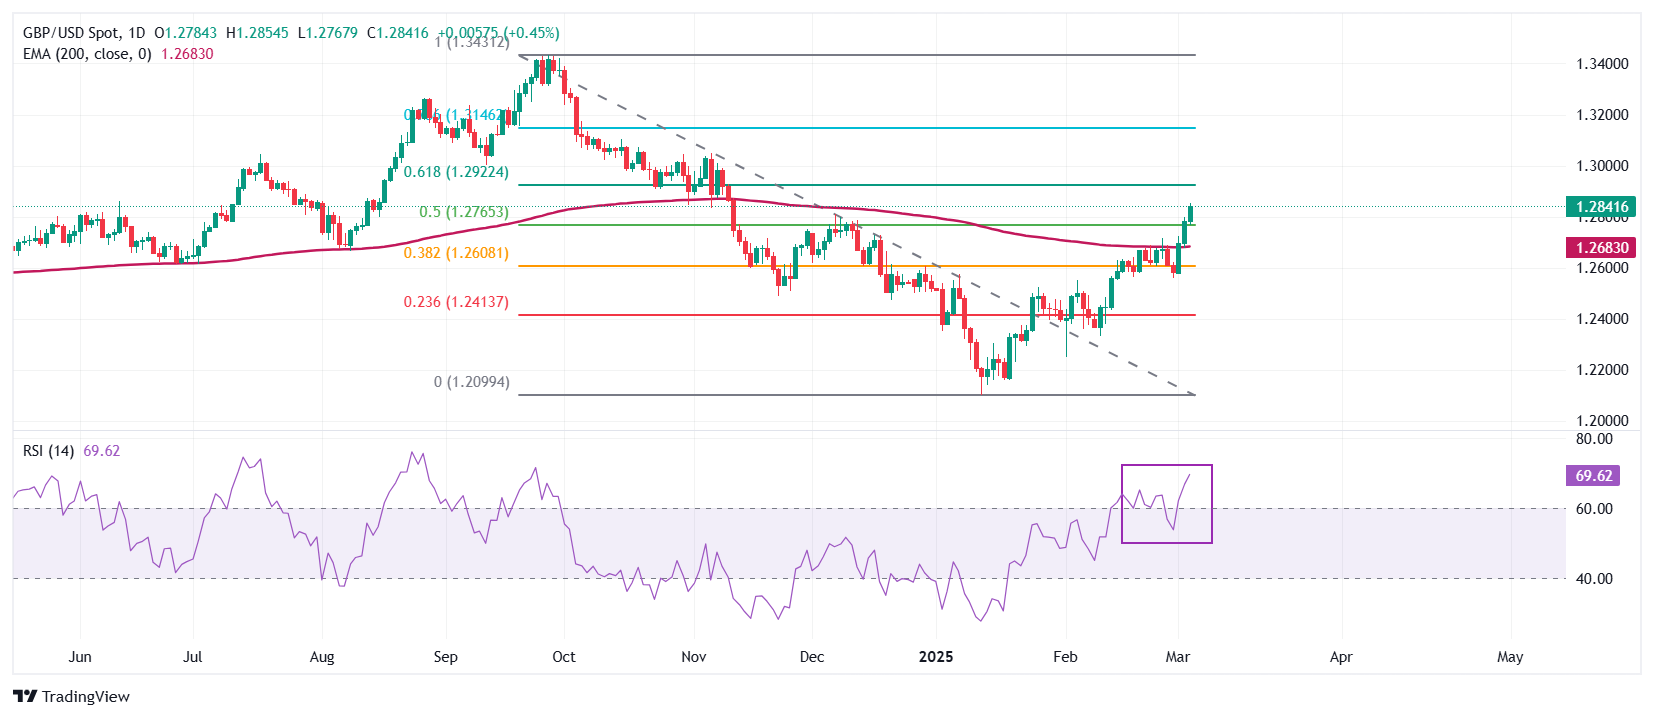
The Pound Sterling breaks above the 50% Fibonacci retracement level plotted from the late September high to mid-January low, around 1.2770. The long-term outlook of the GBP/USD pair has turned bullish as it climbs above the 200-day Exponential Moving Average (EMA), which is around 1.2680.
The 14-day Relative Strength Index (RSI) climbs above 60.00. A fresh bullish momentum would come into action if the RSI sustains above that level.
Looking down, the 38.2% Fibo retracement at 1.2608 will act as a key support zone for the pair. On the upside, the psychological 1.3000 level will act as a key resistance zone.
Pound Sterling FAQs
The Pound Sterling (GBP) is the oldest currency in the world (886 AD) and the official currency of the United Kingdom. It is the fourth most traded unit for foreign exchange (FX) in the world, accounting for 12% of all transactions, averaging $630 billion a day, according to 2022 data. Its key trading pairs are GBP/USD, also known as ‘Cable’, which accounts for 11% of FX, GBP/JPY, or the ‘Dragon’ as it is known by traders (3%), and EUR/GBP (2%). The Pound Sterling is issued by the Bank of England (BoE).
The single most important factor influencing the value of the Pound Sterling is monetary policy decided by the Bank of England. The BoE bases its decisions on whether it has achieved its primary goal of “price stability” – a steady inflation rate of around 2%. Its primary tool for achieving this is the adjustment of interest rates. When inflation is too high, the BoE will try to rein it in by raising interest rates, making it more expensive for people and businesses to access credit. This is generally positive for GBP, as higher interest rates make the UK a more attractive place for global investors to park their money. When inflation falls too low it is a sign economic growth is slowing. In this scenario, the BoE will consider lowering interest rates to cheapen credit so businesses will borrow more to invest in growth-generating projects.
Data releases gauge the health of the economy and can impact the value of the Pound Sterling. Indicators such as GDP, Manufacturing and Services PMIs, and employment can all influence the direction of the GBP. A strong economy is good for Sterling. Not only does it attract more foreign investment but it may encourage the BoE to put up interest rates, which will directly strengthen GBP. Otherwise, if economic data is weak, the Pound Sterling is likely to fall.
Another significant data release for the Pound Sterling is the Trade Balance. This indicator measures the difference between what a country earns from its exports and what it spends on imports over a given period. If a country produces highly sought-after exports, its currency will benefit purely from the extra demand created from foreign buyers seeking to purchase these goods. Therefore, a positive net Trade Balance strengthens a currency and vice versa for a negative balance.
-
10:26
USD/CNH: Decline is likely part of a lower range of 7.2400/7.2800 – UOB Group
Further US Dollar (USD) weakness vs Chinese Yuan (CNH) is not ruled out, but any decline is likely part of a lower range of 7.2400/7.2800. In the longer run, USD could remain under pressure but note the pair of strong supports at 7.2400 and 7.2260, UOB Group’s FX analysts Quek Ser Leang and Peter Chia note.
USD can remain under pressure
24-HOUR VIEW: "The sharp and swift selloff that sent USD plummeting by 0.69% (7.2535) was surprising. Note that the 0.69% drop is the second biggest one-day drop this year. The decline appears excessive, but with no signs of stabilisation just yet, further weakness is not ruled out. However, given the deeply oversold conditions, any decline is likely part of a lower range of 7.2400/7.2800."
1-3 WEEKS VIEW: Our latest narrative was from last Friday (28 Feb, spot at 7.2950), wherein the strong advance from last Thursday 'indicates there is potential for USD to rise to 7.3250.' In a sudden move yesterday, USD plunged to a low of 7.2485. The breach of our ‘strong support’ level at 7.2680 has invalidated our view. Although the sharp drop yesterday indicates USD could remain under pressure, note that there is a pair of strong supports at 7.2400 and 7.2260. To maintain the downward pressure, USD must not break above 7.2980."
-
10:23
NZD/USD: Orr resigns from his position in the RBNZ – BBH
RBNZ Governor Adrian Orr unexpectedly resigned, BBH's FX analysts report.
RBNZ to ease rates by 75bps over the next 12 months
"Deputy Governor Christian Hawkesby will be Acting Governor until March 31. From April 1 the Minister of Finance, on recommendation from the RBNZ Board, will appoint a temporary Governor for a period of up to six months."
"Orr’s sudden departure was a personal decision according to RBNZ Chair Neil Quigley and has no material policy implications. The RBNZ has penciled-in another 75bps of easing over the next 12 months that would see the policy rate bottom at 3.00%. This seems about right and is in line with swaps market pricing."
-
10:19
USD/JPY: To trade between 148.80 and 150.70 – UOB Group
Outlook is unclear; US Dollar (USD) could trade between 148.80 and 150.70 vs Japanese Yen (JPY). In the longer run, failure to hold below 148.50 suggests USD could enter a period of indecision, trading in a 148.00/151.50 range for now, UOB Group’s FX analysts Quek Ser Leang and Peter Chia note.
USD can enter a period of indecision
24-HOUR VIEW: USD traded in a volatile manner on Monday. Yesterday, we indicated that 'the outlook is unclear after the choppy price action,' and we expected USD to 'trade in a broad range between 148.50 and 150.50.' USD subsequently traded in a volatile manner, dropping to a low and then reversing sharply to reach 149.88. We are still unable to derive much out of the choppy price movements. Today, USD could trade between 148.80 and 150.70."
1-3 WEEKS VIEW: "Yesterday (04 Mar, spot at 149.45), we highlighted that 'the bias for USD is slightly tilted to the downside, but it is unclear for now whether it can break and stay below 148.50.' USD subsequently dropped below 148.50, but it rebounded strongly to close at 149.80 (+0.20%). The failure to hold below 148.50 suggests USD could enter a period of indecision, trading in 148.00/151.50 for now."
-
10:15
AUD/USD: RBA projects growth to return to its trend rate of 2% over 2025 – BBH
AUD/USD is firmer on US Dollar (USD) weakness, BBH's FX analysts report.
RBA remains cautious which offers AUD support
"Australia’s Q4 real GDP matched consensus. The economy grew 0.6% q/q vs. 0.3% in Q3. Both public and private expenditure contributed to the growth, supported by an increase in exports of goods and services. On an annual basis, real GDP was up 1.3% in Q4 slightly above the RBA’s 1.1% forecast. The RBA projects growth to return to its trend rate of 2% over 2025."
"RBA remains cautious which offers AUD support. Deputy Governor Andrew Hauser reiterated overnight that 'the Board does not currently share the market’s confidence that a sequence of further cuts will be required.'"
"Interest rate futures imply almost 75bps of easing in the next 12 months with the next 25bps cut priced-in for May as heightened trade tensions weighs on the global economic outlook."
-
10:01
Italy Retail Sales s.a. (MoM) came in at -0.4% below forecasts (0.1%) in January
-
10:00
Italy Retail Sales n.s.a (YoY) increased to 0.9% in January from previous 0.6%
-
10:00
Eurozone Producer Price Index (YoY) above expectations (1.4%) in January: Actual (1.8%)
-
10:00
Eurozone Producer Price Index (MoM) came in at 0.8%, above expectations (0.5%) in January
-
09:53
NZD/USD: A slim chance of NZD reaching 0.5565 – UOB Group
New Zealand Dollar (NZD) is expected to trade in a higher range of 0.5625/0.5670 vs US Dollar (USD). In the longer run, slowing momentum indicates a slim chance of NZD reaching 0.5565; a breach of 0.5670 would suggest range trading, UOB Group’s FX analysts Quek Ser Leang and Peter Chia note.
Expected to trade in a higher range
24-HOUR VIEW: "The following are the excerpts from our update yesterday: “The price movements did not result in any increase in either downward or upward momentum. Today, we continue to expect range trading, most likely between 0.5590 and 0.5640.' Our view of range trading was incorrect, with NZD rising to 0.5666 after dipping to a low of 0.5597. Despite the advance, momentum has not increased significantly. Today, we expect NZD to trade in a range, though a higher one of 0.5625/0.5670."
1-3 WEEKS VIEW: "On Monday, when NZD was at 0.5605, we highlighted the following: 'While we continue to see room for NZD to weaken, it remains to be seen if the next support level at 0.5565 is within reach.' We also highlighted that 'a breach of 0.5670 (‘strong resistance’ level) would
indicate that the NZD weakness from late last week has ended.' Yesterday, NZD rose to 0.5666. While slowing momentum indicates that the chance of NZD reaching 0.5565 is slim, only a breach of 0.5670 would suggest that NZD has moved into a range trading phase." -
09:44
China NPC: Work report delivers on key market expectations – UOB Group
The third annual session of the 14th National People's Congress (NPC) is held in Beijing on 5-11 Mar. The key economic targets announced by Premier Li Qiang at the opening of the NPC were largely in line with expectations as China emphasizes high quality growth led by domestic demand and technological innovation to navigate a more challenging external environment, UOB Group's Economist Ho Woei Chen notes.
China sets its GDP growth target at around 5% for 2025
"The key economic targets announced by Premier Li Qiang were largely in line with expectations as China emphasizes high quality growth led by domestic demand and technological innovation to navigate a more challenging external environment."
"China sets its GDP growth target at around 5% for 2025, the same as the past two years. The CPI growth target is set lower at around 2% for 2025 while the fiscal deficit target is raised to around 4% of GDP. China will increase the issuance of ultra-long-term special treasury bonds and special local government bonds this year, though the CNY1.3 tn in ultra-long-term special treasury bonds for 2025 came below our expectation."
"The NPC agenda of note includes the press conferences on economic topics (6 Mar), foreign affairs topics (7 Mar) and people's livelihood topics (9 Mar) before it concludes on 11 Mar."
-
09:38
USD: The prospect of the US withdrawing its security umbrella from Europe is a crisis – ING
The trade-weighted Dollar Index (DXY) broke decisively under 106 yesterday as European currencies rallied on the prospects of major fiscal stimulus. Critics say that European leaders only react in a crisis – and certainly, the prospect of the US withdrawing its security umbrella from Europe is a crisis. The two significant events here yesterday were: a) the European Commission triggering national escape clauses from the Stability and Growth Pact, which could unlock EUR650bn of national spending and other measures totalling EUR800bn, plus b) German leaders agreeing on a suspension on the debt brake and unleashing a EUR500bn infrastructure fund, ING’s FX analysts Chris Turner notes.
DXY looks vulnerable to the 105.10/40 area
"Expect more focus on the above at a European Council meeting today. The prospects of significant European fiscal stimulus come at a time when new US tariffs were dragging many global equity markets some 2-3% lower, sending two-year Treasury yields under 4.00% and undermining the dollar. In his State of the Union address overnight, US President Donald Trump warned that tariffs were going to cause a 'little disturbance'. And it's that disturbance which has weighed on US activity and the dollar so far this year."
"Not helping investors has been the whipsawing on tariff policy. USD/CAD traded over 1.45 a couple of times yesterday as a US-Canada trade war broke out. Yet later in the day, US Commerce Secretary Howard Lutnick said that the US could announce, potentially today, a pathway for tariff relief based on Canada and Mexico's position in the USMCA accord. It really is hard to take a definitive position on all this. However, we would say that the new US administration has earmarked significant tariff revenues for its policy programmes meaning that tariffs may well be slow to reverse and look highly likely to be broadened in April."
"Where does this leave the USD? It is probably still a little vulnerable to any weaker US activity data through March before the tariff story once again dominates in April. The focus this week will therefore be on Friday's February US jobs report. Before then, today sees the ADP employment figures, but also the ISM Services index. The latter occasionally moves markets. In theory, this services index should be less affected by tariff noise and, barring any surprise weakness, today's US data should not prove a threat to the dollar. DXY looks vulnerable to the 105.10/40 area – but a major clear-out of dollar longs to the 104.00 area probably only comes on a significant miss in Friday's NFP report."
-
09:30
United Kingdom S&P Global/CIPS Services PMI came in at 51, below expectations (51.1) in February
-
09:30
WTI slumps to near $67.50 as Trump tariffs weigh on global Oil demand outlook
- The Oil price slides to near $67.50 as the global trade war intensifies.
- US tariffs and counter-tariffs, its major trading partners, would reduce global Oil demand.
- The OPEC+ is on track to increase Oil production by 138K barrels per day from April.
West Texas Intermediate (WTI), futures on NYMEX, falls sharply to near $67.50 in Wednesday’s European session. The Oil price weakens as investors worry about the Oil demand outlook amid intensifying global trade tensions.
On Tuesday, China, Canada, and Mexico announced retaliatory tariffs on imports from the United States (US). On the same day, 25% tariffs on Canada and Mexico and an additional 10% tariff on China went into effect.
US President Donald Trump also reiterated that his plans of introducing reciprocal tariffs are on and will come into effect on April 2.
Market participants believe the escalating tariff war has paused employers across the globe from making fresh business investments as Trump has not unveiled a detailed import duty plan yet. Such a scenario would reduce the Oil demand in the short-term, weighing on the Oil price significantly.
Apart from escalating global trade tensions, confirmation from the OPEC+ for increasing Oil output for the first time since 2022 has also reduced the appeal of the Oil price. The OPEC+ is on track to increase its Oil production in April by 138K barrels per day.
Meanwhile, the Oil price has also failed to capitalize on tumbling US Dollar (USD). The US Dollar Index (DXY), which tracks the Greenback’s value against six major currencies, falls slightly below 105.00, the lowest level seen this year. Going forward, investors will focus on the US Nonfarm payrolls (NFP) data for February, which will be released on Friday. The US labor market data will influence market expectations for the Federal Reserve’s (Fed) monetary policy outlook.
WTI Oil FAQs
WTI Oil is a type of Crude Oil sold on international markets. The WTI stands for West Texas Intermediate, one of three major types including Brent and Dubai Crude. WTI is also referred to as “light” and “sweet” because of its relatively low gravity and sulfur content respectively. It is considered a high quality Oil that is easily refined. It is sourced in the United States and distributed via the Cushing hub, which is considered “The Pipeline Crossroads of the World”. It is a benchmark for the Oil market and WTI price is frequently quoted in the media.
Like all assets, supply and demand are the key drivers of WTI Oil price. As such, global growth can be a driver of increased demand and vice versa for weak global growth. Political instability, wars, and sanctions can disrupt supply and impact prices. The decisions of OPEC, a group of major Oil-producing countries, is another key driver of price. The value of the US Dollar influences the price of WTI Crude Oil, since Oil is predominantly traded in US Dollars, thus a weaker US Dollar can make Oil more affordable and vice versa.
The weekly Oil inventory reports published by the American Petroleum Institute (API) and the Energy Information Agency (EIA) impact the price of WTI Oil. Changes in inventories reflect fluctuating supply and demand. If the data shows a drop in inventories it can indicate increased demand, pushing up Oil price. Higher inventories can reflect increased supply, pushing down prices. API’s report is published every Tuesday and EIA’s the day after. Their results are usually similar, falling within 1% of each other 75% of the time. The EIA data is considered more reliable, since it is a government agency.
OPEC (Organization of the Petroleum Exporting Countries) is a group of 12 Oil-producing nations who collectively decide production quotas for member countries at twice-yearly meetings. Their decisions often impact WTI Oil prices. When OPEC decides to lower quotas, it can tighten supply, pushing up Oil prices. When OPEC increases production, it has the opposite effect. OPEC+ refers to an expanded group that includes ten extra non-OPEC members, the most notable of which is Russia.
-
09:30
Silver price today: Silver rises, according to FXStreet data
Silver prices (XAG/USD) rose on Wednesday, according to FXStreet data. Silver trades at $32.30 per troy ounce, up 1.40% from the $31.86 it cost on Tuesday.
Silver prices have increased by 11.80% since the beginning of the year.
Unit measure Silver Price Today in USD Troy Ounce 32.30 1 Gram 1.04
The Gold/Silver ratio, which shows the number of ounces of Silver needed to equal the value of one ounce of Gold, stood at 90.34 on Wednesday, down from 91.57 on Tuesday.
Silver FAQs
Silver is a precious metal highly traded among investors. It has been historically used as a store of value and a medium of exchange. Although less popular than Gold, traders may turn to Silver to diversify their investment portfolio, for its intrinsic value or as a potential hedge during high-inflation periods. Investors can buy physical Silver, in coins or in bars, or trade it through vehicles such as Exchange Traded Funds, which track its price on international markets.
Silver prices can move due to a wide range of factors. Geopolitical instability or fears of a deep recession can make Silver price escalate due to its safe-haven status, although to a lesser extent than Gold's. As a yieldless asset, Silver tends to rise with lower interest rates. Its moves also depend on how the US Dollar (USD) behaves as the asset is priced in dollars (XAG/USD). A strong Dollar tends to keep the price of Silver at bay, whereas a weaker Dollar is likely to propel prices up. Other factors such as investment demand, mining supply – Silver is much more abundant than Gold – and recycling rates can also affect prices.
Silver is widely used in industry, particularly in sectors such as electronics or solar energy, as it has one of the highest electric conductivity of all metals – more than Copper and Gold. A surge in demand can increase prices, while a decline tends to lower them. Dynamics in the US, Chinese and Indian economies can also contribute to price swings: for the US and particularly China, their big industrial sectors use Silver in various processes; in India, consumers’ demand for the precious metal for jewellery also plays a key role in setting prices.
Silver prices tend to follow Gold's moves. When Gold prices rise, Silver typically follows suit, as their status as safe-haven assets is similar. The Gold/Silver ratio, which shows the number of ounces of Silver needed to equal the value of one ounce of Gold, may help to determine the relative valuation between both metals. Some investors may consider a high ratio as an indicator that Silver is undervalued, or Gold is overvalued. On the contrary, a low ratio might suggest that Gold is undervalued relative to Silver.
(An automation tool was used in creating this post.)
-
09:30
United Kingdom S&P Global/CIPS Composite PMI in line with forecasts (50.5) in February
-
09:01
Italy Gross Domestic Product (YoY) came in at 0.6%, above forecasts (0.5%) in 4Q
-
09:01
Italy Gross Domestic Product (QoQ) above expectations (0%) in 4Q: Actual (0.1%)
-
09:00
Eurozone HCOB Services PMI came in at 50.6, below expectations (50.7) in February
-
09:00
Eurozone HCOB Composite PMI: 50.2 (February)
-
08:55
Germany HCOB Services PMI came in at 51.1 below forecasts (52.2) in February
-
08:55
Germany HCOB Composite PMI came in at 50.4, below expectations (51) in February
-
08:51
France HCOB Services PMI came in at 45.3, above forecasts (44.5) in February
-
08:50
France HCOB Composite PMI above forecasts (44.5) in February: Actual (45.1)
-
08:48
USD/JPY Price Analysis: Tests resistance at 149.50 near nine-day EMA
- USD/JPY could aim for initial support at the five-month low of 148.10.
- The pair continues to decline within a descending channel, reinforcing a confirmed bearish bias.
- The nine-day EMA at 149.75 serves as an immediate resistance level.
USD/JPY gains ground after registering losses in the previous two successive days, trading around 149.40 during the European session on Wednesday. An analysis of the daily chart showed the USD/JPY pair moves downward within a descending channel, indicating a confirmed bearish bias.
The USD/JPY pair remains below the nine-day Exponential Moving Average (EMA), indicating a weaker short-term price momentum. Additionally, the 14-day Relative Strength Index (RSI), a momentum indicator, is positioned above the 30 level, reinforcing the persistent bearish bias.
In terms of support, the USD/JPY pair could target the five-month low at 148.10, recorded on March 4, followed by the psychological level of 148.00. A successful breach below this crucial support zone could reinforce the bearish bias and put pressure on the pair to test the lower boundary of the descending channel at the level of 146.70
On the upside, the USD/JPY pair could first encounter the nine-day EMA barrier at 149.75. A break above this level could improve the short-term price momentum and support the pair to approach the descending channel’s upper boundary at the 152.00 level.
USD/JPY: Daily Chart
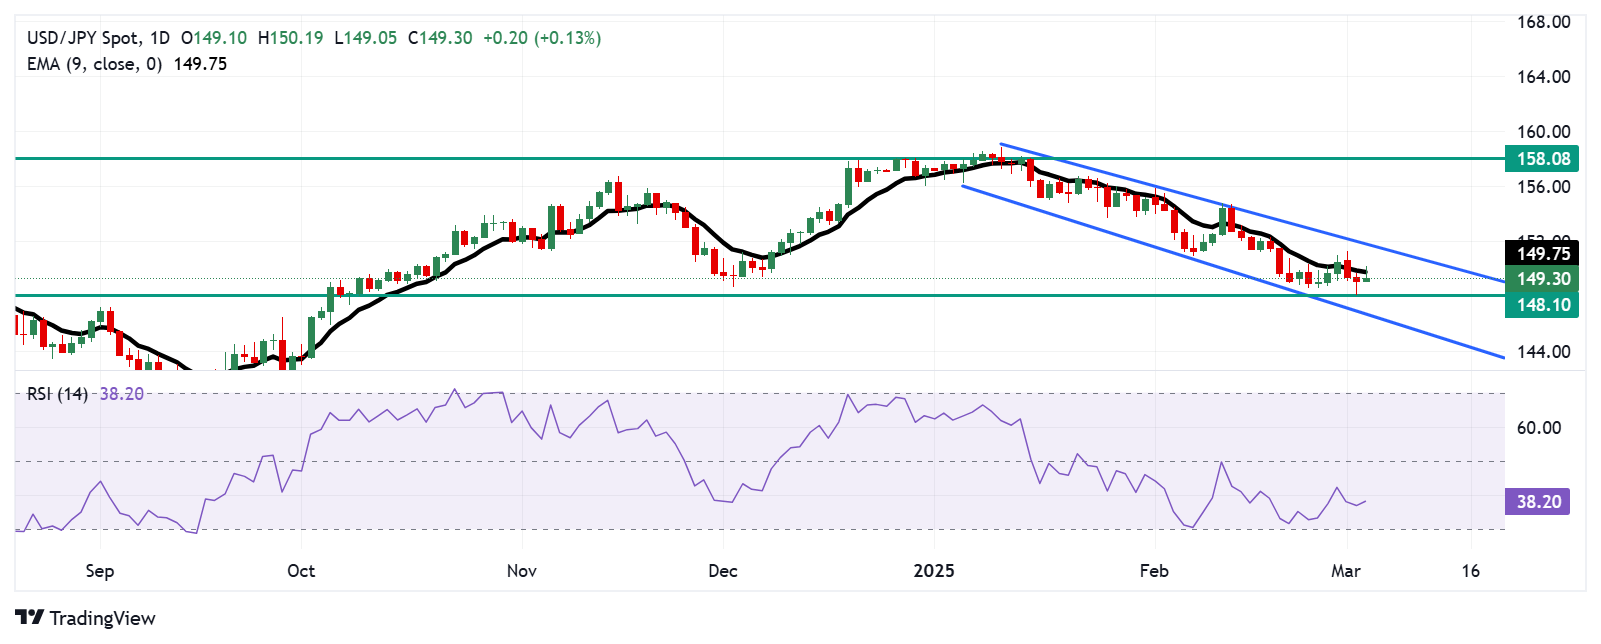
Japanese Yen FAQs
The Japanese Yen (JPY) is one of the world’s most traded currencies. Its value is broadly determined by the performance of the Japanese economy, but more specifically by the Bank of Japan’s policy, the differential between Japanese and US bond yields, or risk sentiment among traders, among other factors.
One of the Bank of Japan’s mandates is currency control, so its moves are key for the Yen. The BoJ has directly intervened in currency markets sometimes, generally to lower the value of the Yen, although it refrains from doing it often due to political concerns of its main trading partners. The BoJ ultra-loose monetary policy between 2013 and 2024 caused the Yen to depreciate against its main currency peers due to an increasing policy divergence between the Bank of Japan and other main central banks. More recently, the gradually unwinding of this ultra-loose policy has given some support to the Yen.
Over the last decade, the BoJ’s stance of sticking to ultra-loose monetary policy has led to a widening policy divergence with other central banks, particularly with the US Federal Reserve. This supported a widening of the differential between the 10-year US and Japanese bonds, which favored the US Dollar against the Japanese Yen. The BoJ decision in 2024 to gradually abandon the ultra-loose policy, coupled with interest-rate cuts in other major central banks, is narrowing this differential.
The Japanese Yen is often seen as a safe-haven investment. This means that in times of market stress, investors are more likely to put their money in the Japanese currency due to its supposed reliability and stability. Turbulent times are likely to strengthen the Yen’s value against other currencies seen as more risky to invest in.
-
08:45
Italy HCOB Services PMI came in at 53, above forecasts (50.7) in February
-
08:40
AUD/USD: Any advance is likely part of a higher range of 0.6230/0.6285 – UOB Group
Australian Dollar (AUD) could strengthen further vs US Dollar (USD); any advance is likely part of a higher range of 0.6230/0.6285. In the longer run, momentum is slowing, and the likelihood of further declines is diminishing; a breach of 0.6285 would indicate stabilisation, UOB Group's FX analysts Quek Ser Leang and Peter Chia note.
Likelihood of further declines is diminishing
24-HOUR VIEW: "Two days ago, we expected AUD to trade in a range. Yesterday, we indicated that 'the price action still appears to be part of a range trading phase,' and we expected AUD to 'trade between 0.6190 and 0.6250.' However, after dipping briefly to 0.6187, AUD soared, reaching a high of 0.6272. While further AUD strength seems likely today, given that momentum has not increased significantly, any advance is likely part of a higher range of 0.6230/0.6285. In other words, AUD is unlikely to break clearly above 0.6280."
1-3 WEEKS VIEW: "We have maintained a negative AUD view since late last week. After AUD fell, in our latest narrative from Monday (03 Mar, spot at 0.6215), we highlighted that 'While declines still seem likely, AUD must break and remain below 0.6190 before a move to 0.6155 can be expected.' Yesterday, AUD dipped briefly to 0.6187 and then rebounded. Momentum is beginning to slow, and the likelihood of further declines is diminishing. However, only a breach of 0.6285 (no change in ‘strong resistance’ level from yesterday) would indicate that the weakness has stabilised."
-
08:37
European natural gas market sells off – ING
The European natural gas market sold off yesterday with TTF settling nearly 3.9% lower on the day, ING's commodity experts Ewa Manthey and Warren Patterson note.
Weakness is overdone given the tighter storage environment
"We believe that the weakness is overdone given the tighter storage environment. Also, European prices need to stay elevated and at a premium to Asia to ensure the region brings in enough LNG through the injection season."
"Previously, the TTF forward curve was at a consistent premium to Japan Korea Marker (JKM) prices for much of the year. This isn’t the case amid weakness in European prices."
-
08:35
GBP/USD: The next major resistance at 1.2900 is likely out of reach – UOB Group
Rapid rise could continue; the next major resistance at 1.2900 is likely out of reach. In the longer run, risk for Pound Sterling (GBP) remains clearly on the upside vs US Dollar (USD); the next level to monitor is 1.2900, UOB Group's FX analysts Quek Ser Leang and Peter Chia note.
Risk for GBP remains clearly on the upside
24-HOUR VIEW: "Following the strong rally in GBP two days ago, we noted yesterday that 'the sharp and rapid rally appears to be running ahead of itself.' However, we highlighted that GBP 'could test the major resistance at 1.2730.' We also highlighted that 'a break of this level is not ruled out, but given the overbought conditions, the next major resistance at 1.2770 is unlikely to come into view.' Our call for a stronger GBP was correct, but we did not expect the strong rally that reached a high of 1.2800. While the rapid rise appears set to continue, the next major resistance at 1.2900 is likely out of reach today (there is another resistance level at 1.2850). On the downside, there is a pair of support levels at 1.2750 and 1.2730."
1-3 WEEKS VIEW: "We revised our view to positive yesterday (04 Mar, spot at 1.2700), indicating that 'the risk for GBP is on the upside.' That said, we pointed out, 'to rise in a sustained manner, GBP must break and remain above 1.2730.' GBP not only broke above 1.2730, but it also surged to 1.2800. Clearly, the risk remains on the upside. The next level to monitor is 1.2900. On the downside, the ‘strong support’ at 1.2680 (level was at 1.2610 yesterday) will likely remain intact for the next couple of days."
-
08:34
Crude oil price today: WTI price bearish at European opening
West Texas Intermediate (WTI) Oil price falls on Wednesday, early in the European session. WTI trades at $67.59 per barrel, down from Tuesday’s close at $67.96. Brent Oil Exchange Rate (Brent crude) is also shedding ground, trading at $70.78 after its previous daily close at $70.96.
WTI Oil FAQs
WTI Oil is a type of Crude Oil sold on international markets. The WTI stands for West Texas Intermediate, one of three major types including Brent and Dubai Crude. WTI is also referred to as “light” and “sweet” because of its relatively low gravity and sulfur content respectively. It is considered a high quality Oil that is easily refined. It is sourced in the United States and distributed via the Cushing hub, which is considered “The Pipeline Crossroads of the World”. It is a benchmark for the Oil market and WTI price is frequently quoted in the media.
Like all assets, supply and demand are the key drivers of WTI Oil price. As such, global growth can be a driver of increased demand and vice versa for weak global growth. Political instability, wars, and sanctions can disrupt supply and impact prices. The decisions of OPEC, a group of major Oil-producing countries, is another key driver of price. The value of the US Dollar influences the price of WTI Crude Oil, since Oil is predominantly traded in US Dollars, thus a weaker US Dollar can make Oil more affordable and vice versa.
The weekly Oil inventory reports published by the American Petroleum Institute (API) and the Energy Information Agency (EIA) impact the price of WTI Oil. Changes in inventories reflect fluctuating supply and demand. If the data shows a drop in inventories it can indicate increased demand, pushing up Oil price. Higher inventories can reflect increased supply, pushing down prices. API’s report is published every Tuesday and EIA’s the day after. Their results are usually similar, falling within 1% of each other 75% of the time. The EIA data is considered more reliable, since it is a government agency.
OPEC (Organization of the Petroleum Exporting Countries) is a group of 12 Oil-producing nations who collectively decide production quotas for member countries at twice-yearly meetings. Their decisions often impact WTI Oil prices. When OPEC decides to lower quotas, it can tighten supply, pushing up Oil prices. When OPEC increases production, it has the opposite effect. OPEC+ refers to an expanded group that includes ten extra non-OPEC members, the most notable of which is Russia.
Disclaimer: West Texas Intermediate (WTI) and Brent oil prices mentioned above are based on FXStreet data feed for Contracts for Differences (CFDs).
(An automation tool was used in creating this post.)
-
08:31
GBP: BoE hawks, doves and centrists speak today – ING
At 3:30pm CET today, Bank of England MPC members Andrew Bailey, Huw Pill, Megan Greene and Alan Taylor tesify to the Treasury Select Comittee on February's 25bp rate cut, ING's FX analyst Chris Turner notes.
Above 1.2810, there may be another leg higher in this rally
"This comes at a time when the market is pricing just 57bp of BoE cuts this year compared to 72/73bp of easing priced for the Federal Reserve. While we ultimately think that the BoE cuts three times this year, the recent mood music from the BoE doves (e.g., Dave Ramsden) has been caution and the need for gradual rate cuts. Sticky private sector wage growth has been the main problem."
"Beyond the very dovish views of external member Alan Taylor, it is hard to see from where the dovish shock is going to emerge today. GBP/USD is close to resistance at 1.2810, above which we could see another leg higher in this rally."
-
08:30
ADP Employment Change projected to show US job growth slowing in February
- The ADP Employment Change, and the US labour market, take centre stage this week.
- The US private sector is seen adding 140K new jobs in February.
- The US Dollar Index continues to trade in the lower end of the range.
The US labor market is set to take center stage this week as fresh concerns mount that the economy may be losing its momentum — a sentiment echoed by recent slower growth and worrisome fundamental data.
In the spotlight, the ADP Research Institute is poised to release its February Employment Change report on Wednesday, offering a snapshot of private-sector job creation.
Typically coming out two days before the official Nonfarm Payrolls (NFP) report, the ADP survey is often seen as an early indicator of trends expected in the Bureau of Labor Statistics (BLS) jobs report — even if the two don't always tell the same story.
The economic equation: Job growth and Fed policy in focus
Employment is critical as it forms one of the two legs of the Federal Reserve’s (Fed) dual mandate. The US central bank is tasked with maintaining price stability while pursuing maximum employment. As inflationary pressures remain stubborn, the focus appears to have temporarily shifted to the performance of the US labour market following the Fed’s hawkish stance at its January 28–29 meeting.
In the meantime, investors continue to closely monitor the White House’s trade policies and their consequences, particularly after US tariffs on Canadian and Mexican imports took effect on March 4. Fears that these levies could fan the flames of a resurgence in inflationary pressure have driven both the Fed’s prudent approach and the cautious remarks from many of its policymakers.
So far, and in light of the recent set of weaker-than-expected results that have challenged the notion of US “exceptionalism”, market participants now expect the Fed to reduce interest rates by 50 basis points this year.
Amid the ongoing tariff turmoil, the apparent slowing momentum of the US economy, and persistent consumer price pressures, the ADP report — and especially Friday’s Nonfarm Payrolls report — has gained renewed relevance and could help shape the Fed’s next move.
When will the ADP Report be released, and how could it affect the US Dollar Index?
The ADP Employment Change report for February is set to drop on Wednesday at 13:15 GMT with forecasts pointing to an addition of 140K new jobs following January’s gain of 183K. In anticipation, the US Dollar Index (DXY) remains securely on the defensive, putting the key support at 106.00 to the test amid rising jitters over the US economy.
If the ADP report delivers robust numbers, it could momentarily cool the mounting concerns over the US economic slowdown. However, if the results fall short of expectations, it might reinforce worries that the economy is losing momentum—potentially prompting the Fed to reconsider an earlier restart of its easing cycle.
According to Pablo Piovano, Senior Analyst at FXStreet, “If the recovery gains traction, the DXY could revisit the weekly peak of 107.66 (February 28), a region that appears reinforced by the proximity of the transitory 55-day SMA around 107.90, ahead of the February high of 109.88 set on February 3, and the YTD peak of 110.17 from January 13. Surpassing that level might pave the way toward the next resistance at the 2022 high of 114.77 recorded on September 28.
“On the flip side, if sellers manage to seize control, the index might first find support at the 2025 bottom of 105.89 reached on March 4, prior to the December 2024 bottom of 105.42, and eventually at the critical 200-day SMA in the 105.00 zone. Staying above that key threshold is essential for sustaining bullish momentum,” Piovano concludes.
Economic Indicator
ADP Employment Change
The ADP Employment Change is a gauge of employment in the private sector released by the largest payroll processor in the US, Automatic Data Processing Inc. It measures the change in the number of people privately employed in the US. Generally speaking, a rise in the indicator has positive implications for consumer spending and is stimulative of economic growth. So a high reading is traditionally seen as bullish for the US Dollar (USD), while a low reading is seen as bearish.
Read more.Next release: Wed Mar 05, 2025 13:15
Frequency: Monthly
Consensus: 140K
Previous: 183K
Source: ADP Research Institute
Traders often consider employment figures from ADP, America’s largest payrolls provider, report as the harbinger of the Bureau of Labor Statistics release on Nonfarm Payrolls (usually published two days later), because of the correlation between the two. The overlaying of both series is quite high, but on individual months, the discrepancy can be substantial. Another reason FX traders follow this report is the same as with the NFP – a persistent vigorous growth in employment figures increases inflationary pressures, and with it, the likelihood that the Fed will raise interest rates. Actual figures beating consensus tend to be USD bullish.
Employment FAQs
Labor market conditions are a key element to assess the health of an economy and thus a key driver for currency valuation. High employment, or low unemployment, has positive implications for consumer spending and thus economic growth, boosting the value of the local currency. Moreover, a very tight labor market – a situation in which there is a shortage of workers to fill open positions – can also have implications on inflation levels and thus monetary policy as low labor supply and high demand leads to higher wages.
The pace at which salaries are growing in an economy is key for policymakers. High wage growth means that households have more money to spend, usually leading to price increases in consumer goods. In contrast to more volatile sources of inflation such as energy prices, wage growth is seen as a key component of underlying and persisting inflation as salary increases are unlikely to be undone. Central banks around the world pay close attention to wage growth data when deciding on monetary policy.
The weight that each central bank assigns to labor market conditions depends on its objectives. Some central banks explicitly have mandates related to the labor market beyond controlling inflation levels. The US Federal Reserve (Fed), for example, has the dual mandate of promoting maximum employment and stable prices. Meanwhile, the European Central Bank’s (ECB) sole mandate is to keep inflation under control. Still, and despite whatever mandates they have, labor market conditions are an important factor for policymakers given its significance as a gauge of the health of the economy and their direct relationship to inflation.
-
08:27
EUR/USD: Strong upward momentum shows no signs of slowing – UOB Group
Strong upward momentum shows no signs of slowing, but it is unclear if Euro (EUR) can break above 1.0665 today vs US Dollar (USD). In the longer run, impulsive rally suggests EUR is likely to break 1.0665; the next technical target lies at 1.0730, UOB Group's FX analysts Quek Ser Leang and Peter Chia note.
Impulsive rally suggests EUR is likely to break 1.0665
24-HOUR VIEW: "After the strong surge in EUR on Monday, we indicated yesterday, Tuesday, that 'while deeply overbought, strong momentum indicates there is scope for EUR to rally further.' However, we pointed out, 'the significant resistance level at 1.0530 could be just out of reach.' EUR then broke the significant resistance level, which led to a sharp rally that sent it to a high of 1.0627. EUR closed higher by a whopping 1.32%, tagging on to the 1.07% gain from Monday. Such a sharp rally over a short period seems excessive, but the strong upward momentum shows no signs of slowing just yet. That said, it is unclear if there is enough momentum for EUR to break above the next resistance level at 1.0665 today. On the downside, any pullback is likely to hold above 1.0545 (minor support is at 1.0580)."
1-3 WEEKS VIEW: "Although EUR rose and closed sharply higher two days ago, we indicated yesterday (04 Mar, spot at 1.0485) that 'the increase in momentum is not enough to suggest a sustained rise.' We highlighted that EUR 'must break and remain above the significant resistance at 1.0530 before a move to 1.0570 can be expected.' The subsequent price movements did not quite turn out as we expected, as EUR lifted off and rocketed, almost reaching the strong resistance level at 1.0630. The impulsive rally suggests EUR is likely to break 1.0665. The next technical target above 1.0665 lies at 1.0730. We will maintain our positive EUR view as long as 1.0480 (‘strong support’ level was at 1.0415 yesterday) is intact. The ‘strong support’ level is set to move higher over the next few days."
-
08:18
EUR/USD strengthens on German debt reforms, concerns over US economic outlook
- EUR/USD posts a fresh year-to-date high near 1.0670 as the US Dollar weakens amid uncertainty over US growth prospects.
- US President Trump reiterates that reciprocal tariffs to take effect on April 2.
- The ECB is expected to reduce interest rates by 25 bps on Thursday.
EUR/USD extends the prior day’s strong upside move to near 1.0670 in European trading hours on Wednesday, the highest level seen this year. The major currency pair strengthens as investors dump the US Dollar (USD) amid growing concerns about the United States (US) economic outlook. The US Dollar Index (DXY), which tracks the Greenback’s value against six major currencies, slides to an over three-month low of 105.15.
A slew of events has changed the perception of market participants towards United States (US) President Donald Trump’s tariff agenda. Investors are anticipating that Trump tariffs will slow down US economic growth rather than being pro-growth and inflationary for the economy, which they had projected earlier.
“Given the tight linkages in supply chains across the United States, Mexico, and Canada (USMCA) countries – most notably in the auto industry – tariffs left on for more than a matter of a week or two are likely to have a substantial impact on growth,” Citi said in a report.
The bank also expects a 0.1% decline in the Q1 real Gross Domestic Product (GDP) and expects the Federal Reserve (Fed) to resume its policy-easing cycle, which it paused in December, in the May meeting.
With tariffs now in effect, inflation cooling, equity markets declining, and consumer spending slowing, Citi expects the likelihood of a Fed rate cut in May has swelled.
Meanwhile, 25% tariffs on Canada and Mexico and an additional 10% on China took effect on Tuesday. Moreover, President Trump confirmed that reciprocal tariffs will be imposed from April 2 while addressing Congress on Tuesday.
Daily digest market movers: EUR/USD strengthens ahead of ECB’s policy meeting
- EUR/USD stays firm while investors await the European Central Bank’s (ECB) monetary policy decision, which will be announced on Thursday. The ECB is almost certain to cut its Deposit Facility Rate by 25 basis points (bps) for the fifth time in a row. Therefore, investors will pay close attention to ECB President Christine Lagarde’s press conference after the policy meeting.
- Lagarde is expected to ensure that the monetary policy path is clear but won’t provide a specific monetary expansion plan. Investors would like to know the impact of Trump tariffs and Germany’s debt restructuring to boost defense spending and uplift economic growth in the Eurozone.
- On Tuesday, Germany’s likely next chancellor, Frederich Merz, and the Social Democratic Party (SDP) agreed to create a 500 billion Euro (EUR) infrastructure fund and widen the borrowing limit. Such reforms could escalate inflation in the Eurozone economy. The impact of German debt reforms has resulted in an increase in demand for the Euro.
- Meanwhile, Trump’s tariff agenda could spoil the party for Euro bulls as the Eurozone’s locomotive, Germany, is one of the major auto exporters to the US. Trump has already announced that he will charge 25% tariffs on foreign cars, which is currently 2.5% on automobiles from Germany.
- In Wednesday’s session, investors will focus on the US ADP Employment Change and the ISM Services data for February, which will be published during the North American session. The economic data will influence market expectations for the Fed’s monetary policy outlook.
Technical Analysis: EUR/USD rises above 200-day EMA
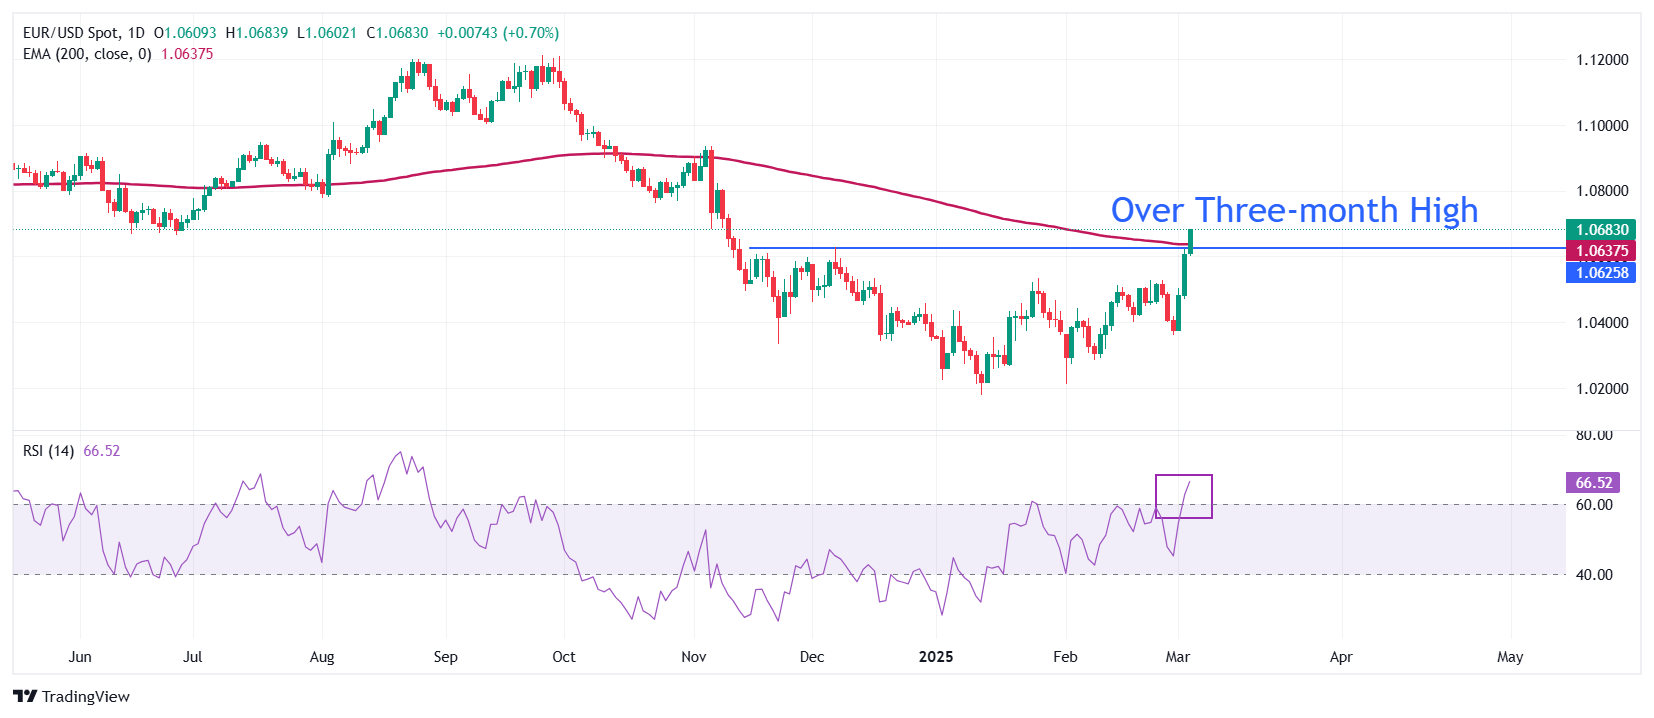
EUR/USD posts a fresh over three-month high near 1.0670, recovering above the 200-day Exponential Moving Average (EMA) for the first time since early November. The major currency pair strengthened on Tuesday after a decisive breakout above the January 27 high of 1.0533.
The 14-day Relative Strength Index (RSI) jumps above 60.00. A bullish momentum would trigger if the RSI stays above that level.
Looking down, the January 27 high of 1.0533 will act as the major support zone for the pair. Conversely, the November 6 high of 1.0937 will be the key barrier for the Euro bulls.
Euro FAQs
The Euro is the currency for the 19 European Union countries that belong to the Eurozone. It is the second most heavily traded currency in the world behind the US Dollar. In 2022, it accounted for 31% of all foreign exchange transactions, with an average daily turnover of over $2.2 trillion a day. EUR/USD is the most heavily traded currency pair in the world, accounting for an estimated 30% off all transactions, followed by EUR/JPY (4%), EUR/GBP (3%) and EUR/AUD (2%).
The European Central Bank (ECB) in Frankfurt, Germany, is the reserve bank for the Eurozone. The ECB sets interest rates and manages monetary policy. The ECB’s primary mandate is to maintain price stability, which means either controlling inflation or stimulating growth. Its primary tool is the raising or lowering of interest rates. Relatively high interest rates – or the expectation of higher rates – will usually benefit the Euro and vice versa. The ECB Governing Council makes monetary policy decisions at meetings held eight times a year. Decisions are made by heads of the Eurozone national banks and six permanent members, including the President of the ECB, Christine Lagarde.
Eurozone inflation data, measured by the Harmonized Index of Consumer Prices (HICP), is an important econometric for the Euro. If inflation rises more than expected, especially if above the ECB’s 2% target, it obliges the ECB to raise interest rates to bring it back under control. Relatively high interest rates compared to its counterparts will usually benefit the Euro, as it makes the region more attractive as a place for global investors to park their money.
Data releases gauge the health of the economy and can impact on the Euro. Indicators such as GDP, Manufacturing and Services PMIs, employment, and consumer sentiment surveys can all influence the direction of the single currency. A strong economy is good for the Euro. Not only does it attract more foreign investment but it may encourage the ECB to put up interest rates, which will directly strengthen the Euro. Otherwise, if economic data is weak, the Euro is likely to fall. Economic data for the four largest economies in the euro area (Germany, France, Italy and Spain) are especially significant, as they account for 75% of the Eurozone’s economy.
Another significant data release for the Euro is the Trade Balance. This indicator measures the difference between what a country earns from its exports and what it spends on imports over a given period. If a country produces highly sought after exports then its currency will gain in value purely from the extra demand created from foreign buyers seeking to purchase these goods. Therefore, a positive net Trade Balance strengthens a currency and vice versa for a negative balance.
-
08:18
EUR: A fiscal coalition of the willing – ING
As above, EUR/USD broke decisivley higher on prospects of a fiscal bazooka out of Europe. The speed with which the Europeans are moving is impressive, especially in Germany. Expect much focus now on whether the agreed fiscal changes in Germany move swiftly and easily through parliament over coming weeks. The prospect of large European stimulus is very present in European bond markets, where the German sovereign 2-10 year curve steepened a further 4bp yesterday, ING's FX analyst Chris Turner notes.
The prospect of large European stimulus is present in European bond markets
"In FX markets, we normally look at the combination of looser fiscal and tigter monetary policy as currency positive. The slight problem for the EUR/USD story here is that the fiscal news has not moved the needle on European Central Bank policy expectations. The forward ESTR curve still prices the low point for the ECB easing cycle near 1.75%. No doubt this is a function of the global tariff threat which looks like it will be coming Europe's way next month."
"We haven't been calling for such a decisive upisde break in EUR/USD. We don't yet buy into this talk of the dollar losing its reserve currency status. This looks more of a cyclical decline on soft US data this year. For the near term, however, US activity data will probably be the determinant of whether we trade up to 1.0670/80 today – or outside risk to 1.0800 were payrolls to miss by a huge degree on Friday."
"And now looking at a multi-month view, our quarterly forecasts in the 1.00/02 area for the second and third quarter will be hard to achieve. Instead, EUR/USD maybe more of a 1.03/04 story when broader US tariffs come in next month."
-
08:15
Spain HCOB Services PMI registered at 56.2 above expectations (55.2) in February
-
08:03
USD/CHF remains below 0.8900 following Swiss CPI data release
- USD/CHF holds losses after the release of February’s Swiss Consumer Price Index on Wednesday.
- The monthly CPI increased by 0.6% in February, surpassing market forecasts of a 0.5% rise.
- The US Dollar faces challenges due to US economic growth concerns.
The USD/CHF pair continues its downward trend for the third consecutive session, trading around 0.8880 during European hours on Wednesday. The pair remains under pressure following the release of Swiss Consumer Price Index (CPI) data.
The monthly CPI rose by 0.6% in February, marking the first increase in nine months and the fastest pace since February 2021, exceeding market expectations of a 0.5% gain. The annual inflation rate eased slightly to 0.3% in February, surpassing the expected 0.2% increase but down from 0.4% in January, marking its lowest level since April 2021. Meanwhile, core inflation—which excludes volatile items such as unprocessed food and energy—remained steady at 0.9%, unchanged from January.
Additionally, the USD/CHF pair depreciates as the US Dollar (USD) struggles due to rising fears over slowing US economic growth. Investors now turn their focus to key US economic data, including the ISM Services PMI and ADP Employment Change, set for release in the North American session.
President Trump’s 25% tariffs on Canadian and Mexican goods took effect on Tuesday, alongside a hike in duties on Chinese imports to 20%. However, market sentiment weighs on the USD amid speculation that Trump could soften his stance on tariffs.
US Commerce Secretary Howard Lutnick suggested in a Fox News interview that Trump may reconsider the tariff policy less than 48 hours after its implementation, indicating potential relief if USMCA rules are followed. However, the New York Times reported that Trump has privately expressed his intent to keep the tariffs in place.
Economic Indicator
Consumer Price Index (MoM)
The Consumer Price Index (CPI), released by the Swiss Federal Statistical Office on a monthly basis, measures the change in prices of goods and services which are representative of the private households’ consumption in Switzerland. The CPI is the main indicator to measure inflation and changes in purchasing trends. The MoM figure compares the prices of goods in the reference month to the previous month. Generally, a high reading is seen as bullish for the Swiss Franc (CHF), while a low reading is seen as bearish.
Read more.Last release: Wed Mar 05, 2025 07:30
Frequency: Monthly
Actual: 0.6%
Consensus: 0.5%
Previous: -0.1%
Source: Federal Statistical Office of Switzerland
-
07:45
France Industrial Output (MoM) came in at -0.6% below forecasts (0.3%) in January
-
07:33
USD/CAD drops to near 1.4400 amid US growth concerns
- USD/CAD declines as concerns over slowing economic growth and the impact of newly imposed tariffs weigh on market sentiment.
- US Commerce Secretary Howard Lutnick indicated that Trump might reconsider his tariff policy less than 48 hours after its implementation.
- The Canadian Dollar faces headwinds amid rising expectations of additional interest rate cuts from the Bank of Canada.
The USD/CAD pair continues to decline for the second straight session, hovering around 1.4400 during early European trading hours on Wednesday. The US Dollar (USD) remains under pressure amid rising concerns over slowing economic growth and the impact of newly imposed tariffs. President Trump’s 25% tariffs on Canadian and Mexican goods took effect on Tuesday, alongside a hike in duties on Chinese imports to 20%.
US Commerce Secretary Howard Lutnick suggested in a Fox News interview that Trump may reconsider the tariff policy less than 48 hours after its implementation, indicating potential relief if USMCA rules are followed. However, the New York Times reported that Trump has privately expressed his intent to keep the tariffs in place.
The US Dollar Index (DXY), which measures the Greenback against six major currencies, remains around 105.70. Market sentiment weighs on the USD amid speculation that Trump could soften his stance on tariffs. Investors now turn their focus to key US economic data, including the ISM Services PMI and ADP Employment Change, set for release in the North American session.
Meanwhile, the Canadian Dollar (CAD) faces downside risks, limiting further losses in the USD/CAD pair, as growing expectations of additional interest rate cuts from the Bank of Canada (BoC). According to Reuters, markets have priced in an 80% probability of a BoC rate cut next week. BMO Chief Economist Douglas Porter stated, "We now expect the quarter-point pace to continue over the next four meetings until July, bringing the rate to 2.0%."
Canadian Dollar FAQs
The key factors driving the Canadian Dollar (CAD) are the level of interest rates set by the Bank of Canada (BoC), the price of Oil, Canada’s largest export, the health of its economy, inflation and the Trade Balance, which is the difference between the value of Canada’s exports versus its imports. Other factors include market sentiment – whether investors are taking on more risky assets (risk-on) or seeking safe-havens (risk-off) – with risk-on being CAD-positive. As its largest trading partner, the health of the US economy is also a key factor influencing the Canadian Dollar.
The Bank of Canada (BoC) has a significant influence on the Canadian Dollar by setting the level of interest rates that banks can lend to one another. This influences the level of interest rates for everyone. The main goal of the BoC is to maintain inflation at 1-3% by adjusting interest rates up or down. Relatively higher interest rates tend to be positive for the CAD. The Bank of Canada can also use quantitative easing and tightening to influence credit conditions, with the former CAD-negative and the latter CAD-positive.
The price of Oil is a key factor impacting the value of the Canadian Dollar. Petroleum is Canada’s biggest export, so Oil price tends to have an immediate impact on the CAD value. Generally, if Oil price rises CAD also goes up, as aggregate demand for the currency increases. The opposite is the case if the price of Oil falls. Higher Oil prices also tend to result in a greater likelihood of a positive Trade Balance, which is also supportive of the CAD.
While inflation had always traditionally been thought of as a negative factor for a currency since it lowers the value of money, the opposite has actually been the case in modern times with the relaxation of cross-border capital controls. Higher inflation tends to lead central banks to put up interest rates which attracts more capital inflows from global investors seeking a lucrative place to keep their money. This increases demand for the local currency, which in Canada’s case is the Canadian Dollar.
Macroeconomic data releases gauge the health of the economy and can have an impact on the Canadian Dollar. Indicators such as GDP, Manufacturing and Services PMIs, employment, and consumer sentiment surveys can all influence the direction of the CAD. A strong economy is good for the Canadian Dollar. Not only does it attract more foreign investment but it may encourage the Bank of Canada to put up interest rates, leading to a stronger currency. If economic data is weak, however, the CAD is likely to fall.
-
07:30
Switzerland Consumer Price Index (MoM) above expectations (0.5%) in February: Actual (0.6%)
-
07:30
Switzerland Consumer Price Index (YoY) above expectations (0.2%) in February: Actual (0.3%)
-
07:27
Forex Today: US Dollar remains fragile as focus shifts to data releases
Here is what you need to know on Wednesday, March 5:
The US Dollar (USD) continued to weaken against its rivals on Tuesday and the USD Index slumped to its weakest level since early December, pressured by growing concerns over an economic slowdown. Early Wednesday, the USD struggles to find demand as the market focus shifts to ISM Services PMI and ADP Employment Change data for February.
US Dollar PRICE This week
The table below shows the percentage change of US Dollar (USD) against listed major currencies this week. US Dollar was the weakest against the Euro.
USD EUR GBP JPY CAD AUD NZD CHF USD -2.52% -1.78% -0.54% -0.32% -1.07% -1.22% -1.47% EUR 2.52% 0.65% 1.80% 2.06% 1.38% 1.15% 0.90% GBP 1.78% -0.65% 1.27% 1.41% 0.74% 0.50% 0.25% JPY 0.54% -1.80% -1.27% 0.43% -0.49% -0.64% -0.95% CAD 0.32% -2.06% -1.41% -0.43% -0.60% -0.90% -1.15% AUD 1.07% -1.38% -0.74% 0.49% 0.60% -0.24% -0.49% NZD 1.22% -1.15% -0.50% 0.64% 0.90% 0.24% -0.25% CHF 1.47% -0.90% -0.25% 0.95% 1.15% 0.49% 0.25% The heat map shows percentage changes of major currencies against each other. The base currency is picked from the left column, while the quote currency is picked from the top row. For example, if you pick the US Dollar from the left column and move along the horizontal line to the Japanese Yen, the percentage change displayed in the box will represent USD (base)/JPY (quote).
Following Monday's sharp decline, the USD Index lost nearly 1% on Tuesday. While addressing the Congress in the late American session, US President Donald Trump reiterated that they will impose tariffs on products not made in the US. Meanwhile, during a televised interview on Fox News, US Commerce Secretary Howard Lutnick hinted that Trump may be preparing to pivot on his own tariffs less than 48 hours after imposing them. Although these comments failed to help the market mood improve, the USD failed to find a foothold. On Tuesday, the Dow Jones Industrial Average (DJIA) and the S&P 500 indexes both lost over 1%. Later in the day, the US economic calendar will also feature Factory Orders data for January and the Federal Reserve (Fed) will publish its Beige Book.
During the Asian trading hours, the data from Australia showed that the Gross Domestic Product (GDP) expanded at an annual rate of 1.3% in the fourth quarter. This reading followed the 0.8% expansion recorded in the previous quarter and surpassed the market expectation of 1.2%. Meanwhile, Reserve Bank of Australia (RBA) Deputy Governor Andrew Hauser said early Wednesday that the measures of global trade uncertainty were at 50-year highs. After rising more than 0.7% on Tuesday, AUD/USD fluctuates in a tight channel above 0.6250 early Wednesday.
Bank of Japan (BoJ) Deputy Governor Shinichi Uchida said on Wednesday that he doesn't have a preset idea in mind on the pace of future rate hikes. "It is not as if we will be raising rates at each policy meeting," he added. After dropping to its weakest level since early October near 148.00 on Tuesday, USD/JPY staged a decisive rebound and was last seen trading above 149.50.
EUR/USD preserved its bullish momentum on Tuesday and gained about 1.3% on the day. The pair clings to small daily gains and trades comfortably above 1.0600 in the European morning on Wednesday.
GBP/USD extended its rally and rose more than 0.7% on Tuesday. The pair stays in a consolidation phase at around 1.2800 early Wednesday. Later in the day, Bank of England (BoE) Governor Andrew Bailey will testify before the Treasury Select Committee.
Gold managed to build on Monday's gains and climbed toward $2,930 before retreating slightly on Tuesday. At the time of press, XAU/USD was moving sideways below $2,920.
Tariffs FAQs
Tariffs are customs duties levied on certain merchandise imports or a category of products. Tariffs are designed to help local producers and manufacturers be more competitive in the market by providing a price advantage over similar goods that can be imported. Tariffs are widely used as tools of protectionism, along with trade barriers and import quotas.
Although tariffs and taxes both generate government revenue to fund public goods and services, they have several distinctions. Tariffs are prepaid at the port of entry, while taxes are paid at the time of purchase. Taxes are imposed on individual taxpayers and businesses, while tariffs are paid by importers.
There are two schools of thought among economists regarding the usage of tariffs. While some argue that tariffs are necessary to protect domestic industries and address trade imbalances, others see them as a harmful tool that could potentially drive prices higher over the long term and lead to a damaging trade war by encouraging tit-for-tat tariffs.
During the run-up to the presidential election in November 2024, Donald Trump made it clear that he intends to use tariffs to support the US economy and American producers. In 2024, Mexico, China and Canada accounted for 42% of total US imports. In this period, Mexico stood out as the top exporter with $466.6 billion, according to the US Census Bureau. Hence, Trump wants to focus on these three nations when imposing tariffs. He also plans to use the revenue generated through tariffs to lower personal income taxes.
-
06:49
Silver Price Forecast: XAG/USD maintains constructive outlook above $32.00
- Silver price extends the rally to near $32.15 in Wednesday’s early European session, up 0.90% on the day.
- The positive view of Silver prevails above the key 100-day EMA with the bullish RSI indicator.
- The immediate resistance level emerges at the $33.00-$33.05 region; the key support level to watch is in the $31.15-$31.00 zone.
Silver price (XAG/USD) extends its upside to around $32.15 during the early European session on Tuesday. The white metal edges higher amid uncertainty and trade war worries, which boost the safe-haven demand.
Technically, the bullish trend of Silver remains in play as the commodity is well-supported above the key 100-day Exponential Moving Average (EMA) on the daily chart. The upward momentum is reinforced by the 14-day Relative Strength Index (RSI), which stands above the midline near 55.00, displaying bullish momentum in the near term.
The first upside target for white metal emerges at the $33.00-$33.05 region, representing the psychological level and the upper boundary of the Bollinger Band. Extended gains could see a rally to $33.40, the high of February 14. The additional upside filter to watch is 34.55, the high of October 29, 2024.
On the other hand, the confluence of the round figure, the lower limit of the Bollinger Band, and the 100-day EMA in the $31.15-$31.00 zone act as key support levels for XAG/USD. Sustained trading below the mentioned level could see a drop to the next contention level at $29.52, the low of January 25.Silver price (XAG/USD) Daily Chart
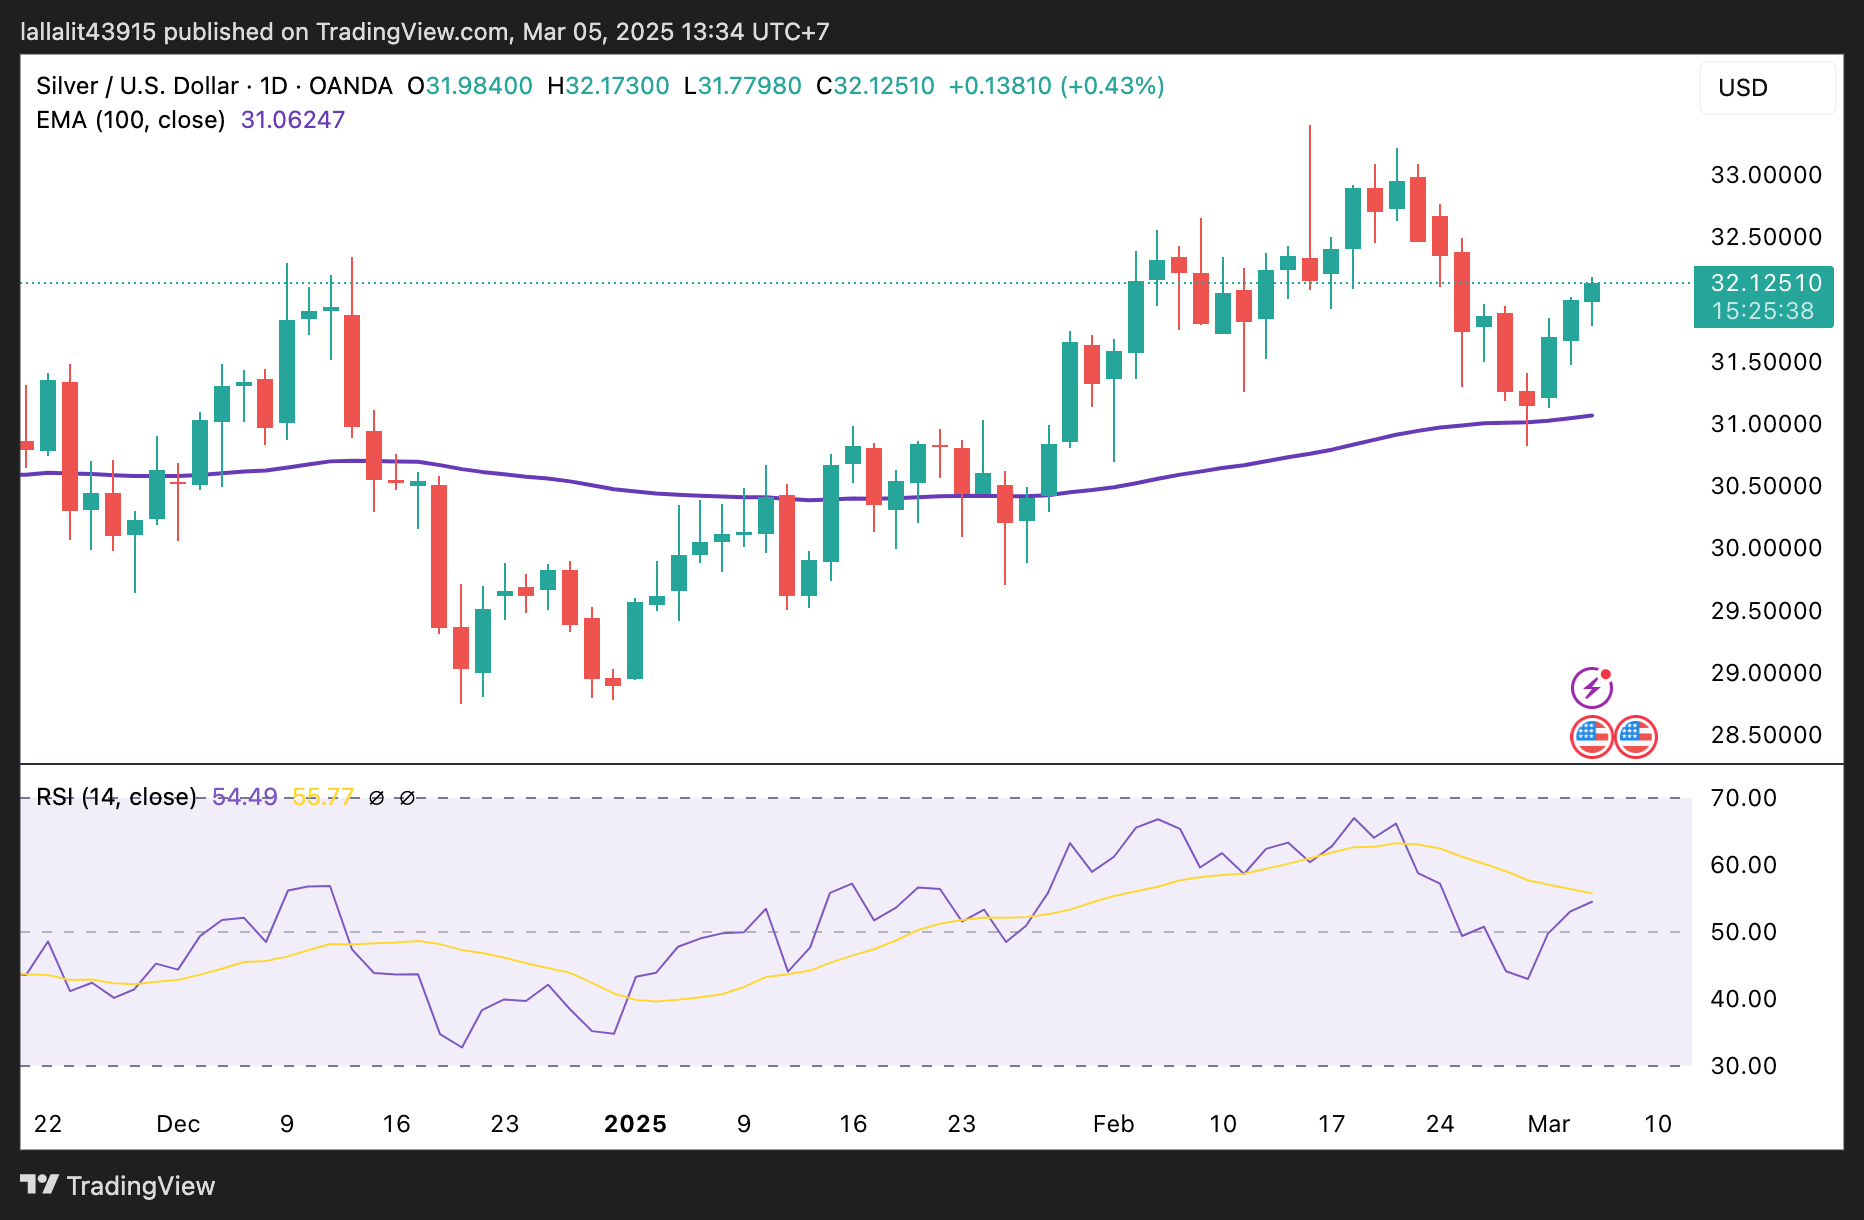
Silver FAQs
Silver is a precious metal highly traded among investors. It has been historically used as a store of value and a medium of exchange. Although less popular than Gold, traders may turn to Silver to diversify their investment portfolio, for its intrinsic value or as a potential hedge during high-inflation periods. Investors can buy physical Silver, in coins or in bars, or trade it through vehicles such as Exchange Traded Funds, which track its price on international markets.
Silver prices can move due to a wide range of factors. Geopolitical instability or fears of a deep recession can make Silver price escalate due to its safe-haven status, although to a lesser extent than Gold's. As a yieldless asset, Silver tends to rise with lower interest rates. Its moves also depend on how the US Dollar (USD) behaves as the asset is priced in dollars (XAG/USD). A strong Dollar tends to keep the price of Silver at bay, whereas a weaker Dollar is likely to propel prices up. Other factors such as investment demand, mining supply – Silver is much more abundant than Gold – and recycling rates can also affect prices.
Silver is widely used in industry, particularly in sectors such as electronics or solar energy, as it has one of the highest electric conductivity of all metals – more than Copper and Gold. A surge in demand can increase prices, while a decline tends to lower them. Dynamics in the US, Chinese and Indian economies can also contribute to price swings: for the US and particularly China, their big industrial sectors use Silver in various processes; in India, consumers’ demand for the precious metal for jewellery also plays a key role in setting prices.
Silver prices tend to follow Gold's moves. When Gold prices rise, Silver typically follows suit, as their status as safe-haven assets is similar. The Gold/Silver ratio, which shows the number of ounces of Silver needed to equal the value of one ounce of Gold, may help to determine the relative valuation between both metals. Some investors may consider a high ratio as an indicator that Silver is undervalued, or Gold is overvalued. On the contrary, a low ratio might suggest that Gold is undervalued relative to Silver.
-
06:36
FX option expiries for Mar 5 NY cut
FX option expiries for Mar 5 NY cut at 10:00 Eastern Time via DTCC can be found below.
EUR/USD: EUR amounts
- 1.0385 1.3b
- 1.0480 1.3b
- 1.0500 1.7b
- 1.0600 782m
GBP/USD: GBP amounts
- 1.2500 883m
USD/JPY: USD amounts
- 149.00 1b
- 151.00 1.3b
AUD/USD: AUD amounts
- 0.6350 1.2b
- 0.6395 581m
USD/CAD: USD amounts
- 1.4400 813m
- 1.4495 1.3b
- 1.4500 1b
- 1.4580 1.5b
- 1.4600 1.4b
-
06:00
Russia S&P Global Services PMI declined to 50.5 in February from previous 54.6
-
05:27
GBP/USD holds positive ground near 1.2800, Bailey's testimony in focus
- GBP/USD posts modest gains around 1.2790 in Wednesday’s early Asian session.
- Investors brace for Bailey's testimony and the US ISM Services Purchasing Managers Index (PMI) for February.
- Rising expectation of more caution on easing from the BoE could help limit the GBP's losses.
The GBP/USD pair trades with mild gains to near 1.2790 during the early European trading hours on Wednesday. The US Dollar (USD) hovered near a three-month low amid concerns over slowing US economic growth and the impact of tariffs.
"Fears about weaker U.S. and global economic activity are manifesting in the markets, with cyclicals driving the sell-off," said Kyle Rodda, senior financial markets analyst at capital.com. Additionally, Trump's 25% levies on Mexican and Canadian imports took effect on Tuesday, alongside a hike in Chinese duties to 20%
Investors will take more cues from the US ISM Services Purchasing Managers Index (PMI) for February, which is due later on Wednesday. In case of a weaker-than-expected outcome, this could drag the Greenback lower against the Pound Sterling (GBP).The Bank of England (BoE) governor Andrew Bailey thinks a renewed bout of inflation is nothing to worry about. Meanwhile, BoE Deputy Governor Dave Ramsden said that the UK central bank should keep a “careful and gradual” approach to monetary policy amid uncertainty over the labor market and global trade.
The expectation of a gradual monetary expansion approach is supported by elevated United Kingdom (UK) wage growth, which could keep inflationary pressures persistently higher."The February BoE cut was accompanied by a dovish vote split, but data has since pointed to more caution on easing. Fourth-quarter growth, December wages and January CPI all came in stronger than expected, and the risks are that we could see some hawkish adjustment in Bailey’s stance,” said ING’s FX analyst Francesco Pesole.
Pound Sterling FAQs
The Pound Sterling (GBP) is the oldest currency in the world (886 AD) and the official currency of the United Kingdom. It is the fourth most traded unit for foreign exchange (FX) in the world, accounting for 12% of all transactions, averaging $630 billion a day, according to 2022 data. Its key trading pairs are GBP/USD, also known as ‘Cable’, which accounts for 11% of FX, GBP/JPY, or the ‘Dragon’ as it is known by traders (3%), and EUR/GBP (2%). The Pound Sterling is issued by the Bank of England (BoE).
The single most important factor influencing the value of the Pound Sterling is monetary policy decided by the Bank of England. The BoE bases its decisions on whether it has achieved its primary goal of “price stability” – a steady inflation rate of around 2%. Its primary tool for achieving this is the adjustment of interest rates. When inflation is too high, the BoE will try to rein it in by raising interest rates, making it more expensive for people and businesses to access credit. This is generally positive for GBP, as higher interest rates make the UK a more attractive place for global investors to park their money. When inflation falls too low it is a sign economic growth is slowing. In this scenario, the BoE will consider lowering interest rates to cheapen credit so businesses will borrow more to invest in growth-generating projects.
Data releases gauge the health of the economy and can impact the value of the Pound Sterling. Indicators such as GDP, Manufacturing and Services PMIs, and employment can all influence the direction of the GBP. A strong economy is good for Sterling. Not only does it attract more foreign investment but it may encourage the BoE to put up interest rates, which will directly strengthen GBP. Otherwise, if economic data is weak, the Pound Sterling is likely to fall.
Another significant data release for the Pound Sterling is the Trade Balance. This indicator measures the difference between what a country earns from its exports and what it spends on imports over a given period. If a country produces highly sought-after exports, its currency will benefit purely from the extra demand created from foreign buyers seeking to purchase these goods. Therefore, a positive net Trade Balance strengthens a currency and vice versa for a negative balance.
-
05:22
AUD/JPY Price Forecast: Rises above 93.50, next barrier appears at nine-day EMA
- AUD/JPY could target the psychological support level at 93.00.
- The 14-day RSI is positioned above the 30 mark, reinforcing the prevailing bearish bias.
- The pair tests the primary barrier at the nine-day EMA of 93.95
AUD/JPY extends its gains for the second consecutive day, trading around 93.60 during Asian hours on Wednesday. However, a technical review of the daily chart reveals the pair remains within a descending channel, signaling a persistent bearish bias.
The 14-day Relative Strength Index (RSI) remains above the 30 level, reinforcing the prevailing bearish bias. Furthermore, the AUD/JPY cross continues to trade below the nine-day Exponential Moving Average (EMA), indicating weaker short-term price momentum.
The AUD/JPY cross may first test the psychological support level at 93.00, followed by the lower boundary of the descending channel at 92.00. A decisive break below this channel could strengthen the bearish bias, potentially pushing the pair toward the 90.13 region—the lowest level since May 2023, last observed on August 5, 2024.
On the upside, the AUD/JPY cross faces its first resistance at the nine-day EMA of 93.95. A breakout above this level could strengthen short-term price momentum, paving the way for a move toward the upper boundary of the descending channel at the psychological level of 96.00, followed by the 50-day EMA at 96.10.
AUD/JPY: Daily Chart
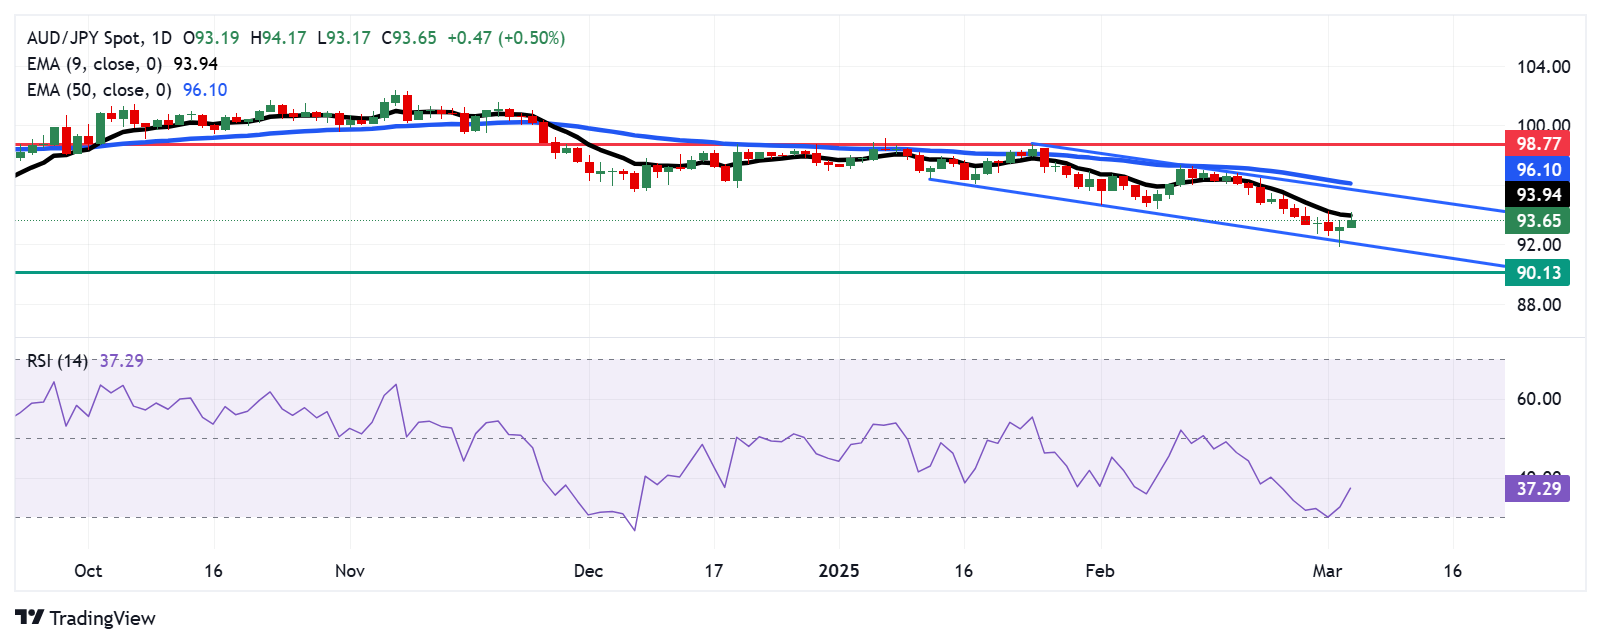
Japanese Yen PRICE Today
The table below shows the percentage change of Japanese Yen (JPY) against listed major currencies today. Japanese Yen was the strongest against the Swiss Franc.
USD EUR GBP JPY CAD AUD NZD CHF USD -0.12% -0.05% 0.48% -0.33% 0.01% 0.02% 0.19% EUR 0.12% 0.07% 0.57% -0.21% 0.13% 0.14% 0.31% GBP 0.05% -0.07% 0.50% -0.27% 0.05% 0.07% 0.24% JPY -0.48% -0.57% -0.50% -0.80% -0.46% -0.46% -0.28% CAD 0.33% 0.21% 0.27% 0.80% 0.34% 0.34% 0.52% AUD -0.01% -0.13% -0.05% 0.46% -0.34% 0.01% 0.18% NZD -0.02% -0.14% -0.07% 0.46% -0.34% -0.01% 0.18% CHF -0.19% -0.31% -0.24% 0.28% -0.52% -0.18% -0.18% The heat map shows percentage changes of major currencies against each other. The base currency is picked from the left column, while the quote currency is picked from the top row. For example, if you pick the Japanese Yen from the left column and move along the horizontal line to the US Dollar, the percentage change displayed in the box will represent JPY (base)/USD (quote).
-
05:16
BoJ’s Uchida: Don't have a preset idea in mind on the pace of future rate hikes
Bank of Japan (BoJ) Deputy Governor Shinichi Uchida said on Wednesday, I “don't have a preset idea in mind on the pace of future rate hikes.”
Further comments
Don't have a preset idea in mind on the pace of future rate hikes.
It is not as if we will be raising rates at each policy meeting.
Wage is key to gauging Japan's trend inflation.
Must be vigilant to how price moves for goods people buy frequently affect inflation expectations.
Will debate policy decision at each meeting looking at economic, price developments.
Market reaction
At press time, USD/JPY holds minor gains near 149.80 following these comments.
Bank of Japan FAQs
The Bank of Japan (BoJ) is the Japanese central bank, which sets monetary policy in the country. Its mandate is to issue banknotes and carry out currency and monetary control to ensure price stability, which means an inflation target of around 2%.
The Bank of Japan embarked in an ultra-loose monetary policy in 2013 in order to stimulate the economy and fuel inflation amid a low-inflationary environment. The bank’s policy is based on Quantitative and Qualitative Easing (QQE), or printing notes to buy assets such as government or corporate bonds to provide liquidity. In 2016, the bank doubled down on its strategy and further loosened policy by first introducing negative interest rates and then directly controlling the yield of its 10-year government bonds. In March 2024, the BoJ lifted interest rates, effectively retreating from the ultra-loose monetary policy stance.
The Bank’s massive stimulus caused the Yen to depreciate against its main currency peers. This process exacerbated in 2022 and 2023 due to an increasing policy divergence between the Bank of Japan and other main central banks, which opted to increase interest rates sharply to fight decades-high levels of inflation. The BoJ’s policy led to a widening differential with other currencies, dragging down the value of the Yen. This trend partly reversed in 2024, when the BoJ decided to abandon its ultra-loose policy stance.
A weaker Yen and the spike in global energy prices led to an increase in Japanese inflation, which exceeded the BoJ’s 2% target. The prospect of rising salaries in the country – a key element fuelling inflation – also contributed to the move.
-
05:00
Singapore Retail Sales (MoM): 2.4% (January) vs -1.5%
-
05:00
Singapore Retail Sales (YoY) climbed from previous -2.9% to 4.5% in January
-
05:00
India HSBC Services PMI above forecasts (57.3) in February: Actual (59)
-
05:00
India HSBC Composite PMI declined to 58.8 in February from previous 60.6
-
04:47
Japan’s Kato: Shared views on FX with US counterpart
Japan’s Finance Minister Katsunobu Kato said on Wednesday that I “have shared views on FX with US counterpart.”
Kato further noted: I “have shared views with US counterpart that FX rates are determined by markets and excessive volatility negatively impacts the economy, financial stability.”
Market reaction
USD/JPY was last seen trading at 149.80, up 0.05% on the day.
-
04:44
India Gold price today: Gold falls, according to FXStreet data
Gold prices fell in India on Wednesday, according to data compiled by FXStreet.
The price for Gold stood at 8,158.50 Indian Rupees (INR) per gram, down compared with the INR 8,172.17 it cost on Tuesday.
The price for Gold decreased to INR 95,150.05 per tola from INR 95,318.62 per tola a day earlier.
Unit measure Gold Price in INR 1 Gram 8,158.50 10 Grams 81,577.20 Tola 95,150.05 Troy Ounce 253,758.00 Daily digest market movers: Gold price surges amid pessimistic US economic outlook
-
The US 10-year Treasury note climbs six basis points (bps) to 4.221%.
-
US real yields, as measured by the US 10-year Treasury Inflation-Protected Securities (TIPS) yield, are rising six bps up to 1.858%.
-
St. Louis Fed President Alberto Musalem said the economic outlook is for continued solid economic growth, but recent data pose some downside risks.
-
Data from Prime Market Terminal revealed that money markets had priced in the Federal Reserve (Fed) easing policy by 74 basis points (bps), up from 70 bps last week.
FXStreet calculates Gold prices in India by adapting international prices (USD/INR) to the local currency and measurement units. Prices are updated daily based on the market rates taken at the time of publication. Prices are just for reference and local rates could diverge slightly.
Gold FAQs
Gold has played a key role in human’s history as it has been widely used as a store of value and medium of exchange. Currently, apart from its shine and usage for jewelry, the precious metal is widely seen as a safe-haven asset, meaning that it is considered a good investment during turbulent times. Gold is also widely seen as a hedge against inflation and against depreciating currencies as it doesn’t rely on any specific issuer or government.
Central banks are the biggest Gold holders. In their aim to support their currencies in turbulent times, central banks tend to diversify their reserves and buy Gold to improve the perceived strength of the economy and the currency. High Gold reserves can be a source of trust for a country’s solvency. Central banks added 1,136 tonnes of Gold worth around $70 billion to their reserves in 2022, according to data from the World Gold Council. This is the highest yearly purchase since records began. Central banks from emerging economies such as China, India and Turkey are quickly increasing their Gold reserves.
Gold has an inverse correlation with the US Dollar and US Treasuries, which are both major reserve and safe-haven assets. When the Dollar depreciates, Gold tends to rise, enabling investors and central banks to diversify their assets in turbulent times. Gold is also inversely correlated with risk assets. A rally in the stock market tends to weaken Gold price, while sell-offs in riskier markets tend to favor the precious metal.
The price can move due to a wide range of factors. Geopolitical instability or fears of a deep recession can quickly make Gold price escalate due to its safe-haven status. As a yield-less asset, Gold tends to rise with lower interest rates, while higher cost of money usually weighs down on the yellow metal. Still, most moves depend on how the US Dollar (USD) behaves as the asset is priced in dollars (XAU/USD). A strong Dollar tends to keep the price of Gold controlled, whereas a weaker Dollar is likely to push Gold prices up.
(An automation tool was used in creating this post.)
-
-
04:33
Gold price depreciates as US Dollar gains ground amid rising Treasury yields
- Gold price declines as rising US Treasury yields weigh on non-yielding assets.
- The precious metal may find support from safe-haven demand amid the implementation of US tariffs.
- Gold also drew buyers as the US halted military aid to Ukraine.
Gold price (XAU/USD) halts its two-day winning streak on Wednesday as rising US Treasury yields pressured non-yielding assets. However, the precious metal could receive upward support from safe-haven demand amid the implementation of US tariffs. Trump's 25% levies on Mexican and Canadian imports took effect on Tuesday, alongside a hike in Chinese duties to 20%, escalating trade tensions and prompting retaliation.
However, US Commerce Secretary Howard Lutnick suggested in a Fox News interview that Trump may reconsider his tariff policy less than 48 hours after its implementation. He noted that if the USMCA rules are followed, relief could be offered. However, the New York Times reported that Trump has privately signaled that he intends to maintain the tariffs.
The safe-haven Gold attracted buyers as the US paused military aid to Ukraine. Bloomberg cited a defense official stating that all US military equipment not yet in Ukraine would be grounded, including weapons in transit via aircraft and ships, as well as those waiting in transit areas in Poland. On Friday, tensions escalated between US President Donald Trump and Ukrainian leader Volodymyr Zelenskyy during peace deal negotiations.
Gold price edges lower amid rising US Treasury yields
- The US Dollar Index (DXY), which measures the USD against six major currencies, trades around 105.70 at the time of writing, edging higher amid rising US Treasury yields with 2- and 10-year yields on US bonds standing at 3.98% and 4.25%, respectively.
- However, USD faced downward pressure amid growing concerns over slowing economic growth and the impact of tariffs on the US economy. Markets bet that President Trump will find a reason to walk back his tariff threats.
- US Commerce Secretary Howard Lutnick stated in a televised interview on Fox News that President Trump may reconsider his tariff policy less than 48 hours after its implementation. Lutnick indicated that if the USMCA rules are followed, Trump is considering offering relief. President Trump's 25% tariffs on goods from Canada and Mexico took effect on Tuesday, alongside a doubling of duties on Chinese imports to 20%.
- Canada confirmed that it will impose retaliatory tariffs on US imports. China’s Commerce Ministry announced on Tuesday that it will slap additional tariffs of up to 15% on imports of key farm products from the US.
- This raises the risk of a global trade war and weighs on investors' sentiment, which should act as a tailwind for the safe-haven precious metal and help limit any deeper losses amid a bearish tone surrounding the US Dollar.
- The Institute for Supply Management's (ISM) Manufacturing PMI slipped to 50.3 in February from 50.9 in the previous month, while the Prices Paid Index jumped to a nearly three-year high amid worries about duties on imports.
- This comes on top of worries that Trump's trade tariffs would undermine consumer spending and fuel concerns about the outlook for the world’s largest economy. This could further lend support to the XAU/USD pair.
Technical Analysis: Gold price holds key psychological support at $2,900 near nine-day EMA
Gold price (XAU/USD) is trading around $2,910 per troy ounce on Wednesday. Technical analysis of the daily chart suggests that the metal price consolidates within an ascending channel pattern, suggesting the bullish bias is intact. Additionally, the 14-day Relative Strength Index (RSI) stays above 50, reinforcing a bearish outlook.
The XAU/USD could target primary resistance at the all-time high of $2,956, recorded on February 24.
On the downside, the immediate support is found at the nine-day Exponential Moving Average (EMA) of $2,902. A break below this level could weaken the short-term price momentum and lead the price to test the lower boundary of the ascending channel at $2,583 level.
XAU/USD: Daily Chart
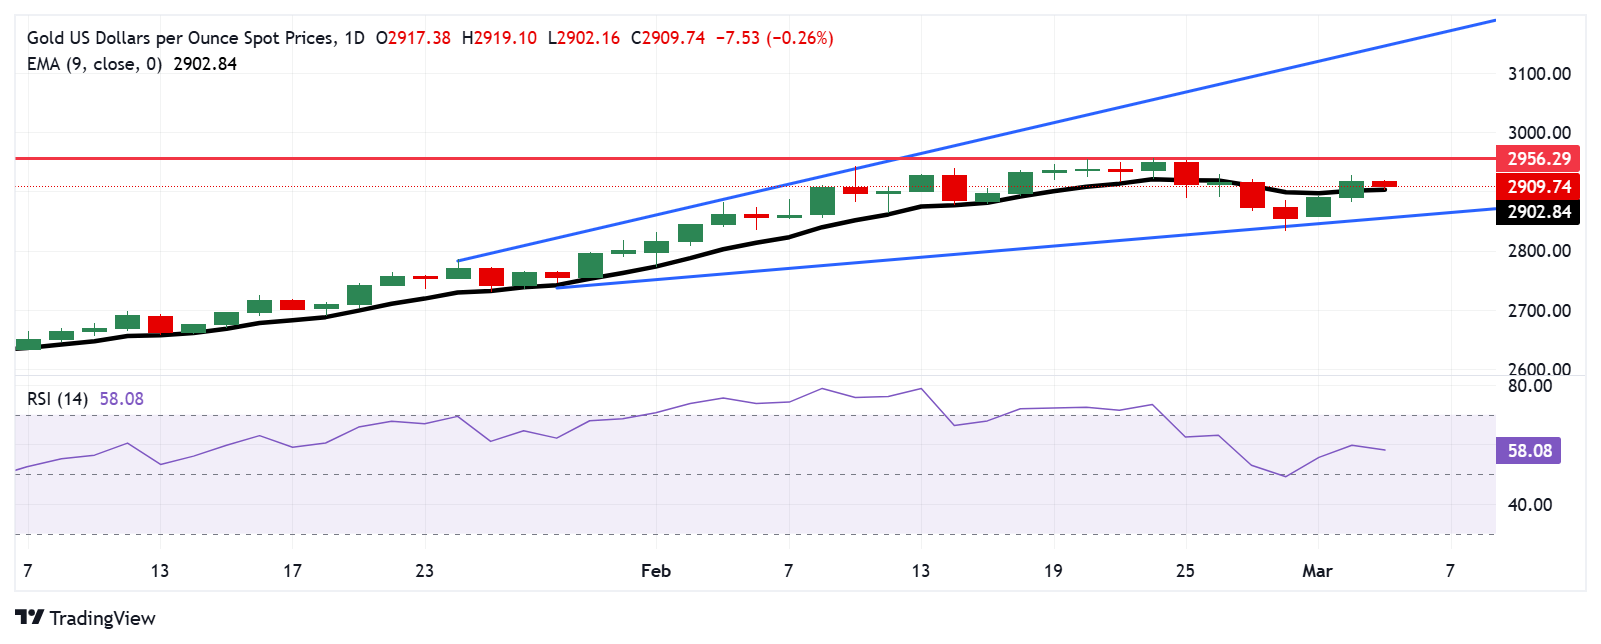
Gold FAQs
Gold has played a key role in human’s history as it has been widely used as a store of value and medium of exchange. Currently, apart from its shine and usage for jewelry, the precious metal is widely seen as a safe-haven asset, meaning that it is considered a good investment during turbulent times. Gold is also widely seen as a hedge against inflation and against depreciating currencies as it doesn’t rely on any specific issuer or government.
Central banks are the biggest Gold holders. In their aim to support their currencies in turbulent times, central banks tend to diversify their reserves and buy Gold to improve the perceived strength of the economy and the currency. High Gold reserves can be a source of trust for a country’s solvency. Central banks added 1,136 tonnes of Gold worth around $70 billion to their reserves in 2022, according to data from the World Gold Council. This is the highest yearly purchase since records began. Central banks from emerging economies such as China, India and Turkey are quickly increasing their Gold reserves.
Gold has an inverse correlation with the US Dollar and US Treasuries, which are both major reserve and safe-haven assets. When the Dollar depreciates, Gold tends to rise, enabling investors and central banks to diversify their assets in turbulent times. Gold is also inversely correlated with risk assets. A rally in the stock market tends to weaken Gold price, while sell-offs in riskier markets tend to favor the precious metal.
The price can move due to a wide range of factors. Geopolitical instability or fears of a deep recession can quickly make Gold price escalate due to its safe-haven status. As a yield-less asset, Gold tends to rise with lower interest rates, while higher cost of money usually weighs down on the yellow metal. Still, most moves depend on how the US Dollar (USD) behaves as the asset is priced in dollars (XAU/USD). A strong Dollar tends to keep the price of Gold controlled, whereas a weaker Dollar is likely to push Gold prices up.
-
03:10
USD/JPY drifts higher above 149.50 as Trump speaks
- USD/JPY edges higher to around 149.75 in Wednesday’s Asian session, up 0.50% on the day.
- Traders brace for Trump’s speech for fresh impetus.
- Fears about weaker US economic activity and a hawkish stance from the BoJ might cap the upside for the pair.
The USD/JPY pair attracts some buyers to around 149.75 during the Asian trading hours on Tuesday. The US Dollar (USD) gains ground as traders await more cues from US President Donald Trump’s speech. Later on Wednesday, the US ISM Services Purchasing Managers Index (PMI) for February will be in the spotlight.
Meanwhile, the US Dollar Index (DXY), a measure of the USD's value relative to its most significant trading partners' currencies, currently trades around 105.75, adding 0.18% on the day. However, the upside for the Greenback might be limited amid concerns over slowing economic growth and the impact of tariffs.
"Fears about weaker U.S. and global economic activity are manifesting in the markets, with cyclicals driving the sell-off," said Kyle Rodda, senior financial markets analyst at Capital.com.
The hawkish remarks from the Japanese authorities migth provide some support to the Japanese Yen (JPY) and create a headwind for USD/JPY. The BoJ Deputy Governor Shinichi Uchida said on Wednesday that the Japanese central bank will continue raising interest rates if its economic forecasts are met. Uchida added that Japan’s exit from its long-standing ultra-loose monetary policy has only just begun.
The BoJ is widely anticipated to continue hiking this year, supported by improving economic conditions, rising prices, and stronger wage growth, which align with the Japanese central bank’s policy normalization efforts.Japanese Yen FAQs
The Japanese Yen (JPY) is one of the world’s most traded currencies. Its value is broadly determined by the performance of the Japanese economy, but more specifically by the Bank of Japan’s policy, the differential between Japanese and US bond yields, or risk sentiment among traders, among other factors.
One of the Bank of Japan’s mandates is currency control, so its moves are key for the Yen. The BoJ has directly intervened in currency markets sometimes, generally to lower the value of the Yen, although it refrains from doing it often due to political concerns of its main trading partners. The BoJ ultra-loose monetary policy between 2013 and 2024 caused the Yen to depreciate against its main currency peers due to an increasing policy divergence between the Bank of Japan and other main central banks. More recently, the gradually unwinding of this ultra-loose policy has given some support to the Yen.
Over the last decade, the BoJ’s stance of sticking to ultra-loose monetary policy has led to a widening policy divergence with other central banks, particularly with the US Federal Reserve. This supported a widening of the differential between the 10-year US and Japanese bonds, which favored the US Dollar against the Japanese Yen. The BoJ decision in 2024 to gradually abandon the ultra-loose policy, coupled with interest-rate cuts in other major central banks, is narrowing this differential.
The Japanese Yen is often seen as a safe-haven investment. This means that in times of market stress, investors are more likely to put their money in the Japanese currency due to its supposed reliability and stability. Turbulent times are likely to strengthen the Yen’s value against other currencies seen as more risky to invest in.
-
03:00
US President Trump: Will impose tariffs on products not made in the US
US President Donald Trump is addressing a joint session of Congress at the Capitol Building, in Washington DC, on Wednesday.
It’s his first Congressional address after returning to power.
Key quotes
To my fellow citizens, America is back.
Our country is on the verge of a comeback the likes of which the world has never witnessed, and perhaps will never witness again.
Reiterate call to drill more oil in the US.
Federal spending reductions will aid in reducing debt.
Will balance the federal budget.
Urge to lower mortgage rates.
Urge Congress to pass tax cut.
Urge Congress to implement tax reductions.
To seek permanent income tax cuts across the board.
Reiterates call for no tax on gratuities and social security.
Any bureaucrat that resist our change will be removed.
Want to make interest payments on car loans tax deductible, only if cars are made in us.
He talked to the top three automakers on Tuesday.
To impose tariffs on products not made in the US.
Will start utilizing tariffs.
To stop subsidizing Mexico, Canada.
Chips Act is a horrible thing.
We should get rid of the Chips Act.
Reiterates reciprocal tariffs to take effect from April 2.
Adjustment period possible for farmers.
Reiterates 25% tariffs for aluminum, copper, steel.
Tariffs will lead to some disturbance.
Require Mexico, Canada to take additional action.
To send a Congress detailed plan on border security.
Market reaction
The US Dollar Index (DXY) is picking up fresh bids on US President Trump’s comments, adding 0.21% on the day at 105.77 as of writing.
US Dollar PRICE Today
The table below shows the percentage change of US Dollar (USD) against listed major currencies today. US Dollar was the strongest against the Japanese Yen.
USD EUR GBP JPY CAD AUD NZD CHF USD 0.06% 0.12% 0.43% -0.18% 0.26% 0.19% 0.27% EUR -0.06% 0.06% 0.38% -0.23% 0.20% 0.14% 0.22% GBP -0.12% -0.06% 0.27% -0.29% 0.13% 0.07% 0.15% JPY -0.43% -0.38% -0.27% -0.60% -0.18% -0.24% -0.16% CAD 0.18% 0.23% 0.29% 0.60% 0.43% 0.37% 0.46% AUD -0.26% -0.20% -0.13% 0.18% -0.43% -0.06% 0.02% NZD -0.19% -0.14% -0.07% 0.24% -0.37% 0.06% 0.09% CHF -0.27% -0.22% -0.15% 0.16% -0.46% -0.02% -0.09% The heat map shows percentage changes of major currencies against each other. The base currency is picked from the left column, while the quote currency is picked from the top row. For example, if you pick the US Dollar from the left column and move along the horizontal line to the Japanese Yen, the percentage change displayed in the box will represent USD (base)/JPY (quote).
-
02:39
USD/INR holds steady ahead of Indian PMI data
- The Indian Rupee trades flat in Wednesday’s early Asian session.
- Renewed USD demand and persistent outflows by foreign institutional investors could undermine the INR.
- India’s HSBC PMI and US ISM Services PMI will be the highlights later on Wednesday.
The Indian Rupee (INR) flat lines on Wednesday. The rising US Dollar (USD) buying by foreign banks and Indian importers, especially local oil companies, might exert some selling pressure on the local currency. Furthermore, the ongoing foreign outflows amid increasing global trade tensions could drag the INR lower. Foreign investors have pulled over $14 billion from Indian equities in 2025.
On the other hand, Crude oil prices are trading near the lowest in almost three months as OPEC+ said it will proceed with a plan to increase oil production from April. This, in turn, could help limit the INR’s losses as India is the world's third-largest oil consumer.
Later on Wednesday, investors will brace for India’s HSBC Composite Purchasing Managers Index (PMI) and Services PMI. On the US docket, the ISM Services PMI will take center stage.Indian Rupee steadies despite escalating global trade tensions
- The RBI's net short dollar position in forwards and futures hit a record high of $77.5 billion in January 2025, as per data released after market hours on Friday.
- President Donald Trump's 25% tariffs on goods from Canada and Mexico took effect Tuesday, along with a doubling of duties on Chinese goods to 20%.
- US Commerce Secretary Howard Lutnick hinted that Trump may be preparing to pivot on his own tariffs less than 48 hours after imposing them.
- New York Fed President John Williams said late Tuesday that although inflationary pressures have eased and the US labor market appears strong, the US central bank will have to take a close look at the fallout from the US tariff actions.
USD/INR’s constructive outlook remains in place
The Indian Rupee trades on a flat note on the day. The USD/INR pair keeps the bullish vibe on the daily chart as the price holds above the key 100-day Exponential Moving Average (EMA). The 14-day Relative Strength Index (RSI) is located above the midline near 60.00, suggesting that the path of least resistance is to the upside.
The first upside barrier for USD/INR emerges at 87.53, the high of February 28. Further north, the next hurdle to watch is an all-time high near 88.00, en route to 88.50.
In the bearish case, the 87.05-87.00 zone acts as a crucial support level for the pair. A breach of this level could expose 86.48, the low of February 21, followed by 86.14, the low of January 27.Indian Rupee FAQs
The Indian Rupee (INR) is one of the most sensitive currencies to external factors. The price of Crude Oil (the country is highly dependent on imported Oil), the value of the US Dollar – most trade is conducted in USD – and the level of foreign investment, are all influential. Direct intervention by the Reserve Bank of India (RBI) in FX markets to keep the exchange rate stable, as well as the level of interest rates set by the RBI, are further major influencing factors on the Rupee.
The Reserve Bank of India (RBI) actively intervenes in forex markets to maintain a stable exchange rate, to help facilitate trade. In addition, the RBI tries to maintain the inflation rate at its 4% target by adjusting interest rates. Higher interest rates usually strengthen the Rupee. This is due to the role of the ‘carry trade’ in which investors borrow in countries with lower interest rates so as to place their money in countries’ offering relatively higher interest rates and profit from the difference.
Macroeconomic factors that influence the value of the Rupee include inflation, interest rates, the economic growth rate (GDP), the balance of trade, and inflows from foreign investment. A higher growth rate can lead to more overseas investment, pushing up demand for the Rupee. A less negative balance of trade will eventually lead to a stronger Rupee. Higher interest rates, especially real rates (interest rates less inflation) are also positive for the Rupee. A risk-on environment can lead to greater inflows of Foreign Direct and Indirect Investment (FDI and FII), which also benefit the Rupee.
Higher inflation, particularly, if it is comparatively higher than India’s peers, is generally negative for the currency as it reflects devaluation through oversupply. Inflation also increases the cost of exports, leading to more Rupees being sold to purchase foreign imports, which is Rupee-negative. At the same time, higher inflation usually leads to the Reserve Bank of India (RBI) raising interest rates and this can be positive for the Rupee, due to increased demand from international investors. The opposite effect is true of lower inflation.
-
02:29
NZD/USD trades flat around 0.5650 despite upbeat China Services PMI, Governor Orr resigns
- NZD/USD holds steady after the release of an upbeat China Services Purchasing Managers’ Index.
- Deputy Governor Christian Hawkesby will serve as acting governor until March 31 following Governor Adrian Orr’s resignation.
- US Commerce Secretary Lutnick suggested that President Trump may reconsider his tariff policy less than 48 hours after its implementation.
NZD/USD trims its daily gains, trading around 0.5650 during Asian hours on Wednesday. The pair remains steady following the release of China’s Services Purchasing Managers’ Index (PMI), which unexpectedly rose to 51.4 in February from 51.0 in January, exceeding market expectations of 50.8. Given China’s close trading relationship with New Zealand, any change in the Chinese economy could impact the New Zealand Dollar (NZD).
Reserve Bank of New Zealand (RBNZ) Governor Adrian Orr has resigned, stating that he leaves the role with inflation at target and the economy in a cyclical recovery following COVID-related disruptions. Deputy Governor Christian Hawkesby will serve as acting governor until March 31, after which the New Zealand Finance Minister will appoint a temporary replacement.
The US Dollar (USD) remains under pressure amid concerns over slowing economic growth and the impact of tariffs. President Trump's 25% tariffs on goods from Canada and Mexico took effect on Tuesday, alongside a doubling of duties on Chinese imports to 20%.
US Commerce Secretary Howard Lutnick suggested in a Fox News interview that Trump may reconsider his tariff policy less than 48 hours after its implementation. He noted that if the USMCA rules are followed, relief could be offered. However, *The New York Times* reported that Trump has privately signaled he intends to maintain the tariffs.
The US Dollar Index (DXY), which tracks the Greenback against six major currencies, hovers around 105.70. The USD faces downward pressure as markets speculate that Trump may eventually soften his stance on tariffs.
Economic Indicator
Caixin Services PMI
The Caixin Services Purchasing Managers Index (PMI), released on a monthly basis by Caixin Insight Group and S&P Global, is a leading indicator gauging business activity in China’s services sector. The data is derived from surveys of senior executives at both private-sector and state-owned companies. Survey responses reflect the change, if any, in the current month compared to the previous month and can anticipate changing trends in official data series such as Gross Domestic Product (GDP), industrial production, employment and inflation. The index varies between 0 and 100, with levels of 50.0 signaling no change over the previous month. A reading above 50 indicates that the services economy is generally expanding, a bullish sign for the Renminbi (CNY). Meanwhile, a reading below 50 signals that activity among service providers is generally declining, which is seen as bearish for CNY.
Read more.Last release: Wed Mar 05, 2025 01:45
Frequency: Monthly
Actual: 51.4
Consensus: 50.8
Previous: 51
Source: IHS Markit
-
01:57
BoJ’s Uchida: If forecasts met the Bank will adjust policy further
Bank of Japan (BoJ) Deputy Governor Shinichi Uchida said on Wednesday, “if forecasts met the Bank will adjust policy further.”
Additional quotes
If forecasts met the Bank will adjust policy further.
It will be possible for the bank to proceed while examining the response of economic activity if it raises the policy interest rate at a pace in line with expectations.
At present, the Bank does not know for certain what the interest rate level that is neutral to economic activity and prices will be.
The Bank will examine the response of economic activity and prices as it raises the policy interest rate.
If the outlook for economic activity and prices presented in the outlook report is realized, the bank will accordingly continue to raise the policy interest rate and adjust the degree of monetary accommodation.
Uncertainties regarding the global economy remain high, and due attention continues to be warranted here.
Wages are likely to keep rising steadily and support private consumption.
Adjusting the degree of monetary accommodation gradually, while maintaining accommodative financial conditions, will lead to stability in economic activity and prices in the long run.
Even after raising the policy interest rate to around 0.5%, accommodative financial conditions have continued to firmly support the economy.
Private consumption has been on a moderate increasing trend.
Corporate capex is likely to keep rising for an extended period.
Japan's economy is expected to keep growing at a pace above the potential growth rate.
Japan's economy has recovered moderately, although some weakness has been seen.
The decrease in the amount outstanding of its JGB holdings has been limited, and therefore monetary easing effects are likely to continue at a large scale.
In principle, long-term interest rates are to be formed freely in financial markets.
In an exceptional situation where long-term interest rates rose rapidly in a manner that differed from normal market developments, the bank would make a nimble response, such as increasing JGB purchases.
The Bank has not changed its thinking on the policy conduct regarding the short-term policy interest rate and on JGB purchases.
Market reaction
At press time, USD/JPY holds gains near 150.00 following these comments, up 0.20% on the day.
-
01:47
China’s Caixin Services PMI surprisingly jumps to 51.4 in February vs. 50.8 expected
China's Services Purchasing Managers' Index (PMI) unexpectedly firmed to 51.4 in February from 51 in January, the latest data published by Caixin showed Wednesday.
The market consensus was for a 50.8 reading.
AUD/USD reaction to China’s Services PMI
At the time of writing, the AUD/USD pair is trading modestly flat on the day just above 0.6250, unimpressed by upbeat Chinese data.
Australian Dollar FAQs
One of the most significant factors for the Australian Dollar (AUD) is the level of interest rates set by the Reserve Bank of Australia (RBA). Because Australia is a resource-rich country another key driver is the price of its biggest export, Iron Ore. The health of the Chinese economy, its largest trading partner, is a factor, as well as inflation in Australia, its growth rate and Trade Balance. Market sentiment – whether investors are taking on more risky assets (risk-on) or seeking safe-havens (risk-off) – is also a factor, with risk-on positive for AUD.
The Reserve Bank of Australia (RBA) influences the Australian Dollar (AUD) by setting the level of interest rates that Australian banks can lend to each other. This influences the level of interest rates in the economy as a whole. The main goal of the RBA is to maintain a stable inflation rate of 2-3% by adjusting interest rates up or down. Relatively high interest rates compared to other major central banks support the AUD, and the opposite for relatively low. The RBA can also use quantitative easing and tightening to influence credit conditions, with the former AUD-negative and the latter AUD-positive.
China is Australia’s largest trading partner so the health of the Chinese economy is a major influence on the value of the Australian Dollar (AUD). When the Chinese economy is doing well it purchases more raw materials, goods and services from Australia, lifting demand for the AUD, and pushing up its value. The opposite is the case when the Chinese economy is not growing as fast as expected. Positive or negative surprises in Chinese growth data, therefore, often have a direct impact on the Australian Dollar and its pairs.
Iron Ore is Australia’s largest export, accounting for $118 billion a year according to data from 2021, with China as its primary destination. The price of Iron Ore, therefore, can be a driver of the Australian Dollar. Generally, if the price of Iron Ore rises, AUD also goes up, as aggregate demand for the currency increases. The opposite is the case if the price of Iron Ore falls. Higher Iron Ore prices also tend to result in a greater likelihood of a positive Trade Balance for Australia, which is also positive of the AUD.
The Trade Balance, which is the difference between what a country earns from its exports versus what it pays for its imports, is another factor that can influence the value of the Australian Dollar. If Australia produces highly sought after exports, then its currency will gain in value purely from the surplus demand created from foreign buyers seeking to purchase its exports versus what it spends to purchase imports. Therefore, a positive net Trade Balance strengthens the AUD, with the opposite effect if the Trade Balance is negative.
-
01:45
China Caixin Services PMI came in at 51.4, above forecasts (50.8) in February
-
01:43
Australian Dollar holds gains following Q4 GDP data release
- The Australian Dollar strengthens as the US Dollar weakens amid rising concerns over slowing US economic growth.
- Australia's Gross Domestic Product grew by 0.6% QoQ in Q4 2024, surpassing market expectations of 0.5%.
- US Commerce Secretary Lutnick indicated that Trump may reconsider his tariff policy less than 48 hours after its implementation.
The Australian Dollar (AUD) extends its gains for the third consecutive session on Wednesday. The AUD/USD pair strengthens as the US Dollar (USD) remains under pressure amid growing concerns over slowing economic growth and the impact of tariffs on the US economy.
The AUD remains resilient following key economic data released on Wednesday. Australia's Gross Domestic Product (GDP) expanded by 0.6% quarter-over-quarter in Q4 2024, surpassing the 0.3% growth recorded in Q3 and exceeding market expectations of 0.5%. On an annual basis, GDP grew by 1.3% in Q4, up from 0.8% in the previous quarter.
The Judo Bank Composite Purchasing Managers’ Index (PMI) declined to 50.6 in February from 51.1 in January, marking the fifth consecutive month of growth in business activity, albeit at a slower pace. The Services PMI also eased to 50.8 from 51.2, reflecting continued expansion for the thirteenth straight month, though at a moderated rate.
Reserve Bank of Australia (RBA) Deputy Governor Andrew Hauser highlighted that global trade uncertainty is at a 50-year high. Hauser warned that uncertainty stemming from US President Donald Trump's tariffs could prompt businesses and households to delay planning and investment, potentially weighing on economic growth.
Australian Dollar extends gains as US Dollar continues to lose ground
- The US Dollar Index (DXY), which measures the USD against six major currencies, trades around 105.60 at the time of writing. The Greenback faces downward pressure as markets bet that President Trump will find a reason to walk back his tariff threats.
- US Commerce Secretary Howard Lutnick stated in a televised interview on Fox News that President Trump may reconsider his tariff policy less than 48 hours after its implementation. Lutnick indicated that if the USMCA rules are followed, Trump is considering offering relief.
- President Trump's 25% tariffs on goods from Canada and Mexico took effect on Tuesday, alongside a doubling of duties on Chinese imports to 20%.
- US ISM Manufacturing PMI came in at 50.3, slightly below the 50.5 forecast and down from January’s 50.9. In contrast, S&P Global’s final Manufacturing PMI for February surpassed expectations at 52.7, improving from its preliminary reading.
- The US PCE inflation report met expectations, with the monthly headline PCE holding steady at 0.3%. Core PCE rose slightly to 0.3% from December’s 0.2%, while the annual headline PCE stood at 2.6%, slightly exceeding projections but unchanged from December’s figure. Core PCE eased to 2.6%, down from a revised 2.9% in December.
- According to Bloomberg, citing a defense official, the US has "paused" all current military aid to Ukraine. The official stated that all US military equipment not yet in Ukraine would be halted, including weapons in transit via aircraft and ships, as well as those waiting in transit areas in Poland. The pause was reportedly ordered by President Trump, with Defense Secretary Pete Hegseth directed to implement the decision. On Friday, Tensions escalated between US President Donald Trump and Ukrainian leader Volodymyr Zelenskyy during peace deal negotiations.
- Chinese authorities announced early Wednesday that they are setting a target of approximately 5% economic growth for 2025, with a 2% goal for the Consumer Price Index (CPI). Additionally, China plans to implement a more proactive fiscal policy while ensuring stability in both the real estate and stock markets.
- The RBA’s February Meeting Minutes highlighted downside risks to the economy. While the Board acknowledged the labor market's strength as a key reason to maintain rates, it noted that the current tightness was inconsistent with a 2.5% inflation target. Ultimately, the Board saw a stronger case for cutting rates.
- Australia’s Retail Sales, a key indicator of consumer spending, increased by 0.3% month-over-month in January, rebounding from a 0.1% decline in December. However, the ANZ-Roy Morgan Australian Consumer Confidence Index dropped to 87.7 from 89.8 in the previous week, when it had reached its highest level since May 2022.
- The S&P Global Australian Manufacturing Purchasing Managers Index (PMI) was revised down to 50.4 in February from an initial estimate of 50.6 but remained above January's 50.2. This marked the second consecutive month of improvement in manufacturing conditions and the strongest growth since February 2023.
Australian Dollar rises above 0.6250; next barrier appears at nine-day EMA
AUD/USD is trading near 0.6260 on Wednesday, with technical analysis of the daily chart indicating the pair remains below the nine-day Exponential Moving Average (EMA), suggesting weakening short-term momentum. Additionally, the 14-day Relative Strength Index (RSI) stays below 50, reinforcing a bearish outlook.
On the downside, the AUD/USD pair could target the four-week low of 0.6187, recorded on March 5. A break below this level may open the door for further declines toward 0.6087, the lowest level since April 2020, recorded on February 3.
Immediate resistance is initially seen at the nine-day EMA of 0.6271, aligning with the trend line. A stronger barrier lies at the 50-day EMA of 0.6303.
AUD/USD: Daily Chart
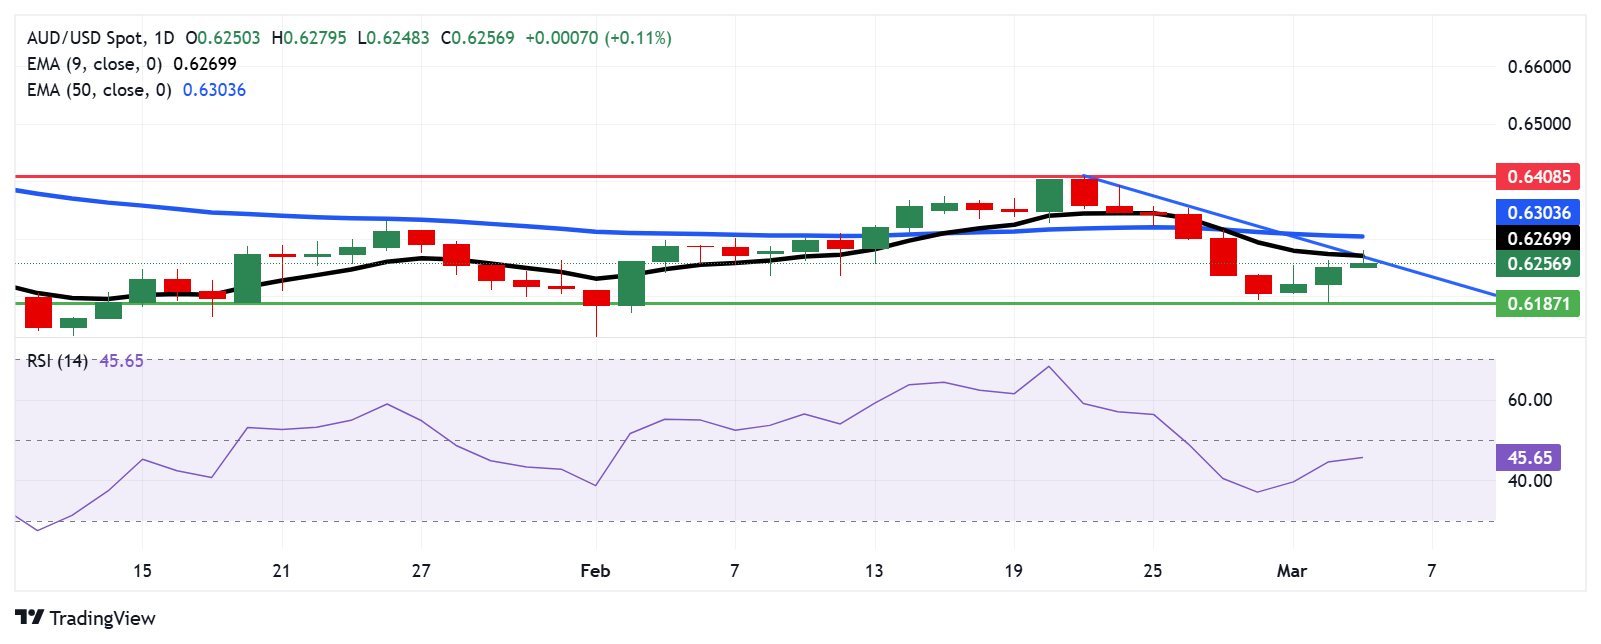
Australian Dollar PRICE Today
The table below shows the percentage change of Australian Dollar (AUD) against listed major currencies today. Australian Dollar was the strongest against the Japanese Yen.
USD EUR GBP JPY CAD AUD NZD CHF USD -0.04% 0.03% 0.68% -0.43% -0.18% -0.20% 0.25% EUR 0.04% 0.08% 0.67% -0.38% -0.13% -0.15% 0.30% GBP -0.03% -0.08% 0.58% -0.46% -0.21% -0.23% 0.22% JPY -0.68% -0.67% -0.58% -1.08% -0.84% -0.87% -0.41% CAD 0.43% 0.38% 0.46% 1.08% 0.25% 0.22% 0.68% AUD 0.18% 0.13% 0.21% 0.84% -0.25% -0.02% 0.43% NZD 0.20% 0.15% 0.23% 0.87% -0.22% 0.02% 0.46% CHF -0.25% -0.30% -0.22% 0.41% -0.68% -0.43% -0.46% The heat map shows percentage changes of major currencies against each other. The base currency is picked from the left column, while the quote currency is picked from the top row. For example, if you pick the Australian Dollar from the left column and move along the horizontal line to the US Dollar, the percentage change displayed in the box will represent AUD (base)/USD (quote).
Australian Dollar FAQs
One of the most significant factors for the Australian Dollar (AUD) is the level of interest rates set by the Reserve Bank of Australia (RBA). Because Australia is a resource-rich country another key driver is the price of its biggest export, Iron Ore. The health of the Chinese economy, its largest trading partner, is a factor, as well as inflation in Australia, its growth rate and Trade Balance. Market sentiment – whether investors are taking on more risky assets (risk-on) or seeking safe-havens (risk-off) – is also a factor, with risk-on positive for AUD.
The Reserve Bank of Australia (RBA) influences the Australian Dollar (AUD) by setting the level of interest rates that Australian banks can lend to each other. This influences the level of interest rates in the economy as a whole. The main goal of the RBA is to maintain a stable inflation rate of 2-3% by adjusting interest rates up or down. Relatively high interest rates compared to other major central banks support the AUD, and the opposite for relatively low. The RBA can also use quantitative easing and tightening to influence credit conditions, with the former AUD-negative and the latter AUD-positive.
China is Australia’s largest trading partner so the health of the Chinese economy is a major influence on the value of the Australian Dollar (AUD). When the Chinese economy is doing well it purchases more raw materials, goods and services from Australia, lifting demand for the AUD, and pushing up its value. The opposite is the case when the Chinese economy is not growing as fast as expected. Positive or negative surprises in Chinese growth data, therefore, often have a direct impact on the Australian Dollar and its pairs.
Iron Ore is Australia’s largest export, accounting for $118 billion a year according to data from 2021, with China as its primary destination. The price of Iron Ore, therefore, can be a driver of the Australian Dollar. Generally, if the price of Iron Ore rises, AUD also goes up, as aggregate demand for the currency increases. The opposite is the case if the price of Iron Ore falls. Higher Iron Ore prices also tend to result in a greater likelihood of a positive Trade Balance for Australia, which is also positive of the AUD.
The Trade Balance, which is the difference between what a country earns from its exports versus what it pays for its imports, is another factor that can influence the value of the Australian Dollar. If Australia produces highly sought after exports, then its currency will gain in value purely from the surplus demand created from foreign buyers seeking to purchase its exports versus what it spends to purchase imports. Therefore, a positive net Trade Balance strengthens the AUD, with the opposite effect if the Trade Balance is negative.
-
01:32
China's Finance Ministry says will step up the pace of fiscal spending
China's finance ministry stated early Wednesday that the government will increase the intensity of fiscal spending and will adopt more proactive, sustainable, robust, and effective fiscal policies in 2025.
Key quotes
Increasing negative impacts from changes in the external environment present numerous difficulties and challenges to China's economy.
This will increase pressure for China to maintain a balanced budget in 2025.
China's sustained economic recovery and growth will support an increase in fiscal revenue, but many constraints will remain.
Insufficient domestic demand and price levels will continue to weigh down government revenues, which are calculated based on current prices.
Some major tax-contributing industries are experiencing a slowdown in growth, while some firms face difficulties in production and operations.
China is also confronted with considerable uncertainty in foreign trade.
China will continue to leverage fiscal policy to implement counter-cyclical adjustments.
China will increase the intensity of fiscal spending.
China will implement a more proactive fiscal policy and improve the fiscal spending structure.
China will adopt more proactive, sustainable, robust, and effective fiscal policies in 2025.
China will accelerate the pace of fiscal spending.
Market reaction
At the time of writing, AUD/USD is holding higher ground near 0.6255, adding 0.09% on the day.
Australian Dollar FAQs
One of the most significant factors for the Australian Dollar (AUD) is the level of interest rates set by the Reserve Bank of Australia (RBA). Because Australia is a resource-rich country another key driver is the price of its biggest export, Iron Ore. The health of the Chinese economy, its largest trading partner, is a factor, as well as inflation in Australia, its growth rate and Trade Balance. Market sentiment – whether investors are taking on more risky assets (risk-on) or seeking safe-havens (risk-off) – is also a factor, with risk-on positive for AUD.
The Reserve Bank of Australia (RBA) influences the Australian Dollar (AUD) by setting the level of interest rates that Australian banks can lend to each other. This influences the level of interest rates in the economy as a whole. The main goal of the RBA is to maintain a stable inflation rate of 2-3% by adjusting interest rates up or down. Relatively high interest rates compared to other major central banks support the AUD, and the opposite for relatively low. The RBA can also use quantitative easing and tightening to influence credit conditions, with the former AUD-negative and the latter AUD-positive.
China is Australia’s largest trading partner so the health of the Chinese economy is a major influence on the value of the Australian Dollar (AUD). When the Chinese economy is doing well it purchases more raw materials, goods and services from Australia, lifting demand for the AUD, and pushing up its value. The opposite is the case when the Chinese economy is not growing as fast as expected. Positive or negative surprises in Chinese growth data, therefore, often have a direct impact on the Australian Dollar and its pairs.
Iron Ore is Australia’s largest export, accounting for $118 billion a year according to data from 2021, with China as its primary destination. The price of Iron Ore, therefore, can be a driver of the Australian Dollar. Generally, if the price of Iron Ore rises, AUD also goes up, as aggregate demand for the currency increases. The opposite is the case if the price of Iron Ore falls. Higher Iron Ore prices also tend to result in a greater likelihood of a positive Trade Balance for Australia, which is also positive of the AUD.
The Trade Balance, which is the difference between what a country earns from its exports versus what it pays for its imports, is another factor that can influence the value of the Australian Dollar. If Australia produces highly sought after exports, then its currency will gain in value purely from the surplus demand created from foreign buyers seeking to purchase its exports versus what it spends to purchase imports. Therefore, a positive net Trade Balance strengthens the AUD, with the opposite effect if the Trade Balance is negative.
-
01:09
US President Donald Trump readies order to bolster US shipbuilders and punish China - WSJ
The Wall Street Journal reported early Wednesday that the Trump administration is preparing an executive order to bolster US shipbuilders and cut Chinese dominance of the global maritime industry.
The order includes 18 measures ranging from raising revenue from fees on Chinese-built ships and cranes entering the United States to establishing a new office at the National Security Council to support the domestic maritime sector.Market reaction
At the time of writing, AUD/USD is holding higher ground near 0.6255, adding 0.09% on the day.
US-China Trade War FAQs
Generally speaking, a trade war is an economic conflict between two or more countries due to extreme protectionism on one end. It implies the creation of trade barriers, such as tariffs, which result in counter-barriers, escalating import costs, and hence the cost of living.
An economic conflict between the United States (US) and China began early in 2018, when President Donald Trump set trade barriers on China, claiming unfair commercial practices and intellectual property theft from the Asian giant. China took retaliatory action, imposing tariffs on multiple US goods, such as automobiles and soybeans. Tensions escalated until the two countries signed the US-China Phase One trade deal in January 2020. The agreement required structural reforms and other changes to China’s economic and trade regime and pretended to restore stability and trust between the two nations. However, the Coronavirus pandemic took the focus out of the conflict. Yet, it is worth mentioning that President Joe Biden, who took office after Trump, kept tariffs in place and even added some additional levies.
The return of Donald Trump to the White House as the 47th US President has sparked a fresh wave of tensions between the two countries. During the 2024 election campaign, Trump pledged to impose 60% tariffs on China once he returned to office, which he did on January 20, 2025. With Trump back, the US-China trade war is meant to resume where it was left, with tit-for-tat policies affecting the global economic landscape amid disruptions in global supply chains, resulting in a reduction in spending, particularly investment, and directly feeding into the Consumer Price Index inflation.
-
01:01
Ireland Purchasing Manager Index Services declined to 53.2 in February from previous 53.4
-
00:32
Japan Jibun Bank Services PMI came in at 53.7, above forecasts (53.1) in February
-
00:32
Japan Jibun Bank Services PMI came in at 53.7, above forecasts (53.1) in February
-
00:30
Australia Gross Domestic Product (QoQ) above expectations (0.5%) in 4Q: Actual (0.6%)
-
00:30
Australia Gross Domestic Product (YoY) came in at 1.3%, above forecasts (1.2%) in 4Q
-
00:30
Australia Gross Domestic Product (QoQ) above expectations (0.5%) in 4Q: Actual (0.6%)
-
00:30
Australia Gross Domestic Product (YoY) came in at 1.3%, above forecasts (1.2%) in 4Q
-
00:30
Japan Jibun Bank Services PMI came in at 1.3 below forecasts (53.1) in February
-
00:30
Japan Jibun Bank Services PMI came in at 1.3 below forecasts (53.1) in February
-
00:16
China unveils 2025 growth goals around 5%
Chinese authorities said early Wednesday that it will target economic growth for 2025 around 5% and will target CPI for 2025 at 2%.
Additionally, China said it will adopt a more proactive fiscal policy and will ensure stability in the real estate market as well as the stock market.Market reaction
At the time of writing, AUD/USD is holding higher ground near 0.6261, adding 0.19% on the day.
Australian Dollar FAQs
One of the most significant factors for the Australian Dollar (AUD) is the level of interest rates set by the Reserve Bank of Australia (RBA). Because Australia is a resource-rich country another key driver is the price of its biggest export, Iron Ore. The health of the Chinese economy, its largest trading partner, is a factor, as well as inflation in Australia, its growth rate and Trade Balance. Market sentiment – whether investors are taking on more risky assets (risk-on) or seeking safe-havens (risk-off) – is also a factor, with risk-on positive for AUD.
The Reserve Bank of Australia (RBA) influences the Australian Dollar (AUD) by setting the level of interest rates that Australian banks can lend to each other. This influences the level of interest rates in the economy as a whole. The main goal of the RBA is to maintain a stable inflation rate of 2-3% by adjusting interest rates up or down. Relatively high interest rates compared to other major central banks support the AUD, and the opposite for relatively low. The RBA can also use quantitative easing and tightening to influence credit conditions, with the former AUD-negative and the latter AUD-positive.
China is Australia’s largest trading partner so the health of the Chinese economy is a major influence on the value of the Australian Dollar (AUD). When the Chinese economy is doing well it purchases more raw materials, goods and services from Australia, lifting demand for the AUD, and pushing up its value. The opposite is the case when the Chinese economy is not growing as fast as expected. Positive or negative surprises in Chinese growth data, therefore, often have a direct impact on the Australian Dollar and its pairs.
Iron Ore is Australia’s largest export, accounting for $118 billion a year according to data from 2021, with China as its primary destination. The price of Iron Ore, therefore, can be a driver of the Australian Dollar. Generally, if the price of Iron Ore rises, AUD also goes up, as aggregate demand for the currency increases. The opposite is the case if the price of Iron Ore falls. Higher Iron Ore prices also tend to result in a greater likelihood of a positive Trade Balance for Australia, which is also positive of the AUD.
The Trade Balance, which is the difference between what a country earns from its exports versus what it pays for its imports, is another factor that can influence the value of the Australian Dollar. If Australia produces highly sought after exports, then its currency will gain in value purely from the surplus demand created from foreign buyers seeking to purchase its exports versus what it spends to purchase imports. Therefore, a positive net Trade Balance strengthens the AUD, with the opposite effect if the Trade Balance is negative.
-
00:15
Currencies. Daily history for Tuesday, March 4, 2025
Pare Closed Change, % AUDUSD 0.627 0.83 EURJPY 159.169 1.5 EURUSD 1.06232 1.29 GBPJPY 191.685 0.99 GBPUSD 1.2794 0.75 NZDUSD 0.56632 0.95 USDCAD 1.4402 -0.54 USDCHF 0.88944 -0.78 USDJPY 149.82 0.21 -
00:03
WTI extends downside to near $67.50 on OPEC+ output rise, tariff threats
- WTI price trades in negative territory near $67.65 in Wednesday’s early Asian session.
- OPEC+ said it will proceed with a plan to increase oil production from April.
- Crude oil stockpiles in the US fell by 1.455 million barrels last week, according to the API.
- Trump’s tariff threats could undermine the WTI price.
West Texas Intermediate (WTI), the US crude oil benchmark, is trading around $67.65 during the early Asian session on Wednesday. The WTI price attracts some sellers amid geopolitical concerns, the OPEC+ production increase announcement and US tariffs on Canada, Mexico and China.
On Monday, OPEC+, the Organization of the Petroleum Exporting Countries and allies including Russia, said it will proceed with a plan to increase oil production from April. This increase follows a series of output cuts made by OPEC+ to stabilize the market.
"The change in OPEC strategy looks like they are prioritizing politics over price. Those politics are likely connected with the wheeling and dealing of Donald Trump,” said Bjarne Schieldrop, chief commodities analyst at SEB.
Crude Oil inventories saw a larger-than-expected drop last week. The American Petroleum Institute (API) weekly report showed crude oil stockpiles in the United States for the week ending February 28 fell by 1.455 million barrels, compared to a decline of 640,000 barrels in the previous week. The market consensus estimated that stocks would decrease by 300,000 barrels.
US President Donald Trump confirmed that tariffs on Canada and Mexico would go into effect on Tuesday. The measures Trump had previously reaffirmed the new March date after having initially set it for April. Additionally, tariffs on imports of Chinese goods were increased to 20% from 10%. Analysts expect the tariffs to curb economic activity and demand for energy, weighing on the WTI price.WTI Oil FAQs
WTI Oil is a type of Crude Oil sold on international markets. The WTI stands for West Texas Intermediate, one of three major types including Brent and Dubai Crude. WTI is also referred to as “light” and “sweet” because of its relatively low gravity and sulfur content respectively. It is considered a high quality Oil that is easily refined. It is sourced in the United States and distributed via the Cushing hub, which is considered “The Pipeline Crossroads of the World”. It is a benchmark for the Oil market and WTI price is frequently quoted in the media.
Like all assets, supply and demand are the key drivers of WTI Oil price. As such, global growth can be a driver of increased demand and vice versa for weak global growth. Political instability, wars, and sanctions can disrupt supply and impact prices. The decisions of OPEC, a group of major Oil-producing countries, is another key driver of price. The value of the US Dollar influences the price of WTI Crude Oil, since Oil is predominantly traded in US Dollars, thus a weaker US Dollar can make Oil more affordable and vice versa.
The weekly Oil inventory reports published by the American Petroleum Institute (API) and the Energy Information Agency (EIA) impact the price of WTI Oil. Changes in inventories reflect fluctuating supply and demand. If the data shows a drop in inventories it can indicate increased demand, pushing up Oil price. Higher inventories can reflect increased supply, pushing down prices. API’s report is published every Tuesday and EIA’s the day after. Their results are usually similar, falling within 1% of each other 75% of the time. The EIA data is considered more reliable, since it is a government agency.
OPEC (Organization of the Petroleum Exporting Countries) is a group of 12 Oil-producing nations who collectively decide production quotas for member countries at twice-yearly meetings. Their decisions often impact WTI Oil prices. When OPEC decides to lower quotas, it can tighten supply, pushing up Oil prices. When OPEC increases production, it has the opposite effect. OPEC+ refers to an expanded group that includes ten extra non-OPEC members, the most notable of which is Russia.
-
00:01
New Zealand ANZ Commodity Price: 3% (February) vs 1.8%
-