Notícias do Mercado
-
23:59
USD/CHF rebound from 0.9200 amid caution in market mood, Fed Powell’s speech eyed
- USD/CHF has picked demand after a marginal correction to near 0.9200.
- The risk-on profile is easing further, weighed down by rising US Treasury yields.
- Fed Bostic sees no recession in CY2023 but has trimmed the GDP forecast dramatically to 1%.
The USD/CHF pair has sensed buying interest after dropping to near the round-level support of 0.9200 in the early Asian session. Earlier, the Swiss franc asset extended its recovery above the immediate resistance of 0.9200 despite a cheerful market mood.
S&P500 futures are displaying a subdued performance after a corrective move on Monday as equities failed to extend a rally. Stretched upside in stocks triggered long liquidation. The US Dollar Index (DXY) has refreshed its seven-month low at around 102.50 led by soaring recession fears after a meaningful contraction in economic activities and less-hawkish monetary policy projections after a sheer drop in wage inflation.
The demand for US government bonds is losing traction further as investors’ risk appetite is declining again. This has led to an increase in 10-year US Treasury yields above 3.53%.
On Tuesday, the show-stopper event will be the speech from Federal Reserve (Fed) chair Jerome Powell, which will trim ambiguity over February’s monetary policy action. Meanwhile, the commentary from Atlanta Fed bank president Raphael Bostic is full of information that will guide investors for further action. Fed policymaker sees no recession in CY2023 but has trimmed Gross Domestic Product (GDP) forecast dramatically to 1%. He believes that interest rates will have to stay high for a long time well into 2024".
On the Swiss franc front, a decline in the Real Retail Sales (Nov) data on an annual basis is going to compel the Swiss National Bank (SNB) to keep monetary policy moderate. The economic data contracted by 1.3% while the street was expecting an expansion of 3.0%.
-
23:38
USD/JPY slides below 132.00 despite mixed Tokyo Inflation data, focus on Fed Chair Powell
- USD/JPY extends two-day downtrend even after mixed Tokyo inflation figures.
- Tokyo Consumer Price Index eased below market forecasts, CPI ex Food, Energy matched upbeat expectations.
- Downbeat yields, hawkish hopes from BOJ challenge recovery moves.
- Upbeat Fedspeak, long weekend in Japan allowed Yen bears to take a breather ahead of Fed Chair Powell’s speech.
USD/JPY takes offers to refresh the intraday low near 131.60 as it prints a three-day downtrend even as the Tokyo inflation data fails to bolster hawkish expectations from the Bank of Japan (BOJ). The reason could be linked to the long weekend in Japan, as well as the wait for Fed Chair Jerome Powell’s speech and the US inflation data.
As per the latest Tokyo inflation data, the headline Consumer Price Index (CPI) rose by 4.0% versus 4.5% market forecasts and 3.8% previous readings. Further, the Tokyo CPI ex-Food, Energy matched 2.7% YoY forecasts versus 2.5% prior.
However, hawkish Fedspeak and waiting for full markets, as well as a speech from Fed Chair Jerome Powell, seemed to have put a floor under the Yen prices.
Given the escalating price pressure in Japan, the odds of the Bank of Japan’s (BOJ) exit from the easy money policy gains momentum and weighs on the USD/JPY. That said, Japanese Prime Minister Fumio Kishida said on Sunday his government and the central bank must discuss their relationship in guiding economic policy after he names a new Bank of Japan (BOJ) governor in April, reported Reuters. The recent chatters over the BOJ’s readiness to edit the Yield Curve Control (YCC) policy seemed to have weighed on the USD/JPY prices of late.
It’s worth noting that the hawkish comments from the Fed policymakers join the firmer prints of the US inflation expectations to challenge the USD/JPY bears.
On Monday, Atlanta Federal Reserve bank president Raphael Bostic said that it is ''fair to say that the Fed is willing to overshoot.'' On the same line, San Francisco Federal Reserve Bank President Mary Daly stated that they are determined, united, resolute to bring inflation down. Additionally, the Federal Reserve Bank of New York's monthly Survey of Consumer Expectations showed on Monday that the US consumers' one-year inflation expectation declined to 5% in December from 5.2% prior. Alternatively, the three-year ahead expected inflation remained unchanged at 3% and the five-year ahead expected inflation edged higher to 2.4% from 2.3%.
Against this backdrop, the US 10-year Treasury yields dropped five basis points to 3.51% while printing the three-day downtrend whereas Wall Street closed mixed.
Looking forward, USD/JPY traders will pay attention to Fed Chairman Jerome Powell’s speech, as well as Thursday’s US inflation data, for near-term directions amid receding hawkish bias for the Fed.
Technical analysis
A daily closing beyond the 21-DMA hurdle surrounding 133.35 becomes necessary for the USD/JPY buyers to retake control, even for the short-term.
-
23:31
Japan Tokyo CPI ex Fresh Food (YoY) came in at 4%, above expectations (3.8%) in December
-
23:31
Japan Tokyo CPI ex Food, Energy (YoY) meets forecasts (2.7%) in December
-
23:30
Japan Tokyo Consumer Price Index (YoY) came in at 4% below forecasts (4.5%) in December
-
23:30
Japan Overall Household Spending (YoY) registered at -1.2%, below expectations (0.5%) in November
-
23:20
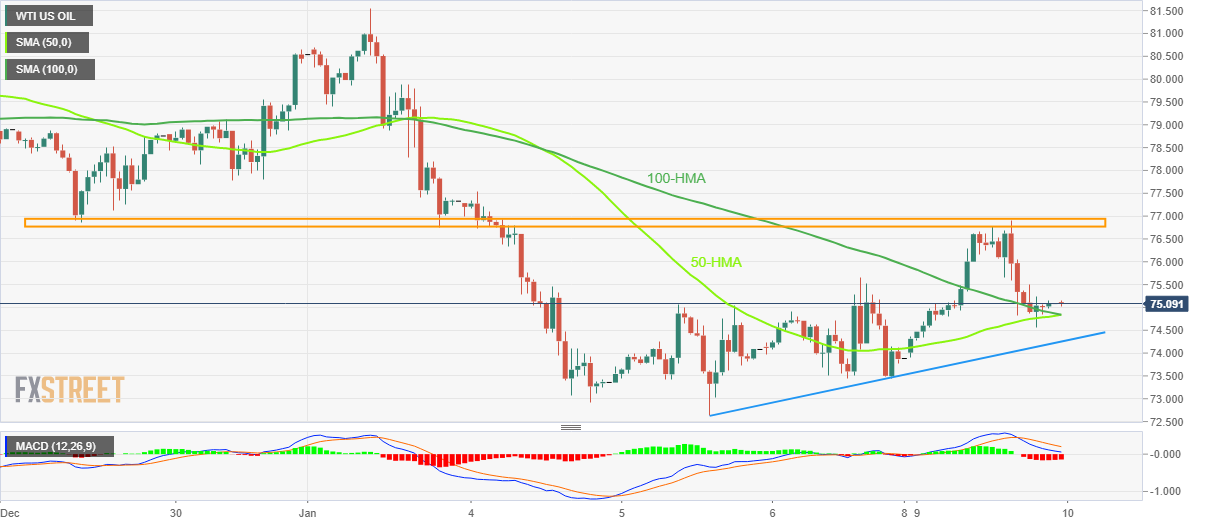
WTI Price Analysis: Keeps pullback from weekly resistance near $75.00
- WTI seesaws above the key moving average convergence after reversing from eight-day-old horizontal resistance.
- Bearish MACD signals, failure to cross short-term hurdle favor sellers.
- Ascending trend line from Thursday adds to the downside filters.
WTI crude oil seesaws around the $75.00 round figure after taking a U-turn from the one-week-long horizontal resistance the previous day. In doing so, the black gold stays defensive above the convergence of the 100 and 50 Hour Moving Averages (HMAs).
That said, the previous day’s failure to cross the $76.75-95 horizontal hurdle joins the bearish MACD signals to keep the WTI sellers hopeful.
However, the aforementioned HMA confluence near $74.80 puts a floor under the energy benchmark’s prices.
Also acting as short-term support is an upward-sloping support line from Thursday, close to $74.25 by the press time.
In a case where the quote remains weak past $74.25, the $74.00 threshold may act as the last defense of the oil buyers before directing the commodity prices towards the recent trough surrounding $72.60.
On the flip side, a successful break of $77.00 becomes necessary for the WTI bull’s conviction. Following that, a run-up toward the $80.00 round figure can’t be ruled out
Even so, the WTI buyers should remain cautious unless crossing the monthly top surrounding $81.55.
Overall, WTI remains bearish despite the latest inaction surrounding the key HMAs and a short-term support line.
WTI: Hourly chart
Trend: Further weakness expected
-
23:07
EUR/USD aims to recapture 1.0760, investors await Fed Powell’s speech for fresh cues
- EUR/USD is looking to recapture 1.0760 as the overall risk profile is still positive.
- Only the stronger-than-projected US CPI report could avoid certain fresh lows for USD Index.
- The speech from Fed Powell will provide cues about the likely monetary policy action for the February meeting.
The EUR/USD pair has displayed a corrective move after failing to extend the upside range above the crucial resistance of 1.0760. The major currency pair has not shown any meaningful sign of bearish reversal, therefore, it would not be ideal to place bearish bids on EUR/USD for now. Investors are required to keep caution in the overall bullish environment as risk-sensitive assets have already displayed a strong run-up, which could force investors to ease their longs ahead.
S&P500 ended on a marginal weak note as Goldman Sachs announced the biggest lay-offs since the subprime crisis as Wall Street banks have suffered a major slowdown in corporate deal-making activity as a result of volatile global financial markets, as reported by Bloomberg. Meanwhile, a decline in 10-year US Treasury yields to 3.53% also weighed pressure on the US Dollar Index (DXY) pushing it to near 102.20, a fresh seven-month low figure.
The US Dollar Index (DXY) is subjected to continue making fresh lows as a meaningful drop in economic activities in the United States economy and a one-time significant drop in wage inflation has accelerated expectations of a deceleration in the pace of interest rate hike by the Federal Reserve (Fed). According to the economists at MUFG Bank, only a stronger-than-expected US Consumer Price Index (CPI) on Thursday would avoid a slide to fresh lows for the USD Index.
But before the release of the US CPI report, the speech from Fed chair Jerome Powell will provide more clarity on monetary policy action for the December meeting.
On the Eurozone front, Economic Bulletin published by the European Central Bank (ECB) clears that wage growth is going to be extremely solid ahead led by robust labor markets that so far have not been substantially affected by the economic slowdown, increases in national minimum wages and some catch-up between wages and high rates of inflation.
-
23:02
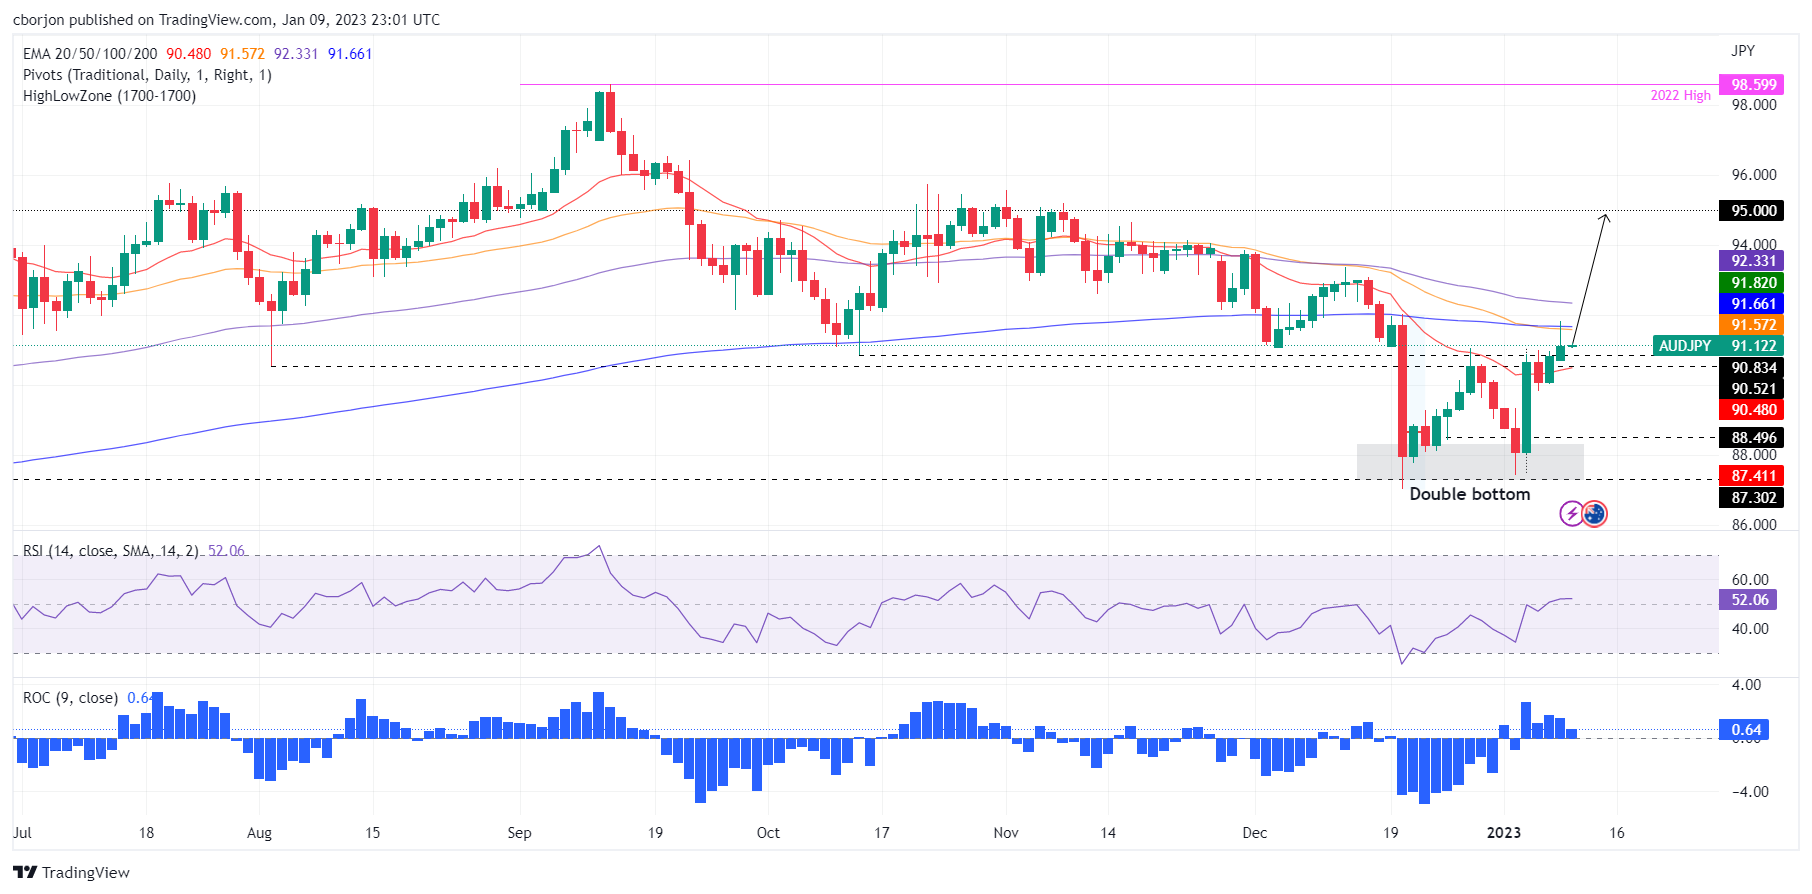
AUD/JPY Price Analysis: Stalls at the 200-DMA, eyeing a re-test on its way to 92.00
- AUD/JPY tested but failed to clear solid resistance around the 100 and 200-day EMAs.
- AUD/JPY Price Analysis: A break above 91.70 could open the door for additional gains.
The AUD/JPY edged up during Monday’s session, though it faltered to clear the 200-day Exponential Moving Average (EMA) around 91.66, retracing from the daily highs, and aimed toward January 4 highs around 90.88. As Tuesday’s Asian Pacific session begins, the AUD/JPY is trading with minuscule gains of 0.01%, at around 91.11.
AUD/JPY Price Analysis: Technical outlook
AUD/JPY Monday’s price action witnessed the formation of an inverted hammer preceded by a slight uptrend after the AUD/JPY bottomed at around 87.40s, forming a double bottom. Albeit AUD sellers pushed exchange rates toward’s 91.05, they failed to achieve a daily close beneath that price level, which would have opened the door for further losses and invalidated the chart pattern.
However, the AUD/JPY might consolidate in the near term and depend on market sentiment and Aussie (AUD) upbeat news. So if the AUD/JPY is to resume its uptrend, it would need to decisively reclaim the 100 and 200-day EMAs at around 91.57 and 91.66, respectively, which, once cleared, could open the door for further gains.
If that scenario plays out, the AUD/JPY first resistance would be 92.00. A breach of the latter will send the cross rallying toward December’s 13 daily high of 93.35, followed by the 94.00 figure and the 95.00 mark.
AUD/JPY Key Technical Levels
-
23:00
South Korea Current Account Balance registered at -0.62B, below expectations (-0.17B) in November
-
22:57
NZD/USD retreats towards 0.6350 with eyes on Fed Chair Powell
- NZD/USD eases from three-week high, snaps two-day uptrend.
- Hawkish Fedspeak, lack of fresh positives from China probe Kiwi bulls.
- Powell’s speech will be crucial ahead of Thursday’s US inflation as NZD/USD is susceptible to Fed wagers.
NZD/USD fades upside momentum after two-day advances as it drops to 0.6370 during early Tuesday’s Asian session. The Kiwi pair previously rose to the highest level in three weeks as headlines surrounding China and the US data helped the NZD/USD bulls. However, recent comments from the Fed officials and the cautious mood ahead of this week’s key data and events seem to challenge the pair buyers.
That said, softer US data concerning the wage growth and ISM Services PMI for December, raised speculations that the Federal Reserve (Fed) finally has an upper hand in taming inflation, suggesting a pause to aggressive rate hikes, which in turn propelled NZD/USD prices.
However, hawkish comments from the Fed policymakers seemed to have challenged the NZD/USD traders. On Monday, Atlanta Federal Reserve bank president Raphael Bostic said that it is ''fair to say that the Fed is willing to overshoot.'' On the same line, San Francisco Federal Reserve Bank President Mary Daly stated that they are determined, united, resolute to bring inflation down.
Additionally, the Federal Reserve Bank of New York's monthly Survey of Consumer Expectations showed on Monday that the US consumers' one-year inflation expectation declined to 5% in December from 5.2% prior. Alternatively, the three-year ahead expected inflation remained unchanged at 3% and the five-year ahead expected inflation edged higher to 2.4% from 2.3%.
Amid these plays, the US 10-year Treasury yields dropped five basis points to 3.51% while printing the three-day downtrend whereas Wall Street closed mixed.
Moving on, the economic calendar appears light ahead of Thursday’s US Consumer Price Index (CPI) for December. However, today’s Fed Chairman Jerome Powell’s speech will be crucial for the NZD/USD traders to watch for clear directions amid receding hawkish bias for the Fed. Should Powell refrains from conveying hawkish bias, the NZD/USD could refresh the multi-day high.
Technical analysis
Despite the recent pullback, the NZD/USD pair’s capacity to stay beyond the 21-DMA support of 0.6330 keeps buyers hopeful.
-
22:35
Gold Price Forecast: XAU/USD struggles below $1,900 on mixed Federal Reserve talks
- Gold price retreats after refreshing eight-month high, lacks follow through.
- Federal Reserve officials tried to defend US Dollar and probed XAU/USD bulls.
- China-linked optimism, previous United Stated data allowed Gold price to stay firmer.
- Light calendar ahead of US, China Inflation can probe XAU/USD traders, Fed Chair Powell eyed for intraday moves.
Gold price (XAU/USD) seems running out of upside momentum as it retreats to $1,871, after renewing the multi-day high amid the mostly quiet week-start trading. That said, the United States economics and China’s reopening appeared to have previously helped the XAU/USD to rise to the highest level since May 2022. However, comments from the Federal Reserve (Fed) officials appear to challenge the Gold bulls afterward.
Federal Reserve talks probe Gold buyers
Last week’s United States economics, mainly concerning the wage growth and ISM Services PMI for December, raised speculations that the Federal Reserve (Fed) finally has an upper hand in taming inflation, suggesting a pause to aggressive rate hikes. The same weighed on the US Treasury bond yields and the US Dollar even as the latest comments from the Fed officials restrict the Greenback’s latest downside.
That said, Atlanta Federal Reserve bank president Raphael Bostic said on Monday that it is ''fair to say that the Fed is willing to overshoot.'' On the same line, San Francisco Federal Reserve Bank President Mary Daly stated that they are determined, united, resolute to bring inflation down. Additionally, the Federal Reserve Bank of New York's monthly Survey of Consumer Expectations showed on Monday that the US consumers' one-year inflation expectation declined to 5% in December from 5.2% prior. Alternatively, the three-year ahead expected inflation remained unchanged at 3% and the five-year ahead expected inflation edged higher to 2.4% from 2.3%.
Hence, the Federal Reserve officials’ defense of the hawkish monetary policy actions weighs on the Gold prices.
China favors XAU/USD bulls amid a light calendar
China’s reopening of the international borders after a three-year halt joined the People’s Bank of China’s (PBOC) quest for more Gold reserves to underpin the XAU/USD upside the previous day. The reason could be linked to the dragon nation’s status as one of the world’s biggest gold consumers. That said, Beijing’s readiness for stimulus and early signals of shopping spree ahead of the Chinese New Year holiday season also seemed to have favored the Gold’s upside. It’s worth noting that a lack of major data and events from elsewhere also allowed Chinese catalysts to gain major attention.
Fed talks, United States inflation in focus
Moving on, Gold traders are likely to witness further hardships amid a lack of major catalysts ahead of Thursday’s United States Consumer Price Index (CPI) for December. However, comments from the various Federal Reserve (Fed) officials may offer intermediate moves. It’s worth observing that Tuesday’s speech from Fed Chair Jerome Powell will be crucial for XAU/USD traders considering the latest shift in the United States data and the market’s bias for the US central bank’s next move.
Gold price technical analysis
Gold buyers managed to poke June 2022 high surrounding $1,880 while extending the bounce off one-month-old horizontal support the previous day. However, nearly overbought conditions of the Relative Strength Index (RSI) line, placed at 14, joined an upward-sloping trend line from December 27 to restrict the metal’s further upside.
Also challenging the XAU/USD buyers was the receding bullish bias of the Moving Average Convergence and Divergence (MACD) indicator.
As a result, Gold’s pullback towards the previous weekly top surrounding $1,865 appears imminent.
However, a fortnight-long ascending support line, close to $1,838 by the press time, could challenge the XAU/USD sellers afterward.
In a case where the Gold price fails to rebound from $1,838, the aforementioned horizontal support near $1,823 and the 100-Simple Moving Average (SMA) level surrounding $1,818 will gain the market’s attention.
Alternatively, the $1,880 level and ascending trend line from early December 2022, around $1,883 restricts the short-term upside of the Gold price.
Following that, highs marked during May 2022 and late April, close to $1,910 and $1,920 in that order, could challenge the Gold buyers.
Gold price: Four-hour chart
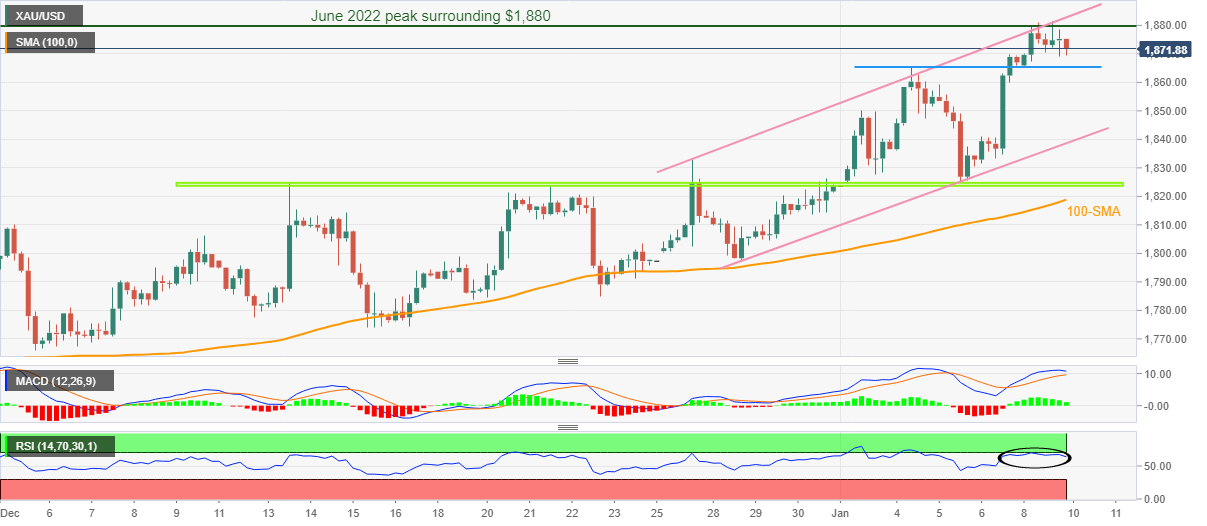
Trend: Pullback expected
-
22:33
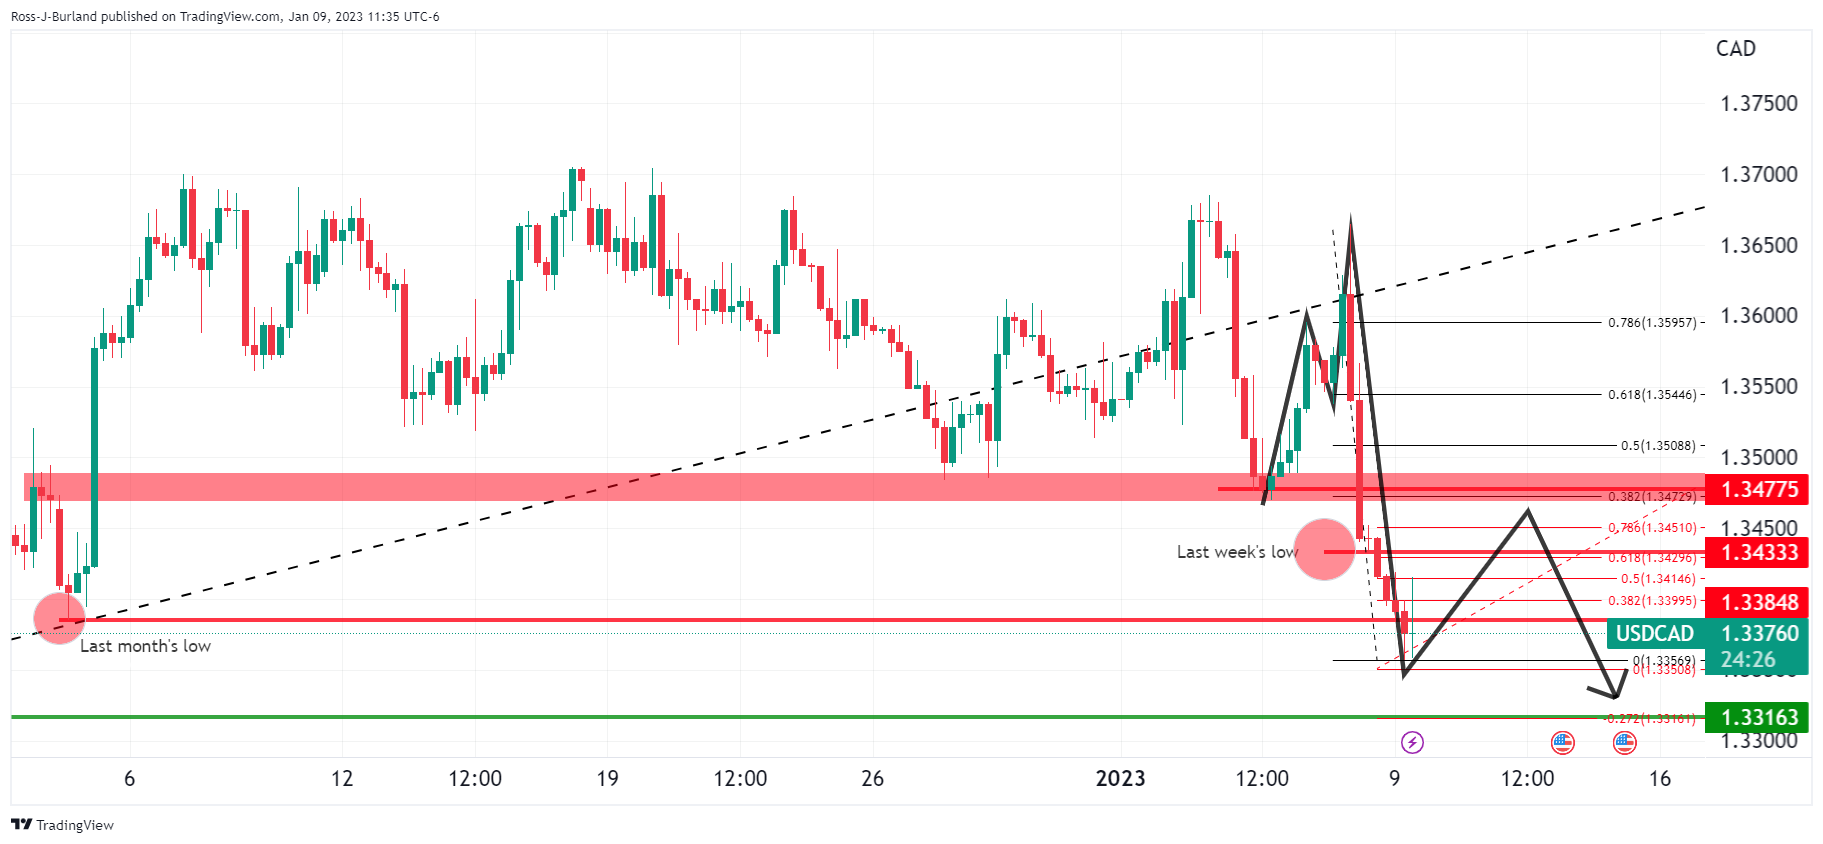
USD/CAD Price Analysis: Downside looks solid to near 1.3400 ahead of Powell/Macklem’s speech
- USD/CAD has gauged an intermediate cushion of around 1.3350.
- Volatility is likely to contract ahead of Powell/Macklem’s speech.
- Downward-sloping 20-and 50-EMAs add to the downside filters.
The USD/CAD pair has shifted its auction profile below the critical resistance of 1.3400 in the early Asian session. The Lonnie asset is displaying a sideways profile after finding an immediate cushion below 1.3400 post carnage led by risk-on market mood. A continuation of rangebound structure is highly expected ahead of the speech from Federal Reserve (Fed) chair Jerome Powell and Bank of Canada (BoC) Governor Tiff Macklem.
The US Dollar Index (DXY) is displaying a subdued performance after a massive sell-off. An absence of follow-up recovery despite gauging an immediate cushion indicates more downside ahead. Meanwhile, a failure in the extension of S&P’s rally resulted in a corrective move, portraying a caution in the risk appetite theme.
After a breakdown of stretched consolidation formed in a range of 1.3482-1.3702 on a four-hour, USD/CAD has dropped dramatically to near 1.3350. The range expansion on the south side is expected to continue further as the overall market sentiment is still positive.
Declining 20-and 50-period Exponential Moving Averages (EMAs) at 1.3482 and 1.3518 respectively, add to the downside filters.
Also, the Relative Strength Index (RSI) (14) has shifted into the bearish range of the 20.00-40.00 range, which indicates that a bearish momentum has been activated.
For further downside, the Canadian Dollar needs to push the Loonie asset below Monday’s low of around 1.3350, which will drag the major towards November 18 low at 1.3300 followed by November 15 low at 1.3226.
On the contrary, a break above December 27 low of around 1.3484 will strengthen the US Dollar and will drive the major towards December 8 low at 1.3561. A breach of the latter will expose the asset for further upside towards January 6 high at 1.3664.
USD/CAD four-hour chart
-638089003590056618.png)
-
22:21
USD/JPY Price Analysis: Seesawed around 131.90s on mixed mood
- USD/JPY falters to extend its downtrend after forming a bearish engulfing candle pattern.
- The RSI and the RoC suggest that the USD/JPY might resume downwards, though it needs the USD/JPY to fall below 131.30.
The USD/JPY is almost flat as Monday’s New York session wanes, printing a doji preceded by a bearish engulfing candle pattern that failed to trigger downward action. The USD/JPY dived as low as 131.30, still almost unchanged, down by 0.17%. At the time of typing, the USD/JPY is trading at 131.88.
USD/JPY Price Analysis: Technical outlook
After testing the 200-day Exponential Moving Average (EMA) at around 134.70s on Friday, the USD/JPY remained almost unchanged as risk appetite improved and safe-haven peers weakened. Therefore, the USD/JPY seesawed between the high/low of 132.65-131.30 before stabilizing around 131.80s, without buyers/sellers having the upper hand. Should be said that the Relative Strength Index (RSI) portrays the pair as bearish biased, though the Rate of Change (RoC) shows momentum heading downwards.
Hence, the USD/JPY might resume its downtrend, but it would need to hurdle some support levels on its way down. The USD/JPY first support would be the January 9 daily low of 131.30. Break below will expose the 131.00 figure, followed by the January 4 swing low of 129.92 and the YTD low of 129.50.
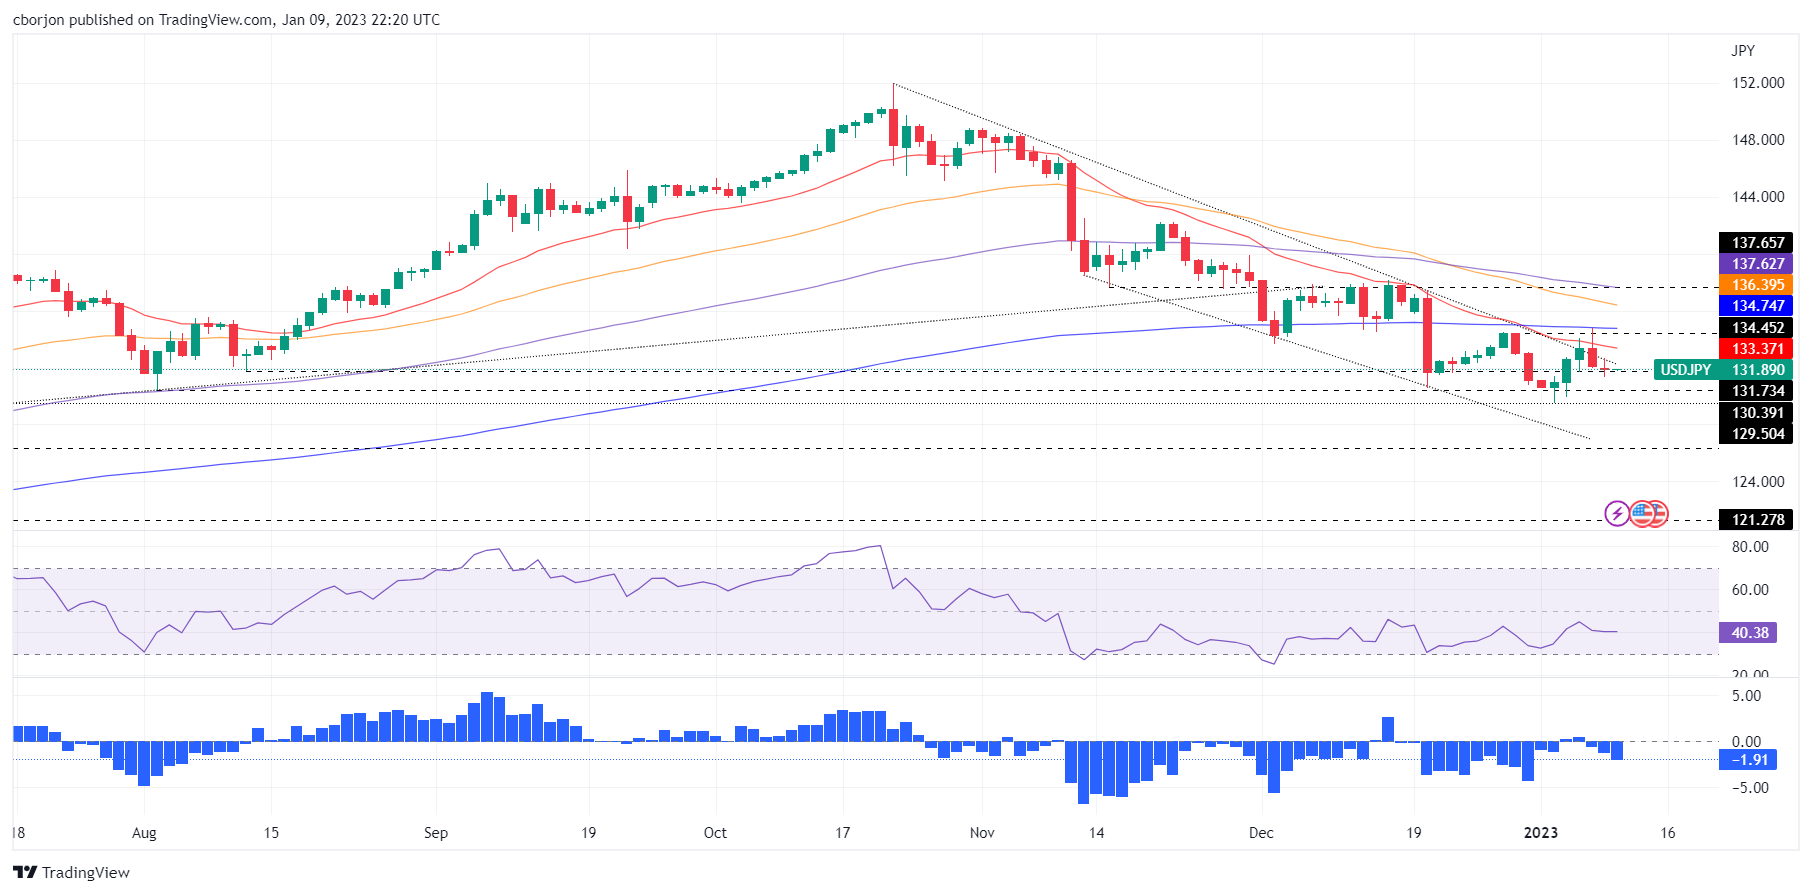
USD/JPY Key Technical Levels
-
22:06
AUD/USD drops to near 0.6900 as risk-on eases, focus shifts to Fed Powell’s speech
- AUD/USD has corrected to near 0.6900 as investors have turned cautious ahead of Fed Powell’s speech.
- The USD Index is expected to continue its downside momentum as the overall sentiment is still solid.
- Australia’s monthly CPI and Retail Sales data will be keenly watched.
The AUD/USD pair has sensed solid barricades while attempting to extend a rally above the critical resistance of 0.6950 in the New York session. The Aussie asset has corrected to near 0.6900 as a firmer rally is generally followed by a healthy correction, therefore, it would be ideal not to consider the correction a bearish reversal.
Optimism in the global market eased vigorously as investors are shifting their focus toward the release of the United States Consumer Price Index (CPI) data, which is scheduled for Thursday. S&P500 witnessed a corrective move on late Monday after a stretch of Friday’s solid rally, portraying a caution in the overall upbeat market mood.
The US Dollar Index (DXY) has gauged immediate support above 102.50, however, an absence of follow-up recovery indicates that more steam is still left in USD Index bears. Meanwhile, the demand for US government bonds remained solid, which led to a further drop in the 10-year US Treasury yields to 3.53%.
Investors are shifting their focus toward the speech from Federal Reserve (Fed) chair Jerome Powell, which is scheduled for Tuesday. The speech from Fed Powell will provide cues about the likely monetary policy to be taken in February’s monetary policy meeting. Apart from that, fresh projections on the terminal rate after a slowdown in economic activities in the United States economy and a drop in wage inflation will be of utmost importance.
On the Aussie front, the Australian Dollar will remain in action ahead of the release of the monthly CPI data, which is scheduled for Wednesday. As per the consensus, the annual CPI (Nov) will escalate to 7.3% vs. the prior release of 6.9%. Also, the Australian Retail Sales data will hog the limelight, which is seen higher at 0.7% against the former figure of -0.2%.
-
21:46
GBP/USD Price Analysis: Bullish impulse is decelerating, eyes on 1.2150
- GBP/USD bears are lurking in a key area of potential resistance.
- 1.1900 is eyed on the downside extreme on a break below 1.2150/00.
The outlook is bearish for GBP/USD while below 1.2400 and 1.2220 nearer-term highs. The following illustrates GBP/USD's W-formation and test of mid-December highs where a failure to break higher would eventuate in a bearish thesis for the days ahead.
GBP/USD daily charts
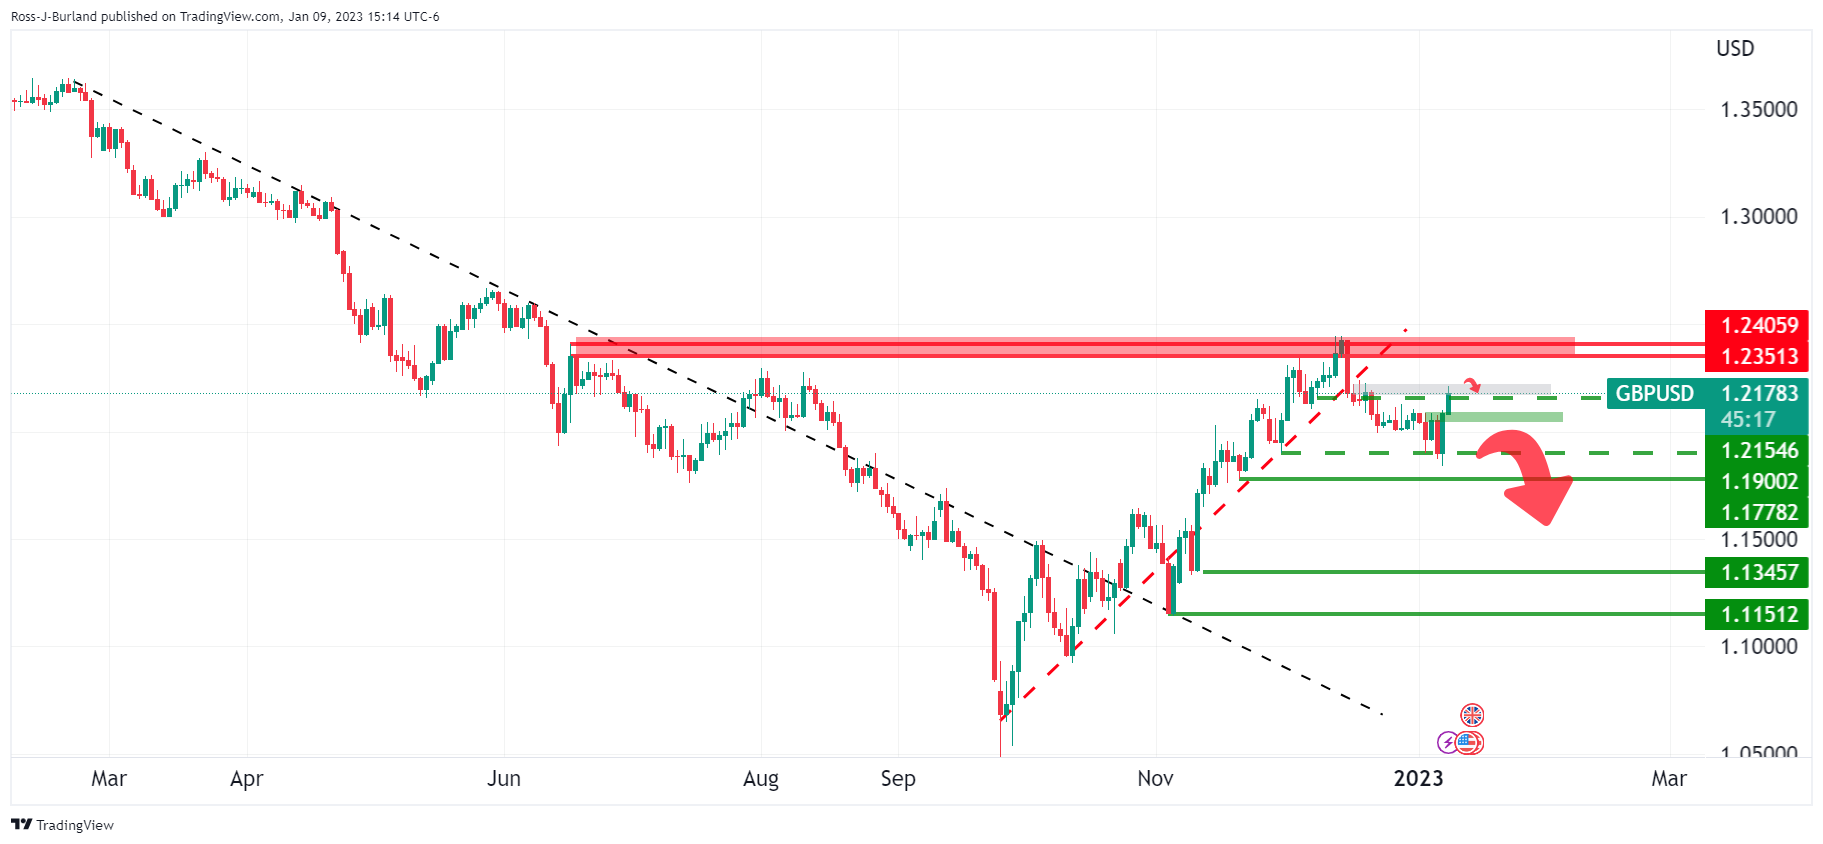
As seen, the market is on the back side of the recent supportive trendline and the price broke 1.1900 structure leaving a bearish bias on the charts.
Zoomed in...
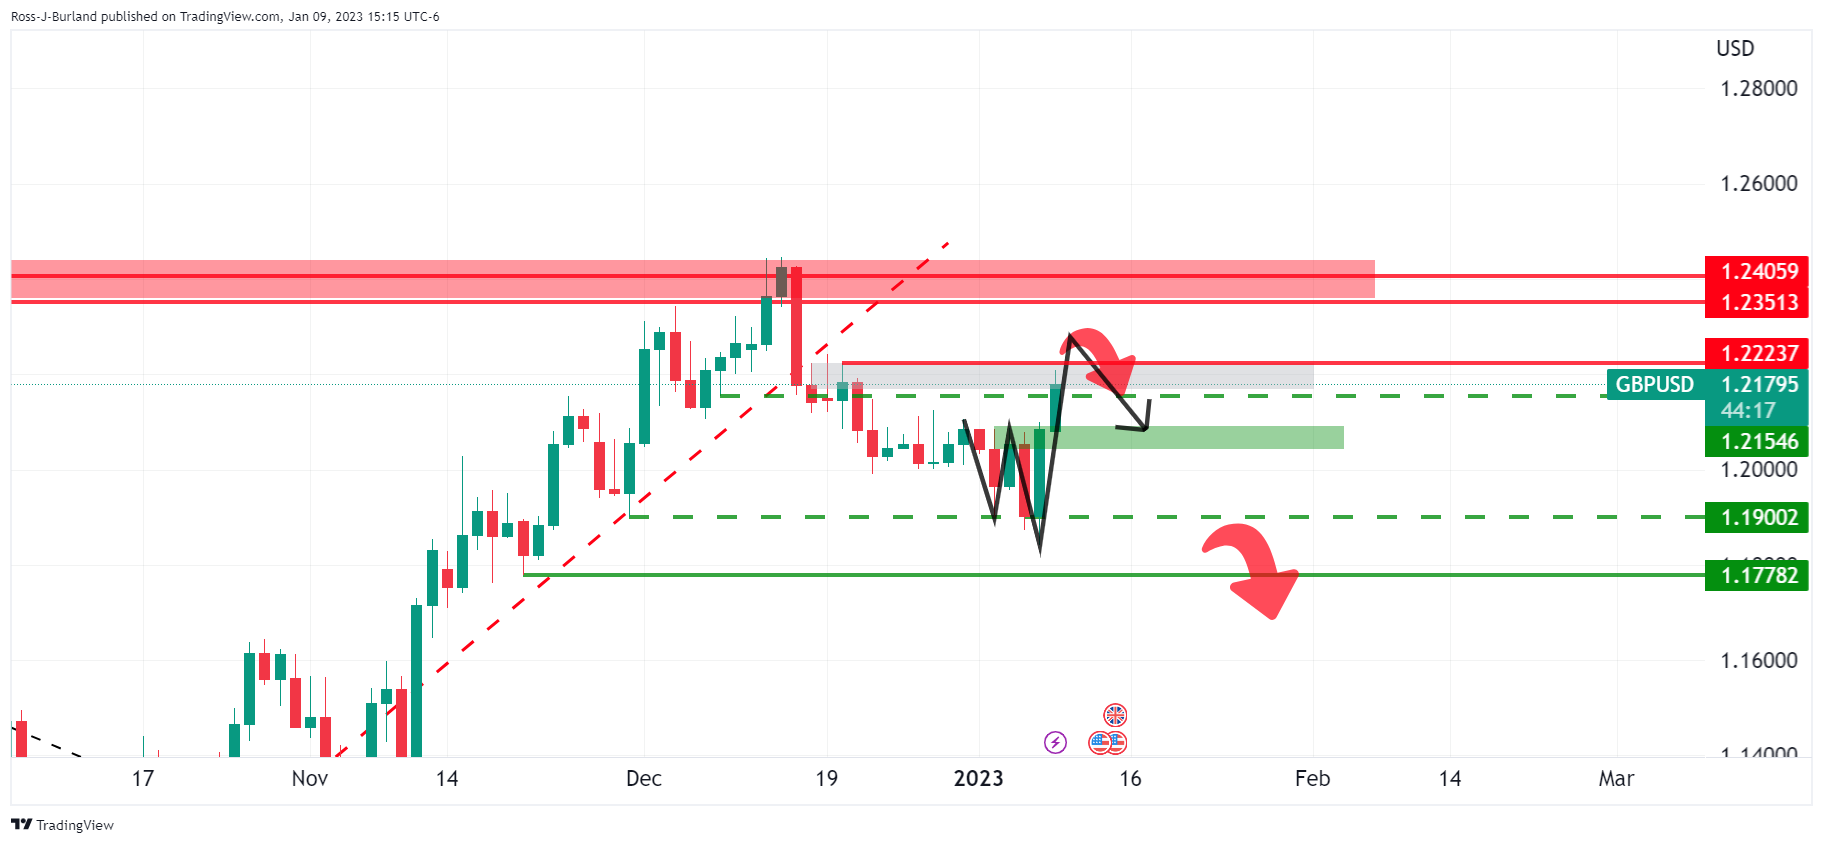
The W-formation is supportive of the bearish thesis given that it is a reversion pattern.GBP/USD would be expected to revert towards the neckline and day's lows of near 1.2080. This level guards a run to the prior broken lows of 1.1900 and 1.1778 below there. A break of that opens risk for a run to 1.1350.
GBP/USD H1 chart
At this juncture, the lower time frames can be monitored for a deceleration of the bullish run and signs of distribution as follows:
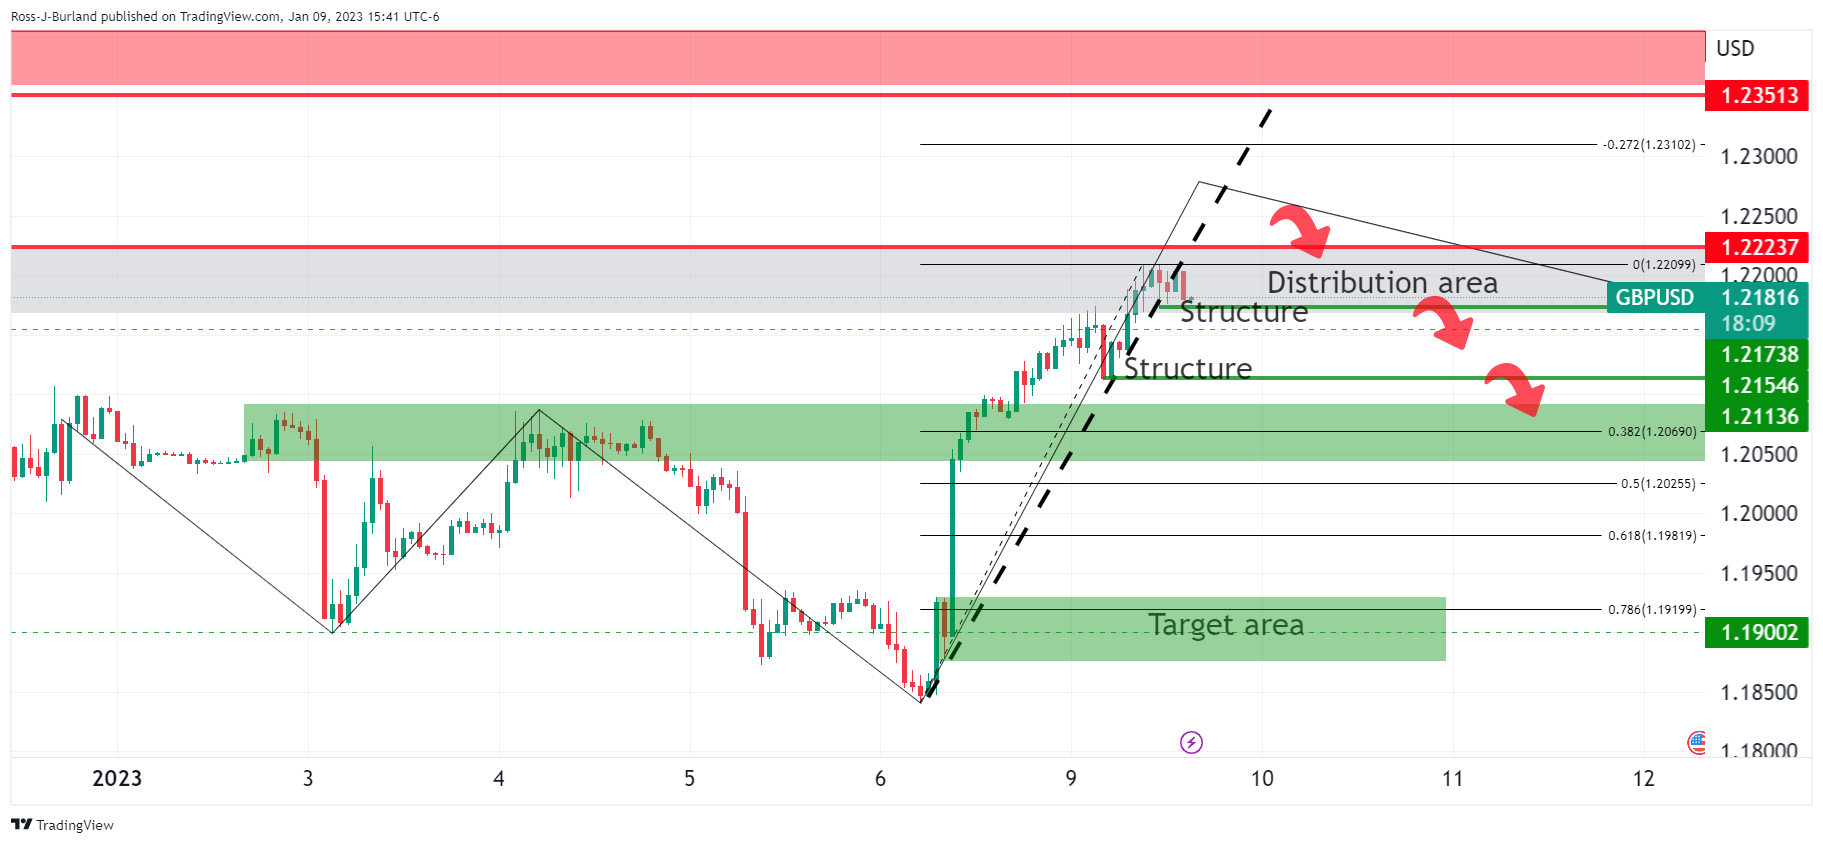
1.2170, 1.2150 and 1.2113 areas are meanwhile key structure target levels. These guard against a full-on capitulation of the bulls and bears taking over towards the 1.1900 target area.
-
21:18
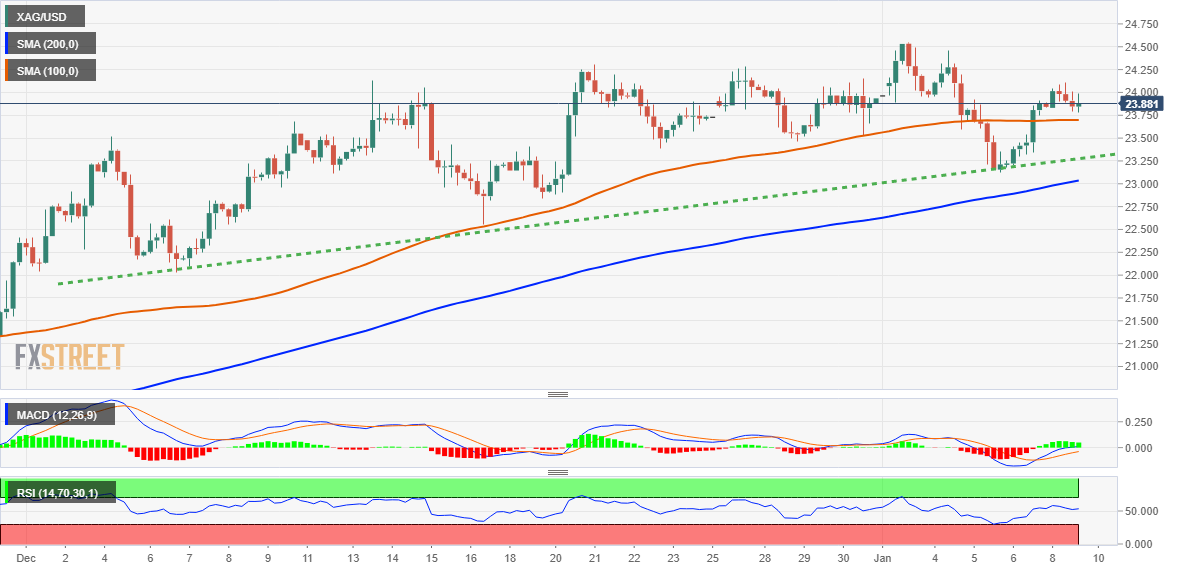
Silver Price Forecast: XAG/USD struggled at $24.00, retraces gains despite a soft USD
- Silver price failed to gain traction, even though the US Dollar and US Treasury bond yields dropped.
- Latest US jobs data flashing that wages are aiming lower keeps traders hopeful for a Fed pivot.
- Silver Price Analysis: Bears mounted around $24.00, dragging prices towards the 20-DMA.
Silver price stumbles as Wall Street entered its last hour of trading on Monday after hitting a daily high of $24.09 but retraced those gains, albeit market sentiment remains positive as shown by US equities trading with solid gains. Therefore, the US Dollar (USD) weakened, bolstering dollar-denominated commodities. At the time of writing, XAG/USD is trading at $23.64, below its opening price by 0.64%.
Silver failed to capitalize on a soft US Dollar
Optimism surrounds worldwide investors as most global equity indices edged higher. China’s reopening and last week’s mixed economic data from the United States (US) were some of the reasons that weighed on the greenback, alongside growing speculations that the US Federal Reserve (Fed) might pivot.
Last week’s employment data showed the US labor market resilient, adding more jobs than estimated. Still, the data spotlight was Average Hourly Earnings, which dropped to 4.6% YoY, below the previous month’s 5%. That eased some of the Federal Reserve’s (Fed) pressures to curb inflation and even opened the door for a 25 bp rate increase for February 1, as shown by the swaps market.
Therefore, traders are repricing a less hawkish Fed, as shown by the US bond market. The US 10-year Treasury bond rate yields 3.53%, losing three and a half bps, undermining the greenback. The US Dollar Index, which measures the buck’s value against a basket of six currencies, edges lower by 0.71%, down at 103.171.
Silver Price Analysis: Technical outlook
From a daily chart perspective, XAG/USD remains upward biased, with prices trending above the 20 and 50-day Exponential Moving Averages (EMAs), which remain as a support level. Last Friday’s price action formed a bullish engulfing candle pattern, which is usually a bullish pattern. However, XAG/USD failure to hold to its gains above Friday’s $23.90 daily high, and oscillators aimed lower capped silver rally.
Therefore, the XAG/USD first support would be the 20- day EMA at 23.48. Break below will expose the last week’s low of $23.12, followed by the $23.00 figure.

-
20:36
NZD/USD Price Analysis: Bears are lurking in critical resistance area
- NZD/USD bulls coming up for ain ahead of the keyUS event.
- The price is on the backside of a daily trend, and the front side of the weekly/monthly bear trend.
NZD/USD is higher by some 0.5% on the day so far and headed for a bullish close to starting the week. However, breakout traders chasing the move could find themselves in trouble as per the following technical analysis.
NZD/USD weekly chart
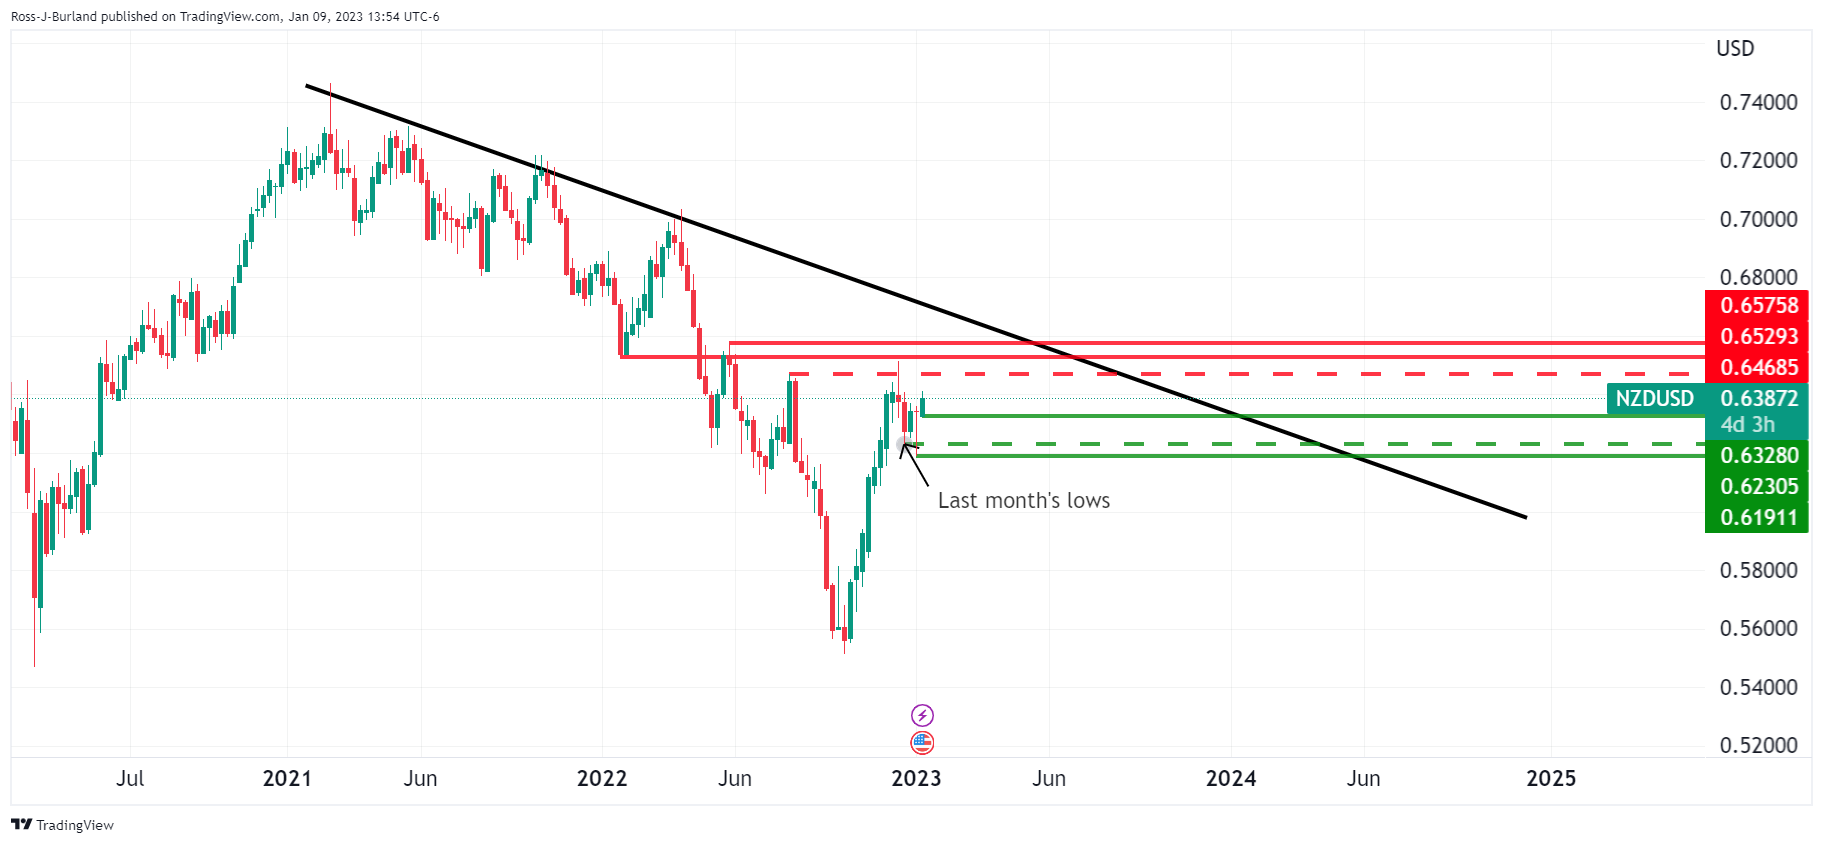
The price took out last month's low last week which is a bearish development looking forward while Kiwi remains on the front side of the dominant bearish trendline and below the following resistance:
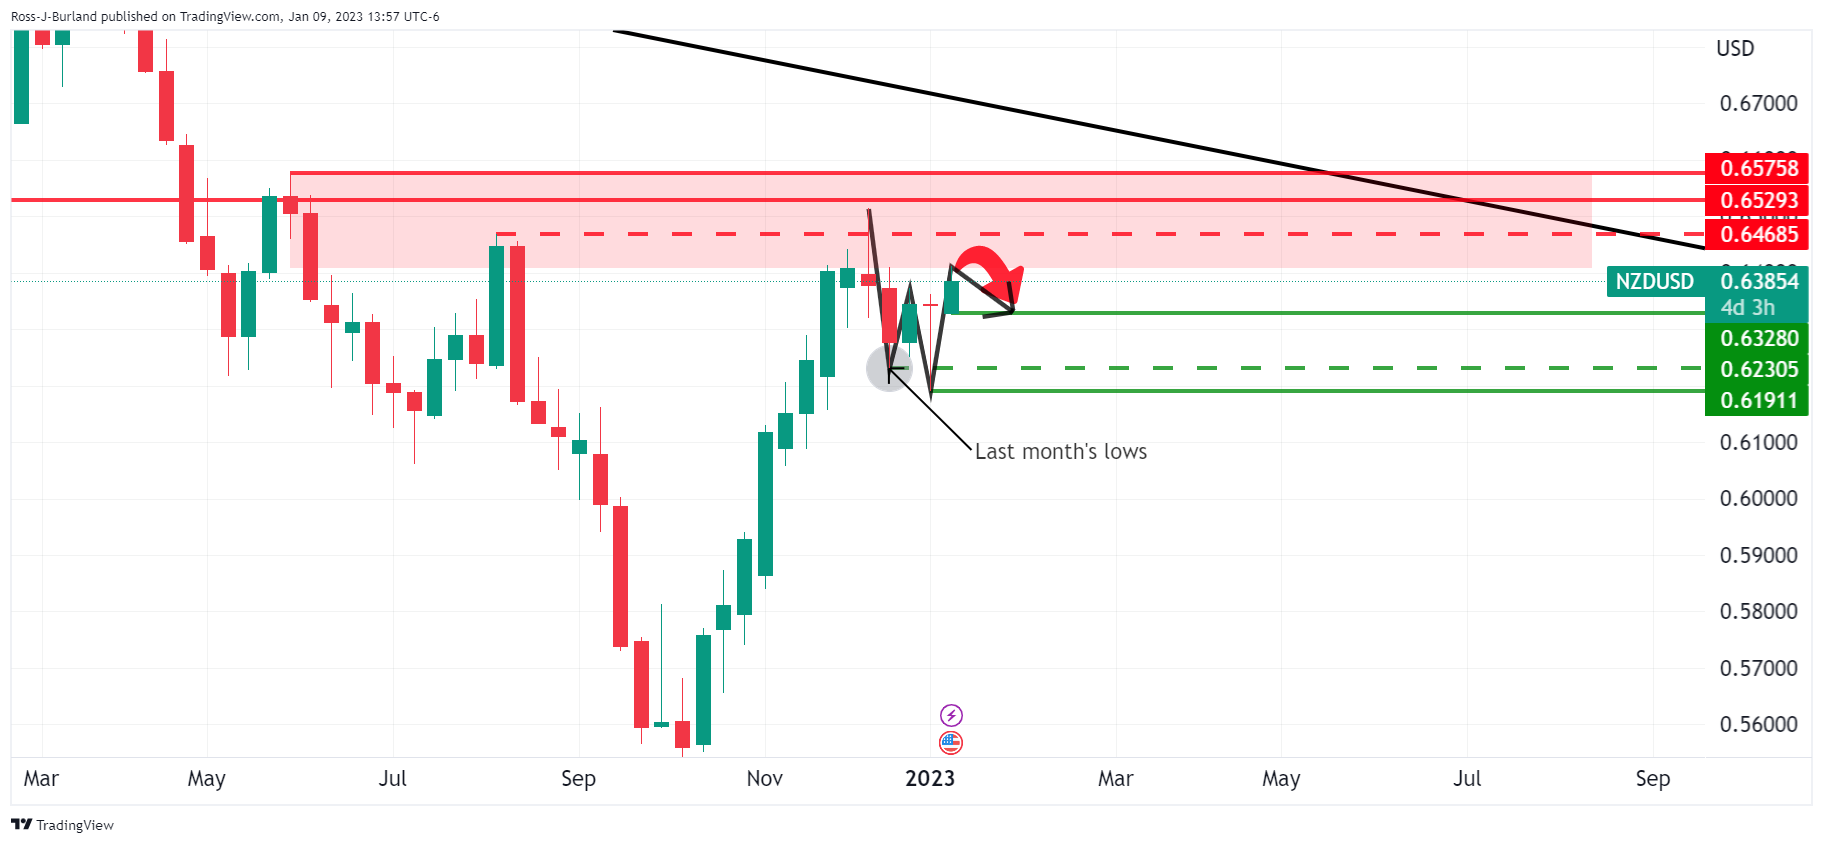
The W-formation that is forming is also a bearish feature that could see the price struggle and hamstrung on bullish attempts. The W-formation is clearer on the line chart as follows:
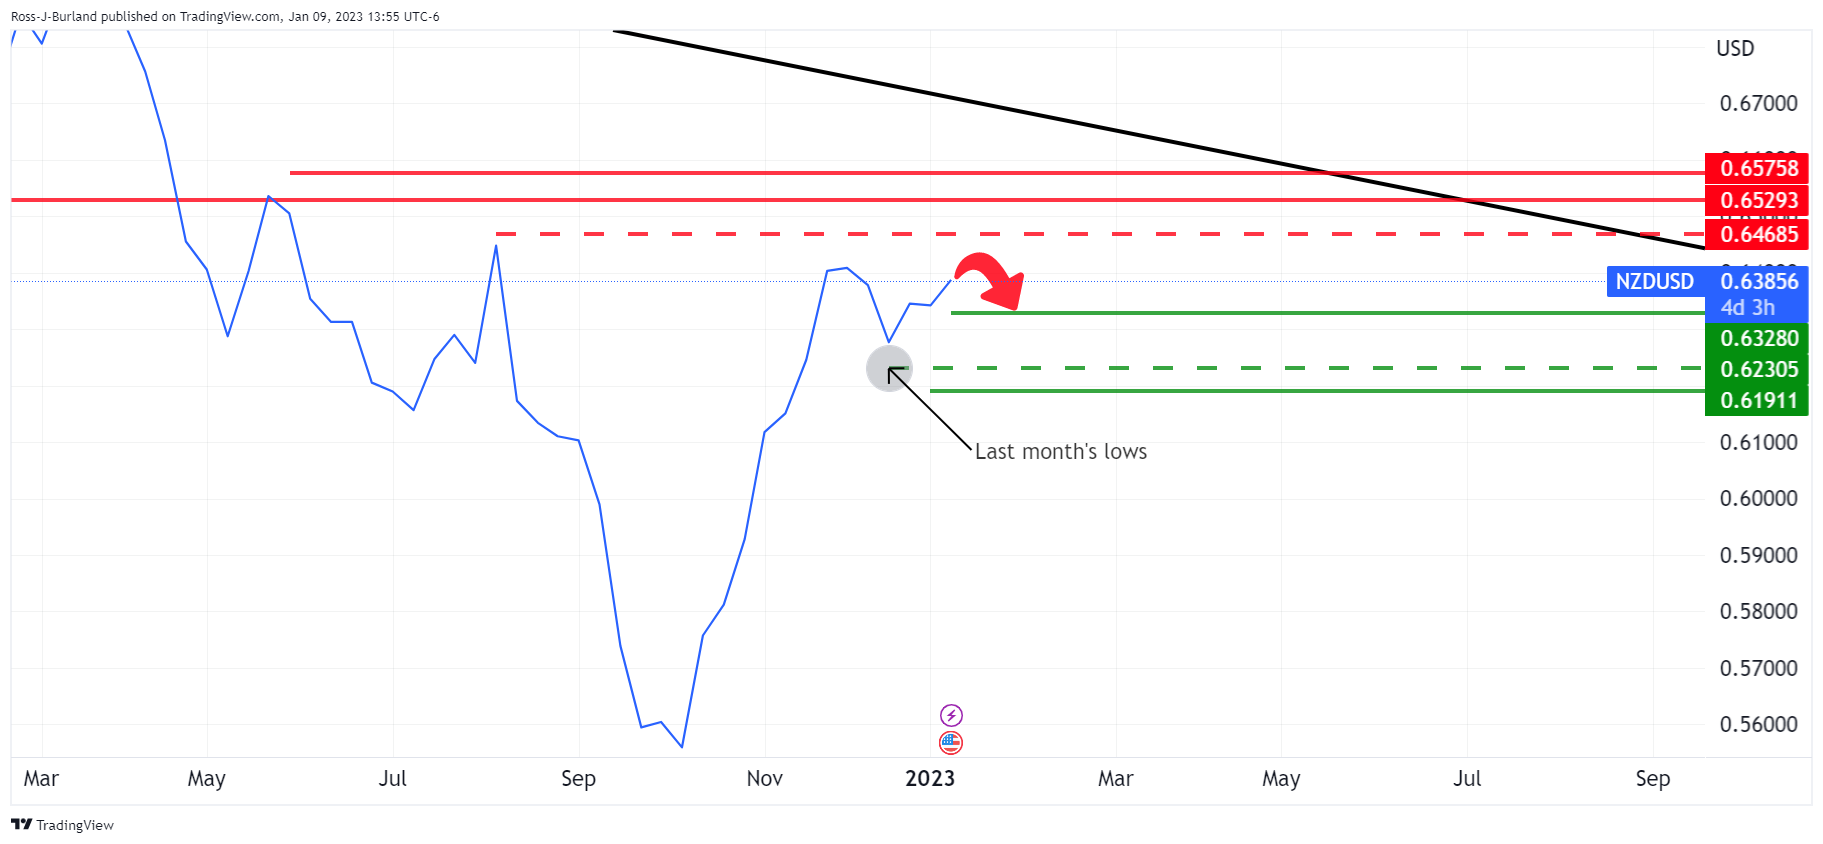
NZD/USD daily chart
We also have a daily W-formation forming into the close on Monday and this reinforces the bearish prospects for days ahead as the countdown to the US Consumer Price Index gets underway.
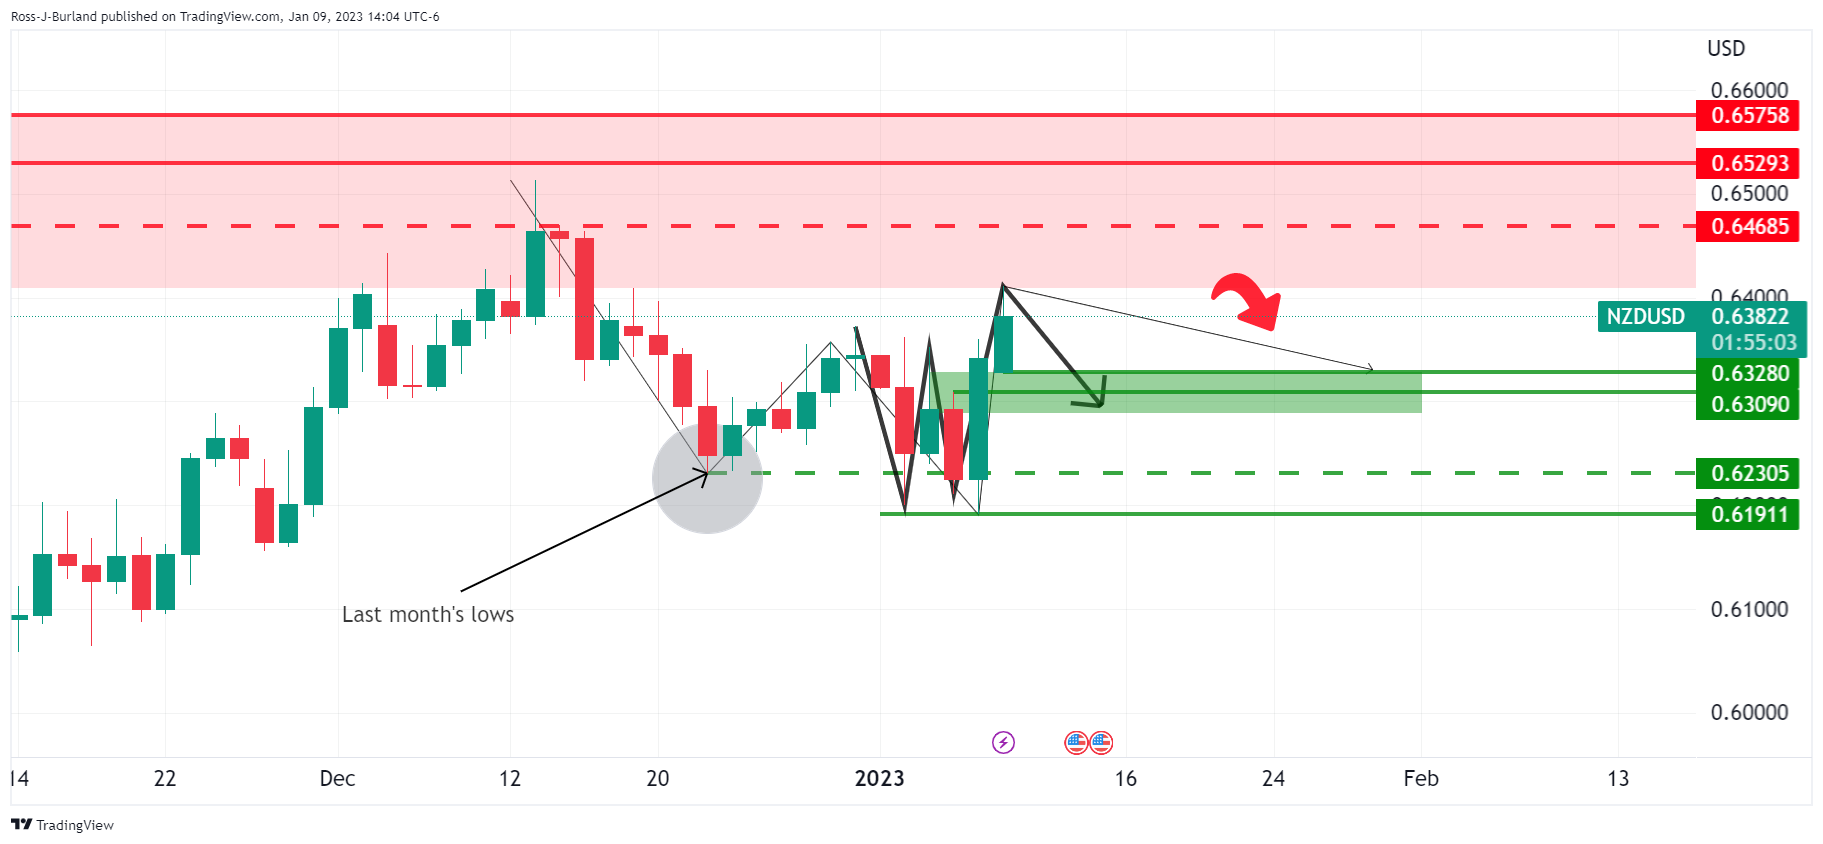
That is not to say, however, that a test of resistance cannot happen before Thursday's main event. This leaves the 0.6470s exposed. In any case, traders will be looking to the lower timeframes for signs for deceleration from the bulls that could lead to a break of 0.6200 and the 90.6191 recent lows in time to come:
-
20:02
United States Consumer Credit Change above forecasts ($25B) in November: Actual ($27.96B)
-
19:55
Forex Today: Optimism hits the US Dollar
What you need to take care of on Tuesday, January 10:
The US Dollar started the week on the back foot as optimism weighed on the safe-haven currency. On the one hand, market players assessed US macroeconomic data published last Friday, which suggests the Federal Reserve could slow the pace of tightening.
Federal Reserve officials backed such speculation, as San Francisco Fed President Mary Daly said that 50 bps or 25 bps are on the table for the next meeting. Atlanta Federal Reserve bank president Raphael Bostic added rates should rise to 5% or 5.25%. Both pledged more hikes to tame inflation before they could finally pause and hold for some time.
On the other, China announced the re-opening of sea and land crossings with Hong Kong, which were closed three years ago. Asian stocks posted substantial gains, leading the way higher for their overseas counterparts. It is worth noting that Wall Street trimmed a good bunch of its intraday gains ahead of the close.
EUR/USD reached 1.0760, holding on to gains despite tepid Euro Zone data. GBP/USD trades at 1.2200, benefiting from the broad US Dollar weakness.
Commodity-linked currencies advanced at the beginning of the day, spending the last two sessions consolidating near their daily peaks vs the dollar. AUD/USD trades around 0.6930, while USD/CAD is down to 1.3370.
The Japanese Yen appreciated against the US Dollar, with the pair down to 131.50.
Gold holds on to gains and trades around $1,875 a troy ounce. However, crude oil prices ended the day little changed, with WTI currently changing hands at $74.70 a barrel.
Here’s what to expect from Shiba Inu price with spike in trade volume and the burn rate
Like this article? Help us with some feedback by answering this survey:
Rate this content -
19:24
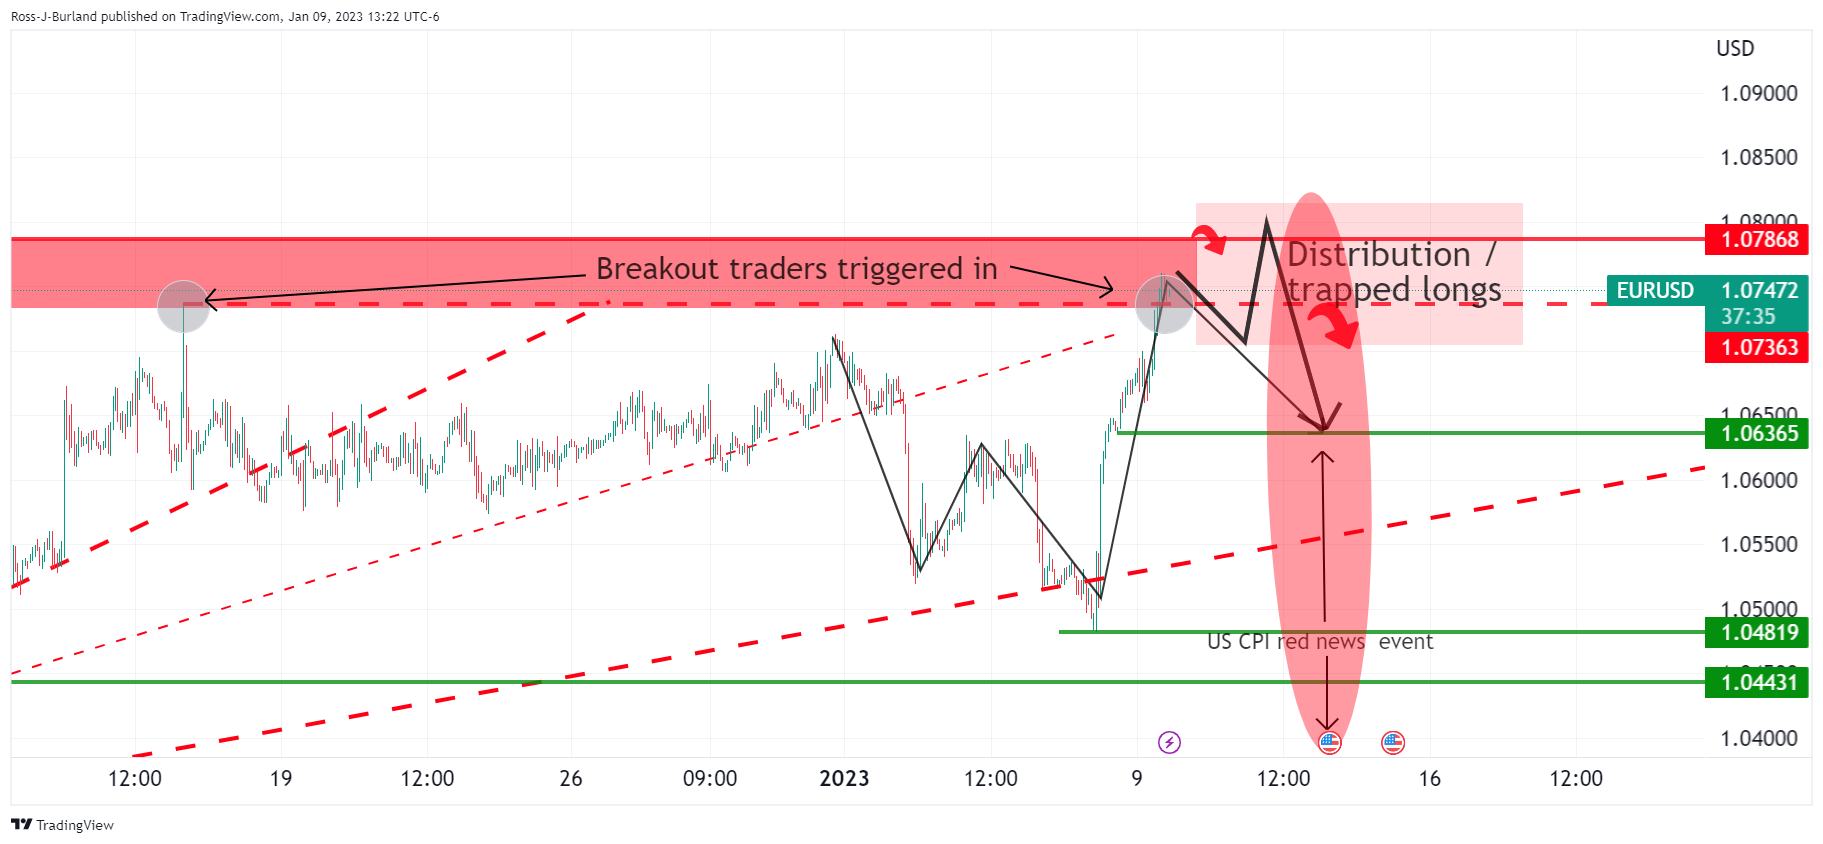
EUR/USD Price Analysis: Breakout traders triggered long, bears looking to pounce
- EUR/USD bearish W-formation is in focus.
- Bulls could find themselves trapped in trying to break out through recent highs.
- US CPI red news event could be the catalyst for a sizeable downside move.
EUR/USD broke to the backside of the bearish trend at the end of last year. It has since rallied towards a key resistance area but has started to slow in its ascent which leaves the focus on signs of distribution for the days ahead. The following illustrates this on a daily chart and highlights a key reversion pattern that has emerged at the start of the year:
EUR/USD daily chart
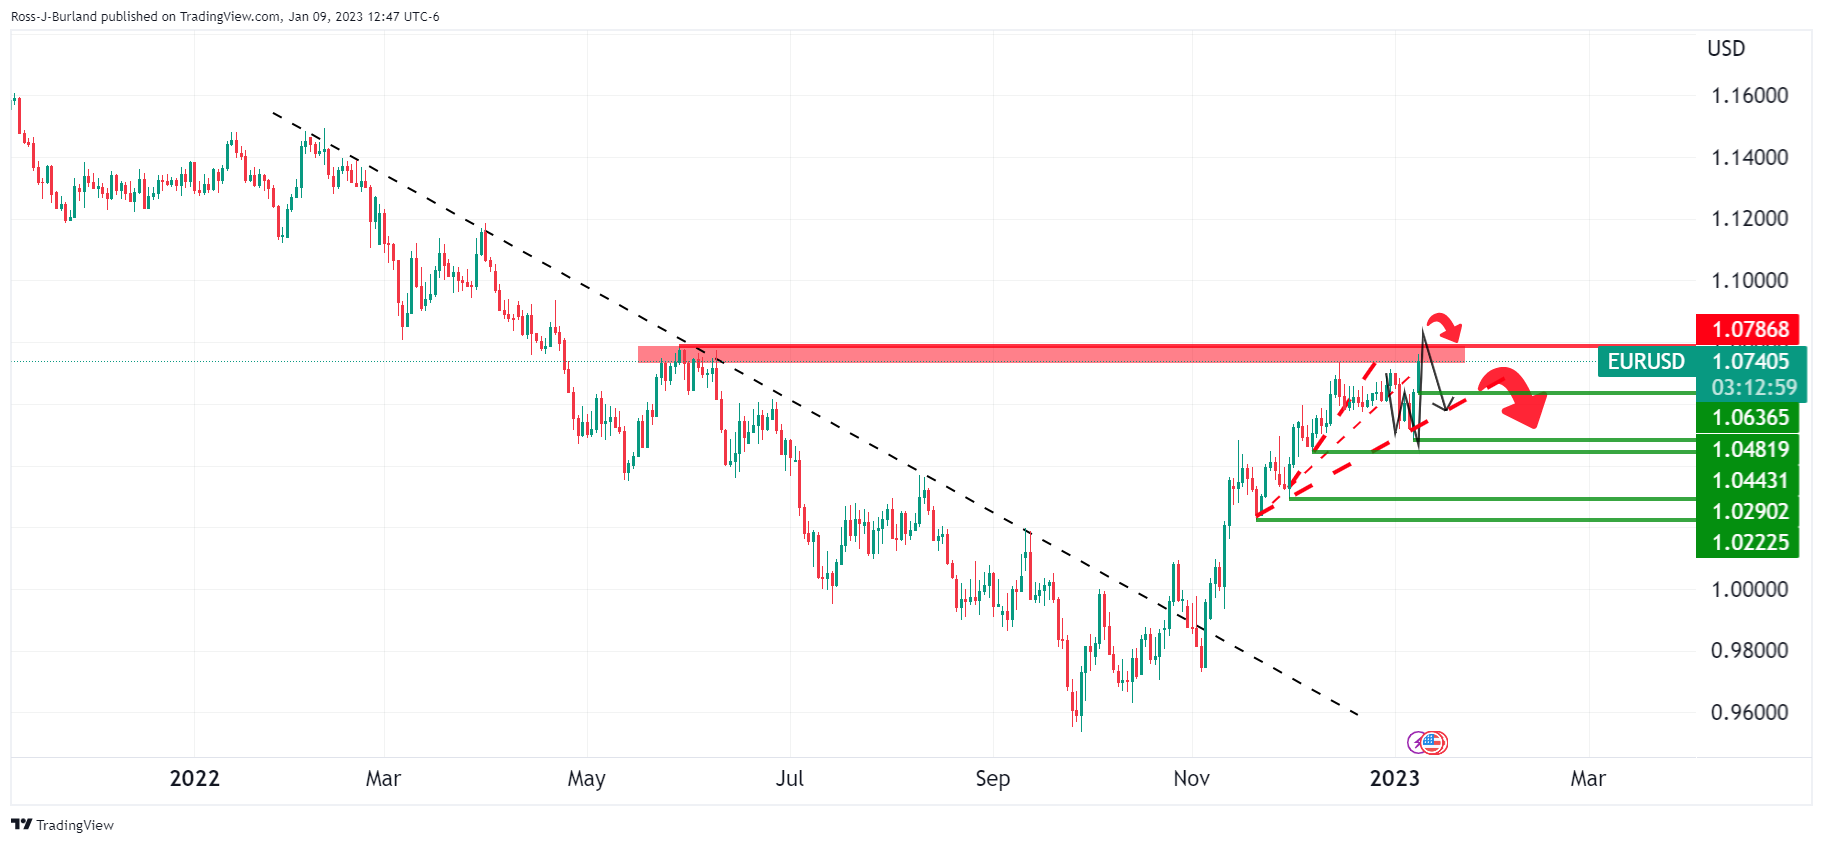
EUR/USD has reached up to test prior highs of 1.0736 and has moved into a critical resistance area as a potential last stop before the bears move back in.
Zoomed in...
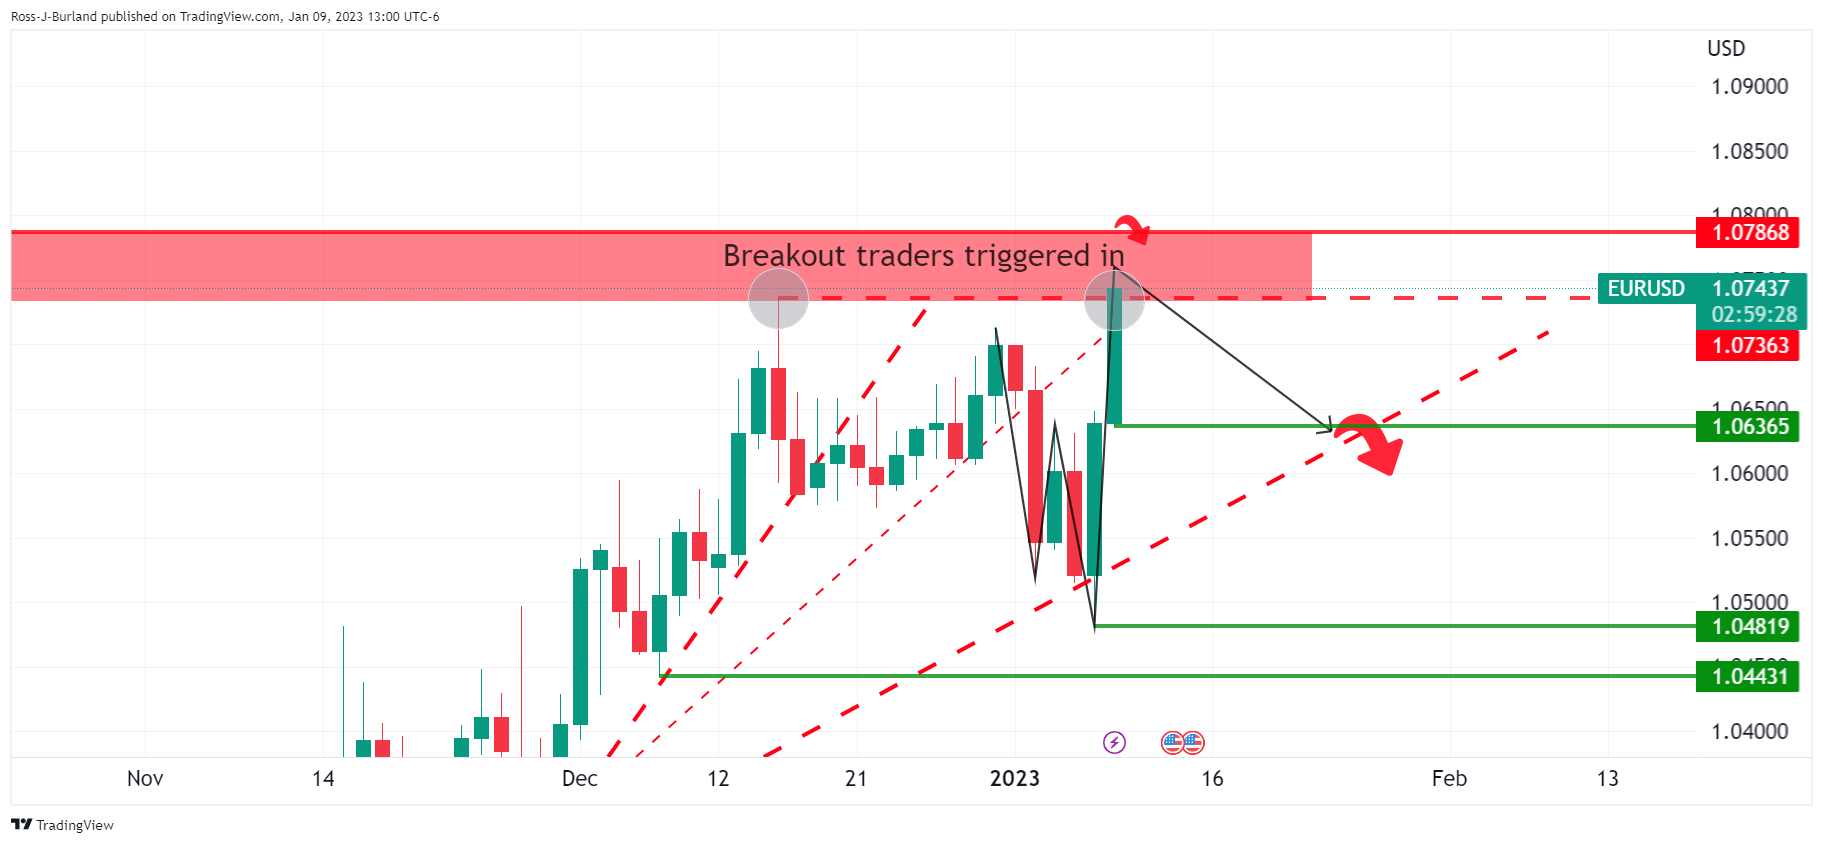
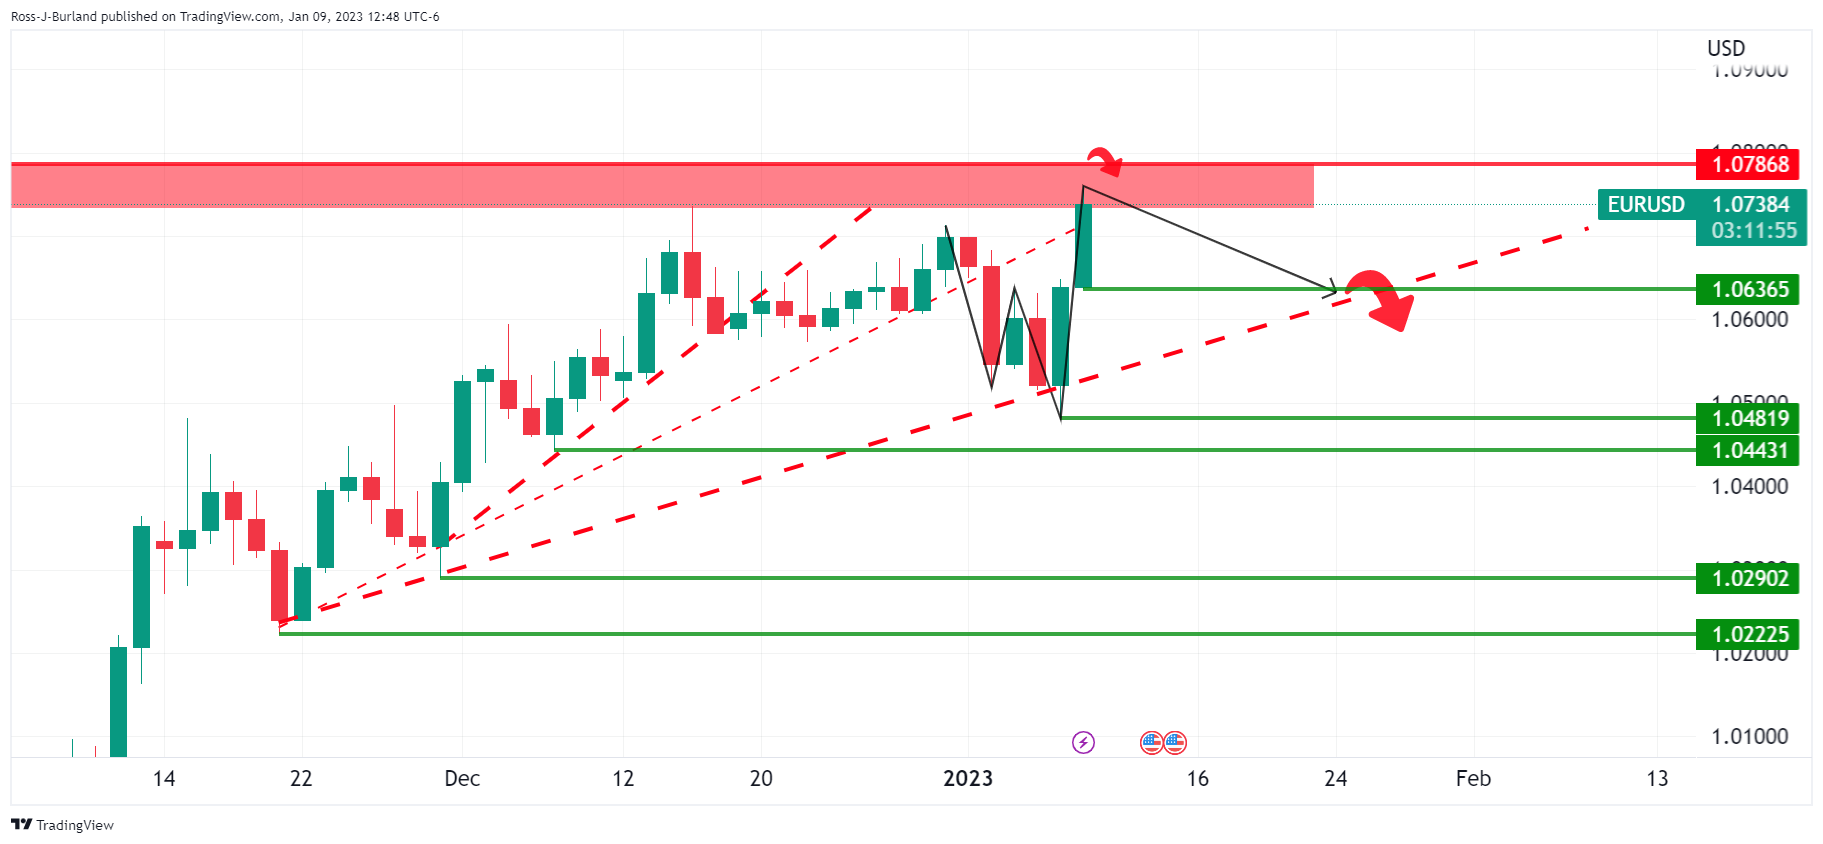
Should the bears emerge below 1.0790, then the focus will be on signs of distribution again that will ultimately trap the breakout long positions.
The W-formation is supportive of such a thesis given that it is a reversion pattern. EUR/USD would be expected to revert towards the neckline and day's lows of near 1.0637. This could put the trendline support back under pressure and open the risk of a move below 1.0500 and on to test 1.0480, 0.0440 and then 1.0300 that guards 1.0290 and 1.0225 lower down.
EUR/USD H1 chart
In the meantime, the lower time frames can be monitored for signs of buying exhaustion love the coming sessions:
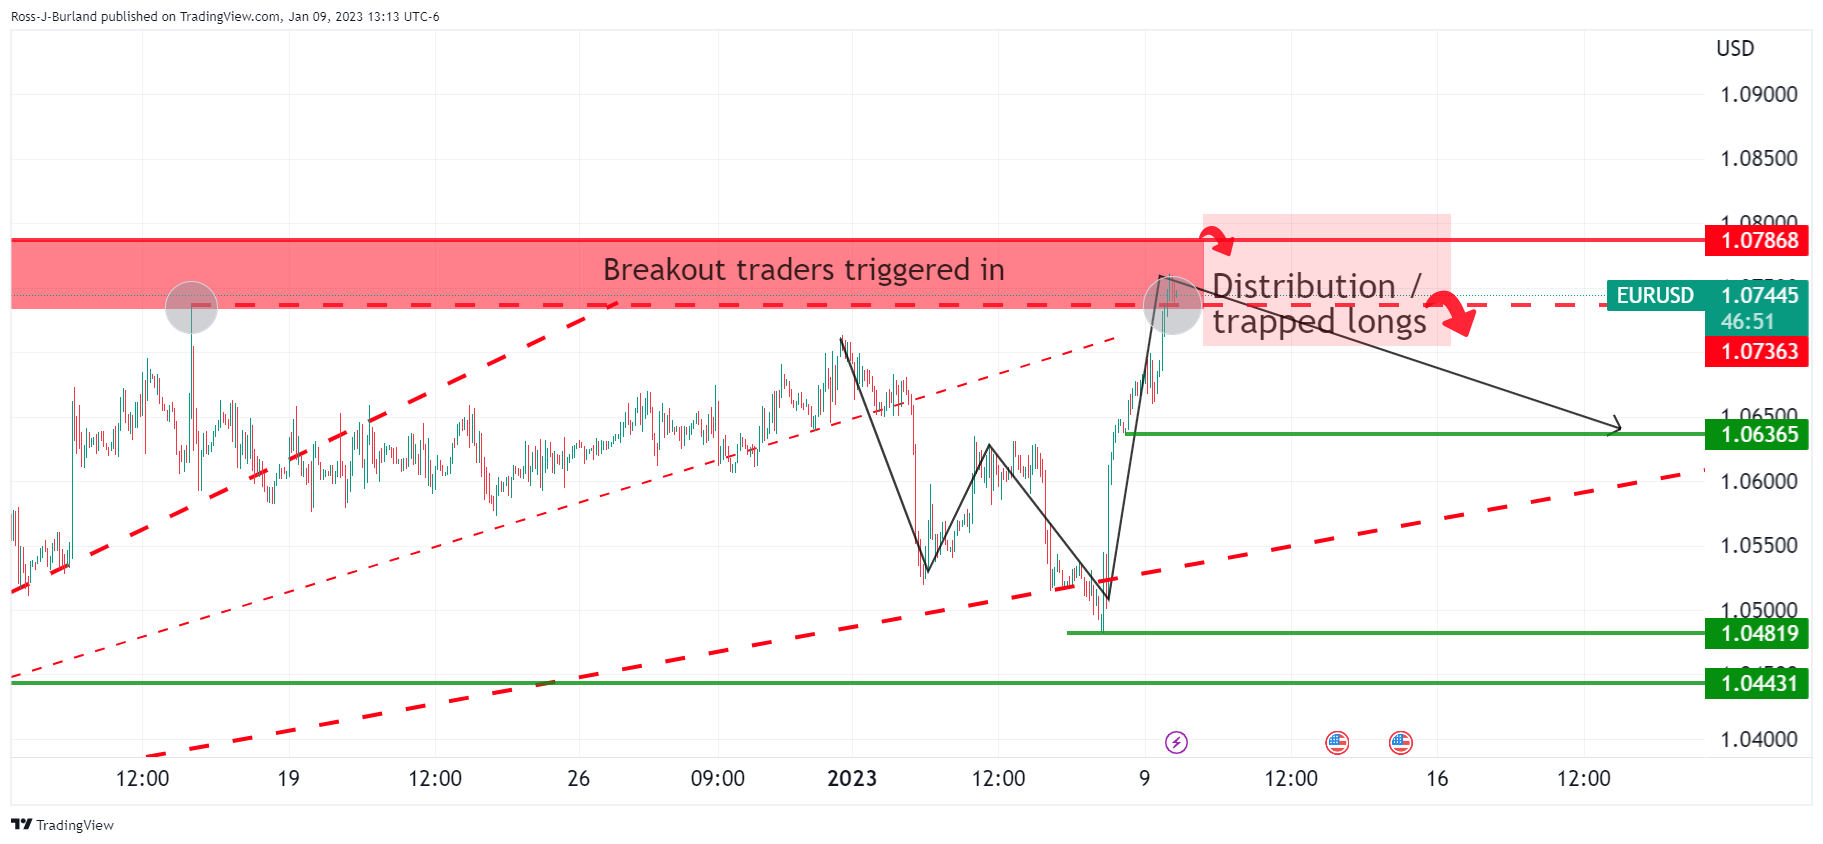
A long squeeze below 1.0750/36 could be in order for the sessions and days ahead with US Consumer Price Index eyed as a potential catalyst on Thursday for a three-day set-up and bearish opportunity.
With that being said, a test of 1.0800 is on the table beforehand:
-
18:46
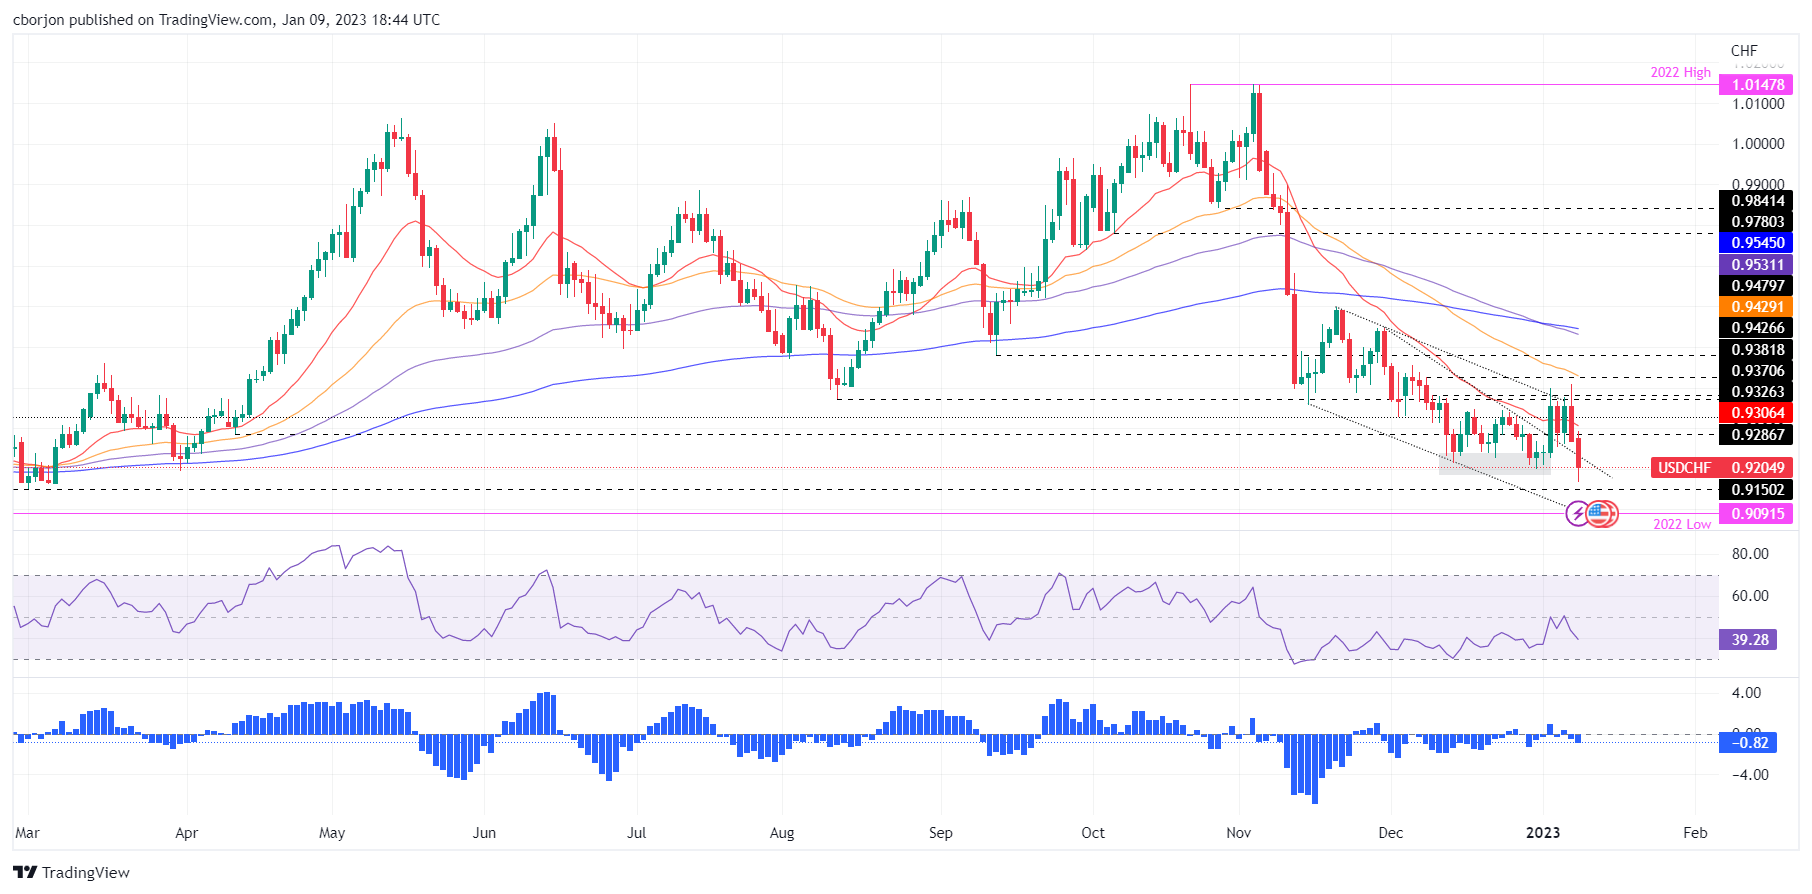
USD/CHF Price Analysis: Drops and invalidates falling wedge, seesaw around 0.9200
- Overall, US Dollar weakness and improvement in risk appetite weighed on the USD/CHF pair.
- A USD/CHF daily close below 0.9200 could exacerbate a fall toward 2022 yearly lows.
- Otherwise, the USD/CHF could bounce at around YTD lows and climb above 0.9300.
The USD/CHF drops back beneath a falling wedge top-trendline and extends its losses for two consecutive trading days, down by 0.73% as the US Dollar (USD) falls. At the time of writing, the USD/CHF is trading at 0.9202.
USD/CHF Price Analysis: Technical outlook
The USD/CHF daily chart portrays the resumption of the major’s downtrend. Failure to cling to gains around 0.9280s exacerbated a downfall toward its daily low of 0.9167, though buyers stepped around the daily lows, lifting the USD/CHF to current exchange rates. The USD/CHF stepped inside the falling wedge, a signal of bearishness. However, it would be needed a USD/CHF daily close below 0.9200 to pave the way for further downside. Otherwise, buyers could step in and lift the USD/CHF pair.
USD/CHF key support levels would be 0.9167. A breach of the latter would expose the February 21 daily low of 0.9150, followed by the 0.9100 mark, ahead of the 2022 year low of 0.9091. On the flip side, the USD/CHF first resistance would be 0.9200, which, once cleared, could pave the way towards today’s high of 0.9292, ahead of 0.9300.
USD/CHF Key Technical Levels
-
18:29
Fed's Bostic: Fair to say that the Fed is willing to overshoot
Atlanta Federal Reserve bank president Raphael Bostic said on Monday that it is ''fair to say that the Fed is willing to overshoot.''
Key notes
A likelihood that services inflation will prove sticker than the Fed would want.
Not seeing that wages are driving final goods prices.
Economy still has a "fair amount" of momentum, remains robust.
Right now economy can absorb Fed policy tightening.
Base case for 2023 is GDP growth of 1%, no recession.
Think inflation can fall to about 3% this year, though it will take time for the Fed's policy change to play out.
If there is a contraction it is going to be shallow and short.
Repeats see rates rising to between 5 and 5.25%.
Broad consensus that the Fed policy is in a restrictive place, appropriate to be much more cautious in terms of calibrating more. movements
Getting back to a more normal cadence of policy movements will be "appropriate and important".
Rates will have to stay high for "a long time...well into 2024".
Fair to say that the Fed is willing to overshoot.US Dollar update
The US Dollar was at a 7-month low, last down 0.83% at 103.05. The index, which measures the greenback against six major currencies, tumbled 1.15% on Friday as investors moved into riskier assets following a mixed labour market report and dismal US PMIs.
-
18:15
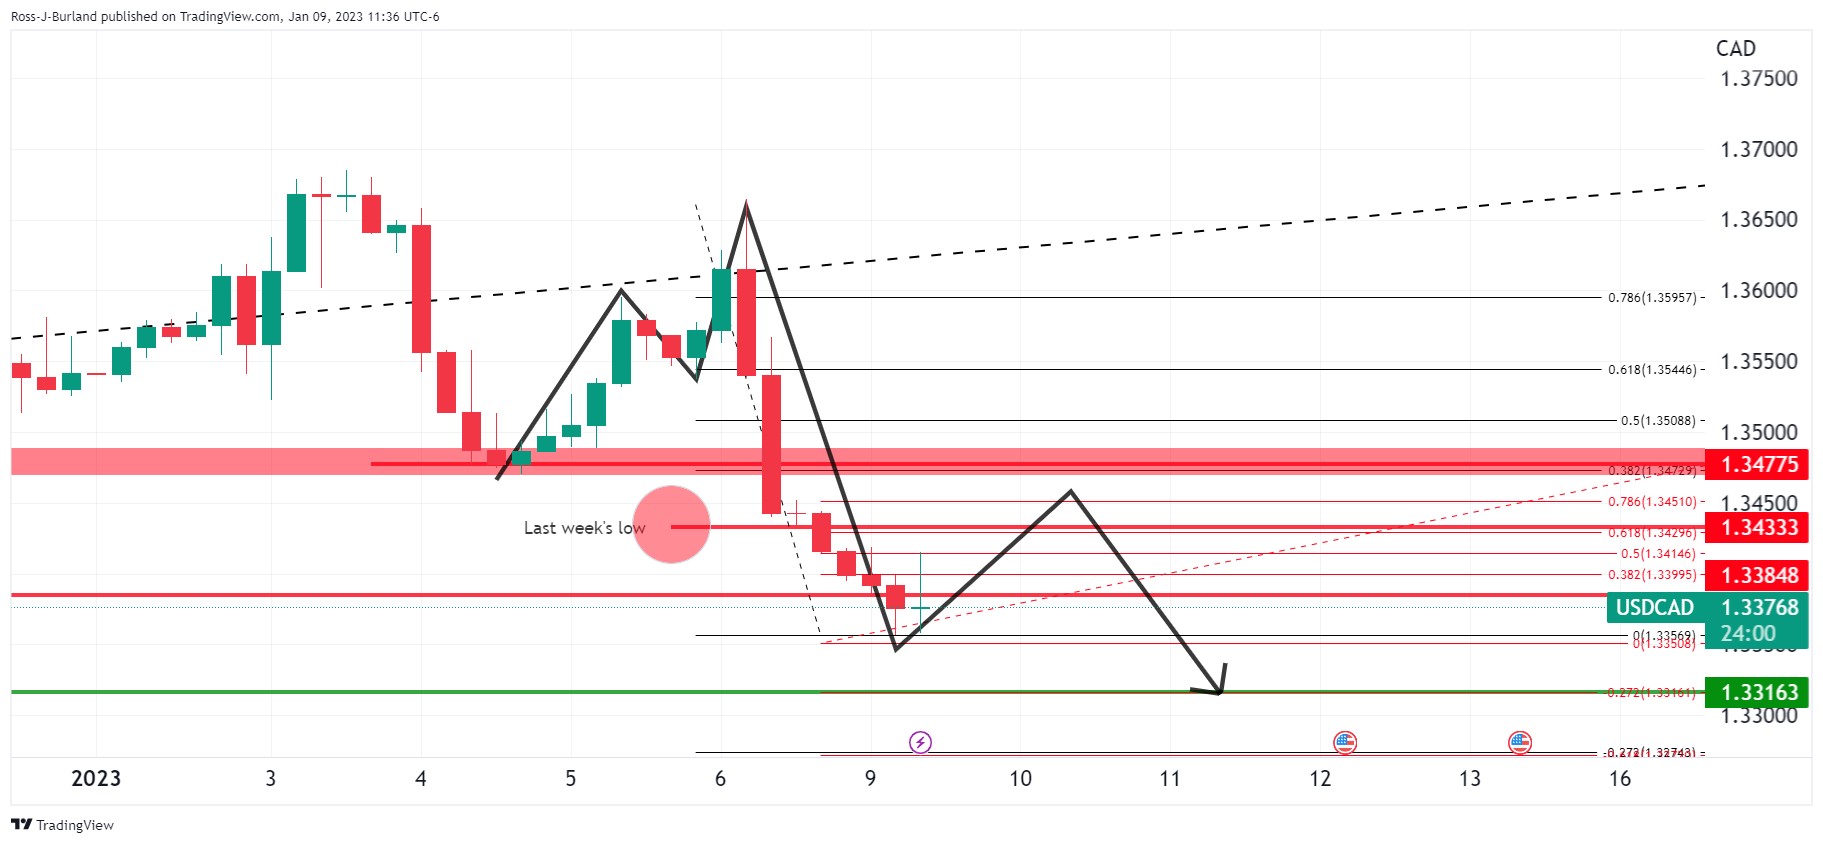
USD/CAD bears take out last month's low, but bulls could emerge
- USD/CAD bears remain in charge but a correction could be imminent.
- US CPI will be the key event for the week and US Dollar.
- Oil surges on China reopening, supportive of CAD.
USD/CAD has been pressured to a key area on the charts as the price of oil rallies while risky currencies benefited from China reopening borders. At the time of writing, USD/CAD is trading at 1.3370 and is down over 0.5% as we head towards the close of the first day of the week.
While there is good news being priced into the markets as China reopens, traders are looking ahead to this week's United States inflation data following a slew of market-impacting economic data last week from the US economy to start the year off. Markets are still digesting Friday’s Nonfarm Payrolls giving credence to a pivot from the Federal Reserve.
''The jobs report was strong overall as Unemployment dropped back to the cycle low of 3.5%, supporting the view that the labour market remains red hot,'' analysts at Brown Brothers Harriman explained. ''However, markets focused on the bigger than expected drop in average hourly earnings to 4.6% year over year.'' However, the analysts argued that ''if the labour market remains as tight as it seems, wages are unlikely to fall much further in the coming months.''
US CPI in focus
Meanwhile, US Services came in dismally poor and the combined jobs report has painted a picture of an economy that is growing and adding jobs, but where overall activity is tilting into recession territory. This prompted traders to sell the dollar against a range of currencies ahead of the US consumer inflation data due later this week.
Price pressures are still front and centre for investors and analysts at TD Securities explained that ''Core prices likely edged higher in December, with the index rising 0.3% month over month after printing 0.2% in November.
''Shelter inflation likely remained the key wildcard, though we look for goods deflation to act again as a major offset. Importantly, gas prices likely provided new relief to the CPI, as they fell sharply in December. All told, our month-over-month forecasts imply 6.5%/5.7% year over year for total/core prices.''
If the data were to surprise to the upside, this would be expected to shift investors' belief that the most likely outcome for the Fed's February meeting is for a 25-basis- point increase.
Oil rises as China reopens borders
Elsewhere, China continued to dismantle much of its strict zero-COVID rules around movement as it reopened its borders to international visitors for the first time since it imposed travel restrictions in March 2020. The BBC reported that ''incoming travellers will no longer need to quarantine, marking a significant change in the country's Covid policy as it battles a surge in cases. They will still require proof of a negative PCR test taken within 48 hours of travelling.''
As a consequence, supportive of the oil-exporting nation's currency, CAD, oil prices surged early on Monday as hopes demand from China will improve as the country issued new import quotas and offered economic support for its flagging economy. Spot West Texas Intermediate crude was last seen up 1.7% to $ 74.91 bbls.
USD/CAD positioning data
When looking at the positioning data, it is worth noting that speculators’ net long USD index positions remain close to their recent lows.
''Despite the hawkish tone of the Fed, net longs are around half the size they were in August, reflecting talk of ‘peak’ Fed rates in recent months. Hopes that the Fed may slacken the pace of rate hikes following the December payrolls report suggest scope for another fall in net longs in the next set of data,'' analysts at Rabobank argued.
The analysts also explained that Canada’s strong December jobs report could have an impact in the next set of CAD's positioning data. ''Speculators’ net short CAD positions dropped lower. The previous week they reached their highest levels since August 2020,'' the analysts said.
USD/CAD technical analysis
After meeting the weekly M-formation's neckline, USD/CAD is now testing last month's low this week and is penetrating a weekly bullish trendline with another more dominant one in sight below:
USD/CAD weekly chart
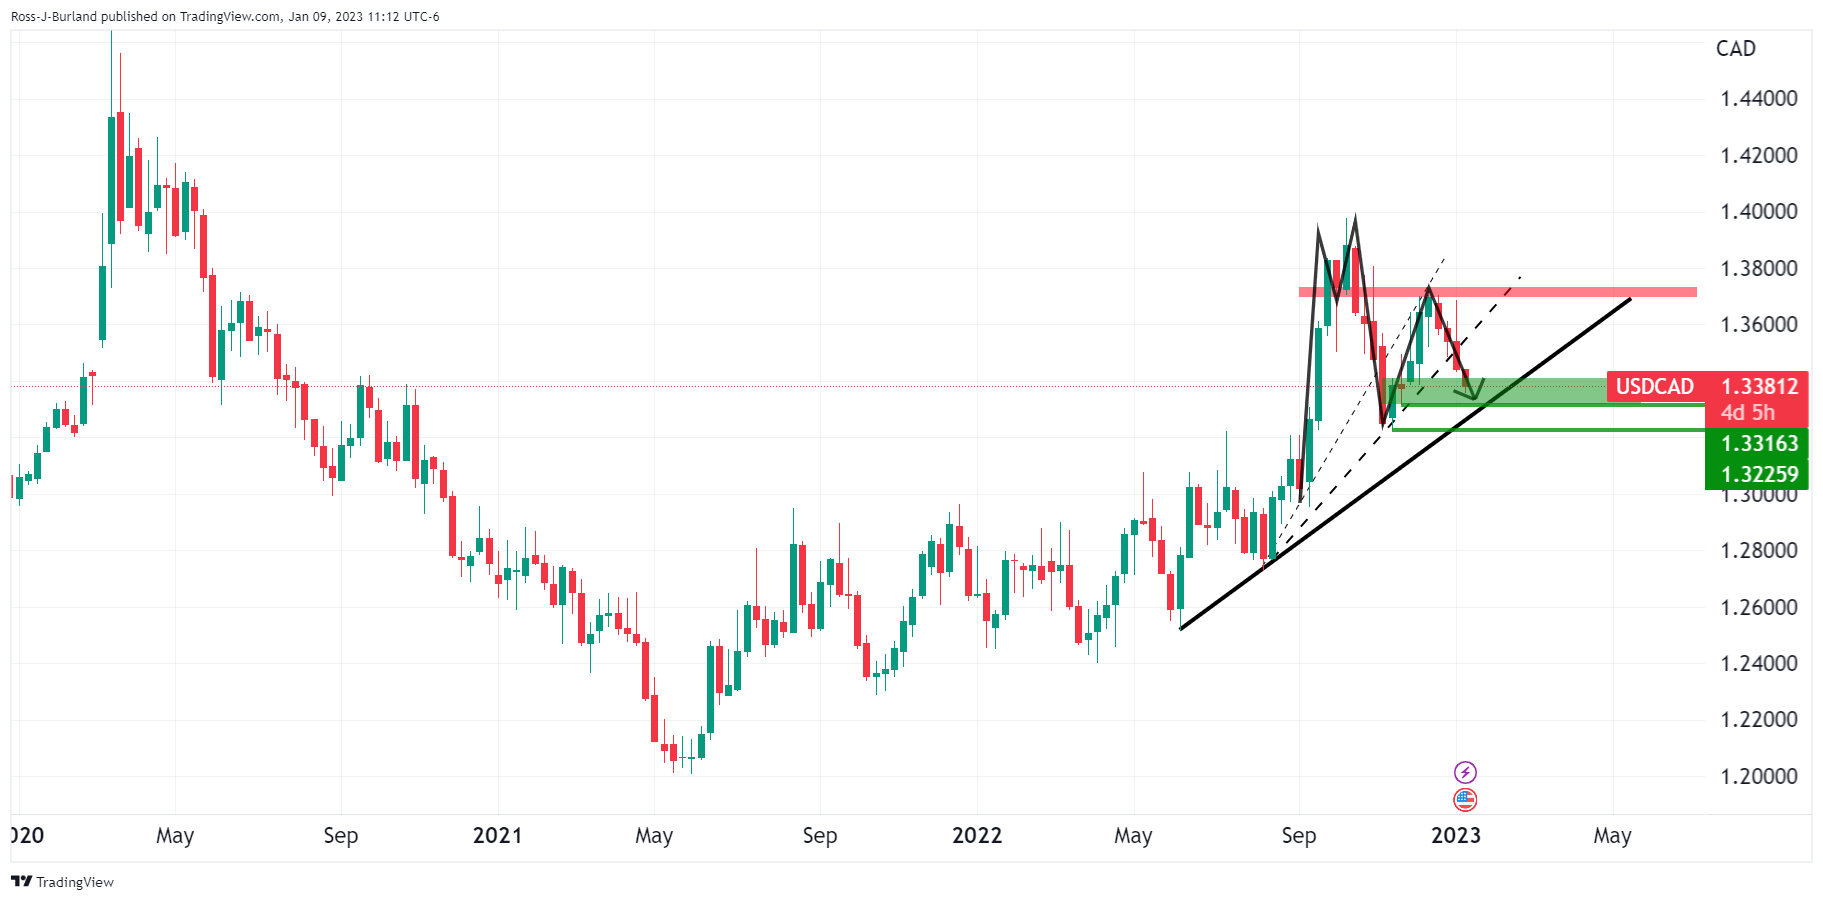
USD/CAD eyes 1.3316 and 1.3225 that come in and around the trendline as illustrated.
USD/CAD daily chart
From a daily perspective, given USD/CAD has pulled in higher time frame sellers on a break of last month's low, the initial balance of the week is being set and this could be the low for the week:
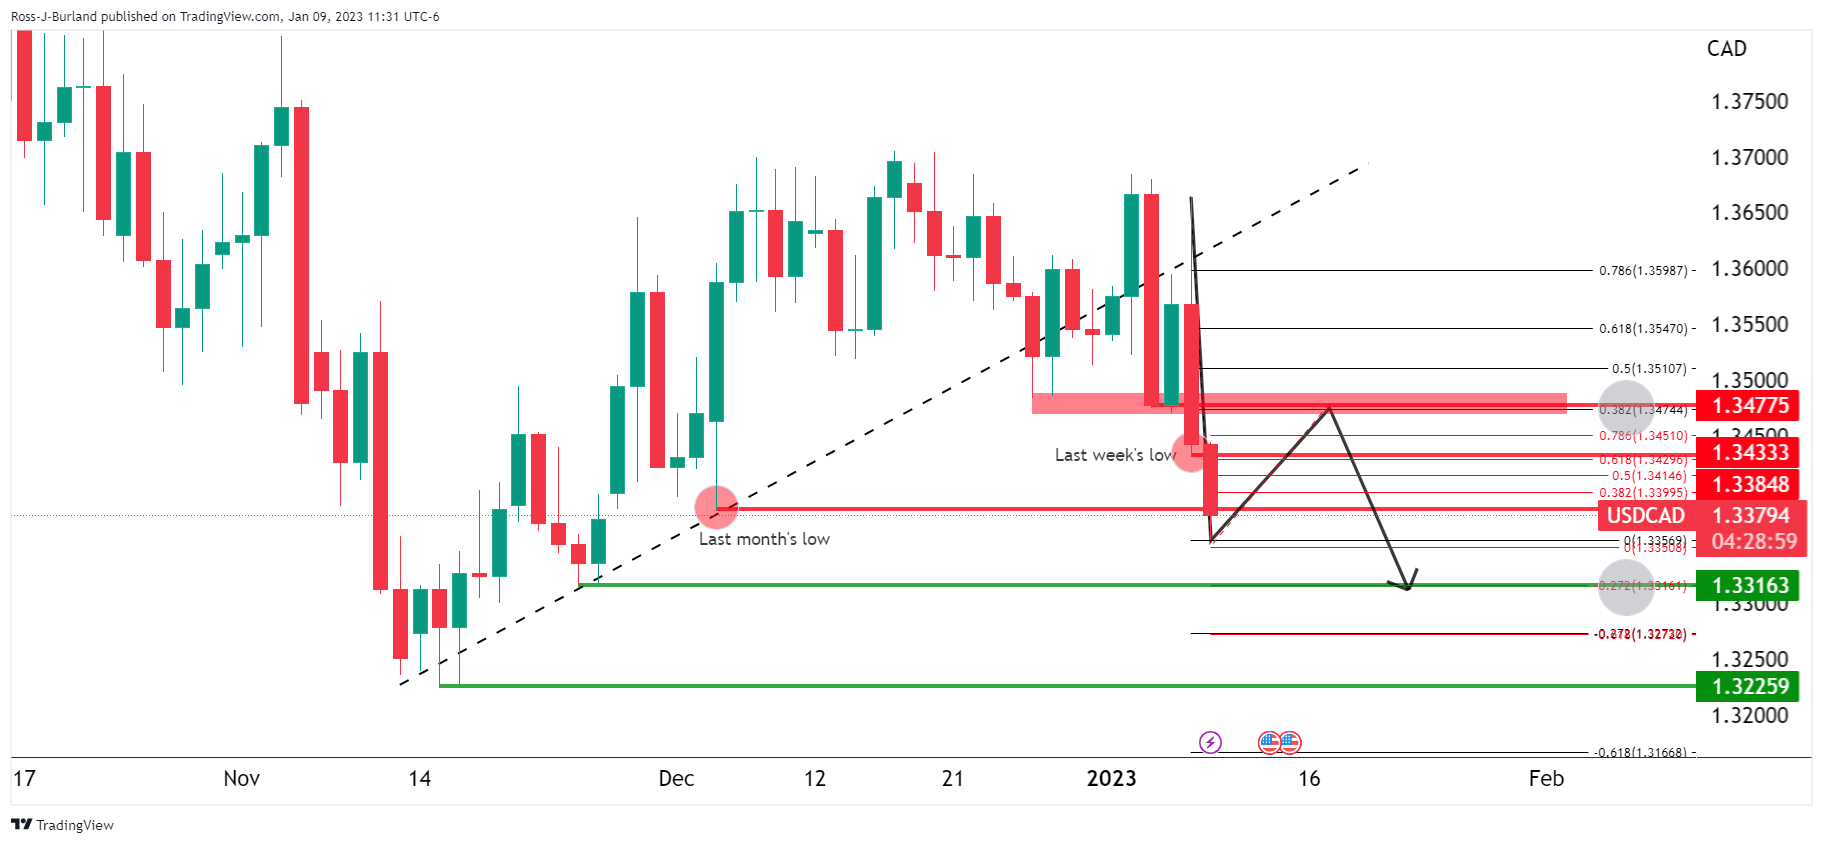
If so, trapped shorts will be under pressure. A retest of last week's low near 1.3430 opens the risk of a move beyond and into the Fibonacci scale to target a 38.2% ratio that meets late December and early January lows as the structure around the 1.3470s. Should the bears commit at this juncture, then they will be encouraged to stay the course for a re-run of the recent lows to target a -272% ratio of the corrective range that meets prior lows of 1.3316 that guard the 1.3220s.
USD/CAD H4 chart
From a 4-hour perspective, the M-formation supports the meanwhile bullish thesis as this is a reversion pattern that would be expected to draw in the price towards the anticipated resistance near 1.3470s. A bullish 4-hour close would be encouraging in this regard:
Zoomed in...
-
18:02
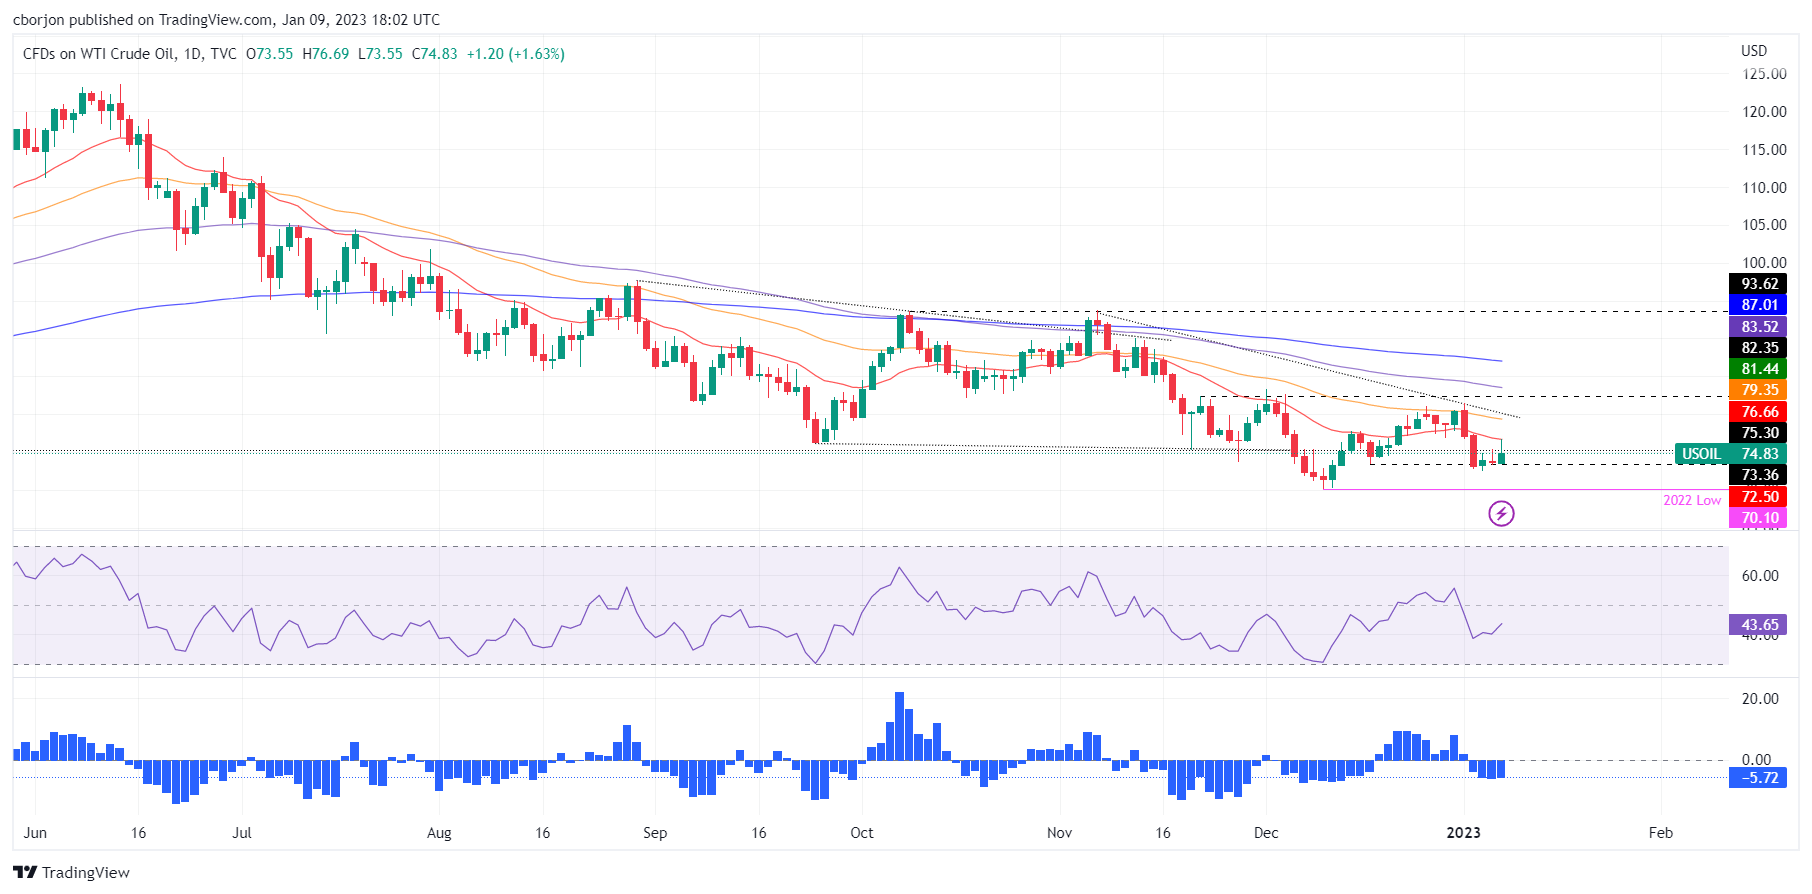
WTI climbs on China’s reopening, steadily around $74.80s
- Oil prices trim some of the last week’s 8% losses, up by 1.70%.
- The reopening of China and a softer US Dollar keep WTI advancing, though trading off the $76.69 highs of the day.
- WTI Price Analysis: Break above $75.00 could pave the way toward the 20-day EMA.
Western Texas Intermediate (WTI), the US crude oil benchmark, rose about 2% on Monday following China’s border reopening, which bolstered fuel’s demand outlook amidst recessionary fears looming. At the time of writing, WTI is trading at $74.83 per barrel.
A boost in sentiment spurred by China’s news and a less hawkish US Federal Reserve (Fed) was cheered by oil traders. Consequently, the greenback weakened, as shown by the US Dollar Index dropping 0.81%, down to 103.069.
Although today’s price action suggests WTI prices could resume upward, traders should be aware of last week’s losses of more than 8%, which were the most significant weekly declines since 2016.
Even though China’s opening its borders after three years of being closed was cheered by investors, woes that it could trigger an uptick in Covid-19 cases keep investors refraining from committing to riskier assets.
Meanwhile, US economic inflation expectations unveiled by a New York Fed survey flashed that consumers for one-year-ahead inflation slowed to 5% in December, on its lowest reading since July 2021. However, estimates for the three years were unchanged at 3%, while for a longer term, they edged 0.1% up to 2.4%.
WTI Price Analysis: Technical outlook
From a technical perspective, WTI peaked at around $76.69 per barrel on Monday, failing to crack the 20-day Exponential Moving Average (EMA) at $76.67. Suppose WTI achieves a daily close above January’s 6-daily high of $75.44. In that case, that will keep oil bulls for a resumption of a challenge of the 50-day EMA at $79.35, ahead of testing a three-month-old downslope trendline drawn from November highs of $93.73, which passes around $79.85, ahead of WTI reaching $80.00 a barrel.
-
17:48
Fed's Daly: December wage data was one month of data, can't declare victory
San Francisco Federal Reserve Bank President Mary Daly is dropping important comments in a live questions and answers with the Wall Street Journal.
Key notes
Expect US economy to continue slowing.
In Q1 expect labor market to continue to slow, inflation to come down.
Fed is data-dependent.
Have not seen core services inflation come down as we would like.
Core services inflation excluding shelter has shown no sense it is coming down.
There's agreement among fed policymakers that inflation is more persistent than thought.
Biggest risk is that inflation expectations would drift up.
We are determined, united, resolute to bring inflation down.
Wage growth coming down is completely consistent with labor market slowing.
Still out of balance in labor market.December wage data was one month of data, can't declare victory.
It's too soon to declare victory and stop rate hikes.We don't need to see inflation get to 2%, or even down to a stone's throw before we would stop raising rates. This phase of tightening is extremely challenging.
More to come...
US Dollar update
The US Dollar was at a 7-month low, last down 0.77% at 103.11. The index, which measures the greenback against six major currencies, tumbled 1.15% on Friday as investors moved into riskier assets following a mixed labour market report and earlier dismal US PMIs.
-
16:56
AUD/USD prints a new five-month high above 0.6900 as the USD remains offered
- AUD/USD climbs due to traders’ speculations that the US Federal Reserve would shift dovish.
- US 10-year Treasury bond yield continues to edge lower, eyeing the 3.50% threshold and weighing on the USD.
- AUD/USD Price Analysis: A daily close above 0.6900 can exacerbate a rally to 0.7000.
The AUD/USD soars sharply above the 0.6900 figure on speculations that the US Federal Reserve (Fed) would pivot from tightening monetary conditions, so the US Dollar weakened. US Treasury yields are dropping toward the 3.50% region while global equities continue to rise. At the time of writing, the AUD/USD is trading at 0.6948, above its opening price by 1.11%.
Sentiment and traders pricing a less hawkish Fed bolstered the AUD/USD
Wall Street extends its gains on Monday, ahead of the first release of US earnings. Inflation expectations in the United States (US) revealed by a New York Fed survey showed that consumers for one-year-ahead inflation decelerated to 5% in December, on its lowest reading since July 2021. However, estimates for the three-year period were unchanged at 3%, while for a longer term, they edged 0.1% up to 2.4%.
Aside from this, the US Dollar is edging down by 0.84%, as the US Dollar Index (DXY) shows, at 103.036, weakened by investors assessing a possible Fed pivot, as shown by US Treasury bond yields pushing lower, down at 3.523%.
Earlier in the Asian session, the Australian docket featured Building Permits for November, flashing a weaker housing as permits plummeted -9.0% below estimates for a -1.0% contraction, though AUD/USD traders mainly ignored data.
Reports from China added to an upbeat sentiment, suggesting that the country will boost the issuance of special local government bonds to a record high of CNY 3.8 trillion. Senior PBOC official Guo said growth would soon return to “normal” as policymakers support households and private companies more. Guo added that “The key to the economic recovery is to convert current total income to consumption and investment to the largest possible extent.”
AUD/USD Price Analysis: Technical outlook
Following a daily close above 0.6886 and piercing the 200-day Exponential Moving Average (EMA) at around 0.6821 exacerbated the AUD/USD rally to the current exchange rate. After seesawing around the 0.6600-0.6800 area during the last ten days, the major broke upwards, eyeing the 0.7000 mark. Oscillators like the Relative Strength Index (RSI) at 63 paint a bullish picture of the AUD/USD, while the Rate of Change (RoC) shows an increase in volatility, as the AUD/USD reclaimed 0.6900.
Therefore, the AUD/USD path of least resistance is upwards, and the key resistance levels would be the 0.7000 mark, followed by the August 26 daily high of 0.7008 and the August 12 swing high of 0.7128.

-
16:48
Brazil: Protests unlikely to hit the Real – Wells Fargo
On Sunday, just a week after Luiz Ignacio Lula da Silva was sworn in as president, supporters of former President Jair Bolsonaro stormed Brazil's Congress and other buildings against the outcome of the 2022 presidential election and the new administration. Analysts at Wells Fargo point out that despite political risk being typically elevated in Brazil, they believe Brazil's “January 6 moment” will not have a long-lasting impact on local financial markets or the economy. They still see USD/BRL around 5.30 by the end of the first quarter.
Past weekend’s event unlikely to weigh on BRL
“Despite more elevated political risk, we maintain our view that the USD/BRL exchange rate can hover around BRL5.30 by the end of Q1-2023 and that the real can strengthen toward BRL5.00 by the end of this year. We also believe this past weekend's events do not alter the course of Brazilian Central Bank (BCB) monetary policy, and we continue to believe BCB policymakers will initiate an easing cycle in Q3 of this year. And as far as the economy, our base case scenario is intact, and we believe Brazil's economy will enter a mild and modest recession by the middle of this year.”
“In the near-term, we will be focused on the Lula administration's reaction to the riots, especially since federal intervention is in place through the end of the month.”
“Over the medium-to-longer term, Lula's fiscal policy will likely be the driving force of the currency. Should future fiscal policies result in a further erosion of fiscal responsibility, we would turn outright negative on the currency for all of 2023, and our BRL5.00 target would be adjusted to reflect an outlook for Brazilian real weakness through the end of this year.”
-
16:23
Gold Price Forecast: XAU/USD bullish near eight-months highs as US Dollar keeps falling
- Gold price holds onto recent gains as the rally in Wall Street continues.
- A weaker US Dollar offers support to XAU/USD that continues to look at $1,880.
- Strong demand for Treasury bonds as market participants await a less hawkish Fed.
Gold prices are holding up and near the $1,880 area on Monday, supported by another slide of the US Dollar across the board, amid risk appetite and lower US Treasury bond yields. Technical bias points to further gains for the yellow metal.
US Dollar drops to lowest in months
The US Dollar, measured by the DXY is trading at the lowest level since June 2022, approaching 103.00, down 0.75% for the day, falling for the second day in a row. The greenback weakened on Friday following US economic data that included a mixed NFP report and an concerning ISM Service Sector PMI report.
Even USD/JPY is trading in negative territory on Monday after being unable to hold onto daily gain, and is back under 132.00. EUR/USD is at the highest level in six months while AUD/USD is at 0.6950, the highest since late August.
US Treasury bonds on demand
Last week’s economic data boosted speculations about a slowdown in the Fed rate hike cycle, favoring an increase of 25 basis points instead of a 50 bps. US Treasury yields tumbled on Friday and remains near the lows on Monday, with the US 10-year Treasury yield at 3.55%, the lowest since December 19 and the 2-year at 4.22%.
European yields are modestly higher but still near weekly lows. The rise in sovereign bond yields is a positive development for gold prices. As long as the market environment favors less hawkish monetary policy in Europe and the US, XAU/USD will likely remain strong.
Risk appetite: other positive for gold
After rising more than 2% on Friday, US equity prices are having another great day. The S&P 500 is up by 1.25% and the Nasdaq gains almost 2%. The improvement in market sentiment is also boosting commodity prices. The WTI barrel is at 75.85$, off highs but by 2.75%. Even cryptocurrencies are up with Bictoin at $17,260 and Ethereum up by 5.35% at $1,337.
Gold: Cleary bullish above $1,825
Last week, XAU/USD broke above $1,830, and it consolidated above strengthening the outlook for the yellow metal. The price peaked on Monday at $1,881.53, the highest level since June. It then pulled back finding support above $1,870.
The RSI is about to hit overbought readings suggesting that a correction or a consolidation might take place before the next leg higher. The next target is seen at $1,890, the last line of defence for a test of $1,900.
The bullish outlook for gold prices will remain strong while it holds above $1,825/30. The mentioned zone is a strong horizontal support and also currently an uptrend line is seen. A break lower would favor more losses.
Gold daily chart
-638088779264729573.png)
.
-
16:06
NY Fed: One-year consumer inflation expectation declines to 5% in December
The Federal Reserve Bank of New York's monthly Survey of Consumer Expectations showed on Monday that the US consumers' one-year inflation expectation declined to 5% in December from 5.2% in October.
Further details of the publication showed that the three-year ahead expected inflation remained unchanged at 3% and the five-year ahead expected inflation edged higher to 2.4% from 2.3%.
"The median expected growth in household income rose by 0.1 percentage point to 4.6% in December, a new series high," the NY Fed noted in its publication. "Median household spending growth expectations fell sharply to 5.9% from 6.9% in November. The decline was broad based across age and income groups."
Market reaction
The US Dollar Index stays under bearish pressure and was last seen losing 0.8% on the day at 103.05.
-
16:00
Gold Price Forecast: XAU/USD supported by negative real yields – Erste Group
XAU/USD increased by +9.9% in the fourth quarter. Negative real yields favour a rising Gold price, economists at Erste Group Research report.
Gold to inch higher to around $1,890 in 1Q 2023
“Real yields remain in negative territory in 1Q 2023 despite Fed rate hikes. This is a factor that favours a rising Gold price. However, real yields will rise due to the continuation of the Fed's rate hike cycle and the expected decline in the US inflation rate during 1Q but will remain in negative territory. As long as that is the case, Gold has very strong support.”
“The expected slowdown in global economic growth and declining corporate earnings growth rates will boost safe-haven flows in gold.”
“We expect a slight price increase to around $1,890 in 1Q 2023.”
-
15:49
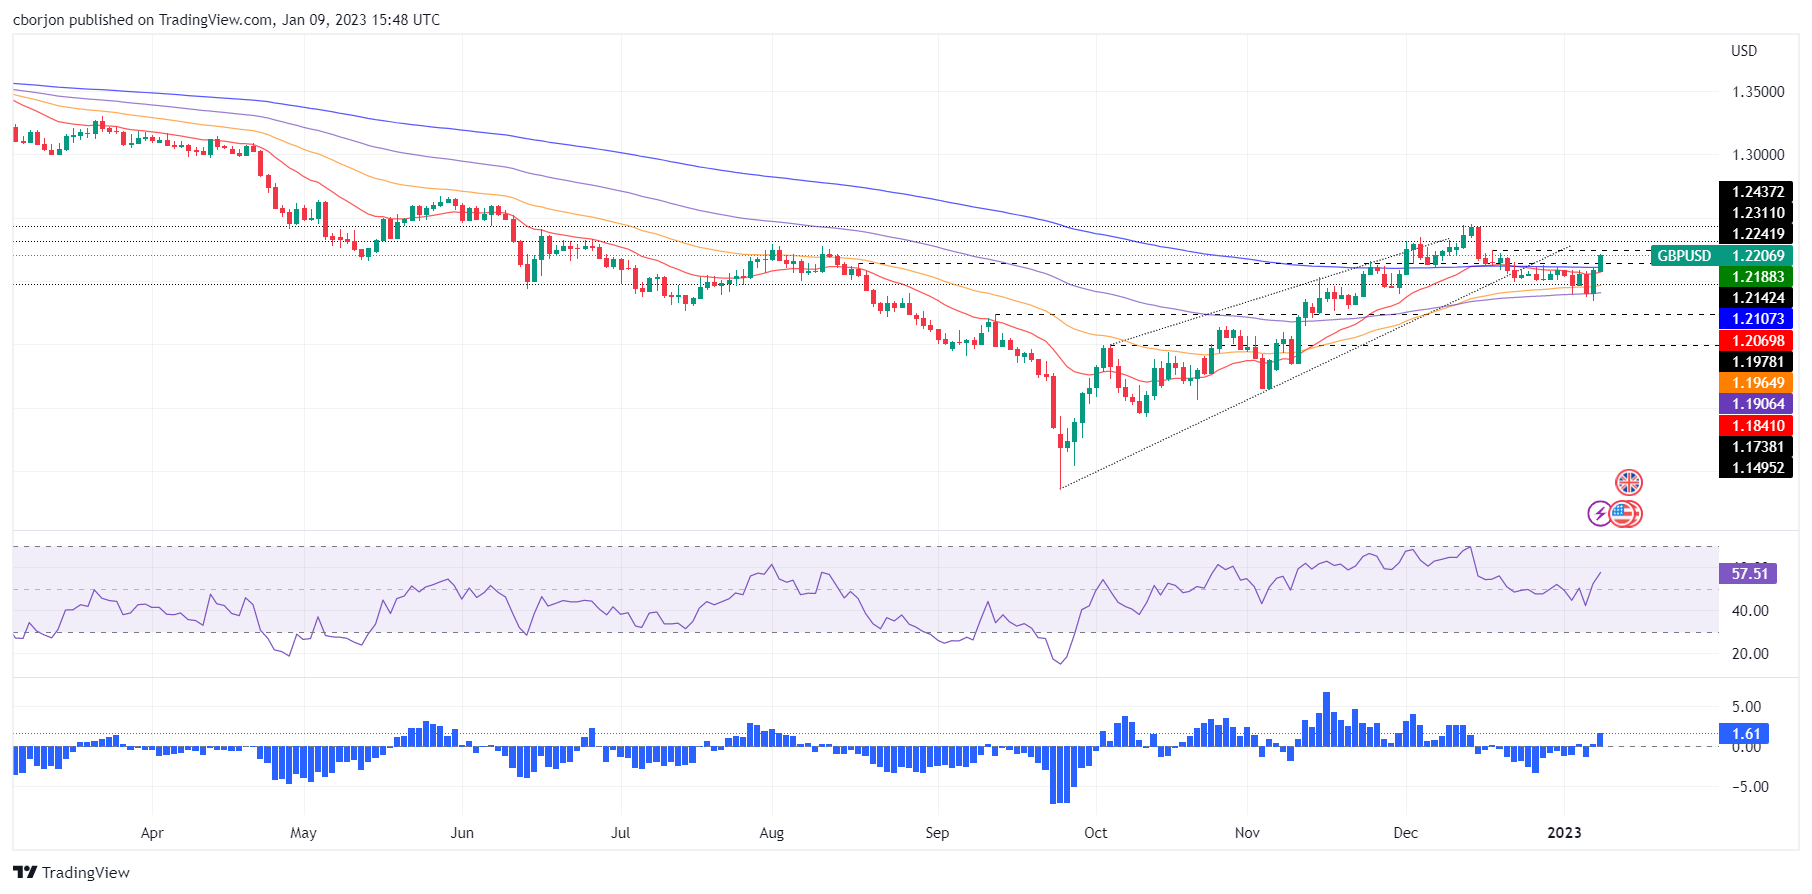
GBP/USD rallies above 1.2200 on soft US Dollar, BoE’s comments
- The GBP/USD pierces the 200-day EMA and distance from it, rallying above the 1.2200 figure.
- Investors are eyeing the United States inflation report on Thursday.
- GBP/USD Price Analysis: A daily close above 1.2200 to pave the way toward 1.2300.
The Pound Sterling (GBP) advances against the US Dollar (USD) early in the North American session due to an upbeat market mood on speculations that the US Federal Reserve (Fed) would slowdown rate hikes in a week that an inflation report in the United States is the spotlight. At the time of writing, the GBP/USD is trading at 1.2205.
UK politics and hawkish BoE commentary lift the GBP/USD
Wall Street opens with solid gains. An absent US economic docket on Monday keeps traders adrift to UK news. As reported by Reuters, UK Prime Minister Rishi Sunak said that inflation is not guaranteed to decline in 2022 and that the government would need to be disciplined to curb inflation. Regarding strikes and other themes, UK’s PM Sunak added that he was willing to discuss pay increases for nurses in an effort to finish strikes.
In the meantime, Bank of England (BoE) policymakers led by Catherine Mann said that energy price caps could bring inflation up in other sectors as it could boost consumer spending. She added that what would happen to inflation is unclear when lids are removed.
At the time of typing, the BoE Chief Economist Huw Pill said that the BoE would continue to act to reach the inflation target, saying that the Monetary Policy Committee (MPC) “will respond forcefully” if needed. Pill stated that domestic prices and wages are key to the MPC outlook.
GBP/USD Price Analysis: Technical outlook
After breaching the 200-day Exponential Moving Average (EMA), the GBP/USD closes toward the 1.2200 mark, printing a three-week new high. The twelve-day consolidation period appears to end, and if the GBP/USD clears the 1.2200 figure, that could pave the way for December’s 19 daily high of 1.2242, which, once cleared, could open the door for a rally to 1.2300.
Oscillators like the Relative Strength Index (RSI) show buyers gathering momentum, while the Rate of Change (RoC) woke up and aimed higher after showing lower levels of volatility.
-
15:48
GBP/USD reasserts the uptrend toward the 1.2668/1.2758 area – Credit Suisse
GBP/USD’s weakness was aggressively reversed on Friday. Analysts at Credit Suisse look for strength back to 1.2447 and eventually 1.2668/1.2758.
Support is seen at 1.1936/30
“We look for strength back to 1.2242 initially, then the potential downtrend from February last year at 1.2346/55. Whilst we would look for a fresh pause here, we look for a break in due course for strength back to the 1.2445/47 December highs and eventually our core objective at 1.2668/1.2758 – the May 2022 high and 61.8% retracement of the 2021/2022 fall.”
“Support is seen at 1.2075 initially, then 1.2035, with the aforementioned 55DMA and ‘neckline’ support at 1.1936/30 ideally holding further weakness.”
-
15:45
BoE's Pill: Supply disruptions appear to have eased in recent months
Bank of England (BoE) Chief Economist Huw Pill said on Monday that the rise in the policy rates to current levels can be seen as significant progress in the normalization of the monetary policy, as reported by Reuters.
Key takeaways
"Supply disruptions appear to have eased in recent months."
"There have been some, albeit still tentative, signs of a normalisation in the patterns of consumer demand."
"We are starting to see labour market indicators turn.
"The extent to which an easing in the labour market induced by monetary tightening will weigh against inflationary pressures will depend on the wider context."
"To the extent that the level of imported gas prices remains significantly higher than in the past, then the threat of second round may well remain."
"Important question for BoE is how pragmatic and realistic UK firms and households are in accepting the macroeconomic implications of the higher imported energy and goods prices."
"The longer that firms try to maintain real profit margins and employees try to maintain real wages at pre-energy price shock levels, the more likely it is that domestically-generated inflation will achieve its own self-sustaining momentum."
"BoE must ensure that any self-sustaining momentum in inflation at rates above the 2% target is squeezed out of the system by constraining demand."
Market reaction
GBP/USD preserves its bullish momentum following these comments and was last seen rising nearly 1% on a daily basis at 1.2205.
-
15:28
USD Index to plunge towards 100 on failure to defend 103 – SocGen
The US Dollar Index is close to potential support of 103. A break below here would open up significant losses to the 100 level, analysts at Société Générale report.
Death cross points towards deeper correction
“Daily MACD has started posting positive divergence however signals of a meaning rebound are not yet visible. The 50DMA is about to cross below the 200DMA forming a death cross; this points towards persistent downtrend.”
“Test of 103 could result in an initial bounce however a break above the confluence of the MAs at 105.80/106.50 is essential to affirm a meaningful up-move.”
“Failure to defend 103 could mean continuation in decline towards last June low of 102/101.30 and 100.”
-
15:08
USD/JPY: Support is seen at 129.62/52 and eventually 127.53/27 – Credit Suisse
USD/JPY has fallen sharply post US payrolls. In the view of analysts at Credit Suisse, the recent strength has been corrective only and stay bearish for 127.53/27.
Resistance at 134.78/89 set to cap
“The recovery in USD/JPY last week was unable to hold above the 134.50 recent high. This adds weight to the core view recent strength has been corrective only.”
“Below support at 131.30 should see the immediate risk stay lower for a retest of the 129.62/52 recent low. An eventual break below here should clear the way for a move to our 127.53/27 core objective – the ‘neckline’ to the multi-year base and 50% retracement of the 2020/2022 uptrend.”
“Resistance is seen at 132.96 initially, then 133.24, with 134.78/89 expected to remain a major cap.”
-
15:03
EUR/USD climbs to 4-week highs past 1.0730, dollar remains offered
- EUR/USD picks up extra pace and trespasses the 1.0700 barrier.
- The greenback remains on the defensive and drops to 7-month lows.
- EMU Unemployment Rate held steady at 6.5% in November.
Bulls push harder at the beginning of the week and lift EUR/USD to the 1.0730 region for the first time since mid-December.
EUR/USD bolstered by risk-on sentiment, weaker dollar
EUR/USD leaves behind the 1.0700 barrier to clinch fresh multi-week peaks always on the back of the persevering sell-off in the greenback, which comes pari passu with investors’ re-assessment of the potential next steps by the Federal Reserve when it comes to future interest rate hikes.
This change of perspective from market participants have been reignited soon after the publication of the December’s Nonfarm Payrolls last Friday. Indeed, while the mixed tone from the monthly US labour market showed a still healthy job creation, the wage growth seems to have lost some momentum and that is what is leading traders to start pricing in some probable pause in the Fed’s hiking cycle.
On another page, and in the euro docket, the Unemployment Rate in the broader Euroland remained at 6.5% in November, while the Investor Confidence gauged by the Sentix Index improved a tad to -17.5 for the current month.
Across the pond, the Consumer Credit Change will be the sole release as well as 3-month/6-month bill auctions.
What to look for around EUR
EUR/USD has embarked on a strong recovery and has already surpassed the 1.0700 barrier. The extent and duration of the breakout, however, should hinge on the risk trends and dollar dynamics.
In addition, the next steps regarding monetary policy – and particularly the ongoing tightening cycles - from both the ECB and the Fed will be crucial in determining the direction of the pair’s price action in the next months.
Looking at the euro area, speculation of a potential recession in the bloc emerges as an important domestic headwind facing the euro in the short-term horizon.
Key events in the euro area this week: Germany Industrial Production, Italy Unemployment Rate, EMU Unemployment Rate/Sentix Index (Monday) – France Industrial Production (Tuesday) – France final Inflation Rate, Germany Full Year GDP Growth, MEU Balance of Trade/Industrial Production (Friday).
Eminent issues on the back boiler: Continuation of the ECB hiking cycle vs. increasing recession risks. Impact of the war in Ukraine and the protracted energy crisis on the region’s growth prospects and inflation outlook. Risks of inflation becoming entrenched.
EUR/USD levels to watch
So far, the pair is gaining 0.84% at 1.0729 and faces the next resistance level at 1.0736 (monthly high December 15 2022) seconded by 1.0773 (monthly high June 27 2022) and finally 1.0786 (monthly high May 30 2022) On the downside, the breach of 1.0496 (monthly low January 6) would target 1.0443 (weekly low December 7) en route to 1.0383 (55-day SMA).
-
14:43
GBP/USD to rise up towards the 1.3000 level – MUFG
The Pound has outperformed since the end of last week. Economists at MUFG Bank expect the GBP/USD pair to advance nicely towards 1.30 this year.
A better year ahead for the Pound after weak performance in 2022?
“While it is already well anticipated that the UK economy is in recession, the recent favourable energy price developments increase the likelihood that the downturn could be shallower and shorter than expected. In the BoE’s latest projections, they expected that the recession could last until the middle of 2024. The downbeat assessment leaves more room for upside surprises in the year ahead.”
“We are now forecasting a more bullish outlook for the pound later this year and expect Cable to rise up towards the 1.3000 level.”
“We believe that we have moved past peak pessimism towards the Pound, although remain wary that strike action alongside elevated wage growth continue to pose downside risks by potentially contributing to a more persistent period of higher inflation in the UK.”
-
14:20
EUR/USD: Break above 1.0737/88 to clear the way for a test of 1.0900/44 – Credit Suisse
EUR/USD’s corrective setback is already over. Economists at Crdit Suissenow look for a retest and then eventual break above 1.0736/88 for a move to 1.0900/44.
Support at 1.0630 set to hold
“The corrective setback is most likely already over and we look for a retest of key resistance at 1.0736/88 – the recent high, May and June 2022 highs, and 61.8% retracement of the 2022 decline. Whilst a fresh setback from here should be allowed for, we continue to look for an eventual clear break for a test of 1.0900/44 – the 50% retracement of the entire 2021/2022 fall.”
“Support at 1.0636/30 ideally holds to keep the immediate risk higher. A break can see a deeper setback to 1.0580, potentially 1.0546.”
-
14:13
Indonesia: FX Reserves shrank in 2022 – UOB
Economist at UOB Group Enrico Tanuwidjaja reviews the latest report of FX Reserves in Indonesia.
Key Takeaways
“Indonesia’s foreign exchange reserves increased by USD3.2bn to USD137.2bn in Dec 2022 but declined a total of USD7.7bn throughout last year.”
“The latest reserve level was equivalent to finance 6 months of import or 5.9 months of imports and servicing the government’s external debt, well above the international adequacy standard of 3 months of imports.”
“Services and tax payment revenue and government external debt drawdown accounted for last month’s significant increase in the reserves. BI maintains the view that the official reserve assets will remain adequate to anchor stability and safeguard the Indonesian economy.”
-
13:58
Silver Price Analysis: XAG/USD retreats from multi-day top, technical setup favours bulls
- Silver struggles to capitalize on its modest intraday gains beyond the $24.00 mark.
- The technical set-up favours bullish traders and supports prospects for further gains.
- A convincing break below the $23.00 mark is needed to negate the positive outlook.
Silver builds on Friday's goodish rebound from the vicinity of the $23.00 mark and gains some follow-through traction on the first day of a new week. The white metal, however, struggles to find acceptance above the $24.00 round figure and retreats from a three-day high touched during the first half of the European session.
The XAG/USD, meanwhile, manages to defend the 100-period SMA on the 4-hour chart, around the $23.70 area, and the technical set-up still seems tilted in favour of bullish traders. The outlook is reinforced by positive oscillators on daily/hourly charts. That said, it will still be prudent to wait for a sustained strength beyond the $24.00 mark before positioning for any further appreciating move.
The XAG/USD might then aim to surpass an intermediate hurdle near the $24.25 region, which is followed by the multi-month high, around the $24.50-$24.55 region touched last week. Some follow-through buying beyond the latter will be seen as a fresh trigger for bullish traders and lift spot prices further towards reclaiming the $25.00 psychological mark for the first time since April 2022.
On the flip side, the $23.20-$23.10 area now seems to have emerged as immediate support ahead of the $23.00 round figure. A convincing break below could drag the XAG/USD towards the $22.60-$22.55 region en route to the next relevant support near the $22.10-$22.00 horizontal zone. Failure to defend the latter will mark a breakdown and set the stage for a further near-term depreciating move.
Silver 4-hour chart
Key levels to watch
-
13:30
Canada Building Permits (MoM) came in at 14.1%, above expectations (3.7%) in November
-
13:18
Gold Price Forecast: XAU/USD at risk of suffering a setback – Commerzbank
Gold price has chalked up gains at the start of the new year. Nonetheless, strategists at Commerzbank envisage a risk of setbacks in the yellow metal market.
Any lasting recovery will require a shift in sentiment among ETF investors
“Gold’s upswing is presumably due primarily to more optimism among speculative financial investors, who are generally more fickle.”
“However, any lasting recovery of prices on the Gold market will require above all a shift in sentiment among ETF investors, who are still exercising caution. They appear to be waiting for the US rate hike cycle to come to an end.”
“In the short term, we envisage if anything a risk of setbacks on the gold market.”
-
13:08
GBP/USD to enjoy further gains toward the mid/upper 1.22s – Scotiabank
GBP/USD retests mid-1.21s. Economists at Scotiabank expect the pair to extend its advance toward the mid/upper 1.22s.
Dip under 1.2080/75 to open up a retest of 1.1950/00
“A strong close on the session Friday (bullish outside range) and a close back above the 200-day MA (1.2014) are clearly GBP positive from a technical point of view.”
“Spot is struggling a little to extend through the mid-1.21s, which may be an early warning that gains may not stick but the basic set-up for the Pound is positive and favours near-term gains to the mid/upper 1.22s at least.”
“Support is 1.2075/80; weakness below here would signal a retest of 1.1950/00.”
-
13:04
USD/JPY clings to modest intraday gains above 132.00, upside potential seems limited
- USD/JPY rallies over 100 pips from the daily low, though the intraday uptick lacks follow-through.
- A generally positive risk tone undermines the safe-haven JPY and offers some support to the pair.
- The prevalent USD selling bias keeps a lid on any meaningful gains and warrants caution for bulls.
The USD/JPY pair attracts some dip-buying near the 131.30 area on Monday and hits a fresh daily high during the mid-European session, though lacks follow-through. The pair, however, sticks to a mildly positive tone heading into the North American session and is currently placed around the 132.30 region.
A generally positive tone around the equity markets undermines the safe-haven Japanese Yen and lends some support to the USD/JPY pair. The global risk sentiment gets a lift in the wake of China's biggest pivot away from its strict zero-COVID policy. In fact, China opened its borders over the weekend for the first time in three years, though worries about a deeper global economic downturn keep a lid on any further optimism.
Apart from this, the prevalent US Dollar selling bias, amid rising bets for a less aggressive policy tightening by the Fed, acts as a headwind for the USD/JPY pair. Friday's mixed US jobs report (NFP) and the disappointing release of the US ISM Services PMI fueled speculations that the US central bank will soften its hawkish stance. Moreover, the markets are now pricing in 25 bps at the next FOMC policy meeting in February.
Apart from this, the recent reports that the Bank of Japan (BoJ) plans to raise its inflation forecasts could lend support to the JPY and contribute to capping the USD/JPY pair. This, in turn, suggests that the path of least resistance for spot prices is to the downside. Hence, attempted recovery could be seen as a selling opportunity and remain capped, at least for the time being, in the absence of any relevant macro data from the US.
Technical levels to watch
-
12:43
EUR/USD to stretch higher toward 1.0750 – Scotiabank
EUR/USD’s rebound extends to the upper 1.06s. Economists at Scotiabank expect the world's most popular currency pair to test the 1.0750 mark.
Technicals are bullish
“A strong close on the session Friday (bullish outside range) following the spot’s rebound back above 1.0575/00 suggests additional upside risks from a technical point of view from here.”
“Resistance is seen at 1.0740/50.”
“Support is 1.0625/30 and 1.0600 on the day.”
“Additional gains will need to be driven by USD-negative developments.”
See: EUR/USD set to head up to 1.0735/85 – ING
-
12:21
AUD/USD to enjoy further upside towards August high at 0.7136 – Credit Suisse
AUD/USD is breaking into fresh highs. Economists at Credit Suisse look for further upside towards 0.7088/7136.
Support shifts to 0.6888/86
“Whilst a solid close above 0.6893/6916 is needed to serve as a final confirmation for the fresh upside, our bias shifts to bullish given the recent breaks, with resistance seen at 0.7000/09 initially and next at 0.7026/40, above which would look to test a much tougher resistance at a retracement resistance and the August high at 0.7088/7136.”
“Support shifts to 0.6888/86 initially and then to 0.6861, though only back below the 13-day exponential average at 0.6798/88 would put the market back within its recent range.”
-
12:16
USD/CAD drops to fresh multi-week low, further below 1.3400 amid weaker USD/rallying oil prices
- USD/CAD drops to a seven-week low on Monday and is pressured by a combination of factors.
- An intraday rally in crude oil prices underpins the Loonie and exerts pressure amid a weaker USD.
- Diminishing odds for more aggressive Fed rate hikes and the risk-on mood weigh on the buck.
The USD/CAD pair remains under heavy selling pressure for the second straight day and drops to its lowest level since late November heading into the North American session on Monday. The pair is currently placed around the 1.3380-1.3375 region, down nearly 0.50% for the day, and is pressured by a combination of factors.
The Canadian Dollar continues to draw support from Friday's upbeat domestic employment details, which raised expectations for additional rate hikes by the Bank of Canada. Adding to this, a strong intraday rally of over 3% in crude oil prices, bolstered by China’s biggest pivot away from its strict zero-COVID policy, underpins the commodity-linked Loonie. This, along with sustained US Dollar selling bias, contributes to the offered tone surrounding the USD/CAD pair and the ongoing downward trajectory.
The mixed US monthly jobs report (NFP) and the disappointing release of the US ISM Services PMI on Friday lifted bets for a less aggressive policy tightening by the Fed. In fact, the markets are now pricing in a 25 bps Fed rate hike move in February, which is reinforced by a further decline in the US Treasury bond yields. Furthermore, a generally positive tone around the equity markets is also seen denting the greenback's relative safe-haven status and exerting additional pressure on the USD/CAD pair.
That said, worries about a deeper global economic downturn keep a lid on the optimism in the markets, which could help limit losses for the USD. Nevertheless, the USD/CAD pair confirms a bearish breakdown below a technically significant 100-day SMA. Moreover, a subsequent slide below the 1.3400 mark could be seen as a fresh trigger for bearish traders. In the absence of any relevant market-moving macro data, either from the US or Canada, this supports prospects for a further depreciating move for the pair.
Technical levels to watch
-
12:14
USD/JPY: 200DMA at 136.50 could cap the bounce – SocGen
USD/JPY’s downward momentum has got arrested after forming a trough near 129.50. The 200-Day Moving Average (DMA) near 136.50 could provide resistance, economists at Société Générale report.
Short-term rebound not ruled out
“Holding above 129.50, a short-term up move is not ruled out towards the 200DMA at 136.50; this could cap the upside.”
“December high of 138/138.80 could be an important resistance zone. Failure to reclaim 138.50/139.00 would mean risk of continuation in downtrend.”
“Below 129.50, next potential supports are located at projections of 128 and peak of 2015 near 125.85/124.00.”
-
12:07
EUR/USD Price Analysis: The surpass of 1.0713 exposes 1.0736
- EUR/USD adds to the upside momentum near 1.0700.
- Extra gains initially target the weekly high at 1.0713.
EUR/USD picks up extra upside traction and flirts with the 1.0700 barrier at the beginning of the week.
If the recovery gathers extra steam, then the pair should challenge the weekly top at 1.0713 (December 30). Once cleared, the next hurdle of relevance is seen at the December 2022 peak at 1.0736 (December 15).
In the meantime, further gains remain in store for the pair while above the 200-day SMA at 1.0310.
EUR/USD daily chart
-
12:00
Mexico 12-Month Inflation above forecasts (7.62%) in December: Actual (7.82%)
-
12:00
Mexico Headline Inflation came in at 0.38%, below expectations (0.83%) in December
-
12:00
Mexico Core Inflation came in at 0.65% below forecasts (0.7%) in December
-
11:54
USD/IDR faces some consolidation near term – UOB
USD/IDR is expected to trade between 14,450 and 15,800 in the near term, comments Markets Strategist at UOB Group Quek Ser Leang.
Key Quotes
“USD/IDR bucked the USD weakness trend as it closed higher by 0.42% last Friday (NY close of 15,575).”
“The price actions appear to be part of a broad consolidation range and we expect USD/IDR to trade between 15,450 and 15,800 this week.”
-
11:52
USD/CNY to slip towards 6.70 by end-2023 – TDS
Since the beginning of November 2022, the Chinese Yuan has appreciated by around 7.4% versus US Dollar. Economists at TD Securities expect further limited CNY appreciation vs. USD but expect CNY to underperform its peers.
CNY TW weakness to resume
“Clearly sentiment has turned for the CNY, but while we now expect further slight appreciation vs. USD to around 6.70 by end-2023 we also expect trade-weighted weakness in the CNY to resume.”
“We think the authorities will favour CNY TW depreciation to help maintain export competitiveness at a time when exports are likely to continue to weaken.”
“We think the CNY will be undermined by a declining current account surplus as the services balance moves back into deficit due to a wave of Chinese tourists overseas.”
-
11:51
USD Index Price Analysis: The 103.50 region offers decent contention
- The index extends the decline and retest the mid-103.00s.
- The loss of this region could accelerate losses to 101.30.
DXY remains on the defensive and poked with the key support region around 103.50 at the beginning of the week.
The breach of that contention area could spark a deeper retracement to, initially, the May 2022 low around 101.30 (May 30) ahead of the psychological 100.00 yardstick.
In the meantime, while below the 200-day SMA, the outlook for the index should remain tilted to the negative side.
DXY daily chart
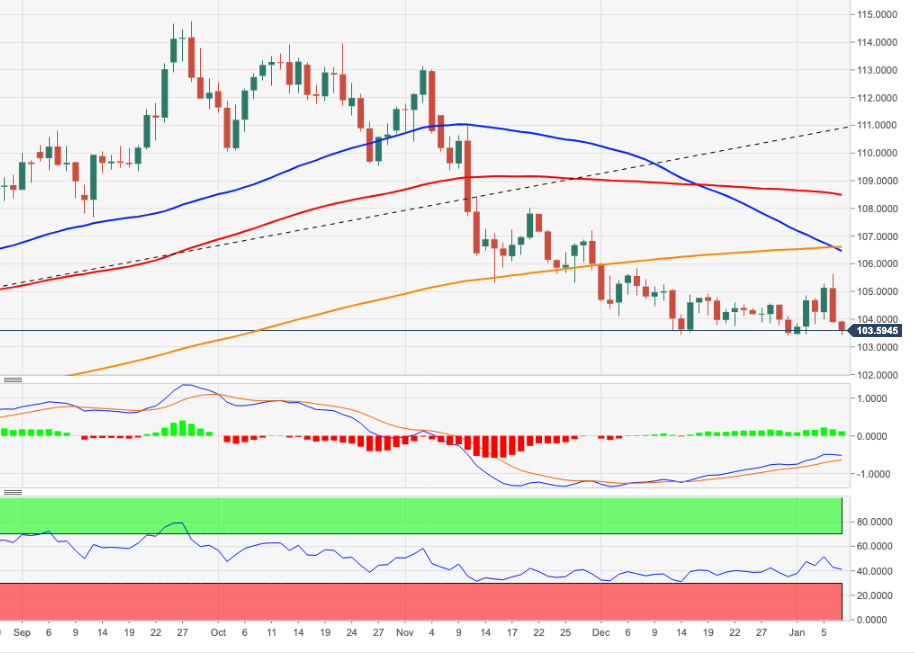
-
11:45
USD/MYR could now debilitate towards the 4.3570 region – UOB
In the opinion of Markets Strategist at UOB Group Quek Ser Leang, USD/MYR could lose further momentum and visit the 4.3570 zone in the short-term horizon.
Key Quotes
“Last week, USD/MYR traded in a relatively quiet manner between 4.3850 and 4.4050 before closing little changed at 4.4010 (+0.02%). USD/MYR dropped below 4.3850 today and downward momentum is beginning to build.”
“This week, USD/MYR is likely to trade with a downward bias toward last month’s low of 4.3570, possibly 4.3400. Resistance is at 4.4050, followed by 4.4200.”
-
11:41
EUR/JPY Price Analysis: Immediately to the upside comes the 143.00 region
- EUR/JPY adds to Friday’s uptick further north of 141.00.
- Extra gains are expected to target the 143.00 zone.
EUR/JPY extends the recovery for the second session in a row and looks to consolidate the breakout of the 141.00 barrier on Monday.
In light of the ongoing price action, further upside should not be ruled out in the short term. That said, the immediate up barrier appears at the weekly top at 142.93 (December 28), which remains propped up by the 100-day SMA.
The outlook for EUR/JPY is expected to shift to constructive while above the 200-day SMA, today at 140.55.
EUR/JPY daily chart
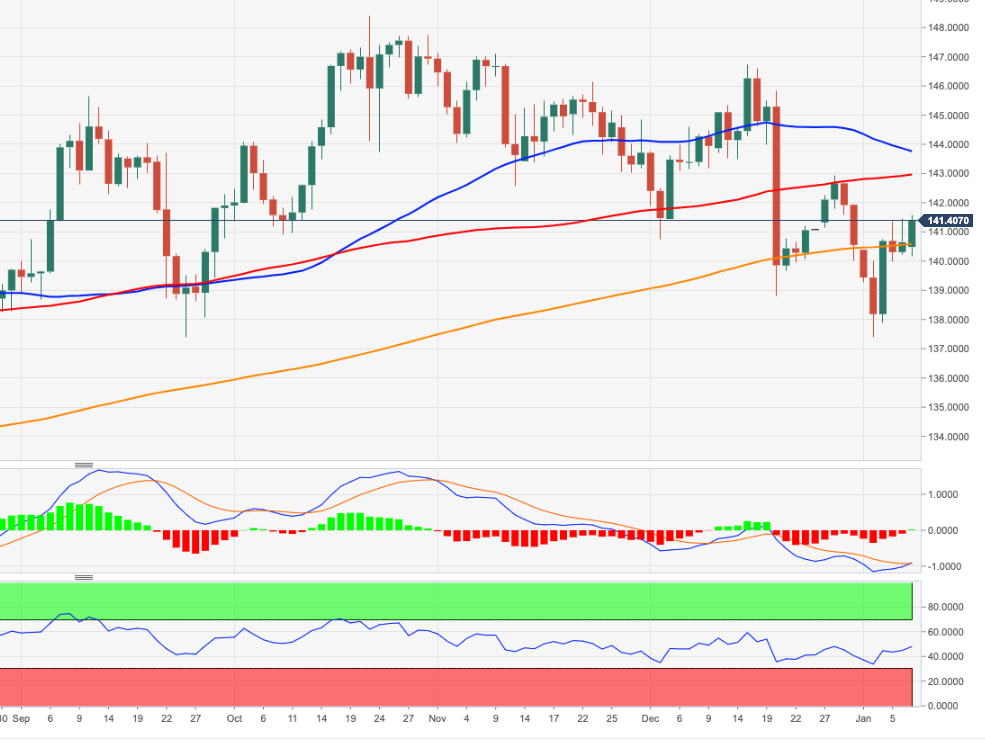
-
11:15
Natural Gas could sink to 3.00 – SocGen
Natural Gas has reached potential support zone of 3.50/3.46 representing the low of December 2021. A break below here would open up further losses to 3.00, strategists at Société Générale report.
4.32 and 4.75 expected to be short-term resistances
“Daily MACD is within deep negative territory denoting an overstretched move.”
“An initial bounce can’t be ruled out however 10-Day EMA at 4.32 and 4.75 are expected to be short-term resistances.”
“In case the decline persists below 3.50/3.46, Natural Gas could dip towards 3.31 and perhaps even towards projections of 3.00.”
-
11:03
USD/THB: Extra decline appears likely near term – UOB
Markets Strategist at UOB Group Quek Ser Leang suggest USD/THB risks a deeper retracement in the near term.
Key Quotes
“After trading in a relatively quiet manner for a few weeks, USD/THB lurched lower last week and closed sharply lower by 2.38% (Friday’s close of 33.78). Not surprisingly, downward momentum is strong.”
“USD/THB extended its decline today, and it is likely to continue to weaken. While a break of the support at 33.15 is likely, oversold conditions suggest a break of the next support at 32.80 is less likely this week. Resistance is at 33.63, the strong resistance at 34.05 is unlikely to come under threat this week.”
-
11:01
Portugal Global Trade Balance: €-7.991B (November) vs €-9.025B
-
11:01
Portugal Global Trade Balance climbed from previous €-9.025B to €-2.433B in November
-
10:53
Only a strong US CPI report will prevent the US Dollar from falling to fresh lows – MUFG
The US Dollar has continued to weaken at the start of this week. Only a stronger-than-expected US Consumer Price Index (CPI) on Thursday would avoid a slide to fresh lows, economists at MUFG Bank report.
ISM survey heightens US recession risks ahead of US CPI report
“The main trigger for the renewed USD sell-off was the release of the much weaker than expected ISM services survey on Friday that signalled a heightened risk of recession in the US. The scale of weakness signalled by the report has encouraged market participants to scale back expectations for further Fed rate hikes.”
“The combination of heightened US recession fears and falling US yields supports our outlook for the US Dollar to weaken further in the year ahead.”
“Market attention in the week ahead will now quickly switch to the release of the latest US CPI report on Thursday. The risk of a stronger US CPI report could be the only factor that prevents the US Dollar from falling to fresh lows in the week ahead.”
-
10:20
AUD/USD clings to gains near multi-month top, comfortably above 0.6900 amid weaker USD
- AUD/USD gains traction for the second straight day and rallies to its highest level since late August.
- A combination of factors weighs heavily on the greenback and remains supportive of the move up.
- Looming recession risks might hold back bulls from placing fresh bets and cap any further gains.
The AUD/USD pair builds on Friday's strong rally and gains strong follow-through traction on the first day of a new week. This marks the second successive day of a positive move and lifts spot prices closer to mid-0.6900s, or the highest since late August during the first half of the European session.
A combination of factors continues to weigh heavily on the US Dollar, which, in turn, is seen acting as a tailwind for the AUD/USD pair. The mixed US monthly jobs report (NFP) and the disappointing release of the US ISM Services PMI on Friday fueled speculations that the Fed will soften its hawkish stance. In fact, the markets are now pricing in a 25 bps Fed rate hike move in February. This leads to a further decline in the US Treasury bond yields and undermines the buck. Apart from this, the upbeat market mood exerts additional pressure on the safe-haven greenback and benefits the risk-sensitive Australian Dollar.
China pivoted away from the strict zero-COVID policy and opened its borders over the weekend for the first time in three years. This, in turn, boosted investors' confidence, is evident from a generally positive tone around the equity markets and is seen denting the USD's relative safe-haven status. That said, worries that the massive flow of Chinese travellers may cause another surge in COVID infections might keep a lid on any further optimism in the markets. Apart from this, the protracted Russia-Ukraine war, along with concerns about a deeper global economic downturn, could lend some support to the buck and cap the AUD/USD pair.
Traders might also refrain from placing aggressive bets and prefer to move to the sidelines ahead of the release of the high-anticipated US consumer inflation figures on Thursday. The crucial US CPI could influence the US central bank's near-term policy outlook and provide a fresh directional impetus to the greenback. Nevertheless, sustained strength and acceptance above the 0.6890-0.6900 region support prospects for a further appreciating move for the AUD/USD pair. Hence, any meaningful pullback could be seen as a buying opportunity and remain limited.
Technical levels to watch
-
10:18
AUD/USD to race higher toward the 0.7090/0.7130 area – SocGen
AUD spearheads G10 gains. Economists at Société Générale expect the AUD/USD pair to extend its advance towards the 0.7090/0.7130 region.
Support 0.6830, resistance 0.6980
“AUD/USD has broken out above its recent consolidation zone denoting resumption in up move. It has overcome the 200DMA first time since giving it up in April last year; this affirms persistence in upward momentum.”
“The pair is expected to inch higher gradually towards 0.6980 and last August high of 0.7090/0.7130. This could be next potential resistance zone.”
“Defending 0.6830 would be crucial for persistence in up move.”
-
10:02
EUR/USD set to head up to 1.0735/85 – ING
EUR/USD has been participating in this dollar sell-off and the bias looks higher, economists at ING report.
Low gas prices and China reopening are supportive for EUR/USD
“A surprisingly hawkish European Central Bank warns that EUR/USD could rally hard if the market is convinced the Fed will ease.”
“Low gas prices and China reopening are also supportive for EUR/USD and we would say that, despite the bearish seasonals for EUR/USD, pressure is building for further near-term gains.”
With money probably flowing into emerging market funds now – and out of Dollar deposits – we can see EUR/USD heading up to 1.0735/85, with outside risk to the 1.09 area should US price data soften again this week.”
-
10:00
European Monetary Union Unemployment Rate in line with forecasts (6.5%) in November
-
09:43
USD/CNH risks a drop to the 6.7500 region – UOB
The continuation of the selling pressure could drag USD/CNH to another test of the 6.7500 zone in the short term, note UOB Group’s Economist Lee Sue Ann and Markets Strategist Quek Ser Leang.
Key Quotes
24-hour view: “While we expected USD to weaken last Friday, we were of the view that ‘6.8560 is unlikely to come into view’. The anticipated USD weakness exceeded our expectations as USD cracked a couple of solid support levels and plunged to 6.8243. Solid downward momentum suggests USD could break 6.8000 but it might not be able to maintain a foothold below this level (next support is at 6.7700). On the upside, any rebound is unlikely to challenged 6.8550 (minor resistance is at 6.8350).”
Next 1-3 weeks: “Our latest narrative was from last Thursday (05 Jan, spot at 6.8910) where the risk for USD is still on the downside but any decline ‘is expected to face solid support at 6.8400’. While our view of USD weakening is not the wrong, the anticipated support at 6.8400 did not materialize as GBP plunged to a low of 6.8243 on Friday. Not surprisingly, downward momentum is very strong and we expect USD to weaken further, albeit likely at a slower pace. Support levels are at 6.7700 and 6.7500. Overall, only a break of 6.8800 (‘strong resistance’ level was at 6.9250 last Friday) would indicate that the downward pressure has eased.”
-
09:39
Natural Gas Futures: Near-term rebound could be in the limelight
According to advanced prints from CME Group for natural gas futures markets, open interest extended the upside for yet another session on Friday, this time by nearly 1.7K contracts. On the other hand, volume remained erratic and went down by around 56.2K contracts.
Natural Gas looks supported near $3.50
Natural gas prices resumed the downside on Friday, although they seem to have met some contention around the $3.50 region per MMBtu. The small decline was amidst rising open interest, which is indicative that a deeper pullback could lie ahead. The sharp bounce in volume, however, could spark some bouts of strength in the very near term as well.
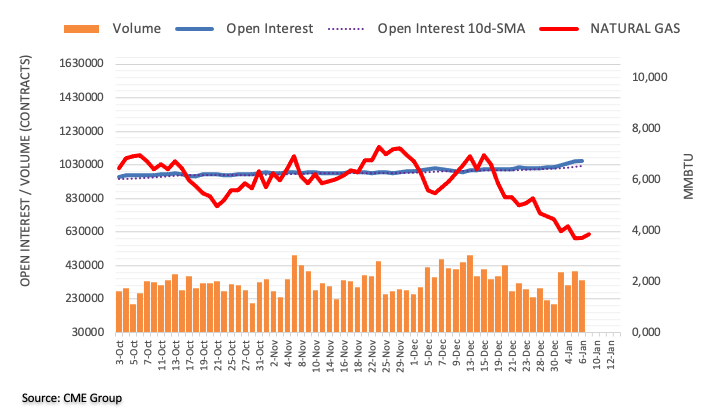
-
09:34
NZD/USD: More volatility seems likely – ANZ
The Kiwi has had a volatile start to the year, and with more key US data due this week, more volatility seems likely, according to economists at ANZ Bank.
US CPI to be a key determinant of how big the next Fed rate hike will be
“With little local data this week and many New Zealanders still on holiday, the focus this week will be offshore, with US CPI set to be a key determinant of how big the next Fed rate hike will be.”
“We expect a 25 bps hike but markets are pricing in around 32 bps; so expect ongoing volatility, especially if liquidity remains thin.”
“Support 0.5875/0.6000 Resistance 0.6450/0.6575”
-
09:33
Eurozone Sentix Investor Confidence Index climbs to -17.5 in Jan vs. -11.1 expected
The Eurozone Sentix Investor Confidence index rises to –17.5 in January from -21.0 in December vs. -11.1 expected.
The current situation in the Eurozone rose to -19.3 from -20.0, the highest since August 2022 and also the third consecutive rise.
An expectations index improved to -15.8 from -22.0 in December, the highest level since February 2022.
Key takeaways
"The January data in the Sentix economic indices indicate a further improvement.”
"(But) There is virtually no change in the assessment of the current situation, with only the expectations values signaling a greater easing of the situation."
EUR/USD reaction
The shared currency is unfazed by the downbeat Eurozone Sentix data. EUR/USD is trading at 1.0676, up 0.30% on the day.
-
09:32
European Monetary Union Sentix Investor Confidence came in at -17.5 below forecasts (-11.1) in January
-
09:23
GBP/USD climbs to over two-week top, beyond mid-1.2100s amid sustained USD selling
- GBP/USD gains traction for the second straight day and climbs to over a two-week high.
- A combination of factors keeps the USD bulls on the defensive and remains supportive.
- Looming recession risks could cap the optimism and lend support to the safe-haven buck.
The GBP/USD pair builds on Friday's solid recovery from a six-week low and gains strong follow-through traction for the second successive day. The momentum lifts spot prices to a two-and-half-week high, around the 1.2170 area during the first half of the European session and is sponsored by the prevalent US Dollar selling bias.
In fact, the USD Index, which tracks the greenback against a basket of six currencies, hangs near the monthly low and is pressured by a combination of factors. Friday's mixed US monthly jobs report (NFP) and the disappointing release of the US ISM Services PMI fueled speculations that the Fed will soften its hawkish stance. In fact, the markets are now pricing in a 25 bps Fed rate hike move in February, which leads to a further decline in the US Treasury bond yields. Apart from this, a positive risk tone further dents the greenback's relative safe-haven status and offers additional support to the GBP/USD pair.
China's pivoted away from its strict zero-COVID policy and opened its borders over the weekend for the first time in three years. This, in turn, boosted investors' appetite for riskier assets, which is evident from the upbeat mood around the equity markets. Investors, however, remain concerned that the massive flow of Chinese travellers may cause another surge in COVID infections. Apart from this, the protracted Russia-Ukraine war has been fueling worries about a deeper global economic downturn, which should cap any optimism in the markets. This could lend some support to the buck and cap gains for the GBP/USD pair.
Traders might also refrain from placing aggressive bets and prefer to move to the sidelines ahead of the release of the latest US consumer inflation figures on Thursday. The crucial US CPI could influence the US central bank's near-term policy outlook and provide a fresh directional impetus to the GBP/USD pair. In the meantime, the US bond yields, along with the broader risk sentiment, will drive the USD demand and provide some impetus to the major in the absence of any major market-moving economic releases on Monday.
Technical levels to watch
-
09:20
USD/JPY faces further range bound near term – UOB
USD/JPY is now expected to navigate the 130.50-134.50 range in the next weeks, according to UOB Group’s Economist Lee Sue Ann and Markets Strategist Quek Ser Leang.
Key Quotes
24-hour view: “We highlighted last Friday that USD ‘could continue to rise but it is unlikely to challenge the major resistance at 135.00’. While our view was not wrong as USD rose to 134.77, the sharp selloff from the high came as a surprise (USD touched a low of 131.98 in late NY). While deep in oversold territory, the weakness in USD could extend to 131.50 first before stabilization is likely. The next support at 131.00 is unlikely to come into view. On the upside, a break of 133.00 (minor resistance is at 132.55) would indicate the weakness in USD has stabilized.”
Next 1-3 weeks: “Last Friday (06 Jan, spot at 133.50), we indicated that USD is likely in the early stages of a corrective rebound that could extend to 135.00. USD subsequently rose to 134.77 before dropping sharply to a low of 131.98. While our ‘strong support’ level at 131.50 is not breached, the rapid loss in momentum suggests that USD is likely to trade within a broad range of 130.50 and 134.50 instead of rebounding further.”
-
09:17
Crude Oil Futures: Extra losses not ruled out
CME Group’s flash data for crude oil futures markets noted traders extended the uptrend in their open interest positions and added around 13.2K contracts on Friday. Volume, instead, shrank for the second straight session, this time by nearly 98K contracts.
WTI could still put the $70.00 mark to the test
Friday’s small downtick in prices of the WTI was amidst rising open interest, which suggests that further decline should not be discarded yet. Against that, the commodity still faces a key contention area at the 2022 low near the $70.00 mark per barrel (December 9).
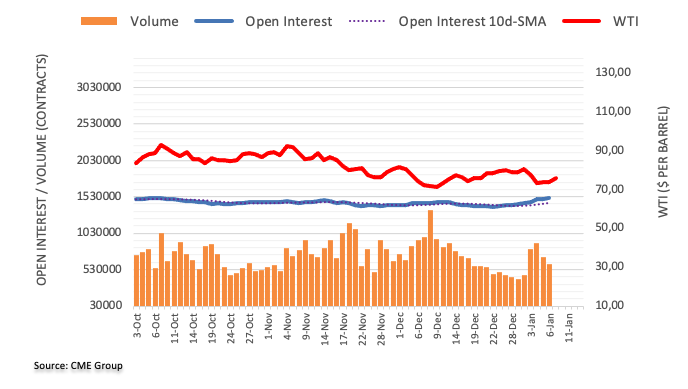
-
09:12
EUR/USD: Further upside now flirts with the 1.0700 region
- EUR/USD extends the optimism and flirts with 1.0700.
- The weaker dollar sustains the better tone in the risk complex.
- EMU Unemployment Rate, Sentix index next of note in the docket.
The European currency keeps the bid tone unchanged and lifts EUR/USD to the boundaries of 1.0700 the figure at the beginning of the week.
EUR/USD looks at data, risk appetite
EUR/USD advances for the second session in a row on Monday and prints new multi-day highs in the 1.0700 neighbourhood amidst the persistent selling bias around the US dollar.
Indeed, the greenback loses further ground and revisits the 103.50 zone as market participants continue to assess Friday’s publication of the US labour market report for the month of December.
Data wise in the bloc, the Unemployment Rate is due later along with the Sentix Index, which tracks the Investor Confidence in the region.
Across the pond, the Consumer Credit Change will be the sole release as well as 3-month/6-month bill auctions.
What to look for around EUR
EUR/USD has embarked on a strong recovery and has already gained nearly 2 cents since lows near 1.0500 recorded in the first trading week of the new year.
In the meantime, the European currency is expected to closely follow dollar dynamics, the impact of the energy crisis on the region and the Fed-ECB divergence.
Back to the euro area, the increasing speculation of a potential recession in the bloc emerges as an important domestic headwind facing the euro in the short-term horizon.
Key events in the euro area this week: Germany Industrial Production, Italy Unemployment Rate, EMU Unemployment Rate/Sentix Index (Monday) – France Industrial Production (Tuesday) – France final Inflation Rate, Germany Full Year GDP Growth, MEU Balance of Trade/Industrial Production (Friday).
Eminent issues on the back boiler: Continuation of the ECB hiking cycle vs. increasing recession risks. Impact of the war in Ukraine and the protracted energy crisis on the region’s growth prospects and inflation outlook. Risks of inflation becoming entrenched.
EUR/USD levels to watch
So far, the pair is gaining 0.38% at 1.0679 and faces the next resistance level at 1.0713 (weekly high December 30) ahead of 1.0736 (monthly high December 15) and finally 1.0773 (monthly high June 27). On the downside, the breach of 1.0496 (monthly low January 6) would target 1.0443 (weekly low December 7) en route to 1.0383 (55-day SMA).
-
09:11
ECB: Wage growth in next few quarters to be “very strong”
In its Economic Bulletin article published on Monday, the European Central Bank (ECB) noted that the wage growth in the next few quarters to be "very strong" but real wages will fall further in the coming months.
Additional takeaways
"Wage growth over the next few quarters is expected to be very strong compared with historical patterns."
"This reflects robust labor markets that so far have not been substantially affected by the slowing of the economy, increases in national minimum wages and some catch-up between wages and high rates of inflation."
“But the expected economic slowdown and uncertainty about the outlook are likely to put downward pressure on wage growth beyond the near term.”
Market reaction
EUR/USD keeps its range below 1.0700 on the release of the ECB Bulletin, trading 0.35% higher on the day at 1.0680, as of writing.
-
09:07
USD Index to plummet toward the 102 level – ING
The Dollar starts the week under pressure and has seen some sizable losses over the last two trading sessions. Economists at ING expect the US Dollar Index to fall as low as 102.00.
Emerging currencies fly
“We suspect investors will be looking to add to positions in EM FX and the commodity complex this week. The Chinese Renminbi is enjoying strong gains and Asia's high beta Korean Won is flying. It seems very hard to fight this trend – especially in the second week of the year when money is being put to work.”
“Were US two-year Treasury yields to drop below the 4.10/20% area this week, we would expect another decent leg lower in the Dollar.”
“The recent DXY low at 103.45 looks vulnerable and 102.00 now looks to be the direction of travel as US recession fears build.”
-
09:02
PBOC to cut borrowing costs, support liquidity in Q1 – MNI
Citing economists and analysts, MNI reported on Monday, the People's Bank of China (PBOC) will seek to maintain ample liquidity and guide down borrowing costs early in 2023, as the economy continues to struggle after a likely slowdown in fourth quarter GDP amid a nationwide surge in Covid infections.
Additional takeaways
The central bank will play a role in boosting consumption and assisting ailing private property developers by lowering credit costs.
Given the central bank cut the RRR in December, there is little chance of another one this month. The PBOC may also increase the MLF injection this month.
Growth may have bottomed in December as infection numbers peaked in major cities and stimulus measures were deployed.
Related reads
- USD/CNH Price Analysis: Refreshes multi-day low as bears approach 6.7650 support
- China’s six cities set GDP growth targets from 5.5% to 7.0% for 2023 – Securities Daily
-
09:01
Singapore Foreign Reserves (MoM) dipped from previous 291.3B to 289.5B in December
-
09:00
Italy Unemployment meets forecasts (7.8%) in November
-
08:58
AUD/USD: Extra gains now look at 0.6950 – UOB
The ongoing upside bias could motivate AUD/USD to strengthen to the 0.6950 region in the next few weeks, suggested UOB Group’s Economist Lee Sue Ann and Markets Strategist Quek Ser Leang.
Key Quotes
24-hour view: “We expected AUD to weaken last Friday but we were of the view that AUD ‘is unlikely to challenge to the support at 0.6700’. AUD subsequently dropped briefly to 0.6722 before surging sharply to high of 0.6886. AUD could advance further to 0.6920. In view of the overbought conditions, the next resistance at 0.6950 is unlikely to come under threat. Support is at 0.6850, followed by 0.6820.”
Next 1-3 weeks: “In our most recent narrative from last Thursday (05 Jan, spot at 0.6825), we highlighted that upward momentum has faded and we expected AUD to trade within a broad consolidation range of 0.6660/0.6860. We did not expect the strong surge on Friday as AUD soared to a high of 0.6886. Upward momentum has been rejuvenated and we expect AUD strength from here. In order to keep the momentum going, AUD must stay above 0.6775 within the next few days. Resistance is at 0.6950.”
-
08:54
Gold Futures: Further upside in store
Open interest in gold futures markets set aside the previous drop and went up by around 10.5K contracts on Friday according to preliminary readings from CME Group. In the same direction, volume increased by around 24.4K contracts after two consecutive daily drops.
Gold: Further gains likely above $1880
Friday’s sharp uptick in prices of the ounce troy of gold was amidst increasing open interest and volume. That said, the continuation of the recovery appears the most likely scenario in the very near term, while gains are seen picking up pace on a convincing breakout of the $1880 region.
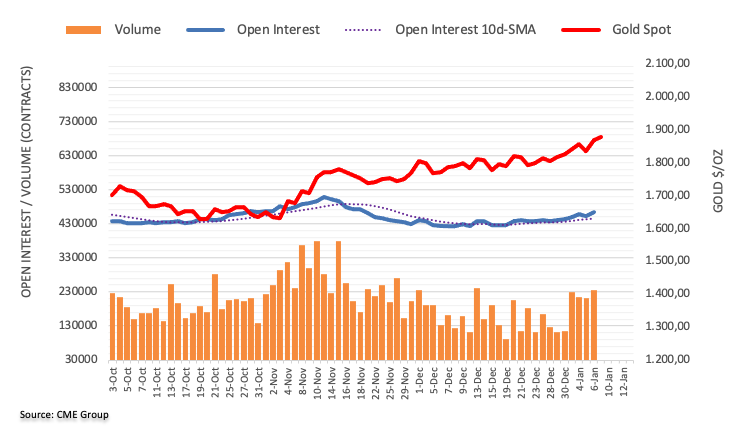
-
08:47
GBP/USD: Next target now comes at 1.2270 – UOB
In the opinion of UOB Group’s Economist Lee Sue Ann and Markets Strategist Quek Ser Leang, GBP/USD’s upside could retarget the 1.2270 area in the short term.
Key Quotes
24-hour view: “We highlighted last Friday that ‘there is room for the weakness in GBP to extend to 1.1850 before stabilization is likely’. While GBP subsequently dropped to a low of 1.1846, it reversed and rocketed to a high of 1.2100. GBP extended its advance in early Asian trade and it could continue to rise even though the resistance at 1.2200 is likely out of reach today (there is another resistance at 1.2160). On the downside, any pullback is unlikely to challenge the support at 1.2010 (minor support is at 1.2060).”
Next 1-3 weeks: “Our view from last Friday (06 Jan, spot at 1.1915) for ‘further GBP weakness’ was proven incorrect quickly as it blew above our ‘strong resistance’ of 1.2020 (high of 1.2100). While the rapid rise appears to be running ahead of itself, GBP could rise further but it remains to be seen if it can build enough momentum to reach 1.2270. On the downside, a break of 1.1950 would indicate that GBP is not strengthening further.”
-
08:39
GBP/USD looks biased towards the 1.2350 area this week – ING
GBP/USD holds in positive territory at around 1.2150. Economists at ING expect the pair to extend its advance towards the 1.2350 region.
BoE Chief Economist speaks at 15:30 GMT
“Recent job and wage data has yet to assuage the BoE's concerns over a tight UK labour market, thus we doubt Huw Pill will need to sound very dovish today.”
“With the Dollar at risk of falling further, GBP/USD looks biased towards the 1.2350 area this week, while EUR/GBP should find support in the 0.8780 area.”
-
08:36
Gold Price Forecast: XAU/USD hits eight-month high, bulls retain control amid weaker US Dollar
- Gold price hits an eight-month high on Monday and is supported by a combination of factors.
- The prospects for less aggressive Fed rate hikes weigh on the US Dollar and remain supportive.
- The prevalent risk-on environment turns out to be the only factor capping gains for Gold price.
Gold price gains positive traction for the second successive day on Monday and climbs to an eight-month high, around the $1,880 area during the early European session. This comes on the back of Friday's breakout through the $1,860-$1,865 hurdle and favours bullish traders.
Weaker US Dollar underpins Gold price
The US Dollar (USD) adds to Friday's heavy losses inspired by softer macro-data, which lifted bets for a less-aggressive policy tightening by the Federal Reserve (Fed). This, in turn, is seen as a key factor benefitting the US Dollar-denominated Gold price. In fact, the closely-watched monthly jobs report from the United States (US) showed that Average Hourly Earnings grew 0.3% last month and the yearly rate eased to 4.6% from 4.8% in November. This suggests that inflation pressures could be weakening and allow the US central bank to further slow the pace of its rate-hiking cycle.
Sliding US Treasury bond yields further benefits Gold price
The prospect for a less hawkish Fed is evident from the ongoing decline in the US Treasury bond yields. This further contributes to the offered tone surrounding the Greenback and provides an additional boost to the non-yielding Gold price. The aforementioned supporting factors suggest that the path of least resistance for the XAU/USD is to the upside. That said, the prevalent risk-on mood - as depicted by a generally positive tone around the equity markets - might hold back traders from placing aggressive bullish bets around the safe-haven precious metal, at least for the time being.
Positive risk-on might cap gains for Gold price
Investors cheered China's biggest pivot away from its strict zero-COVID policy. In fact, China opened its borders over the weekend for the first time in three years. That said, concerns that the massive flow of Chinese travellers may cause another surge in COVID infections and growing worries about a deeper global economic downturn should cap any optimism in the markets. This further adds credence to the positive outlook for the Gold price which tends to act as a safe-haven. Hence, any meaningful pullback could be seen as a buying opportunity and is more likely to remain limited in the absence of any relevant macro releases.
Gold price technical outlook
From a technical perspective, the $1,865-$1,860 resistance breakpoint now seems to act as immediate support for the Gold price. A sustained break below might prompt some technical selling, though is more likely to get bought into near the $1,835-$1,833 horizontal support. On the flip side, some follow-through buying should allow bulls to aim to reclaim the $1,900 round figure for the first time since May 2022.
Key levels to watch
-
08:08
Rally in the CE3 currencies is consistent with latest data – Commerzbank
The CE3 currencies – Polish Zloty, Czech Koruna and Hungarian Forint – have strengthened noticeably over the past month. Tatha Ghose, FX Analyst at Commerzbank, explains recent currency strength?
Tentative signs that inflation may be peaking in the region
“There are some tentative signs that inflation may be peaking in the region. The signs go beyond obvious year-on-year base effect or energy price swings: the month-on-month change of core HICP appears to have eased in the CE3. The slightly smoother 3m/3m rate of change shows the peak clearer.”
“It would be premature to celebrate yet, but the noticeable rally by the CE3 currencies – in particular, by the CZK and the HUF – is consistent with latest data.”
-
08:02
Austria Trade Balance declined to €-1894.1M in October from previous €-1383.7M
-
08:01
Switzerland Foreign Currency Reserves fell from previous 790B to 784.006B in December
-
07:48
France Imports, EUR up to €64.8B in November from previous €63.595B
-
07:47
France Exports, EUR dipped from previous €51.445B to €51.035B in November
-
07:46
France Trade Balance EUR came in at €-13.766B, above forecasts (€-14.799B) in November
-
07:45
France Current Account registered at €-6.8B, below expectations (€-5.5B) in November
-
07:43
US: Inflation around or slightly below zero might not weaken the Dollar further – Commerzbank
The highlight of the US data calendar this week is the December inflation data due to be published by the Bureau of Labor Statistics on Thursday. The Dollar could stay resilient even with a soft reading, in the opinion of Ulrich Leuchtmann, Head of FX and Commodity Research at Commerzbank.
Consumer prices not expected to have risen in December
“The majority of analysts polled by Bloomberg expect that consumer prices will not have risen in December. If that turns out to be correct, we could bet on everything being priced in, with the Dollar not coming under pressure. However, I am not so sure.”
“If there is no sufficiently reliable model for inflation development, there is no model for allocating probabilities.”
“I am not so certain whether in an environment such as that an inflation reading around or slightly below zero might not weaken the Dollar further after all.”
-
07:36
US' drastic economic policy is superior to the Eurozone’s “soft” policy – Natixis
The United States' economic policy is clearly more drastic than the eurozone’s policy. Does the Eurozone's "softer" economic policy unnecessarily prolong crises? Analysts at Natixis see that the US systematically emerges from recession faster than the eurozone.
The US systematically emerges from recession faster than the Eurozone
“The adjustment of the economy during recessions (adjustment of employment and unemployment, correction of fiscal deficits) is much ‘softer’ and more gradual in the Eurozone than in the United States. But perhaps the US’ drastic adjustment is preferable.”
“It allows for a rapid recovery in earnings, and therefore in investment, and therefore in activity and employment. US recessions are more drastic but much shorter, and on the whole less detrimental for the economy.”
-
07:20
USD/JPY struggles for a firm direction, stuck in a range below 132.00 mark
- USD/JPY oscillates in a narrow trading band on the first day of a new week.
- The prevalent USD selling bias is seen as acting as a headwind for the major.
- The risk-on mood undermines the safe-haven JPY and limits the downside.
The USD/JPY pair struggles to gain any meaningful traction on the first day of a new week and seesaws between tepid gains/minor losses through the early European session. The pair is currently placed just below the 132.00 round-figure mark and seems vulnerable to extending Friday's retracement slide from over a one-week high.
The US Dollar adds to Friday's softer US macro data-inspired losses, which, in turn, is seen as a key factor acting as a headwind for the USD/JPY pair. In fact, the closely-watched US monthly jobs report (NFP) showed that Average Hourly Earnings grew 0.3% last month, lowering the YoY rise to 4.6% from 4.8% in November. This was seen as an indication that inflation pressures could be weakening.
Furthermore, the US ISM Services PMI fell into contraction territory and hit the worst level since 2009, fueling expectations for a less aggressive policy tightening by the Fed. This leads to an extension of the downfall in the US Treasury bond yields, which continues to weigh on the buck. That said, the risk-on impulse undermines the safe-haven Japanese Yen and acts as a tailwind for the USD/JPY pair.
China's biggest pivot away from its strict zero-COVID policy boosts investors' confidence, which is evident from a generally positive tone around the equity markets. The latest optimism, however, is likely to remain limited amid concerns that the massive flow of Chinese travellers may cause another surge in COVID infections and worries about a deeper global economic downturn.
Moreover, the recent reports that the Bank of Japan (BoJ) plans to raise its inflation forecasts could lend support to the JPY. This, in turn, suggests that the path of least resistance for the USD/JPY pair is to the downside. Hence, any attempted recovery could be seen as a selling opportunity and runs the risk of fizzling out rather quickly in the absence of any relevant macro data from the US.
Technical levels to watch
-
07:19
USD Index: Bears remain in control around 103.50
- The index remains on the defensive and flirts with 103.50.
- The dollar looks weaker as investors continued to digest NFP figures.
- Consumer Credit Change, short-term auction next on tap in the docket.
The greenback starts the new trading week on the back foot and retreats to the mid-103.00s region when tracked by the USD Index (DXY).
USD Index looks to risk trends, data, Fed
The index sheds ground for the second session in a row and revisits the key contention area around 103.50 amidst increasing investors’ appetite for the risk-associated universe, all ahead of the opening bell in the old continent on Monday.
Indeed, market participants continue to assess Friday’s results from the US labour market, where the US economy added more jobs than expected during December (+223K), the jobless rate ticked lower to 3.5% but the wage growth showed some loss of momentum.
In fact, traders perceived the latter as a potential factor behind a potential slowdown of future interest rate hikes by the Federal Reserve, triggering a subsequent sharp sell-off in the greenback.
In the US docket, the only release of note will be the Consumer Credit Change for the month of November as well as short-term auctions (3-month, 6-month bills).
What to look for around USD
The dollar keeps the selling bias unchanged at the beginning of the week and puts the strong support region near 103.50 to the test at the beginning of the week.
The mixed results from the US Nonfarm Payrolls for the month of December (Friday) seem to have reignited the idea of a probable pivot in the Fed’s policy in the next months, which comes in contrast to the message from the latest FOMC Minutes, where the Committee advocated the need to remain within a restrictive stance for longer, at the time when it ruled out any interest rate reduction for the current year.
Furthermore, the tight labour market, still elevated inflation and the resilient economy are also seen supportive of the firm message from the Federal Reserve and its hiking cycle.
Key events in the US this week: Consumer Credit Change (Monday) – Wholesale Inventories, Fed’s Powell (Tuesday) – MBA Mortgage Applications (Wednesday) – Inflation Rate, Initial Jobless Claims, Monthly Budget Statement (Thursday) – Flash Michigan Consumer Sentiment (Friday).
Eminent issues on the back boiler: Hard/soft/softish? landing of the US economy. Prospects for further rate hikes by the Federal Reserve vs. speculation of a recession in the next months. Fed’s pivot. Geopolitical effervescence vs. Russia and China. US-China trade conflict.
USD Index relevant levels
Now, the index is losing 0.41% at 103.48 and the breakdown of 103.39 (monthly low December 30) would open the door to 101.29 (monthly low May 30) and finally 100.00 (psychological level). On the upside, the next hurdle aligns at 105.82 (weekly high December 7) followed by 106.33 (200-day SMA) and then 107.19 (weekly high November 30).
-
07:03
Forex Today: US Dollar starts new week on the back foot
Here is what you need to know on Monday, January 9:
The US Dollar struggles to find demand at the beginning of the week with the US Dollar Index falling toward multi-month lows near 103.50 after having lost more than 1% on a daily basis on Friday. The market mood remains relatively upbeat after the risk rally witnessed ahead of the weekend and US stock index futures rise between 0.3% and 0.5% in the early European morning. Sentix Investor Confidence and November Unemployment Rate data will be featured in the European economic docket. Later in the session, November Consumer Credit Change from the US will be looked upon for fresh impetus.
The US Bureau of Labor Statistics reported on Friday that Nonfarm Payrolls rose by 223,000 in December. This reading came in much better than the market expectation of 200,000 but failed to provide a boost to the US Dollar. Underlying details of the jobs report revealed showed that the annual wage inflation, as measured by the Average Hourly Earnings, declined to 4.6% from 4.8%, compared to analysts' forecast of 5%. Later in the American session, the ISM announced that the Services PMI dropped to 49.6 in December from 56.5 in November. The Employment Index declined to 49.8 in the same period and the Priced Paid Index dropped to 67.6 from 70.
Following these data releases, the 10-year US Treasury bond yield fell toward 3.5% and lost more than 4% on Friday. Wall Street's three main indexes rose more than 2% and the US Dollar suffered heavy losses against its rivals. According to the CME Group FedWatch Tool, markets are currently pricing in a 75% probability of a 25 basis points Fed rate hike in February, up from 57% early Friday.
EUR/USD gained more than 100 pips on Friday and continued to stretch higher toward 1.0700 early Monday. The data from Germany revealed on Monday that Industrial Production expanded by 0.2% on a monthly basis in November following October's 0.1% contraction.
GBP/USD rose sharply on Friday and ended up closing the week flat near 1.2100. With the US Dollar staying on the back foot in the early European session on Monday, the pair holds in positive territory at around 1.2150.
Gold price capitalized on falling US T-bond yields and registered impressive gains ahead of the weekend. XAU/USD preserves its bullish momentum early Monday and was last seen trading at its highest level sinc eearly May near $1,880.
Despite the selling pressure surrounding the US Dollar, USD/JPY stayed relatively quiet below 132.00 at the beginning of the week as Japanese markets remained closed due to Coming-of-Age Day bank holiday.
Bitcoin managed to push higher over the weekend and rose nearly 3% on a weekly basis. BTC/USD was last seen trading at its highest level since mid-December at around $17,200. Ethereum gained more than 2% on Sunday and preserved its bullish momentum early Monday. At the time of press, ETH/USD was up 1.5% on the day at $1,310.
-
07:03
Germany Industrial Production n.s.a. w.d.a. (YoY) below forecasts (1.3%) in November: Actual (-0.4%)
-
07:02
EUR/USD Price Analysis: Extends bounce off 50% Fibo. towards 1.0700
- EUR/USD picks up bids to refresh intraday high, approaches three-week-old resistance line.
- Receding bearish bias of MACD, sustained rebound from 50% Fibonacci retracement level strengthen upside hopes.
- Two-month-old ascending trend line, 50-DMA restrict short-term downside.
- Golden ratio, May 2022 peak act as additional upside filters inside megaphone trend-widening pattern.
EUR/USD holds onto the US NFP-led bullish bias as it marches towards 1.0700 during early Monday, up 0.30% intraday near 1.0680 by the press time.
In doing so, the major currency pair extends the previous day’s U-turn from a 50% Fibonacci retracement level of the February-September 2022 downside to approach a one-month-old resistance line, close to the 1.0700 by the press time.
It’s worth noting that the EUR/USD pair’s successful trading above the 50-DMA and the recently easing bearish bias of the MACD also favor the bulls.
However, the 61.8% Fibonacci retracement level surrounding 1.0745, also known as the “Golden Ratio”, precedes the May 2022 peak of 1.0786 to challenge the EUR/USD bulls.
Following that, the 1.0800 round figure could act as the last defense of the EUR/USD bears before directing the quote towards the late April 2022 high near 1.0935.
On the flip side, an upward-sloping trend line from early November 2022, close to 1.0560 at the latest, restricts short-term EUR/USD pullback.
However, the pair sellers will need a successful break of the 50% Fibonacci retracement level and the 50-DMA, close to 1.0510 and 1.0425 in that order, to retake control.
EUR/USD: Daily chart
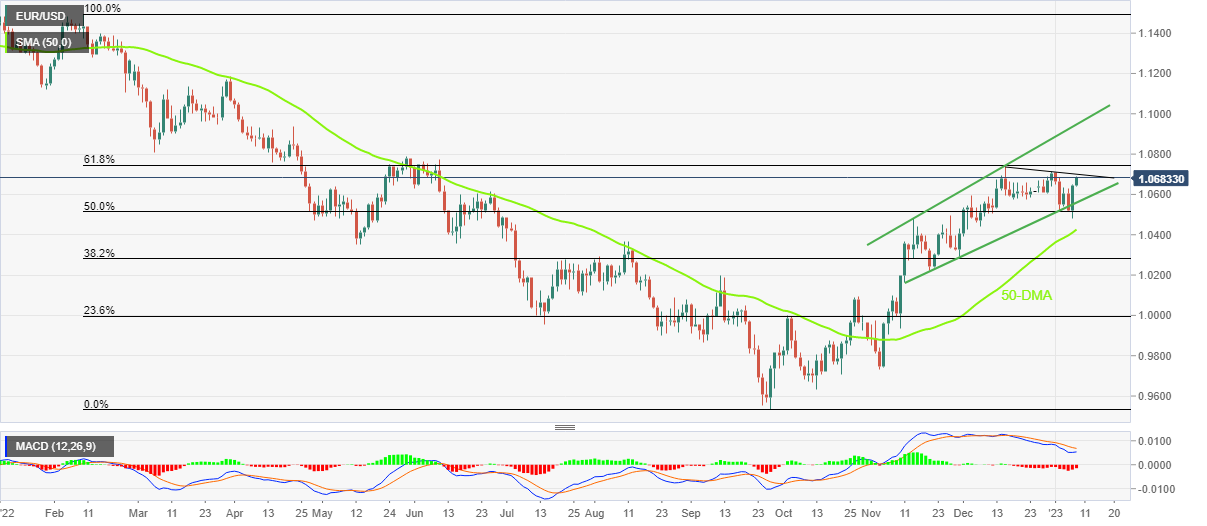
Trend: Further upside expected
-
07:02
German Industrial Production rises 0.2% MoM in November vs. 0.1% expected
Industrial Production in Germany increased in November, the official data showed on Monday, suggesting that the manufacturing sector is showing some signs of recovery.
Eurozone’s economic powerhouse’s Industrial Output rose by 0.2% MoM, the federal statistics authority Destatis said in figures adjusted for seasonal and calendar effects, vs. a 0.1% expected and -0.1% prior.
On an annualized basis, German Industrial Production arrived at -0.4% in November versus a 0% figure seen in October and 1.3% market estimates.
FX implications
The shared currency pays little attention to the mixed German industrial figures. At the time of writing, EUR/USD is trading at around 1.0685, up 0.40% on the day.
About German Industrial Production
The Industrial Production released by the Statistisches Bundesamt Deutschland measures the outputs of German factories and mines. Changes in industrial production are widely followed as a major indicator of strength in the manufacturing sector. A high reading is seen as positive (or bullish) for the EUR, whereas a low reading is seen as negative (or bearish).
-
07:02
Gold Price Forecast: XAU/USD bulls to take a breather before targeting $1,900
Gold price is consolidating the two-day uptrend near the highest level in eight months at $1,880. XAU/USD could take a breather before recapturing $1,900, FXStreet’s Dhwani Mehta reports.
A retreat toward the $1,865 support could be in the offing
“Gold has paused its advance, as the Relative Strength Index (RSI) is flirting with the overbought territory, warranting caution for bulls.”
“Recapturing the multi-month high at $1,880 is critical to targeting $1,900 once again. Daily closing above the latter is needed to extend the bullish reversal.”
“If Gold sellers take out support at $1,865, then a fresh drop toward the bullish 21-Simple Moving Average (SMA) at $1,853 cannot be ruled out.”
-
07:00
Germany Industrial Production s.a. (MoM) above expectations (0.1%) in November: Actual (0.2%)
-
07:00
Denmark Trade Balance: 25.6B (November) vs previous 27.4B
-
07:00
Denmark Current Account declined to 31.8B in November from previous 33.2B
-
06:45
Switzerland Unemployment Rate s.a (MoM) meets forecasts (1.9%) in December
-
06:19
USD/CAD bears attack 1.3400 as Oil rises to $75.00 amid firmer sentiment, focus on Fed wagers, China
- USD/CAD drops to the lowest levels in one month as bears keep the reins.
- China reopening, challenges for Fed hawks underpin risk-on mood.
- Oil price grinds higher amid softer US Dollar, hopes of more energy demand from China.
- Upbeat Canada jobs report versus mixed US data adds strength to the bearish moves.
USD/CAD bears occupy the driver’s seat as the Loonie pair slides to the lowest levels in a month heading into Monday’s European session. In doing so, the quote takes clues from the market’s upbeat sentiment, as well as firmer prices of Canada’s main export item WTI crude oil.
That said, WTI crude oil buyers poke $75.00 amid expectations that the China-inspired global optimism could tame the recession fears and inflate the energy demand. Also likely to have favored the black gold prices could be the downbeat US Dollar and geopolitical fears surrounding Russia.
Elsewhere, China’s reopening of the international borders after a three-year blockage bolstered the market’s optimism. Also favoring the risk appetite could be comments from the People’s Bank of China (PBOC) Official who hinted at robust growth expectations from the dragon nation.
Additionally favoring the USD/CAD bears could be the challenge for the Federal Reserve (Fed) hawks, especially after the latest US data. On Friday, United States Nonfarm Payrolls (NFP) rose by 223,000 in December compared to the market expectations of 200,000 and November's increase of 256,000 (revised from 263,000). Further details of the US December jobs report revealed that the Unemployment Rate declined to 3.5% from 3.6% in November and 3.7% expected. More importantly, the Average hourly earnings rose 0.3% in December versus 0.4% prior while the YoY figures eased to 4.6% from 4.8% in November.
Further, US ISM Services PMI slumped to the lowest levels in 31 months while suggesting a contraction in activities with 49.6 figures for December, versus the market expectations of 55 and 56.5 marked in November. On the same line, US Factory Orders also slumped, falling 1.8% in November after gaining 0.4% in October.
On the other hand, Canada’s Net Change in Employment rose by 104K in December versus 8K expected and 10.1K prior while the Unemployment Rate dropped to 5.0% during the stated month, compared to 5.2% market forecasts and 5.1% previous readings.
Despite the mixed readings of the key US data, Atlanta Federal Reserve bank president Raphael Bostic stated that the US economy is definitely slowing, which in turn drowned the key US Treasury bond yields and the US Dollar. That said, the US 10-year Treasury yields dropped 16 basis points (bps) to 3.56%, the lowest levels in three weeks, whereas the US Dollar Index (DXY) marked the biggest daily slump since November 11.
Against this backdrop, Wall Street closed with notable gains and helps the S&P 500 futures to remain firmer, which in turn exerts downside pressure on the US Dollar and favors Oil prices.
Moving on, Thursday’s US inflation data will be crucial for the USD/CAD pair traders while today’s Canadian Building Permits and Tuesday’s speech from Bank of Canada (BOC) Governor Tiff Macklem could offer intermediate directions.
Technical analysis
A clear downside break of the 100-DMA, around 1.3480 by the press time, directs the USD/CAD bears towards the 1.3230-25 support zone comprising a seven-month-old ascending trend line and multiple levels marked since July 2022.
-
06:05
GBP/USD surpasses 1.2150 despite Fed sees hawkish policy continuation into 2024
- GBP/USD is looking to extend the upside further as the Federal Reserve may choose a smaller interest rate hike ahead.
- Weaker United States Services PMI after poor Manufacturing PMI has triggered recession fears.
- Considering the stubbornness in United States inflation, Federal Reserve may continue a higher terminal rate into CY2024.
- GBP/USD may get strengthened further after a bull cross by the 20-and 50-EMAs.
GBP/USD has overstepped the critical resistance of 1.2150 in the early European session. The Cable may need significant bids to extend its upside journey further as upside bias gets trimmed after a firmer rally. Odds are favoring further upside in the Pound Sterling as the market sentiment is extremely positive after a downbeat release of the Average Hourly Earnings followed by weaker-than-projected United States ISM Services PMI data.
Meanwhile, S&P500 futures are adding further gains after a stalwart rally on Friday, portraying that bulls are not out of steam yet. US equities snapped their 10-day subdued performance and jumped heavily after weak economic data. The US Dollar Index (DXY) is looking for an immediate cushion after a sheer fall. The USD Index is likely to test a six-month low of around 103.00, considering the bearish momentum in the asset. Also, the 10-year US Treasury yields slipped to near 3.56%.
Weaker United States PMI triggers recession fears
A slowdown in an economy is favorable for a decline in inflationary pressures but also fired up recession fears too. After recording a fresh low Manufacturing PMI figure since May 2000, reported by the United States Institute of Supply Management (ISM) department, Services PMI has also been released poor-than-projected. The Services PMI plunged significantly to 49.6 vs. the projection of 55.0. Also, New Orders Index that displays forward demand dropped massively to 45.2 vs. the expectations of 58.5. A sheer slowdown in economic activities and its forward projections are impacting the US Dollar.
No doubt, the decline in the United States' economic activities is sponsored by the higher interest rate of the Federal Reserve (Fed). This has triggered a risk of recession in the United States economy. There is no denying the fact that the Federal Reserve would look for decelerating its policy-tightening pace further. However, the continuation of higher interest rates will remain intact as the road to 2% inflation is yet to see significant obstacles.
Ambiguity escalates as wage inflation drops and NFP soars
Employment data released on Friday has created ambiguity among the sentiment of the market participants. The United States Nonfarm Payrolls (NFP) (Dec) data soared to 223K vs. the consensus of 200K. Usually, resilient demand for labor is addressed by higher earnings as firms offer more wages to bring talent in-house. Contrary, the Average Hourly Earnings dropped to 4.6% vs. the expectations of 5.0% and the prior release of 4.8%. This might result in smaller rate hikes by the Federal Reserve in the coming months.
Chicago Fed President Evans quoted in Wall Street Journal (WSJ), “It was possible the economic data would support raising the policy rate by 25 basis points at the Fed's next gathering” as reported by Reuters.
However, the continuation of a higher terminal rate for a longer period is still in the picture, citing the stubbornness of the Consumer Price Index (CPI).
Atlanta Fed Bank President warned that "The US economy is definitely slowing" led by a significant reduction in activities in housing and other interest rate sectors. On policy rate projections, the Federal Reserve policymaker sees a terminal rate above 5% and a continuation of peak policy rates into CY2024.
United Kingdom energy inflation is substitution with other categories
The price cap levied by the United Kingdom administration on energy prices to support households has mechanically reduced inflation but is impacting the prices of other products. Bank of England (BOE) policymaker Catherine Mann cited that “The cap on energy prices allows for a restructuring of spending in the rest of the consumption basket and thus potentially higher inflation in the case of all other products,” Mann said. “It’s something we watch carefully” as reported by Bloomberg. He is worried that inflation could rebound in the case the price cap on energy prices will be rolled back.
GBP/USD technical outlook
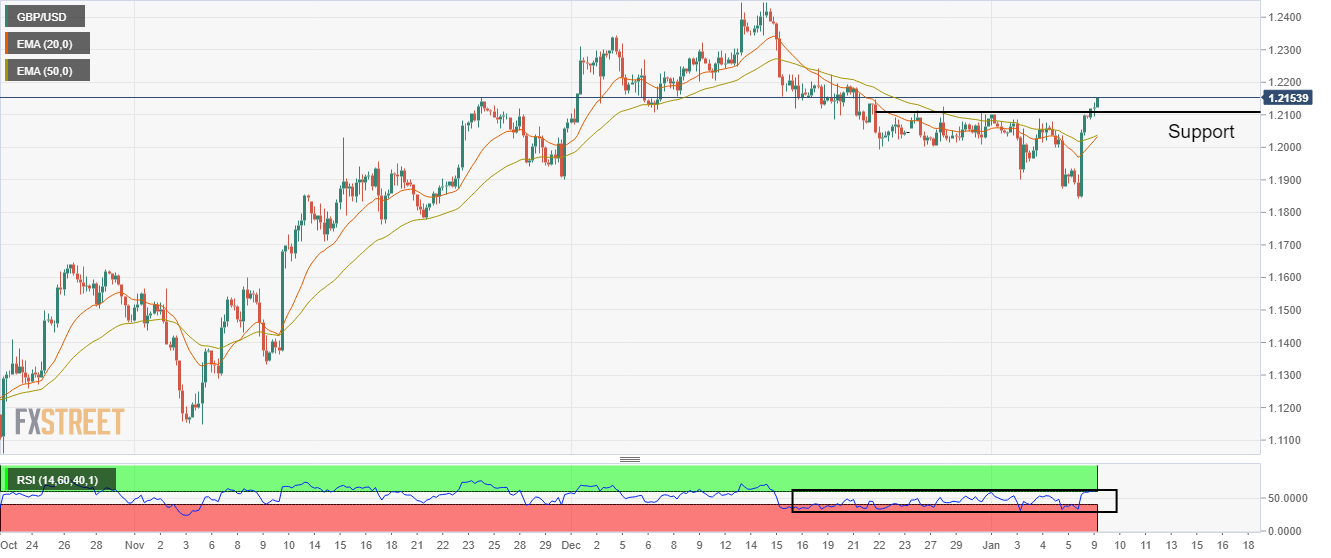
GBP/USD has delivered a break above the horizontal resistance plotted from December 27 high around 1.2112, which has become support now for the Pound Sterling. The 20-and 50-period Exponential Moving Averages (EMAs) are on the verge of delivering a bull cross around 1.2038, which will add to the upside filters.
Meanwhile, the Relative Strength Index (RSI) (14) is on the edge of shifting into the bullish range of 60.00-80.00, which will trigger the bullish momentum.
-
06:01
South Africa Gross $Gold & Forex Reserve came in at $60.57B, above expectations ($59.478B) in December
-
06:01
South Africa Net $Gold & Forex Reserve above forecasts ($52.963B) in December: Actual ($53.827B)
-
06:00
EUR/USD: Rebound faces strong resistance at 1.0735 – UOB
UOB Group’s Economist Lee Sue Ann and Markets Strategist Quek Ser Leang se EUR/USD picking up further upside traction in the next few weeks.
Key Quotes
24-hour view: “EUR dropped to a low of 1.0482 last Friday before lifting to off to close sharply higher by 1.18% (1.0644). While overbought, the strong rise is not showing any signs of weakening just yet. There is room for the advance in EUR to edge above 1.0685 first before easing. The next resistance at 1.0715 is not expected to come into view. Support is at 1.0615, followed by 1.0580.”
Next 1-3 weeks: “Last Friday (06 Jan, spot at 1.0520), we indicated that EUR could weaken to the next support at 1.0450, possibly 1.0410. The sudden lift-off in NY trade sent EUR soaring to a high of 1.0647. The break of our ‘strong resistance’ at 1.0630 indicates that our view of further EUR weakness is incorrect. Despite the strong rise, upward momentum has not improved much. That said, EUR is likely to trade with an upward bias from here even though last month’s high of 1.0735 is a solid resistance and at this stage, the odds for a sustained rise above this level are not high. The upward bias is intact as long as EUR stays above 1.0535.”
-
05:50
USD/CNH Price Analysis: Refreshes multi-day low as bears approach 6.7650 support
- USD/CNH drops to the lowest levels since August 17, 2022.
- Clear break of 200-DMA, bearish MACD signals favor sellers as they eye two-month-old descending support line.
- Previous support line from June adds to the upside filters.
USD/CNH takes offers to renew a multi-day low around 6.7900 heading into Monday’s European session. In doing so, the offshore Chinese Yuan (CNH) pair extends the previous day’s downside break of the 200-DMA to poke the lowest levels since mid-August 2022.
Also adding strength to the bearish bias is the pair’s sustained trading below the support-turned-resistance line from early June, as well as the bearish MACD signals.
That said, USD/CNH bears are on their way to meeting a downward-sloping support line from November 14, close to 6.7650 by the press time.
The pair’s further downside, however, appears limited as the 61.8% Fibonacci retracement level of its February-October upside, near 6.7150, could challenge the USD/CNH sellers afterward. If not, then the mid-2022 low surrounding 6.6170 and the 6.6000 round figure will be in focus.
On the contrary, recovery moves may initially aim for the 50.0% Fibonacci retracement level surrounding 6.8420 ahead of confronting the 200-DMA level of 6.8730.
Following that, the seven-month-old support-turned-resistance line near 6.9240 will be in focus as it holds the key to the USD/CNH run-up towards the 7.0000 psychological magnet.
Overall, USD/CNH remains on the bear’s radar even if the downside room appears limited.
USD/CNH: Daily chart
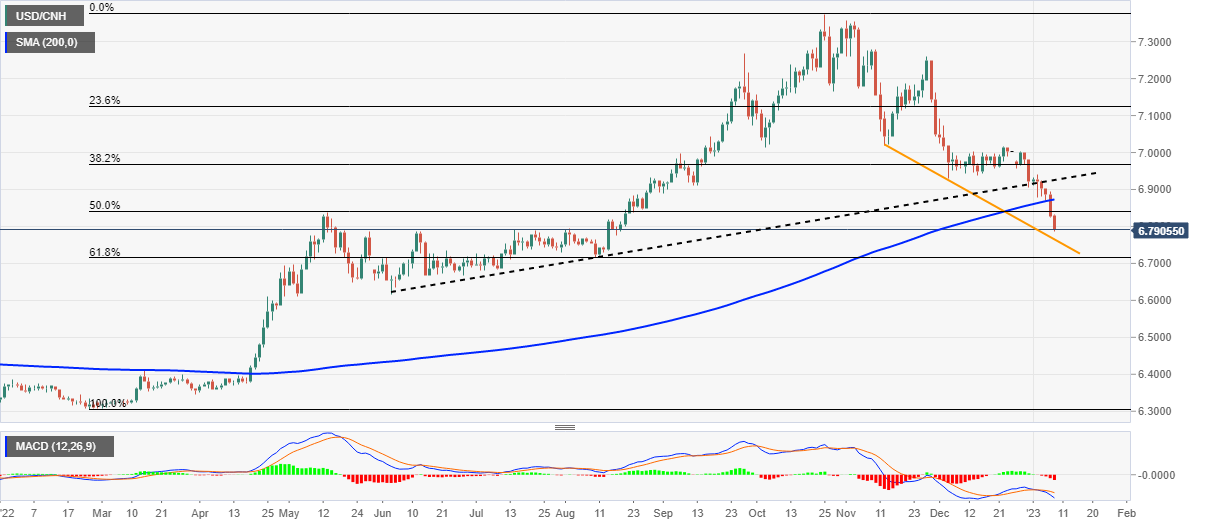
Trend: Further downside expected
-
05:19
Asian Stock Market: China reopening, easy Fed bets underpin firmer sentiment amid Tokyo’s absence
- Asia-Pacific equities trace Wall Street’s gains even as Japan cheers extended weekend.
- China’s openings of international borders, year-end shopping spree favor sentiment.
- Downbeat US data weigh on hawkish Fed wagers, tease US recession.
- Light calendar, off in Japan restrict market moves ahead of inflation data from China, Japan and US.
Market sentiment improves in Asia as China drops the last flag of the zero-Covid policy and the softer US wage growth data challenged hawkish Fed wagers. Even so, an absence of traders from Tokyo and a light calendar, as well as a cautious mood ahead of this week’s key inflation data, restrict the volatility during early Monday.
While portraying the mood, MSCI’s index of the Asia-Pacific shares outside Japan rises 2.25% to print the highest levels since late September. On the same line could be the shares from South Korea, Taiwan and India as each one of them rises over 1.0% intraday by the press time.
Chinese blue-chip stocks cheer the latest shopping spree in the dragon nation, as per the early activity signals for December and early January, whereas Australia’s ASX 200 and New Zealand’s NZX 50 trace equities in Beijing due to their trade ties with the Asian major.
It should be noted that mildly bid ASX 200 ignores downbeat prints of Aussie Building Permits for November.
China’s reopening of the international borders after a three-year blockage bolstered optimism in Asia. Also favoring the risk appetite could be comments from the People’s Bank of China (PBOC) Official who hinted at robust growth expectations from the dragon nation.
Additionally, Friday’s downbeat prints of US Average Hourly Earnings, ISM Services PMI and Factory Orders pushed back the hawkish hopes from the US Federal Reserve (Fed) as the figures raised US recession concerns. The same joined mixed comments from the Fed policymakers and hopes of an upbeat US earnings season to also favor risk-on mood in Asia.
On a broader front, S&P 500 Futures print mild gains while India’s benchmark equity index BSE Sensex rises over 1.0% by the press time. Also portraying the risk-on mood could be the upbeat oil prices, as well as the softer prints of the US Dollar Index (DXY).
Looking forward, a light calendar may allow the equity bulls to keep the reins but this week’s inflation data from the US, China and Japan are crucial for near-term direction.
-
04:50
AUD/USD Price Analysis: Aims to conquer 0.7000 amid a cheerful market mood
- A cheerful market mood has strengthened the Australian Dollar.
- North-side sloping 20-and 50-EMAs add to the upside filters.
- The RSI (14) has shifted into the bullish range of 60.00-80.00, which indicates that bullish momentum is active now.
The AUD/USD pair is displaying a sideways auction around the immediate hurdle of 0.6930 in the Asian session. The Aussie asset is expected to continue its upside journey amid sheer volatility in the US Dollar Index (DXY). The USD Index has dropped below 103.25, at the time of writing, and is expected to refresh its six-month low below the critical support of 103.00 amid a risk-appetite theme.
S&P500 futures have carry-forwarded Friday’s strength as investors see a slowdown in the policy tightening pace by the Federal Reserve (Fed) ahead. Meanwhile, the 10-year US Treasury yields dropped to 3.56%.
On a four-hour scale, the Aussie asset has delivered an upside break of the horizontal resistance plotted from December 13 high around 0.6880, which has turned into support now. Also, the breakout of the Rising Channel chart pattern indicates the strength of the Australian Dollar.
Upward-sloping 20-and 50-period Exponential Moving Averages (EMAs) at 0.6833 and 0.6800 respectively add to the upside filters.
Also, the Relative Strength Index (RSI) (14) has delivered a breakout into the bullish range of 60.00-80.00, which indicates that the upside momentum has been triggered.
After a juggernaut rally, a corrective to near December 13 high around 0.6880 would be an optimal buy for investors, which will drive the major towards Monday’s high at 0.6930, followed by the psychological resistance at 0.7000.
On the contrary, a downside move below December 29 low at 0.6710 will drag the major further toward December 22 low at 0.6650 followed by November 21 low at 0.6585.
AUD/USD four-hour chart
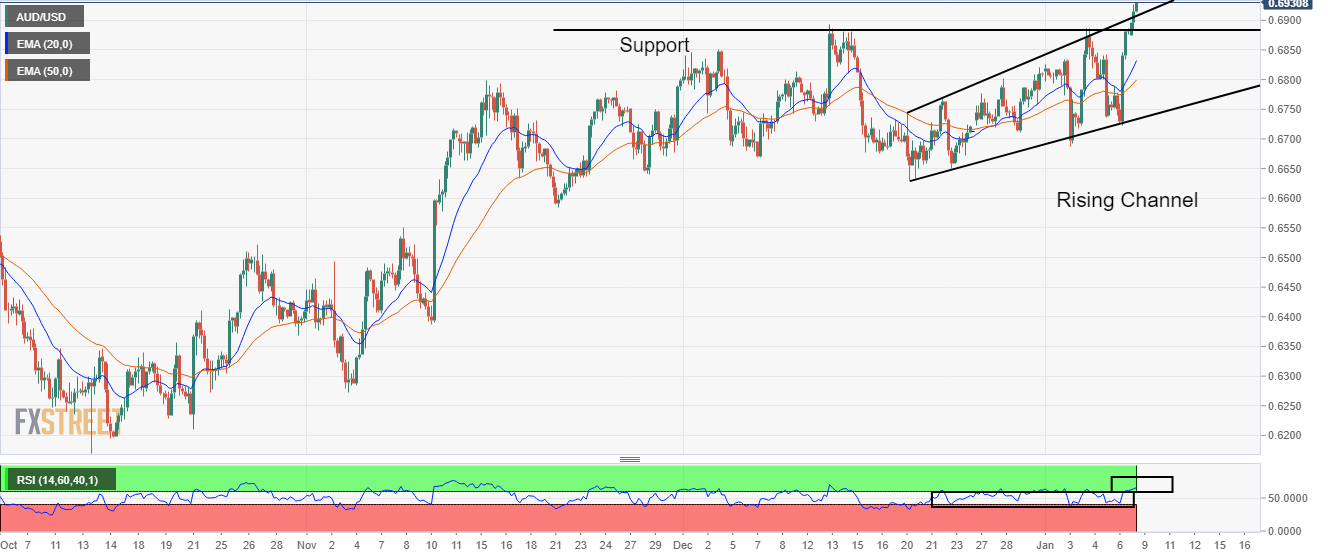
-
04:44
USD/INR Price News: Indian Rupee seesaws around 82.30 even as China, Fed chatters favor risk-on mood
- USD/INR dribbles near the lowest levels in one month.
- China reopening joins PBOC headlines to underpin risk-on mood in Asia.
- Downbeat US wage growth weigh on Treasury yields and hawkish Fed bets.
- Japan holiday, light calendar and upbeat oil prices allow bears to lick their wounds.
USD/INR bears lick their wounds near 82.30, after refreshing a one-month low, as the Indian Rupee (INR) buyers await fresh clues during early Monday. In doing so, the quote remains indecisive after printing a three-day downtrend at the latest.
That said, China-inspired risk-on mood joins the broadly softer US Dollar to weigh on the USD/INR prices. However, a light calendar and the cautious mood ahead of this week’s key US inflation data, as well as the holiday in Japan, restrict the pair’s immediate moves.
It’s worth noting that China’s reopening of the international borders after a three-year blockage bolstered optimism in Asia. Also favoring the risk appetite could be early signals suggesting Beijing’s heavy shopping amid the year-end festive season. Furthermore, comments from the People’s Bank of China (PBOC) Official also hinted at robust growth expectations from the dragon nation and underpinned the firmer sentiment.
On the other hand, Friday’s downbeat prints of US Average Hourly Earnings, ISM Services PMI and Factory Orders pushed back the hawkish hopes from the Fed as the figures raised the US recession concerns, which in turn weighed on the US Dollar Index (DXY). Additionally, weighing on the DXY could be the mixed comments from the Fed policymakers and hopes of an upbeat US earnings season also seem to favor the USD/INR bears.
Alternatively, a light calendar and upbeat prices of Crude Oil put a floor under the USD/INR prices. The reason could be linked to India’s reliance on energy imports.
Amid these plays, S&OP 500 Futures print mild gains while India’s benchmark equity index BSE Sensex rises over 1.0% by the press time.
Moving on, a lack of major data/events and firmer oil prices can restrict the USD/INR pair’s immediate moves ahead of Thursday’s US Consumer Price Index (CPI) data.
Technical analysis
A clear downside break of the 82.40 horizontal support favors USD/INR bears targeting the early December 2022 swing low near 82.10.
-
04:02
GBP/JPY Price Analysis: Volatility contracts amid stretched weekend in Japan
- The formation of an ascending triangle chart pattern indicates a volatility contraction.
- Advancing 50-EMA indicates that the upside bias in the short term is still solid.
- A 40.00-60.00 range oscillation by the RSI (14) indicates that investors are awaiting a trigger for a decisive move.
The GBP/JPY pair has corrected after facing barricades around the psychological resistance of 160.00 in the Asian session. The cross has slipped to near 159.50 and is likely to remain on tenterhooks amid volatility contraction. Trading activity is expected to remain quiet as Japanese markets are closed on account of Coming of Age Day.
On an hourly scale, the cross is auctioning in an Ascending Triangle chart pattern that signals a volatility contraction. Usually, a volatility contraction is followed by a breakout, which results in wider ticks and heavy volume. The horizontal resistance of the aforementioned chart pattern is plotted from January 4 high around 160.20 while the upward-sloping trendline is placed from January 5 low at 158.52.
At the time of writing, the cross is looking for support around the 20-period Exponential Moving Average (EMA) at 159.53 after a mild correction. While the 50-EMA at 159.25 is sloping north, which indicates that the short-term trend is solid.
The Relative Strength Index (RSI) (14) is oscillating in a 40.00-60.00 range, which indicates that investors are awaiting a fresh trigger for a decisive move.
For an upside move, the cross needs to deliver a breakout of the chart pattern above January 4 high around 160.20, which will drive the asset towards December 27 high around 161.00. An upside break of the latter will expose the cross for more upside to near December 28 high around 162.34.
Alternatively, a breakdown below January 5 low at 158.52 will drag the cross towards January 3 high at 157.46 followed by January 3 low at 155.36.
GBP/JPY hourly chart
-638088336188019505.png)
-
03:25
Gold Price Forecast: XAU/USD renews eight-month high near $1,880 on China concerns, softer US Dollar
- Gold price grinds higher after refreshing multi-day high.
- China unlock, PBOC’s gold stocking underpins XAU/USD run-up.
- US Dollar bears the burden of downbeat data, mixed Fedspeak.
- Light calendar, cautious mood ahead of US inflation figures probe Gold buyers.
Gold price (XAU/USD) rises to the highest levels since early May 2022 as the risk-on mood joins the softer US Dollar to begin the key week comprising inflation numbers from the US, China and Japan. Also adding strength to the yellow metal’s upside momentum is Beijing’s recent stockpiling of Gold. In doing so, the XAU/USD bulls attack a $1,880 hurdle by the press time.
The risk profile remains firmer as China reopens national borders after a three-year pause. On the same line could be the early signals suggesting China’s heavy shopping during the festive season, as well as comments from People’s Bank of China (PBOC) Official suggesting optimism surrounding China’s growth conditions.
It’s worth observing that China is one of the world’s biggest Gold consumers and hence the risk-positive headlines from Beijing influence the XAU/USD bulls.
On the same line could be the PBOC’s announcement of Gold buyers as it holds around 2,010 tonnes of the metal as reserves after the latest addition of nearly 30 tonnes. That said, the recent piling of gold by the PBOC is the third notable instance, after September 2019 and October 2016.
Elsewhere, Friday’s downbeat prints of US wage growth, ISM Services PMI and Factory Orders weighed on the US Dollar Index (DXY) and added strength to the risk-on mood, which in turn propels the Gold price. That said, mixed comments from the Fed policymakers and hopes of an upbeat US earnings season also seem to favor the XAU/USD buyers.
While portraying the mood, the S&P 500 Futures print mild gains but a holiday in Japan limits the bond market moves in Asia, as well as during early Monday morning in Europe.
Looking forward, a light calendar for the day and upbeat headlines from China could keep the Gold buyers hopeful. However, inflation data from Tokyo, China and the US will be important for precious metal traders as central bankers brace for shifting gears.
Gold price technical analysis
Gold buyers cheer upside break of the previous weekly top surrounding $1,865, as well as the 61.8% Fibonacci Expansion (FE) of its December 22 to January 05 moves, near $1,875, as the XAU/USD bulls jostle with the June 2022 high of around $1,880.
That said, the bullish MACD signals and the metal’s sustained trading beyond the 100-SMA and the 200-SMA, respectively ear $1,815 and $1,795, favor the XAU/USD buyers. On the same line could be the metal’s U-turn from a one-month-old horizontal support region of around $1,823.
Hence, the Gold buyers are in the driver’s seat unless the quote drops below $1,795.
However, the overbought RSI (14) suggests limited upside and hence a clear break of the $1,880 hurdle becomes necessary for the XAU/USD to aim for the May 2022 peak of $1,910.
Gold price: Four-hour chart
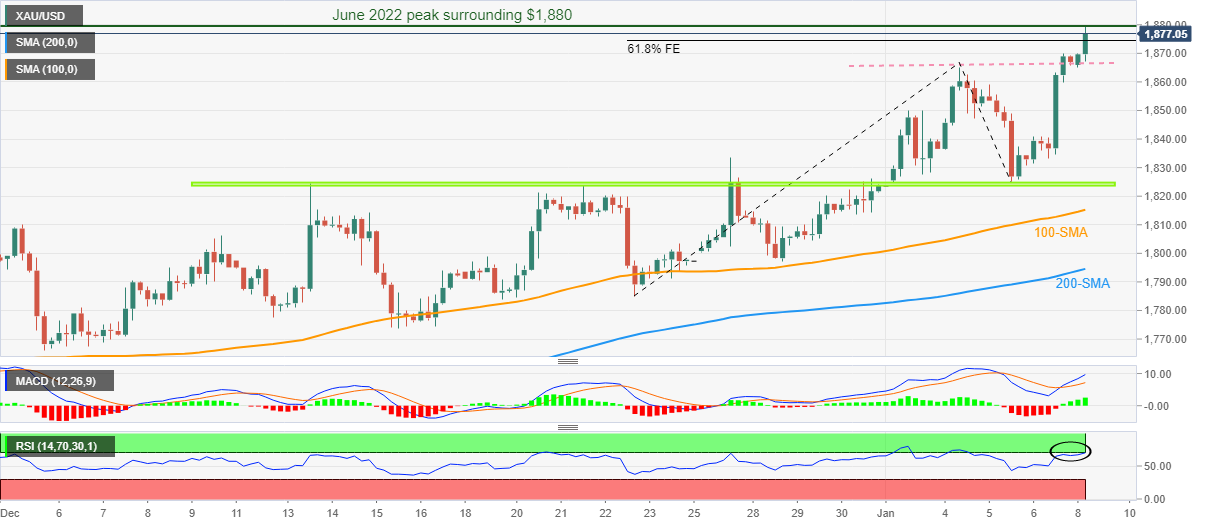
Trend: Limited upside expected
-
03:23
EUR/USD scales to near 1.0680 as Fed looks to trim policy tightening pace
- EUR/USD has climbed to near 1.0680 amid a sell-off in the US Dollar index led by a risk-on mood.
- A sheer drop in US wage inflation and PMI numbers is advocating for a slowdown in the policy tightening pace by the Fed.
- The ECB is looking to reach terminal rates this summer.
The EUR/USD pair has scaled to near 1.0680 after the resumption of Friday’s rally in the Asian session. The major currency pair has witnessed firmer demand amid a sell-off in the US Dollar Index (DXY). The asset is likely to remain in the grip of bulls as the Federal Reserve (Fed) is expected to decelerate its current pace of hiking interest rates amid accelerating recession fears.
Investors are pouring funds into risk-perceived assets like S&P500 futures, portraying a vigorous improvement in the risk appetite of the market participants. The 10-year US Treasury yields scaled lower to 3.56%. Meanwhile, the US Dollar Index has stretched its downside to near 103.27 and is highly expected to re-rest a six-month low around 103.00 amid a decline in wage inflation in the United States.
On Friday, the United States Bureau of Labor Statistics reported a drop in wage inflation (Dec) to 4.6% vs. the consensus of 5.0% and the former release of 4.8%. Federal Reserve (Fed) policymakers remained worried that higher wage inflation could result in a rebound in the Consumer Price Index (CPI) going ahead. The labor market is upbeat, which would force firms to offer higher wages to attract labor and it will leave higher liquidity to the households for disposal.
Apart from that, weaker US ISM Services PMI data after a weak Manufacturing PMI has triggered the risk of a further slowdown in the economy. Meanwhile, Chicago Fed President Evans quoted in Wall Street Journal (WSJ), “It was possible the economic data would support raising the policy rate by 25 basis points at the Fed's next gathering” as reported by Reuters.
Also, Atlanta Fed President Raphael Bostic warned that "The US economy is definitely slowing" led by a significant reduction in activities in housing and other interest rate sectors.
Meanwhile, European Central Bank (ECB) Governing Council member and French central bank governor Francois Villeroy de Galhau advocated last week, "it would be desirable to reach the right 'terminal rate' by next summer, but it is too early to say at what level.” After a decline in Eurozone inflation, investors are seeing ECB reaching an interest rate peak sooner.
-
03:07
US NFP: Encouraging for a soft landing – Goldman Sachs
In a recent interview with CNBC, Goldman Sachs Chief Economist Jan Hatzius offered his take on Friday’s United States Nonfarm Payrolls data.
Also read: US Nonfarm Payrolls rise by 223,000 in December vs. 200,000 expected
Key quotes
“We’re growing at a below-trend pace that’s necessary to rebalance the economy.”
“Wage growth is gradually decelerating, price inflation is pretty quickly decelerating.”
“I think that should be encouraging for a soft landing.”
-
02:57
USD/JPY Price Analysis: Slides towards weekly support line near 131.00
- USD/JPY takes offers to refresh intraday low, extends Friday’s U-turn from three-week high.
- Oversold RSI conditions highlight immediate support line as the key challenge for bears.
- Convergence of 100, 200 EMAs appears a tough nut to crack for the buyers.
- Bearish MACD signals, sustained trading below important moving averages signal further downside.
USD/JPY stands on slippery grounds as the Yen pair renews its intraday low near 131.35 during early Monday. In doing so, the major currency pair extends the previous day’s pullback from the three-week high, as well as a downside break of the 100 and 200-hour Exponential Moving Average (EMA).
It’s worth noting that the oversold conditions of the RSI (14) suggest a limited downside of the USD/JPY prices, which in turn highlights the one-week-old ascending support line, close to the 131.00 threshold at the latest.
In a case where the USD/JPY bears dominate past 131.00, the recently flashed multi-month low, marked in the last week around 129.50, could act as the last defense of the buyers before directing the pair towards May 2022 low near 126.35.
On the contrary, USD/JPY recovery remains elusive unless the pair remains below the convergence of the aforementioned EMAs around 132.45-50.
Even so, the 134.05-10 region and the monthly high surrounding 134.80 could challenge the USD/JPY bulls before giving them control.
However, the USD/JPY buyers need to remain cautious until the quote trades below the previous monthly low of around 138.20.
USD/JPY: Hourly chart
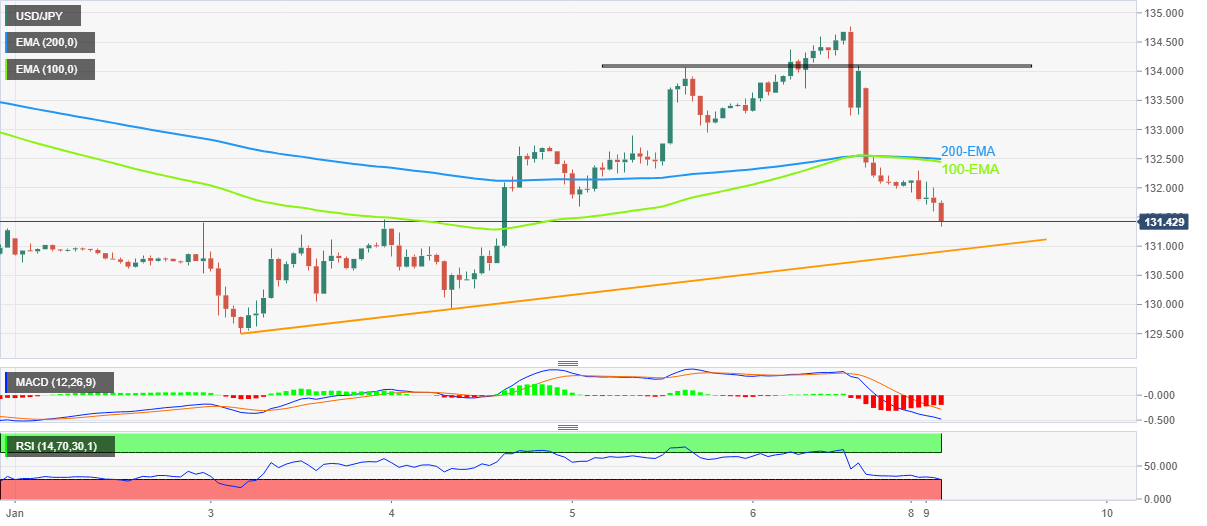
Trend: Limited downside expected
-
02:51
China’s six cities set GDP growth targets from 5.5% to 7.0% for 2023 – Securities Daily
China’s Securities Daily reported on Monday that six Chinese cities announced GDP growth targets for next year, with the majority targeting 5.5% to 7% in the hope that changes in government policies will lead to economic recovery.
Key quotes
According to the reporter's incomplete statistics, as of January 8, at least six cities including Jinan, Qingdao, and Changsha have announced their GDP growth targets for 2023, and the values are concentrated between 5.5% and 7%.
"Judging from the 2023 economic development goals determined by various places, they are generally full of confidence in economic recovery."
Market reaction
Amidst upbeat reports from China, AUD/USD is holding ground near four-month highs at around 0.6900, up 0.45% on the day.
-
02:35
AUD/JPY justifies risk-barometer status around 91.00, Japan holiday, Aussie data probe bulls
- AUD/JPY clings to mild gains around three-week high.
- Australia Building Permits slumped in November, Tokyo markets are off for Coming-of-Age Day.
- China-linked headlines propel risk-on mood amid a sluggish start to the key week.
- Inflation numbers from US, China and Japan appears crucial for clear directions.
AUD/JPY seesaws around the highest levels in three weeks as it makes rounds to 91.00 during Monday’s sluggish Asian session.
In doing so, the cross-currency pair takes clues from the markets’ risk-on mood to grind higher. However, a holiday in Japan joins downbeat Aussie data and hawkish concerns from the Bank of Japan (BOJ) to challenge the AUD/JPY bulls.
That said, Australia’s Building Permits dropped to -15.1% YoY in November versus -6.4% prior. Further details suggest that the MoM prints also declined to -9.0% from -5.6% prior (revised from -6.0%), as well as the -1.0% market forecasts.
On the other hand, comments from Japanese Prime Minister (PM) Fumio Kishida also seem to probe the AUD/JPY pair’s upside momentum. “While communicating closely with markets, the BOJ needs to make its policy more flexible with an eye on an eventual normalization of monetary policy,” said Japan PM Kishida.
The market’s risk profile remains firmer as China reopens national borders after a three-year pause. On the same line could be the early signals suggesting China’s heavy shopping during the festive season, as well as comments from People’s Bank of China (PBOC) Official suggesting optimism surrounding China’s growth conditions.
It should be noted that Friday’s downbeat prints of US wage growth, ISM Services PMI and Factory Orders also add strength to the risk-on mood and help the AUD/JPY price to remain firmer.
Amid these plays, Wall Street closed positive while the US 10-year Treasury yields dropped 16 basis points (bps) to 3.56%, the lowest levels in three weeks. It’s worth noting that the S&P 500 Futures print 0.20% intraday gains by the press time.
Looking forward, inflation data from Tokyo, China and the US will be important for the AUD/JPY pair traders to watch for clear directions as upbeat sentiment jostles with hawkish bets on the Bank of Japan (BOJ).
Technical analysis
Although the resistance-turned-support line defends AUD/JPY bulls around 89.80, a two-month-old descending trend line near 93.00 challenges the upside momentum.
-
02:19
BoE's Mann: Energy price caps could be boosting other inflation
Participating in a panel discussion at the annual conference of the American Economics Association in New Orleans over the weekend, Bank of England (BoE) Monetary Policy Committee (MPC) member Catherine Mann spoke about the energy price caps and their impact on inflation.
Key quotes
“The caps on energy prices allow the reorientation of spending to the rest of the consumption basket and thus potentially higher inflation than otherwise would be the case in all those other products”
“That’s something we look at carefully.”
“What’s going to happen when the caps are removed?”
Will inflation kind of bounce back? What will the energy prices be at that time? We don’t know.”
Related reads
- GBP/USD extends gains above 1.2100 as US recession fears soar
- UK PM Sunak: Open to discussing pay rises for nurses
-
02:15
Silver Price Analysis: XAG/USD bulls brace for a bumpy road past $24.00
- Silver price seesaws around intraday top after bouncing off three-week low.
- 100-SMA breakout joins bullish MACD signals to favor XAG/USD buyers.
- One-week-old descending resistance line, horizontal area from December 21 challenge Silver bulls.
Silver price (XAG/USD) remains firmer around the intraday high of $24.04 as bulls keep the reins during early Monday. In doing so, the bright metal extends Friday’s U-turn from the lowest levels in two weeks.
That said, the bullion’s successful upside break of the 100-SMA joins the bullish MACD signals to underpin the latest recovery moves.
It should be noted, however, that multiple hurdles stand tall to challenge the XAG/USD bulls and hence the buyers remain skeptical at the moment.
Among the key resistances, a downward-sloping trend line from the last Tuesday, close to $24.20 by the press time, guards the quote’s immediate upside.
Following that, a horizontal area comprising multiple hurdle marked in the last 13 days, around $21.40, challenges the Silver buyers.
In a case where the XAG/USD remains firmer past $21.40, the monthly high around $21.55, also the highest level since late April 2022, will be crucial to watch.
Alternatively, Silver sellers may wait for a clear downside break of the 100-SMA, around $23.70 at the latest, before taking fresh positions.
Following that, the latest swing low and the 61.8% Fibonacci retracement level of the metal’s upside from December 06 2022 to January 03 2023, close to $23.10 and $23.00 in that order, could gain the market’s attention.
Silver price: Four-hour chart
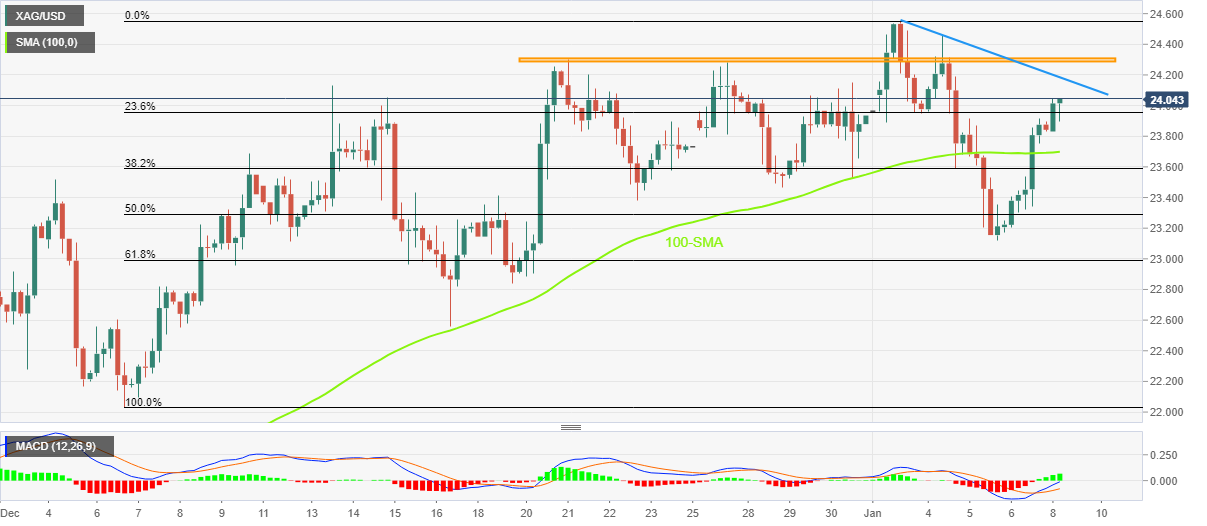
Trend: Further upside expected
-
02:13
PBOC boosts Gold purchases by 30 tonnes in December
The People's Bank of China (PBOC) published on its website over the weekend that it bumped up its holdings of Gold by 30 tonnes in December, following an increase of 32 tonnes in November.
In doing so, the Chinese central bank’s gold reserves increased to 2,010 tonnes
Previously, the PBOC reported an inflow of gold in September 2019 and October 2016.
Market reaction
Gold price is getting an additional boost from the encouraging report from China, closing in on the highest level since June 2022 at $1,879.At the time of writing, Gold price is adding 0.47% on the day to trade at $1,876.
-
01:51
WTI marches towards $75.00 as China-linked demand hopes poke recession woes
- WTI remains on the front foot around intraday high.
- China reopening, PBOC’s Shuqing propel expectations of higher energy demand.
- US data trigger economic slowdown fears, weigh on the US Dollar.
- US, China inflation will be crucial for clear directions.
WTI grinds higher near the intraday top surrounding $74.70 as firmer sentiment jostles with economic slowdown concerns during early Monday. Even so, the softer US Dollar and a light calendar allow the black gold buyers to keep the reins, after Friday’s mixed performance.
That said, the risk profile remains firmer amid China’s reopening of the national borders after a three-year halt. On the same line were comments from Guo Shuqing, party secretary of the People’s Bank of China (PBOC).
“Some 2 billion trips are expected this season, nearly double last year's movement and recovering to 70% of 2019 levels, the government says” reported Reuters while conveying China unlock news.
On the other hand, PBOC’s Shuqing said, “The world’s second-largest economy is expected to quickly rebound because of the country’s optimized Covid-19 response and after its economic policies continue to take effect.”
Elsewhere, the US Dollar Index (DXY) dropped the most in three weeks the previous day, down 0.20% intraday near 103.70 by the press time, as the US employment report failed to impress the greenback buyers while the US activity numbers raised fears of economic slowdown. It’s worth noting that downbeat prints of the US wage growth, ISM Services PMI and the Factory Orders drowned the Treasury bond yields, as well as the DXY the previous day.
On a different page, headlines surrounding a delay in the colonial pipeline restoration and the Russia-Ukraine tussles seem to also help the energy buyers. However, the economic fears test the upside momentum as traders fear more rate hikes ahead of the Consumer Price Index (CPI) for December from China and the US, up for publishing on Wednesday and Thursday respectively.
Technical analysis
WTI rebound remains elusive unless the quote crosses the 21-DMA hurdle surrounding $77.00.
-
01:41
GBP/USD extends gains above 1.2100 as US recession fears soar
- GBP/USD has overstepped the critical resistance of 1.2100 amid risk-on impulse.
- A sheer decline in economic activities in the United States has triggered recession fears.
- BOE Mann has warned that an energy price cap-inspired fall in inflation could trigger inflation in other productions.
The GBP/USD pair has surpassed the round-level resistance of 1.2100 in the Tokyo session. The Cable is expected to shift its auction profile above 1.2100 amid a cheerful market mood. The US Dollar faced immense pressure on Friday after the release of weaker-than-anticipated Average Hourly Earnings.
S&P500 futures have extended their upside journey after a stellar buying on Friday, portraying more stream left in bulls. Also, the higher risk appetite of the market participants is supporting more weakness in the US Dollar Index (DXY). The USD Index is hovering below 103.50, which indicates that the upside has been capped as the risk-aversion theme has lost its traction. The 10-year US Treasury yields have dropped to near 3.56%.
After recording the lowest United States Manufacturing PMI figure (Dec) at 48.4 last week since May 2000 reading, as reported by the Institute of Supply Management (ISM), Services PMI has also dropped significantly. The Services PMI plunged significantly to 49.6 vs. the projection of 55.0. Also, New Orders Index that displays forward demand dropped massively to 45.2 vs. the expectations of 58.5. This has triggered a risk of recession in the United States.
Considering the recent decline in potential economic data, Chicago Federal Reserve (Fed) President Evans quoted in Wall Street Journal (WSJ), “It was possible the economic data would support raising the policy rate by 25 basis points at the Fed's next gathering” as reported by Reuters.
On the United Kingdom front, a price cap on energy prices to support households has mechanically reduced inflation but is impacting the prices of other products. Bank of England (BOE) policymaker Catherine Mann cited that “The cap on energy prices allows for a restructuring of spending in the rest of the consumption basket and thus potentially higher inflation in the case of all other products,” Mann said. “It’s something we watch carefully” as reported by Bloomberg.
-
01:17
PBOC sets USD/CNY reference rate at 6.8265 vs. 6.8912 previous
People’s Bank of China (PBOC) set the USD/CNY central rate at 6.8265 on Monday, versus Friday's fix of 6.8912 and market expectations of 6.8276. In doing so, the PBOC propels the CNY rate by the most in 30 days.
It's worth noting that the USD/CNY closed near 6.8235 the previous day.
In addition to the USD/CNY fix, the PBOC also released data for the Open Market Pperations (OMO) that suggest the Chinese central bank drained net 41 billion Yuan on the day, per Reuters calculations.
About the fix
China maintains strict control of the yuan’s rate on the mainland.
The onshore yuan (CNY) differs from the offshore one (CNH) in trading restrictions, this last one is not as tightly controlled.
Each morning, the People’s Bank of China (PBOC) sets a so-called daily midpoint fix, based on the yuan’s previous day's closing level and quotations taken from the inter-bank dealer.
-
01:09
Gold Price Forecast: XAU/USD struggles to extend rally above $1,870, upside seems favored
- Gold price is facing barricades around $1,870.00, upside looks solid amid the volatile US Dollar Index.
- S&P500 futures have added more gains in Friday’s rally, portraying an upbeat market mood.
- Gold price is getting much attention amid rising expectations of a recession in the United States.
Gold price (XAU/USD) is hovering in a narrow range around the immediate hurdle of $1,870 in the Asian session. The precious metal is looking to extend its upside journey amid the higher risk appetite of the market participants.
S&P500 futures have added more gains in Friday’s rally, portraying an upbeat market mood. The US Dollar Index (DXY) has sensed barricades around 103.50 and is going to find an intermediate cushion around 103.00. The 10-year US Treasury yields have dropped to near 3.56% amid a decline in safe-haven’s appeal.
Gold price is getting much attention amid rising expectations of a recession in the United States. After a consecutive drop in the US ISM Manufacturing PMI, the Services PMI has also slipped too, indicating that the overall demand in the United States economy has weakened. The Services PMI plunged significantly to 49.6 vs. the projection of 55.0. Also, New Orders Index that displays forward demand dropped massively to 45.2 vs. the expectations of 58.5. A sheer slowdown in economic activities and its forward projections are impacting the US Dollar.
Gold technical analysis
Gold price has delivered an upside break of the horizontal resistance plotted from January 4 high at $1,865.15 on an hourly scale, which will act as major support ahead. The 20-and 50-period Exponential Moving Averages (EMAs) have delivered a bull cross around $1,840.58, which adds to the upside filters.
Also, the Relative Strength Index (RSI) (14) has shifted into the bullish range of 60.00-80.00, which indicates that the bullish momentum has been triggered.
Gold hourly chart
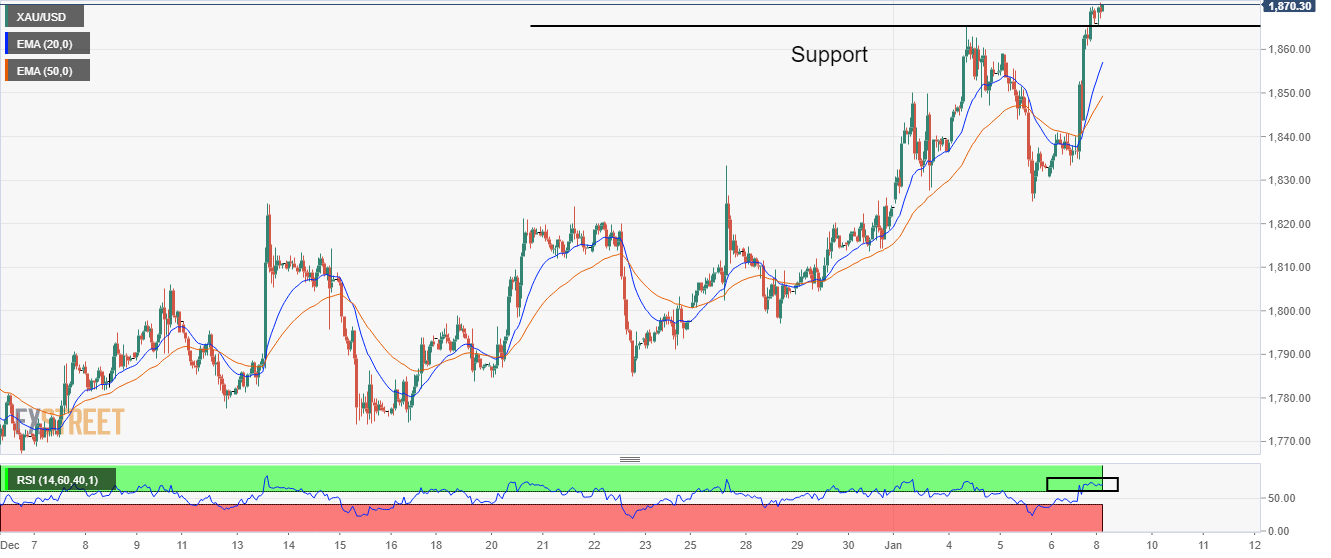
-
01:01
AUD/USD bulls flirt with 0.6900 as firmer sentiment battles with downbeat Aussie data
- AUD/USD grinds higher after filling the week-start gap.
- China-inspired risk-on mood joins downbeat US data to favor AUD/USD bulls.
- Australia Building Permits slumped to -15.1% in November.
- Risk catalysts will be important for immediate directions, US/China inflation figures are the key.
AUD/USD clings to mild gains around 0.6890 as recently downbeat Aussie data probes the previous advances linked to the upbeat risk profile during early Monday. Also likely to have probed the Aussie buyers could be the anxiety ahead of this week’s key inflation data from the US and China.
Australia’s Building Permits dropped to -15.1% YoY in November versus -6.4% prior. Further details suggest that the MoM prints also declined to -9.0% from -5.6% prior (revised from -6.0%), as well as the -1.0% market forecasts.
Elsewhere, market sentiment remains firmer as China reopens national borders after a three-year pause. On the same line could be the early signals suggesting China’s heavy shopping during the festive season, as well as comments from People’s Bank of China (PBOC) Official suggesting optimism surrounding China’s growth conditions.
Adding to the risk-on mood could be the receding odds of the Fed’s aggressive rate hikes, mainly due to the recently downbeat US data, as well as mixed Fedspeak.
That said, US Nonfarm Payrolls (NFP) rose by 223,000 in December compared to the market expectations of 200,000 and November's increase of 256,000 (revised from 263,000). Further details of the US December jobs report revealed that the Unemployment Rate declined to 3.5% from 3.6% in November and 3.7% expected. More importantly, the Average hourly earnings rose 0.3% in December versus 0.4% prior while the YoY figures eased to 4.6% from 4.8% in November.
Further, US ISM Services PMI slumped to the lowest levels in 31 months while suggesting a contraction in activities with 49.6 figures for December, versus the market expectations of 55 and 56.5 marked in November. On the same line, US Factory Orders also slumped, falling 1.8% in November after gaining 0.4% in October.
It should be noted that Atlanta Federal Reserve President Raphael Bostic highlighted the fears of the US economic slowdown while outgoing Chicago Fed President Charles Evans favored a 0.50% rate hike in December. Further, Kansas City Fed President Esther George highlighted inflation fears whereas Richmond Federal Reserve Bank President Thomas Barkin praised the last two months of inflation reports by terming them as “a step in the right direction,” but marked fears from the higher median figures.
Against this backdrop, Wall Street closed positive while the US 10-year Treasury yields dropped 16 basis points (bps) to 3.56%, the lowest levels in three weeks. It’s worth noting that the S&P 500 Futures print 0.20% intraday gains by the press time.
Considering the mixed mood and a light calendar, AUD/USD prices may witness further grinding towards the north, as market sentiment remains firmer. However, the Consumer Price Index (CPI) for December from China and the US, up for publishing on Wednesday and Thursday respectively, will be crucial for the risk barometer pair traders to watch for clear directions.
Technical analysis
A clear upside break of the three-week-old resistance line, around 0.6885 by the press time, becomes necessary for the AUD/USD bull’s conviction. Also acting as upside filters is the 0.6900 round figure and September 2022 high near 0.6920.
-
00:31
Australia Building Permits (YoY) fell from previous -6.4% to -15.1% in November
-
00:30
Australia Building Permits (MoM) below expectations (-1%) in November: Actual (-9%)
-
00:28
EUR/USD Price Analysis: Bulls keep eyes on 1.0700 hurdle
- EUR/USD picks up bids to refresh intraday high, extends Friday’s U-turn from one-month low.
- Upbeat oscillators, clear break of 100-SMA underpin bullish bias.
- Key Fibonacci retracement levels also restrict short-term EUR/USD downside.
- Three-week-old descending resistance line probes buyers ahead of December’s peak.
EUR/USD prints mild gains around 1.0665 as it extends the previous day’s rebound from a one-month low during Monday’s Asian session. In doing so, the major currency pair justifies the upside break of the 100-SMA, as well as the U-turn from the 50% Fibonacci retracement level of its November 21 to December 15 upside.
Also adding strength to the bullish bias could be the upbeat signals from the MACD and firmer RSI (14), not overbought.
As a result, the EUR/USD buyers are well-set to poke a downward-sloping resistance line from mid-December, around 1.0700 by the press time.
However, the previous monthly high surrounding 1.0735 could challenge the bulls afterward.
Following that, a run-up towards the May 2022 peak near 1.0790 and the 1.0800 threshold can’t be ruled out.
Alternatively, the EUR/USD pair’s pullback moves remain elusive unless the quote stays beyond the 100-SMA, currently around 1.0620.
Even so, the 50% and the 61.8% Fibonacci retracement levels, close to 1.0480 and 1.0420 in that order, could challenge the EUR/USD bears.
In a case where the pair remains weak past 1.0420, the odds of witnessing a slump to the November 30 low near 1.0290 can’t be ruled out.
EUR/USD: Four-hour chart

Trend: Further upside expected
-
00:22
USD/JPY aims to shift auction below 132.00 as US slowdown fears escalate
- USD/JPY is aiming to shift its auction below 132.00 after further sell-off in the US Dollar Index.
- Fed Evans supports raising the policy rate by 25 basis points at the Fed's next gathering.
- Japan’s PM Kishida is interested in laying the groundwork for an exit from the BoJ's loose monetary policy.
The USD/JPY pair surrendered the immediate cushion of 132.00 in the early Asian session. The major is likely to shift its auction profile below 132.00 amid sheer volatility in the US Dollar Index (DXY). Trading action could be lower in USD/JPY on Monday as Japanese markets are closed on account of Coming of Age Day.
The risk appetite of the market participants has improved further as the S&P500 futures have extended their upside journey in early trade on Monday. Also, the US Dollar Index (DXY) is sensing more offers after a less-hawkish commentary from Chicago Federal Reserve (Fed) President Evans. The USD Index has extended its downside to near 103.35 and is expected to extend further to near the six-month low around 103.00.
Chicago Fed President Evans quoted in Wall Street Journal (WSJ), “It was possible the economic data would support raising the policy rate by 25 basis points at the Fed's next gathering” as reported by Reuters.
Also, Atlanta Fed bank president Raphael Bostic said on Friday that how the economy evolves will shape what the Federal Reserve has to do, as reported by Reuters. He further warned that "The US economy is definitely slowing" led by a significant reduction in activities in housing and other interest rate sectors. On policy rate projections, the Fed policymaker sees a terminal rate above 5% and a continuation of peak policy rates into CY2024.
On the Tokyo front, Japanese PM Fumio Kishida said on Sunday his government and the Bank of Japan (BoJ) must discuss their relationship in guiding economic policy after he names a new BoJ governor in April, as reported by Reuters. He further added the government may revise its decade-long blueprint with the BoJ that will focus on beating deflation, a move that would lay the groundwork for an exit from the BoJ's ultra-loose monetary policy.
-
00:15
Currencies. Daily history for Friday, January 6, 2023
Pare Closed Change, % AUDUSD 0.6883 1.96 EURJPY 140.589 0.27 EURUSD 1.0644 1.16 GBPJPY 159.725 0.64 GBPUSD 1.20933 1.64 NZDUSD 0.6352 2.09 USDCAD 1.34399 -0.94 USDCHF 0.9275 -0.88 USDJPY 132.074 -0.99 -
00:11
US Dollar Index slides below 104.00 amid China-inspired optimism, mixed Fedspeak ahead of US inflation
- US Dollar Index takes offers to refresh intraday low, extends Friday’s U-turn from one-month high.
- China’s reopening of national border, growth optimism at PBOC underpin risk-on mood.
- Fed officials struggle to defend hawkish bias after recently mixed US data.
- US CPI will be crucial for policy hawks amid chatters of easing inflation fears.
US Dollar Index (DXY) renews its intraday low near 103.75 as it extends the previous day’s U-turn from a three-week high during Monday’s Asian session. In doing so, the DXY bears cheer upbeat sentiment, as well as mixed concerns, surrounding the US Federal Reserve’s (Fed) next move.
That said, the risk-positive headlines from China, one of the world’s biggest commodity users, favor the market’s upbeat sentiment as Beijing reopens national borders after a three-year pause. On the same line could be the early signals suggesting China’s heavy shopping during the festive season, as well as comments from People’s Bank of China (PBOC) Official suggesting optimism surrounding China’s growth conditions.
On the other hand, downbeat prints of the US wage growth, ISM Services PMI and the Factory Orders drowned the Treasury bond yields, as well as the US Dollar Index (DXY) the previous day. However, the headline US Nonfarm Payrolls and Unemployment Rate printed impressive figures for December.
Following the mixed data, Atlanta Federal Reserve President Raphael Bostic highlighted the fears of the US economic slowdown while outgoing Chicago Fed President Charles Evans favored a 0.50% rate hike in December. Further, Kansas City Fed President Esther George highlighted inflation fears whereas Richmond Federal Reserve Bank President Thomas Barkin praised the last two months of inflation reports by terming them as “a step in the right direction,” but marked fears from the higher median figures.
Amid these plays, Wall Street closed positive while the US 10-year Treasury yields dropped 16 basis points (bps) to 3.56%, the lowest levels in three weeks. It’s worth noting that the S&P 500 Futures print 0.20% intraday gains by the press time.
Moving on, the mixed US data and a slump in the United States Treasury bond yields highlight Thursday’s US Consumer Price Index (CPI) for December as firmer inflation numbers could shift focus on hawkish Fed bets and can trigger the DXY’s corrective bounce.
Technical analysis
US Dollar Index extends the previous day’s U-turn from a 200-day EMA hurdle, around 105.62 by the press time, which in turn joins downbeat oscillators to direct DXY bears towards December’s low surrounding 103.40.
-