Notícias do Mercado
-
23:45
New Zealand Food Price Index (MoM) above expectations (0.6%) in August: Actual (1.1%)
-
23:39
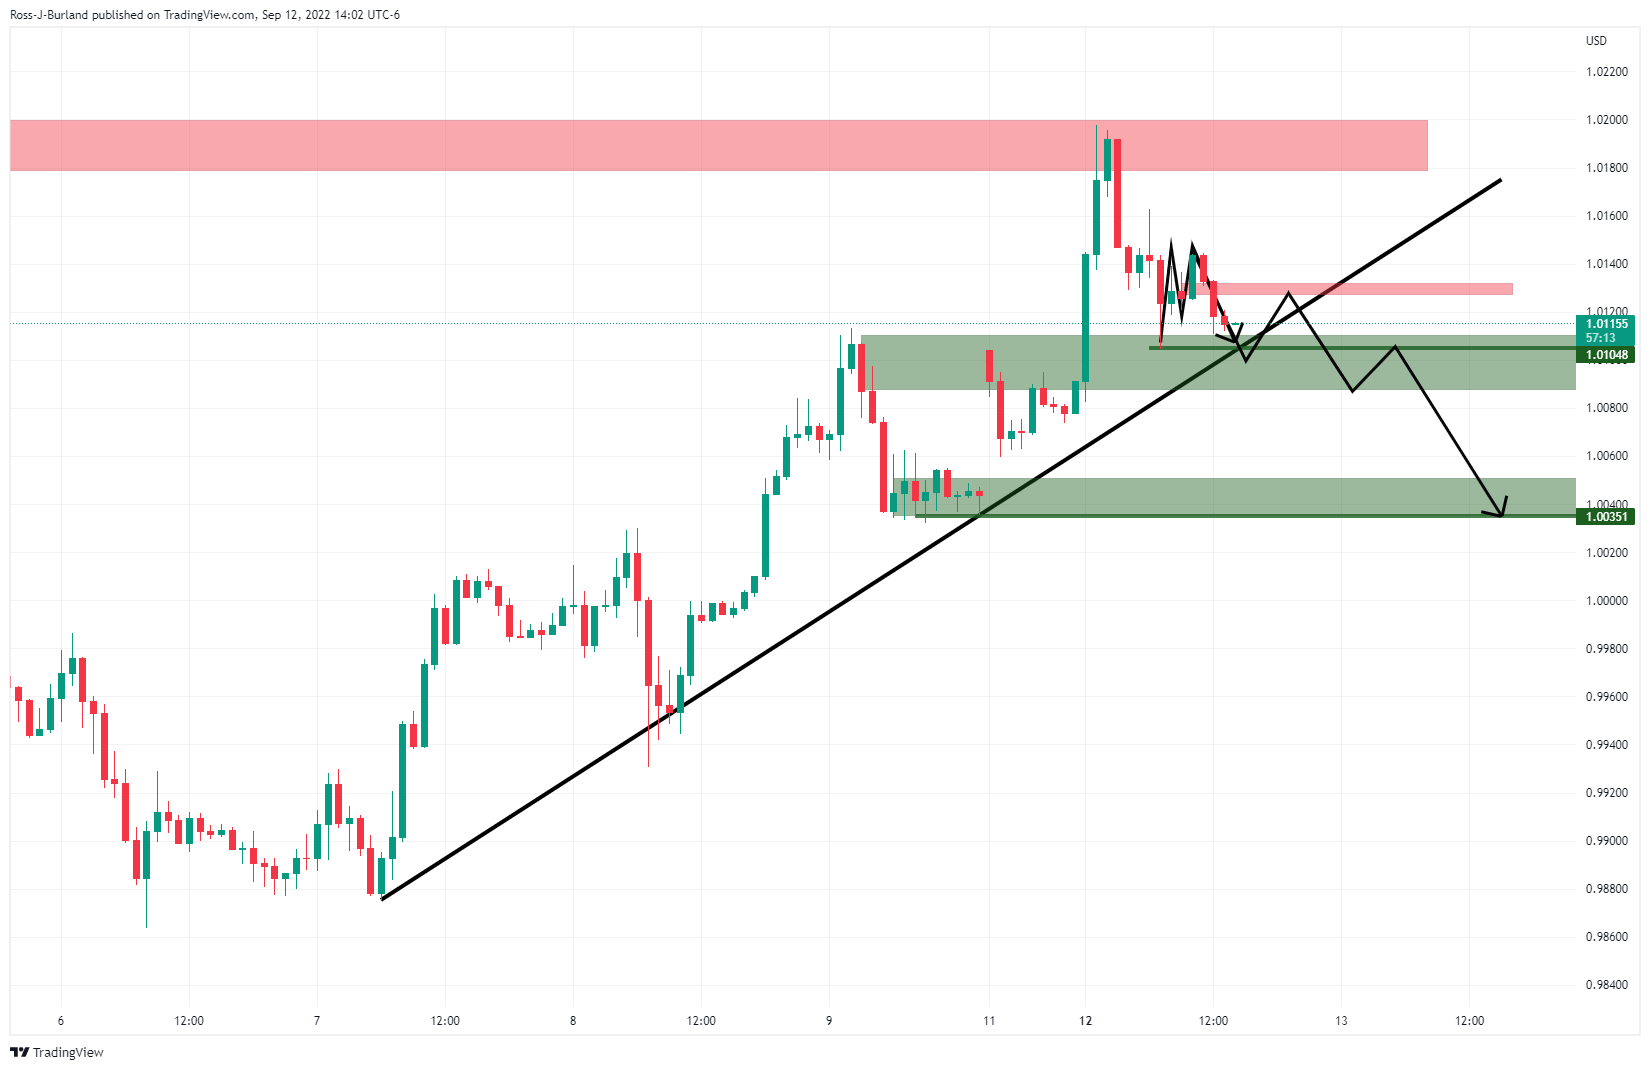
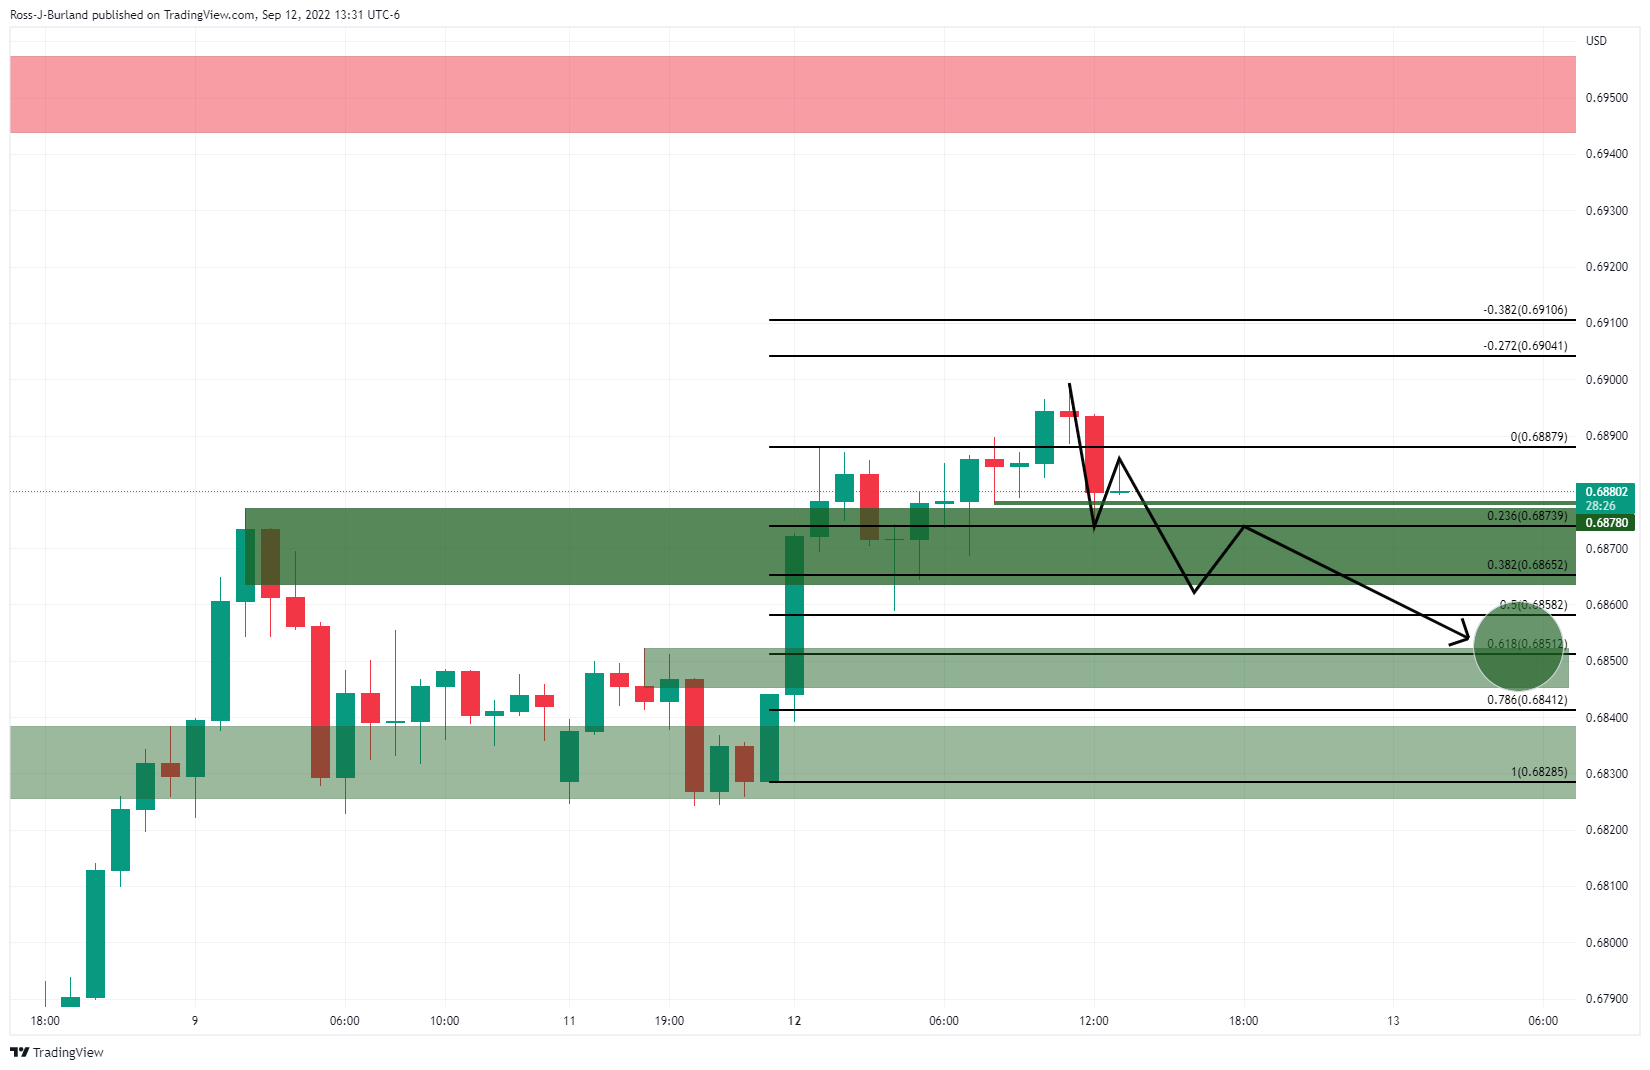
AUD/USD bulls attack 0.6900 with eyes on China’s return, US inflation data
- AUD/USD buyers keep reins at a two-week high, up for the third consecutive day.
- Firmer sentiment, US dollar weakness and hopes from upcoming data favored buyers.
- RBA versus Fed divergence, absence of China seemed to have probed bulls.
- Australia’s NAB sentiment data, US CPI will be crucial ahead of Thursday’s Aussie jobs report.
AUD/USD gains the buyer’s attention as it refreshes a fortnight high around 0.6900 ahead of the all-important US inflation data. Also keeping the Aussie pair on the watch is the return of China after a long weekend, as well as Thursday’s employment data from the Pacific major.
The Aussie pair cheered broad weakness in the US dollar, as well as the risk-on mood, to portray a positive start to the key week. The underlying reasons include geopolitical and stimulus-linked expectations/news surrounding China and Russia. Also keeping the quote positive were the hopes that the global policymakers will be able to overcome the latest economic pessimism, even at higher rates.
Chatters that Ukraine is gaining success in pushing back the Russian military from some of its battlegrounds seem to have underpinned the market’s cautious optimism, even as the same raised the fears of Russia’s harsh retaliation. On the same line could be the hopes of more stimulus from major economies like China, the US, the UK and Europe. Furthermore, the latest news from the Wall Street Journal (WSJ) suggesting that the US gas prices are down for the 13th consecutive week also eased the market’s pressure and favored the risk-on mood, as well as the gold price.
Additionally, upbeat prices of metals, especially iron ore and gold, seemed to have joined the firmer Wall Street to favor the AUD/USD bulls. It should be noted, however, that the yields were up but could not underpin the US dollar recovery and hence propelled the Aussie pair.
That said, the US Dollar Index (DXY) printed a four-day downtrend to fall to the lowest levels in a fortnight, around 108.30 at the latest.
Looking forward, the August month sentiment gauges from the National Australia Bank (NAB) could immediate direction to the AUD/USD prices. However, major attention will be given to the US Consumer Price Index (CPI) for the stated month and Thursday’s release of Australia’s employment data. The forecasts suggest the headline number ease to -0.1% MoM versus 0.0% prior while the CPI ex Food & Energy is likely to remain unchanged at 0.3% MoM.
Also read: US CPI Preview: Dollar set to climb on low core expectations, three scenarios
Technical analysis
A clear upside break of the one-month-old descending trend line, around 0.6865 by the press time, seeks validation from the 200-SMA hurdle surrounding 0.6920 to convince the AUD/USD bulls.
-
23:32
NZD/USD Price Analysis: Bulls prepare for an impulsive wave, 0.6160 a key hurdle
- Investors brace for a breakout of an Ascending Triangle for a sheer upside.
- A golden cross, represented by 50-and 200-EMAs at 0.6100, adds to the upside filters.
- The upside momentum will get triggered if the RSI (14) recaptures the 60.00-80.00 range.
The NZD/USD pair is displaying back-and-forth moves in a narrow range of 0.6132-0.6140 in the early Tokyo session ahead of the US Consumer Price Index (CPI) data. The asset displayed exhaustion signals on Monday after failing to sustain above the prior week’s high at 0.6152. Broadly, the asset is advancing sharply higher after printing a fresh two-year low around 0.6000 last week.
On an hourly scale, the major is on the verge of delivering a breakout of the Ascending Triangle chart pattern. The upward sloping trendline of the above-mentioned chart pattern is placed from Friday’s low at 0.6031 while the horizontal resistance is plotted from August 31 high at 0.6160. A breakout of the bullish-bias triangle pattern will expand volatility and will display wider ticks and heavy volume.
A golden cross, represented by the 50-and 200-period Exponential Moving Averages (EMAs) at 0.6100, has underpinned the kiwi bulls against the greenback.
The Relative Strength Index (RSI) (14) has slipped below the bullish range of 60.00-80.00, which warrants a mild correction so that more participants could ride with the impulsive wave.
Should the asset break above Monday’s high at 0.6159 decisively, the antipodean will drive the asset towards August 25 high at 0.6252. A breach of the latter will send the major towards the round-level hurdle at 0.6300.
On the flip side, the kiwi bulls could lose their grip if the asset drops below September 2 low at 0.6050. An occurrence of the same will drag the asset towards the psychological support at 0.6000, followed by 20 April 2020 low at 0.5910.
NZD/USD hourly chart
-637986186658811742.png)
-
23:23
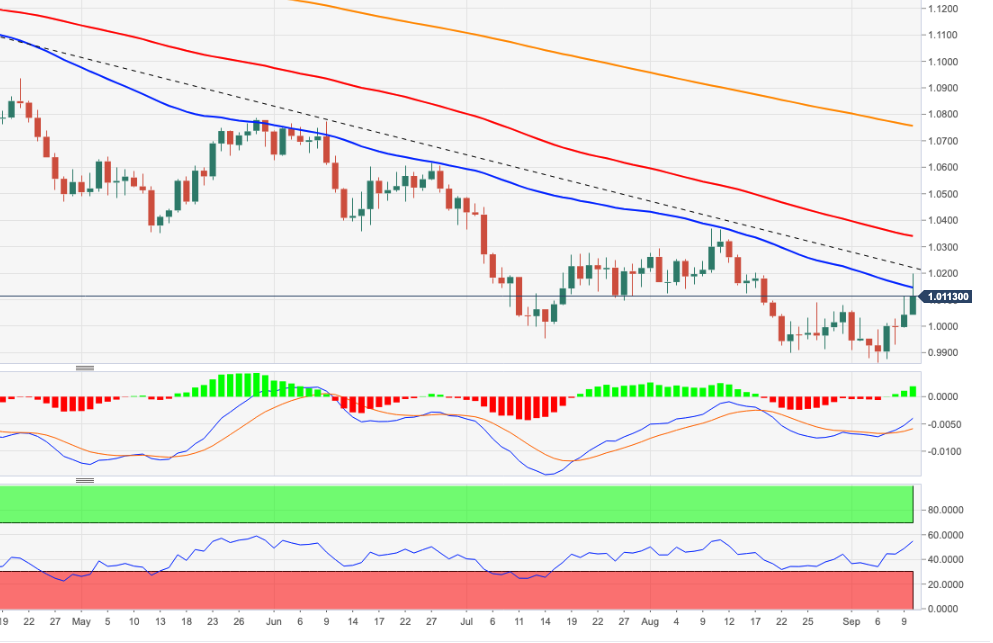
Gold Price Forecast: XAU/USD jostles with $1,730 hurdle ahead of US inflation
- Gold price remains firmer around fortnight high, pokes 21-DMA resistance.
- Risk-on mood, softer US dollar underpin XAU/USD recovery ahead of the key US CPI.
- Headlines surrounding Russia, light calendar and stimulus hopes favored risk-on mood.
- Firmer US inflation data could recall US dollar bulls but absence of Fedspeak may restrict the fall.
Gold price (XAU/USD) grinds higher around a fortnight top after a two-day uptrend to $1,725 as traders await the all-important US Consumer Price Index (CPI) on Tuesday. The metal’s latest gains could be linked to the market’s optimism and likely preparations for today’s inflation numbers.
Chatters that Ukraine is gaining success in pushing back the Russian military from some of its battlegrounds seem to have underpinned the market’s cautious optimism, even as the same raised the fears of Russia’s harsh retaliation. On the same line could be the hopes of more stimulus from major economies like China, the US, the UK and Europe. It’s worth noting that a holiday in China and a light calendar could also be linked to the XAU/USD’s rebound as the absence of covid/economic woes from Beijing may have helped the metal prices. Furthermore, the latest news from the Wall Street Journal (WSJ) suggesting that the US gas prices are down for the 13th consecutive week also eased the market’s pressure and favored the risk-on mood, as well as the gold price.
Elsewhere, the policymakers from the US Federal Reserve and the European Central Bank (ECB) remain hawkish but the recent softening of the headline economics and the inflation expectations seemed to have pushed back the gold bears amid a light calendar.
Amid these plays, Wall Street printed another day of gains even as the US Treasury yields were on the rise, up five basis points (bps) to 3.36% at the latest. The same weighed on the US Dollar Index (DXY) and drowned the greenback gauge towards printing the four-day downtrend.
Moving on, US CPI for August becomes crucial after the latest softness in the price pressure. The forecasts suggest the headline number ease to -0.1% MoM versus 0.0% prior while the CPI ex Food & Energy is likely to remain unchanged at 0.3% MoM. If the inflation numbers arrive softer the US dollar may have a further downside to track, which in turn can help the XAU/USD to remain firmer.
Also read: Gold forms a reversal
Technical analysis
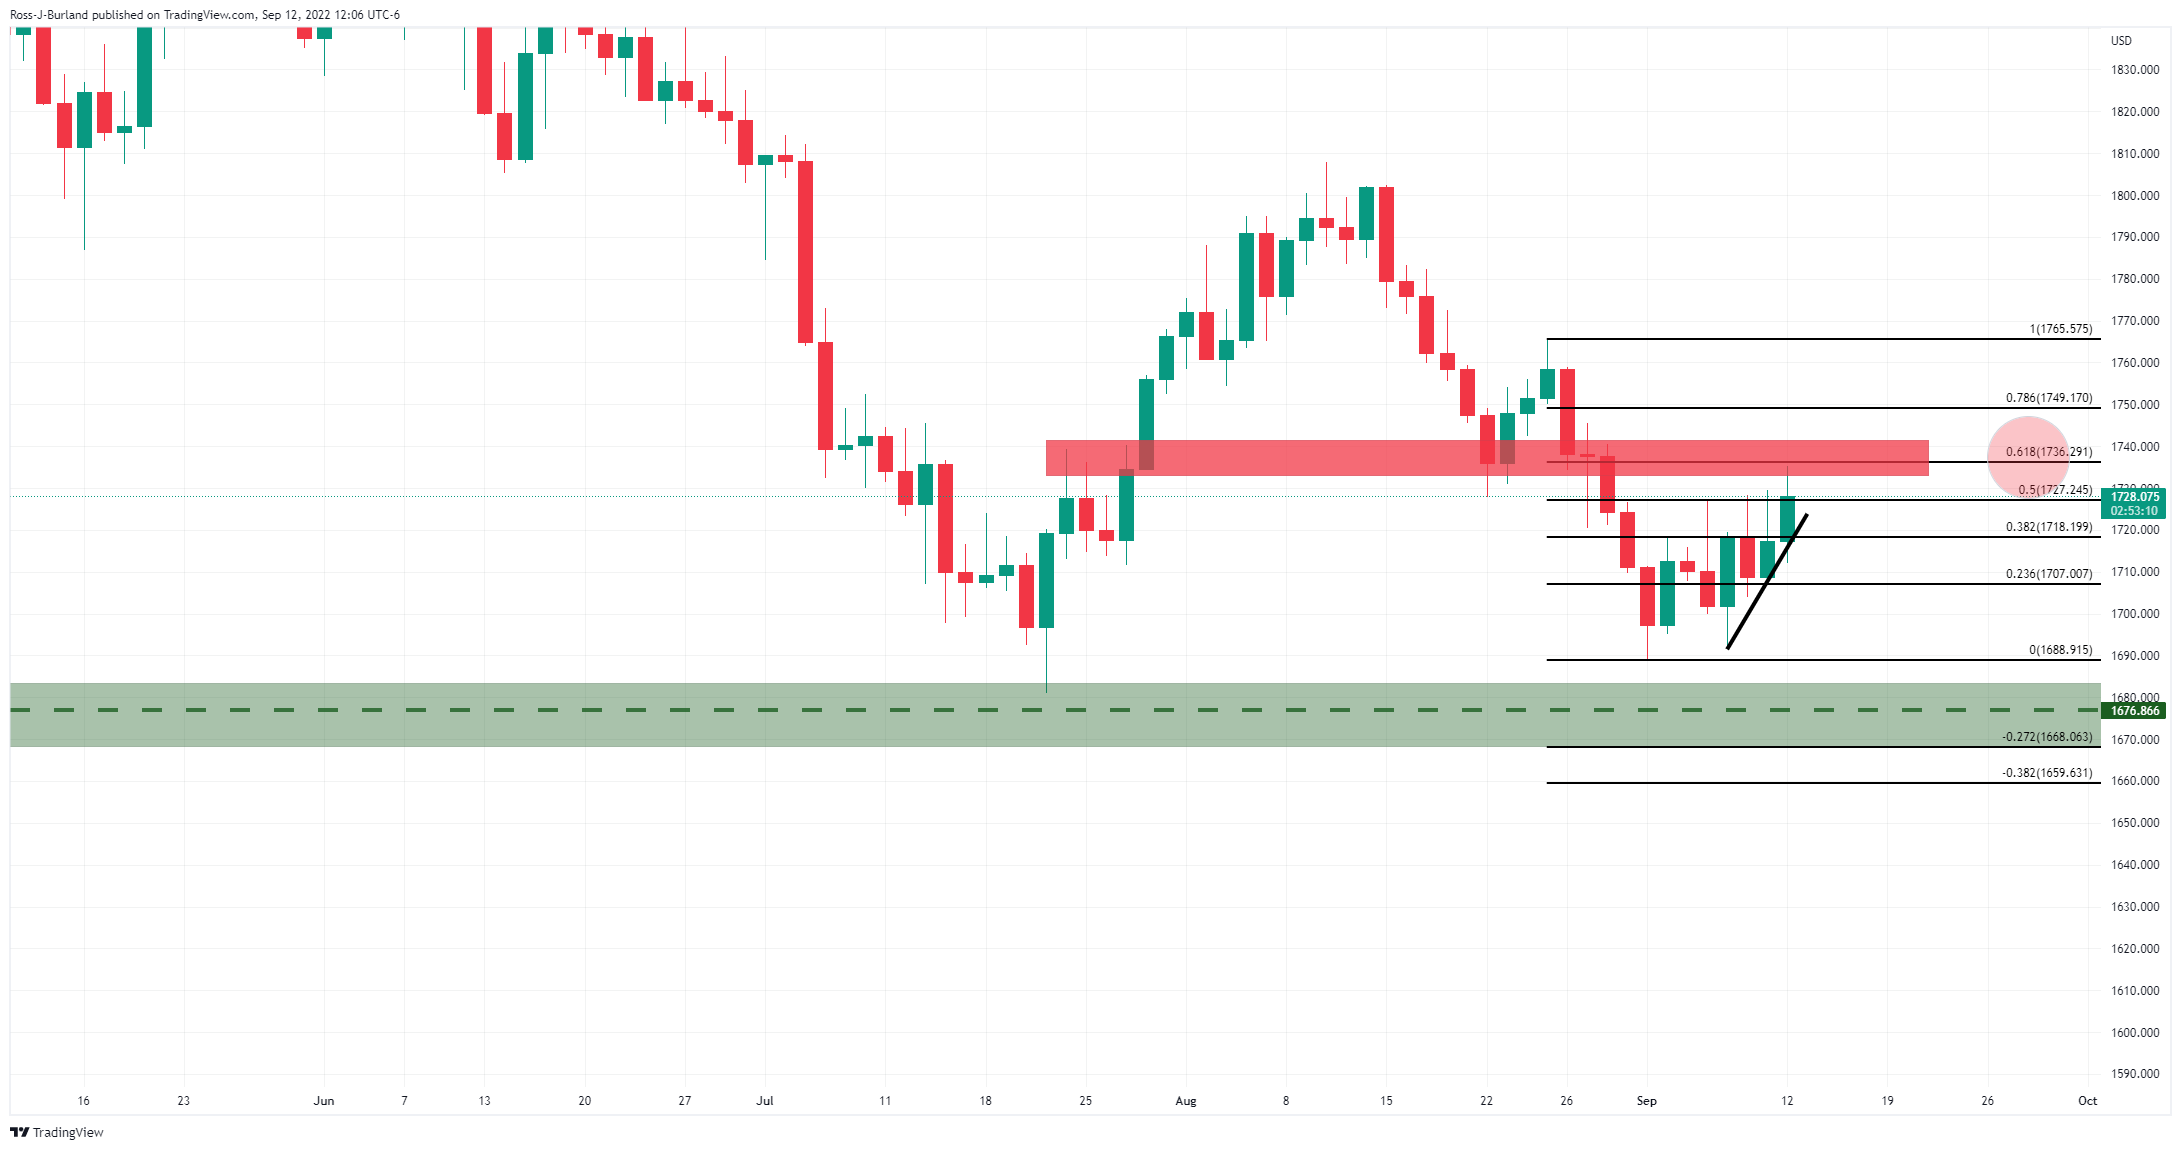
Gold justifies an impending bull cross on the MACD and a price-positive trend line breakout of the RSI (14) as it pokes the 21-DMA hurdle surrounding $1,731.
With this, the XAU/USD prices are likely to overcome the immediate DMA resistance and aim for the 38.2% Fibonacci retracement level of April-July downside, near $1,756.
However, the metal’s upside past $1,756 appears doubtful as a three-month-old descending resistance line could challenge the gold buyers at around $1,768.
On the contrary, multiple supports around the $1,700 threshold could challenge the pair’s downside moves ahead of directing XAU/USD bears towards the yearly low near $1,680.
Following that, the 61.8% Fibonacci Expansion (FE) of the metal’s moves from late April to early August, around $1,660, will be in focus.
Gold: Daily chart
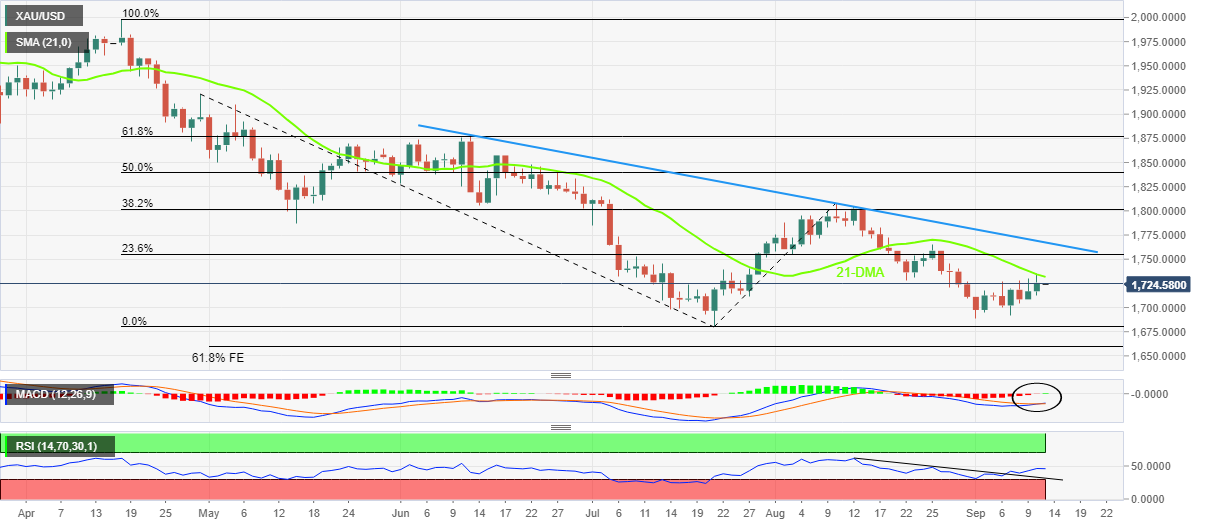
Trend: Further recovery expected
-
22:59
GBP/USD turns sideways after a downside move from 1.1700, US Inflation in focus
- GBP/USD is juggling around 1.1680 ahead of US Inflation and UK Employment data.
- The lower inflation situation will force the Fed policymakers to scale down their ‘hawkish tone.
- The UK jobless rate is seen as stable at 3.8% and an improvement in the labor cost index is music to the ears.
The GBP/USD pair is displaying a lackluster performance in the early Tokyo session as investors are awaiting the release of the US Consumer Price Index (CPI) data. The cable is oscillating in a narrow range of 1.1675-1.1685, followed by a decline after facing barricades around the critical resistance of 1.1700. The asset has displayed exhaustion signals while attempting to cross the round-level resistance of 1.1700, which indicates a minor correction ahead.
Considering the market estimates, the plain-vanilla CPI figure is seen at 8.1%, lower than the prior release of 8.5%. As gasoline prices have witnessed a serious decline, and the price pressures have started responding inversely to the higher interest rates, the forecasts for interest rates have trimmed dramatically. Adding to that, the core CPI that doesn’t inculcate food and energy prices is expected to rise to 6% vs. the 5.9% reported earlier.
There is no denying the fact that the Federal Reserve (Fed) will stick to its ‘hawkish’ stance on interest rates as the road destined to reach the desired inflation rate of 2% is far from over. However, a decline in the inflationary pressures will scale down the ‘hawkish’ tone as the Fed would have the luxury to go slow due to the decent response shown by the price rise index on interest rates.
On the UK front, investors are looking for employment data, which will have a significant impact on pound bulls. The Unemployment Rate is expected to remain unchanged at 3.8%. While the number of individuals claiming jobless benefits will decline by 9.2k. The Average Earnings data will improve significantly by 5% vs. 4.7%, which will support the households to offset the higher payouts led by soaring inflation.
-
22:19
Forex Today: US dollar longs squeezed ahead of US CPI
Here is what you need to know for Tuesday September 13:
It was a poor day for the greenback that fell to the worst level in more than two weeks against a basket of currencies at the start of the week. The dollar index, DXY, which measures the currency against six major counterparts, softened despite the firm anticipation that the Federal Reserve will hike interest rates by 75 basis points at its Sept. 20-21 meeting.
The sentiment had sent the index to a two-decade peak of 110.79 last Wednesday, but it fell to its lowest point since Aug. 26 at 107.81 ahead of Tuesday's US Consumer Price Index. The headline Consumer Price Index in the United States is expected to fall to 8% year on year in August, while the core measure, which excludes food and energy, is expected to rise.
Meanwhile, fueling the drop in the DXY, the euro climbed to more than a three-week high against the dollar, with European Central Bank officials calling for additional aggressive monetary tightening. Also, there was some news that Ukrainian forces have made significant progress in pushing back Russian troops and that too has supported a better tone across European markets. The European common currency rose around 1.5% to 1.0198, its highest since August. 17, and well up from a 20-year lows of 0.9862 scored last week.
AUD/USD started off the week better bid and is up some 0.61% in late North America trade after giving back territory from the highs scored at the start of the shift near 0.69 the figure. The currency pair rallied from 0.6824 and remains in bullish territory due to the softness of the greenback.
As for the yen, the greenback was up slightly against the Japanese currency with the pair meeting 143.50, but off its 24-year high of 144.99 hit last week. Traders are on the lookout for Japanese officials hinting at intervention to stop the currency from weakening further. On the weekend, a senior official of the government said in a local television interview that the administration must take steps as needed to counter excessive yen declines. However, the Bank of Japan's ultra-accommodative stance is expected to remain unchanged at its next scheduled meeting on Sept. 21-22.
The CAD rose to 1.2963 from 1.3045 and with no Canadian data that had been scheduled for release on Monday, the focus remained on the Bank of Canada's recent hike of 75 basis points. The central bank said more tightening will likely be needed to bring down inflation. The next BOC meeting is scheduled for Oct. 26.
As for the pound, this rose to 1.1710 from 1.1600. UK industrial production fell slightly in July after a larger June decline, though manufacturing output rebounded modestly after a June drop, data released earlier Monday showed. Looking ahead, UK employment data is scheduled for release on Tuesday followed by inflation data on Wednesday and retail sales on Friday. Those awaiting the Bank of England's monetary policy meeting will need to now hold on until Sept. 22 due to the 10-day mourning period following the passing of Queen Elizabeth II.
Elsewhere, The main US indexes have now risen four straight days. Cryptocurrency investment products and funds, on the other hand, saw total outflows for a fifth straight week, totalling $63 million in the week ended Sept. 9, according to a report from digital asset manager CoinShares on Monday. Cryptocurrency investment products and funds saw total outflows for a fifth straight week, totalling $63 million in the week ended Sept. 9.
The gold price, meanwhile, has rallied at the start of the week in a move that was forecasted in the weekly pre-open analysis here: Gold Price Forecast: XAU/USD bulls eye a 61.8% golden ratio daily target. At the time of writing, gold was 0.75% higher on the day having travelled from a low of $1,712.04 to a high of $1,735.18 so far, piercing into the 61.8% Fibonacci of the daily bear impulse.
-
EUR/USD Price Analysis: Bears eye a move to 1.0050
-
AUD/USD bulls meet strong resistance at 0.69 the figure
- Gold Price Forecast: XAU/USD bulls are in control and take on a key resistance area
-
-
21:20
EUR/USD Price Analysis: Bears eye a move to 1.0050
- EUR/USD bears are lurking within a key peak formation.
- 1.0050 is eyed for the day ahead if the price remains below 1.0130.
EUR/USD has been higher by some 0.7% in late North American trade as the bulls commit to trendline support, so far. However, the single currency is well below the start of the week's highs and peak formations are being printed on the hourly chart. The following illustrates a bearish bias from a short-term perspective as markets await the US inflation data on Tuesday:
EUR/USD H1 chart
The price has formed a peak formation near 1.0200 and again at 1.0150 with the M-formations. While below 1.0130, this leaves the focus on the downside for the sessions ahead. The above chart illustrates the potential flight path for the single currency with 1.0050/35 eyed as a potential downside target and structure respectively.
First, 1.0105 needs to give. A retest of the current M-formation's neckline could be first in line and if that were to hold, the bears will have the ammunition required to take on the bull's commitments around 101 the figure.
-
20:36
AUD/USD bulls meet strong resistance at 0.69 the figure
- AUD/USD is back under pressure following an extension of the bullish correction.
- Bears eye a move below 0.6880 for the day ahead.
AUD/USD started off the week better bid and is up some 0.61% in late North America trade after giving back territory from the highs scored at the start of the shift near 0.69 the figure. The currency pair rallied from 0.6824 and remains in bullish territory due to the softness in the greenback that is enabling the commodity sector some airtime.
DXY recoiled further to its lowest level since late August and after trading at a new cycle high Wednesday near 110.786 as per the DXY index. It is down for the fourth straight day and trading near 108.30 at the time of writing, after falling from a high of 108.86 and printing a low of 107.81.
Risk sentiment remains strong as the week gets underway which is weighing on the US dollar. However, the mood has left some analysts scratching their heads. Those at Brown Brothers Harriman argued ''it’s hard to see a reason for buying risk assets when the ECB is adding to the global headwinds. With its 75 bp hike last week with more to come, this means global liquidity is being withdrawn even faster than before.''
The analysts noted that the Reserve Bank of Australia and the Bank of Canada also hiked big last week, while the Bank of England is expected to join the ranks of the jumbo movers this week. ''Global growth is undoubtedly slowing and it remains to be seen whether any of these banks can engineer a soft landing.''
Meanwhile, the Aussie calendar will be lit up this week by the employment report. ''After the huge disappointment last month, August jobs report may show some modest improvement as indicators of labour demand (e.g., job ads) remain strong'' analysts at TD Securities argued.
''However, we see downside risk if COVID-related disruptions on the labour market persist. A poor jobs report likely seals the outcome for a 25bps hike (TD: 25bps) in October after the Governor struck a dovish tone last week.''
AUD/USD technical analysis
As per the pre-market analysis at the start of the week, the Aussie has rallied from the 0.6820's:
In the prior analysis above, the 0.6820s was eyed as a potential support area from which AUD/USD bulls would be attracted in for a discount to take the price on for a deeper correction of the prior downtrend, as follows:
The price has made headway, but 0.6900 is standing in the way currently. From a 1-hour basis, a peak formation is forming and threatens to send the price into the 0.6850s for the day ahead on a break of 0.6880 structure:
The doji followed by the bearish engulfing is compelling as a topping formation that exposes the 61.8% Fibo of the prior bullish impulse that meets the prior resistance structure.
-
19:16
Gold Price Forecast: XAU/USD bulls are in control and take on a key resistance area
- Gold bulls are taking control as they move in on a critical technical level on the charts.
- The markets are awaiting the US CPI data on Tuesday for clues.
The gold price has rallied at the start of the week in a move that was forecasted in the weekly pre-open analysis here: Gold Price Forecast: XAU/USD bulls eye a 61.8% golden ratio daily target. At the time of writing, gold is 0.75% higher on the day having travelled from a low of $1,712.04 to a high of $1,735.18 so far, piercing into the 61.8% Fibonacci of the daily bear impulse.
A weaker USD saw commodity markets recover some of the losses at the start of this week and gold has been no exception, despite expectations of another aggressive rate hike by the Federal Reserve next week.
However, a weaker USD has improved investor appetite. US stocks rose along with gold and crude oil futures after midday on Monday, while government bond yields fell with the dollar index. The US 10-year rate slipped 3.262% intraday from 3.346% while the dollar index weakened against a basket of currencies, including the euro, falling 0.8% to 107.81.
With no data released on Monday, the focus is on Tuesday's US Consumer Price Index for August. Core prices likely stayed firm in August, with the series registering another 0.3% MoM gain, analysts at TD Securities expect. ''Our MoM forecasts imply 8.0%/6.0% YoY for total/core prices.'' That would be slower than the 8.5% pace in July.
Markets are seeking further evidence inflation has peaked in the US and the data will be important for the direction of yields, gold and the greenback. However, Federal Reserve officials said last week that more than a few months of consistently lower readings will be needed to assure that price increases have reliably slowed.
Fed officials are in the so-called quiet period through the Sept. 20-21 Federal Open Market Committee meeting. It remains in place until Chair Powell’s post-decision press conference on September 21. WIRP suggests over 90% odds of a 75 bp hike.
''Overall, we continue to expect that while rates markets appear to be nearing a fair pricing for Fed funds, precious metals' price action is still not consistent with their historical performance when hiking cycles enter into a restrictive rates regime,'' analysts at TD Securities said. ''Indeed, gold and silver prices have tended to display a systematic underperformance when markets expect the real level of the Fed funds rate to rise above the neutral rate, as estimated by Laubach-Williams. We expect continued outflows from money managers and ETF holdings to weigh on prices, which will ultimately raise the pressure on a small number of family offices and proprietary trading shops to capitulate on their complacent length in gold.''
Gold technical analysis
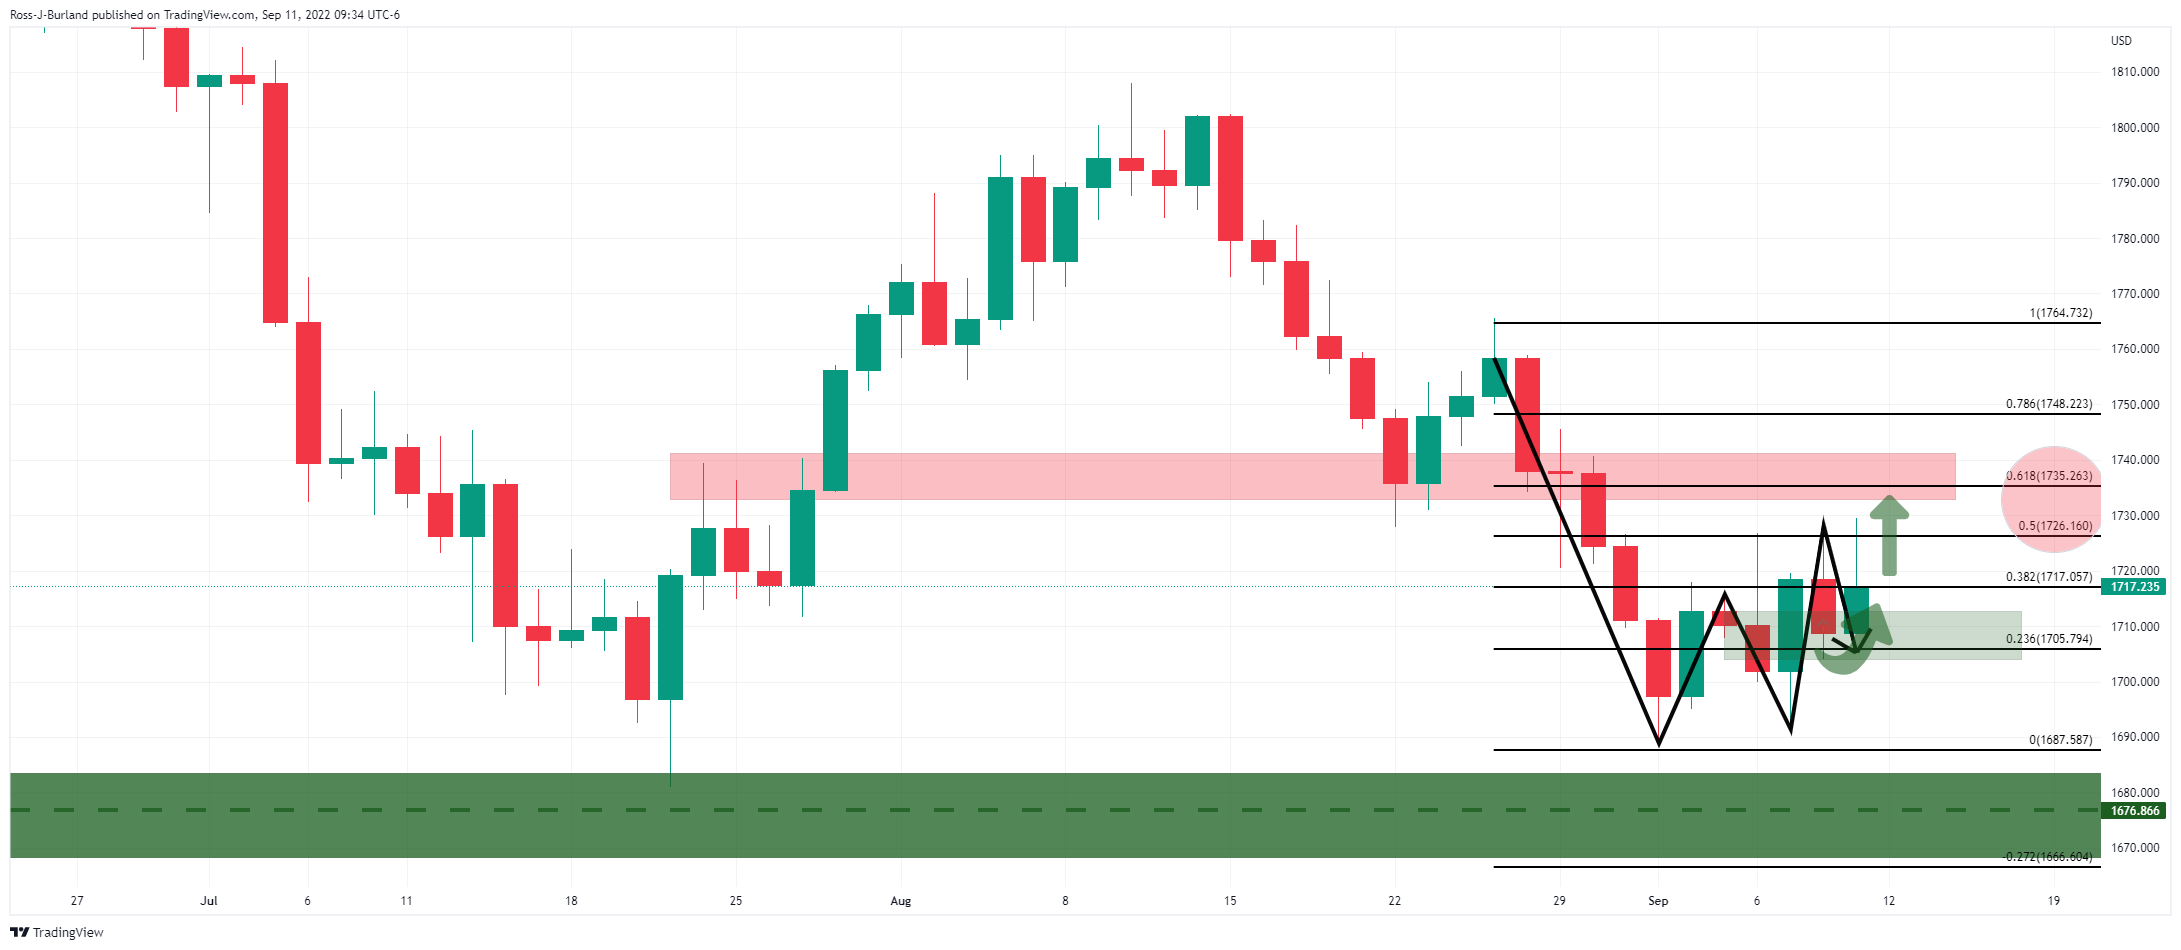
As per the per-open analysis, gold has moved higher into the key 61.8% golden ratio:
(Gold, daily chart: Before and after)
Gold weekly chart
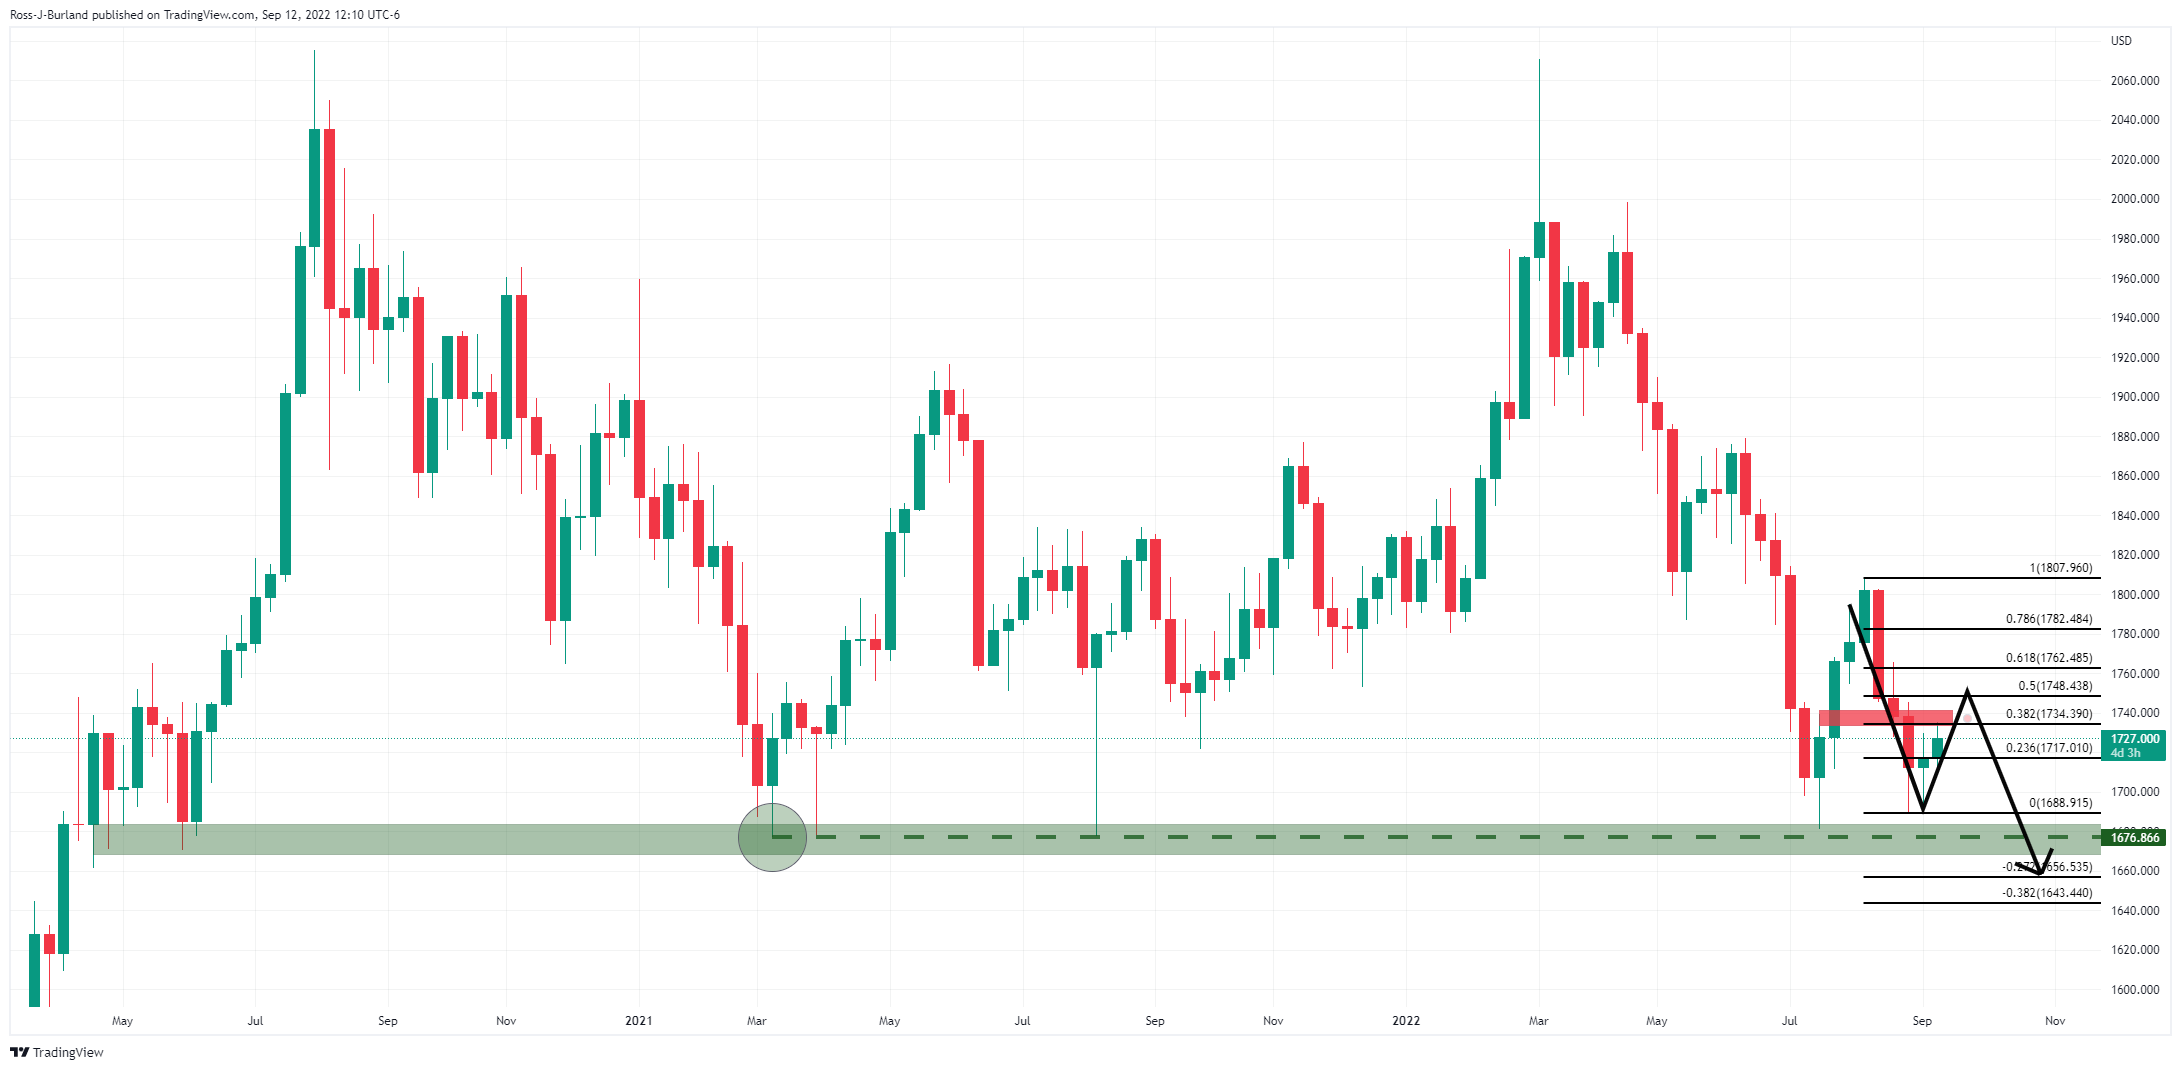
The weekly outlook remains bullish as the price embarks on a test of the 38.2% Fibonacci level with potentially some more fuel left in the tank. There are prospects of a deeper correction towards $1,750 or even as high as the weekly 61.8% ratio near $1,763. However, signs of deceleration at this current confluence Fibo area could lead to a move lower and in any respect, the bears will be keen on a test of the $1,676 lows in due course.
-
18:18
United States 10-Year Note Auction climbed from previous 2.755% to 3.33%
-
17:14
US: August CPI to show consumers received further relief – Wells Fargo
On Tuesday, key inflation data is due in the US. The August CPI print will be watched closely by market participants ahead of the next FOMC meeting to be held September 20-21. According to analysts at Wells Fargo, the CPI will show a decline of 0.2% in August, on the back of a further plunge in gasoline prices.
Key Quotes:
“Consumer price inflation surprised to the downside in July, driven by a big drop in energy prices and a sharp slowdown in both core goods and services. We expect Tuesday's report to show consumers received further relief on the inflation front in August. Specifically, we look for prices to have declined 0.2% last month, which would be the largest monthly drop since the spring of 2020.”
“A further plunge in gasoline prices is expected to lead the headline lower, while additional giveback in travel services and used cars should help hold the core to a 0.4% month-over-month increase.”
“The FOMC has been singularly focused on inflation of late, and Tuesday's CPI print will be important in shaping the Fed's latest thinking ahead of its next meeting. While we expect the FOMC to be encouraged by the downshift in inflation since June, core prices continue to advance well ahead of the Fed's target. Lower commodity prices in recent months and easing of supply chain bottlenecks point to inflation cooling in the months ahead, but the still-strong rate of labor cost growth suggests that it will not be easy to return inflation to the Fed's target on a sustained basis.”
-
16:35
United States 3-Year Note Auction: 3.564% vs 3.202%
-
16:19
GBP/USD prints fresh weekly highs above 1.1700
- UK growth positive in July, but below expectations.
- Attention turns to US inflation numbers.
- GBP/USD up for the second day in a row, tests the 20-day SMA.
The GBP/USD is rising on Monday and during the American session climbed to 1.1709, reaching the highest level since August 30. Cable remains near the top, holding onto daily gains and a bullish bias in the very near term.
The pound continues to recover from multi-year lows against the US dollar. It is testing the 20-day Simple Moving Average and a consolidation above could open the doors to a more sustainable recovery.
Weak dollar ahead of CPIs
The US dollar is falling across the board on Monday hit by an improvement in risk sentiment and steady US yields. The DXY is falling by 0.75%, hovering around 0108.15. The US 10-year yield stands at 3.28% and the 2*-year at 3.52%. The Dow Jones rises by 0.90% and the S&P 1%, adding to last week’s gains.
On Tuesday, August US CPI numbers are due. A 0.1% decline is expected on the monthly reading and a slide in the annual rate from 8.5% to 8.1%. The report will be relevant for Federal Reserve rate hike expectations ahead of the FOMC meeting next week. The Bank of England will also have its meeting next week (postponed due the Queen’s death).
In the UK, July growth data showed a recovery from the 0.6% June contraction with a 0.2% expansion. The figure was below expectations. On Tuesday labor data is due and the CPI on Wednesday.
Technical levels
-
16:05
NY Fed: 1-year consumer inflation expectations fall to 10-month low of 5.75%
The Federal Reserve Bank of New York's monthly Survey of Consumer Expectations showed on Monday that the US consumers' one-year inflation expectation declined to a new 10-month low of 5.7% in August from 6.2% in July, as reported by Reuters.
Consumers' 3-year inflation expectation declined to the lowest in nearly two years at 2.8% in August from 3.2% in July.
Moreover, the publication revealed that consumers saw a lower chance of losing a job in August than in July and a higher likelihood of finding a new job should they lose one. Additionally, consumers in August saw the lowest chance of quitting their current job since March 2021.
Market reaction
The greenback struggles to find demand after this report and the US Dollar Index was last seen losing 0.72% on a daily basis at 108.18.
-
15:59
US CPI Preview: Forecasts from 12 major banks, inflation begins to ease
The US Bureau of Labor Statistics will release the Consumer Price Index (CPI) data for August on Tuesday, September 12 at 12:30 GMT and as we get closer to the release time, here are the forecasts by the economists and researchers of 12 major banks regarding the upcoming US inflation print.
On a monthly basis, the CPI is expected to decline by 0.1%. The Core CPI, which excludes volatile food and energy prices, is forecast to stay unchanged at 0.3%. On a yearly basis, the CPI figure is expected to have eased to 8.1% in August, from 8.5% printed a month earlier. Meanwhile, the Core CPI is forecast at 6% from 5.9%.
ANZ
“We expect US core CPI to rise by 0.4% MoM in August and headline inflation to be flat for the second straight month with falling energy prices dragging headline down.”
Commerzbank
“Overall, we expect consumer prices to stagnate in August (consensus -0.1%). The annual inflation rate is thus likely to have fallen to 8.1%. Even though the peak in the inflation rate is probably behind us, it is nevertheless too early to sound the all-clear. This is because the recent decline in the inflation rate is mainly attributable to volatile components such as energy prices. By contrast, the sharp rise in rents, the most important component of the consumer price index, is likely to continue for the time being. As a result, the core rate of inflation should actually increase to 6.2% in August.”
ING
“CPI should show headline inflation being depressed by lower gasoline prices, but core inflation is likely to rise to 6.1% from 5.9%.”
TDS
“Our estimate for August is -0.2%/0.3% MoM for headline/core CPI; we see more risk of 0.2% than 0.4% for the core series (0.28% unrounded). On a YoY basis, we look for inflation to slow to 8.0% YoY for the headline, but to pick up slightly to 6.0% for the core.”
SocGen
“For August, we expect the headline CPI to fall 0.1% MoM due to a plunge in gasoline prices from a high. Early September gasoline prices are still falling, implying a weak headline figure for September too. Headline inflation rates peaked at 9.1% in June, fell to 8.5% in July and should register 8.1% in August. We expect the headline CPI to fall below 7% by year-end, but uncertainty over energy prices clouds that projection. Our core-CPI forecast is 0.4% MoM. That projection is based on a 0.6% shelter cost increase that is offset by weak pricing for apparel, motor vehicles and public transportation. These latter categories have been volatile. We expect weak auto pricing in the quarters ahead, but the still tight inventory readings, which have been limited by semiconductors, mean that the monthly forecasts are more uncertain.”
NBF
“Headline prices could have decreased 0.2% moM, their biggest drop since April 2020. If we’re right, the year-on-year rate should come down to 7.9% from 8.5%. Core prices, meanwhile, may have continued to be supported by rising rent prices and advanced 0.3%. This would translate into a two-tick increase of the 12-month rate to 6.1%.”
Westpac
“We forecast +0.2% for core and -0.2% for headline. If achieved though, it should not be assumed that October and beyond will see repeats, with volatility likely to persist.”
Deutsche Bank
“We expect a slight decline in the headline CPI number (-0.09% MoM) but an acceleration of +0.30% in core, which would continue the pattern from July's reading (unchanged and +0.3%, respectively) which came in lower than expected. We believe the YoY headline CPI should fall five-tenths to 8.0%, while core should tick up a tenth to 6.0%.”
CIBC
“The relief from higher prices at the pump extended into August and should result in cooling in annual inflation to 8.0%. While global indices of food prices have pulled back lately, that may take longer to feed through to the CPI. Although there was a sharp drop in used car prices, continued pressure from housing costs likely resulted in a 0.3% monthly rise in core prices, leaving the annual rate a tick hotter at 6.0%, magnified by base effects. We expect the annual inflation readings to look a touch softer than the consensus, but that won’t matter for the Fed given the still-elevated readings.”
BofA
“We look for headline CPI to decline by 0.1% MoM, its first decline since May 2020, and for core CPI to advance by 0.3% MoM. This would leave headline and core CPI up 8.2% and 6.0% YoY, respectively.”
Citibank
“US August CPI MoM – Citi: -0.1%, prior: 0.0%; CPI YoY – Citi: 8.0%, prior: 8.5%; CPI ex Food, Energy MoM – Citi: 0.4%, prior: 0.3%; CPI ex Food, Energy YoY – Citi: 6.1%, prior: 5.9%. In the last key CPI release ahead of the September FOMC meeting, it will be particularly important for this release to assess details underlying another ‘softer’ core inflation print, as there are notable downside risks relative to expectations. However, the data may not be enough to convince the Fed of sustainably slowing inflation which would leave another 75 bps hike on the table for the Sep 21 FOMC meeting.”
Wells Fargo
“We look for prices to have declined 0.2% last month, which would be the largest monthly drop since the spring of 2020. A further plunge in gasoline prices is expected to lead the headline lower, while additional giveback in travel services and used cars should help hold the core to a 0.4% month-over-month increase.”
-
15:52
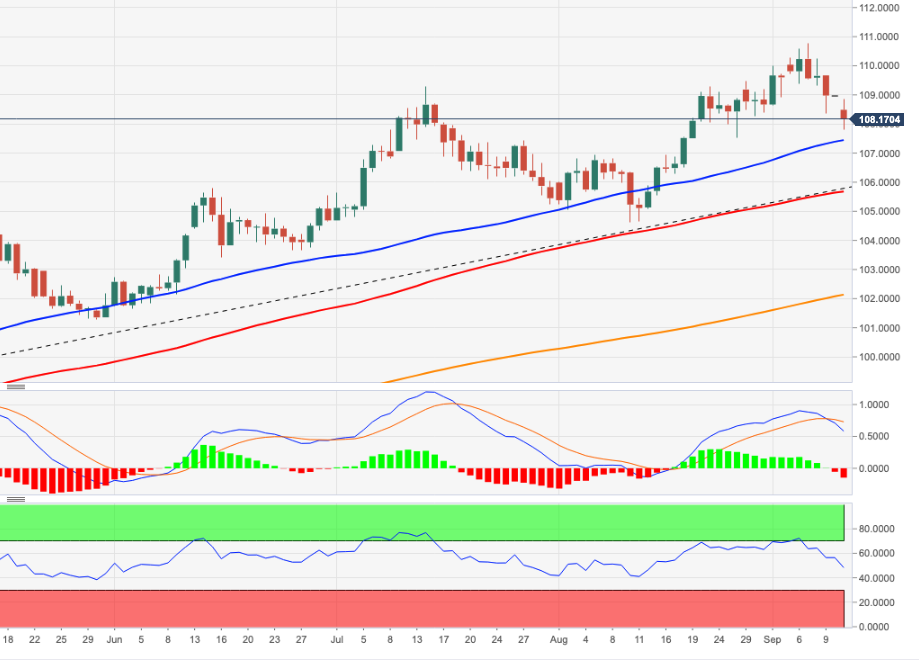
USD/JPY erases daily gains, trades near 142.50
- USD/JPY erased its daily gains during the European trading hours.
- The dollar struggles to find demand as US stocks push higher.
- Focus shifts to US 10-year Treasury note auction.
USD/JPY gathered bullish momentum at the beginning of the week and climbed to the 143.50 area before reversing its direction during the European trading hours. As of writing, the pair was trading at 142.50, where it was virtually unchanged on a daily basis.
The risk-positive market environment during the Asian session made it difficult for the JPY to find demand. Japanese Deputy Chief Cabinet Secretary Seiji Kihara reiterated that the government will take necessary steps to counter excessive declines in the yen but the pair showed no reaction to these comments.
In the European morning, the greenback came under heavy selling pressure amid falling US Treasury bond yields and caused USD/JPY to turn south.
The US Dollar Index, which tracks the dollar's performance against a basket of six major currencies, was last seen losing 0.7% on the day at 108.22. In the meantime, Wall Street's three main indexes are up more than 1% after the opening bell, not allowing the USD to stage a rebound.
In the absence of high-impact macroeconomic data releases, investors will pay close attention to the outcome of the 10-year US Treasury note auction that is scheduled to take place at 1700 GMT. In case the high-yield comes in below the previous auction's 2.755%, the 10-year US T-bond yield could stretch lower and open the door for additional losses in USD/JPY.
Technical levels to watch for
-
15:35
GBP/USD: Break through mid/upper 1.17s should add to positive momentum – Scotiabank
GBP/USD climbs to the 1.1700 level. Further gains through mid/upper 1.17s should add more strength to the pound, economists at Scotiabank report.
Support aligns at 1.1575/00
“Cable closed positively last week (weekly bull ‘hammer’) and additional progress through the mid/upper 1.17s should add to positive momentum in the short/medium term.”
“Support is 1.1575/00.”
-
15:31
USD/CAD: Downside potential to the 1.2940 area in the short run – Scotiabank
USD/CAD continues losing ground for the fourth straight day. In the view of economists at Scotiabank, the Canadian dollar can extend gains to the low 1.29s against the US dollar.
Technical picture remains CAD-positive
“CAD gains on the USD have lagged somewhat but the technical picture remains CAD-positive following last week’s second rejection of the low 1.32 area and the USD’s break under the double top neckline at 1.3075.”
“USD/CAD dips have been reluctant to extend through the upper 1.29s again today, similar to Friday, but the double top pattern implies downside potential to the 1.2940 area in the short run.”
-
15:28
EUR/USD to turn technically bullihs on a sustained move above 1.02 – Scotiabank
EUR/USD rose from an opening level of around 1.0050 in Asian trade to near 1.02 in European dealing before drifting back. Economists at Scotiabank note that a break past 1.02 would technically be bullish.
Support aligns at 1.0050/55
“Strong EUR gains on the session brought spot to within a whisker of key trend resistance off the Feb high (1.0206) earlier. The EUR has retreated from the intraday high but short-term price dynamics remain positive for the pair, which maintains the strong, short-term uptrend that developed earlier last week.”
“We see support at 1.0050/55 intraday.”
“Solid gains above the 1.02 area would be technically bullish from a medium-term point of view.”
-
14:58
Gold Price Forecast: XAU/USD retreats from two-week high, still well bid around $1,725 area
- Gold climbs to a nearly two-week high, tough lacks follow-through buying.
- The risk-on impulse, a modest USD recovery act as a headwind for the metal.
- Sliding US bond yields cap the USD bounce and continues to offer support.
- Investors await the US CPI report on Tuesday for a fresh directional impetus.
Gold trims a part of its intraday gains to a nearly two-week high touched in the last hour and eases to the $1,725 area during the early North American session. The XAU/USD, however, manages to hold in the positive territory for the second straight day and remains at the mercy of the USD price dynamics.
A combination of factors fails to assist gold to capitalize on its early positive move and prompts some selling near the $1,733-$1,734 area on Monday. The risk-on impulse, as depicted by a generally positive tone around the equity markets, acts as a headwind for the safe-haven precious metal. Furthermore, a modest US dollar recovery from a fresh monthly low also contributes to capping the dollar-denominated commodity.
Adding to this, the prospects for a more aggressive policy tightening by major central banks force the non-yielding gold to retreat from the daily peak. That said, retreating US Treasury bond yields weighs on the USD. This, along with growing recession fears, amid economic headwinds stemming from COVID-19 curbs in China and the protracted Russia-Ukraine war, continues to lend some support to the safe-haven XAU/USD.
The mixed fundamental backdrop makes it prudent to wait for strong follow-through buying before traders start positioning for some meaningful upside for gold. In the absence of any major market-moving economic data from the US, the US bond yields will drive the USD demand. This, along with the broader risk sentiment, could produce short-term opportunities around gold ahead of the US consumer inflation figures on Tuesday.
The crucial US CPI report will play a key role in influencing the Fed's policy outlook and dictate the near-term USD trend. This, in turn, will help investors to determine the next leg of a directional move for gold. Heading into the key releases, traders might refrain from placing aggressive bets and prefer to move to the sidelines. This, in turn, could lead to a further consolidative price move for the XAU/USD.
Technical levels to watch
-
14:57
Silver Price Analysis: King Dollar's reversal is catalyzing a ferocious short squeeze – TDS
Strategists at TD Securities analyze the outlook of silver (XAG/USD). They note that a consolidation lower in the USD has sent participants rushing for the exits.
Short positioning has grown to its highest levels since 2019
“With money managers short positioning in silver having grown to its highest levels since 2019, a consolidation lower in the USD has sent participants rushing for the exits. However, the coincident rally in gold prices has been more limited, which suggests little has changed with respect to the investment appetite for precious metals.”
“With 54% of silver's demand tied to fabrication, silver remains highly sensitive to our deteriorating gauge of commodity demand.”
“We continue to expect that while rates markets appear to be nearing a fair pricing for Fed funds, precious metals' price action is still not consistent with their historical performance when hiking cycles enter into a restrictive rates regime.”
-
14:52
Malaysia: Labour market remains strong – UOB
UOB Group’s Senior Economist Julia Goh and Economist Loke Siew Ting review the recently published labour market report in Malaysia.
Key Takeaways
“Malaysia’s labour market recovery gained further traction in Jul with both employment and the size of labour force breaching new record levels. This helped bring the national unemployment rate lower for 12 months in a row to 3.7% in Jul (from 3.8% in Jun), moving closer to the pre-pandemic jobless rate of 3.3%.”
“The gain in total employment was primarily driven by persistent hiring in services (particularly food & beverages services, wholesale & retail trade, and administrative & support services activities), manufacturing (i.e. E&E, other plastic products, and refined petroleum products), and the construction sectors, which fully offset the decline in the agriculture and mining & quarrying sectors. The employment-to-population ratio, which indicates the ability of an economy to create employment, accelerated to 67.0% from 66.9% in Jun, above pre-pandemic levels for three straight months.”
“Despite lingering headwinds on the horizon, we think that the country’s transition to endemicity with a full reopening of economic and social activities as well as borders would continue to drive the labour market recovery for the rest of the year and into 2023. The government is also expected to unveil some positive measures to boost investment and employment in the coming Budget 2023 on 7 Oct. We tweak our year-end unemployment rate projections lower to 3.5% for this year (from 3.6% previously, BNM est: average ~4.0%) and 3.2% for 2023 (from 3.5% previously).”
-
14:43
EUR/USD Price Analysis: Sustained gains look likely above 1.0200
- EUR/USD rises to 4-week highs just below the 1.0200 mark.
- Extra upside appears in store once that level is cleared.
EUR/USD adds to Friday’s advance and tests fresh peaks near 1.0200 at the beginning of the week, an area coincident with the 7-month resistance line.
The pair now needs to leave behind that resistance area to see its downside pressure alleviated and allow at the same time a visit to the interim 100-day SMA at 1.0338 prior to the more relevant August high at 1.0368 (August 10).
In the longer run, the pair’s bearish view is expected to prevail as long as it trades below the 200-day SMA at 1.0755.
EUR/USD daily chart
-
14:21
China: Lower inflation could support further PBoC easing – UOB
Economist at UOB Group Ho Woei Chen, CFA, assesses the latest inflation figures in China.
Key Takeaways
“Headline inflation unexpectedly eased from its 2-year high as it fell to 2.5% y/y in Aug (Bloomberg est: 2.8% y/y, Jul: 2.7%) with food and non-food prices moderating. Core inflation (excluding food & energy) was unchanged from Jul at 0.8% y/y as domestic demand stayed weak amid expanding COVID lockdowns across cities.”
“Producer Price Index (PPI) dropped sharply to 2.3% y/y in Aug (Bloomberg est: 3.2% y/y, Jul: 4.2%). Weaker PPI was attributed to lower international oil and commodity prices as well as weak market demand in some domestic industries.”
“With CPI averaging just 1.9% y/y in Jan-Aug, we now expect full-year inflation at 2.2% instead of our earlier forecast of 2.5% (2021: 0.9%). We also lower our PPI forecast to average 4%-5% in 2022 compared to our earlier estimate of 5%-6% (2021: +8.1%).”
“We continue to see scope for further monetary policy easing, with the 1Y LPR to move lower to 3.55% by end-4Q22 (from current 3.65%). After 35 bps cut YTD, the 5Y rate is still poised to fall further (from current 4.30%) as PBoC extends support to the property market.”
-
14:15
US Dollar Index Price Analysis: Further weakness could revisit 107.60
- DXY remains offered and probes the sub-108.00 region.
- If the index accelerates its losses, it could retest the 107.60/55 band.
DXY starts the week on the negative foot and briefly drops to multi-week lows in the sub-108.00 region.
Despite the ongoing weakness around the dollar, its short-term bullish view remains in place as long as it trades above the 7-month support line around 106.10.
If sellers push harder, then a potential test of the weekly low at 107.58 (August 26) could start emerging on the horizon just ahead of the interim 55-day SMA at 107.25.
Looking at the long-term scenario, the constructive view in DXY remains unchanged while above the 200-day SMA at 101.39.
DXY daily chart
-
14:01
USD/IDR faces some range bound trade near term – UOB
USD/IDR could extend its consolidative mood within the 14,770-14,920 range for the time being, notes Quek Ser Leang, FX Strategist at UOB Group’s Global Economics & Markets Research.
Key Quotes
“Our expectations for USD/IDR to advance last week did not materialize as it traded between 14,815 and 14,933. Upward pressure has eased and USD/IDR is likely to consolidate between 14,770 and 14,920 this week.”
-
13:13
EUR/USD to test August 10 high near 1.0370 on a clean breach of 1.02 – BBH
EUR/USD has traded as high as 1.02 earlier. A break above here would open up a move towards 1.0370, economists at BBH report.
European Central Bank sticks to hawkish stance
“A clean break above 1.02 would set up a test of the August 10 high near 1.0370.”
“ECB officials are sticking to the hawkish message. Taking a lesson from the Fed, the bank is trying to stay on message and so far, the markets like it. Despite these comments, we believe nothing has fundamentally changed. We think the ECB’s base case forecast of no recession is way too optimistic and that a downturn will eventually prevent the ECB from hiking that aggressively. That said, no one should stand in the way of this move, which is also being exaggerated by position skew going into the ECB meeting.”
-
13:08
AUD/USD ascends to 0.6900 neighbourhood, nearly two-week high amid weaker USD
- AUD/USD builds on last week’s late bounce and gains traction for the second straight day.
- Retreating US bond yields, a positive risk tone undermines the USD and extends support.
- Recession fears might cap the risk-sensitive aussie ahead of the US CPI report on Tuesday.
The AUD/USD pair catches some bids for the successive straight day on Monday and builds on last week's bounce from sub-0.6700 levels or the lowest since July 14. This also marks the third day of a positive move in the previous four and lifts spot prices to a more than one-week high, closer to the 0.6900 mark during the mid-European session.
A combination of factors force the US dollar to prolong its recent sharp pullback from a two-decade high, which, in turn, is seen lending support to the AUD/USD pair. The markets already seem to have priced in a supersized 75 bps rate hike by the Federal Reserve at the next policy meeting on September 20-21. Furthermore, a modest downtick in the US Treasury bond yields seems to weigh on the greenback.
Apart from this, a generally positive tone around the equity markets further undermines the safe-haven buck and benefits the risk-sensitive aussie. That said, growing recession fears, amid the prospects for a faster policy tightening by major central banks and economic headwinds stemming from fresh COVID-19 curbs in China could cap optimism. This, in turn, warrants some caution for bullish traders.
Investors might also refrain from placing aggressive bets and prefer to move to the sidelines ahead of the latest US consumer inflation figures, due for release on Tuesday. The crucial US CPI report for August will play a key role in influencing the Fed's policy outlook. This will drive the USD demand in the near term and help determine the next leg of a directional move for the AUD/USD pair.
In the meantime, spot prices are more likely to consolidate in a range amid absent relevant market-moving economic releases from the US on Monday. That said, the US bond yields, along with the broader risk sentiment, might provide some impetus to the greenback and allow traders to grab short-term opportunities around the AUD/USD pair.
Technical levels to watch
-
13:03
GBP/USD to remain on the back foot as the pound faces strong headwinds – Rabobank
UK economic data, guidance from the Bank of England (BoE) and, very importantly, direction from the Tory government and its new leadership will set the tone for the British pound. Economists at Rabobank expect further weakness for the GBP in the coming weeks.
PM Truss does have the potential to win back some investor confidence
“The promise of higher interest rates is not a guarantee of GBP strength when the economy is facing recession. To this end, news of another bank holiday this month is not encouraging for the pound given that it is set to detract from the GDP numbers for September.”
“If Truss can find a way to piece together a solution that strengthens relations with the EU, investors could take heart. This, however, will not be easy.”
“For now, the headwinds facing the pound are still very strong. We maintain our one-month forecast of GBP/USD 1.14.”
-
13:00
India Manufacturing Output dipped from previous 12.5% to 3.2% in July
-
13:00
India Cumulative Industrial Output below forecasts (11.9%) in June: Actual (10%)
-
13:00
India Industrial Output below expectations (4.3%) in July: Actual (2.4%)
-
12:56
EUR/GBP to extend its advance once key resistance at 0.8720 is reclaimed – SocGen
EUR/GBP picks up bids to reverse Friday’s losses. Economists at Société Générale expect the pair to extend its race higher on a break past 0.8720.
Short-term support aligns at 0.8560
“EUR/GBP recently gave a break above the descending trend line drawn since 2020 denoting potential upside. This is also highlighted by weekly MACD which is now firmly anchored within positive territory and above its trigger.”
“The pair is close to key graphical resistance of 0.8720. Once this is reclaimed, the up move is likely to extend towards projections of 0.8860 and perhaps even towards 0.8980/0.9010.”
“Last week's low of 0.8560 is short-term support.”
-
12:18
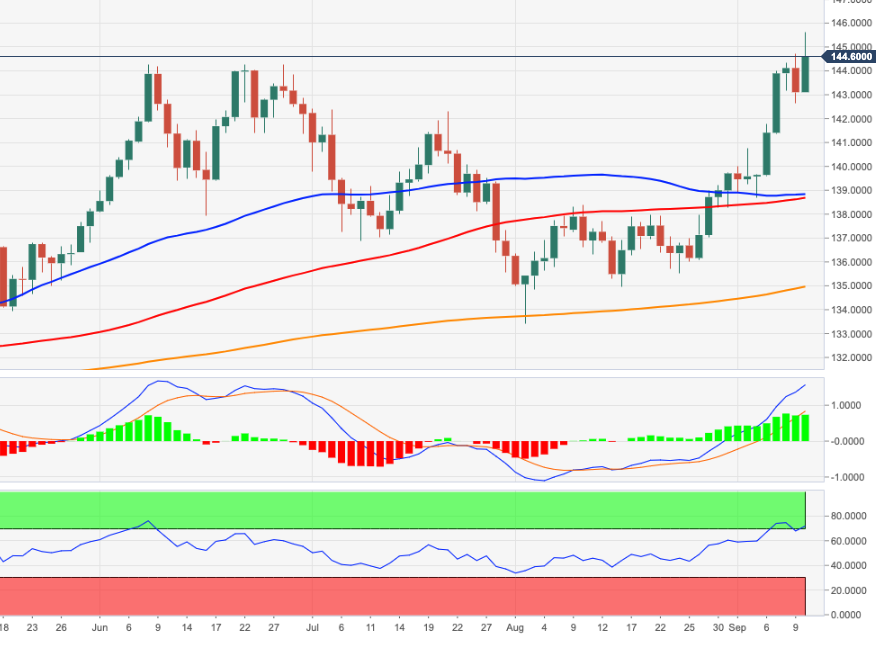
EUR/JPY Price Analysis: Next on the upside remains the 150.00 zone
- EUR/JPY prints new multi-year peaks past 145.00.
- Extra gains could extend to the 2014 high near 150.00.
EUR/JPY starts the week on the positive foot and records new highs near 145.60.
Extra gains in the cross appear well favoured for the time being. The next target, however, is not expected to emerge until the 2014 high at 149.78 (December 8).
While above the 200-day SMA at 134.93, the prospects for the pair should remain constructive.
Of note, however, is the current overbought condition of EUR/JPY, which could spark a technical drop in the near term.
EUR/JPY daily chart
-
12:02
United Kingdom NIESR GDP Estimate (3M) came in at -0.2% below forecasts (0.1%) in August
-
11:56
Germany's Ifo: German economy to contract by 0.3% in 2023
Germany's Ifo Institute announced on Monday that it revised its 2023 growth forecast to -0.3% from 3.5% in June. The institute further noted that the annual inflation expectation for 2023 got revised higher to 9.3% from June's forecast of 6%.
For 2022, Ifo now sees the economy growing by 1.6%, down from 2.5% in June, and forecasts 8.1% inflation (6.8% in June), as reported by Reuters.
Market reaction
EUR/USD pair retreated from the multi-week high it set at 1.0198 after this report. Nevertheless, the pair was last seen trading at 1.0140, where it was still up 1% on a daily basis.
-
11:55
USD/MYR: Further upside remains on the cards but… - UOB
The continuation of the upside in USD/MYR is not ruled out, although a test of the 4.51 hurdle remains elusive for the time being, suggests Quek Ser Leang, FX Strategist at UOB Group’s Global Economics & Markets Research.
Key Quotes
“While we expected USD/MYR to strengthen last week, we were of the view that ‘the major resistance at 4.4980 is likely out of reach’. However, USD/MYR took out 4.4980 and rose to 4.5020. Upward momentum has improved, albeit not by much.”
“For this week, USD/MYR could advance further but the resistance at 4.5100 is unlikely to come into view for now. Support is at 4.4930 but only a break of 4.4900 would indicate that the current upward pressure has eased.”
-
11:27
Silver Price Analysis: XAG/USD bulls have the upper hand near 200-period SMA on 4-hour chart
- Silver gains traction for the fourth straight day and climbs to over a two-week high.
- The technical set-up favours bullish traders and supports prospects for further gains.
- A sustained break below the $18.60 region is needed to negate the positive outlook.
Silver prolongs its recent recovery move from the lowest level since June 2020 touched earlier this month and gains traction for the fourth successive day on Monday. This also marks the sixth day of a positive move in the previous seven and lifts the white metal to over a two-week high, around the $19.30 area during the first half of the European session.
Last week's sustained breakout through the top end of a nearly one-month-old descending channel and a subsequent strength beyond the 100-period SMA on the 4-hour chart was seen as a key trigger for bulls. Furthermore, technical indicators on the daily chart have just started moving in the positive territory and remain supportive of the strong follow-through move up.
That said, RSI (14) on hourly charts is already flashing overbought conditions and might hold back traders from placing fresh bullish bets around the XAG/USD. Hence, it is prudent to wait for some near-term consolidation or a modest pullback before positioning for any further appreciating move. The bias, meanwhile, still seems tilted firmly in favour of bullish traders.
A convincing breakthrough the $19.35-$19.40 hurdle will reaffirm the constructive outlook and allow the XAG/USD to accelerate the momentum towards reclaiming the $20.00 psychological mark. The next relevant resistance is pegged near the $20.25 horizontal zone, which if cleared should pave the way for additional gains.
On the flip side, the $19.00 round figure now seems to protect the immediate downside. Any further pullback might be seen as a buying opportunity and remain limited near the 100-period SMA on the 4-hour chart, around the $18.65-$18.60 region. This is followed by support near the $18.30 area. A convincing break below the latter will negate the near-term positive bias.
Silver 4-hour chart
-637985751324582175.png)
Key levels to watch
-
11:11
USD/THB: Tough support aligns at 36.10 – UOB
Quek Ser Leang, FX Strategist at UOB Group’s Global Economics & Markets Research, noted that further decline in USD/THB is likely to meet solid contention around 36.10.
Key Quotes
“Our view for USD/THB to ‘rise above 36.95’ last week was incorrect as it dropped below the rising trend-line support. Daily MACD is weakening rapidly and this coupled with the breach of the rising trend-lines support is likely to lead to a lower USD/THB this week.”
“That said, any weakness is expected to encounter solid support at 36.10. On the upside, resistance is at 36.60 but only a breach of 36.80 would indicate the current downward pressure has eased.”
-
11:01
Portugal Consumer Price Index (MoM) unchanged at -0.3% in August
-
11:00
Portugal Consumer Price Index (YoY) dipped from previous 9% to 8.9% in August
-
10:51
EUR/USD climbs to 4-week highs near 1.0200
- Renewed buying interest lifts EUR/USD to the vicinity of 1.0200.
- German 10-year Bund yields trade on the defensive below 1.70%.
- ECB’s De Guindos declined to comment on how high rates could go.
The European currency adds to Friday’s gains and pushes EUR/USD to fresh multi-week highs just below 1.0200 the figure at the beginning of the week.
EUR/USD up on weaker dollar
EUR/USD advances for the second session in a row and flirts with the 1.0200 neighbourhood in response to the intense sell-off in the greenback, which forces the US Dollar Index (DXY) to break below the 108.00 support and record new multi-week lows.
Extra gains in the pair seem to have picked up extra pace following the unprecedented 75 bps interest rate hike by the ECB at its event on September 8, while Monday’s market chatter around the probability that interest rates in the region could move to restrictive territory also lent legs to the single currency.
The strong rebound in the pair, however, comes in contrast to the corrective decline in the German 10-year Bund yields, which breach the 1.70% yardstick after poking with 1.80% at the end of last week.
Still around the ECB, Vice-President De Guindos said he does not know how high rates could climb at the time when he stressed that the recent 75 bps hike is expected to anchor inflation expectations.
In the domestic docket, a minor release includes Germany’s Current Account, while short-term bill auctions and medium-term note auctions are only due across the pond later in the NA session.
What to look for around EUR
EUR/USD pushes higher and briefly tested the key 7-month resistance line in the 1.0200 neighbourhood amidst the persistent selling pressure hitting the US dollar.
So far, price action around the European currency is expected to closely follow dollar dynamics, geopolitical concerns, fragmentation worries and the Fed-ECB divergence.
On the negatives for the single currency emerge the so far increasing speculation of a potential recession in the region, which looks propped up by dwindling sentiment gauges as well as an incipient slowdown in some fundamentals.
Key events in the euro area this week: Germany Final Inflation Rate, Germany/EMU ZEW Economic Sentiment (Tuesday) – EMU Industrial Production (Wednesday) – France Final Inflation Rate, EMU Balance of Trade (Thursday) – Italy, EMU Final Inflation rate (Friday).
Eminent issues on the back boiler: Continuation of the ECB hiking cycle. Italian elections in late September. Fragmentation risks amidst the ECB’s normalization of its monetary conditions. Impact of the war in Ukraine and the persistent energy crunch on the region’s growth prospects and inflation outlook.
EUR/USD levels to watch
So far, the pair is advancing 1.16% at 1.0160 and now faces the initial barrier at 1.0197 (weekly high September 12) followed by 1.0202 (August 17 high) and then 1.0338 (100-day SMA). On the flip side, the breakdown of 0.9863 (2022 low September 6) would target 0.9859 (December 2002 low) en route to 0.9685 (October 2002 low).
-
10:43
USD/CAD drops to two-week low, further below 1.3000 amid weaker USD, rising oil prices
- USD/CAD continues losing ground for the fourth straight day and dives to a nearly two-week low.
- Rising oil prices underpin the loonie and exert heavy pressure amid broad-based USD weakness.
- Aggressive Fed rate hike bets should limit the USD downside and lend some support to the major.
The USD/CAD pair meets with a fresh supply following an early uptick to the 1.3040 area and turns lower for the fourth successive day on Monday. The downward trajectory drags spot prices to a nearly two-week low, around the 1.2980-1.2975 zone during the early European session and is sponsored by a combination of factors.
As investors look past Friday's disappointing Canadian employment details, a further recovery in crude oil prices from a multi-month low touched last week underpins the commodity-linked loonie. Apart from this, the heavily offered tone surrounding the US dollar exerts additional downward pressure on the USD/CAD pair and contributes to the intraday decline.
A symbolic output cut by OPEC+, along with Russia's threat to cut oil flows to any country that backs a price cap on its crude, raises concerns about tight global supply and offers support to oil prices. On the other hand, a generally positive tone around the equity markets drags the safe-haven greenback further away from a two-decade high touched last week.
That said, concerns that a deeper global economic downturn, along with fresh COVID-19 curbs in China, could curb fuel demand should cap oil prices. This, along with elevated US Treasury bond yields, bolstered by the prospects for more aggressive rate hikes by the Fed, should offer some support to the buck and help limit losses USD/CAD pair, at least for now.
The markets seem convinced that the Fed will continue to tighten its monetary policy at a faster pace to tame inflation. That said, a supersized 75 bps rate hike at the September FOMC meeting is already priced in. Hence, the USD bulls might now wait for the release of the latest US consumer inflation figures, due on Tuesday, before placing fresh bets.
In the meantime, the broader market risk sentiment and the US bond yields will continue to play a key role in driving the USD demand on Monday. Apart from this, oil price dynamics will be looked upon for some short-term trading opportunities around the USD/CAD pair amid absent relevant market-moving economic releases, either from the US or Canada.
Technical levels to watch
-
10:07
GBP/USD climbs to 1.1700 mark, nearly two-week high amid sustained USD selling bias
- GBP/USD gains traction for the second straight day and climbs to a nearly two-week high.
- A positive risk tone, subdued US bond yields weigh on the USD and remain supportive.
- The disappointing UK macro data adds to recession fears and might cap any further gains.
The GBP/USD pair catches fresh bids near the 1.1600 mark on Monday and climbs to a near two-week high during the first half of the European session. The pair is currently trading around the 1.1700 round figure and is looking to build on its recent bounce from the lowest level since 1985 touched last week.
The US dollar prolongs its sharp retracement slide from a two-decade high and remains under intense selling pressure on the first day of a new week. In fact, the USD Index, which measures the greenback's performance against a basket of currencies, dives to a fresh monthly low. This turns out to be a key factor pushing the GBP/USD pair higher for the second successive day.
Given that the markets have already priced in a supersized 75 bps rate hike at the next FOMC meeting on September 20-21, a generally positive tone around the equity markets is seen weighing on the safe-haven greenback. Apart from this, the ongoing USD corrective decline lacks any obvious fundamental catalyst and is more likely to remain limited amid elevated US Treasury bond yields.
Furthermore, the worsening outlook for the UK economy might further contribute to keeping a lid on any further gains for the GBP/USD pair. The worries were further fueled by the mostly disappointing UK macro data released earlier this Monday. The UK Office for National Statistics reported that the economy expanded by 0.2% in July, less than consensus estimates for a 0.5% growth.
Separately, the UK Manufacturing and total Industrial Production fell short of expectations, arriving at 0.1% MoM in July and -0.3%, respectively. This warrants caution before positioning for any further gains. Nevertheless, the GBP/USD pair has now rallied nearly 300 pips from the 1.1400 neighbourhood, or a 35-year low set last Wednesday and remains at the mercy of the USD price dynamics.
Investors might also refrain from placing aggressive bets and prefer to move to the sidelines ahead of the US consumer inflation figures, due on Tuesday. Traders will further take cues from this week's key UK macro releases, including the crucial CPI report on Wednesday. This, in turn, will play a key role in influencing the GBP/USD pair and help determine the next leg of a directional move.
Technical levels to watch
-
09:50
ECB’s de Guindos: I don't know how much rates will climb
European Central Bank (ECB) Vice President Luis de Guindos said on Monday, “I don't know how much rates will climb.”
Additional comments
“Governments, not the ECB, should resolve rising state debt.”
“Any GDP contraction will be less than in the euro crisis.”
“The German economy is very adaptable to energy shocks.”
-
09:28
USD/CNH is now expected to trade within 6.9000-6.9700 range – UOB
According to FX Strategists at UOB Group Quek Ser Leang and Peter Chia, USD/CNH is now seen trading between 6.9000 and 6.9700 in the next few weeks.
Key Quotes
24-hour view: “Last Friday, we expected USD to ‘consolidate further’. In other words, we did not expect the sharp drop in USD to 6.9180 and the subsequent strong bounce from the low. The strong bounce amidst oversold conditions suggests USD is unlikely to weaken much further. For today, USD is more likely to trade between 6.9150 and 6.9450.”
Next 1-3 weeks: “We have held a positive view in USD since the middle of last month. In our latest narrative form last Wednesday (07 Sep, spot at 6.9770), we indicated that as long as 6.9300 is not breached, there is still chance for USD to break 7.0000. USD subsequently rose to 6.9967 before easing off. Last Friday, USD lurched lower and cracked the ‘strong support’ at 6.9300. The break of the ‘strong support’ indicates that the month-long rally in USD has ended. USD appears to have moved into a consolidation phase and is likely to trade between 6.9000 and 6.9700 for now.”
-
09:27
EUR/USD to extend its race higher as long as 1.0160 holds
EUR/USD has gathered bullish momentum to start the week. As FXStreet’s Eren Sengezer notes, the pair's technical outlook points to a bullish tilt in the near term.
EUR/USD could stage a technical correction before stretching higher
“EUR/USD pierced through the 200-period SMA on the four-hour chart and the 20-period SMA crossed above the 50-period and 100-period SMA's during the latest rally, reflecting the strong buying interest in the euro. However, that the Relative Strength Index on the same chart is about to rise above 70, suggesting that the pair could stage a technical correction before stretching higher.”
“On the downside, 1.0160 (Fibonacci 61.8% retracement level of the latest downtrend) aligns as key technical support. In case the pair manages to hold above that level, it could test 1.0200 (psychological level) and target 1.0245 (static level) and 1.0280 (static level) afterwards.”
“With a decline below 1.0160, sellers could show interest and drag the pair toward 1.0100 (200-period SMA, Fibonacci 50% retracement).”
-
09:23
US Dollar Index extends the pullback below 108.00
- The index loses further momentum and breaches 108.00.
- Extra improvement in the risk complex keeps weighing on the dollar.
- This week’s focus will largely by on US inflation figures.
Sellers remain well in control of the sentiment around the greenback and sponsor the ongoing sell-off to the sub-108.00 area when tracked by the US Dollar Index (DXY).
US Dollar Index focuses on inflation, Fed
The index loses ground for the second session in a row and extends further the corrective downside after last week’s 20-year peaks well north of the 110.00 mark.
The move lower in the dollar comes in tandem with a small downtick in US yields across the curve, as market participants appear to have already priced in a 75 bps interest rate hike at the Fed’s September 21 gathering.
On the latter, CME Group’s FedWatch Tool now sees the probability of such a rate raise at 90% from around 57% a week ago and 45% vs. a month ago.
No data releases in the US data space other than 3-month/6-month Bill Auctions and 3-year/10-year Note Auctions.
What to look for around USD
The index has embarked on a corrective path that has already broken below the key support at 108.00 at the beginning of last week.
Bolstering the dollar’s underlying positive stance appears the firmer conviction of the Federal Reserve to keep hiking rates until inflation looks well under control regardless of a likely slowdown in the economic activity and some loss of momentum in the labour market. This view was reinforced by Chair Powell’s speech at the Jackson Hole Symposium.
Looking at the more macro scenario, the greenback appears propped up by the Fed’s divergence vs. most of its G10 peers in combination with bouts of geopolitical effervescence and occasional re-emergence of risk aversion.
Key events in the US this week: Inflation Rate (Tuesday) – MBA Mortgage Applications, Producer Prices (Wednesday) – Retail Sales, Initial Claims, Philly Fed Manufacturing Index, Industrial Production, Business Inventories (Thursday) – Flash Michigan Consumer Sentiment, TIC Flows (Friday).
Eminent issues on the back boiler: Hard/soft/softish? landing of the US economy. Prospects for further rate hikes by the Federal Reserve vs. speculation over a recession in the next months. Geopolitical effervescence vs. Russia and China. US-China persistent trade conflict.
US Dollar Index relevant levels
Now, the index is retreating 0.92% at 107.97 and faces the next support at 107.58 (weekly low August 26) seconded by 107.24 (55-day SMA) and then 104.63 (monthly low August 10). On the other hand, a break above 110.78 (2022 high September 7) would aim for 111.90 (weekly high September 6 2002) and then 113.35 (weekly high May 24 2002).
-
09:23
USD/INR to suffer a deeper pullback on a break under 78.70/78.50 – SocGen
USD/INR has started evolving within a pause after reaching 80 in July. 78.70/78.50 is short-term support – which should cushion the downside, in the view of economists at Société Générale.
Uptrend has paused
“Recent attempt at overcoming the 80 hurdle has failed, denoting the possibility of an elongated consolidation. Lower limit of recent range at 78.70/78.50 should be an important support near-term. Only a break below would mean a deeper pullback.”
“Once a move beyond 80 materializes, the pair is expected to resume its uptrend. Next targets are expected to be at projections of 80.30 and 81.00.”
-
09:20
AUD/USD: Revisit of 0.7130 not ruled out – SocGen
ADU/USD has defended the 0.6680/0.6650 support zone on a second attempt, triggering an initial bounce. Economists at Société Générale think the pair could now retest the 0.7130 mark.
Deeper downtrend on a break under 0.6680/0.6650
“A revisit of the neckline at 0.7130 which is also the 200-DMA is not ruled out. If this is overcome, an extended bounce could take shape towards 0.7280 and upper band of the channel at 0.7500.”
“Only if 0.6680/0.6650 gets violated would there be a deeper downtrend.”
-
09:17
S&P 500 Index: Defense of 3900/3890 to trigger further upside – SocGen
S&P 500 has so far defended the potential support zone at 3900/3890. Economists at Société Générale expect the index to test 4115/4160 and 4220 next.
Break below 3900/3890 to open up previous bullish gap at 3795
“Once a cross above the 50-DMA at 4020 materializes, a short-term up move is likely towards graphical levels of 4115/4160 and 4220.”
“Only if the index establishes itself below 3900/3890, there would be a risk of extension in pullback towards previous bullish gap at 3795 and the lows of June at 3636.”
-
09:15
Gold Price Forecast: XAU/USD jumps closer to Friday’s swing high amid notable USD supply
- Gold catches fresh bids on Monday and turns positive for the second successive day.
- The prevalent USD selling bias turns out to be a key factor boosting the commodity.
- A positive risk tone, the prospects for more aggressive central banks continue to cap.
Gold attracts some dip-buying near the $1,712 area on Monday and turns positive for the second straight day. The XAU/USD refreshes daily high, around the $1,726-$1,727 region during the European session and moves back closer to a one-and-half-week high touched on Friday.
The US dollar extends last week's sharp retracement slide from a two-decade high and remains under intense selling pressure on the first day of a new week. In fact, the USD Index, which measures the greenback's performance against a basket of currencies, dives to a fresh monthly low and offers support to the dollar-denominated gold.
Given that the markets have already priced in a 75 bps Fed rate hike move in September, subdued action around the US Treasury bond yields turns out to be a key factor weighing on the greenback. Apart from this, growing worries about a deeper global economic downturn further contribute to driving flows towards safe-haven gold.
That said, a positive risk tone - as depicted by a generally upbeat mood around the equity markets - could act as a headwind for the precious metal. Furthermore, the prospects for a more aggressive policy tightening by major central banks warrant some caution before positioning for any further appreciating move for the non-yielding gold.
Investors might also prefer to move to the sidelines ahead of the latest US consumer inflation figures, due for release on Tuesday. The crucial US CPI report will influence the Fed's policy outlook and dictate the near-term USD trajectory. This, in turn, will help investors to determine the next leg of a directional move for gold.
In the meantime, the XAU/USD is more likely to enter a consolidation phase amid absent relevant market-moving economic data from the US. That said, the US bond yields, the USD price dynamics, along with the broader risk sentiment, might still provide some impetus to gold and allow traders to grab short-term opportunities.
Technical levels to watch
-
09:00
Italy Industrial Output s.a. (MoM) came in at 0.4%, above forecasts (0.3%) in July
-
09:00
Italy Industrial Output w.d.a (YoY) below expectations (-0.4%) in July: Actual (-1.4%)
-
08:40
USD/JPY trims intraday gains, back below 143.00 amid broad-based USD weakness
- USD/JPY struggles to capitalize on its intraday positive move to the 143.50 area.
- The ongoing USD slide to a fresh monthly low and acts as a headwind for the pair.
- A combination of factors could undermine the safe-haven JPY and offer support.
- Investors might also move to the sidelines ahead of the US CPI report on Tuesday.
The USD/JPY pair retreats nearly 90 pips from the daily high and drops back closer to mid-142.00s during the early European session on Monday.
The US dollar prolongs its recent sharp corrective pullback from a two-decade high touched last week and remains under heavy selling pressure on Monday. This, in turn, acts as a headwind for the USD/JPY pair. Furthermore, speculations that authorities may soon step in to arrest a freefall in Japanese yen also contribute to capping the upside for the major. In fact, Japanese Deputy Chief Cabinet Secretary Seiji Kihara urged the government to take necessary steps to counter excessive declines in the yen.
That said, a combination of factors should help limit the downside for the USD/JPY pair and support prospects for the resumption of a one-month-old strong bullish trajectory. A generally positive tone around the equity markets, along with a big divergence in the policy stance adopted by the Bank of Japan and the Federal Reserve, might undermine the safe-haven JPY. It is worth mentioning that the BoJ has been lagging behind other major central banks in the process of policy normalisation and remains committed to continuing with its monetary easing. In contrast, the Fed is expected to tighten its policy at a faster pace.
The markets, however, already seem to have priced in a supersized 75 bps rate hike move at the next FOMC meeting on September 20-21. Hence, the USD bulls might wait for the crucial US consumer inflation figures on Tuesday before placing fresh bets, which will play a key role in influencing the Fed's policy outlook. This, in turn, will drive the USD demand and provide a fresh directional impetus to the USD/JPY pair. In the meantime, traders might prefer to move to the sidelines amid absent relevant market-moving economic releases from the US.
Technical levels to watch
-
08:21
USD to weaken once the end of US monetary tightening campaign is in sight – NBF
The trade-weighted US dollar was back to a post-recession high against a basket of 26 currencies on September 2. For now, the most compelling argument for higher interest rates made by the Fed is the resilience of labor markets. Economists at the National Bank of Canada think things are about to change.
Easing of China's "zero COVID" policy to limit USD appreciation
“Full-time employment, meanwhile, has stagnated since the beginning of 2022. This suggests that companies may be on the verge of cutting back on hiring in the coming months. If we are right, the FOMC may soon recognize that the end of US monetary tightening campaign is in sight, a development that could weaken the greenback.”
“An easing of China's ‘zero COVID’ policy would also help limit the appreciation of the US currency.”
-
08:17
Gold Price Forecast: XAU/USD to rebound on soft US inflation report
Last week, gold failed to make a convincing move in either direction. August inflation data from the US next week could have a significant impact on gold’s valuation, FXStreet’s Eren Sengezer reports.
August inflation data from the US could trigger a significant reaction
“The US Bureau of Labor Statistics will release the Consumer Price Index (CPI) data for August on Tuesday. FOMC policymakers refrained from confirming a 75 bps rate hike in September and a soft inflation report could cause the probability of a 50 bps rate increase to rise. In that scenario, US T-bond yields are likely to fall sharply and trigger a decisive rally in gold. On the flip side, stronger-than-expected CPI prints could cement a 75 bps rate hike and not allow XAU/USD to turn north.”
“On Friday, August Industrial Production and Retail Sales data from China will be looked upon for fresh impetus. If these figures disappoint, gold could have a hard time finding demand, with investors losing hope for a steady recovery in gold’s demand and vice versa.”
“The University of Michigan’s flash September Consumer Sentiment Index report will be released on Friday. A decline in 5-10 year consumer inflation expectations should hurt the dollar, while an unexpected increase could help the currency gather strength and weigh on XAU/USD.”
-
08:13
USD/CAD: Loonie to appreciate on the back of higher policy rate – NBF
The Canadian dollar remains the best performing G10 currency against the US dollar so far in 2022 but is still down 3.9%. Economists at the National Bank of Canada still expect the CAD to appreciate against the greenback.
USD/CAD could breach 1.32
“The loonie is still down 3.9% despite a better performing economy, a current account surplus, the best terms of trade on record and a hawkish central bank. Even then, 1.32 USD/CAD is in danger of being breached.”
“Notwithstanding the upcoming slowdown, we still expect economic resilience to translate into a higher policy rate in Canada than in the US. Such a development remains conducive to CAD appreciation vs. the greenback.”
-
08:08
GBP/USD to struggle to surpass the 1.1730/50 resistance zone – ING
GBP/USD has broken above 1.1600. Economists at ING expect the pair to remain capped by the 1.1730/50 resistance area.
July GDP slightly softer than expected
“July UK GDP has come in slightly softer than expected at 0.2% month-on-month. However, the adjustment for the June bank holiday makes the figures a little difficult to read and we think the Bank of England (BoE) will take more notice of tomorrow's August jobs data for insight into how tight the UK labour market really is.”
“We are not particularly bearish on the dollar – thus we doubt GBP/USD makes it as far as the 1.1730/50 resistance area.”
“EUR/GBP can consolidate in a 0.8650-08720 range after recent gains.”
-
08:03
NZD/USD refreshes daily high, inches back closer to mid-0.6100s amid weaker USD
- NZD/USD catches fresh bids on Monday amid the prevalent USD selling bias.
- A positive risk tone keeps the safe-haven USD depressed near the monthly low.
- Recession fears might cap the risk-sensitive kiwi ahead of the US CPI on Tuesday.
The NZD/USD pair attracts some dip-buying near the 0.6080 region on Monday and climb to a fresh daily peak during the early European session. The pair is currently placed around the 0.6135-0.6140 region and moves back closer to over a one-week high touched on Friday.
The US dollar struggles to gain any meaningful traction and languishes near the monthly low, which, in turn, is seen as a key factor lending some support to the NZD/USD pair. The markets already seem to have priced in a supersized 75 bps rate hike at the next FOMC policy meeting on September 20-21. Apart from this, a positive risk tone continues to undermine the safe-haven greenback and benefits the risk-sensitive kiwi.
The upside potential, however, seems limited amid worries about a deeper global economic downturn. The prospects for rapid interest rate hikes, along with economic headwinds stemming from fresh COVID-19 curbs in China and the protracted Russia-Ukraine war, have been fueling recession fears. This might keep a lid on any optimistic move in the markets and act as a headwind for the NZD/USD pair, warranting caution for bulls.
Traders might also prefer to move to the sidelines and wait for the release of the latest US consumer inflation figures on Tuesday. The crucial US CPI report will play a key role in influencing the Fed's policy outlook and driving the USD in the near term. This, in turn, should provide a fresh directional impetus to the NZD/USD pair.
In the meantime, spot prices seem more likely to oscillate in a range amid absent relevant market-moving economic releases from the US. That said, the broader market risk sentiment could drive the USD price dynamics and allow traders to grab short-term opportunities around the NZD/USD pair.
Technical levels to watch
-
08:01
Turkey Current Account Balance below expectations ($-3.6B) in July: Actual ($-4.01B)
-
08:00
Turkey Unemployment Rate dipped from previous 10.3% to 10.1% in July
-
08:00
GBP/USD: There is limited possibility for appreciation – NBF
GBP/USD flirted with all-time lows on September 1st, ending four-tenths away from the pandemic trough. Economists at the National Bank of Canada expect the pair to remain under pressure.
Turmoil on all fronts
“The island nation is composing with a multitude of challenges ranging from inflation to political change. The economic outlook has deteriorated and will pose a navigational challenge for the Bank of England.”
“As the country appears headed for a recession, there is limited possibility for appreciation unless the trade-weighted USD descends from its lofty levels.”
-
07:57
Forex Today: Markets remain cautious in quiet calendar day
Here is what you need to know on FridaMonday, September 12:
The market action stays subdued to start the week as investors refrain from making large bets. The US Dollar Index, which lost 0.6% on Friday, stays on the backfoot in the European morning after having opened with a bearish gap. US stock index futures trade virtually unchanged and the 10-year US Treasury bond yield posts small daily gains near 3.3%. There won't be any high-impact macroeconomic data releases featured in the economic calendar on Monday. Comments from European Central Bank (ECB) officials and the 10-year US Treasury note auction later in the day will be watched closely by market participants.
Ahead of the weekend, several FOMC policymakers reiterated that they consider it appropriate to continue removing policy accommodation. "I support another significant hike in two weeks," Federal Reserve Governor Christopher Waller said on Friday but the greenback failed to end the week on a firm footing. Nevertheless, the CME Group FedWatch Tool shows that markets are pricing in a 90% probability of a 75 basis points (bps) rate hike.
EUR/USD snapped a three-week losing streak on Friday and preserved its bullish momentum early Monday. The pair trades with strong daily gains above 1.0100. The latest comments from officials revived expectations for one more 75 bps hike in October. Additionally, several news outlets reported that the bank is planning to start discussing quantitative tightening in October, allowing the shared currency to continue to gather strength.
GBP/USD broke above 1.1600 and continued to push higher toward 1.1650 early Monday. The data from the UK revealed that the Gross Domestic Product expanded by 0.2% on a monthly basis in July. This reading came in weaker than the market expectation for a growth of 0.5%. Other data showed that Industrial Production contracted by 0.3% and the Manufacturing Production increased by only 0.1% in the same period. Despite the disappointing data, the pair clings to its daily gains amid the broad-based selling pressure surrounding the dollar.
Following Friday's deep downward correction, USD/JPY is edging higher early Monday and was last seen trading above 143.00. Japanese Deputy Chief Cabinet Secretary Seiji Kihara urged the government to take the necessary steps to counter the excessive depreciation in the JPY but this comment failed to help the currency stay resilient against the greenback.
Gold ended up closing the previous week with small gains. With US yields staying moving up and down in tight ranges on Monday, XAU/USD is having a difficult time finding direction as it fluctuates near $1,720.
Bitcoin continued to edge higher over the weekend and climbed above $22,000 on Monday before retreating to the $21,800 area. Ethereum touched its highest level in three weeks near $1,800 but lost its bullish momentum. ETH/USD closed in negative territory on Sunday and was last seen losing nearly 2% on the day at $1,735.
-
07:57
Silver Price Analysis: Crosses 21-DMA to refresh 11-day top near $19.00
- Silver price picks up bids to renew daily top during the four-day uptrend.
- Previous support line from mid-July challenges immediate XAG/USD upside.
- MACD signals, 21-DMA breakout keeps buyers hopeful of challenging nine-week-old horizontal hurdle.
Silver price (XAG/USD) takes the bids to refresh a two-week high near $19.10 during the early Monday morning in Europe. In doing so, the bright metal crosses the 21-DMA while printing the four-day uptrend.
The 21-DMA breakout also takes clues from the bullish MACD signals to challenge the support-turned-resistance line from July 14, close to $19.15 at the latest.
It should, however, be noted that the XAG/USD bulls will need validation from a seven-week-old horizontal resistance area and a downward sloping resistance line from early May, respectively near $19.50 and $20.10, to retake control.
Meanwhile, pullback moves may initially aim for the 21-DMA level, surrounding $18.80, before aiming at the one-week-old support line near $18.45.
Following that, July’s low of $18.14 and the $18.00 threshold could test the XAG/USD bears.
In a case where the silver price remains weak past $18.00, the yearly low of $17.56, marked on September 01, will be crucial to watch.
Overall, XAG/USD is likely to witness short-term upside but the bulls are far from the throne.
Silver: Daily chart
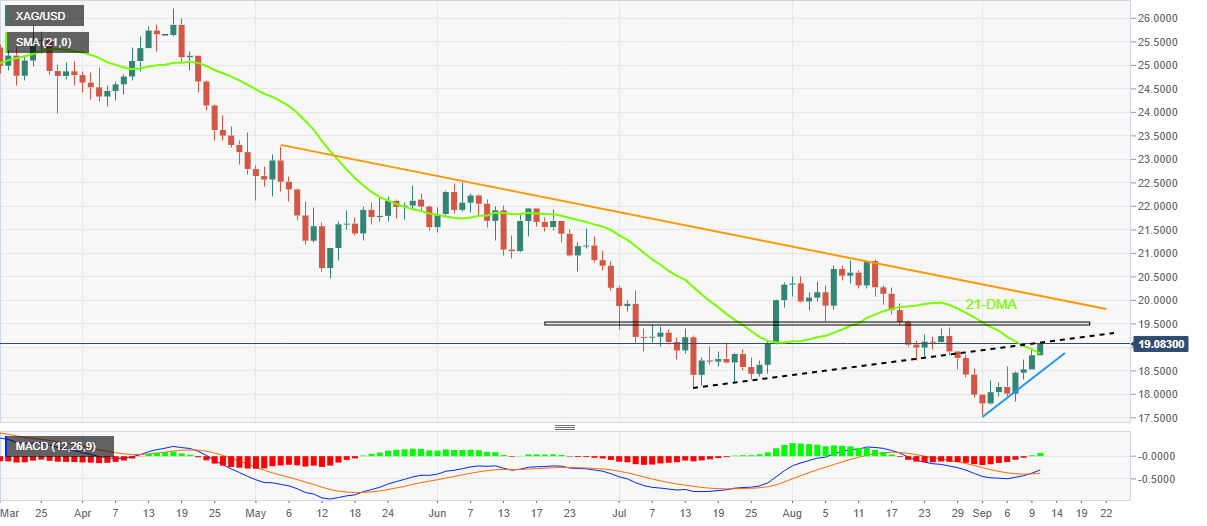
Trend: Limited upside expected
-
07:54
NZD/USD: Bounce off 0.60 to keep uber-bearish kiwi sentiment at bay – ANZ
NZD/USD recovered nicely off 0.60 last week. Economists at ANZ Bank believe downside pressure on the kiwi has been alleviated.
Immediate focus is US CPI
“While the focus is still offshore and will likely remain that way into US CPI data, NZ current account and GDP data on Wednesday and Thursday will also be important scene-setters.”
“Ukrainian developments (Russia retreating in some areas) haven’t done much to commodities, but it’s early days, and we’re watching closely.”
“On the technical side, the size of the bounce off the psychological 0.60 level has now been significant, and macro events notwithstanding, that might keep uber-bearish NZD sentiment at bay.”
“Support 0.5940/0.6000 Resistance 0.6575/0.6660.”
-
07:50
EUR/USD to hover around parity in the coming months – NBF
EUR/USD continues to hover around parity. Economists at the National Bank of Canada believe the pair could remain in this situation for some time.
ECB appears committed to contain inflation with higher interest rates
“The euro continues to hover around parity with the USD and could remain in this situation for some time. The common currency area is likely headed for negative growth as its economic situation deteriorates.”
“The European Central Bank appears committed to contain inflation with higher interest rates, a development that could help stabilize EUR/USD.”
“We see EUR/USD trading sideways in the coming months before moving higher on the back of trade-weighted USD weakness.”
-
07:48
USD/JPY now seen within 140.80/144.60 – UOB
USD/JPY seems to have moved into a consolidative phase, likely between 140.80 and 144.60 in the next weeks, comment FX Strategists at UOB Group Quek Ser Leang and Peter Chia.
Key Quotes
24-hour view: “We did not expect the sharp drop in USD to 141.49 and the subsequent strong bounce from the low (we were expecting USD to range trade). The strong rebound amidst oversold conditions suggests USD is unlikely to weaken further. For today, USD is more likely to consolidate and trade between 141.80 and 143.80.”
Next 1-3 weeks: “Last Friday, USD dropped sharply and cracked our ‘strong support’ level at 142.50. The breach of the ‘strong support’ indicates that the 2week USD rally (see annotations in the chart below) has ended. The current price actions are likely the early stages of a consolidation phase. After the recent outsized rally, USD is likely to consolidate within a broad range of 140.80/144.60.”
-
07:47
French FinMin Le Maire: Consumers will need to absorb a “small part” of surging energy costs
French Finance Minister Bruno Le Maire said on Monday that consumers will need to absorb a "small part" of surging energy costs, as the government can't bear all of the increase.
He said that “France's public deficit target of 5% will be met next year despite increased spending to protect households from rising inflation.”
Market reaction
At the time of writing, EUR/USD is advancing 0.72% on the day to trade at 1.0111, as the US dollar extends its correction in the European morning.
-
07:39
USD/BRL: Central bank supports real ahead of the election – Commerzbank
The real was able to appreciate after the inflation data for August last Friday. The Brazilian central bank (BCB) remains an important support for the real, in the opinion fo economists at Commerzbank.
Incumbent Jair Bolsonaro continues to trail in the polls
“Inflation fell less than expected despite tax cuts and measures to reduce fuel prices. The price categories not affected by the measures continued to rise unabated. That means the likelihood of the BCB’s rate hike cycle being extended has risen. This is likely to strengthen the resilience of the real ahead of the politically turbulent weeks.”
“Concerns about unrest at the occasion of the National holiday last week were not confirmed but the incumbent Jair Bolsonaro continues to trail in the polls. That means the gloves will be off in the election campaign and threatens to affect the real time and again.”
-
07:38
AUD/USD advances towards 0.6900 ahead of US Inflation and Aussie Employment data
- AUD/USD is marching towards 0.6900 on a lower forecast for headline US inflation.
- A decline in US inflation could scale down the hawkish tone of Fed policymakers.
- The Aussies economy is expected to display job additions by 50k against layouts reported earlier.
The AUD/USD pair is displaying back-and-forth moves in a tad higher range of 0.6824-0.6852 from the early Tokyo session. The asset has turned sideways after printing a fresh September high at 0.6877. The major is expected to continue its advancing momentum after an upside break of the consolidation.
Investors are underpinning the aussie bulls against the greenback on lower forecasts for US inflation. A decline in consensus for the US Consumer Price Index (CPI) data, which will release on Tuesday, is seen at 8.1%, lower than the prior release of 8.5%. While the core CPI that excludes fossil fuels and food prices is seen higher at 6% by 10 basis points (bps). An occurrence of the same will delight the households as the latter is facing the headwinds of higher payouts.
No doubt, back-to-back decline in the headline US Consumer Price Index (CPI) warrant exhaustion signals. Falling gasoline prices in the US and jaw-dropping interest rates have resulted in a decline in inflation forecasts. The odds of a rate hike by the Federal Reserve (Fed) in the September monetary policy meeting remain solid, however, the scale of the hawkish tone could trim as the Fed will have the luxury of hiking rates modestly.
On the Aussie front, investors are awaiting the release of the employment data. As per the consensus, the Unemployment Rate is expected to remain stable at 3.4%. The show stopper data will be Employment Change, which is seen extremely higher at 50k against job cuts of 40.9k.
-
07:37
Natural Gas Futures: Room for extra gains near term
CME Group’s flash data for natural gas futures markets showed open interest reverse two consecutive daily pullbacks and rise by around 2.7K contracts on Friday. On the other hand, volume went down for the third session in a row, this time by around 71.6K contracts.
Natural Gas remains supported near $7.50
Prices of natural gas kept the optimism intact in the second half of last week amidst increasing open interest and a marked drop in volume. Against that, further upside should not be ruled out, although a sustained recovery appears not favoured in the very near term.
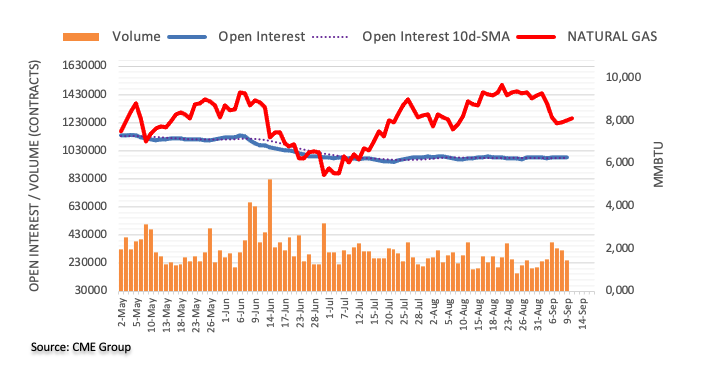
-
07:34
Gold Price Forecast: XAU/USD needs acceptance above $1,730-$1734 to regain traction
Gold price turns south after Friday’s rebound. XAU/USD could regain traction on a sustained move above $1,730-$1734, FXStreet’s Dhwani Mehta reports.
Support at $1,708 could likely limit the decline
“The recovery from six-week lows could regain traction on a sustained move above the $1,720 round number, above which the $1,730-$1,734 supply zone could come into play. The area is the confluence of the recent range highs and the bearish 21-Daily Moving Average (DMA). Further up, the 50-DMA at $1,742 will be a tough nut to crack for bulls.”
“On the downside, the channel resistance-turned-support at $1,708 could likely limit the decline. The next cushion is seen at the $1,700 threshold, below which the rising trendline support of $1,695 will be challenged.”
-
07:31
EUR/USD: Devaluation risks for the euro as long as energy crisis is not over – Commerzbank
The energy crisis lingers, which is a fatal signal for the common currency. Economists at Commerzbank expect the euro to remain under pressure.
The energy crisis remains a significant drag on the euro
“The energy crisis remains a significant drag on the euro, even if the ECB can convince the markets that monetary policy follows a restrictive stance. After all, high energy prices make the euro area poorer.”
“The energy crisis bears signs of a classic terms-of-trade shock in which euro area export prices must fall relative to import prices. In currency areas with flexible exchange rates, the necessary relative price adjustment takes place at least in part via the exchange rate. This means that as long as the energy crisis is not over, there are devaluation risks for the euro.”
-
07:30
AUD/USD: Next on the upside comes 0.6920 – UOB
In the opinion of FX Strategists at UOB Group Quek Ser Leang and Peter Chia, further gains in AUD/USD should meet the next hurdle at 0.6920.
Key Quotes
24-hour view: “Last Friday, we highlighted that AUD ‘is likely to edge higher but is not expected to break the strong resistance at 0.6800’. However, AUD took out 0.6800 and surged to 0.6877. Despite the subsequent pullback from the high, there appears to be enough momentum for AUD to advance from here. That said, the major resistance at 0.6920 is not expected to come under threat (there is another resistance at 0.6880). Support is at 0.6820 but only a breach of 0.6795 would indicate that AUD is unlikely to advance further.”
Next 1-3 weeks: “We did not expect the strong surge in AUD last Friday that took out our ‘strong resistance’ at 0.6800. The break of the ‘strong resistance’ has invalidated our view for AUD to weaken. The rapid boost in momentum has shifted the risk to the upside even though any advance is likely limited to a test of the major resistance at 0.6920. On the downside, a breach of 0.6760 (current ‘strong support’ level) would indicate that AUD is unlikely to rise towards 0.6920.”
-
07:27
FX option expiries for Sept 12 NY cut
FX option expiries for Sept 12 NY cut at 10:00 Eastern Time, via DTCC, can be found below.
- EUR/USD: EUR amounts
- 0.9925 429m
- 0.9950-55 453m
- 1.0000 760m
- 1.0010-20 881
- 1.0050 473m
- 1.0065-75 715m
- 1.0080 352m
- 1.0100 758m
- 1.0150 274m
- 1.0200 387m
- GBP/USD: GBP amounts
- 1.1500 310m
- 1.1875 955m
- USD/JPY: USD amounts
- 141.50 555m
- 142.00 280m
- 142.50-52 711m
- 143.00 760m
- USD/CHF: USD amounts
- 0.9600 600m
- AUD/USD: AUD amounts
- 0.6900 228m
- 0.6940 365m
- 0.7000 201m
- USD/CAD: USD amounts
- 1.2850 260m
-
07:25
Crude Oil Futures: Upside lacks strength
Advanced prints from CME Group for crude oil futures markets noted investors trimmed their open interest positions for the second straight session on Friday, now by nearly 12K contracts. Volume followed suit and added around 58.3K contracts to the previous retracement.
WTI could revisit $81.20
Prices of the WTI edged higher for the second session in a row on Friday. The rebound, however, was on the back of shrinking open interest and volume, hinting at the idea that further upside could lack sustainability in the very near term at least. That said, the WTI could attempt another challenge of the multi-month lows at $81.20 (September 8).
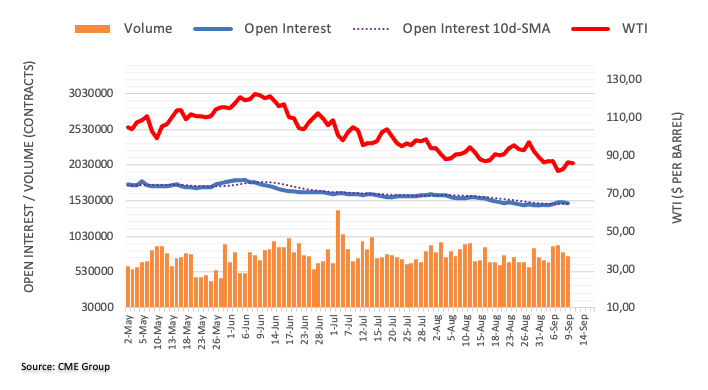
-
07:22
GBP/JPY renews 11-week top below 167.00 amid firmer yields, mixed UK data
- GBP/JPY takes the bids to refresh multi-day high despite mixed UK statistics.
- UK GDP, Manufacturing/Industrial Production numbers disappoint but trade balance improved in July.
- Treasury yields regain upside momentum as central bankers keep hawkish bias intact.
- Chatters over BOJ, covid relief package challenge upside momentum.
GBP/JPY marches towards 167.00, up 0.90% around 166.70, as mixed UK economics join firmer Treasury yields to please bulls during the initial hours of London open on Monday. The upside momentum also takes clues from the technical signals as the quote breaks the short-term key hurdle for the bulls.
That said, the UK’s Gross Domestic Product (GDP) for July eased to 0.2% versus 0.5% market forecasts and -0.6% prior. Further, the figures for Industrial Production and Manufacturing Productions also marked a downbeat outcome on an MoM basis, despite improving from priors on YoY. It should be noted, however, that trade balance data have been firmer and seemed to have helped the GBP/JPY bulls of late.
Also read: UK Manufacturing Production rises 0.1% MoM in July vs. 0.6% expected
Elsewhere, US 10-year Treasury yields add two basis points (bps) to 1.34% while reversing the previous day’s downbeat performance amid Monday’s sluggish session, due to China’s holiday and a light calendar. Even so, recently hawkish comments from the policymakers of the European Central Bank (ECB) and the US Federal Reserve (Fed) seem to keep the fears of the recession on the table. On the same line could be the hawkish hopes from the Bank of England (BOE), especially after Liz Truss won the UK PM candidacy.
On the contrary, economic fears surrounding Britain, mainly due to the expectations of further activity halt on Queen’s death, join the chatters over the Bank of Japan’s (BOJ) market intervention to defend the yen and likely rolling back of the covid stimulus also probe the bulls.
It’s worth mentioning that the absence of China and a light calendar elsewhere might restrict the GBP/JPY moves looking forward.
Technical analysis
A sustained upside break of a 2.5-month-long horizontal resistance area, now support around 166.30, directs the GBP/JPY towards the yearly peak surrounding 168.50. During the anticipated run-up, the tops marked in late June and April, respectively around 167.85 and 168.40, could act as buffers.
-
07:15
GBP/USD recovers losses despite weaker-than-expected UK economic data
- GBP/USD has recovered the data-induced decline despite lower-than-expected UK economic data.
- The UK economy is expanded by 0.2% against a contraction of 0.6% reported earlier.
- Both Industrial and Manufacturing Production remained lower at 1.1% than expected.
The GBP/USD pair dropped to near 1.1610 after the release of the lower-than-expected UK economic data but recovered from the heated decline. The Gross Domestic Product (GDP) data has expanded by 0.2%, lower than the consensus of 0.5% but remained upbeat than the contraction of 0.6% reported earlier.
Industrial Production has landed lower at 1.1% vs. expectation of 2% and the prior release of 2.4%. Also, the Manufacturing Production data has remained lower than expectations. The economic data is released at 1.1%, lower than the expectations and the prior release of 1.7% and 1.3% on an annual basis.
On a broader note, the cable is advancing firmly after the UK economy chose Liz Truss for the next UK Prime Minister. Her selection for managing UK leadership brought a sense of political stability in the pound zone. Truss has already announced stimulus packages for households to safeguard them against the ramping up energy bills. The ideology behind announcing stimulus packages aiming to reduce taxes and energy bills will leave more purchasing power to them to offset the higher payouts.
Meanwhile, the US dollar index (DXY) is facing barricades around 108.85 on lower consensus for US Consumer Price Index (CPI) data, which will release on Tuesday. The headline CPI is seen at 8.1%, lower than the prior release of 8.5%. While the core CPI that doesn’t inculcate food and oil prices will elevate by 10 basis points (bps) to 6%.
A decline in the price pressures will not halt the spree of rate hikes by the Federal Reserve (Fed). However, it could scale down their hawkish tone as the Fed will have the luxury of avoiding going all in and dictate a subtle rate hike.
-
07:12
GBP/USD: A breakout of 1.1700 appears not favoured – UOB
A move beyond 1.1700 in GBP/USD looks unlikely for the time being, noted FX Strategists at UOB Group Quek Ser Leang and Peter Chia.
Key Quotes
24-hour view: “We expected GBP to ‘continue to range-trade’ last Friday. Instead of range-trading, GBP soared to a high of 1.1646 before closing higher by 0.75% (NY close of 1.1584), its biggest 1-day gain in more than a month. While approaching overbought, the advance in GBP could extend to 1.1665. For today, the next resistance at 1.1700 is not expected to come into view. Support is at 1.1575 followed by 1.1550.”
Next 1-3 weeks: “We turned neutral on GBP last Wednesday (06 Sep, spot at 1.1575) and expected it to consolidate. Last Friday, GBP soared to a high of 1.1646, above the top of our expected range. Upward momentum has improved, albeit not by much. From here, GBP is likely to edge higher but the chance for a break of the major resistance at 1.1700 is not high for now. On the downside, a breach of 1.1520 would indicate that the current upward pressure has eased.”
-
07:06
Gold Price Forecast: XAU/USD sellers aim for $1,690 with eyes on US inflation
- Gold price fades upside momentum, breaks three-day-old support amid sluggish session.
- Firmer yields, fears surrounding China/Russia seemed to have recalled XAU/USD sellers.
- US consumer-centric data appears key for fresh impulse amid Fed blackout period.
Gold price (XAU/USD) retreats from a one-week high, flashed the previous day, to $1,713 heading into Monday’s European session. In doing so, the bullion traders seem to take clues from the firmer US Treasury yields, as well as the fears surrounding China and Russia.
US 10-year Treasury yields add two basis points (bps) to 1.34% while reversing the previous day’s downbeat performance amid Monday’s sluggish session, due to China’s holiday and a light calendar. Even so, recently hawkish comments from the policymakers of the European Central Bank (ECB) and the US Federal Reserve (Fed) seem to keep the fears of the recession on the table.
“Many policymakers saw a growing probability that they will need to take the rate into "restrictive territory", jargon for a level of rates that causes the economy to slow, at 2% or above,” mentioned Reuters while quoting five sources. Among them, comments from Bundesbank President and ECB Governing Council member Joachim Nagel and Bank of Greece Governor Yannis Stournaras seem to gain major attention.
On the other hand, Federal Reserve Governor Christopher Waller was the prominent one as he said on Friday that he supports another significant hike in two weeks. On the same line was Kansas City Fed President Esther George who said, as reported by Reuters, “Case for continuing to remove policy accommodation is clear cut.” Furthermore, Cleveland Federal Reserve Bank President Loretta Mester said, “One inflation report is insufficient to alter one's outlook.” The policymaker also stated that he sees policy rates rising slightly above 4% by early 2023.
Elsewhere, US Treasury Secretary Yellen’s comments suggesting more pain for the US consumers due to the energy crisis and headlines suggesting US President Joe Biden’s readiness to increase hardships for Chinese chipmakers seem to challenge the previous optimism. Furthermore, fears that Russia could retaliate with greater strength after witnessing the retreat of some Moscow-backed militaries in Ukraine, also weigh on the XAU/USD prices.
It’s worth noting, however, that the absence of Chinese traders from the market and a light calendar, as well as the blackout period of the Fed policymakers ahead of September’s Federal Open Market Committee (FOMC) meeting test the intraday traders of the metal.
Looking forward, the US Consumer Price Index (CPI) and Retail Sales for August, as well as the preliminary readings of the Michigan Consumer Sentiment Index for September, will be important for fresh directions.
Technical analysis
A clear break of an upward sloping support trend line from the last Wednesday, now resistance around $1,720, directs gold price towards the $1,700 threshold.
However, an upward sloping support line from July 21, close to $1,690, could challenge the XAU/USD bears before directing them towards the yearly low surrounding $1,680.
Meanwhile, gold buyers have a bumpy road to return even if they manage to cross the $1,720 immediate hurdle.
That said, a descending resistance line from mid-August precedes the 100-SMA, respectively around $1,724 and $1,727, to limit the short-term upside of the metal. Following that, a weekly resistance line and the 200-SMA, close to $1,731 and $1,751, will gain the market’s attention.
Gold: Four-hour chart

Trend: Limited downside expected
-
07:03
UK Manufacturing Production rises 0.1% MoM in July vs. 0.6% expected
The industrial sector recovery regained traction in July, the latest UK industrial and manufacturing production data published by Office for National Statistics (ONS) showed on Monday.
Manufacturing output arrived at 0.1% MoM in July versus 0.6% expectations and -1.6% booked in June while total industrial output came in at -0.3% vs. 0.4% expected and -0.9% last.
On an annualized basis, the UK manufacturing production figures came in at 1.1% in July, missing expectations of 1.7%. Total industrial output rose by 1.1% in the seventh month of the year against a 2.0% reading expected and the previous 2.4% print.
Separately, the UK goods trade balance numbers were published, which arrived at GBP-19.362 billion in July versus GBP-22.695 billion expectations and GBP-22.847 billion last. The total trade balance (non-EU) came in at GBP-10.194 billion in July versus GBP-12.290 billion previous.
Related reads
- UK GDP expands 0.2% MoM in July vs. 0.5% expected
- GBP/USD recovers losses despite weaker-than-expected UK economic data
-
07:02
United Kingdom Total Trade Balance increased to £-7.793B in July from previous £-11.387B
-
07:02
United Kingdom Industrial Production (MoM) came in at -0.3% below forecasts (0.4%) in July
-
07:02
Denmark Consumer Price Index (YoY): 8.9% (August) vs 8.7%
-
07:01
United Kingdom Manufacturing Production (YoY) came in at 1.1% below forecasts (1.7%) in July
-
07:01
Denmark Inflation (HICP) (YoY) up to 9.9% in August from previous 9.6%
-
07:01
United Kingdom Index of Services (3M/3M) came in at -0.2%, above expectations (-0.8%) in July
-
07:01
United Kingdom Manufacturing Production (MoM) below forecasts (0.6%) in July: Actual (0.1%)
-
07:01
United Kingdom Trade Balance; non-EU above expectations (£-12.648B) in July: Actual (£-10.194B)
-
07:01
UK GDP expands 0.2% MoM in July vs. 0.5% expected
- UK GDP arrived at 0.2% MoM in July vs. 0.5% expected.
- GBP/USD remains unfazed above 1.1600 on UK GDP miss.
The UK GDP monthly release showed that the economy rebounded in July, growing at 0.2% vs. 0.5% expectations and -0.6% previous.
A Reuters poll of economists had pointed to month-on-month growth of 0.4% in July.
Meanwhile, the Index of services (July) came in at -0.2% 3M/3M vs. -0.8% estimate and -0.4% prior.
Key takeaways via ONS
“Services grew by 0.4% in July 2022, after a fall of 0.5% in June 2022, and was the main driver to the rise in GDP; information and communication grew by 1.5% and was the largest contributor to the services growth in July.”
“Production fell by 0.3% after a fall of 0.9% in June 2022; this was mainly because of a fall of 3.4% in electricity, gas, steam, and air conditioning supply.”
“Construction also fell in July 2022 by 0.8%, after a fall of 1.4% in June 2022; the decrease in monthly construction output in July 2022 came solely from repair and maintenance, which fell 2.6%.”
Market reaction
The Cable remains little changed on the below-forecast UK growth numbers. The spot is adding 0.22% on the day.
About UK GDP
The Gross Domestic Product released by the National Statistics is a measure of the total value of all goods and services produced by the UK. The GDP is considered as a broad measure of the UK economic activity. Generally speaking, a rising trend has a positive effect on the GBP, while a falling trend is seen as negative (or bearish).
-
07:01
Japan Machine Tool Orders (YoY) rose from previous 5.5% to 10.7% in August
-
07:00
United Kingdom Goods Trade Balance came in at £-19.362B, above forecasts (£-22.695B) in July
-
07:00
United Kingdom Industrial Production (YoY) below forecasts (2%) in July: Actual (1.1%)
-
07:00
United Kingdom Gross Domestic Product (MoM) below forecasts (0.5%) in July: Actual (0.2%)
-
06:55
Gold Price Forecast: XAU/USD's technical outlook points to a lack of recovery momentum
Last week, gold failed to preserve its bullish momentum and closed little changed below $1,720. In the view of FXStreet’s Eren Sengezer, gold’s near-term technical outlook points to a neutral/bearish bias.
$1,700 stays intact as significant support
“The Relative Strength Index (RSI) indicator on the daily chart is yet to reach 50, suggesting that XAU/USD has more correction room on the upside despite struggling to gather bullish momentum.”
“$1,740 (20-day SMA, 50-day SMA) aligns as key resistance. With a daily close above that level, additional gains toward $1,760 (Fibonacci 23.6% retracement of the latest downtrend) and $1,790 (100-period SMA) could be witnessed.”
“$1,700 (psychological level, end-point of the downtrend) stays intact as significant support. In case gold falls below that level and starts using it as resistance, bears could target $1,680 (July 21 low) and $1,675 (static support from March 2021).”
-
06:52
Gold Futures: Some consolidation looks likely
Open interest in gold futures markets rose for the second session in a row on Friday, this time by just 270 contracts according to preliminary readings from CME Group. Volume, instead, extended the ongoing choppiness and shrank by around 26.8K contracts.
Gold appears supported around $1,680
Gold prices retested the upper end of the range near $1,730 on Friday, just to give away part of those gains afterwards. The move was accompanied by a small increase in open interest and a marked retracement in volume, which could allow for some extra gains in the very near term although always within the prevailing range bound theme. In the meantime, the $1,680 region still emerges as decent contention.
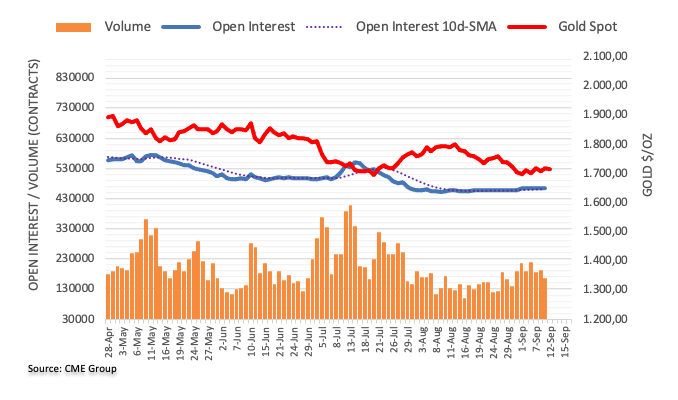
-
06:50
EUR/USD Price Analysis: Bulls gear up for a mark-up phase, 1.0097-1.0114 range a critical zone
- A prolonged accumulation will be followed by a markup phase ahead.
- The shared currency bulls await a break above the 1.0097-1.0114 supply zone for a fresh rally.
- Advancing 20-and 50-EMAs add to the upside filters.
The EUR/USD pair is displaying a lackluster performance in the Asian session as investors have shifted to the sidelines ahead of the US inflation data. The asset is oscillating in a narrow range of 1.0061-1.0104 and is expected to continue its rangebound performance. The major has remained in the grip of bulls for the past week after printing a multi-year low below 0.9900.
On an hourly scale, the asset is hovering around the supply zone, placed in a 1.0097-1.0114 range. A prolonged accumulation in a 0.9864-1.0097 range indicates a transfer of assets from retail participants to institutional investors. This also serves as a bullish reversal and results in sheer upside ahead. A breakout of the accumulation phase results in a markup phase ahead.
The 20-and 50-period Exponential Moving Averages (EMAs) at 1.0066 and 1.0040 respectively are advancing higher, which adds to the upside filters.
Also, the Relative Strength Index (RSI) (14) is attempting to shift into the bullish range of 60.00-80.00, which will strengthen the shared currency bulls further.
A decisive break above the 1.0097-1.0114 range supply zone will drive the asset towards August 17 high at 1.0203, followed by July 21 high at 1.0278.
Alternatively, the shared currency bulls would lose their grip if the asset drops below August 26 low at 0.9947. If it happens then the asset could decline further towards Monday’s low at 0.9878 and round-level support at 0.9800.
EUR/USD hourly chart
-637985585804477136.png)
-
06:37
USD/CAD leans bearish towards 1.3000 on downbeat options market signals
USD/CAD remains pressured around the lowest levels in a fortnight amid the sluggish European morning on Monday. That said, the Loonie pair seesaws near 1.3030 during the four-day downtrend amid the bearish bias of the options market traders.
One-month risk reversal (RR) on USD/CAD, a measure of the spread between call and put prices, dropped during the last two consecutive days, while also printing the weekly negative, per the data source Reuters.
A call option gives the holder the right but not the obligation to buy the underlying asset at a predetermined price on or before a specific date. A put option represents a right to sell. That said, the weekly RR dropped to -0.130 by the end of Friday.
The options market signal also follows the latest USD/CAD RR on the daily, to -0.163 at the latest.
Considering the broad US dollar pullback, as well as the bearish options market signals, the USD/CAD pair may ignore the recent weakness in the oil prices, Canada’s main exports to lure the pair sellers.
Also read: USD/CAD stay pressured towards 1.3000 amid firmer oil, USD weakness ahead of US inflation
-
06:33
EUR/USD faces solid resistance at 1.0180 – UOB
FX Strategists at UOB Group Quek Ser Leang and Peter Chia noted further upside in EUR/USD should meet the next up barrier at 1.0180.
Key Quotes
24-hour view: “While we expected EUR to strengthen last Friday, we were of the view that ‘any advance is unlikely to break 1.0090’. However, EUR cracked 1.0090 and soared to 1.0112 before retreating to close at 1.0039 (+0.45%). Despite the sharp retreat, momentum still appears to be positive and we see room for EUR to retest the 1.0115 level. For today, a sustained rise above this level is unlikely (next resistance is at 1.0140). Support is at 1.0030 but only a breach of 1.0000 would indicate that EUR is unlikely to advance further.”
Next 1-3 weeks: “Last Thursday (08 Sep, spot at 0.9990), we indicated that the downside risk is EUR has dissipated and we expected EUR to consolidate and trade between 0.9900 and 1.0090. On Friday, EUR soared above 0.9990 and rose to 1.0112. Upward momentum is beginning to build and EUR is likely to trade with an upward bias in the coming days. However, any advance is expected to face solid resistance at 1.0180. The upside bias is intact as long as EUR does not move below the ‘strong support’ level, currently at 0.9960.”
-
06:28
Steel price remains firmer even as China’s holiday, covid policy probe bulls
- Steel price grinds higher around one-week top amid sluggish session.
- China’s off, light calendar restrict market movements as traders await US/China inflation.
- Virus, emission-led activity restricts for Chinese steel producers test the upside momentum.
- Fears of a supply crunch, recently softer US dollar underpin bullish bias.
Steel buyers keep reins during early Monday in Europe, despite a lackluster start to the week, as fears of supply crunch join cautious optimism surrounding the global economic rebound.
That said, steel rebar prices on the Shanghai Futures Exchange (SFE), as well as the most active steel contract on the London Metal Exchange (LME), both print over 2.0% intraday gains by the press time.
In doing so, the metals cheer the broad weakness of the US dollar, as well as hopes that the Chinese government will announce more stimulus to defend the metal industry, as well as the world’s second-largest economy to slip into the recession. Also keeping the metal prices firmer are the recent output restrictions, due to the covid and the emission-linked stipulations.
The supply-crunch fears have regained momentum after multiple days of inactivity on the production front joining recent hopes that the global central bankers will be able to renew growth.
On the other hand, fresh geopolitical and trade headlines surrounding China and Russia appear to probe the metal buyers. On the same line could be the hawkish outlook of the Fed policymakers, as well as the doubts over China’s stimulus. Recently, headlines suggesting US President Joe Biden’s readiness to hit China with broader curbs on US chip and tool exports seemed to have tested the metal buyers.
It’s worth noting that a fortnight-long blackout of the Fed policymakers and a light calendar ahead of the US consumer-centric data, including the key inflation readings, seem to favor the steel buyers of late.
In addition to the US and China Consumer Price Index (CPI), the Retail Sales for August, as well as the preliminary readings of the Michigan Consumer Sentiment Index for September, will also be important for fresh impulse.
-
06:17
Asian Stock Market: Extensively bullish on subdued DXY, oil slips to near $85.00
- Asian indices are advancing amid DXY’s lackluster performance ahead of US CPI.
- Chinese equities have carry-forwarded their buying spree on expectations of PBOC’s dovish stance.
- The black gold is facing the heat on lower consensus for oil demand.
Markets in the Asian domain are displaying a rock-solid performance, following the footprints of Wall Street performance on Friday. Asian indices have been infused with fresh blood as the US dollar index (DXY) is displaying a subdued performance in the Asian session. The DXY is oscillating in a narrow range of 108.58-108.85 after a subpar opening as investors are awaiting the release of the US Consumer Price Index (CPI).
At the press time, Japan’s Nikkei225 jumped 1.06%, ChinaA50 soared 1.68%, Hang Seng mounts 2.69%, and Nifty50 gained 0.64%.
The DXY is displaying a lackluster performance ahead of the US inflation, which will release on Tuesday. The headline US CPI is seen lower at 8.1% against the prior release of 8.5%. As gasoline prices in the US have fallen significantly and interest rates are continuously elevating, price pressures are highly expected to cool down further.
On Monday, Chinese equities carry-forwarded their Friday’s bullish stance on a decline in China’s inflation data. The economic data landed at 2.5%, lower than the expectations and the prior release of 2.8% and 2.7% respectively on an annual basis. A decline in China’s inflation will force the People’s Bank of China (PBOC) to sound dovish and trim the Prime Lending Rate (PLR) further. And, more liquidity flush into the economy will spurt the volumes in economic activities.
On the oil front, oil prices have declined as oil demand in China is expected to contract for the first time in the last two decades. The lockdown curbs to contain the spread of Covid-19 have restricted the movement of men, materials, and machines. Therefore, the upcoming holiday week and households staying at home will keep the oil demand on the tenterhooks.
-
06:08
When are the UK data releases and how could they affect GBP/USD?
The UK Economic Data Overview
The British economic calendar is all set to entertain the cable traders during the early hours of Monday, at 06:00 GMT with the monthly release of July 2022 GDP figures. Also increasing the importance of that time are Trade Balance and Industrial Production details for the stated period.
Having witnessed a contraction of 0.6% in economic activities during June 2022, market players will be interested in July’s monthly GDP figures to confirm the recently hawkish hopes from the Bank of England (BOE), especially after Liz Truss’ elections as the UK PM.
Forecasts suggest that the UK GDP will reverse the previous drop with 0.5% MoM in July. GBP/USD traders also await the Index of Services (3M/3M) for the same period, likely to deteriorate to -0.8% versus -0.4% prior, for further insight.
Meanwhile, Manufacturing Production, which makes up around 80% of total industrial production, is expected to improve to 0.6% MoM in July. Also, the total Industrial Production is expected to rise to 0.4% versus -0.9% previous figures.
Considering the yearly figures, the Industrial Production for July is expected to have eased to 2.0% versus 2.4% previous while the Manufacturing Production is anticipated to have risen to 1.7% in the reported month versus 1.3% the last.
Separately, the UK Goods Trade Balance will be reported at the same time, prior £11.387B.
Deviation impact on GBP/USD
Readers can find FX Street's proprietary deviation impact map of the event below. As observed the reaction is likely to remain confined around 20-pips in deviations up to + or -2, although in some cases, if notable enough, a deviation can fuel movements over 60-70 pips.
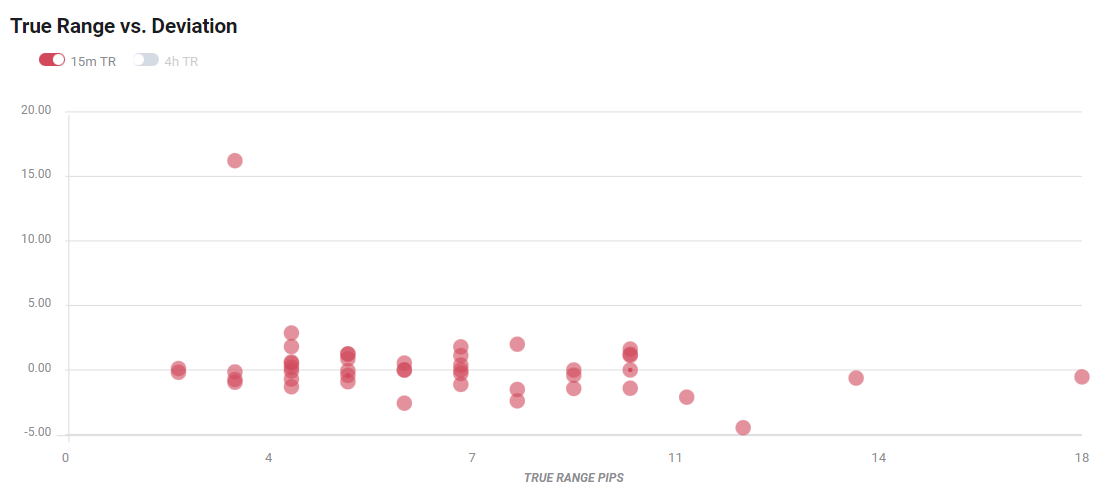
How could affect GBP/USD?
GBP/USD pares intraday losses around 1.1600 ahead of the key data releases on Monday. In doing so, the Cable pair struggles to defend buyers amid fears that the ongoing economic inaction in the UK, due to Queen’s death, might add to the recession fears of the nation.
Given the increasing push to the BOE towards following the hawkish Fed, mainly due to the newly elected PM Liz Truss’ criticism of the BOE’s slow action, the GBP/USD may witness further upside in the case of upbeat data. It’s worth noting, however, that major attention will be given to the UK/US inflation numbers, up for publishing on Tuesday and Wednesday. Even if the scheduled data print a softer outcome, the GBP/USD upside appears more likely due to the US dollar’s pullback from the multi-year high, as well as due to the cautious optimism in the markets amid a sluggish session.
Ahead of the event, Westpac said, “The trade deficit is set to remain wide in July given the strength of imports) market forecasts: -£11300mn).
Technically, GBP/USD bulls cheer the upside break of the 10-DMA and monthly bearish channel amid the recently firmer RSI (14) and the strongest bullish MACD signals to aim for the 21-DMA hurdle surrounding 1.1700 ahead of the UK’s key monthly statistics for July.
In case of an alternative move, the 10-DMA resistance-turned-support, around 1.1555 by the press time, will precede the stated bearish channel’s upper line, close to 1.1500 at the latest, to restrict the short-term downside.
Key notes
GBP/USD stays mildly bid below 1.1650 as BOE postpones meeting, UK data, US inflation eyed
GBP/USD Price Analysis: Bulls keep reins above 1.1600 ahead of UK data dump
GBP/USD Weekly Forecast: Eyes 21 DMA on a technical rebound ahead of critical US, UK events
About the UK Economic Data
The Gross Domestic Product released by the Office for National Statistics (ONS) is a measure of the total value of all goods and services produced by the UK. The GDP is considered as a broad measure of the UK economic activity. Generally speaking, a rising trend has a positive effect on the GBP, while a falling trend is seen as negative (or bearish).
The Manufacturing Production released by the Office for National Statistics (ONS) measures the manufacturing output. Manufacturing Production is significant as a short-term indicator of the strength of UK manufacturing activity that dominates a large part of total GDP. A high reading is seen as positive (or bullish) for the GBP, while a low reading is seen as negative (or bearish).
The trade balance released by the Office for National Statistics (ONS) is a balance between exports and imports of goods. A positive value shows trade surplus, while a negative value shows trade deficit. It is an event that generates some volatility for the GBP.
-
06:03
BOJ set to end COVID-relief scheme but leave its loose policy unchanged – Reuters
The Bank of Japan (BOJ) is on track to end its COVID-19-relief funding scheme but the central bank is likely to maintain ultra-low rates at the September 21-22 policy meeting, Reuters reports, citing three sources familiar with its thinking.
Key takeaways
"While some firms remain under stress, corporate funding has generally improved."
"Conditions for ending the scheme is falling into place.”
With risks to the economy broadening, the BOJ may also change a portion of its policy guidance that pledges to "scrutinize the impact of the pandemic" and "strive to support corporate funding conditions.”
Related reads
- USD/JPY oversteps 143.00, more upside seems favored on hawkish Fed bets
- Japan’s Kihara: Must take steps against 'excessive' yen moves
-
05:57
US inflation: A big downside miss to core CPI to knock the Fed off course – Scotiabank
Analysts at Scotiabank offer their take on Tuesday’s US inflation data and its implications on the Fed rate hike trajectory.
Key quotes
“Tuesday’s CPI figures ... may further inform whether the FOMC hikes by 75bps or 50bps on September 21st but there is a high bar to whether they matter.”
“I say high bar because when given the opportunity to lean against market pricing for a 75bps move, Chair Powell took a pass in his appearance at a Cato Institute event. Several of his FOMC colleagues appeared to behave similarly.”
“It would probably take a big downside miss to core CPI to knock the Fed off course and even that is not assured.”
“It’s the annualized month-over-month core CPI reading that matters more than the year-over-year rate and so an estimated 6.3% m/m SAAR reading in core CPI would likely motivate the FOMC to believe that underlying inflation continues to run hot with broad pressures.”
“One input to the call is the Cleveland Fed’s CPI ‘nowcasts.’ ... They have been a useful but not infallible source of input into the estimates. Still, the signal on core inflation points to a hot reading that should have markets looking through headline influences stemming from energy prices.”
-
05:41
USD/JPY oversteps 143.00, more upside seems favored on hawkish Fed bets
- USD/JPY has crossed 143.00 as odds of a bumper rate hike by the Fed have advanced.
- The ongoing price pressures have highly deviated from the desired inflation rate of 2%.
- An expectation of intervention in the Fx market by Japan seems unable to support the depreciating yen.
The USD/JPY pair has advanced sharply after a little shaky opening and is hovering around 143.00 in the Asian session. The asset is expected to advance further after slaughtering the immediate hurdle of 143.00 as the Federal Reserve (Fed) is preparing to scale up its interest rates further this year. On a broader note, the major has attempted a firm rebound after the conclusion of retracement from the previous week’s high around 145.00.
There is no denying the fact that the US economy has entered into a decline phase of US inflation as back-to-back declines in headline US Consumer Price Index (CPI) warrant exhaustion signals. Falling gasoline prices in the US and jaw-dropping interest rates have resulted in a decline in inflation forecasts. The plain-vanilla CPI that does inculcate food and energy prices is seen at 8.1%, lower than the prior release of 8.5%. A decline in the inflation rate is music to the ears but the Fed will continue its hawkish stance further.
The deviation between desired inflation rate, which is 2% and ongoing inflationary pressures is quite huge. Therefore, the Fed will continue its hawkish guidance and will observe the inflation rate for several months to shift its stance. In September’s monetary policy meeting, the Fed is expected to announce a third consecutive 75 basis points (bps) interest rate hike.
On the Tokyo front, investors are awaiting more build-up on news of Japan’s intervening in the Fx market to support yen. Japan's top currency diplomat Kanda said on Thursday that recent yen falls cannot be justified based on fundamentals, as reported by Reuters.
He further added that the Bank of Japan (BOJ) is expected to take necessary action to support the yen bulls. Also, Tokyo is communicating with other countries on recent Fx moves. The meeting was attended by officials from Japan’s Ministry of Finance, the Financial Institutions Agency, and the Bank of Japan (BOJ).
-
05:38
EUR/GBP Price Analysis: Bulls approach 0. 8700 inside ascending triangle
- EUR/GBP picks up bids to reverse Friday’s losses.
- Successful rebound from 21-SMA, bullish chart formation favor buyers.
- Sellers need to break 100-SMA to retake control, 61.8% FE acts as additional upside filters.
EUR/GBP bulls keep reins around 0.8680-85 inside a weekly ascending triangle formation during early Monday morning in Europe. In doing so, the cross-currency pair teases buyers ahead of the UK’s data dump for July.
That said, the quote’s latest rebound took place from the 21-SMA, which in turn gained support from the upward sloping RSI (14), not overbought, to keep buyers hopeful.
Hence, a descending resistance line from Thursday, around the 0.8700 threshold is likely to gain the intraday trader’s attention.
Following that, the latest high near 0.8715 and the stated triangle’s resistance line near 0.8720 could test the EUR/GBP bulls.
Also acting as an upside hurdle is the 61.8% Fibonacci Expansion (FE) of the pair’s moves between August 25 and September 05, around 0.8725.
Alternatively, pullback moves remain elusive until the quote stays beyond 0.8670 support confluence, including the 21-SMA and the aforementioned triangle’s support line.
If the EUR/GBP bears manage to conquer the 0.8670 support, the 0.8600 round figure could entertain them before directing them towards the 0.8565-60 level including the 100-SMA and the latest August swing low.
EUR/GBP: Four-hour chart

Trend: Limited upside expected
-
05:09
USD/INR Price News: Indian rupee treads water around 79.60 with eyes on US/India inflation
- USD/INR remains sidelined around one-week low, retreats of late.
- Holiday in China, pre-data anxiety restrict intraday moves amid a light calendar.
- India CPI, output details will be crucial as RBI interventions appear less effective in limiting the upside.
- US consumer-centric data could entertain traders amid Fed blackout.
USD/INR portrays the market’s inaction as it steadies around 79.60 during Monday’s Asian session. That said, cautious sentiment ahead of the key data from India and the US joins China’s holiday to restrict the Indian rupee (INR) pair’s latest moves.
It should be noted that a pullback in the oil prices seems to jostle with the market’s mixed sentiment to also challenge the USD/INR traders. That said, WTI crude oil prices snapped a two-day uptrend by retreating to $85.10 at the latest. Considering India’s heavy reliance on energy imports and higher budget deficit, the INR is prone to moves in oil prices. However, the recent fears surrounding China and Russia, coupled with the doubts over the Reserve Bank of India’s (RBI) capacity to defend the INR, with multiple interventions, seem to challenge the pair sellers.
A fall in the RBI’s headlines foreign exchange reserve to the lowest levels since October 2020, largely driven by the decline in the foreign currency assets, signaled that the Indian central bank is actively in play to defend the domestic currency versus the US dollar. However, the USD/INR remains more or less around 80.00, which in turn hints at the RBI’s inability to defend the domestic currency.
Elsewhere, fears of fresh troubles for Chinese chipmakers and headlines suggesting covid woes in the dragon nation join Russia’s retreat in some of the Ukrainian areas to weigh on the market sentiment, which in turn underpins the US dollar’s safe-haven demand.
Even so, the US Dollar Index (DXY) remains pressured around 108.80, down 0.20% intraday by the press time. In doing so, the greenback’s gauge versus the six major currencies also ignores downbeat comments from US Treasury Secretary Janet Yellen and some of the key Fed policymakers.
“Fed is going to need skill and luck to bring inflation down while maintaining labor market strength,” said US Treasury Secretary Yellen during the CNN interview. On the other hand, Federal Reserve Governor Christopher Waller was the prominent one as he said on Friday that he supports another significant hike in two weeks. On the same line was Kansas City Fed President Esther George who said, as reported by Reuters, “Case for continuing to remove policy accommodation is clear cut.” Furthermore, Cleveland Federal Reserve Bank President Loretta Mester said, “One inflation report is insufficient to alter one's outlook.” The policymaker also stated that he sees policy rates rising slightly above 4% by early 2023.
Moving on, India’s Consumer Price Index (CPI) for August, expected 6.9% versus 6.71% prior, appears important for the USD/INR traders as strong numbers could push the RBI towards more rate hikes, which in turn may offer intermediate relief to the INR bulls. However, the lack of market action and the scheduled release of the US CPI and Retail Sales for August, as well as the preliminary readings of the Michigan Consumer Sentiment Index for September, will be important to watch for clear directions.
Technical analysis
USD/INR sellers seem to tighten their grip inside a monthly trading range between 79.30 and 80.20.
-
04:49
Gold Price Forecast: XAU/USD sees a downside towards $1,700 on lower consensus for US Inflation
- Gold price is expected to drop to near $1,700.00 on a breakdown of Ascending Triangle.
- Lower consensus for US CPI is resulting in a sell-off in the precious metal.
- The headline US CPI is seen lower at 8.1% vs. 8.5% reported earlier.
Gold price (XAU/USD) is witnessing a steep fall after refreshing intraday’s low at $1,712.96. The precious metal is facing a sell-off heat to lower consensus for the US Consumer Price Index (CPI). The yellow metal is expected to continue its vulnerable performance and will decline towards the psychological support of $1,700.00.
As per the market estimates, the US inflation will land at 8.1%, 40 basis points lower than the prior release. The households in the US economy are facing the headwinds of soaring price pressures for a prolonged time. They are forced higher payouts on similar quantities purchased. As gasoline prices have fallen dramatically and the rising interest rates by the Federal Reserve (Fed) have started doing their job perfectly now, price pressures are experiencing exhaustion signals.
It is worth noting that gold is considered an inflation-hedged asset and a lower consensus for inflationary pressures is forcing the market participants to ditch the yellow metal.
Meanwhile, the US dollar index (DXY) has turned sideways as a lower consensus for the headline CPI figure will force the Fed policymakers to trim their hawkish tone.
Gold technical analysis
Gold price has dropped below the Ascending Triangle pattern whose upward-sloping trendline is placed from Wednesday’s low at $1,694.31 while the horizontal resistance is August 31 high at $1,726.62. The 20-and 50-period Exponential Moving Averages (EMAs) are overlapping to each other, which indicates a sideways move ahead.
Also, the Relative Strength Index (RSI) (14) is oscillating in a 40.00-60.00 range, which supports a consolidation ahead.
Gold hourly chart
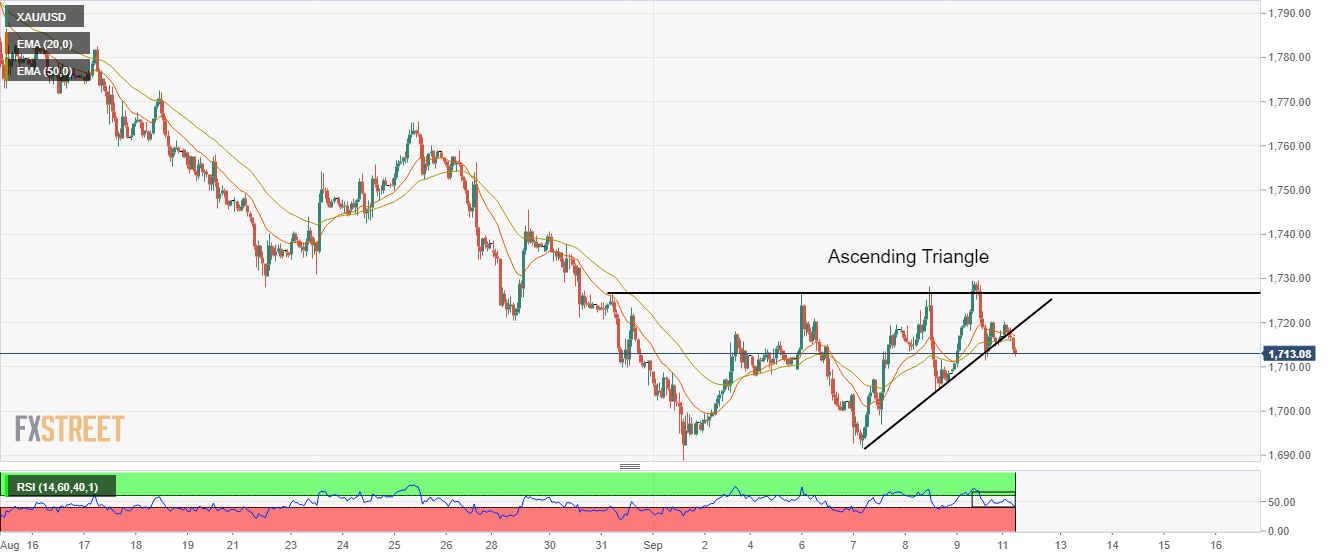
-
04:13
US President Biden to hit China with broader curbs on US chip, tool exports – Reuters
Citing several people familiar with the matter, Reuters reported that US President Joe Biden’s administration is considering plans next month to broaden curbs on US shipments to China of semiconductors and chipmaking tools.
Additional takeaways
“The Commerce Department intends to publish new regulations based on restrictions communicated in letters earlier this year to three US companies -- KLA Corp, Lam Research Corp and Applied Materials Inc.”
“The regulations would likely include additional actions against China. The restrictions could also be changed and the rules published later than expected.”
A senior Commerce official said: "As a general rule, we look to codify any restrictions that are in is-informed letters with a regulatory change."
Also read: US President Biden delays a decision on Trump's tariffs on China
Market reaction
AUD/USD is bearing the brunt of the renewed US-China tensions and covid resurgence in Beijing, shedding 0.18% on the day to trade at 0.6826, as of writing.
-
03:58
AUD/USD Price Analysis: Retreats from monthly resistance, 100-SMA towards 0.6800
- AUD/USD takes offers to renew intraday low as it pares the biggest daily gains in a month.
- Receding bullish bias of MACD, RSI pullback adds strength to the fall targeting 50-SMA.
- 200-SMA adds to the upside filters, bears have a bumpy road before retaking control.
AUD/USD consolidates the biggest daily gains in a month as it refreshes intraday low around 0.6825-30 during Monday’s Asian session. In doing so, the Aussie pair takes a U-turn from the downward sloping resistance line from August 15 as well as the 100-SMA.
Given the receding bullish bias of the MACD and the RSI retreat, the AUD/USD prices are likely to witness further downside.
However, the 0.6800 threshold and the 50-SMA, around 0.6790, could challenge the intraday sellers.
Following that, the monthly horizontal support area, around 0.6770, appears the last defense of the AUD/USD bulls before challenging the yearly low of 0.6700.
Meanwhile, the 100-SMA and the aforementioned resistance line, respectively near 0.6850 and 0.6870, challenge short-term AUD/USD upside ahead of the 200-SMA hurdle surrounding 0.6925.
It’s worth noting that the pair’s run-up beyond 0.6925 enables it to overcome the 0.7000 psychological magnet, which in turn highlights the late August swing high near 0.7010 for the bulls to watch as a probable challenge.
AUD/USD: Four-hour chart
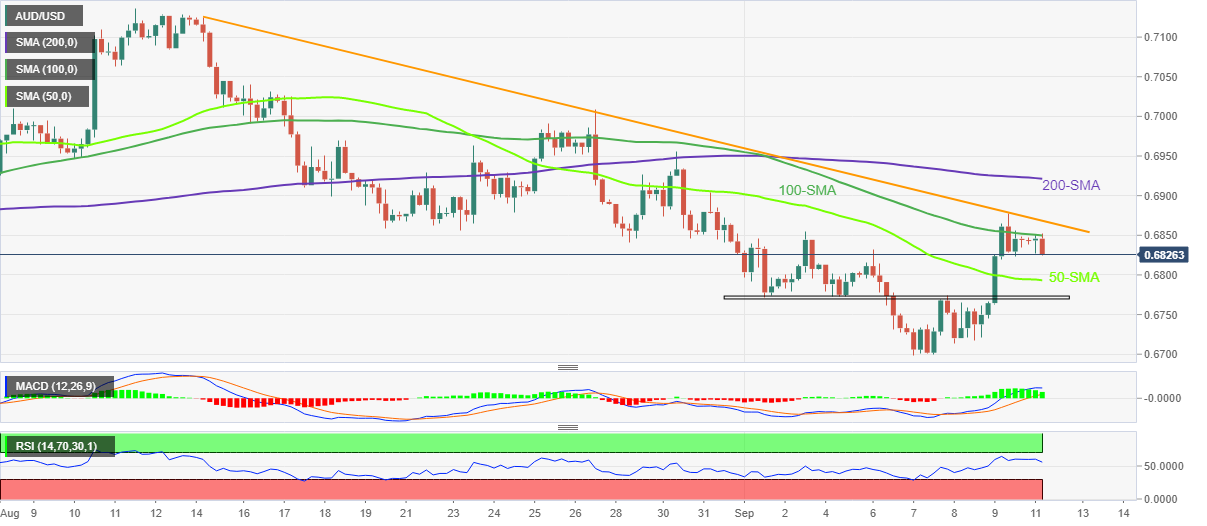
Trend: Limited downside expected
-
03:45
EUR/USD: Hawkish bets on ECB favor bulls to aim for 1.0115 hurdle, US inflation eyed
- EUR/USD remains firmer for the second consecutive day as it battles 50-DMA hurdle.
- ECB hawks signal further tightening of monetary policy despite recession woes.
- Fed policymakers remained hopeful of higher rates before entering blackout period.
- China, Russia-linked headlines tests buyers amid sluggish session, US CPI is the key.
EUR/USD grinds higher around 1.0090 during Monday’s sluggish session as China’s off and a light calendar joins pre-data anxiety. However, the recently hawkish comments from the European Central Bank (ECB) policymakers keep the pair buyers hopeful.
“Many policymakers saw a growing probability that they will need to take the rate into "restrictive territory", jargon for a level of rates that causes the economy to slow, at 2% or above,” mentioned Reuters while quoting five sources. Among them, comments from Bundesbank President and ECB Governing Council member Joachim Nagel and Bank of Greece Governor Yannis Stournaras seem to gain major attention.
Also read: ECB officials back further tightening, as they see rates into ‘restrictive territory’
On the other hand, Federal Reserve Governor Christopher Waller was the prominent one as he said on Friday that he supports another significant hike in two weeks. On the same line was Kansas City Fed President Esther George who said, as reported by Reuters, “Case for continuing to remove policy accommodation is clear cut.” Furthermore, Cleveland Federal Reserve Bank President Loretta Mester said, “One inflation report is insufficient to alter one's outlook.” The policymaker also stated that he sees policy rates rising slightly above 4% by early 2023.
It should be noted that US Treasury Secretary Janet Yellen also signaled challenges for the US Federal Reserve (Fed) going forward as she said during the CNN interview, “Fed is going to need skill and luck to bring inflation down while maintaining labor market strength.”
On a different page, fresh geopolitical and trade headlines surrounding China and Russia appear to probe the previous risk-on mood, mainly backed by the hopes that the inflation is easing and the policymakers will be able to tackle the economic crisis. The same challenges the EUR/USD buyers as China’s holiday restricts the market’s moves.
That said, US President Joe Biden is ready to hit China with broader curbs on US chip and tool exports that restrict the previously upbeat market sentiment. On the same line could be the analysis suggesting a 20-year low oil demand from China due to covid curbs, shared by Reuters. It’s worth mentioning that the fears emanating from the Russia-Ukraine crisis, due to Moscow’s retreat, are also a risk-negative catalyst.
While portraying the mood, the S&P 500 Futures struggle to extend the three-day uptrend around a fortnight top, easing from the intraday high of 4,094.50 of late. On the same line are the US 10-year Treasury yields, down one basis point (bp) to 3.31% at the latest.
Looking forward, final readings of the Eurozone and German inflation data will join the political plays surrounding the bloc’s energy crisis to direct short-term EUR/USD moves. Though, more important will be the US Consumer Price Index (CPI) and Retail Sales for August, as well as the preliminary readings of the Michigan Consumer Sentiment Index for September.
Also read: EUR/USD Weekly Forecast: Bears take a breath, but don’t expect them to give up
Technical analysis
Although a two-month-old horizontal area and the 50-DMA challenge EUR/USD bulls, around 1.0090-95 and 1.0115 in that order, the pair’s sustained trading beyond a three-week-old previous resistance line, close to 0.9980 at the latest, keeps the upside potential intact.
-
03:34
Upside risks to US Tresaury yields but moving beyond peak inversion – Goldman Sachs
In its latest note published on Monday, economists at Goldman Sachs said that "market pricing is roughly aligned with our Fed baseline through year-end and 10-Year yields sit right around our current YE22 forecast of 3.30%."
Additional quotes
"Nonetheless, we see upside risks to longer dated yields from a higher realized terminal rate in the current economic backdrop. This is mainly because investors, in our view, appear to be placing material odds on scenarios that involve significant easing from the peak, to a degree that is incongruent with Fed commentary if current inflation pricing were to realize."
"Under a soft landing baseline, we think forward points should trade at a smaller discount to the peak rate. Longer horizon forwards can also reset higher as investors update their long run rate priors in the event of a 'normal' growth outcome at a higher policy rate setting."
"Finally, we think higher yields should be primarily driven by the real component, most notably at nearer-term forward points (more on this below), but also further out to some extent."
"A slowing in the pace of Fed tightening after a 75bp September hike, coupled with the expectation that growth can rebound next year alongside inflation that is closer to target, suggests that 'peak curve inversion' for the cycle is likely behind us."
-
03:20
GBP/USD stays mildly bid below 1.1650 as BOE postpones meeting, UK data, US inflation eyed
- GBP/USD remains sidelined after crossing the short-term key resistances.
- Mixed sentiment, pre-data anxiety and China’s off restrict the Cable pair’s latest moves.
- BOE delayed monetary policy meeting by a week on Queen’s death.
- Monthly prints of UK data, US inflation will be crucial for short-term directions.
GBP/USD grinds higher around 1.1625-30 as traders brace for the UK’s data-filled week during early Monday. Even so, a softer US dollar and hopes of the faster rate hike from the Bank of England (BOE), mainly due to Liz Truss’ election as the UK Prime Minister (PM), seem to keep the buyers hopeful. It should be noted that a week’s delay by the BOE in its monetary policy decision also seems to restrict the Cable pair’s latest moves.
BOE delays monetary policy announcement to September 22 as the nation mourns over the death of Queen Elizabeth II. Not only the “Old Lady”, as the BOE is sometimes called, but the majority of the UK activities are likely to be compressed during September, which in turn raises economic fears for the already struggling London and challenges GBP/USD buyers.
Additionally, fresh geopolitical and trade headlines surrounding China and Russia appear to probe the previous risk-on mood, mainly backed by the hopes that the inflation is easing and the policymakers will be able to tackle the economic crisis. US President Joe Biden is ready to hit China with broader curbs on US chip and tool exports that restrict the previously upbeat market sentiment. On the same line could be the analysis suggesting a 20-year low oil demand from China due to covid curbs, shared by Reuters. It’s worth mentioning that the fears emanating from the Russia-Ukraine crisis, due to Moscow’s retreat, are also a risk-negative catalyst.
Elsewhere, comments from US Treasury Secretary Janet Yellen and some of the prominent Fed policymakers could also be considered a hurdle for the GBP/USD prices. US Treasury Secretary Janet Yellen mentioned that, during the CNN interview on Sunday, “Fed is going to need skill and luck to bring inflation down while maintaining labor market strength.” The policymaker also mentioned that US consumers could experience a spike in gas prices in winter when the European Union significantly cuts back on buying Russian oil.
Federal Reserve Governor Christopher Waller was the prominent one as he said on Friday that he supports another significant hike in two weeks. On the same line was Kansas City Fed President Esther George who said, as reported by Reuters, “Case for continuing to remove policy accommodation is clear cut.” Furthermore, Cleveland Federal Reserve Bank President Loretta Mester said, “One inflation report is insufficient to alter one's outlook.” The policymaker also stated that he sees policy rates rising slightly above 4% by early 2023.
Amid these plays, the S&P 500 Futures struggle to extend the three-day uptrend around a fortnight top, easing from the intraday high of 4,094.50 of late. On the same line are the US 10-year Treasury yields, down one basis point (bp) to 3.31% at the latest.
Moving on, the UK’s key monthly statistics for July, namely Industrial Production, Gross Domestic Product (GDP) and Manufacturing Production, will be important for the GBP/USD traders for immediate direction. However, major attention will be given to the UK’s employment and inflation statistics, as well as the US Consumer Price Index (CPI) for August, for a clear view.
Technical analysis
GBP/USD bulls cheer the upside break of the 10-DMA and monthly bearish channel amid the recently firmer RSI (14) and the strongest bullish MACD signals to aim for the 21-DMA hurdle surrounding 1.1700 ahead of the UK’s key monthly statistics for July.
In case of an alternative move, the 10-DMA resistance-turned-support, around 1.1555 by the press time, will precede the stated bearish channel’s upper line, close to 1.1500 at the latest, to restrict short-term downside.
-
03:14
Japan’s Kihara: Must take steps against 'excessive' yen moves
Japanese Deputy Chief Cabinet Secretary Seiji Kihara urges the country’s government to take necessary steps to counter excessive declines in the yen.
Additional comments
"As for excessive, one-sided currency moves, we will closely watch developments and must take steps as needed."
The government will consider "in the not so distant future" relaxing strict border measures to further open Japan's borders to overseas visitors.
"Weak yen most effective in boosting inbound tourism."
"Won't rule out issuing debt to fund rising defense cost."
Market reaction
USD/JPY is attempting another leg higher above 142.50, having slumped to 142.15 in early dealing on the Japanese verbal intervention. The spot is higher by 0.11% on the day.
-
03:03
ECB officials back further tightening, as they see rates into ‘restrictive territory’
Over the weekend, European Central Bank (ECB) Executive Board member Frank Elderson said that more interest hikes from the central bank will be in the offing.
Additional quotes
"it’s very important that the expectations that the people have on how the inflation will develop in the medium to long term will not become deanchored.”
“It is vital that people and companies or actors in the economy, in general, maintain their trust that we as the ECB will reach our target of 2% inflation.”
“Getting the inflation development under control again -- and that is a shared belief within the ECB council, in my opinion.”
“In the end, stable prices are much more important for medium-term, long-term growth, for a good outlook for the euro area.”
“We may need to overcome a dry spell, but for now at least it looks like this dry spell and the decline in economic output will not be severe.”
Meanwhile, Bundesbank President and ECB Governing Council member Joachim Nagel said over the weekend that “Thursday’s step was a clear sign and if the inflation picture stays the same, further clear steps must follow.”
Nagel said: the rate of inflation ahead “is likely to be at a far-too-high level of over 6%”, may peak over 10% in December, adding that “in the course of 2023, the inflation picture is likely to weaken somewhat.”
Citing five sources close to the matter, Reuters reported that “many policymakers saw a growing probability that they will need to take the rate into "restrictive territory", jargon for a level of rates that causes the economy to slow, at 2% or above.”
“This would most likely happen if the ECB's first inflation projection for 2025, due to be published in December, is still above 2%.”
Market reaction
Amidst hawkish ECB expectations and the extended US dollar correction, EUR/USD is testing offers just below 1.0100, adding 0.50% on the day.
-
02:54
USD/CAD Price Analysis: Bulls could be about to make their moves, but bears are testing commitments
- USD/CAD is under pressure in the open, but there are bullish prospects.
- The bulls need to cover come the recent highs for a measured move into restest a key resistance structure.
USD/CAD has been under pressure, falling into support near 1.2990 while resistance is situated around 1.3080. The following illustrates a prospective path of price action for the day (s) ahead given the current structure that has been broken to the downside.
USD/CAD daily chart

The bears have taken the bulls back below the trendline support which is a significant development and leave the focus on an initial upside correction prior to a deeper run to the downside.
The M-formation is a reversion pattern that reinforces the meanwhile bullish corrective prospect towards the neckline and the said 1.3080 area for the day ahead.
USD/CAD H4 chart

The 4-hour chart has the 50% mean reversion marked up on the said level of resistance, around 1.3080, which gives the additional conviction that this should act as a firm resistance area. Beyond there, 1.3120 guards a run on the highs near 1.3160.
USD/CAD H1 chart
Meanwhile, now that the gap has been closed, the bulls need to get over the highs of the day and 1.3050 thereafter:

The hourly charts support is being taken on, but if the bulls commit between here and the 61.8% Fibonacci retracement of the bullish correction;'s range, so far, then there will be a higher probability of a continuation tot he upside over the coming day.
-
02:50
NZIER Consensus Forecasts show a weaker economic outlook as high inflation, interest rates continue
The New Zealand Institute of Economic Research (NZIER) has made a downward revision to the near-term outlook for the economy in their latest Consensus Forecasts published on Monday.
Key takeaways
Despite a stronger starting point for household spending, the downward revision through 2025 reflects the expectation that the dampening effect of higher interest rates on spending will become more apparent as households roll into much higher fixed mortgage rates.
Recent short-term softening in global demand has resulted in a downward revision of the export growth forecast for the near term.
In the latest NZIER Consensus Forecasts, while stronger wage growth is expected across the projection horizon, annual CPI inflation for the coming year has been revised higher before easing in 2024.
Annual CPI inflation hiked to 7.3 percent in the year to June 2022. It is expected to moderate to 4.8 percent in 2023 and ease to 2.1 percent in 2026.
The upward revision to short-term interest rates reflects the Reserve Bank’s August Monetary Policy Statement, which indicated further monetary tightening, and it would look to increase the Official Cash Rate to 4.1 percent by mid -2023.
Market reaction
At the time of writing, NZD/USD is keeping its renewed upside intact at around 0.6115, up 0.05% on the day.
- NZD/USD grinds higher past 0.6100 despite downbeat NZIER forecasts, US inflation eyed
-
02:50
USD/CHF Price Analysis: Drops back below 0.9615-20 resistance confluence
- USD/CHF takes offers to refresh intraday low, reverses late Friday’s bounce off three-week bottom.
- Failures to cross 200-SMA, 50% Fibonacci retracement join bearish MACD signals to favor sellers.
- 61.8% golden ratio could test bears amid oversold RSI.
USD/CHF prints a four-day downtrend as it reverses the previous day’s corrective pullback from a three-week low during Monday’s Asian session. In doing so, the Swiss currency (CHF) pair portrays the inability to cross the 200-SMA and 50% Fibonacci retracement of its August-September upside.
As the bearish MACD signals back the quote’s recent weakness, USD/CHF sellers could aim for the 61.8% Fibonacci retracement (Fibo.) level surrounding 0.9560. However, oversold RSI conditions seem to challenge the pair’s further downside.
In a case where the pair remains weak past 0.9560, the 0.9500 threshold and the 78.6% Fibo. around 0.9475 could offer intermediate halts during the south run targeting the previous monthly low of 0.9370.
On the contrary, recovery remains elusive until the quote rises past the aforementioned confluence including the 200-SMA and 50% Fibonacci retracement level near 0.9615-20.
Following that, a three-week-old horizontal resistance area between 0.9690 and 0.9710 will be a crucial hurdle for the USD/CHF pair buyers to tackle to retake control.
Should the pair successfully crosses the 0.9710 hurdle, the 0.9800 round figure and the monthly peak surrounding 0.9870 will be in focus.
USD/CHF: Four-hour chart

Trend: Further weakness expected
-
02:28
S&P 500 Futures, yields portray market’s inaction amid off in China, anxiety ahead of US inflation
- Global markets witness a sluggish start to the week carrying US inflation.
- S&P 500 Futures struggles around two-week top, US 10-year Treasury yields retreat.
- Holidays in China, geopolitical/trade fears challenge previous risk-on mood.
- Light calendar could restrict market’s moves but challenges to sentiment may weigh on risk assets.
China’s extended weekend and a light calendar strengthen Monday blues at various bourses amid a mixed feeling over the previous risk-on mood. Also challenging the risk appetite, as well as the market moves, could be a caution ahead of the US inflation release.
While portraying the mood, the S&P 500 Futures struggle to extend the three-day uptrend around a fortnight top, easing from the intraday high of 4,094.50 of late. On the same line are the US 10-year Treasury yields, down one basis point (bp) to 3.31% at the latest.
Headlines suggesting US President Joe Biden’s readiness to hit China with broader curbs on US chip and tool exports seem to restrict the previously upbeat market sentiment. On the same line could be the analysis suggesting a 20-year low oil demand from China due to covid curbs, shared by Reuters. It’s worth mentioning that the fears emanating from the Russia-Ukraine crisis are also a negative for the riskier assets.
That said, comments from US Treasury Secretary Janet Yellen and some of the prominent Fed policymakers could also be considered as the risk-negative. US Treasury Secretary Janet Yellen mentioned that, during the CNN interview on Sunday, “Fed is going to need skill and luck to bring inflation down while maintaining labor market strength.” The policymaker also mentioned that US consumers could experience a spike in gas prices in winter when the European Union significantly cuts back on buying Russian oil.
Federal Reserve Governor Christopher Waller was the prominent one as he said on Friday that he supports another significant hike in two weeks. On the same line was Kansas City Fed President Esther George who said, as reported by Reuters, “Case for continuing to remove policy accommodation is clear cut.” Furthermore, Cleveland Federal Reserve Bank President Loretta Mester said, “One inflation report is insufficient to alter one's outlook.” The policymaker also stated that he sees policy rates rising slightly above 4% by early 2023.
It should be noted that the previously easing early signals of inflation from the key global economies and the central bankers’ readiness to take whatever measures need to overcome the economic challenge seemed to have triggered the risk-on mood earlier.
Moving on, China’s holiday and a light calendar at home could restrict the market’s moves on Monday. However, this week’s US Consumer Price Index (CPI) and Retail Sales for August, as well as the preliminary readings of the Michigan Consumer Sentiment Index for September, will be crucial for fresh impulse as the Fed policymakers are in a pre-meeting blackout.
-
02:22
WTI Price Analysis: Finds bids around 20-EMA above 85.00
- Oil prices are displaying a healthy correction after a juggernaut upside move.
- The black gold has attacked the prior balanced profile placed in an $85.77-90.14 range.
- A bullish range shift by the RSI (14) has strengthened bulls.
West Texas Intermediate (WTI), futures on NYMEX, has declined to near $85.20 in the Asian session after failing to sustain above $86.00. The black gold has attempted a bullish reversal after refreshing its six-month low at $80.94. The asset is picking significant bids as investors are considering the oil prices a ‘value bet’ after a meaningful decline from the all-time highs above 125.00.
On an hourly scale, oil bulls have stepped into the prior balanced profile (placed in an $85.77-90.14 range), which resulted in a bearish imbalance earlier. Investors should be aware of the fact that an entry into the prior balanced auction bolsters the odds of a bullish reversal.
The 20-and 50-period Exponential Moving Averages (EMAs) have delivered a bullish crossover at $83.66, which indicates more upside ahead.
Also, the Relative Strength Index (RSI) (14) has shifted into the bullish range of 60.00-80.00, which dictates that upside momentum has been triggered.
A decisive break above Friday’s high at $86.78 will send the major towards the round-level resistance at $90.00, followed by August 11 high at $94.32.
Alternatively, bears could demolish the upside bias if it drops below Thursday’s low at $82.14 will rag the asset towards the round-level support at $80.00. A breach of the latter will unleash bears for more downside towards July 6 high at $76.40.
WTI hourly chart
-637985424493568839.png)
-
02:06
GBP/JPY Price Analysis: Further upside hinges on 166.30 breakout, UK data
- GBP/JPY defends three-month-old resistance breakout amid bullish MACD signals.
- Horizontal area from late June challenge immediate upside moves.
- The key DMA confluence challenges bears, buyers can aim for yearly top.
GBP/JPY picks up bids to consolidate the previous day’s losses around 165.80 during Monday’s Asian session.
In doing so, the cross-currency pair defends the upside break of a three-month-old resistance, now support around 164.15.
Not only the key resistance breakout but the bullish MACD signals also favor GBP/JPY bulls to portray another run-up towards crossing a 10-week-old horizontal resistance area surrounding 166.30.
It should, however, be noted that the pair’s upside past 166.30 won’t hesitate to challenge the yearly peak surrounding 168.50. During the anticipated run-up, the tops marked in late June and April, respectively around 167.85 and 168.40, could act as buffers.
On the flip side, GBP/JPY sellers may not risk fresh entries until witnessing a clear downside break of the resistance-turned-support line around 164.15, as well as the 164.00 threshold.
Also acting as the key downside barrier is the convergence of the 50-DMA and the 100-DMA around 163.00.
In a case where GBP/JPY sellers keep reins past 163.00, an upward sloping support line from May 12, close to 161.30, followed by the 160.00 psychological magnet, will pop up on the radar.
GBP/JPY: Daily chart
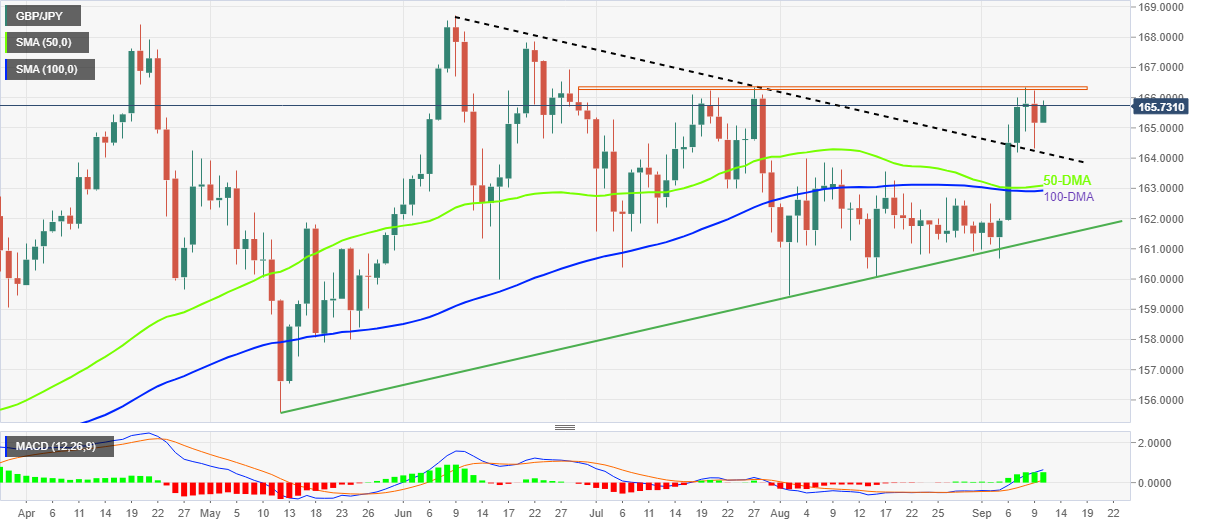
Trend: Further upside expected
-
01:55
Gold Price Forecast: XAU/USD senses selling pressure around $1,720, US Inflation hogs limelight
- Gold price has struggled around $1,720.00 as investors await US Inflation data.
- The headline CPI is expected to decline to 8.1% vs. 8.5% on an annual basis.
- A risk-on market mood has faded the DXY’s rally.
Gold price (XAU/USD) has witnessed barricades while attempting to cross the critical hurdle of $1,720.00 in the Asian session. The precious metal has displayed a weak pullback move after a firmer decline to near $1,711.65 and is expected to remain sideways as investors are expected to remain on the sidelines ahead of the US Consumer Price Index (CPI) data.
As gasoline prices have fallen dramatically in the US region and the soaring interest rates by the Federal Reserve (Fed) have squeezed liquidity, consensus for the US inflation is hinting at a decent decline ahead. The US inflation is expected to land at 8.1%, lower than the prior release of 8.5% on an annual basis. While the core CPI figure that doesn’t inculcate food and energy prices is seen higher by 10 basis points (bps) at 6%.
Meanwhile, the US dollar index (DXY) is displaying exhaustion signals after a dead cat bounce to near 108.90. A risk-on undertone in the market will keep the asset on the tenterhooks as a lower consensus for US CPI is hinting that the Fed will leave with no other choice than to scale down it hawkish tone.
Gold technical analysis
Gold price is trading in an Ascending Triangle pattern whose upward-sloping trendline is placed from Wednesday’s low at $1,694.31 while the horizontal resistance is August 31 high at $1,726.62. The 20-and 50-period Exponential Moving Averages (EMAs) are overlapping to each other, which indicates a sideways move ahead.
Also, the Relative Strength Index (RSI) (14) is oscillating in a 40.00-60.00 range, which supports a consolidation ahead.
Gold hourly chart
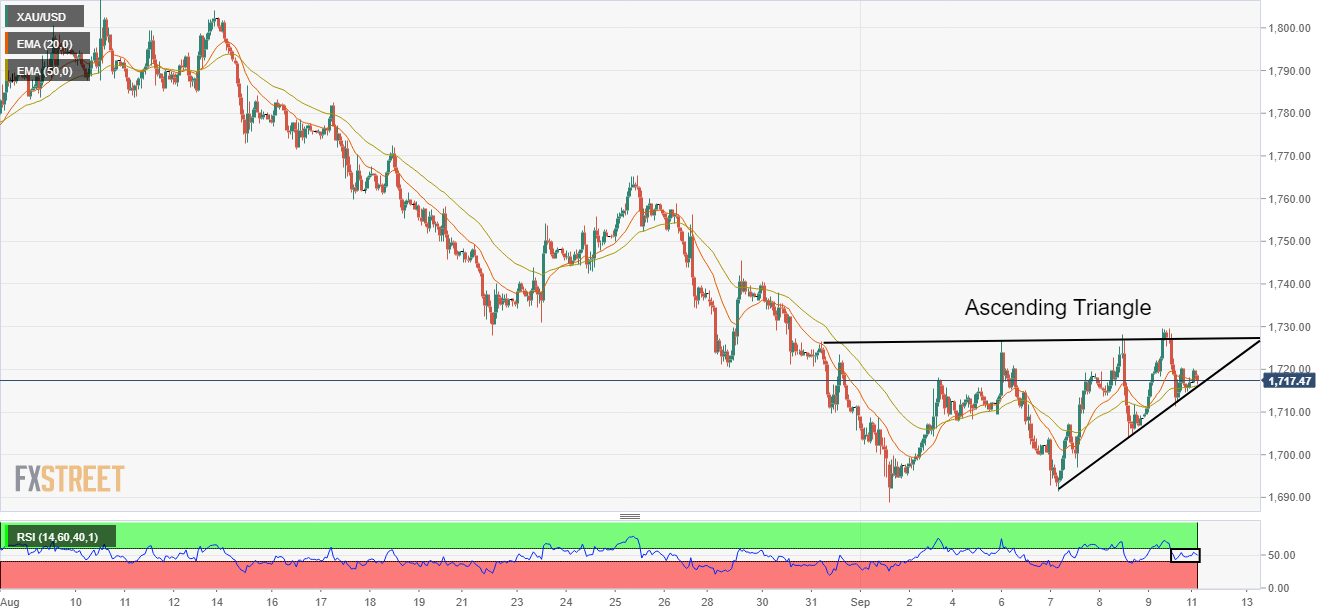
-
01:43
EUR/JPY bulls step in to start off the week
- EUR/JPY is bid in the open this week.
- The central banks are in focus as a driving force.
EUR/JPY is treading near 0.5% higher on the day as the bulls step in following Friday's drop. Risk sentiment improved but the yen was correcting higher as the US dollar lost its footing. At the time of writing, the cross is trading at 143.85 and between a low of 143.37 and 143.87.
Markets in China, Hong Kong and Korea are closed for the harvest moon/mid-autumn festival so it is otherwise quiet to start the week. On Friday, however, the dollar fell to a more than one-week low ahead of a US inflation report that could determine the size of the Federal Reserve's rate hike at this month's policy meeting. Nevertheless, equities squeezed higher, albeit without obvious news or data catalysts. The US dollar lost safe haven demand, sliding against all G10 currencies on the day. The yen, on the other hand, has been on track for its worst year on record, prompting the strongest warnings to date from senior Japanese government officials aimed at stemming the slide.
As for the euro, the European Central Bank recently hiked rates 75 bp, as expected and leaves the market expecting more over the next several meetings, adding that it will regularly reevaluate the policy pate and take a meeting-by-meeting approach.
Madame Lagarde's press conference was key, analysts at Brown Brothers Harriman argued.''She said there were different views but the decision was unanimous. Most importantly, she said 75 bp was not the norm but that the large deviation of inflation from target justifies front-loading rate hikes.''
''Lagarde said future rate decisions will be made meeting by meeting and data-dependent. When asked about how far the ECB is likely to tighten, she said she did not know what the terminal rate was but did say that current rates are “far away” from the level that will return inflation to target. ''
The analysts argued that higher-than-expected August inflaiton readings certainly make the case for more aggressive tightening. ''While the energy crisis adds another wrinkle to the process, we think it is too early yet for it to impact ECB policy right now.''
-
01:41
NZD/USD grinds higher past 0.6100 despite downbeat NZIER forecasts, US inflation eyed
- NZD/USD defends the first weekly gains in four, mildly bid of late.
- NZIER revises down near-term outlook for New Zealand’s economy.
- Headlines surrounding China, politics also challenge the upside momentum.
- Hawkish hopes from RBNZ, Fed seems to underpin the bullish bias during a quiet session.
NZD/USD stays mildly bid after snapping a three-week downtrend, taking rounds to 0.6115-20 during Monday’s Asian session. In doing so, the Kiwi pair ignores downbeat results of the New Zealand Institute of Economic Research (NZIER) survey of economists, as well as the risk-negative headlines emanating from China amid a sluggish start to the week.
In its latest economic forecasts, NZIER stated, “Consensus Forecasts for Gross Domestic Product (GDP) have been revised lower through to 2025.” The publication also mentioned that the reduction reflects the headwinds from higher inflation and interest rates slowing down economic activity. “Annual GDP growth is expected to ease to below 3 percent for the years ending March 2024 and March 2025 before increasing to just above 2 percent in the subsequent year,” notes NZIER.
The update also mentioned that the annual CPI inflation is expected to be just above the Reserve Bank’s inflation target mid-point of 2 percent across the horizon. The NZIER also mentioned, “Annual CPI inflation hiked to 7.3 percent in the year to June 2022. It is expected to moderate to 4.8 percent in 2023 and ease to 2.1 percent in 2026.”
Elsewhere, the latest news from Reuters suggesting that US President Joe Biden is to hit China with broader curbs on US chip and tool exports seems to test the previous upbeat market sentiment and the NZD/USD buyers. On the same line could be the analysis suggesting a 20-year low oil demand from China due to covid curbs, shared by Reuters. It’s worth mentioning that the fears emanating from the Russia-Ukraine crisis are also a negative for the NZD/USD prices.
Furthermore, comments from US Treasury Secretary Janet Yellen and some of the prominent Fed policymakers should have also challenged the NZD/USD bulls of late. That said, US Treasury Secretary Janet Yellen mentioned that, during the CNN interview on Sunday, “Fed is going to need skill and luck to bring inflation down while maintaining labor market strength.” The policymaker also mentioned that US consumers could experience a spike in gas prices in winter when the European Union significantly cuts back on buying Russian oil.
On the other hand, Federal Reserve Governor Christopher Waller was the prominent one as he said on Friday that he supports another significant hike in two weeks. On the same line was Kansas City Fed President Esther George who said, as reported by Reuters, “Case for continuing to remove policy accommodation is clear cut.” Furthermore, Cleveland Federal Reserve Bank President Loretta Mester said, “One inflation report is insufficient to alter one's outlook.” The policymaker also stated that he sees policy rates rising slightly above 4% by early 2023.
The pair’s upside momentum could be linked to the hawkish hopes from the Reserve Bank of New Zealand (RBNZ), as well as receding hawkish bets on the Fed despite the bold comments from the Fed policymakers.
With this in mind, the NZD/USD traders should wait for the US Consumer Price Index (CPI) and Retail Sales for August, as well as the preliminary readings of the Michigan Consumer Sentiment Index for September, for fresh impulse. Also important will be the second quarter (Q2) New Zealand GDP, expected 0.8% YoY versus -0.2% prior.
Technical analysis
A successful break of a three-week-old descending resistance line, now support around 0.6090, keeps NZD/USD buyers hopeful to challenge the 21-DMA hurdle surrounding 0.6170.
-
01:22
USD/JPY picks bids around 142.50, US Inflation in focus
- USD/JPY has picked significant bids around 142.50 despite lower consensus for the US inflation.
- A back-to-back decline in US CPI will force the Fed to scale down its hawkish tone.
- The depreciating yen is impacting the corporate margins to a great extent.
The USD/JPY pair has sensed a decent buying interest around the immediate support of 142.50 in the Asian session. The asset is aiming for a rebound as investors have focused their shift on the US Consumer Price Index (CPI) data, which will release on Tuesday. Broadly, the asset has remained in the grip of bears for the past week after failing to cross the critical hurdle of 145.00. The major has slipped to near 142.00 and is expected to display volatile moves ahead of US inflation data.
A decline in forecasts for the US inflation data has trimmed the bullish bets toward the US dollar index (DXY). The inflation rate is expected to trim down to 8.1% against the prior release of 8.5%. In case of its occurrence, the Federal Reserve (Fed) will scale down its hawkish tone for interest rate guidance. A back-to-back decline in the headline inflation rate will bolster the fact that an intermittent top for price pressures have created and exhaustion signals are dragging it lower.
On the Tokyo front, the depreciating yen is impacting the Japanese economy. A weaker yen is resulting in costly imports in the Japanese economy. This is impacting the margins of the corporate sector to a great extent as input prices have soared dramatically and the companies have failed in passing on the impact of higher input prices to the end consumers.
Meanwhile, Goldman Sachs has argued that intervention in Fx moves from Japan’s officials doesn’t seem to be a part of ongoing planning. As the Bank of Japan (BOJ) is still sticking to its ultra-loose monetary policy and the intervention is followed by a stance change in monetary policy.
-
01:20
US Dollar Index aims to recapture 109.00 as market optimism fades ahead of US inflation
- US Dollar Index picks up bids to pare intraday loss, grinds higher after the first weekly loss in four.
- Chatters surrounding China and oil price cap on Russia energy export test sentiment amid sluggish session.
- Hawkish Fedspeak, pre-CPI anxiety also challenges DXY bears as economic calendar remains light.
- US Retail Sales, Michigan Consumer Sentiment Index also appear important for fresh clues.
US Dollar Index (DXY) licks its wounds near 108.80, consolidating the first weekly loss in four amid a sluggish Asian session. In doing so, the greenback’s gauge versus the six major currencies justifies China’s off and mixed concerns surrounding the Sino-American tension and the Russia-Ukraine crisis, not to forget hawkish Fedspeak and the lack of major data/events.
News from Reuters suggesting that US President Joe Biden is to hit China with broader curbs on US chip and tool exports seemed to have probed the market’s previous risk-on mood. On the same line could be the analysis suggesting a 20-year low oil demand from China due to covid curbs, shared by Reuters.
Comments from US Treasury Secretary Janet Yellen and some of the prominent Fed policymakers could also be considered restricting the DXY’s further downside. US Treasury Secretary Janet Yellen mentioned, during the CNN interview on Sunday, “Fed is going to need skill and luck to bring inflation down while maintaining labor market strength.” The policymaker also mentioned that US consumers could experience a spike in gas prices in winter when the European Union significantly cuts back on buying Russian oil.
On the other hand, Federal Reserve Governor Christopher Waller was the prominent one as he said on Friday that he supports another significant hike in two weeks. On the same line was Kansas City Fed President Esther George who said, as reported by Reuters, “Case for continuing to remove policy accommodation is clear cut.” Furthermore, Cleveland Federal Reserve Bank President Loretta Mester said, “One inflation report is insufficient to alter one's outlook.” The policymaker also stated that he sees policy rates rising slightly above 4% by early 2023.
Previously, the recently easing early signals of inflation, in contrast with firmer macros in other areas, favored market players to gain confidence that the global central bankers will be able to tame the price pressure. In doing so, they manage to accept the hawkish comments/actions of the European Central Bank (ECB) and the US Federal Reserve (Fed) while also favoring equities and commodities.
Against this backdrop, Wall Street marked another positive day and the US Treasury yields remained sluggish for the 10-year while being firmer for the two-year tenure. The S&P 500 Futures prints mild gains at the latest.
Moving on, the US Consumer Price Index (CPI) and Retail Sales for August, as well as the preliminary readings of the Michigan Consumer Sentiment Index for September, will be crucial as markets await the Fed’s next move. Should the scheduled data print softer inflation pressure, the DXY may witness further downside.
Technical analysis
A daily closing beyond the 21-DMA hurdle, previous support around 108.75, appears necessary for the DXY bulls to retake control.
-
01:15
Currencies. Daily history for Friday, September 9, 2022
Pare Closed Change, % AUDUSD 0.68457 1.42 EURJPY 143.291 -0.53 EURUSD 1.0046 0.46 GBPJPY 165.272 -0.25 GBPUSD 1.15871 0.74 NZDUSD 0.61004 0.75 USDCAD 1.30209 -0.53 USDCHF 0.96057 -0.99 USDJPY 142.634 -0.99 -
01:09
EUR/USD Price Analysis: Bears eye a run to 0.9950 on a break of trendline support
- EUR/USD bears eye a break of key hourly trendline support.
- 0.9950 is beckoning on a break below 1.0035.
Market sentiment bounced on Friday night, despite more hawkish rhetoric from Fed speakers and the euro subsequently rallied. However, the following illustrates the potential for a downside continuation while below the 1.0300 level.
EUR/USD weekly chart
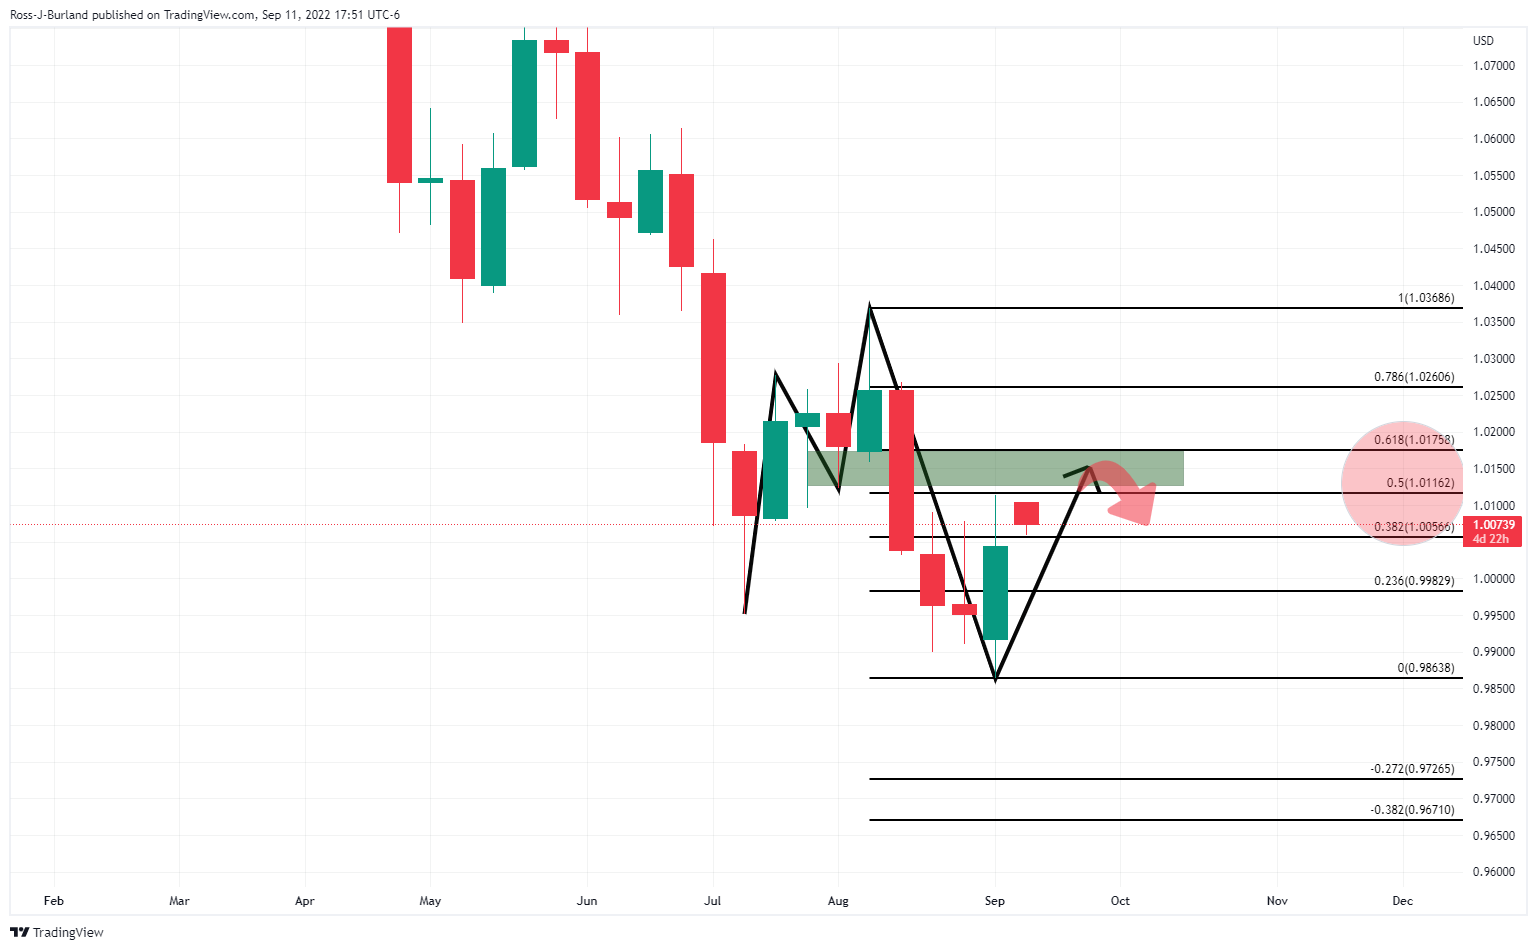
The weekly chart shows that the price is correcting into the neckline of the M-formation. While there is scope for a deeper correction towards a 61.8% or even the 78.6% Fibonacci levels, the 4-hour time frame's harmonic pattern is bearish as follows:
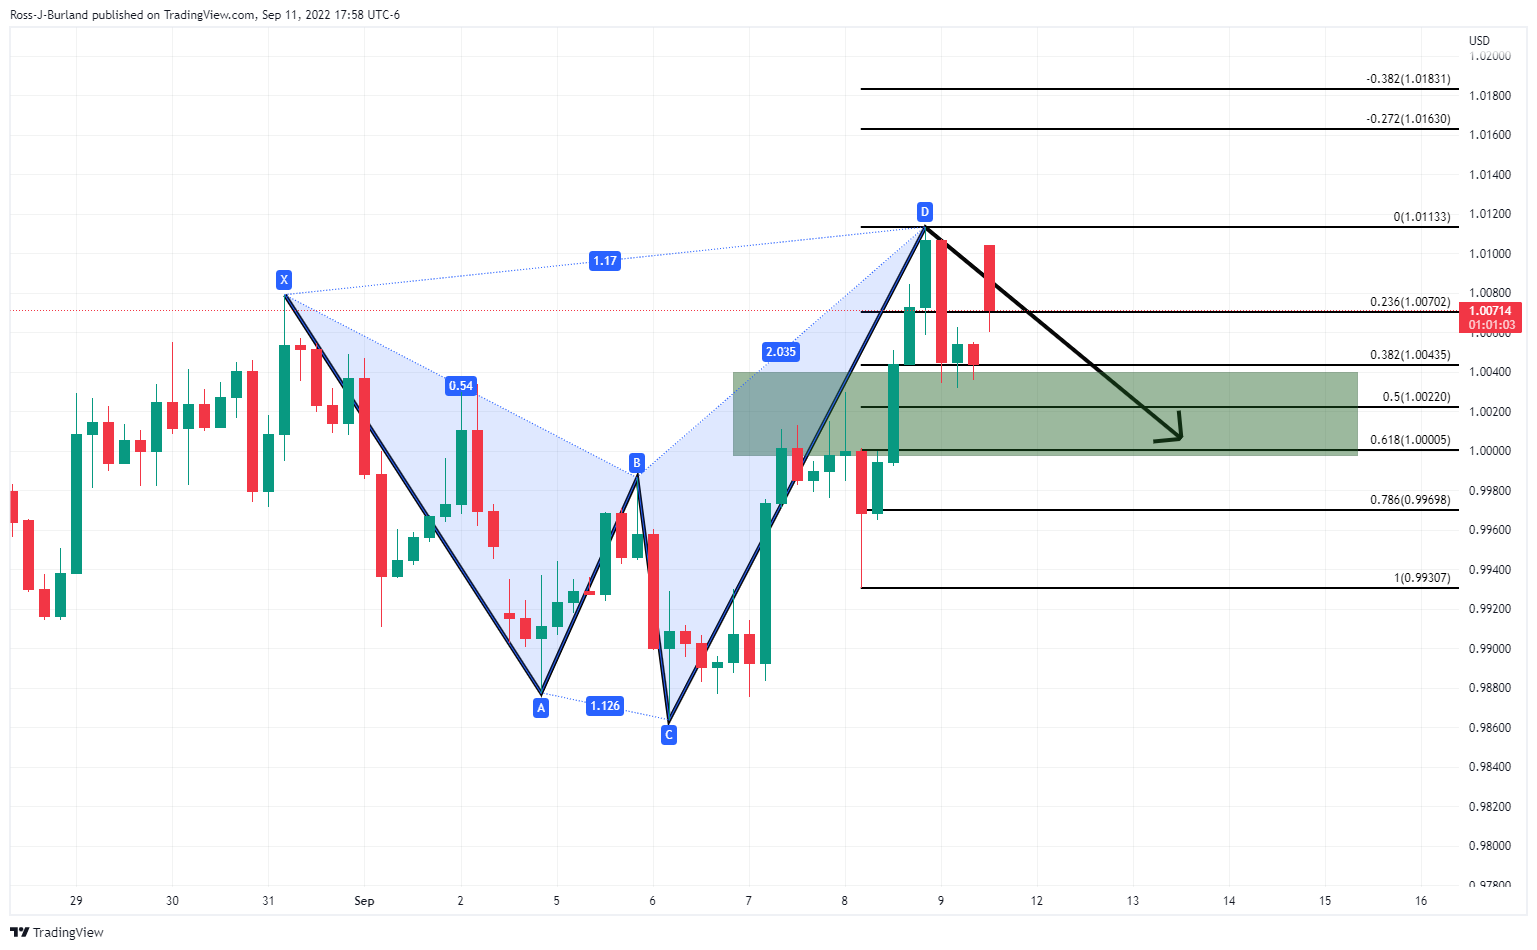
The price has opened strongly bid in early Asia but while below D and 1.0120, there is the potential for further downside and a deeper correction of the 4-hour impulse to challenge 1.0000.
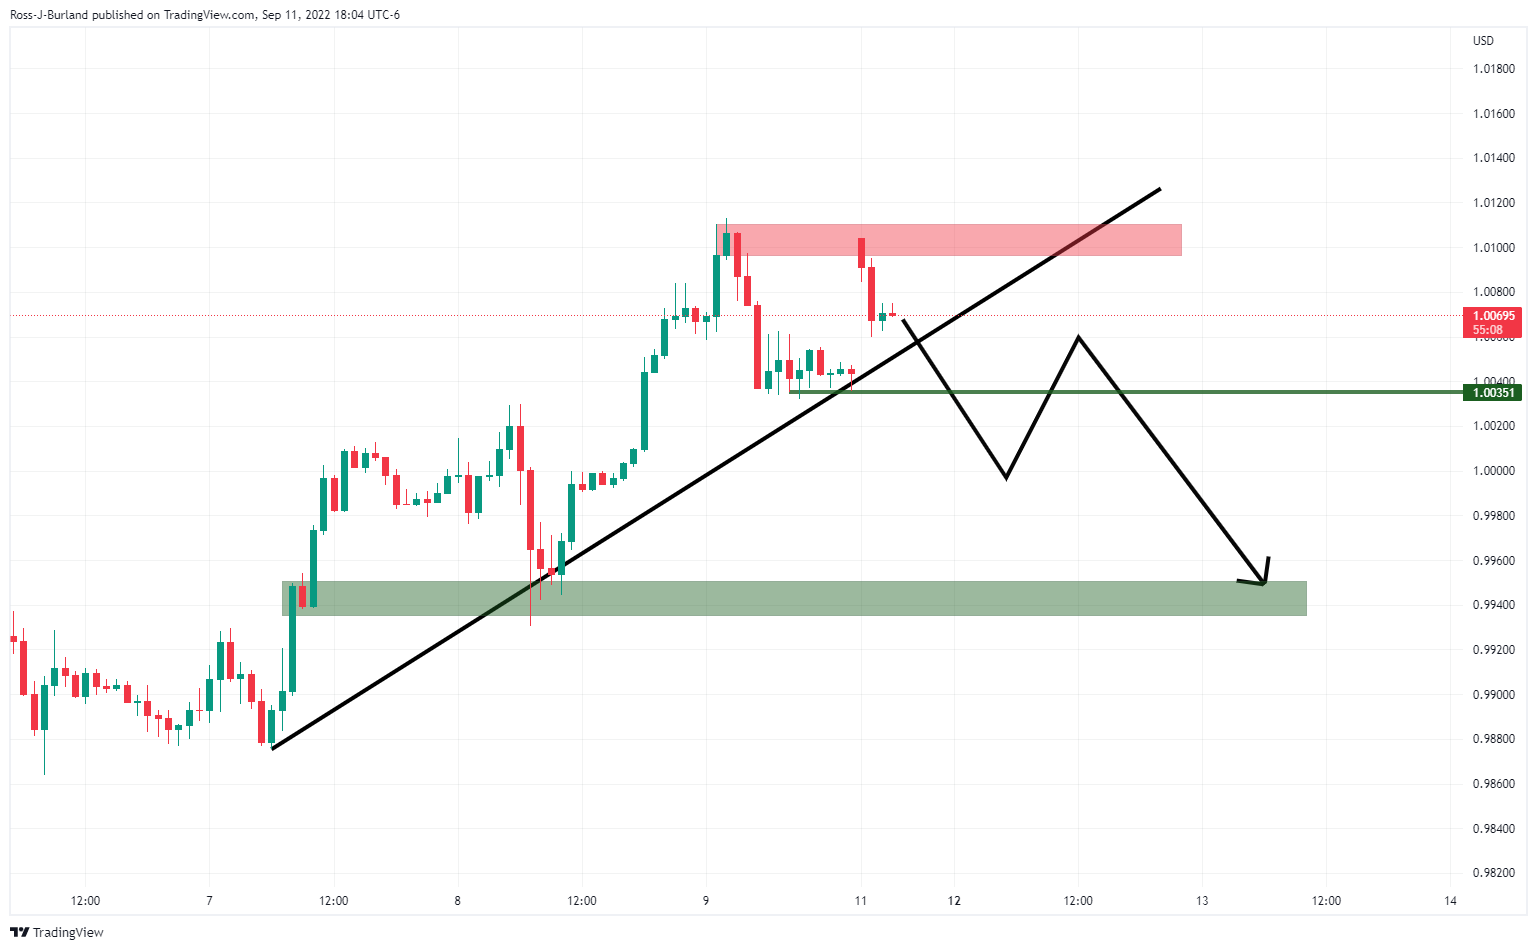
From a 1 hour perspective, the key support is seen at 1.0035 which guards a run down towards 0.9950. In such a scenario, the trendline support will give way for the grind lower.
-
01:00
GBP/USD Price Analysis: Bulls keep reins above 1.1600 ahead of UK data dump
- GBP/USD remains on the front foot after defying monthly bearish channel, crossing 10-DMA.
- Bull cross on MACD, firmer RSI also backs the pair’s recovery moves.
- Bears have a bumpy road to return, descending trend line from May is the key support.
GBP/USD remains on the front foot as it keeps Friday’s upside break of the bearish channel and the 10-DMA hurdle during Monday’s Asian session. That said, the Cable pair grinds higher around 1.1620 at the latest.
Not only the upside break of the 10-DMA and rejection of the bearish chart pattern but the recently firmer RSI (14) and the strongest bullish MACD signal in a month also favor the GBP/USD buyers.
With this in mind, the pair bulls aim for the 21-DMA hurdle surrounding 1.1700 ahead of the UK’s key monthly statistics for July, namely Industrial Production, Gross Domestic Product (GDP) and Manufacturing Production.
It’s worth noting, however, that the GBP/USD upside past 1.1700 needs validation from July’s bottom surrounding 1.1760 to keep buyers on the board. Following that, a north-run towards the previous monthly high surrounding 1.2280 can’t be ruled out, with the 1.2000 likely acting as an intermediate halt.
Alternatively, pullback moves may initially rest on the 10-DMA resistance-turned-support, around 1.1555 by the press time, before revisiting the stated bearish channel’s upper line, close to 1.1500 at the latest.
In a case where GBP/USD remains bearish past 1.1500, a four-month-old downward sloping support line, near 1.1375, could challenge the sellers before directing them to the aforementioned channel’s bottom, at 1.1284 by the press time.
GBP/USD: Daily chart

Trend: Further recovery expected
-
00:42
AUD/USD struggles near 0.6850 as risk-on mood ebbs ahead of Aussie employment, US inflation
- AUD/USD struggles to extend the weekly gains, remains sidelined of late.
- Fears emanating from China, light calendar tests pair buyers.
- Hopes of overcoming inflation fears jostle with receding hawkish expectations from RBA to restrict the upside moves.
- China’s off, light calendar and cautious mood ahead of the key top-tier data may test the momentum traders.
AUD/USD bulls struggle to keep reins, after posting the biggest weekly rebound in five, amid Monday’s sluggish Asian session. In addition to China’s holiday, fears emanating from the dragon nation and a light calendar also challenge the Aussie pair traders around the mid-0.6800s by the press time.
The Mid-Autumn Festival results in a bank holiday in China, the largest customer of Australia, which in turn tests the AUD/USD pair buyers as the quote previously cheered hopes of more stimulus from the dragon nation.
Also challenging the upside momentum is the latest news from Reuters suggesting that US President Joe Biden is to hit China with broader curbs on US chip and tool exports. On the same line could be the analysis suggesting a 20-year low oil demand from China due to covid curbs, shared by Reuters.
It’s worth noting that comments from US Treasury Secretary Janet Yellen and some of the prominent Fed policymakers could also be linked to the AUD/USD pair’s latest struggle to keep buyers on the board.
That said, US Treasury Secretary Janet Yellen mentioned that, during the CNN interview on Sunday, “Fed is going to need skill and luck to bring inflation down while maintaining labor market strength.” The policymaker also mentioned that US consumers could experience a spike in gas prices in winter when the European Union significantly cuts back on buying Russian oil.
Elsewhere, Federal Reserve Governor Christopher Waller was the prominent one as he said on Friday that he supports another significant hike in two weeks. On the same line was Kansas City Fed President Esther George who said, as reported by Reuters, “Case for continuing to remove policy accommodation is clear cut.” Furthermore, Cleveland Federal Reserve Bank President Loretta Mester said, “One inflation report is insufficient to alter one's outlook.” The policymaker also stated that he sees policy rates rising slightly above 4% by early 2023.
It should be noted that a divergence between Fed Chairman Jerome Powell’s hawkish tone and Reserve Bank of Australia (RBA) Governor Philip Lowe’s hesitance in suggesting aggressive rate hikes seemed to have also challenged the AUD/USD buyers of late.
Amid these plays, Wall Street marked another positive day and the US Treasury yields remained sluggish for the 10-year while being firmer for the two-year tenure. The S&P 500 Futures prints mild gains at the latest.
Given the light calendar and China’s holiday, AUD/USD traders may witness a lackluster day ahead. However, Tuesday’s US Consumer Price Index (CPI) and Thursday’s Australia jobs report are the key catalysts for the pair traders to watch for clear directions.
Technical analysis
AUD/USD bulls are at the test as buyers attack the monthly bearish channel’s resistance line, at 0.6870 at the latest. Also acting as an upside hurdle is the 50-DMA level near 0.6900. It’s worth noting, however, that the impending bull cross on the MACD and firmer RSI favor the pair’s upside momentum.
-
00:40
USD/CHF struggles around 0.9600 on upbeat market sentiment, US CPI eyed
- USD/CHF has faced barricades around 0.9600 amid a risk-on market tone.
- Lower consensus for the US CPI is impacting the mighty DXY.
- The Swiss Franc’s lower jobless rate has weakened the USD/CHF pair.
The USD/CHF pair is facing less-confident hurdles around 0.9600 in the early Tokyo session. The asset moved higher after a tepid opening around 0.9580 but is facing exhaustion signals amid a risk-on market mood. A failure to sustain above 0.9600 will drag the greenback bulls towards the previous week’s low of around 0.9560.
A lower consensus for the US Consumer Price Index (CPI) is impacting the mighty US dollar index (DXY). As per the market forecasts, US inflation is seen lower at 8.1% vs. 8.5% recorded for July on an annual basis. A decent drop in headline CPI led by falling gasoline prices and soaring interest rates by the Federal Reserve (Fed) is sufficient to activate bears in the DXY counter.
Investors should be aware of the fact that declining oil infused-inflation will not trim the odds of a third consecutive 75 basis point (bps) rate hike by the Fed. Price pressures are still beyond the desired rate of 2% and it will take a hell of sweat to fix the inflation monster. The core CPI that excludes oil and food prices will improve by 10 basis points (bps) to 6%.
Fed Governor Christopher Waller said on Friday that it was too soon to say whether inflation was moving meaningfully and persistently downward, as reported by Reuters. Fed policymaker added further that the tight labor market has faded signs of recession ahead and the extent of the rate hike will be more data-driven.
On the Swiss franc front, it is worth noting that the decline in the USD/CHF pair is significantly higher than the decline in the mighty US dollar index (DXY) in a broader context. This indicates that the Swiss franc bulls have strengthened extremely after a decline in Swiss Unemployment Rate data. Last week, the Swiss jobless rate landed at 2.1%, against 2.2% as expected on a monthly basis.
-
00:09
AUD/JPY advances towards 98.00 ahead of Australia’s employment data
- AUD/JPY is marching towards 98.00 on higher consensus for Australian employment data.
- Australian Employment Change is seen extremely higher at 50k against job layouts of 40.9k.
- RBA’s fourth rate hike by 50 bps poured fresh blood into the aussie bulls.
The AUD/JPY pair has displayed a powerful rebound after a gap down opening around 97.00 on Monday. The asset is advancing firmly towards the immediate hurdle of 98.00 amid an overall bullish bias towards the risk barometer. Broadly, a break above 94.80-96.10 has already strengthened the aussie bulls.
The antipodean witnessed buying interest from the market participants after the announcement of an interest rate hike by the Reserve Bank of Australia (RBA). RBA Governor Philip Lowe went hawkish and announced a hike by 50 basis points (bps) consecutively for the fourth time to address its foremost priority of scaling down price pressures. Currently, RBA’s Official Cash Rate (OCR) stands at 2.35%.
The central bank has set a target for interest rate elevation and has forecasted the area where inflationary pressures will find their peak. The RBA is looking to escalate its OCR further to 3.85%. Also, the inflation rate will top around 7%. It is worth noting that the inflation rate for the second quarter of CY2022 has been recorded at 6.1%.
Going forward, the Australian employment data will hog the limelight. As per the consensus, the Unemployment Rate is expected to remain stable at 3.4%. The show stopper data will be Employment Change, which is seen extremely higher at 50k against job cuts of 40.9k.
On the Tokyo front, the upbeat Gross Domestic Product (GDP) data failed to bring meaningful strength to the yen bulls. The Japanese GDP data landed at 0.9%, higher than the forecasts of 0.7% and the prior release of 0.5%. Also, the annual data improved meaningfully to 3.5% against the expectations and the prior print of 2.9% and 2.2% respectively.
-
00:07
China oil demand may shrink first time since 2002 as covid curbs bite
Oil demand in China, the world's biggest energy consumer, could contract for the first time in two decades this year as Beijing's zero-COVID policy keeps people at home during upcoming holidays and reduces fuel consumption, reported Reuters.
Key quotes
Hundreds of millions of Chinese who typically hit the roads and domestic flights during the Mid-Autumn Festival - falling on Sept. 10 this year - and early October's Golden Week holidays are expected to stay home to avoid being ensnared by sudden lockdowns to curb the spread of COVID-19.
Lockdowns in key cities such as financial hub Shanghai already hurt China's oil demand in the second quarter while recovery for the rest of the year is expected to be slow as China sticks to its zero-COVID policy. This could cap intake of the world's top crude oil importer and dent global oil prices.
China's demand for gasoline, diesel and jet fuel could fall by 380,000 barrels per day (bpd) to 8.09 million bpd in 2022, which would be the first contraction since 2002, said Sun Jianan, an analyst from Energy Aspects, calling it a ‘watershed moment". In comparison, demand rose 450,000 bpd, or 5.6%, in 2021.
As of Aug. 31, bookings for domestic air travel during the holiday are 38.5% lower than 2021, data tracked by ForwardKeys showed, while flight bookings for Golden Week travel are expected to fall by 23.8% from last year.
Road traffic in the southwestern city of Chengdu, which has extended its COVID lockdown, is down 50% this week from a year earlier, according to Baidu data.
In the fourth quarter, gasoline, diesel and jet fuel demand are expected to increase by about 530,000 bpd from the third quarter to 8.55 million bpd, Energy Aspect's Sun said, adding that demand could fall further if COVID cases increase.
For aviation fuel, demand of about 500,000 bpd is less than half of the 1.1 million to 1.2 million bpd in pre-pandemic days, said Mukesh Sadhav, head of downstream and oil trading at consultancy Rystad Energy.
Market reaction
Despite the price-negative news, oil prices grind higher past $86.00, up 0.40% intraday by the press time.
Also read: US Treasury Secretary Yellen: Fed is going to need skill and luck
-