Notícias do Mercado

12 dezembro 2022
  • 23:49

    GBP/JPY finds bids around 168.50 ahead of UK Employment, BOE policy a key trigger ahead

    • GBP/JPY has reversed after dropping marginally below 168.50, following the footprints of the GBP/USD major.
    • Higher UK average earnings could be a double-edged sword for the economy.
    • The BOE is likely to return to a slower pace hike approach after a 50 bps rate hike announcement this week.

    The GBP/JPY pair has witnessed a termination in a corrective move to near 168.50 as investors are shifting their focus toward the United Kingdom Employment data. A recovery in the GBP/USD pair has propelled a rebound in the cross.

    The asset is expected to reclaim the immediate resistance of 169.00 led by a recovery in monthly Gross Domestic Product (GDP) data in the UK. The monthly GDP data (October) reported an expansion of 0.5% while the street was expecting a contraction of 0.1%. Meanwhile, Industrial and Manufacturing Production data remained better than anticipation but have contracted on an annual basis for October month.

    After solid economic activities data, investors are awaiting the release of the UK Employment data for further guidance. As per the projections, the UK economy is expected to report negative jobless claims numbers. The economic data (Nov) is seen at -13.3K vs. the prior release of 3.3K. This indicates that the demand for labor is extremely higher. While the quarterly Unemployment Rate (October) is seen higher at 3.7% against the former release of 3.6%.

    Apart from that, the crucial catalyst is the Average Earnings data. Quarterly Average Earnings excluding Bonus data is seen higher at 5.9% vs. the former release of 5.7%. Increment in earnings for the households will support them in offsetting higher payouts due to mounting inflation but will also propel inflation to escalate further as higher earnings support bumper retail demand. Therefore, it could be a double-edged sword for the economy.

    This week, the show-stopper event is the interest rate decision from the Bank of England (BOE), which will be announced on Thursday. Analysts from Danske Bank are expecting a return of the BoE to a slower hiking pace after a 50 bps rate hike announcement. 

    On the Tokyo front, Bank of Japan (BOJ) board member Hajime Takata said in an interview with the Nikkei newspaper published on Saturday that Japan's economy is not yet in a phase where the central bank can end yield curve control. He further added that there were some positive signs in corporate capital expenditure and wages, as reported by Reuters.


  • 23:41

    USD/CHF retreats to 0.9350 amid cautious mood ahead of US inflation

    • USD/CHF fades the week-start rebound from eight-month low, sidelined of late.
    • Markets turn dicey as precursors for the US inflation data flash mixed signals.
    • Wall Street closed positive but yields stay firmer.

    USD/CHF struggles to extend the previous day’s recovery while taking rounds to 0.9360-50 during early Tuesday. In doing so, the Swiss Franc (CHF) pair portrays the market’s anxiety ahead of the key US Consumer Price Index (CPI), especially when the early signals for the data flash mixed lights.

    On Monday, the New York Federal Reserve’s (Fed) Survey of Consumer Inflation Expectations Survey stated that the 1-year ahead inflation expectations slumped to their lowest level since 2021 and marked the biggest month-to-month decline in November on record. It’s worth observing that the last week’s downbeat prints of the United States Producer Price Index (PPI) also hinted at softer US inflation but the University of Michigan’s (UoM) Consumer Sentiment Index, as well as the US ISM Services PMI and inflation expectations from the UoM Survey, suggested firmer prints of the US CPI. As a result, the USD/CHF traders remain off the table amid mixed signals for the key United States inflation release.

    Also likely to have challenged the USD/CHF traders could be the recently mixed signals from China and Russia. Chinese Foreign Ministry spokesman Wang Wenbin conveyed dislike for the US sanctions on two of their diplomats on Monday.  “These illegal sanctions severely affected Sino-American relations,” Wang said as per Reuters. Elsewhere, Russian President Vladimir Putin’s rejection to supply oil to the countries respecting Europe-led price cap also raise the market’s fears and exert downside pressure on the USD/CHF price.

    The market’s indecision favored the benchmark 10-year US Treasury bond yields rose three basis points (bps) to 3.61% but Wall Street also closed in greed and tried to challenge the USD/CHF buyers by the end of Monday’s North American session.

    Moving on, the early signals for the US CPI for November hint at a softer print of 7.3% YoY, versus 7.7% prior figure, while the monthly CPI is likely to ease to 0.3% compared to 0.4% previous readings. It should be noted that the CPI ex Food & Energy appears to be the key and is expected to be unchanged at 0.3% MoM, which can surprise the USD/CHF traders in case of a firmer print. It should be noted that the firmer inflation data can push the Federal Open Market Committee (FOMC) members to stay away from the bearish bias and defend the latest rate hikes, which in turn could signal more upside for the USD/CHF.

    Technical analysis

    A two-week-old resistance line near 0.9370 restricts immediate upside of the USD/CHF pair, which in turn directs the quote towards the recently flashed multi-day low near 0.9310.


  • 23:26

    US Inflation: JP Morgan, Goldman Sachs both expect S&P 500 gains on likely softer CPI

    As global markets keenly await the US Consumer Price Index (CPI) data for November, analysts from Goldman Sachs (GS) and JP Morgan (JPM) came out with their expectations on how the headline inflation numbers could affect the benchmark US equity index S&P500.

    JP Morgan appears more bullish on the S&P 500 as it expects the equity benchmark to rise by 2% to 3% in case the CPI YoY matches market forecasts ranging between 7.2% to 7.4%. That said, the US bank anticipates a rally between 8.0% and 10.0% in case the inflation figure arrives as 6.9% or lower.

    “Index is likely to sink as much as 5% should inflation exceed 7.8%,” mentioned JP Morgan.

    Goldman Sachs appears a bit reserved in its forecasts and anticipates S&P 500 gains of above 3% if the US CPI comes in under 7%.

    “A reading 7 to 7.3% would see 2 to 3% added to the S&P500,” adds GS while also stating that (the US CPI) from 7.4% to 7.7% sees the S&P 500 drop 1 to 2%. The US bank also stated that the inflation readings above 7.7% could see S&P 500 losses of more than 3%.

    Also read: Forex Today: US inflation and central banks coming up next

  • 23:16

    EUR/USD Price Analysis: Bulls about to throw in the towel?

    • EUR/USD could be in a phase of distribution.
    • Bears are lurking at the highs of the bull cycle. 

    The Euro was mostly flat against the US Dollar at the start of the week. EUR/USD traded between 1.0580 and 1.0505 on Monday. On the charts, the bulls remain on the front side of a daily trendline support, although the trend is decelerating and weak longs are starting to move out ahead of key events this week. 

    The following illustrates the bearish bias should the price slide out of the trendline supports:

    EUR/USD daily charts

    As illustrated, the structure of support required to make way for further downside is located near 1.0450.

    EUR/USD H1 chart

    The Euro is already breaking a micro trendline on the hourly chart as it decelerates on the bid. A phase of distribution could be in process that would be expected to eventually offer a bearish structure for a downside opportunity. 

  • 23:11

    USD/CAD declines towards 1.3600 on hawkish BOC Macklem’s speech and firmer oil

    • The Canadian Dollar is being supported by firmer oil prices and BOC Governor’s hawkish commentary.
    • JP Morgan Chase & Co. see a spark in S&P500 post a drop in US Inflation data.
    • Oil prices rebounded as a key pipeline supplying oil to the US remained shut.

    The USD/CAD pair is displaying a fragile rebound after dropping to near 1.3620 in the early Asian session. Earlier, the Lonnie asset delivered a breakdown of the consolidation formed in a range of 1.3640-1.3680 on a hawkish speech from Bank of Canada (BOC) Governor Tiff Macklem. Also, a recovery in positive risk profile traction has supported the Canadian Dollar against the Greenback.

    The US Dollar Index (DXY) is hovering inches higher from the crucial support of 105.00. An improvement in investors’ risk appetite led by a recovery in S&P500 has impacted safe-haven’s appeal.

    Analysts at JP Morgan Chase & Co. believe that a soft reading in United States Consumer Price Index (CPI) data could spark a powerful rally in United States equities. The 500-stock basket of the United States could rally up to 10% if headline inflation drops to 6.9% or lower, as reported by Bloomberg.

    While speaking to business leaders in Vancouver, BOC Governor said that policy tightening has begun to work but would take time to feed the economy. The present challenge in front of the BOC is that higher interest rates could push the economy into an unnecessarily painful recession, as reported by Reuters. He further added that elevated inflation levels despite higher interest rates will force the BOC to escalate policy tightening further to achieve price stability.

    On the oil front, oil prices have rebounded sharply after picking demand above the critical support of $70.00. A Supply crisis was triggered as a key pipeline supplying the United States remained shut while Russian President Vladimir Putin threatened to cut production in retaliation for a Western price cap on its exports, reported Reuters.


  • 23:07

    AUD/JPY Price Analysis: Conquers the 20-day EMA as a double bottom, looms

    • AUD/JPY climbs above the 20-day EMA, eyeing a break of 93.00.
    • Double bottom in the daily chart targets a test of the YTD high around 98.60.

    The AUD/JPY prolonged its gains to seven straight days amidst a risk-on impulse that benefitted high-beta currencies, while safe-haven ones remain downward pressured, except for the US Dollar (USD), bolstered by a looming US CPI report. At the time of writing, the AUD/JPY is trading at 92.81.

    AUD/JPY Price Analysis: Technical outlook

    From a daily chart perspective, the cross-currency pair is neutral to upward biased, testing the 20-day Exponential Moving Average (EMA) at around 92.86. After bottoming on December 6 to its monthly lows of 91.08, it formed a double bottom, which would be confirmed, once the AUD/JPY clears the October 21 swing high of 95.74.  

    If that scenario plays out, the AUD/JPY following resistance would be the September 20 high of 96.54, followed by the YTD high at 98.60.

    Traders should be aware that the Relative Strength Index (RSI) is in bearish territory and paused its uptrend while the Rate of Change (RoC) is about crossing above 0, meaning that buying pressure would be building in the near term.

    As an alternate scenario, the AUD/JPY first support would be the 200-day Exponential Moving Average (EMA) at 92.00. Once cleared, the next support would be December’s 5 swing low of 91.08, followed by the August 2 pivot low at 90.83.

    AUD/JPY Key Technical Levels


  • 23:05

    Gold Price Forecast: XAU/USD lures bears on rising wedge confirmation ahead of United States inflation

    • Gold price stays depressed after snapping four-day uptrend and confirming bearish chart pattern.
    • United States inflation expectations test US Dollar bulls, as well as XAU/USD sellers, amid mixed mood ahead of key events.
    • Headlines surrounding China, Russia also challenge sentiment and Gold price even as equities, Treasury bond yields rose.
    • United States Consumer Price Index for November will be crucial for Gold traders.

    Gold price (XAU/USD) holds lower ground near $1,780 after confirming a bearish chart pattern before a few hours. That said, the yellow metal’s latest inaction could be linked to the market’s cautious mood ahead of the United States' key inflation numbers for November, namely the Consumer Price Index (CPI). It should be noted that the Gold dropped the most in a week as the US Dollar began the crucial week on a positive note despite downbeat inflation expectations and upbeat performance of the equities, as well as the Treasury bond yields.

    US Dollar rebound weighs on Gold price

    US Dollar Index (DXY) carried Friday’s recovery moves to Monday and weighed on the Gold price. In doing so, the greenback’s gauge versus the six major currencies benefited from the market’s cautious mood while tracing the United States Treasury bond yields.

    It’s worth observing, however, that the benchmark 10-year US Treasury bond yields rose three basis points (bps) to 3.61% but Wall Street also closed in the greed and tried to challenge the Gold bears by the end of Monday’s North American session.

    With this, the DXY remains sidelined around 105.00 by the press time as traders await the key US inflation number, namely the US CPI, as well as the Federal Open Market Committee (FOMC) meeting announcements. The same appeared to challenge the latest Gold price moves ahead of the key catalysts.

    As a result, Reuters stated that the dollar gained against most currencies on Monday in choppy trading ahead of key data expected to show United States inflation moderating in November on a year-on-year basis, and a Federal Reserve decision that likely slows the pace of rate increases at the conclusion of its two-day policy meeting on Wednesday.

    Inflation Expectations fail to impress Gold buyers

    Gold price remains on the back foot even as the New York Federal Reserve’s (Fed) Survey of Consumer Inflation Expectations appeared as downbeat. That said, the 1-year ahead inflation expectations slumped to their lowest level since 2021 and marked the biggest month-to-month decline in November on record. It’s worth observing that the latest week’s downbeat prints of the United States Producer Price Index (PPI) and UoM Consumer Sentiment Index, as well as the US ISM Services PMI and inflation expectations, helped the Gold buyers to keep the reins.

    China, Russia news also please XAU/USD bears

    In addition to the firmer US Dollar, headlines surrounding China and Russia also seemed to have weighed on the Gold price.

    Although further easing in the Zero-Covid policy kept the equity traders’ optimism intact, the risk of more Sino-America tussles seemed to weigh on the sentiment, as well as the XAU/USD price. Chinese Foreign Ministry spokesman Wang Wenbin conveyed dislike for the US sanctions on two of their diplomats.  “These illegal sanctions severely affected Sino-American relations,” Wang said per Reuters.

    Elsewhere, Russian President Vladimir Putin’s rejection to supply oil to the countries respecting Europe-led price cap also raise the market’s fears and exert downside pressure on the Gold price.

    United States Consumer Price Index is crucial for Gold

    The early signals for the United States Consumer Price Index (CPI) for November hint at a softer print of 7.3% YoY, versus 7.7% prior figure. The monthly CPI is also likely to ease to 0.3% compared to 0.4% previous readings. It should be noted that the CPI ex Food & Energy appears to be the key and is expected to be unchanged at 0.3% MoM, which can surprise the Gold traders in case of a firmer print. It should be noted that the firmer inflation data can push the Federal Open Market Committee (FOMC) members to stay away from the bearish bias and defend the latest rate hikes, which in turn could signal more downside for the XAU/USD.

    With this in mind, Analysts at ANZ said, “FOMC members can revise their forecasts up until lunchtime of the first day of the meeting, but we think the number (US CPI) would have to be around 0.6% m/m or higher on a core basis to raise the probability of a larger hike than 50bp.”

    Gold price technical analysis

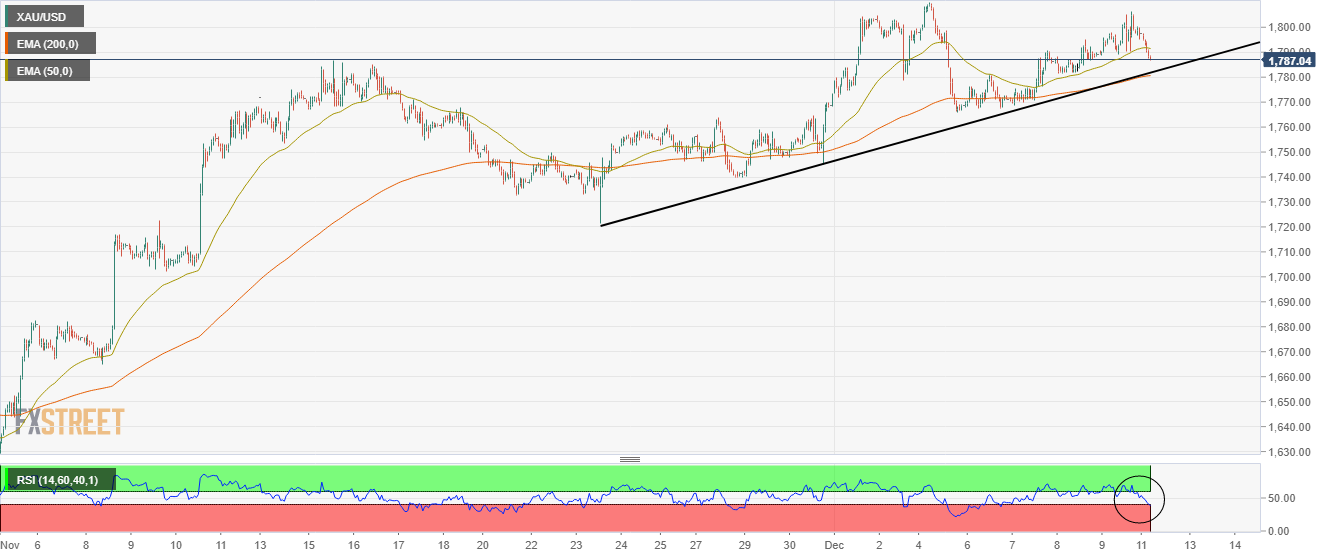
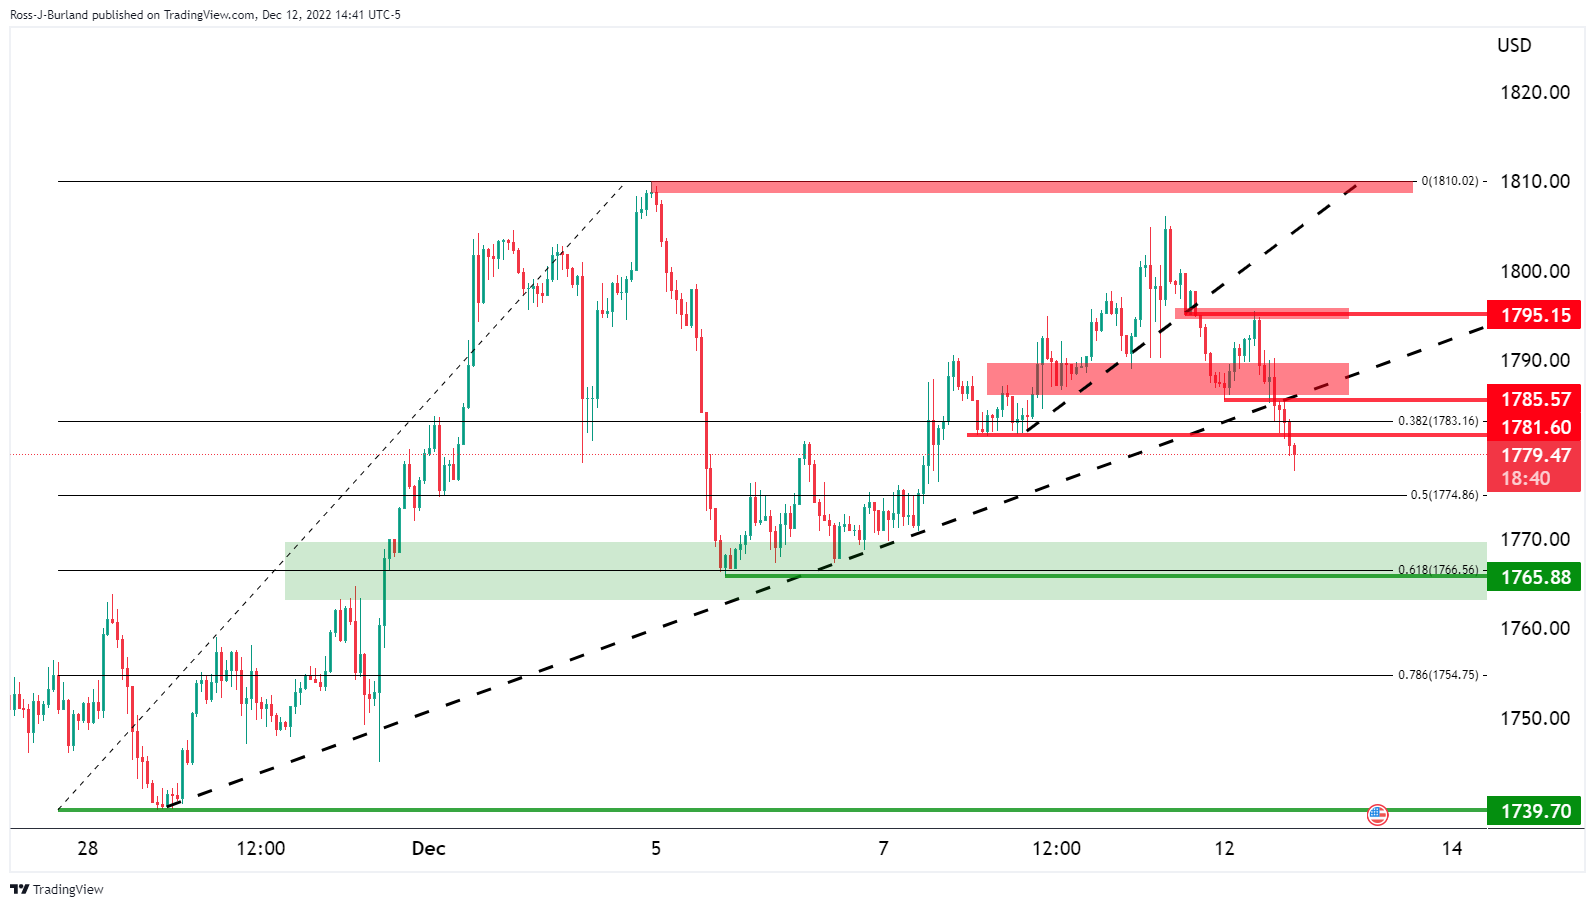
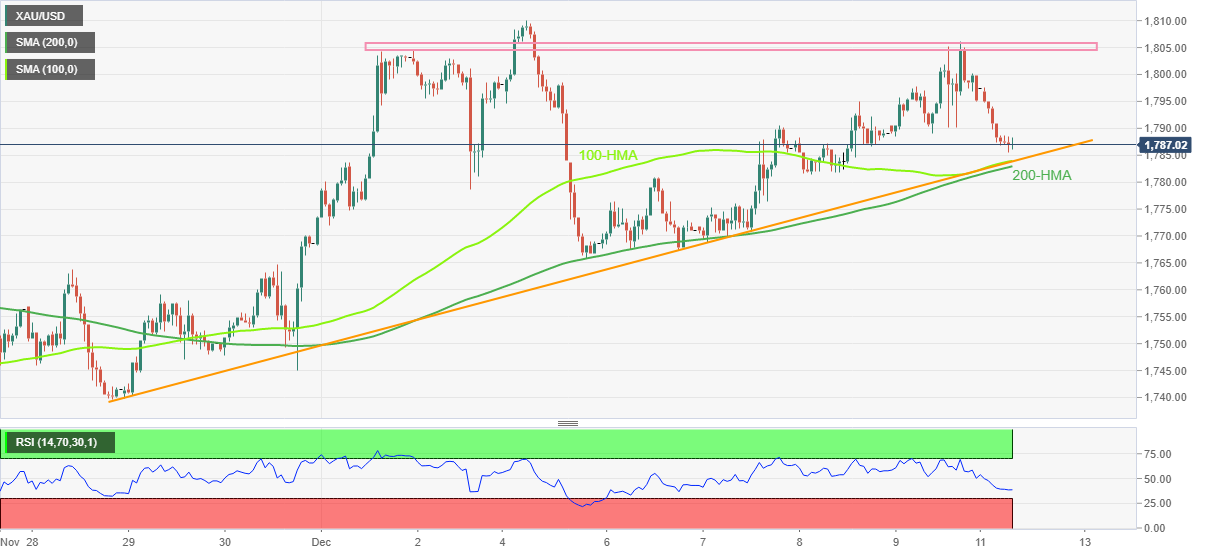
    Gold price confirmed a one-month-old rising wedge bearish chart pattern with a daily closing below $1,788 support, now resistance. The bearish bias also justifies the downbeat signals from the Relative Strength Index (RSI) line, placed at 14, as well as the Moving Average Convergence and Divergence (MACD) indicator.

    As a result, the yellow metal is all set, technically, to aim for the theoretical target surrounding $1,700. However, the 100-bar Simple Moving Average (SMA) and late November’s low, respectively near $1,768 and $1,721, could act as intermediate halts during the gold’s expected fall.

    It’s worth noting that the XAU/USD weakness past $1,700 won’t hesitate to challenge the November 04 swing high surrounding $1,682.

    Alternatively, recovery needs validation from the support-turned-resistance line of the aforementioned rising wedge, around $1,788.

    Even so, a one-week-old descending resistance line near $1,805 and the stated wedge’s top line around $1,820 by the press time, could challenge the gold buyers.

    Overall, the Gold price is likely to witness further downside as it braces for the key United States inflation data.

    Gold price: Daily chart

    Trend: Further downside expected


  • 22:40

    NZD/JPY Price Analysis: Hits a fresh YTD high at around 87.90s

    • An upbeat sentiment bolstered the New Zeland Dollar to fresh yearly highs vs. the Japanese Yen.
    • NZD/JPY: A decisive break above 87.93 could open the door above 88.00; otherwise, a fall towards 87.00 is likely.

    The New Zealand Dollar (NZD) reached a fresh 52-week high around 87.93 during Monday’s trading session, courtesy of a risk-on impulse, which bolstered risk-perceived currencies to the detriment of the Japanese Yen (JPY). At the time of writing, the NZD/JPY is trading at 87.80.

    NZD/JPY Price Analysis: Technical outlook

    The NZD/JPY hit a fresh YTD high of 87.93 on Monday, invalidating a previous double-top formation that emerged in November 2022. The cross-currency pair remains upward biased, though the Relative Strength Index (RSI) at bullish territory turned flat, while the Rate of Change (RoC) depicts buyers losing momentum.

    In the near term, the NZD/JPY 1-hour chart illustrates the pair is upward biased, though a negative divergence between price action and the Relative Strength Index (RSI) suggests sellers are moving in. Additionally, the Rate of Change (RoC) shows that buying pressure is fading. Hence, the NZD/JPY first support would be the daily pivot point at 87.69. A breach of the latter will expose the intersection of the S1 pivot point and the 50-Exponential Moving Average (EMA) at 87.44, followed by the 100-EMA at 87.19 and the S2 pivot point at 87.04.

    NZD/JPY 1-Hour chart

    NZD/JPY Key Technical Levels


  • 22:30

    GBP/USD Price Analysis: Struggles to cross 1.2300 ahead of Fed/BOE policy

    • GBP/USD is facing hurdles in conquering the round-level resistance of 1.2300.
    • An explosion of a symmetrical triangle results in wider ticks and heavy volume.
    • The 200-EMA around 1.2200 is acting as major support for the Cable.

    The GBP/USD pair is struggling to surpass the immediate resistance of 1.2300 in the early Asian session. The Cable is displaying topsy-turvy moves from Friday in a range of 1.2200-1.2300, which indicates a volatility contraction, and an explosion of the same results in wider ticks and volume. Also, investors are restricting themselves from making significant positions ahead of the monetary policy announcements by the Bank of England (BOE) and the Federal Reserve (Fed).

    Meanwhile, the US Dollar index (DXY) is struggling to sustain above the round-level support of 105.00. A significant improvement in investors’ risk appetite has trimmed the appeal for safe-haven.

    On an hourly scale, the Cable is oscillating in a Symmetrical Triangle chart pattern that indicates a volatility contraction and a sideways performance. The upward-sloping trendline of the chart pattern is plotted from December 7 low at 1.2107 while the downward-sloping trendline is placed from December 5 high at 1.2345.

    The 200-period Exponential Moving Average (EMA) at around 1.2200 is providing support to the pound Sterling. Meanwhile, the Relative Strength Index (RSI) (14) is oscillating in a 40.00-60.00 range, which indicates a consolidation ahead.

    For more upside, a decisive break above December 9 high at 1.2323 will drive the Cable toward June 7 low at 1.2430, followed by the psychological resistance at 1.2500.

    On the flip side, a drop below Friday’s low of around 1.2200 will drag the asset toward December 7 low at 1.2107. A breakdown of the latter will expose the major for more downside toward November 15 high at 1.2029.

    GBP/USD hourly chart


  • 22:11

    BOC’s Macklem: Should see much clearer evidence next spring that inflation is moving down

    “(We) should see much clearer evidence next spring that inflation is moving down,” added Governor of the Bank of Canada, Tiff Macklem while speaking to business leaders in Vancouver.

    The policymaker also added, “We are starting to see some improvements in the balance in the labor market.”

    “Inflation is well above our target and it is a long way back to our 2% target,” adds BOC’s Macklem.

    Earlier in the day, BOC Governor Macklem praised the Canadian central bank’s monetary policy while turning down inflation risk.

    Also read: Bank of Canada says higher rates are starting to work, frets over inflation risk

    USD/CAD rebounds

    USD/CAD bounces off the latest trough surrounding 1.3625 to 1.3637 following the comments from BOC’s Macklem. However, the upside momentum remains doubtful as traders await the US inflation data on early Tuesday.

    Also read: Forex Today: US inflation and central banks coming up next

  • 22:03

    AUD/USD extends recovery above 0.6750 as investors shrug off pre-US Inflation anxiety

    • AUD/USD has stretched its recovery above 0.6750 as the risk-off impulse has lost its traction.
    • A decline in November US PPI numbers has resulted in lower consensus for inflation data.
    • This week, The speech from RBA Governor and Australian payroll data will remain in focus.

    The AUD/USD pair has extended its gains to near 0.6751 in the early Asian session after rebounding from near 0.6730.  The Aussie asset has shown strength and has gauged recovery as investors are shrugging off anxiety ahead of the United States Consumer Price Index (CPI). The US Dollar Index (DXY) has again failed in surpassing the critical resistance of 105.20 and has dropped to near 105.00.

    S&P500 manifested a sharp recovery Monday as investors cheered expectations of a slowdown in the current interest rate hike pace by the Federal Reserve (Fed), portraying a recovery in the risk appetite theme. The 10-year US Treasury yields recovered sharply and has overstepped the crucial hurdle of 3.60%.

    Investors are keeping an eye on the release of the United States inflation data as it will set the ground for Wednesday’s Fed policy. As per the projections, the headline US inflation is seen lower at 7.3% vs. the former release of 7.7%. Also, the core US inflation that excludes oil and food prices is seen lower at 6.1% against the prior figure of 6.3%. A fresh decline in consensus for US CPI is supported by a sheer drop in US Producer Price Index (PPI) data.

    November’s US headline PPI dropped sharply to 7.4% as manufacturers were forced to reduce prices of the end products at the factory gate due to a decline in consumer spending.

    On the Aussie front, investors are keeping an eye on the speech from Reserve Bank of Australia (RBA) Governor Philip Lowe, which is scheduled for Wednesday. The speech from RBA Governor will provide cues about the likely monetary policy action in January 2023. Apart from that investors will focus on Thursday’s employment data.


  • 22:01

    NZD/USD stumbles below 0.6400 ahead of US CPI data, and Fed’s decision

    • US Dollar gained against the New Zealand Dollar as traders brace for the US CPI report.
    • Inflation expectations reported by the New York Fed showed people estimate inflation will cool down.
    • New Zealand housing data further deteriorated due to increased borrowing costs.

    The New Zealand Dollar (NZD) drops against the US Dollar (USD) amidst a risk-on impulse and also a buoyant US Dollar. Data revealed in the US showed that inflation expectations continued to ease ahead of Tuesday’s US Consumer Price Index (CPI) report. At the time of writing, the NZD/USD is trading at 0.6382 after hitting a daily high of 0.6421.

    NZD/USD falls ahead of November’s US CPI report

    Wall Street finished on a higher note before the release of inflation data in the United States (US). The NZD/USD is expected to remain subdued as market analysts carefully watch the upcoming US Consumer Price Index (CPI) release. It is estimated to show a slight dip from previous levels – YoY readings should decrease from 7.7% to an estimated 7.3%, while Core CPI may drop slightly from 6.3% to 6%. A fall in CPI would be a tailwind for the NZD/USD pair after the release of the latest Reserve Bank of New Zealand (RBNZ) Monetary Policy Statement (MPS).

    Elsewhere, American households predicted their inflation rate in the year ahead to be at its lowest since August 2021. According to a November report from the Federal Reserve Bank of New York’s monthly Survey of Consumer Expectations, this was an estimated 5.2%, down significantly from October’s prediction of 5.7%. Longer-term forecasts for inflation over three and five years also decreased compared with previous months’ expectations

    In the meantime, the REINZ Housing data report revealed that the housing market had seen a troubling trend, with prices falling significantly from their peak last November. Unsurprisingly this has been attributed to the RBNZ MPS back in November, and while there is still uncertainty about how far home values may drop, it is estimated that they could fall by around 22%.

    NZD/USD Price Analysis: Technical outlook

    The NZD/USD daily chart suggests the pair is neutral-biased, though a positive inflation report could pave the way for a break above 0.6400 and then above the August 12 daily high of 0.6421. Once cleared, the NZD/USD bias would shift upwards, with the next resistance at around the June 3 swing high at 0.6575. As an alternate scenario, the NZD/USD first support would be the psychological 0.6300. A breach of the latter will expose the  20-day Exponential Moving Average (EMA) at 0.6287, followed by the 200-day EMA at 0.6240.


  • 21:45

    New Zealand Food Price Index (MoM) came in at 0%, below expectations (0.1%) in November

  • 21:36

    EUR/USD holds in bullish territory awaiting US CPI and the Fed

    • EUR/USD holds in a bullish territory as markets await key US  data and the Fed. 
    • The Fed is expected to deliver a 50 bp rate hike but will be scrutinised for clues. 

    EUR/USD is trading near 1.0535, mostly consolidated while traders get braced for interest rate decisions from a slew of central banks this week. The European Central Bank is expected to deliver a dialled-down 50 bps rate hike on Thursday, while the Federal Reserve, an arguably more key event, is expected to deliver a hawkish 50 bps hike also.

    US CPI eyed

    First up, the United States Consumer Price Index will be a key data event on Tuesday, which could cement the sentiment of either a more hawkish or dovish Federal Reserve for the months ahead, ceiling the fate of the US Dollar.

    ''Core prices likely maintained a firm pace in November, rising 0.3% MoM for a second consecutive month. Shelter inflation likely remained the key wildcard, though we look for goods deflation to act again as an offset. Importantly, gas prices are expected to provide relief to the CPI, as they fell in Nov. All told, our m/m forecasts imply 7.3%/6.1% YoY for total/core prices,'' analysts at TD Securities said.

    Meanwhile, the money markets are currently pricing an almost 75% chance that the US central bank will hike rates by 50 basis points after delivering four successive 75 basis point rate increases. However, some analysts anticipate a hawkish outcome from the event. 

    ''We expect a more hawkish tone than what he delivered to the Brookings Institution last month,'' analysts at Brown Brothers Harriman said awaiting the interest rate decision and who argued that ''the Fed narrative remains too dovish.''

    'With both Average Hourly Earnings (AHE) and core Personal Consumption Expenditures (PCE) flat-lining near 5% for most of this year, we don’t think this expected tightening path will get inflation back to target, not when the labour market remains so firm and consumption is holding up,'' the analysts explained. ''Furthermore, the swaps market continues to price in an easing cycle in H2 2023. This seems highly unlikely and so the mispricing continues,'' the analysts argued. 


  • 21:16

    Bank of Canada says higher rates are starting to work, frets over inflation risk

    Reuters reported that the Governor of the Bank of Canada, Tiff Macklem, who was speaking to business leaders in Vancouver, said the tightening had "begun to work" but would take time to feed through the economy.

    Going forward, the challenge is that raising rates too much would risk driving the economy "into an unnecessarily painful recession", he said. Not raising them enough would allow price increases to remain elevated and feed expectations for persistently high - or sticky - inflation.

    "With inflation running well above target, this is the greater risk," Macklem said. "If high inflation sticks, much higher interest rates will be required to restore price stability, and the economy will have to slow even more sharply."

    USD/CAD update

    The Canadian Dollar is bid on the day and vs. the US Dollar, the currency is 0.1% higher at 1.3630. Meanwhile, Money markets see a roughly 40% chance that the central bank would hike by 25 basis points at its next policy decision on Jan. 25.


  • 20:09

    Forex Today: US inflation and central banks coming up next

    What you need to take care of on Tuesday, December 13:

    The US Dollar started the week on the back foot but changed course during the American session to end the day with uneven gains against its major rivals. Asian and European indexes closed in the red, while Wall Street managed to post gains after a tumultuous week.

    Action, however, was limited amid a scarce macroeconomic calendar and ahead of several first-tier events, starting Tuesday with an update on US inflation, then followed by monetary policy decisions from the US Federal Reserve, the Bank of England and the European Central Bank.

    The New York Federal Reserve released the Survey of Consumer Expectations, which showed that inflation expectations have fallen for the year ahead, although they remain elevated. At the same time, the survey indicated that expected inflation marked a record month-to-month decline in November, while the median inflation uncertainty decreased in the short and medium term.

    The EUR/USD pair settled at around 1.0520 after peaking at 1.0580. The GBP/USD pair trades around 1.2250, unable to extend gains beyond 1.2300 despite generally positive UK data. The October Trade Balance posted a deficit of £14.476 billion, while the monthly GDP rose by 0.5%, beating the 0.1% decline expected.

    The Australian dollar edged lower against its American rival, with AUD/USD currently trading at around 0.6740. The USD/CAD pair lost some ground and settled at 1.3636, as the Canadian Dollar benefited from strengthening oil prices. Exports from Russia’s Black Sea terminals were suspended on Saturday amid a storm in the region, boosting prices. WTI currently trades at $73.10 a barrel.

    China further relaxed its coronavirus-related restrictions but there was little market reaction to the positive headline.

    The US Dollar surged against safe-haven rivals. USD/JPY trades around 137.80 while spot gold battles around $1,780.

    The US will release the November Consumer Price Index on Tuesday. Annual inflation is foreseen at 7.3%, easing from the previous month’s 7.7% rate, while the core CPI, which excludes volatile food and energy prices, is expected to have risen by 6.1%.  On Wednesday, the US Federal Reserve (Fed) will announce its decision on monetary policy, while the European Central Bank (ECB) will do the same on Thursday. Both central banks are expected to hike rates, although the extent of such hikes is uncertain. The Fed may slow the pace of tightening and proceed with a 50 bps hike, while the ECB may finally turn hawkish.


    Like this article? Help us with some feedback by answering this survey:

    Rate this content
  • 19:43

    Gold Price Forecast: XAU/USD bears take out key supports, eye $1,765

    • Gold price bears have move din for the kill at the start of the week.
    • $1,765 swing lows are now in sight and in-the-money longs below there is a target for the bears. 

    Gold price has started out the week on the back foot and printed a low of $1,777.68 having fallen from a high of $1,797.46. Gold price is down by some 0.96% at the time of writing while the US Dollar has cut early losses to trade higher by some 0.25% as per the DXY index at 105.20.

    All eyes on the Federal Reserve

    Investors are potentially moving to the sidelines ahead of the US data events this week that kick off with the US Consumer Price Index on Tuesday.  This data comes ahead of the showdown event for the week in the Federal Open Markey Committee meeting that will conclude a week's long blackout period of Federal Reserve speakers. Gold price would be expected to suffer if the peak for the Fed funds tilts higher than expected should inflation becomes entrenched. 

    Money markets are currently pricing an almost 75% chance that the US central bank will hike rates by 50 basis points after delivering four successive 75 basis point rate increases. However, some analysts anticipate a hawkish outcome from the event. 

    ''We expect a more hawkish tone than what he delivered to the Brookings Institution last month,'' analysts at Brown Brothers Harriman said who argued that ''the Fed narrative remains too dovish.''

    'With both Average Hourly Earnings (AHE) and core Personal Consumption Expenditures (PCE) flat-lining near 5% for most of this year, we don’t think this expected tightening path will get inflation back to target, not when the labour market remains so firm and consumption is holding up,'' the analysts explained. ''Furthermore, the swaps market continues to price in an easing cycle in H2 2023. This seems highly unlikely and so the mispricing continues,'' the analysts argued. 

    Gold technical analysis

    The bulls have thrown in the towel on the lower time frames as the Gold price breaks $1,780 support and a number of micro trendlines:

    $1,765 swing lows are now in sight and in-the-money longs below there is a target for the bears. 

  • 19:39

    USD/CAD grinds higher above 1.3650 ahead of BoC Macklem speech, US CPI data

    • Inflation expectations in the US dipped, as reported by the NY Fed.
    • USD/CAD traders are eyeing a speech of Bank of Canada Governor Tiff Macklem.
    • Consumer Price Index in the United States is forecasted to fall, which would weigh on the US Dollar.

    The USD/CAD remains positive during the day amidst a risk-on impulse, ahead of Tiff Macklem’s speech around 20:40 GMT, ahead of a crucial inflation report in the United States (US), as the Federal Reserve (Fed) last monetary policy meeting of 2022 looms. Also, inflation expectations revealed by the New York Fed cooled, which could be a prelude to Tuesday’s report. At the time of writing, the USD/CAD is trading at 1.3657.

    Inflation expectations cooled, according to the New York Fed

    Wall Street is set to finish Monday’s session positively. The latest data released by the New York Federal Reserve showed that household inflation expectations are expected to dip to 5.2% over the following 12 months, down from November’s 5.7%, according to the Survey of Consumer Expectations published Monday.

    In the meantime, the release of the US Consumer Price Index (CPI) could be a significant indicator for determining the trajectory of USD/CAD. With forecasts predicting a decrease from 7.7% to 7.3% and core CPI anticipated to decline from 6.3% to 6%, both readings on an annual pace, if results allude towards diminishing inflation conditions, it may lead to the USD losing more strength in comparison with its counterpart, the Canadian Dollar (CAD).

    In the meantime, the US Dollar Index, which tracks the greenback’s performance against a basket of peers, is rising 0.25% at 105.198, underpinned by high US Treasury bond yields.

    Aside from this, on the Canadian side, the Bank of Canada (BoC) lifted rates by 50 basis points to 4.25% at its last monetary policy meeting. As reported by Reuters, money market futures expect the BoC to hike by a lesser size of 25 bps on January 25. At around 20:40 GMT, we will hear from BoC Governor Macklem, who hosts a fireside chat on the economic outlook, which we look for a similar tone to last week’s Economic Progress Report.

    USD/CAD Key Technical Levels


  • 19:00

    United States Monthly Budget Statement: $-249B (November) vs previous $-88B

  • 18:34

    United States 10-Year Note Auction: 3.625% vs previous 4.14%

  • 18:31

    USD/CHF Price Analysis: Climbs toward 0.9370s as a double-bottom emerged

    • USD/CHF bounces around the last week’s lows around 0.9310s.
    • Near term, the USD/CHF formed a double bottom, which targets a rally towards 0.9430s.

    The USD/CHF bounces from last week’s lows around 0.9313 and rises toward 0.9350s, due to a slight jump in US Dollar (USD) demand, amidst an optimistic market sentiment. Elevated US Treasury yields and market-moving economic data from the US due Tuesday bolstered the USD. At the time of writing, the USD/CHF is trading at 0.9378, above its opening price.

    USD/CHF Price Analysis: Technical outlook

    With the USD/CHF climbing in the North American session after bottoming at the falling-wedge bottom trendline, the USD/CHF remains neutral to downward biased. Nevertheless, a clear break above last Friday’s high of 0.9381 could pave the way to challenge the 0.9400 figure. The Relative Strength Index (RSI0 at bearish territory suggests sellers remain in charge; whatsoever the Rate of Change (RoC) indicates, they are losing momentum.

    Short term, the USD/CHF formed a double bottom in the one-hour chart, which would be confirmed by a decisive break above 0.9381. Once achieved, the USD/CHF following resistance would be 0.9400, followed by the December 8 daily high of 0.9426, ahead of 0.9455. On the flip side, the USD/CHF first support would be the 100-Exponential Moving Average (EMA) at 0.9368. A breach of the latter will expose the 50-EMA at 0.9353, followed by the 20-EMA at 0.9347.

    USD/CHF Key Technical Levels


  • 18:19

    GBP/USD traders in high anticipation of Federal Reserve and Bank of England

    • The British Pound vs the United States Dollar is bullish.
    • GBP/USD is on the backside of a broken prior trendline resistance which is also bullish.
    • All eyes are on the Federal Reserve and Bank of England meetings.

    The British Pound is firm on Monday within a bullish cycle that targets the 1.2400 area in what would be a measured move to the upside from the recent lows near 1.2100. Fundamentally, all eyes will be on the Federal Reserve and Bank of England interest rate announcements this week.

    Federal Reserve & Bank of England are key

    GBP/USD will be in the limelight this week due to the Monetary Policy Committee (MPC) and Federal Open Market Committee (FOMC) meetings this week. The outcome of the meetings will set the interest rates for both the United States of America's and the United Kingdom's central banks, the Federal Reserve (Fed) and the Bank of England (BoE) respectively. 

    Fed & BoE expectations

    ''We expect the Bank of England (BoE) to hike the Bank Rate by 50bp on 16 December bringing it to 3.50%,'' analysts at Danske Bank said. 

    ''In its statement we expect the BoE to highlight the dire state of the UK economy lending support to our call that market pricing is too aggressive currently pricing a peak in the Bank Rate at 4.60% by August 2023, the analysts at Danske Bank argued. 

    As for the Federal Reserve, ''we expect the FOMC to deliver a 50bp rate increase at its December meeting, lifting the target range for the Fed funds rate to 4.25%-4.50%,'' analysts at TD Securities said. 

    Meanwhile, World Interest Rate Probabilities suggest that a 50 bp hike on December 14 by the FOMC is fully priced in, with only around 10% odds of a larger 75 bp move. The latter outcome would be expected to support the United States Dollar (USD)  as rates markets price in a more aggressive rate-setting path for 2023 and beyond. Currently, the swaps market is pricing in a peak policy rate of 5.0%, with very low odds of a higher 5.25% peak. For now, WIRP suggests around 60% odds of a 50 bp move on February 1 and then around 75% odds of a final 25 bp hike in Q2. 

    The Federal Reserve chairman, Jerome Powell, will hold a press conference after the Federal Open Markey Committee's release of the Statement. Jerome Powell’s press conference will be key. ''We expect a more hawkish tone than what he delivered to the Brookings Institution last month,'' analysts at Brown Brothers Harriman said who argued that ''the Fed narrative remains too dovish.''

    ''With both Average Hourly Earnings (AHE) and core Personal Consumption Expenditures (PCE) flat-lining near 5% for most of this year, we don’t think this expected tightening path will get inflation back to target, not when the labour market remains so firm and consumption is holding up,'' the analysts explained. ''Furthermore, the swaps market continues to price in an easing cycle in H2 2023.  This seems highly unlikely and so the mispricing continues,'' the analysts argued. 

    Britain's murky growth outlook

    Meanwhile, the British Pound held steady against the US Dollar on Monday, despite a murky economic growth outlook ahead of the Bank of England's next policy decision. Gross Domestic Product grew by 0.5% after September's 0.6% contraction, but fears of a lengthy UK recession are still weighing on sentiment.

    However, on the whole, the data dump that included Industrial Production and Manufacturing Production was a positive prelude for the labour market data that will be reported Tuesday.  Average Weekly Earnings and the Unemployment Rate will be key in this regard. 

    Analysts at Rabobank argued that a recession in the United Kingdom likely started last quarter and is widely expected to persist throughout next year. 

    ''In November, the Bank of England's Governor Andrew Bailey indicated that the market may have been priced in a too aggressive path of policy tightening from the Bank,'' the analysts said.

    ''This underpins his concerns about the depth of the downturn facing the economy. A recession, however, will be needed to loosen the labour market and bring demand down in line with supply.  We expect a 50bp BoE rate rise in December, followed by another 50bp increase in February and subsequently a series of three 25bp rate increases to a terminal rate of 4.75%,'' the analysts added.

    GBP/USD technical analysis, Daily charts

    The British Pound vs the United States Dollar is travelling within a bullish channel. GBP/USD is on the backside of a broken prior trendline resistance which is also bullish and eyes are on a continuation of the prior bullish impulse for a run towards 1.2400 on a clean break of 1.2250. 

  • 17:51

    AUD/USD fails to crack 0.6800 and retraces toward 0.6730s on a strong USD

    • AUD/USD struggled around 0.6800 and dropped towards its daily lows below 0.6730s, losses 0.86%.
    • Last week’s US inflation data and the Consumer Price Index on Tuesday underpin the US Dollar.
    • AUD/USD traders eye Australia’s Business Confidence and Conditions ahead of the US CPI.

    The Australian Dollar (AUD) snapped three days of gains and dropped 0.84%, following last Friday’s US producer’s inflation data, ahead of the release of the Consumer Price Index (CPI) in the United States (US). An upbeat sentiment that usually bolsters the AUD/USD keeps the AUD pressured. Therefore, the AUD/USD is trading at 0.6735 after hitting a daily high, shy of the 0.6800 figure.

    US Consumer Price Index looming, a headwind for the AUD/USD

    Risk appetite improved, as shown by US equities rising. The lack of economic data from the US and Australia kept investors digging into last week’s US economic data. The Department of Labor revealed last Friday that the Producer Price Index (PPI) rose for three consecutive months, exceeding expectations on an annual base. At 7.4% year-over-year and 6.2%, excluding food and energy prices, such figures indicate inflation being stubbornly stickier than expected. Also, the consumer sentiment improved to 59.1 from 56 .8 according to the University of Michigan’s data released Friday, although inflation projections dropped slightly, with one-year horizon forecasts dropping to 4.6% from 4.9%.

    The US Consumer Price Index (CPI) could be a catalyst in determining the AUD/USD pair direction. The CPI is expected to decrease from 7.7% YoY to 7.3%, while core CPI is foreseen to fall from 6.3% to 6%. If findings indicate cooling inflation conditions, it may result in the US Dollar weakening further.

    The Australian side's lack of economic data leaves the AUD adrift to market sentiment and China’s developments. Despite re-opening many areas in China, investors remain cautious about making decisions with uncertainties surrounding how rising Covid cases could affect economic activity. Recently, Chinese authorities have taken steps such as shutting down their tracking app and removing all “at risk” decrees from Shanghai effective December 13th, hopefully providing further insight into future developments.

    On Tuesday, the Australian economic calendar will feature Business Confidence and Business Conditions, both released revealed by the National Bank of Australia. This comes in anticipation of the upcoming US Consumer Price Index (CPI) release on Tuesday and the Federal Reserve’s monetary policy decision on Wednesday.

    AUD/USD Key Technical Levels


  • 16:42

    Silver Price Forecast: XAG/USD tumbles to $23.10s on overall US Dollar strength

    • An appreciation of the US Dollar weighs on Silver prices.
    • The robust US Producer Price Index report confirms that inflation is stickier than estimated.
    • Consumer Sentiment in the United States improved last week while inflation expectations eased.
    • Rising US Treasury bond yields undermine the XAG/USD value.

    Silver price retraces from daily highs of $23.53 reached in the European session and tumbles toward $23.17, courtesy of a sudden change in market mood, with US Treasury yields trimming its earlier losses, while the US Dollar (USD), shifted positively. Therefore, the XAG/USD is trading at $23.16, below its opening price by 1.31%.

    US equities remain buoyed amidst an upbeat sentiment, trading in the green. Last week’s economic data from the Department of Labor, with the Producer Price Index (PPI), not only rose 0.3% MoM for three consecutive months but also outpaced expectations on an annual base, up 7.4% YoY and 6.2% YoY, excluding food and energy prices. During the day, the University of Michigan (UoM) Consumer sentiment improved to 59.1 from 56.8 last month, the data showed Friday. Delving into the report, inflation expectations dropped from 4.9% to 4.6% in the one-year horizon.

    Tuesday’s release of the US Consumer Price Index (CPI) could be a catalyst in determining the performance of the precious metal segment and the US Dollar. It is anticipated that CPI will have decreased, with YoY readings expected to drop from 7.7% to an estimated 7.3%, while core CPI has been predicted to fall slightly from 6.3% to 6%. If findings indicate cooling inflation conditions, it may result in the US Dollar weakening further, which would underpin the white metal.

    In the meantime, the US Dollar Index (DXY), a gauge of the buck’s value against a basket of six currencies, is gaining 0.14%, back above the 105.000 threshold, while the US 10-year benchmark note is yielding 3.586%, slightly tilted to the upside, by one bps.

    Therefore, the XAG/USD would likely keep downward pressured ahead of the US inflation report. A hotter-than-expected CPI data could pave the way to prolong rate hikes by the Federal Reserve, meaning the US Dollar would strengthen, to the detriment of the precious metals segment.

    Silver Key Technical Levels


  • 16:34

    United States 3-Year Note Auction: 4.093% vs previous 4.605%

  • 16:29

    BoE: A return to a slower hiking pace with the end of the hiking cycle near – Danske Bank

    On Thursday, the Bank of England (BoE) will announce its decision on monetary policy; market consensus is for a 50 basis points rate hike. Analysts from Danske Bank expected a return of the BoE to a slower hiking pace.  They point out that a slightly dovish BoE and a hawkish ECB (decision also on Thursday) should send EUR/GBP higher during the day.

    Key Quotes: 

    “We expect the Bank of England (BoE) to hike the Bank Rate by 50bp on 16 December bringing it to 3.50%. Markets are currently pricing slightly above 50bp for the meeting next week (55bp). As a result of a more balanced fiscal policy, market conditions have cooled off and broadly returned to conditions we saw prior to the mini-budget. We thus expect a return to slower hiking pace.”

    “In our base case of a 50bp hike, we expect EUR/GBP to move slightly higher on announcement. In its statement we expect the BoE to highlight the dire state of the UK economy lending support to our call that market pricing is too aggressive currently pricing a peak in the Bank Rate at 4.60% by August 2023. Combined with the expectation of a hawkish 50bp hike by the ECB later in the afternoon, we expect EUR/GBP to move further higher during the afternoon, ending the day ½ figure higher.”
     

  • 16:22

    NY Fed: One-year consumer inflation expectation declines to 5.2% in November

    The Federal Reserve Bank of New York's monthly Survey of Consumer Expectations showed on Monday that the US consumers' one-year inflation expectation declined to 5.2% in November from 5.9% in October, marking the biggest one-month decline on record.

    Further details of the publication showed that the three-year ahead expected inflation edged lower to 3% from 3.1% in October and the five-year ahead expected inflation declined modestly to 2.3% from 2.4%.

    Finally, the year-ahead increase in gasoline price is seen at 4.7%, down from 5.3% in October.

    Market reaction

    The US Dollar Index showed no immediate reaction to this report and was last seen posting small daily gains at 105.07.

  • 16:21

    USD/JPY rises further above 137.50 to five-day highs amid higher yields and risk appetite

    • Japanese Yen among weakest currencies on Monday amid risk appetite.
    • US yields move modestly to the upside ahead of US CPI and FOMC decision.
    • USD/JPY to face resistance below 138.00.

    The USD/JPY is trading at the highest level since last Wednesday at 137.52, up almost a hundred pips on Monday ahead of critical events on the back of a stronger US Dollar.

    Dollar up despite Wall Street

    Equity prices are rising on Monday. The Dow Jones gains by 0.89% and the Nasdaq climbs by 0.41%. At the same time, US yields are moving to the upside supporting the US Dollar. The Japanese Yen is among the worst performers hit by yields and risk appetite.

    The USD/JPY appears to be finally moving away from the 136.60. A daily close around current levels would be the highest since late November, creating a bullish sign for the pair for a test of the 20-day Simple Moving Average that waits at 138.30. Before that area, many resistance levels are spotted between 137.50 and 138.00.

    Anyway, volatility in any direction seems to be the game in town for the next few days considering the critical events ahead, including data and central bank meetings.

    On Tuesday, the US Consumer Price Index is due with a decline expected to 7.3% (y/y) from 7.7%. “Last week, PPI came in higher than expected and confirmed our concerns that inflation is likely to prove to be much stickier than the markets expect.  We see upside risks for CPI this week, especially since last month’s lower-than-expected readings were due to a statistical quirk”, argued analysts at Brown Brother Harriman.

    The FOMC will announce its monetary policy decision on Wednesday. A 50 basis points rate hike is expected. The meeting includes new macroeconomics forecasts and Powell’s press conference.

    On Thursday, the European Central Bank and the Bank of England will deliver their policy statements with rate hikes of 50 basis points expected from both central banks.  The Bank of Japan meets next week.

    Technical levels


  • 15:59

    EUR/USD: Limited upside scope from here into year-end – MUFG

    Economists at MUFG Bank see limited upside scope for EUR/USD from here into year-end.  

    EUR upside limited from here 

    “ECB is set to signal more rate hikes but we expect terminal rate to be reached in Q1.”

    “There is a high expectation of balance sheet policy being updated with confirmation of QT commencing so it is unlikely to have much bearing on EUR performance.”

    “Given annual inflation may have only just peaked in the euro-zone, the tone of the ECB press conference is likely to still be hawkish but with the implied terminal rate at around 2.75%, we doubt rates or FX will advance notably higher in the aftermath.”


  • 15:45

    EUR/USD climbs around 1.0540 on soft US Dollar ahead of CPI

    • Last week’s Producer Price Index in the United States was hotter than expected, warranting a US Dollar upside.
    • US Consumer Price Index is estimated to cool, favoring the Euro, due to less tightening needed by the Federal Reserve.
    • US and Eurozone data revealed on the week suggests the EUR/USD could rally to the 2020 lows.

    The Euro (EUR) registers solid gains against the US Dollar (USD) on Monday, during the North American session, courtesy of overall US Dollar weakness. A busy economic calendar featuring monetary policy decisions by the Federal Reserve (Fed) and the European Central Bank (ECB) loom. Also, an inflation report by the United States (US) could confirm that rate hikes are taming inflation, which could pave the way for a sooner-than-expected pause. At the time of writing, the EUR/USD is trading at 1.0543.

    Upbeat mood keeps the US Dollar pressured after US PPI data

    Sentiment remains upbeat, as shown by US equities trading in the green. Last week’s economic data revealed that the Producer Price Index (PPI) for the United States rose more than foresaw up 0.3% MoM for the third consecutive month and increased by 7.4% YoY vs. a 7.2% estimated, as the Department of Labor reported last Friday. Excluding volatile items like food and energy, the PPI jumped by 0.4% MoM and 6.2%, with both figures exceeding estimates.

    US Consumer Price Index is estimated to drop below estimates

    In the meantime, the US Consumer Price Index (CPI), to be revealed on Tuesday, is expected to fall from 7.7% in the previous month’s reading to a 7.3% YoY consensus, while the so-called core CPI is estimated to drop from 6.3% to 6.1% YoY. If data shows that inflation is cooling, that could trigger Euro buying, exerting pressure on the US Dollar. Therefore, the EUR/USD might climb above the 1.0600 figure and test the 2020 yearly low of 1.0635.

    European Central Bank expected to hike at least 50 bps

    On the Eurozone front, the German ZEW economic sentiment is expected to improve to -24.6 from -36.7 set in November, according to a poll. Meanwhile, European Central Bankers (ECB) are split between lifting rates by 50 or 75 bps on Thursday. Initial indications suggest that the US Federal Reserve may be liable to an unexpected USD downturn, as a turning point in inflation has been evidenced. Conversely, it is premature to assert the same for the European Central Bank; consequently, the EU's inflation remains high with little chance of respite. These contrasting circumstances imply that this week’s central bank meetings could bolster the EUR/USD.

    EUR/USD Price Analysis: Technical outlook

    The EUR/USD daily chart depicts the pair as upward biased, but so far has failed to test the 2020 yearly low at 1.0636, which turned out to be a difficult resistance to hurdle. Also, sellers had been leaning to a seven-month-old downslope trendline drawn from May 2022 highs which pass around 1.0580/1.0600, as the EUR/USD has struggled to clear the latter. The Relative Strength Index (RSI) is in bullish territory but aiming lower, while the Rate of Change (RoC) displays that buyers are gathering momentum. If the EUR/USD buyers clear 1.0600, a test of 1.0635 is on the cards, followed by 1.0700. On the flip side, the EUR/USD might drop towards 1.0500, ahead of testing December’s low of 1.0392.

  • 15:45

    Gold Price Forecast: XAU/USD hits fresh daily lows under $1,785

    • Gold is moving with a bearish bias on Monday.
    • Quiet day for financial markets ahead of US CPI, Fed, ECB and BoE.
    • Daily close above $1,805 to open the doors to more gains.

    On a quiet Monday ahead of key events, XAU/USD is falling by more than $10, hovering around $1,784, the lowest level since Thursday. The yellow metal is extending the retreat from above $1,800.

    Gold price lost momentum during the American session amid higher US Treasury yields that also boosted the US Dollar. The US 10-year yield stands at 3.56% while the 2-year at 4.34%. In Wall Street, the Dow Jones is up by 0.55% and the Nasdaq gains by 0.04%. The improvement in risk sentiment and the rally in crude oil prices (up by more than 3%) are not helping hold.

    Price action remains limited on Monday ahead of likely volatile days ahead considering the upcoming events. On Tuesday, the US Consumer Price Index is due. On Wednesday, the Federal Reserve will announce its decision on monetary policy and on Thursday, the European Central Bank and the Bank of England.

    Bullish but…

    Gold’s chart is still showing a bullish bias but the upside presents difficulties holding above $1,800. The price needs to hold that area. A clear sign would be a daily close above $1,805 that could open the doors to the next strong resistance zone seen at $1,830,

    In the very short-term, the bias is to the downside with the next support at ·$1,775. A rebound above $1,790 (20-Simple Moving Average in the 4-hour chart) should change the bias.

    Technical levels


  • 15:34

    AUD and CAD to face downside pressures over the near term, before a bumpy recovery in 2023 – HSBC

    In the view of economists at HSBC, both the Australian Dollar and the Loonie are likely to face risk sentiment challenges over the near term, before a bumpy recovery in 2023.

    Near-term challenges

    “If the coming weeks bring a fresh bout of risk aversion (amid a still hawkish Fed, global growth concerns, and reasons for caution elsewhere), then both the CAD and AUD are likely to weaken against the USD. 

    “Our medium-term view is that both commodity currencies will probably be on a bumpy recovery path in 2023, as the Fed’s hiking cycle comes to an end.”


  • 15:29

    United Kingdom NIESR GDP Estimate (3M) meets forecasts (-0.3%) in November

  • 15:26

    IMF: Governments should use fiscal policies to reduce inflationary pressures

    In a blog post published on Monday, the International Monetary Fund (IMF) noted that the total public and private global debt fell to 247% of GDP in 2021 from 257% in 2020, marking the biggest one-year drop in seven decades.

    The IMF also said that high inflation will continue to reduce debt levels in 2023 but urged governments to use fiscal policies to reduce inflationary pressures.

    Managing high debt levels will become increasingly difficult if the global economic outlook deteriorates further, the IMF further warned.

    Market reaction

    The US Dollar Index showed no immediate reaction to these remarks and it was last seen trading modestly lower on the day at 104.80.


  • 15:11

    EUR/GBP: Potential to rise amid hawkish risks skewed to the ECB – TDS

    The ECB/BoE meet this week, with prospects of a hawkish surprise from the former. That favors upside in EUR/GBP, in the view of economists at TD Securities.

    Big risk for GBP lies in the vulnerability of the housing market

    “In Europe, we expect a 50 bps hike from both the ECB and BoE but see the hawkish risks skewed to the former. That favors upside in EUR/GBP, as the ECB has the wiggle room to deliver 75 bps, while the BoE should disappoint market terminal rate expectations over time.”

    “China reopening favors EZ growth over the UK, especially in the context of housing vulnerabilities. In turn, we argue that the recent dip of EUR/GBP offers a good entry point to start scaling into long exposure ahead of this week’s event risk.”


  • 14:41

    Gold Price Forecast: Events from the US will hold the key to determining the next direction in XAU/USD

    Inflation data from the US and the Federal Reserve’s policy announcements will help investors decide whether Gold will be able to extend its bullish rally into the end of the year, FXStreet’s Eren Sengezer reports.

    Fed dot plot to trigger next big action in XAU/USD

    “The US Bureau of Labor Statistics will release November inflation data on Tuesday. The annual Core CPI, which excludes volatile food and energy prices, is expected to edge higher to 6.4% from 6.3% in October. The market reaction to the inflation report is likely to be straightforward with a lower-than-expected Core CPI reading weighing on the US Dollar and providing a boost to XAU/USD and vice versa.”

    “Considering that FOMC Chairman Jerome Powell acknowledged in his last public appearance that it would make sense to moderate the pace of interest rate hikes, a 50 bps increase should not come as a big surprise. In case the Fed opts for a 75 bps hike, which is an extremely low possibility at this point, XAU/USD is likely to come under heavy bearish pressure and fall sharply.”

    “In September, the dot plot showed that officials’ median view of the Fed’s terminal (final) rate stood at 4.6%. The terminal is likely to be revised higher in December’s SEP. A reading closer to 5.5% than to 5.0% could be seen as reflecting a hawkish outlook by the majority of members, and trigger a rally in the US Treasury bond yields, as well as the USD. On the flip side, a terminal rate at or below 5.0% should allow markets to remain optimistic about a Fed policy pivot in the second half of 2023 and force the USD to continue to weaken against its rivals.”


  • 14:19

    GBP/USD: On track for a test of the 1.2450/60 zone – Scotiabank

    Cable retains a firm undertone. Economists at Scotiabank expect the GBP/USD pair to test the 1.2450/60 area.

    Short-term support is 1.2220

    “A steady procession of higher highs and higher lows on the short-term chart is keeping the GBP/USD pair on track for a test of 1.2450/60.” 

    “Short-term support is 1.2220, with stronger support seen at 1.2120/30.” 

    “A push through the 1.2340/50 area should give GBP gains some additional positive momentum.”

    See: Accumulation of bad news from the UK justifies a weak Sterling – Commerzbank

  • 13:58

    USD/CAD advances toward 1.3700 as oil prices struggle to rebound

    • USD/CAD trades modestly higher on the day above 1.3670.
    • Crude oil prices trade little changed on the day following last week's decline.
    • Bank of Canada Governor Macklem is scheduled to speak later in the day.

    USD/CAD started to edge higher toward 1.3700 in the second half of the day on Monday as the commodity-sensitive Canadian Dollar is having a difficult time attracting investors amid crude oil's dismal performance. The pair was last seen rising 0.18% on a daily basis at 1.3675

    The barrel of West Texas Intermediate (WTI) lost more than 10% last week and touched a fresh 2022-low near $70. Although China announced additional measures toward re-opening earlier in the day, investors don't seem to be convinced about oil demand improving in the near term. As of writing, the WTI was trading flat on the day at $71.40.

    Meanwhile, Wall Street's main indexes remain on track to open modestly higher with US stock index futures rising around 0.3% ahead of the opening bell.

    In case the market mood continues to improve later in the session, the US Dollar could weaken against its rivals and limit USD/CAD's upside. Later in the session, Bank of Canada (BOC) Governor Tiff Macklem will be delivering a speech. On December 7, the BOC hiked its policy rate by 50 basis points to 4.25% as expected and the policy statement revealed that policymakers were yet to decide whether the rate needs to rise further.

    On Tuesday, the Consumer Price Index (CPI) data will be featured in the US economic docket ahead of the Federal Reserve's all-important policy announcements on Wednesday.

    Technical levels to watch for


  • 13:56

    US CPI and FOMC meeting could trigger a USD short squeeze heading into year end – MUFG

    The week ahead is expected to be pivotal for USD performance through the rest of this year with the release of the latest US Consumer Price Index (CPI) report and final FOMC meeting of this year. Economists at MUFG Bank highlight the risk of USD short squeeze in week ahead. 

    Bearish USD trend set to be stress tested

    “Market participants are anticipating further confirmation that underlying inflation pressures (+0.3% MoM expected in November) are beginning to ease from an elevated starting point, which if confirmed should keep the USD on a softer footing heading into year end. On this occasion though an upside inflation surprise poses a greater risk of a bigger market reaction after the sharp weakening of the USD over the past month.”

    “The Fed has been clear that it plans to deliver a smaller 50 bps hike. USD performance will be driven mainly by: i) whether Chair Powell signals clearly that another step down in the pace of hikes is likely at the next FOMC meeting posing downside risks for the USD, and/or ii) whether the Fed signals that the policy rate will need to be raised to a higher peak above 5.0% in 2023 and remain higher for longer in 2024 posing upside risks for the USD.”


  • 13:23

    GBP/USD continues to push higher toward 1.2300

    • GBP/USD gained traction and advanced toward 1.2300 on Monday.
    • The data from the UK showed that the UK economy grew by 0.5% in October. 
    • The improving market mood seems to be weighing on the US Dollar.

    GBP/USD gained traction and climbed to a fresh daily high near 1.2300 in the early American session on Monday. As of writing, the pair was up 0.23% on the day at 1.2282.

    Earlier in the day, the data published by the UK's Office for National Statistics showed that the Gross Domestic Product expanded by 0.5% on a monthly basis in October following the 0.6% contraction recorded in September. This data, however, failed to trigger an immediate market reaction.

    Nevertheless, the improving market mood seems to be weighing on the US Dollar and helping GBP/USD continue to edge higher.

    At the time of press, US stock index futures were up between 0.3% and 0.35%, pointing to a positive opening in Wall Street's main indexes. Meanwhile, the US Dollar Index was posting modest daily losses at 104.80.

    On Tuesday, the November jobs report from the UK will be looked upon for fresh impetus. More importantly, the US Bureau of Labor Statistics will release the Consumer Price Index figures later in the day. Investors will scrutinize these data releases and their potential impact on the Bank of England's and the Federal Reserve's upcoming policy announcements later in the week. 

    Technical levels to watch for


  • 12:50

    EUR/USD: The 1.0650/1.0750 range is reachable in the next few weeks – Scotiabank

    EUR/USD holds firm trend through the upper 1.05s. Economists at Scotiabank believe that the pair could reach 1.0650/1.0750 in the coming weeks.

    Uptrend is intact and not at any obvious risk at the moment

    “EUR/USD looks somewhat consolidative but the broader uptrend is intact and not at any obvious risk at the moment.”

    “Gains through 1.06 sustain the developing bull trend in the short run and will help lift the EUR towards the 1.0650/1.0750 range we think is reachable in the next few weeks.”

    “Support is 1.0525 intraday and (firmer) 1.0450/75.”


  • 12:48

    AUD/USD stays below 0.6800 despite renewed US Dollar weakness

    • AUD/USD declined below 0.6800 during the European trading hours on Monday.
    • US Dollar struggles to find demand heading into American session.
    • Business sentiment data from Australia will be looked upon for fresh impetus.

    AUD/USD lost its traction after having recovered toward 0.6800 earlier in the day. Despite the renewed US Dollar weakness, the pair was last seen losing 0.4% on a daily basis at around 0.6770.

    In the absence of high-impact data releases, markets started the new week on a cautious note, allowing the US Dollar to find demand. Although the US Dollar Index started to edge lower amid improving market mood during the European trading hours, AUD/USD failed to stage a decisive rebound.

    Investors remain cautious as they try to figure out how the rising number of coronavirus cases on re-opening steps taken by China will impact economic activity. Earlier in the day, Chinese officials announced that they will take the Covid-tracking app offline and the city of Shanghai announced that all areas of the city will be deemed as "not at risk of Covid' from December 13. 

    There won't be any macroeconomic data releases from the US on Monday. In the early trading hours of the Asian session on Tuesday, the National Bank Australia (NBA) will release the Business Confidence and Business Conditions indexes for November.

    Ahead of Tuesday's Consumer Price Index data from the US and the Federal Reserve's monetary policy announcements on Tuesday, however, AUD/USD could have a hard time making a decisive move in either direction.

    Technical levels to watch for


  • 12:16

    USD Index approaches key support levels, risk of bounce – OCBC

    US Dollar Index holds steady following last week's choppy action. As economists at OCBC Bank note, a head and shoulders pattern could be forming. 

    A head & shoulders pattern in the making?

    “Bearish momentum on weekly chart intact and should underpin the broad bearish bias. Price action on weekly chart also exhibited a head & shoulders (H&S) pattern with neckline around 104.10.”

    “We do not rule out consolidative play with risk of bounce as DXY approaches key support levels. Support at 104.1 (recent low, H&S neckline) and 102.15. But assuming what we are seeing is an eventual play-out of a H&S, then the textbook price objective of the breakdown should be somewhere closer to 95-96 levels.”

    “Resistance at 105.75 (200DMA), 106 (21DMA) and 107.”


  • 12:03

    Shanghai City Government: Will deem all areas as 'not at risk of Covid' from December 13

    The government of Shanghai city announced on Monday that they will deem all districts as "not at risk of Covid" from Tuesday, December 13, as reported by Reuters.

    Earlier in the day, Chinese officials announced that they will take the application used to track coronavirus cases offline later this week.

    Market reaction

    There seems to be a positive shift in risk sentiment following this headline. As of writing, US stock index futures were up between 0.2% and 0.35% on a daily basis. Meanwhile, the US Dollar Index was last seen losing 0.17% at 104.75.

  • 12:02

    EUR/GBP to advance gradually toward 0.89 over next six months – Rabobank

    EUR/GBP has remained relatively stable this year despite the pickup in volatility in other currency pairs. Economists at Rabobank expect the pair to edge higher to 0.89 on a six-month view.

    EUR/USD may again dip below parity next year if gas prices soar again

    “Despite the possibility of a greater amount of policy tightening from the BoE vs. the ECB, the pound is vulnerable vs. the EUR given UK’s weakness in business confidence, investment and growth. The Pound is likely to be particularly susceptible if political drama increases again next year.”

    “EUR/USD may again dip below parity next year if gas prices soar again. This, however, would provide no comfort for GBP.”

    “We expect the process of peaking to be lengthy for the greenback with scope for potentially sizable dips for both EUR/USD and GBP/USD next year. For choice, we continue to expect a slow grind higher in the value of EUR/GBP to 0.89 on a six-month view.”


  • 12:01

    India Industrial Output dipped from previous 3.1% to -4% in October

  • 12:01

    India Manufacturing Output: -5.6% (October) vs previous 1.8%

  • 12:01

    India Cumulative Industrial Output dipped from previous 7% to 5.3% in September

  • 12:00

    Mexico Industrial Output (MoM) above expectations (-0.1%) in October: Actual (0.4%)

  • 12:00

    Mexico Industrial Output (YoY) below expectations (3.9%) in October: Actual (3.1%)

  • 11:30

    EU's von der Leyen: Our energy supply is safe for this winter

    European Commission President Ursula von der Leyen said in a press conference on Monday that Europe's energy supply will be safe this winter, as reported by Reuters.

    "Despite the action that we have taken, we might still face a gap of up to 30 billion cubic metres (bcm) of gas next year," she added and called on EU members to adopt the energy proposals swiftly.

    Market reaction

    EUR/USD edged higher following these comments. As of writing, the pair was trading at 1.0565, where it was up 0.35% on a daily basis.

  • 11:25

    Gold Price Forecast: XAU/USD extends sideways grind below $1,800

    • Gold price continues to fluctuate in a narrow range below $1,800.
    • 10-year US Treasury bond yield edges lower but holds above 3.5%.
    • Markets are likely to remain choppy ahead of this week's key events.

    Gold price is moving up and down in a tight range below $1,800 on Monday after having declined modestly during the Asian trading hours. The market action is expected to remain choppy at least until the November inflation report from the US on Tuesday.

    XAU/USD closed the previous week virtually unchanged as investors refrain from making large bets ahead of this week's key macroeconomic data releases and central bank decisions. Following the Consumer Price Index (CPI) data, the US Federal Reserve will announce its interest rate decision and publish the updated Summary of Economic Projections (SEP), the so-called 'dot plot.'

    Meanwhile, the benchmark 10-year US Treasury bond yield is edging lower during the European trading hours but managing to hold above the key 3.5% mark for the time being.

    Later in the session, the 10-year US Treasury note auction will be watched closely by market participants. In the previous auction, the high yield was 4.14%. In case the high yield stays above 4% following the auction, the 10-year US T-bond yield could gain traction.

    It's also worth noting that US stock index futures are up between 0.2% and 0.4%. If risk flows dominate the market action in the second half of the day, the US Dollar could have a difficult time finding demand.

    Technical levels to watch for


  • 11:22

    USD/JPY: Risks skewed to the upside – OCBC

    USD/JPY climbed above 137.00 earlier in the day but struggled to preserve its bullish momentum. Still, economists at OCBC Bank expect the pair to edge higher.

    Near term upside risks

    “Daily momentum shows signs of turning mild bullish while RSI rose. Risks skewed to the upside.”

    “Resistance at 138.40 (21DMA), 138.65 (61.8% fibo retracement of Aug low to Oct high), 141.20 (50% fibo).”

    “Support at 135.50 (76.4% fibo), 134.70 (200DMA) before 133.70.”

    See: USD/JPY to bounce toward 140.60 on a move above 138 – SocGen


  • 11:10

    USD/CAD to extend its rise towards 1.3810 and October peak of 1.3980 – SocGen

    The Canadian Dollar lost 1.3% on the US Dollar last week. Economists at Société Générale expect the USD/CAD pair to see further gains towards the 1.3810 mark and October peak of 1.3980. 

    Further uptrend likely

    “The USD/CAD pair has negated the previous Head and Shoulders and has reclaimed the 50-Day Moving Average.” 

    “A move towards 1.3810 and October peak of 1.3980 is expected.”

    “Last week's low at 1.3380 aligns as near term support.”

    See – USD/CAD: Loonie could appreciate substantially in 2023 – NBF


  • 10:42

    USD/CNY could rise towards 7.20 or beyond in the coming months – Commerzbank

    USD/CNY trades slightly below the 7 level. In the view of economists at Commerzbank, the pair could surge higher towards 7.20 and even beyond.

    Muted inflation but rate cut unlikely

    “Producer price once again fell in November by 1.3% YoY while consumer price inflation moderated further to just 1.6% YoY.”

    “Muted inflation provides the PBoC room for further monetary easing, but we think they will stick to using quantitative tools instead of interest rate cuts.”

    “The recent strengthening of CNY due to improved sentiment on reopening optimism provides some room for rate cuts. However, USD/CNY could surge beyond the 7 mark when markets realize the economic reality is not as rosy, and it could rise towards 7.20 or beyond in the coming months when the reopening process gets bumpy.”


  • 10:12

    GBP/USD to struggle to hold any gains over 1.23 – ING

    This week's highlight will be the Bank of England meeting on Thursday. Economists at ING expect the “Old Lady” to revert to a 50 bps hike with the GBP/USD pair moving below the 1.23 mark.

    BoE to hike 50 bps this week

    “We expect the BoE to revert to a 50 bps hike (55 bps hike priced) as it tries to balance high inflation against growing evidence of a prolonged downturn - with little signs of stimulus.”

    “Our game plan assumes that GBP/USD struggles to hold any gains over 1.23, while EUR/GBP should find support in the 0.85/0.86 area.”

    “A winter of discontent should see Sterling underperform should central bankers need to keep rates tight(er) into a recession.”


  • 09:48

    USD/JPY to bounce toward 140.60 on a move above 138 – SocGen

    USD/JPY climbed above 137.00 earlier in the day. If the pair overcomes 138.00, a short-term rebound is likely towards 140.60, economists at Société Générale report.

    135.00 must be defended to avert continuation in pullback

    “Daily MACD is in deep negative territory denoting the down move is a bit stretched. This is not a reversal signal however a brief bounce can’t be ruled out.”

    “If the pair overcomes the steep channel band at 138.00, a short-term rebound is likely towards 140.60 with next hurdle at 142.50/142.80, the 50% retracement of the down move.”

    “The MA at 135.00 must be defended to avert continuation in pullback.”


  • 09:40

    FX option expiries for Dec 12 NY cut

    FX option expiries for Dec 12 NY cut at 10:00 Eastern Time, via DTCC, can be found below.

    - EUR/USD: EUR amounts        

    • 1.0420 537m
    • 1.0510 1b
    • 1.0550 381m
    • 1.0610 452m

    - GBP/USD: GBP amounts        

    • 1.2150 446m

    - USD/JPY: USD amounts                     

    • 135.00 610m
    • 136.00 600m
    • 138.00 911m
    • 138.30 495m

    - USD/CHF: USD amounts        

    • 0.9820 460m

    - EUR/GBP: EUR amounts        

    • 0.8750 405m
  • 09:10

    Pivotal week for 2023 themes to determine Dollar’s fate – ING

    A pivotal week for FX and global asset markets lies ahead of us. The two key event risks are tomorrow's US November CPI reading and Wednesday's FOMC meeting. Economists at ING analyze how the US Dollar could react to these event risks

    DXY to go into tomorrow's CPI release near its current 105 levels

    “Event risks this week will determine whether 2023 starts with a focus on the inflation battle being won and the prospect of stimulative, reflationary policy coming through – a Dollar negative. Or whether sticky inflation ties the hands of central bankers, the US yield curve remains steeply inverted and the Dollar continues to perform well in a challenging risk environment. We do see the latter scenario as more likely, but this week should certainly give one of the scenarios a big lift.”

    “There is very little on the US calendar today and we would expect DXY to go into tomorrow's CPI release near its current 105 levels.”


  • 09:06

    EUR/USD looks to recapture 1.0600 ahead of key US/EU events

    • EUR/USD is catching a fresh bid, as the US Dollar drops with Treasury yields.
    • Risk sentiment remains tepid amid China’s covid woes, ahead of critical events.
    • EUR/USD targets a rising channel upper boundary at 1.0635 on a sustained move above 1.0600.

    EUR/USD is recovering ground above 1.0500, eyeing a sustained move above 1.0550 in the European session this Monday. The latest uptick in the currency pair could be associated with a minor pullback in the US Dollar across the curve, as the US Treasury bond yields extend to the downside.  

    Markets remain unnerved amid surging COVID cases in China, assuming that the resurgence could disrupt consumption and manufacturing in the world’s second-largest economy.

    Further, risk appetite was curbed by uncertainty ahead of the major central banks’ monetary policy decisions this week. The US Consumer Price Index (CPI), the Federal Reserve and the European Central Bank (ECB) interest rates decisions will be closely followed in the week ahead.

    Safe-haven flows into the US government bonds weigh negatively on the Treasury yields across the curve, eventually dragging the US Dollar Index back below the 105.00 level.

    EUR/USD: Technical outlook

    EUR/USD has been traversing within a rising channel formation since November 11, with bulls now looking to challenge the upper boundary of the channel, at 1.0635.

    The 14-day Relative Strength Index (RSI) stays flat above the 50.00 level, suggesting that there is more room for the upside.

    Adding credence to the upward potential, the bullish crossover of the 21 and 200-Daily Moving Averages (DMA), confirmed last week, remains in play.

    Euro buyers could take out the 1.0600 barrier before attempting a break above the aforesaid technical resistance.

    On the other side, bulls will guard the December 7 low at 1.0443 before the mildly bullish 21 DMA at 1.0417 gets tested.

    EUR/USD: Daily chart

  • 08:41

    Accumulation of bad news from the UK justifies a weak Sterling – Commerzbank

    GBP/USD has dropped below 1.2250. Economists at Commerzbank note that the dire overall situation the UK is currently in justifies a weak Sterling.

    Why the state of Great Britain is GBP negative

    “Whereas the most urgent real economic factors putting pressure on the economy seem transitional on the Continent (the threat of a gas crisis and the resulting high energy prices) the urgent British woes seem to be more permanent. It is therefore not implausible to assume a long-term growth disadvantage for the British economy as compared with Europe.”

    “As long-term growth is relevant for real exchange rates the prospect of that plays a role for today’s exchange rates. And that is why this accumulation of bad news from the island constitutes a sufficient justification for Sterling to be weak.”


  • 08:37

    UK’s Hunt: Economy is likely to get worse before it gets better

     UK Finance Minster Jeremy Hunt said in a BBC News interview on Monday, the economy is “likely to get worse before it gets better.”

     “i don't know whether inflation has peaked or not,” Hunt said.

    Also read: UK GDP rebounds 0.5% MoM in October vs. -0.1% expected

    Market reaction

    The Pound Sterling is picking up bids on the above comments, as GBP/USD tests 1.2250 once again, still down 0.05% on the day.

  • 08:27

    Senior US officials visit China, hold talks with Vice Foreign Minister

    According to a Chinese Foreign Ministry spokesman Wang Wenbin, cited by Reuters, US Assistant Secretary of State for East Asian Affairs Daniel J. Kritenbrink and Senior Director for China Affairs of the White House National Security Council, Laura Rosenberger, and China’s Vice foreign minister Xie Feng held a meeting on Sunday and Monday.

     Wang said, they had an "extensive exchange" of views on international and regional issues of common concern.”

    "The talks were frank, in-depth and constructive," Wang added.

    Further, China's Foreign Ministry responded to the US sanctioning two top Chinese officials for what they called significant human rights violations in Tibet.

    “These illegal sanctions severely affected Sino-American relations,” Wang said.

  • 08:19

    EUR/USD to struggle to hold any gains over 1.06 this week – ING

    EUR/USD continues to fluctuate above 1.0500. In the opinion of economists at ING, the pair will struggle to hold any gains over 1.06 this week.

    Slight risk of the ECB doing 75 bps rather than 50 bps

    “We note there is still a slight risk of the ECB doing 75 bps rather than 50 bps – which would probably help the Euro. But this of course comes after the US CPI/FOMC risk.”

    “Given the 10% EUR/USD correction off the late September lows, our preference would be that EUR/USD struggles to hold any gains over 1.06 this week and could end the week lower should US events oblige.”


  • 07:58

    NZD/USD: Volatility beckons in a usually positive month for the Kiwi – ANZ

    The Kiwi ended the week back above 0.64, and while it didn’t reclaim Monday’s highs, it’s still the best-performing G10 currency month to date. Economists at ANZ Bank expect volatility this week.

    NZD seasonality is usually positive in December

    “NZD seasonality is usually positive in December, but while it has that and higher interest rates in its corner, there are no guarantees that it will finish this week un-bruised, with several central bank meetings due.”

    “Volatility beckons ahead of the Fed meeting, which is expected to be hawkish, with a 50 bps hike and a much higher terminal rate (2023) ‘dot plot’. Our chief concern is what this might do to the USD, which has come under pressure as the trendy ‘pivot’ narrative has taken hold, despite clear signs of sticky US inflation.”

    “NZ factors will also play a role, with the HYEFU and GDP due this week, but they’re likely to play second fiddle to volatility and the global vibe (again!).”


  • 07:33

    Fossil fuel and renewable energy prices to remain high for a long time – Natixis

    Many had hoped that the transition from fossil fuels to renewable energies would only gradually drive up energy prices. In the view of strategists at Natixis, it is likely that both fossil fuel prices and renewable energy prices will remain high.

    Very high energy prices

    “It is now becoming clear that both fossil fuel and renewable energy prices probably will be high, because: Investment in fossil fuels has fallen markedly, and there will be a shortfall in fossil fuel supply; Investment in renewable energies is insufficient.”

    “Unfortunately, the prices of both types of energy are likely to remain high for a long time.” 


  • 07:16

    Forex Today: Markets turn cautious to start the big central bank week

    Here is what you need to know on Monday, December 12:

    Markets seem to have turned cautious at the beginning of the week with participants staying on the sidelines ahead of this week's eagerly-awaited central bank policy announcements and high-tier macroeconomic data releases. The US Dollar Index holds steady above 105.00 following last week's choppy action, US stock index futures trade flat in the European morning and the 10-year US Treasury bond yield stays calm above 3.5%. The European nor the US economic docket will not be featuring any data releases on Monday. There will be auctions for 10-year and 3-year US Treasury Notes later in the day.

    Chinese officials announced earlier in the day that they will take the application used to track coronavirus cases offline later in the week. Additionally, Bloomberg reported that China may partially open borders with Hong Kong from next month, allowing people to travel freely heading into the Lunar New Year holidays. Nevertheless, the Shanghai Composite Index and Hong Kong's Hang Seng Index both remain on track to end the day in negative territory.

    EUR/USD stays on the back foot early Monday but continues to fluctuate above 1.0500. The pair failed to make a decisive move in either direction last week and closed virtually unchanged.

    GBP/USD edged lower during the European trading hours and dropped below 1.2250. The data published by the UK's Office for National Statistics (ONS) revealed on Monday that the Gross Domestic Product expanded by 0.5% on a monthly basis in October following September's 0.6% contraction. Although this reading came in much better than the market expectation of 0.1%, it failed to provide a boost to Pound Sterling. Other data from the UK showed Industrial Production remain unchanged in October while Manufacturing Production rose by 0.7%.

    USD/JPY climbed above 137.00 earlier in the day but struggled to preserve its bullish momentum. The data from Japan showed on Monday that Machine Tool Orders contracted by 7.8% on a yearly basis in November and the annual Producer Price Index arrived at 9.3% in November, surpassing the market expectation of 8.9%. 

    Gold price advanced beyond $1,800 late Friday but started the new week under modest bearish pressure. XAU/USD was last seen trading in negative territory slightly below $1,790.

    Bitcoin spent the weekend in a very narrow range and started to inch lower early Monday. BTC/USD was last seen trading slightly below $17,000. Ethereum fluctuates in the lower half of its two-week-old range at around $1,250.

  • 07:16

    UK Manufacturing Production jumps 0.7% MoM in October vs. -0.1% expected

    The industrial sector seems to extend its recovery momentum in October, the latest UK industrial and manufacturing production data published by Office for National Statistics (ONS) showed on Monday.

    Manufacturing output arrived at 0.7% MoM in October versus -0.1% expectations and 0% registered in September while total industrial output came in at 0% vs. -0.3% expected and 0.2% last.

    On an annualized basis, the UK manufacturing production figures came in at -4.6% in October, missing expectations of -6.3%. Total industrial output dropped by 2.4% in the tenth month of the year against a -4.2% score expected and the previous -3.1% print. 

    Separately, the UK goods trade balance numbers were published, which arrived at GBP-14.476 billion in October versus GBP-20.894 billion expectations and GBP-15.656 billion last. The total trade balance (non-EU) came in at GBP-4.823 billion in October versus GBP-8.551 billion previous.

    Related reads

    • UK GDP rebounds 0.5% MoM in October vs. -0.1% expected
    • GBP/USD probes bears above 1.2200 on UK data dump, BOE, Fed eyed
  • 07:10

    GBP/USD probes bears above 1.2200 on UK data dump, BOE, Fed eyed

    • GBP/USD bounces off intraday bottom on mostly upbeat British data.
    • UK data came in mostly firmer-than-expected and challenges the previous fears surrounding the British economy.
    • US Dollar cheers risk-off mood ahead of the key US inflation, Fed meeting.
    • Light calendar elsewhere restricts the pair’s immediate moves even as bears struggle to retake control.

    GBP/USD picks up bids to rebound from the intraday low of 1.2207 after the UK data flashed upbeat statistics during early Monday. In doing so, the Cable pair challenges the previous pessimism surrounding the British economy and likely challenges for the Bank of England (BOE). However, broad-based US Dollar strength, amid recession woes and the pre-Fed anxiety, challenges the Cable pair buyers.

    That said, the UK’s Gross Domestic Product (GDP) for October rose to 0.5% MoM versus -0.1% expected and -0.6% prior while the Manufacturing Production growth rallied by 0.7% compared to -0.1% market consensus and 0.0% previous readouts. Further, the Industrial Production also marked a positive surprise compared to -0.3% expected as it came in at 0.0% MoM for October versus 0.2% prior.

    Also read: UK GDP rebounds 0.5% MoM in October vs. -0.1% expected

    Despite the firmer UK data, the looming recession over the British economy joins the hawkish hopes from the Federal Reserve (Fed) to keep the GBP/USD rebound in check. Earlier in the day, Reuters quoted statements from a British trade body Make UK while saying, “UK manufacturers foresee output falling by 3.2% in 2023.” On the same line is the news stating that the UK lenders see 23% slide in mortgages for home-buyers in 2023.

    It should be noted that the US Dollar Index (DXY) prints 0.20% intraday gains of around 105.20 by the press time. In doing so, the greenback’s gauge versus the six major currencies rises for the second consecutive day.

    The DXY defied a two-day downtrend on Friday after upbeat figures from the US Producer Price Index (PPI) and the University of Michigan’s (UoM) Consumer Sentiment Index for November and December respectively. Also likely to have favored the greenback bulls could be the recently firmer inflation expectations that underpin the hawkish bets on the Federal Reserve’s (Fed) next move. Additionally, fears of global recession and the traditional safe-haven status also underpin the US Dollar’s run-up of late.

    Against this backdrop, the US stock futures print mild losses while the Treasury yields grind higher, which in turn keeps the GBP/USD bears hopeful.

    Having witnessed the initial reaction to the UK data, the GBP/USD pair traders will pay attention to Tuesday’s British employment data and the US Consumer Price Index (CPI) for more clarification of the trend before monetary policy meetings of the Fed and the BOE. It’s worth noting, however, that the comparatively more hawkish concerns surrounding the US Federal Reserve than the Bank of England (BOE) join the economic fears concerning the UK to keep GBP/USD bears hopeful.

    Technical analysis

    A one-month-old rising wedge bearish chart pattern, currently between 1.2205 and 1.2485, teases the GBP/USD bears.


  • 07:06

    United Kingdom Index of Services (3M/3M) meets forecasts (-0.1%) in October

  • 07:04

    United Kingdom Total Trade Balance down to £-14.47B in October from previous £-3.135B

  • 07:03

    United Kingdom Manufacturing Production (YoY) above expectations (-6.3%) in October: Actual (-4.6%)

  • 07:02

    Turkey Current Account Balance came in at $-0.359B, above expectations ($-1.616B) in October

  • 07:02

    United Kingdom Manufacturing Production (MoM) above expectations (-0.1%) in October: Actual (0.7%)

  • 07:02

    United Kingdom Goods Trade Balance registered at £-14.476B above expectations (£-20.894B) in October

  • 07:01

    United Kingdom Trade Balance; non-EU came in at £-4.823B, above expectations (£-11.309B) in October

  • 07:01

    Turkey Unemployment Rate up to 10.2% in October from previous 10.1%

  • 07:01

    United Kingdom Industrial Production (MoM) above forecasts (-0.3%) in October: Actual (0%)

  • 07:01

    UK GDP rebounds 0.5% MoM in October vs. -0.1% expected

    • UK GDP arrived at -% MoM in October vs. -0.1% expected.
    • GBP/USD keeps its range below 1.2250 on UK GDP upside surprise.

    The UK Gross Domestic Product (GDP) monthly release showed on Monday that the economy returned to an expansion in October, arriving at 0.5% vs. -0.1% expectations and -0.6% previous.

    Meanwhile, the Index of services (October) came in at -0.1% 3M/3M vs. -0.1% estimate and 0% prior.

    The UK October 2022 GDP came in above the pre-COVID-19 level of 0.4% in Feb 2020.

    Market reaction

    The Cable remains little changed at around 1.2225 on the upbeat UK growth numbers. The spot is down 0.18% on the day.

    About UK GDP

    The Gross Domestic Product released by the National Statistics is a measure of the total value of all goods and services produced by the UK. The GDP is considered as a broad measure of the UK economic activity. Generally speaking, a rising trend has a positive effect on the GBP, while a falling trend is seen as negative (or bearish).

  • 07:01

    Denmark Inflation (HICP) (YoY) dipped from previous 11.4% to 9.7% in November

  • 07:00

    United Kingdom Gross Domestic Product (MoM) above expectations (-0.1%) in October: Actual (0.5%)

  • 07:00

    Gold Price Forecast: XAU/USD could resume the upside above the $1,800 mark

    Gold price is dropping for the first time in five trading days on Monday. Here you can find XAU/USD’s technical analysis by FXstreet’s Dhwani Mehta.

    Gold sets off the week on a wrong footing

    “Gold is below the 200-Daily Moving Average (DMA) at $1,791, with bears eyeing Thursday’s low at $1,781 as the next downside target. Further south, the moderately bullish 21DMA support at $1,768 could come into play.”  

    “On the upside, the immediate resistance is seen at the 200DMA, above which buyers will yearn for a sustained move beyond the $1,800 threshold. Gold price will then see fresh buying opportunities for a test of Friday’s high at $1,806.”


  • 06:51

    USD/JPY eyes establishment above 137.00 as anxiety soars ahead of Federal Reserve policy

    • USD/JPY is aiming to shift its auction profile above 137.00 as the risk-off mood is strengthening further.
    • Mixed views on the Federal Reserve policy outlook have escalated anxiety among the market participants.
    • The Bank of Japan is aggressively working to achieve a 2% inflation rate.
    • USD/JPY is expected to accelerate gains amid technical tailwinds.

    USD/JPY is hovering around the critical hurdle of 137.00 in the early European session. The asset is aiming to shift its business profile above the aforementioned critical hurdle as investors are getting anxious ahead of the announcement of the interest rate decision by the Federal Reserve (Fed). Volatility will stay a little longer this time as it is the last monetary policy of CY2022, which is expected to remain uncertain due to rising expectations of a slowdown in the pace of the interest rate hike. Also, Federal Reserve chair Jerome Powell is expected to provide interest rate guidance for the whole CY2023.

    S&P500 is displaying a subdued performance as investors await more development on Federal Reserve’s policy outlook through commentary from Federal Reserve policymakers. The 10-year US Treasury yields have surrendered gains and are auctioning below 3.57%, at the time of writing.

    The US Dollar Index (DXY) is displaying back-and-forth moves around the immediate resistance of 105.20. The US Dollar is facing hurdles in overstepping the 105.20 resistance despite a solid risk aversion theme in the global market.

    Mixed views on Federal Reserve policy outlook muddle investors’ sentiment

    After the release of the Federal Open Market Committee (FOMC) minutes for October’s monetary policy, it was clear that Federal Reserve policymakers are advocating a deceleration in the interest rate hike pace. Federal Reserve chair Jerome Powell and his teammates were in favor of reducing financial risks and assessing the impact of efforts made by the Federal Reserve in achieving price stability.

    Now, the release of upbeat payroll data for November and fresh demand in the United States service sector has triggered the option of a bigger rate hike continuation to safeguard the economy from a rebound in inflation. There is no denying the fact that higher employment generation and solid demand in service sector have the potential to spur the inflation rate again.

    Rabobank analysts said they expect the United States central bank to hike the policy rate by 50 basis points (bps) and see policymakers revising the terminal rate projection to the neighborhood of 5%.

    United States Inflation to set a stage for Federal Reserve’s policy

    Before the announcement of the last monetary policy of CY2022 by the Federal Reserve on Wednesday, investors are awaiting the release of Tuesday’s Consumer Price Index (CPI) data. As per the consensus, the headline inflation is expected to remain unchanged at 7.7% while core CPI that excludes oil and gas prices will inch higher to 6.4% from the former release of 6.3%.

    The United States Producer Price Index (PPI) data released on Friday is indicating the continuation of a slowdown in the inflation rate. The price Index for factory-gate rates was trimmed to 7.4% in line with expectations. A decline in prices for final products indicates a decline in demand, which forced producers to go easy on decision-making for end-products prices.

    However, investors should brace a surprise jump in inflation as the United States economy added 263K jobs in November more than the expectations of 200K. Tight labor demand is accompanied by premium earnings that could result in solid demand for durable goods by households.

    Bank of Japan to continue policy easing despite rising wages

    The risk of a decline in inflation has been triggered after a contraction in Japan’s Gross Domestic Product (GDP) numbers. A subdued demand never propels a hike in the price rise index. Bank of Japan (BOJ) Haruhiko Kuroda is of the view that even if wages rise by 3%, the BOJ will maintain its current easy policy until inflation reaches 2%. This would weigh more pressure on the Japanese yen.

    Meanwhile, Bank of Japan (BOJ) board member Hajime Takata said in an interview with the Nikkei newspaper published on Saturday that Japan's economy is not yet in a phase where the central bank can end yield curve control. He further added that there were some positive signs in corporate capital expenditure and wages, as reported by Reuters.

    USD/JPY technical outlook

    USP/JPY has accelerated to near the downward-sloping trendline plotted from November 22 high around 142.24. The asset is at a make or a break after a firmer rally. A bull cross, represented by the 20-and 50-period Exponential Moving Averages (EMAs) at 136.5, indicates more upside. Meanwhile, the Relative Strength Index (RSI) (14) has moved into the bullish range of 60.00-80.00. Sustainability above the same will keep the reins in the asset solid.


  • 06:37

    Gold Price Forecast: XAU/USD eases below $1,800 on sluggish markets ahead of Fed’s verdict

    • Gold price stays pressured around intraday low as it snaps four-day uptrend.
    • Cautious mood ahead of the key data/events favor US Dollar buyers amid an easy start to the key week.
    • XAU/USD bears need validation from the US CPI, Fed hawks.

    Gold price (XAU/USD) remains depressed around $1,785 as it pushes back the bulls after a four-day winning streak during early Monday in Europe. The yellow metal’s latest losses, despite being mild, could be linked to the US Dollar’s recovery. However, a lack of major data/events on Monday challenges the bullion sellers.

    That said, the US Dollar Index (DXY) prints 0.20% intraday gains around 105.20 by the press time. In doing so, the greenback’s gauge versus the six major currencies rises for the second consecutive day.

    The DXY defied a two-day downtrend on Friday after upbeat figures from the US Producer Price Index (PPI) and the University of Michigan’s (UoM) Consumer Sentiment Index for November and December respectively. Also likely to have favored the greenback bulls could be the recently firmer inflation expectations that underpin the hawkish bets on the Federal Reserve’s (Fed) next move. Additionally, fears of global recession and the traditional safe-haven status also underpin the US Dollar’s run-up of late.

    It should be noted that the recent economic optimism surrounding China, one of the biggest consumers of Gold, joins the doubts over the Fed’s further hawkish bias to challenge the XAU/USD bears.

    Recently, CNBC quotes the Mastercard official as it said, “Inflation has already peaked, but it will remain above pre-Covid levels in 2023, said David Mann, chief economist for Asia-Pacific, Middle East and Africa at the Mastercard Economics Institute.”

    The rising inflation fears favor a hawkish bias from the Fed and keep the Gold bears hopeful ahead of Tuesday’s US Consumer Price Index (CPI) and Wednesday’s Federal Open Market Committee (FOMC) meeting.

    Gold price technical analysis

    Gold’s pullback from a seven-day-old horizontal resistance area surrounding $1,805 joins downward-sloping RSI (14) line, not oversold, to favor XAU/USD bears.

    That said, the sellers presently aim for the $1,783-84 support confluence including the 100-Hour Moving Average (HMA), 200-HMA and an ascending trend line from November 28.

    However, any further downside needs validation from $1,766 before directing the Gold bears toward the late November swing low surrounding $1,721.

    Meanwhile, an upside clearance of the stated horizontal resistance zone near $1,805 should stay beyond the monthly high of $1,810 to keep the Gold buyers on the table.

    Following that, a run-up towards the tops marked in June around $1,857 and the $1880 can’t be ruled out.

    Gold price: Hourly chart

    Trend: Further downside expected


  • 06:05

    Japan Machine Tool Orders (YoY): -7.8% (November) vs previous -5.4%

  • 06:01

    AUD/USD Price Analysis: Fades bounce off 200-HMA to snap three-day uptrend

    • AUD/USD remains depressed around intraday low during the first loss-making day in four.
    • Bearish MACD signals, failure to cross weekly resistance line keep sellers hopeful.
    • Buyers need validation from monthly high to retake control.

    AUD/USD retreats to 0.6775 as it defies the three-day winning streak heading into Monday’s European session. In doing so, the Aussie pair retreats toward the 200-Hour Moving Average (HMA) amid the bearish MACD signals.

    It’s worth noting that the quote’s failure to cross a one-week-old ascending trend line also contributes to the bearish bias.

    That said, the AUD/USD weakness past the 200-HMA level of 0.6755 will aim for the 50% Fibonacci retracement level of the pair’s November 29 to December 05 upside, near .6745.

    However, a two-week-old horizontal support area surrounding 0.6670 appears a tough nut to crack for the AUD/USD bears.

    In a case where AUD/USD remains bearish past 0.6670, a downward trajectory towards the late November swing low near 0.6585 can’t be ruled out.

    Meanwhile, recovery moves may initially confront the 23.6% Fibonacci retracement level round the 0.6800 round figure before challenging an upward-sloping resistance line near 0.6825.

    Even if the AUD/USD bulls manage to cross the 0.6825 hurdle, the monthly high of 0.6850 will act as an extra upside filter to challenge the pair’s further advances.

    Overall, AUD/USD is likely to witness a short-term pullback but the bulls remain hopeful unless witnessing a clear downside break of 0.6670.

    AUD/USD: Hourly chart

    Trend: Further downside expected


  • 05:46

    Asian Stock Market: Turns cautious ahead of Western monetary policy week, oil defends $70.00

    • Asian indices are facing immense pressure following the footprints of the S&P500.
    • Global volatility is escalating on expectations of fresh rate hikes by Western central banks.
    • Oil prices have rebounded on the fresh supply crisis in the United States.

    Markets in the Asian domain have turned risk averse as investors are experiencing sheer anxiety ahead of the interest rate decision from various central banks. Indices are following the footprints of the S&P500 and are likely to remain on tenterhooks as the fresh rate hike cycle will escalate recession fears. The US Dollar index (DXY) is aiming to overstep the day’s high around 105.20 amid an upbeat market mood. Meanwhile, the US Treasury yields have surrendered their gains and have shifted into a negative trajectory.

    At the press time, Japan’s Nikkei225 eased 0.20%, ChinaA50 plunged 1.23%, Hang Seng plummeted 1.93% while Nifty50 added 0.07%.

    This week, the Federal Reserve (Fed), European Central Bank (ECB), Bank of England (BOE), and the Swiss National Bank (SNB) will announce their last monetary policies of CY2022.  All western central banks are expected to hike their interest rates, which will accelerate the risk of recession in the global economy. Also, their guidance on interest rates will be keenly watched.

    Meanwhile, Chinese equities are facing immense pressure as Covid restrictions easing-inspired optimism is fading away. No doubt, the institutional investors are hiking their guidance for economic projections but the impact of recent carnage will stay for a while.

    On the oil front, oil prices have rebounded after dropping to near the critical support of $70.00. The oil price has managed to defend the critical support and has resurfaced firmly as a key pipeline supplying the United States remained shut while Russian President Vladimir Putin threatened to cut production in retaliation for a Western price cap on its exports, reported Reuters.


  • 05:35

    When are the UK data releases and how could they affect GBP/USD?

    The UK Economic Data Overview

    The British economic calendar is all set to entertain the cable traders during the early hours of Monday, at 07:00 GMT with the monthly release of October 2022 Gross Domestic Product (GDP) figures. Also increasing the importance of that time are Trade Balance and Industrial Production details for the stated period. It’s worth noting that the Bank of England’s (BOE) monetary policy meeting on Thursday amplifies the importance of today’s UK data dump for the GBP/USD pair traders.

    Having witnessed a contraction of 0.6% in economic activities during September 2022, market players will be interested in October month’s GDP figures to confirm the fears of an economic slowdown.

    Forecasts suggest that the UK GDP will mark stagnation of the British economy with 0.1% MoM figures for October. GBP/USD traders also await the Index of Services (3M/3M) for the same period, likely to deteriorate to -0.1% versus 0.0% prior, for further insight.

    Meanwhile, Manufacturing Production, which makes up around 80% of total industrial production, is expected to ease to -0.1% MoM in October. Also, the total Industrial Production may shrink by 0.3% versus 0.2% previous expansion.

    Considering the yearly figures, the Industrial Production for October is expected to have dropped to -4.2% versus -3.1% previous while the Manufacturing Production is anticipated to have dropped by -6.3% in the reported month versus -5.8% the last.

    Separately, the UK Goods Trade Balance for October will be reported at the same time and is expected to deteriorate to £-11.309B versus the prior readings of £-8.551B.

    How could affect GBP/USD?

    GBP/USD snaps a three-day uptrend as it holds lower ground near 1.2230 heading into Monday’s London open. The Cable pair’s latest losses could be linked to the US Dollar’s broad-based recovery ahead of the key US inflation data, as well as the Federal Reserve (Fed) monetary policy meeting. Also weighing on the quote could be the recession woes.

    It should be observed that the latest headlines suggesting the British manufacturers’ expectations of witnessing 3.2% fall in output during 2023 also exert downside pressure on the GBP/USD price. On the same line are news shared by Reuters suggesting that the UK lenders see 23% slide in mortgages for home-buyers in 2023.

    That said, a positive surprise from the scheduled British statistics may, however, could offer only a kneejerk bounce amid broad pessimism surrounding the UK’s economic growth and likely a lesser hawkish outlook over the BOE than the Fed.

    Technically, a one-month-old rising wedge bearish chart pattern, currently between 1.2205 and 1.2485, teases the GBP/USD bears.

    Key notes

    GBP/USD Weekly Forecast: Pound Sterling looks north, gearing up for a critical week

    About the UK Economic Data

    The Gross Domestic Product released by the Office for National Statistics (ONS) is a measure of the total value of all goods and services produced by the UK. The GDP is considered a broad measure of the UK's economic activity. Generally speaking, a rising trend has a positive effect on the GBP, while a falling trend is seen as negative (or bearish).

    The Manufacturing Production released by the Office for National Statistics (ONS) measures the manufacturing output. Manufacturing Production is significant as a short-term indicator of the strength of UK manufacturing activity that dominates a large part of total GDP. A high reading is seen as positive (or bullish) for the GBP, while a low reading is seen as negative (or bearish).

    The trade balance released by the Office for National Statistics (ONS) is a balance between exports and imports of goods. A positive value shows a trade surplus, while a negative value shows a trade deficit. It is an event that generates some volatility for the GBP.

  • 05:17

    USD/CHF Price Analysis: 50-HMA probes bulls inside falling wedge

    • USD/CHF buyers struggle inside a bullish chart formation.
    • Upbeat MACD signals suggest further advances, 200-HMA acts as an additional upside filter.
    • Bears have a bumpy road to travel unless breaking 0.9300 support.

    USD/CHF prints mild gains around 0.9360 even as the 50-Hour Moving Average (HMA) challenges the buyers during early Monday in Europe. In doing so, the Swiss Franc (CHF) pair justifies bullish MACD signals while staying inside a short-term falling wedge bullish chart pattern.

    That said, the quote’s latest weakness becomes less troublesome beyond the stated wedge’s support line, around 0.9310 at the latest.

    Even if the quote defies the bullish chart formation, by breaking the 0.9310 support, the 0.9300 round figure could act as an extra filter to the south before pleasing the USD/CHF bears.

    In that case, lows marked during April and March around 0.9195 and 0.9150 respectively, will gain the major attention of the pair sellers.

    Meanwhile, recovery moves need validation from the 50-HMA hurdle of 0.9365, a break of which could poke the stated wedge’s upper line, close to 0.9395 at the latest.

    It should be noted that the USD/CHF run-up beyond 0.9395 should provide a clear break of the 200-HMA, around 0.9405 by the press time, to boost the buyer’s morale.

    Following that, a rally towards the late November swing high around the 0.9600 threshold can’t be ruled out.

    USD/CHF: Hourly chart

    Trend: Further upside expected


  • 04:55

    USD/CAD pares intraday gains around mid-1.3600s as Oil price rebounds, BOC’s Macklem eyed

    • USD/CAD retreats from intraday high, struggles to defend buyers.
    • WTI bounces off yearly low, snaps six-day downtrend, amid fears of supply crunch.
    • Sour sentiment, anxiety ahead of the key data/events underpin US Dollar.
    • Speech from BOC Governor Maclem can entertain traders ahead of bumper catalysts.

    USD/CAD consolidates daily gains around 1.3650 heading into Monday’s European session as the Loonie pair traders turn cautious ahead of a speech from Bank of Canada (BOC) Governor Tiff Macklem. Also challenging the pair buyers could be the recently firmer prices of Canada’s key export item, WTI crude oil.

    It’s worth noting, however, that the hawkish Fed bets and recession woes keep the US Dollar firmer as traders await Tuesday’s US Consumer Price Index (CPI) and Wednesday’s Federal Open Market Committee (FOMC) meeting.

    WTI crude oil prints mild gains around $71.80 as it bounces off the yearly low while snapping a six-day downtrend. In doing so, the black gold portrays the supply crunch fears as Russian President Vladimir Putin rejects supplying oil to those countries who accept the European Union (EU)-led oil price caps. Also likely to challenge the oil flow could be the shutdown of the key pipeline supply energy benchmark to the US, namely the Keystone pipeline. On Sunday, Canada's TC Energy said it has not yet determined the cause of the Keystone oil pipeline leak last week in the United States, while also not giving a timeline as to when the pipeline will resume operations, reported Reuters.

    On the other hand, the US Dollar Index (DXY) extends Friday’s gains amid recession woes, recently highlighted by US Treasury Secretary Janet Yellen.

    On Friday, the US Producer Price Index (PPI) matched the market forecasts of 7.4% YoY for November versus 8.1% prior. Further, the Core PPI rose to 6.2% YoY versus 6.0% expected and 6.7% previous readings. Additionally, preliminary readings of the University of Michigan’s (UoM) Consumer Sentiment Index rose to 59.1 for December versus 53.3 market forecasts and 56.8 final readings for November. Moreover, the 1-year inflation expectations dropped to 4.6%, the lowest since September 2021 while compared to 4.9% expected whereas 5-10 year expectations were stable at 3.0%. It should be noted that the US ISM Services PMI improved to 56.5 versus 54.4 expected.

    While portraying the mood, the markets witness a sluggish start to the key week with mildly offered S&P 500 Futures and inactive Treasury yields.

    To sum up, mixed sentiment and anxiety prior to the crucial data/events can keep the USD/CAD on the front foot even if the latest rebound in oil prices probes the upside moves. It should be noted that the absence of hawkish remarks from BOC’s Macklem could help the Loonie pair to remain firmer as the Canadian central bank has recently ruled out odds of aggressive rate hikes.

    Technical analysis

    A daily closing beyond the seven-week-old descending resistance line, around 1.3655, becomes necessary for the USD/CAD bulls to keep the reins. However, the pair bears are off the table unless witnessing a clear downside break of the previous resistance line from October 13, close to 1.3510 at the latest.


  • 04:36

    NZD/USD Price Analysis: Rally towards 0.6500 looks imminent

    • The Kiwi Dollar has rebounded despite pre-Fed policy anxiety.
    • A bull cross, represented by the 20-and 200-period EMAs at 0.6214, indicates more upside ahead.
    • The RSI (14) is oscillating in the bullish range, which indicates that the upside momentum is active.

    The NZD/USD pair is an inch far from the round-level resistance of 0.6400, at the time of writing, after resurfacing from around 0.6380 in the early Asian session. The Kiwi asset has attempted a firmer recovery despite the risk-off market mood ahead of Federal Reserve (Fed) monetary policy meeting on Wednesday.

    Meanwhile, the US Dollar Index (DXY) is displaying signs of exhaustion after failing to surpass the immediate hurdle of 105.20. The 10-year US Treasury yields have turned negative in intraday trade and have slipped below 3.56%.

    NZD/USD is initially aiming to conquer the current resistance plotted from August 12 high at 0.6470. After surpassing the current resistance at 0.6470, the Kiwi asset will face fresh barricades at June 3 high of around 0.6576. A bull cross, represented by the 20-and 200-period Exponential Moving Averages (EMAs) at 0.6214, indicates more upside ahead.

    The Relative Strength Index (RSI) (14) is oscillating in the bullish range of 60.00-80.00, which indicates a continuation of the upside ahead.

    For further upside, the Kiwi asset needs to surpass August 12 high at 0.6470, which will drive the pair toward the psychological resistance at 0.6500, followed by June 3 high around 0.6576.

    Alternatively, a breakdown below December 5 low around 0.6300 will drag the kiwi pair towards December 1 low at 0.6233. A slippage below the latter will drag the major toward the round-level support at 0.6200.

    NZD/USD daily chart


  • 04:29

    EUR/USD bears attack 1.0510 support as recession woes propel US Dollar ahead of Fed vs. ECB play

    • EUR/USD holds lower ground after welcoming bears on Friday.
    • Economic slowdown fears, EU-Russia tensions join hawkish Fed bets to fuel US Dollar.
    • Light calendar, cautious mood ahead of FOMC, ECB meetings restrict trading moves.

    EUR/USD grinds lower towards 1.0500, printing mild losses to extend Friday’s downward trajectory, as traders await this week’s bumper events during early Monday. Among them, the US Consumer Price Index (CPI) for November and monetary policy meetings of the US Federal Reserve, as well as the European Central Bank (ECB) gain major attention.

    In addition to the pre-event anxiety, fears of economic slowdown in the bloc, as well as abroad, also weigh on the EUR/USD prices, due to the US Dollar’s safe-haven demand.

    Late Sunday, US Treasury Secretary Janet Yellen said, “There's a risk of a recession, but it certainly isn't something that is necessary to bring inflation down.” Further, the economic slowdown fears could be linked to the yield curve inversion as the US 10-year Treasury bond yields and the two-year bond coupons portray a negative difference.

    On the same line, the European Central Bank (ECB) Governing Council member and French central bank governor Francois Villeroy de Galhau warned on Friday, “a temporary recession cannot be excluded.” It’s worth noting that the bloc’s tussle with Russia and the recent oil price cap on Moscow’s energy exports increase the odds of witnessing an economic slowdown in the region. Adding to the pessimism are the latest readings of the November month activity numbers for the Eurozone, which were downwardly revised in the last week.

    It should be noted that the ECB policymakers appeared less hawkish than their Fed counterparts and hence the market bets on the 0.50% Fed rate hike have been on the rise of late. Alternatively, a Reuters poll mentioned that the ECB will take its deposit rate up by 50 basis points next week to 2.00%, despite the eurozone economy almost certainly being in recession, as it battles inflation running at five times its target.

    Amid these plays, the markets witness a sluggish start to the key week with mildly offered S&P 500 Futures and inactive Treasury yields.

    Moving on, Tuesday’s US Consumer Price Index (CPI) and Wednesday’s Federal Open Market Committee (FOMC) meeting will be crucial for the EUR/USD pair traders ahead of Thursday’s ECB monetary policy announcements. Overall, the pair bulls are likely running out of steam ahead of the key data/events.

    Technical analysis

    A five-week-old ascending trend line, around 1.0510 by the press time, restricts the immediate downside of the EUR/USD pair, a break of which could quickly drag the quote towards another support line stretched from November 10, close to 1.0480. Overall, the trend remains bullish unless the quote stays beyond the 200-SMA level surrounding 1.0250.


  • 04:21

    UK manufacturers foresee output falling by 3.2% in 2023

    Make UK, a trade body, said in its report published on Monday that British manufacturing firms expect their output to fall by 3.2% in 2023 after declining by 4.4% this year.

    Key takeaways

    "There is simply no sugar-coating the outlook for next year and possibly beyond." 

    "These are remarkably challenging times which are testing even the best and most successful of companies to the limit."

    "The bigger issue is that the UK risks sleepwalking into an acceptance that little or no growth is the norm. The government needs to work with industry as a matter of urgency to deliver a long-term industrial strategy.”

    “Make UK forecasts the broader economy will shrink 0.9% next year, less than the 1.4% decline forecast by the government's Office for Budget Responsibility last month.”

    Market reaction

    GBP/USD is off the lows, paying little heed to the above headlines. The pair is losing 0.18% on the day at 1.2230, at the press time.

  • 03:58

    USD/INR Price News: Rupee slides to 82.70 ahead of India/US inflation, Fed meeting

    • USD/INR prints three-day losing streak as it takes the bids to refresh intraday high.
    • Precursors for US inflation suggest hawkish rate hike announcements from the Federal Reserve.
    • India inflation, Industrial/Manufacturing Production keeps traders on the edge, recovery in oil prices also fuels USD/INR prices.

    USD/INR stays firmer for the third consecutive day, up 0.20% intraday near 82.70, as traders await India inflation and industrial output figures during early Monday. In doing so, the Indian Rupee (INR) pair takes clues from the recent recovery in oil prices, as well as the firmer US Dollar amid the risk aversion.

    Fears of recession join the market’s cautious mood ahead of the key data/events to underpin the US Dollar’s haven demand. That said, US Treasury Secretary Janet Yellen said, “There's a risk of a recession, but it certainly isn't something that is necessary to bring inflation down.” Further, the economic slowdown fears could be linked to the yield curve inversion as the US 10-year Treasury bond yields and the two-year bond coupons portray a negative difference.

    Also favoring the US Dollar could be the recently firmer data. Among them, the Producer Price Index (PPI) matched the market forecasts of 7.4% YoY for November versus 8.1% prior. Further, the Core PPI rose to 6.2% YoY versus 6.0% expected and 6.7% previous readings. Additionally, preliminary readings of the University of Michigan’s (UoM) Consumer Sentiment Index rose to 59.1 for December versus 53.3 market forecasts and 56.8 final readings for November. Moreover, the 1-year inflation expectations dropped to 4.6%, the lowest since September 2021 while compared to 4.9% expected whereas 5-10 year expectations were stable at 3.0%. It should be noted that the US ISM Services PMI improved to 56.5 versus 54.4 expected.

    It should be noted that the WTI crude oil snaps a six-day losing streak as it rises 0.20% intraday gains near $71.60. India’s reliance on oil imports makes the INR susceptible to energy price moves.

    Against this backdrop, the S&P 500 Futures print mild losses near 3,960 while tracking Friday’s downbeat close of Wall Street. Further, the US 10-year Treasury yields remain firmer around 3.56%. It should be observed that the US 2-year Treasury bond yields flash 4.33% as the latest quote.

    Looking forward, India’s monthly Consumer Price Index (CPI) for November, expected 6.92% YoY versus 6.77% prior, as well as Industrial and Manufacturing Output for October, will be important for the USD/INR pair traders to watch. However, major attention will be on the US CPI and the Federal Open Market Committee (FOMC) as the hawkish bets on the Fed increased of late.

    Technical analysis

    USD/INR again pierces a two-month-old descending resistance line, around 82.60 by the press time, amid firmer MACD signals and upbeat RSI (14). As a result, the bulls are likely to overcome the stated upside hurdle this time, which in turn could challenge the all-time high marked in October around 83.42.


  • 03:51

    Gold Price Forecast: XAU/USD extends losses below $1,790.00, manifests pre-Fed policy anxiety

    • Gold price has slipped sharply below $1,790.00 as anxiety soars ahead of Fed’s policy.
    • The US Dollar Index is struggling to surpass the immediate resistance of 105.20 despite the risk-off mood.
    • Apart from the Fed’s policy, investors will also focus on the United States Inflation data.

    Gold price (XAU/USD) has tumbled to near $1,787.00 in the Tokyo session after failing to sustain near the critical resistance of $1,805.00. The precious metal is shifted into a bearish trajectory as investors are getting anxious amid uncertainty over Federal Reserve (Fed) policy outlook.

    New developments in United States' economic prospects after the release of the better-than-anticipated employment report and demand in the service sector for November month signaled that the Fed might continue the current interest rate hike pace to offset fresh evidence indicating a rebound in inflation or may provide higher interest rate guidance.

    However, Fed policymakers warned that the continuation of a bigger rate hike regime could accelerate financial risks in the United States economy.

    Meanwhile, the US Dollar Index (DXY) is struggling to surpass the immediate resistance of 105.20. S&P500 futures are displaying a subdued performance as investors have shifted to the sidelines ahead of Fed policy.

    Going forward, investors will also focus on the US Consumer Price index (CPI) data, which will release on Tuesday. As per the consensus, the headline inflation is seen unchanged at 7.7%.

    Gold technical analysis

    On an hourly scale, the Gold price is declining to near the upward-sloping trendline plotted from November 23 low at $1,721.23. The precious metal has surrendered the 50-period Exponential Moving Average (EMA) at $1,791.60. While, the 200-EMA around $1,780.00 is still advancing, which adds to the upside filters.

    Meanwhile, the Relative Strength Index (RSI) (14) has dropped sharply to near 40.00 from the bullish range of 60.00-80.00. A slippage inside the 20.00-40.00 range will trigger a bearish momentum ahead.

    Gold hourly chart


  • 03:10

    AUD/USD gauges a cushion around 0.6760 ahead of Fed’s policy, risk-off mood still solid

    • AUD/USD is finding immediate support after dropping from above 0.6800 amid a cautious market mood.
    • Fed policymakers are advocating a deceleration in policy tightening pace to reduce financial risks.
    • Australian Employment Change is seen higher at 46.5K while the jobless rate is seen lower at 3.3%.

    The AUD/USD pair is looking for a cushion after dropping from above the round-level resistance of 0.6800 in the Asian session. The Aussie asset is building a cushion around 0.6760, however, the bewildering inventory adjustment activity could turn into a further downfall ahead as the risk-off impulse is still solid and has not displayed any sign of exhaustion yet.

    Meanwhile, the US Dollar Index (DXY) is aiming to extend its gains above the immediate hurdle of 105.20 as investors are hiding behind safe haven to dodge anxiety ahead of the monetary policy decision by the Federal Reserve (Fed), which is due on Wednesday.

    S&P500 futures have turned cautious as the Fed is set to tighten policy further. While the 10-year US Treasury yields have surrendered their gains and have dropped to 3.56% as the odds are favoring a less hawkish commentary from Fed chair Jerome Powell.

    Less-than-projected October’s inflation report, decline in Producer Price Index (PPI) data, and a  serious decline in consumer spending in the United States economy favor a slowdown in the current pace of the interest rate hike by the Fed. Also, Fed policymakers are advocating a deceleration in policy tightening pace to reduce financial risks.

    On the Aussie front, investors are shifting their focus toward the speech from Reserve Bank of Australia (RBA) Governor Philip Lowe, which is scheduled for Wednesday. The speech from RBA Governor will provide cues about the likely monetary policy action in the first monetary policy meeting of CY2023.

    Apart from that, Australian employment data will be released on Thursday. The Employment Change is seen higher at 46.5K vs. the prior release of 32.2K. Also, the Unemployment Rate is seen lower at 3.3%. Upbeat payroll data is going to delight the RBA in hiking its interest rates further.


  • 02:43

    USD/JPY braces for 138.30 hurdle on firmer yields ahead of US inflation, FOMC

    • USD/JPY cheers upside break of three-week-old resistance to refresh intraday high.
    • Yields remain firmer amid recession woes but light calendar on Monday, firmer Japan PPI readings probe the Yen buyers.
    • US CPI, Fed’s signals for future rate hikes will be important for near-term directions.
    • Chatters surrounding BOJ’s tightening, geopolitical headlines may offer extra directions.

    USD/JPY picks up bids to favor buyers around the 137.00 threshold as the cautious mood in the market underpins the US Dollar demand during early Monday. Adding strength to the upside momentum is the technical breakout and hawkish hopes from the US Federal Reserve (Fed).

    It’s worth noting that the recession woes have recently challenged the market sentiment amid a light calendar day ahead of the busy week. That said, US Treasury Secretary Janet Yellen said, “There's a risk of a recession, but it certainly isn't something that is necessary to bring inflation down.” Further, the economic slowdown fears could be linked to the yield curve inversion as the US 10-year Treasury bond yields and the two-year bond coupons portray a negative difference.

    To portray the risk appetite, the S&P 500 Futures print mild losses near 3,960 while tracking Friday’s downbeat close of Wall Street. Further, the US 10-year Treasury yields remain firmer around 3.58%. It should be observed that the US 2-year Treasury bond yields flash 4.35% as the latest quote.

    Not only the recession woes but recently firmer US data also favor the hawkish hopes from the Fed and propel the US Dollar. the Producer Price Index (PPI) matched the market forecasts of 7.4% YoY for November versus 8.1% prior. Further, the Core PPI rose to 6.2% YoY versus 6.0% expected and 6.7% previous readings. Additionally, preliminary readings of the University of Michigan’s (UoM) Consumer Sentiment Index rose to 59.1 for December versus 53.3 market forecasts and 56.8 final readings for November. Moreover, the 1-year inflation expectations dropped to 4.6%, the lowest since September 2021 while compared to 4.9% expected whereas 5-10 year expectations were stable at 3.0%. It should be noted that the US ISM Services PMI improved to 56.5 versus 54.4 expected.

    At home, Japan’s Producer Price Index (PPI) rose to 9.3% YoY in November versus 8.9% expected and 9.1% prior. However, the nation’s BSI Large Manufacturing Conditions Index for the fourth quarter (Q4) slumped to -3.6 QoQ versus 0.1% market forecasts and 1.7 previous readings.

    Although the risk-off mood and the firmer US data keep the USD/JPY buyers hopeful, talks surrounding the Bank of Japan’s (BOJ) monetary policy tightening and a light calendar on Monday challenge the pair’s intraday upside. During the weekend, the BOJ policymaker Hajime Takata said in an interview with Japan's Nikkei newspaper that Japan's economy is not yet in a phase where the central bank can end yield curve control (YCC). Additionally, “We will be flexible on timing of tax increase for defense,” said Japan's Prime Minister Fumio Kishida. The policymaker also added that by the end of the year, I will decide on the source of defense funds.

    Looking forward, a light calendar can restrict the immediate upside of the USD/JPY pair but a cautious mood and hawkish hopes from the Fed could keep the Yen pair firmer ahead of Wednesday’s Federal Open Market Committee (FOMC).

    Technical analysis

    A clear upside break of the three-week-old resistance line, now support near 136.65, directs USD/JPY buyers towards a confluence of the 21-DMA and a descending trend line from late October, around 138.30.


  • 02:21

    WTI consolidates near fresh bear cycle lows

    • WTI printed fresh bear cycle lows on Friday. 
    • Focus is on TC Energy and the price of Russian crude trading below the $60/bbl cap.

    West Texas Intermediate is higher by some 0.57% on the day having travelled between a low of $71.47 and a high of $72.30. However, a fresh 2022 low was put into place on Friday due to supply concerns following a major spill from TC Energy's Keystone Pipeline in Nebraska.

    Nearly a fifth of Canada's oil exports to the United States was shut off at the same time that tankers carrying Russian crude are backed up in the Black Sea following the imposition of European Union sanctions and price caps.

    TC Energy shut the pipeline system following a spill of about 14,000 barrels of oil into a creek south of Steele City, Nebraska, according to the US Pipeline and Hazardous Materials Safety Administration (PHMSA). 

    Meanwhile, analysts at TD Securities, explained that with the price of Russian crude trading below the $60/bbl price cap, the sanctions are seen as less useful, while a surge of Russian exports ahead of the announcement likely loosened the fundamental picture.

    At the same time, the analysts noted that OPEC's decision to not deepen their output cuts also weighed on market sentiment. ''But the OPEC decision not to cut supply further may only be temporary, if the export flows from Russia do not drop significantly due to the $60/b price cap,'' the analysts previously said. ''Plus, notwithstanding the fact that Russia has some 100 hastily assembled tankers and sanction avoidance by exporters, the higher shipping costs (more distant delivery ports) and less efficient logistics imply some reduction from Moscow.''


  • 02:18

    Silver Price Analysis: XAG/USD snaps three-day uptrend above $23.00

    • Silver price renews intraday low during the first loss-making day in four.
    • Rising wedge, nearly overbought RSI adds strength to bearish bias.
    • Convergence of previous resistance line, 21-DMA appears a tough nut to crack for XAG/USD bears.

    Silver price (XAG/USD) remains on the back foot as it refreshes intraday low near $23.30 during early Monday. In doing so, the bright metal defies the three-day winning streak by reversing from the highest levels since late April.

    It’s worth noting that the overbought conditions of the RSI (14) and the quote’s failure to stay beyond the 61.8% Fibonacci retracement level of March-September downside, near $23.40, teases XAG/USD sellers. Also keeping the bears hopeful is the one-month-old rising wedge chart pattern.

    That said, a clear downside break of $22.70 becomes necessary to confirm the bearish chart pattern, which in turn highlights the theoretical target of $19.10.

    However, a convergence of the 21-DMA and the previous resistance line from March, around $21.90 by the press time, appears crucial support for the Silver bears to break before taking control. Also challenging the XAG/USD downside is the $20.00 threshold.

    On the flip side, a daily closing beyond the 61.8% Fibonacci retracement level near $23.40 could lure short-term buyers of XAG/USD.

    Following that, the upper line of the stated wedge, near the $24.00 round figure, could act as the last defense of the Silver bears before giving control to the commodity buyers.

    Silver price: Daily chart

    Trend: Further downside expected


  • 02:16

    NZIER Consensus Forecasts show a weaker economic outlook for years beyond 2024

    According to the latest New Zealand Institute of Economic Research (NZIER) Consensus Forecasts, New Zealand's economy is seen resilient over the coming year but the growth could be revised downward for 2025 and 2026.

    Additional takeaways

    As more fixed-term mortgages get repriced within the next twelve months, the dampening effect of interest rate increases on economic activity will become more apparent over the coming years.

    Household consumption has been revised down beyond 2024.

    Despite a strong starting point for export growth, the forecasts of export growth have been revised lower for years after 2023.

    Consensus Forecasts for GDP growth show a mixed outlook for the next few years. Annual GDP growth for the year s ending March 2023 and March 2024 has been revised up to 3.1 percent and 1.1 percent , respectively. However, forecasts for growth beyond 2024 have been revised lower.

    The NZD is expected to track around 71 on the TWI over the coming years.

    Annual CPI is forecast to moderate to 3.4 percent in 2024 and ease to 2.2 percent in 2026 – still above the RBNZ inflation target mid -point of 2 percent.

    The outlook for interest rates has again been revised up across the projection horizon.

    Market reaction

    NZD/USD is heavily offered in Asian trading this Monday, as risk-off flows dominate kicking off a critical week. The pair was last seen trading at 0.6386, down 0.30% on the day.

  • 02:03

    EUR/USD Price Analysis: Bears breakdown the trendline support, eye test of 1.0500

    • EUR/USD bears are taking control and a move into a test below 1.0500 is favourable while below 1.0520. 
    • Bulls need to get back into the trend for prospects of 1.0550.

    As per the pre-market open analysis, EUR/USD Price Analysis: Bulls eye a break of key 1.0550 area, eyes on 1.0600, the upside levels are eyed at 1.0550 and 1.0600 but for the meanwhile, the US Dollar is firm. 

    As measured by the DXY index, the greenback has moved 0.28% higher against a basket of currencies to 105.23, although it is not too far away from the five-month trough of 104.1 a week ago. Nevertheless, the euro is carving out the downside in the open, pressuring key trendline support as the following illustrates:

    EUR/USD prior analysis

    While on the front side of the daily trendline, it was noted that EUR/USD bulls were firming from near 1.0480 support and were taking on resistance around 1.0570.

    A move-through resistance will leave 1.0600 exposed while a drop in EUR/USD below the trendline will leave 1.0490 vulnerable and would open prospects of a deeper correction towards 1.0400. 

    EUR/USD H1 chart

    The bull's first challenge will be the micro trendline resistance and the 1.0550s.

    However, in the meanwhile, the bears are taking control and a move into a test below 1.0500 is favourable while below 1.0520. 

  • 01:56

    S&P 500 Futures, US Treasury bond yields portray market fears, focus on recession, Fed

    • Market sentiment remains dull ahead of key data/events.
    • US Treasury Secretary Yellen highlights recession fears.
    • S&P 500 Futures extend Friday’s losses, US Treasury bond yields grind higher.
    • Economic calendar has fewer events ahead of Tuesday, which might allow traders to prepare for crucial catalysts.

    Markets begin the key week on a negative note as recession woes join the pre-data/event anxiety during early Monday. The risk-off mood, however, fails to gain major attention amid a light calendar and mixed concerns.

    While portraying the mood, the S&P 500 Futures print mild losses near 3,960 while tracking Friday’s downbeat close of Wall Street. Further, the US 10-year Treasury yields remain firmer around 3.58%. It should be observed that the US 2-year Treasury bond yields flash 4.35% as the latest quote.

    In addition to the yield curve inversion, which portrays the recession woes, the recently firmer US data and comments from the US Treasury Secretary Janet Yellen also weigh on the market sentiment.

    As per the latest US data, the Producer Price Index (PPI) matched the market forecasts of 7.4% YoY for November versus 8.1% prior. Further, the Core PPI rose to 6.2% YoY versus 6.0% expected and 6.7% previous readings. Additionally, preliminary readings of the University of Michigan’s (UoM) Consumer Sentiment Index rose to 59.1 for December versus 53.3 market forecasts and 56.8 final readings for November. Moreover, the 1-year inflation expectations dropped to 4.6%, the lowest since September 2021 while compared to 4.9% expected whereas 5-10 year expectations were stable at 3.0%. It should be noted that the US ISM Services PMI improved to 56.5 versus 54.4 expected.

    That said, US Treasury Secretary Janet Yellen said, “There's a risk of a recession, but it certainly isn't something that is necessary to bring inflation down.” Further, the economic slowdown fears could be linked to the yield curve inversion as the US 10-year Treasury bond yields and the two-year bond coupons portray a negative difference.

    It should be noted that China’s gradual easing of the Zero-Covid policy and the recent stimulus, mainly to the struggling real-estate sector, challenge the market bears ahead of the US inflation numbers and the Federal Reserve’s (Fed) monetary policy meeting. Other than that, the preliminary readings of December’s PMIs and monetary policy meetings of the European Central Bank (ECB), as well as the Bank of England (BOE), are also important events to watch for the market players for clear directions.

  • 01:33

    AUD/JPY drops firmly below 92.50 amid risk-off mood, RBA Lowe’s speech eyed

    • AUD/JPY has slipped firmly to near 92.50 as the market mood sours.
    • RBA Lowe is likely to guide the interest rate action in the first monetary policy meeting of CY2023.
    • Upbeat payroll data is going to delight the RBA in hiking its interest rates further.

    The AUD/JPY pair has dropped sharply to near 92.40 in the Tokyo session after a breakdown of the consolidation formed in a 92.75-92.90 range. The cross is following the footprints of AUD/USD, portraying a risk-aversion theme in the currency market.

    AUD/JPY has turned volatile as investors have shifted their focus towards the speech from the Reserve Bank of Australia (RBA) Governor Philip Lowe, which is scheduled for Wednesday. RBA Lowe is expected to guide the likely monetary policy action in the first monetary policy meeting in CY2023.

    The Australian central bank hiked its Official Cash Rate (OCR) by 25 basis points (bps) to 3.10% last week as the inflationary pressures are still beyond the desired target despite signs of a slowdown in October. The inflation rate was trimmed to 6.9% from the prior release of 7.3% on an annual basis.

    Apart from the RBA Lowe’s speech, investors will focus on the employment data, which will release on Thursday. The Employment Change is seen higher at 46.5K vs. the prior release of 32.2K. Also, the Unemployment Rate is seen lower at 3.3%. Upbeat payroll data is going to delight the RBA in hiking its interest rates further.

    Meanwhile, declining Chinese inflation is accelerating the odds of policy easing by the People’s Bank of China (PBOC) to propel the growth rate and strengthen the economic prospects. This could be supportive of the Australian Dollar, being the leading trading partner of China.

    On the Tokyo front, the risk of a decline in inflation has been triggered after a contraction in Gross Domestic Product (GDP) numbers. A subdued demand never propels a hike in the price rise index. Bank of Japan (BOJ) Haruhiko Kuroda is of the view that even if wages rise by 3%, the BOJ will maintain its ultra-loose monetary policy until inflation reaches 2%.


  • 01:28

    USD/CAD Price Analysis: Bulls approach 1.3690 hurdle

    • USD/CAD picks up bids to refresh intraday high, extends Friday’s run-up.
    • Impending bull cross on MACD, firmer RSI keeps buyers hopeful.
    • Five-week-old descending resistance line challenges buyers, weekly support line limits immediate downside.

    USD/CAD stays on the front foot around 1.3675, refreshing intraday high while extending the previous day’s run-up during early Monday.

    In doing so, the Loonie pair stretches the latest rebound from a one-week-old ascending trend line as MACD signals tease bulls. That said, the recently firmer RSI (14) also keeps the buyers hopeful as the quote approaches a downward-sloping resistance line from early November.

    In a case where the USD/CAD bulls successfully cross the aforementioned resistance line, around 1.3690 by the press time, the monthly high near 1.3700 could act as an extra upside filter before directing the upside towards the previous monthly peak near 1.3810.

    It’s worth noting that multiple hurdles near the 1.3900 round figure and 1.3950 could challenge the USD/CAD pair’s upside past 1.3810, a break of which won’t hesitate to challenge the yearly high marked in October near 1.3980, as well as aim for the 1.4000 psychological magnet.

    On the contrary, a downside break of the aforementioned weekly support line, near 1.3620 at the latest, becomes necessary to recall the USD/CAD bears.

    Even so, the 50% Fibonacci retracement level of the pair’s November 03-15 downside, close to 1.3515, as well as the 200-SMA level of 1.3480, could challenge the pair’s further downside.

    USD/CAD: Four-hour chart

    Trend: Further upside expected


  • 01:24

    USD/CNY fix: 6.9565 vs. last close 6.9598

    In recent trade today, the People’s Bank of China (PBOC) set the yuan (CNY) at 6.9565 vs. the last close of 6.9598.

    About the fix

    China maintains strict control of the yuan’s rate on the mainland.

    The onshore yuan (CNY) differs from the offshore one (CNH) in trading restrictions, this last one is not as tightly controlled.

    Each morning, the People’s Bank of China (PBOC) sets a so-called daily midpoint fix, based on the yuan’s previous day's closing level and quotations taken from the inter-bank dealer.

  • 01:10

    US Treasury Secretary Yellen: There's a risk of a recession

    In a CBS 60 minutes interview, US Treasury Secretary Janet Yellen said there's a risk of a recession, but said it certainly isn't something that is necessary to bring inflation down.

    "I believe by the end of next year you will see much lower inflation if there's not-- an unanticipated shock," she said.

    Asked about the likelihood of recession, she said:

    "There's a risk of a recession. But-- it certainly isn't, in my view, something that is necessary to bring inflation down."

    US Dollar update

    Meanwhile, the US dollar, as measured by the DXY index, has moved 0.28% higher against a basket of currencies to 105.23, although it is not too far away from the five-month trough of 104.1 a week ago.

  • 01:03

    GBP/USD Price Analysis: Mean reversion to near 20-EMA around 1.2050 looks likely

    • The heat of the risk-aversion theme has dragged the Cable below 1.2230.
    • No trend can be undisputed for a secular period, therefore, a corrective move to near the 20-EMA cannot be ruled out.
    • The RSI (14) has shown signs of deceleration in the upside momentum.

    The GBP/USD pair has extended its losses below 1.2230 in the Asian session after failing to sustain above the round-level resistance of 1.2300. The Cable is facing the heat of risk-aversion theme as investors are getting anxious ahead of the monetary policy announcement by the Federal Reserve (Fed) and the Bank of England (BOE).

    The US Dollar Index (DXY) has climbed firmly to near 105.20 in Tokyo and is expected to extend gains further amid an improvement in safe-haven’s appeal. Meanwhile, the 10-year US Treasury yields are hovering above 3.5%.

    On a daily scale, the Cable is continuously moving north and has not displayed a mean-reversion to near 20-period Exponential Moving Average (EMA). No trend can be undisputed for a secular period, therefore, a corrective move to near the 20-EMA cannot be ruled out. Also, the Pound Sterling has shown signs of exhaustion in the upside trend.

    The Cable is auctioning above the 200-EMA at 1.2116, which indicates that the upside trend is still intact.

    Meanwhile, a continuous oscillation in the bullish range of 60.00-80.00 by the Relative Strength Index (RSI) (14) is showing signs of overbought.

    Should the Cable drops below Friday’s low around 1.2200, the US Dollar bulls will drag the asset towards the 200-EMA at 1.2116 and the 20-EMA at 1.2050.

    On the contrary, a decisive break above December 5 high at 1.2345 will drive the asset toward the round-level resistance at 1.2400, followed by the psychological resistance at 1.2500.

    GBP/USD daily chart


  • 00:58

    Gold Price Forecast: XAU/USD sellers eye $1,780 on firmer US Dollar ahead of US inflation, Fed announcements

    • Gold price takes offers to renew intraday low, snaps four-day uptrend.
    • Cautious sentiment ahead of the key data/events, recession woes favor XAU/USD bears.
    • Bearish RSI divergence on four-hour chart adds strength to the downside bias.

    Gold price (XAU/USD) begins the bumper week on the negative side as it renews intraday low near $1,792 while printing the first daily loss in five during early Monday.

    In doing so, the yellow metal takes clues from the US Dollar strength ahead of crucial catalysts.

    Other than the anxiety ahead of the market-moving catalysts, the chatters surrounding the recession also underpin the US Dollar’s safe-haven demand and weigh on the Gold price.

    That said, the US Dollar Index (DXY) remains firmer around 105.15 while extending the first weekly gain in three. In doing so, the DXY cheers firmer US data and hawkish hopes from the US Federal Reserve.

    US Producer Price Index (PPI) matched the market forecasts of 7.4% YoY for November versus 8.1% prior. Further, the Core PPI rose to 6.2% YoY versus 6.0% expected and 6.7% previous readings. Additionally, preliminary readings of the University of Michigan’s (UoM) Consumer Sentiment Index rose to 59.1 for December versus 53.3 market forecasts and 56.8 final readings for November. Moreover, the 1-year inflation expectations dropped to 4.6%, the lowest since September 2021 while compared to 4.9% expected whereas 5-10 year expectations were stable at 3.0%. It should be noted that the US ISM Services PMI improved to 56.5 versus 54.4 expected.

    On the other hand, US Treasury Secretary Janet Yellen said, “There's a risk of a recession, but it certainly isn't something that is necessary to bring inflation down.” Further, the economic slowdown fears could be linked to the yield curve inversion as the US 10-year Treasury bond yields and the two-year bond coupons portray a negative difference, suggesting the market’s preference for the short-term US Treasury bonds that print the recession woes.

    Amid these plays, the S&P 500 Futures print mild losses while tracking Friday’s downbeat close of Wall Street whereas the US 10-year Treasury yields remain firmer around 3.58%. It should be observed that the US 2-year Treasury bond yields flash 4.35% as the latest quote.

    Looking forward, a light calendar may restrict immediate Gold price moves but a bumper week comprising the US Consumer Price Index (CPI) for November, the Fed’s verdict and monthly PMI data for the US will be crucial to watch. Above all, clues about the Fed’s future rate hikes will be important for clear directions.

    Gold price technical analysis

    Gold price justifies the bearish RSI (14) divergence as it drops towards a one-month-old ascending support line, near $1,780 by the press time.

    It should be noted that the Relative Strength Index (RSI) line, placed at 14, diverges from the XAU/USD price as the quote printed higher highs but the oscillator marked lower tops, which in turn suggests that the upside momentum fades and the same teases sellers.

    In addition to the aforementioned support line near $1,780, the 100-SMA level surrounding $1,767 also acts as a short-term important level to watch for the Gold bears.

    Meanwhile, the $1,800 threshold and the monthly high near $1,810 restrict the short-term upside of the XAU/USD.

    However, a successful run-up beyond $1,810 won’t hesitate to aim for June’s top near $1,780.

    Gold price: Four-hour chart

    Trend: Further downside expected


  • 00:53

    NZD/USD pressured as traders await key US events

    • NZD/USD is pressured in the open as traders get set for the Fed.
    • The Fed is expected to be a hawkish outcome.

    NZD/USD is lower by some 0.25% in the open with the price dropping from a high of 0.6411 to print a low of 0.6382 so far. Nevertheless, it has been the best-performing G10 currency month to date.

    ''NZD seasonality is usually positive in December, but while it has that that and higher interest rates in its corner, there are no guarantees that it will finish this week un-bruised, with several central bank meetings due,'' analysts at ANZ Bank explained.

    The Federal Open Market Committee is coming up this week and traders are in anticipation of a hawkish outcome with US producer inflation data for November coming in slightly hotter than expected, bolstering the case for continued interest rate hikes by the Federal Reserve even if at a slower pace.

    Analysts at TD Securities expect the FOMC to deliver a 50bp rate increase at its December meeting, lifting the target range for the Fed funds rate to 4.25%-4.50%. ''In doing so, the Committee would finally move the inflation-adjusted policy stance into restrictive territory. We also look for the FOMC to signal that they will have to move to a higher terminal rate than anticipated in September.''

    ''Our chief concern is what this might do to the USD, which has come under pressure as the trendy “pivot” narrative has taken hold, despite clear signs of sticky US inflation,'' analysts at ANZ Bank said.''NZ factors will also play a role, with the HYEFU and GDP due this week, but they’re likely to play second fiddle to volatility and the global vibe (again!).''

    In other events, the US consumer inflation report on Tuesday will set the tone for markets ahead of the Fed. Economists expect core inflation to ease to 6.1% in November from a year ago, compared with a rise of 6.3% the prior month.


  • 00:31

    USD/JPY aims to recapture 137.00 as investors see Fed’s terminal rate above 5%

    • USD/JPY is looking to reclaim 137.00 as the risk profile sours ahead of Fed’s policy.
    • The Fed is expected to hike interest rates by 50 bps and terminal rate guidance above 5%.
    • The headline US inflation is seen unchanged at 7.7% and core inflation is higher at 6.4% annually.

    The USD/JPY pair has picked strength after remaining sideways around 136.50 in the Tokyo session. The asset is aiming to hit the immediate resistance of 137.00 as the market participants have turned cautious ahead of the interest rate decision by the Federal Reserve (Fed).

    Meanwhile, the US Dollar Index (DXY) has shown strength at open and has crossed the round-level resistance of 105.00 firmly. Appeal for safe-haven has improved as the market mood is turning risk-averse ahead of the Fed’s monetary policy and the release of the United States Consumer Price Index (CPI) data.

    S&P500 futures have resumed their precautionary selling as a further rate hike by the Fed will propel recession signals. While the 10-year US Treasury yields are marching towards 3.60% on expectations of further policy tightening.

    A surprise decline in October’s inflation report and the expected release of November’s Producer Price Index (PPI) has cleared that Fed chair Jerome Powell will look for a slowdown in the interest rate hike pace. Rabobank analysts said they expect the US central bank to hike the policy rate by 50 basis points (bps) and see policymakers revising the terminal rate projection to the neighborhood of 5%.

    Apart from that, November’s inflation report will keep the risk-perceived assets on the tenterhooks. As per the projections, the headline CPI is seen unchanged at 7.7% on an annual basis. While the core inflation that excludes oil and food prices is seen marginally higher at 6.4%.

    On the Japanese yen front, Reuters reported Bank of Japan (BOJ) board member Hajime Takata said in an interview with the Nikkei newspaper published on Saturday that Japan's economy is not yet in a phase where the central bank can end yield curve control. He further added that there were some positive signs in corporate capital expenditure and wages.


  • 00:25

    AUD/USD Price Analysis: Revisits 61.8% Fibo. level to snap three-day uptrend below 0.6800

    • AUD/USD takes offers to refresh intraday low, prints the first daily loss in four.
    • 61.8% Fibonacci retracement level will challenge the bears ahead of the key 0.6690 support confluence.
    • Rising wedge teases sellers, 200-day EMA acts as immediate upside hurdle.

    AUD/USD begins the key week on the negative side as it takes offers to refresh the intraday low near 0.6770 while snapping a three-day uptrend during early Monday in Asia. In doing so, the Aussie pair pokes the 61.8% Fibonacci retracement level of the pair’s August-October downside.

    Even if the key Fibonacci retracement level, also known as the “Golden Ratio”, challenges the AUD/USD bears near 0.6770, the recently bearish MACD signals and the sluggish RSI (14) suggest the quote’s further downside. Also keeping the pair sellers hopeful is the one-month-old rising wedge bearish chart formation on the daily play.

    It’s worth noting, however, that a convergence of the 100-day EMA and the stated wedge’s support line, near 0.6690, appears a tough nut to crack for the AUD/USD bears.

    Following that, a south run towards the 38.2% Fibonacci retracement level near 0.6540 and then to the 0.6425 theoretical target can’t be ruled out.

    Alternatively, the 200-day EMA level surrounding 0.6840 restricts immediate AUD/USD upside ahead of the aforementioned rising wedge’s top, close to 0.6880 by the press time.

    In a case where the AUD/USD bulls keep the reins past 0.6880, the late August high near the 0.7000 round figure will be in focus.

    AUD/USD: Daily chart

    Trend: Further downside expected


  • 00:15

    Currencies. Daily history for Friday, December 9, 2022

    Pare Closed Change, %
    AUDUSD 0.67961 0.45
    EURJPY 143.901 -0.14
    EURUSD 1.05354 -0.17
    GBPJPY 167.504 0.26
    GBPUSD 1.22635 0.31
    NZDUSD 0.64174 0.82
    USDCAD 1.36442 0.38
    USDCHF 0.9341 -0.23
    USDJPY 136.588 -0.04
  • 00:13

    US Dollar Index stays firmer past 105.00 as DXY traders await US inflation, Fed’s action

    • US Dollar Index stays firmer after snapping two-week downtrend.
    • Upbeat US data keeps Fed hawks on the table even as 50 bps rate hike is already given.
    • Slew of economic data could trigger more volatility and favor DXY bulls ahead of the key data/events.
    • Monday’s light calendar may portray a softer start to the key week.

    US Dollar Index (DXY) extends the previous weekly gains, the first in three, as it picks up bids to refresh its intraday high around 105.10 during early Monday. In doing so, the greenback gauge portrays the market’s rush toward the US Dollar ahead of the key data/events.

    That said, the greenback’s latest run-up could be linked to the talks of the US recession, as well as recently firmer US data.

    The economic slowdown fears could be linked to the yield curve inversion as the US 10-year Treasury bond yields and the two-year bond coupons portray a negative difference, suggesting the market’s preference for the short-term US Treasury bonds that print the recession woes.

    Recently, US Treasury Secretary Janet Yellen said, “There's a risk of a recession, but it certainly isn't something that is necessary to bring inflation down.”

    Talking about the data, US Producer Price Index (PPI) matched the market forecasts of 7.4% YoY for November versus 8.1% prior. Further, the Core PPI rose to 6.2% YoY versus 6.0% expected and 6.7% previous readings. Additionally, preliminary readings of the University of Michigan’s (UoM) Consumer Sentiment Index rose to 59.1 for December versus 53.3 market forecasts and 56.8 final readings for November. Moreover, the 1-year inflation expectations dropped to 4.6%, the lowest since September 2021 while compared to 4.9% expected whereas 5-10 year expectations were stable at 3.0%. It should be noted that the US ISM Services PMI improved to 56.5 versus 54.4 expected.

    Amid these plays, the S&P 500 Futures print mild losses while tracking Friday’s downbeat close of Wall Street whereas the US 10-year Treasury yields remain firmer around 3.58%. It should be observed that the US 2-year Treasury bond yields flash 4.35% as the latest quote.

    Moving on, the US Consumer Price Index (CPI) for November and the Federal Reserve’s (Fed) guidance on the rates, indirectly though, will be crucial for the DXY traders as bulls flex muscles. However, as the 0.50% rate hike is already priced-in, an absence of a major hawkish statement could recall the US Dollar bears. That said, a light calendar on Monday might result in an inactive day.

    Technical analysis

    Unless staying beyond the one-week-old ascending support line, around 104.70 by the press time, the US Dollar Index buyers may remain hopeful.


O foco de mercado
Cotações
Símbolo Bid Ask Horário
AUDUSD
EURUSD
GBPUSD
NZDUSD
USDCAD
USDCHF
USDJPY
XAGEUR
XAGUSD
XAUUSD
Material posted here is solely for information purposes and reliance on this may lead to losses. Past performances are not a reliable indicator of future results. Please read our full disclaimer
Abrir Conta Demo e Página Pessoal
Compreendo e aceito a Política de Privacidade e concordo que os meus dados sejam processados pela TeleTrade e usados para os seguintes efeitos: