Notícias do Mercado
-
23:50
Japan Producer Price Index (YoY) registered at 10.2% above expectations (9.5%) in December
-
23:50
Japan Producer Price Index (MoM) came in at 0.5%, above forecasts (0.3%) in December
-
23:07
USD/CHF Price Analysis: Spring below 0.9200 pushes back inside the woods
- The formation of a Spring has pushed the asset inside the woods.
- A stretched consolidation after a bearish bias indicates inventory accumulation for a bullish reversal.
- Overlapping 20-EMA with the asset price is indicating a consolidation ahead.
The USD/CHF pair is displaying topsy-turvy moves in the early Tokyo session as the upside in the asset is capped around 0.9300 while the downside is restricted at 0.9250. The Swiss franc asset has turned sideways, defending the risk-appetite theme in the market.
S&P500 witnessed a decent buying interest last week as the result season kicked off. Surprisingly, the 10-year US Treasury yields gained to 3.50%, which has restricted the downside in the US Dollar index (DXY). The USD Index remained in consolidation around 101.76.
USD/CHF has reversed inside the woods after sensing a responsive buying action from the market participants below 0.9200. This has served as a Spring formation, which signifies the case of restricted downside. On a four-hour scale, stretched consolidation in USD/CHF is indicating an inventory accumulation formation, which might result in a bullish reversal ahead.
The 20-period Exponential Moving Average (EMA) at 0.9277 is overlapping with the asset price, which indicates a consolidation ahead.
Also, the Relative Strength Index (RSI) (14) is oscillating in the bullish range of 40.00-60.00, which indicates that the asset awaits a key trigger for a decisive move.
Going forward, a break above January 11 high at 0.9332 will drive the asset towards December 12 high at 0.9363 followed by the round-level resistance at 0.9400.
Alternatively, a slippage below Monday’s low at 0.9167 will result in a fresh downside journey toward March low at 0.9150. A downside move below March low will expose the asset to January 17 low at 0.9117.
USD/CHF four-hour chart
-638094207690328431.png)
-
22:43
GBP/USD sees an upside above 1.2250 ahead of UK Inflation data
- GBP/USD is expecting more upside above 1.2250 amid a cheerful market mood.
- BOE’s Mann doesn’t see any risk of over-tightening in its current interest rate hike cycle.
- The US PPI is expected to decline further amid lower gasoline prices and weak retail demand.
The GBP/USD pair is struggling to extend gains above the immediate resistance of 1.2250 in the early Asian session. The Cable has sensed selling pressure while overstepping the aforementioned resistance a few times but is now expected to extend the rally upside amid a significant improvement in the risk appetite of the market participants.
A four-day winning streak in S&P500 is portraying that the market mood is quite upbeat. Investors are pouring funds into the risk-perceived assets while dumping the safe-haven assets. The 10-year US Treasury yields surprisingly gained to 3.50%. Meanwhile, the US Dollar Index (DXY) managed to restrict its downside to near 101.76.
This week, the Pound Sterling will be guided by the United Kingdom inflation data, which will release on Wednesday. As per the projections, the headline Consumer Price Index (CPI) (Dec) is expected to trim to 10.6% from the former release of 10.7%. While the core price index data that excludes oil and gas prices might escalate to 6.6% vs. the prior release of 6.3% in a similar period.
It looks like the UK inflation has got more stubborn and the Bank of England (BOE) will be forced to continue hiking interest rates further. BOE member Catherine Mann cited that the central bank is not at a point where it needs to worry about the risk of over-tightening in its interest rate-rising cycle.
On the United States front, investors are awaiting the release of the Producer Price Index (PPI) data. The street sees a decline in headline factory gate prices of goods and services (Dec) to 6.8% from the former release of 7.4%. Also, the core PPI might trim to 5.9% from the former release of 6.2% in a similar period.
-
22:15
Gold Price Forecast: XAU/USD aims to extend rally above $1,920 as Fed to ease policy tightening pace
- Gold price is looking to extend gains above $1,920.00 decisively amid weakness in the US Dollar Index (DXY).
- The Fed is expected to scale down the policy tightening pace amid declining inflation.
- S&P500 recorded a four-day winning streak, portraying a risk-on market mood.
Gold price (XAU/USD) has turned sideways after a juggernaut rally to near the critical resistance of $1,920.00 in the early Asian session on Monday. The precious metal witnessed substantial buying interest after surpassing the round-level resistance of $1,900 for the first time in eight months. Also, a sell-off in the US Dollar Index (DXY) supported a rally in the Gold price.
The risk profile remains upbeat as S&P500 recorded a four-day winning streak as the Federal Reserve (Fed) is set to trim its current policy tightening pace after a decent decline in December’s inflation report. However, the return generated by US Treasury bonds remains solid and gained to 3.50% despite the risk appetite theme. The US Dollar Index remained below 101.80 despite an improvement in United States Consumer Confidence data on Friday.
The University of Michigan released Consumer Confidence at 64.6 vs. the expectations of 60.5. The street is aware of the fact that retail demand has slowed down, therefore, the catalyst that has cheered consumers is the lower inflation led by lower gasoline prices.
Analysts at Wells Fargo see that the relief on the inflation front and wage growth is lifting spirits, but warn the still-sour buying conditions suggest the good vibes in this report may not translate into a spending surge.
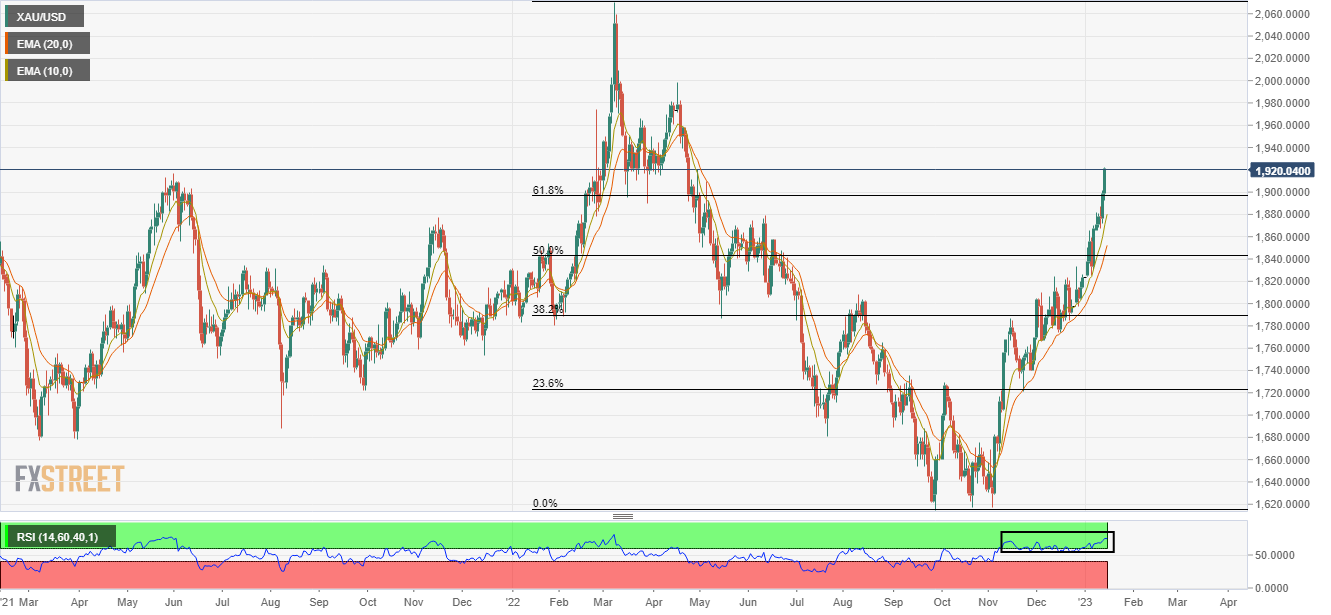
Gold technical analysis
Gold price has scaled above the 61.8% Fibonacci retracement (placed from March 8 high at $2,070.54 to September 28 low at $1,614.85) at $1,897.42. The 10-and 20-period Exponential Moving Averages (EMAs) at $1,881.49 and $1,852.64 respectively are upward-sloping, which adds to the upside filters.
Also, the Relative Strength Index (RSI) (14) is oscillating in the bullish range of 60.00-80.00, which indicates that the upside momentum is active.
Gold daily chart
-
21:57
BoJ preparing to purchase more Japanese government bonds on Monday
The Bank of Japan again broke its daily record for Japanese government bond purchases Friday as yields defied its 0.5% cap, in a sign of the rising market pressure for another policy retreat by the central bank.
The BOJ bought roughly 10 trillion yen ($78 billion) in JGBs over the past two days, with a 5 trillion yen purchase on Friday topping the high it had just set Thursday and is preparing to purchase more Japanese government bonds on Monday, according to the Nikkei.
''The BOJ will kick off the year's first two-day policy board meeting Tuesday. Ahead of this, many in the central bank believe that it should take a wait-and-see approach on policy changes.''
USD/JPY update
In last week's analysis, USD/JPY drops to fresh lows on BoJ sentiment, scarred by US CPI also, it was noted that USD/JPY was under pressure due to that headline did the rounds that the Bank of Japan, as reported by Japanese media Yomiuri, was about to make another hawkish move during its monetary policy meeting.
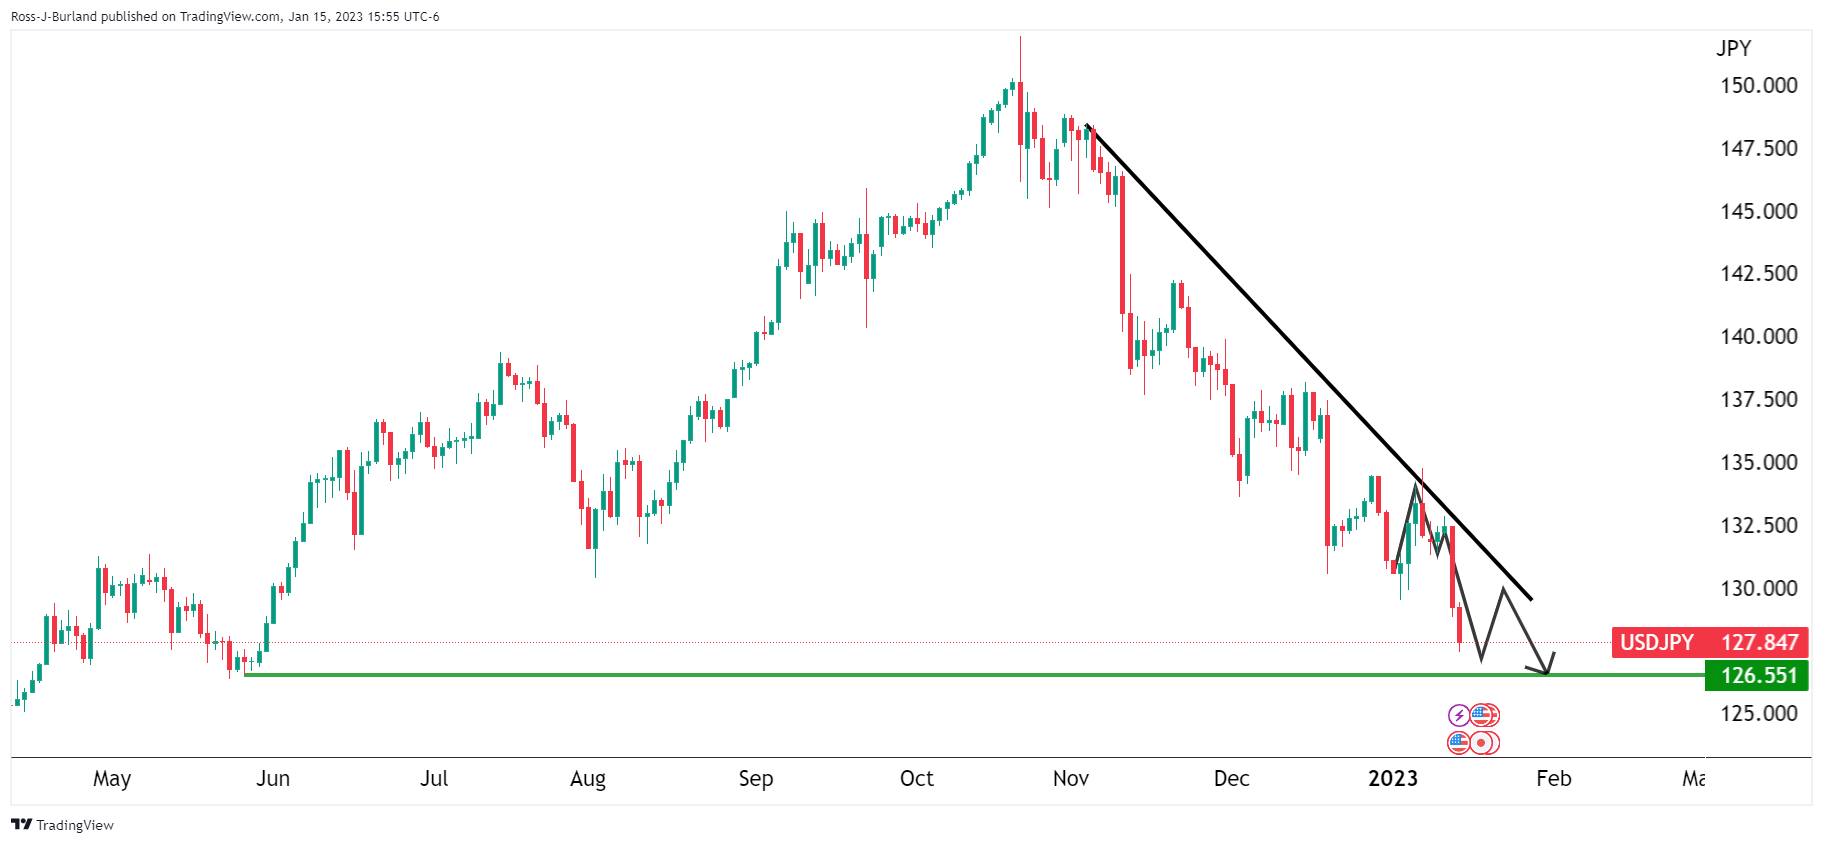
The pair has since continued lower and eyes the 126.50s. However, the daily M-formation could hold up the bears and attract a bid towards the 129.50s beforehand.
-
21:43
EUR/USD Price Analysis: Bears attacking the bullish H4 trendline support
- EUR/USD H4 M-formation is compelling for the start of the week.
- Bers eye a downside move below 1.0780.
As per the prior analysis, EUR/USD Price Analysis: Bulls could be running into a trap, it was explained that the breakout traders had been triggered into the market ahead of the Consumer Price Index event. However, the data ignited a rally that took out the 1.0800 and likely hunted down stops in the 1.0850s. This leaves the scope of a reversal on the cards for the days ahead as per the poster CPI technical analysis, EUR/USD prints fresh bull cycle highs, on course for 5-day rally.
EUR/USD prior analysis
This puts the downside thesis into play as follows:
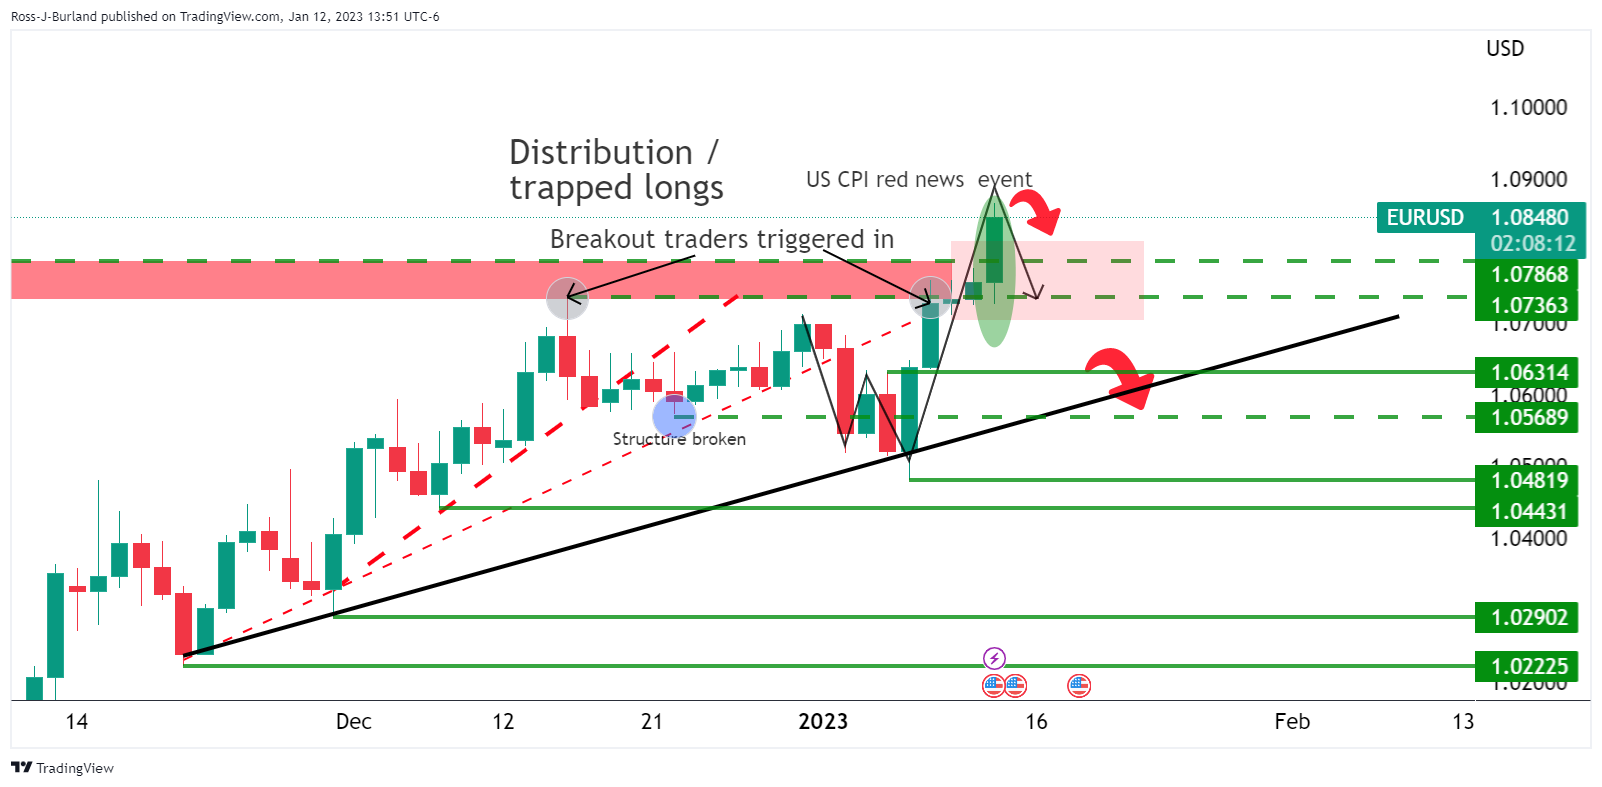
The analysis highlighted the downside risks as illustrated above.
EUR/USD update
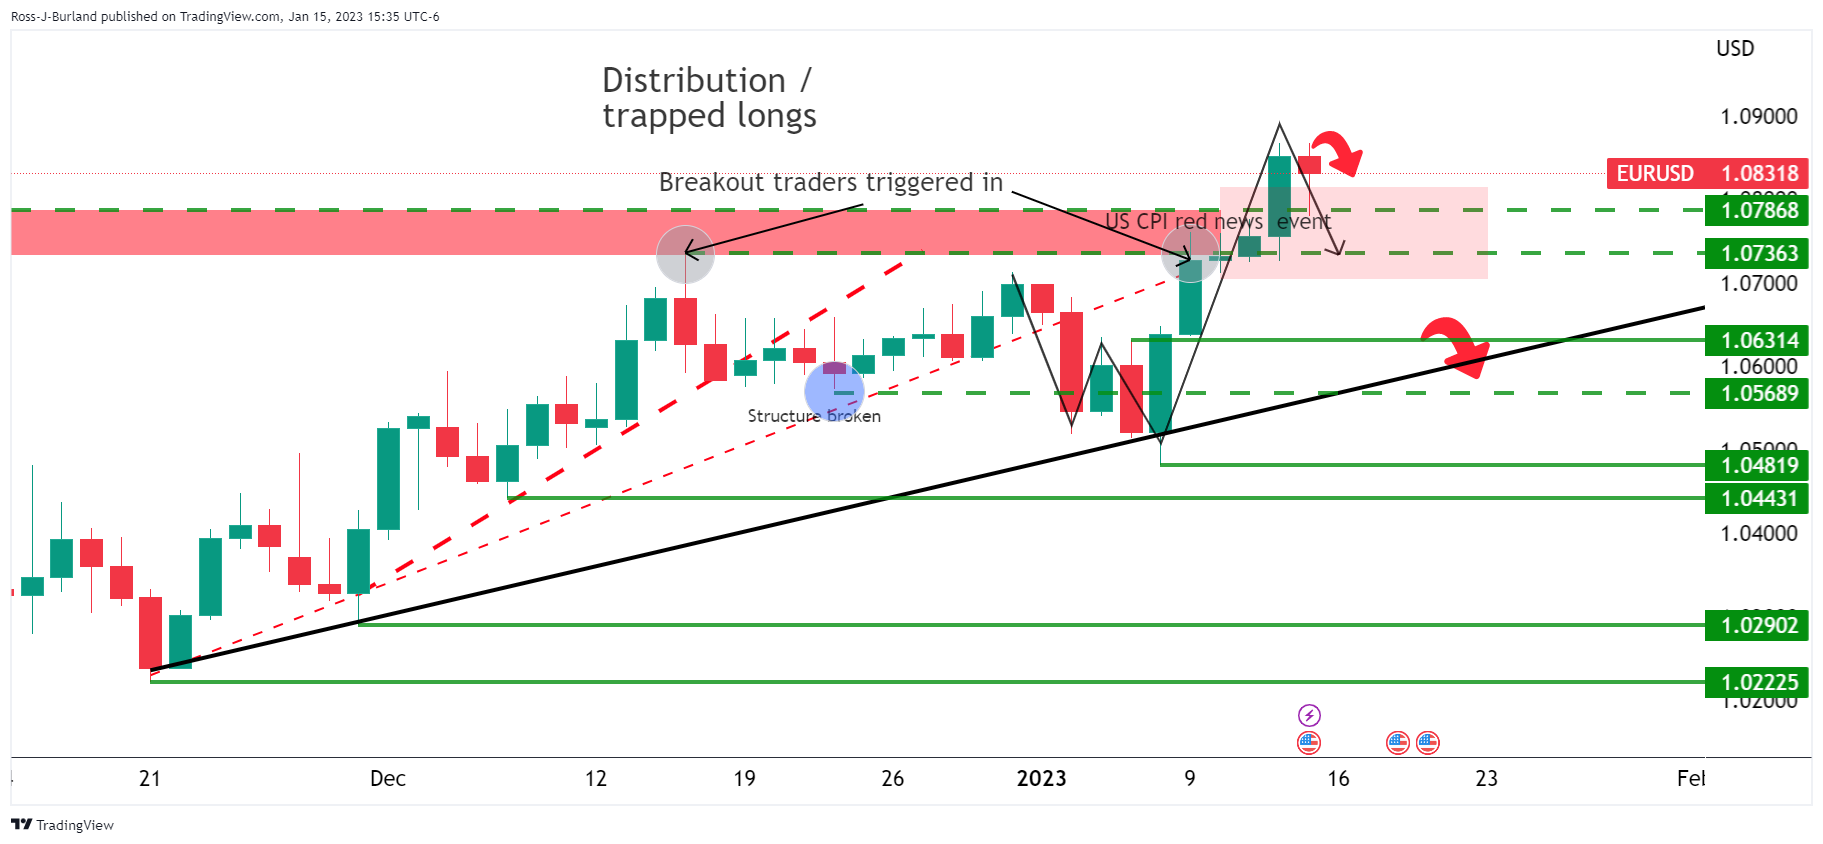
The price has since stalled and is on track for a re-test of 1.0780s and lower towards 1.0700. However, the bears need to break trendline support on the lower time frames, such as the 4-hour chart as follows:
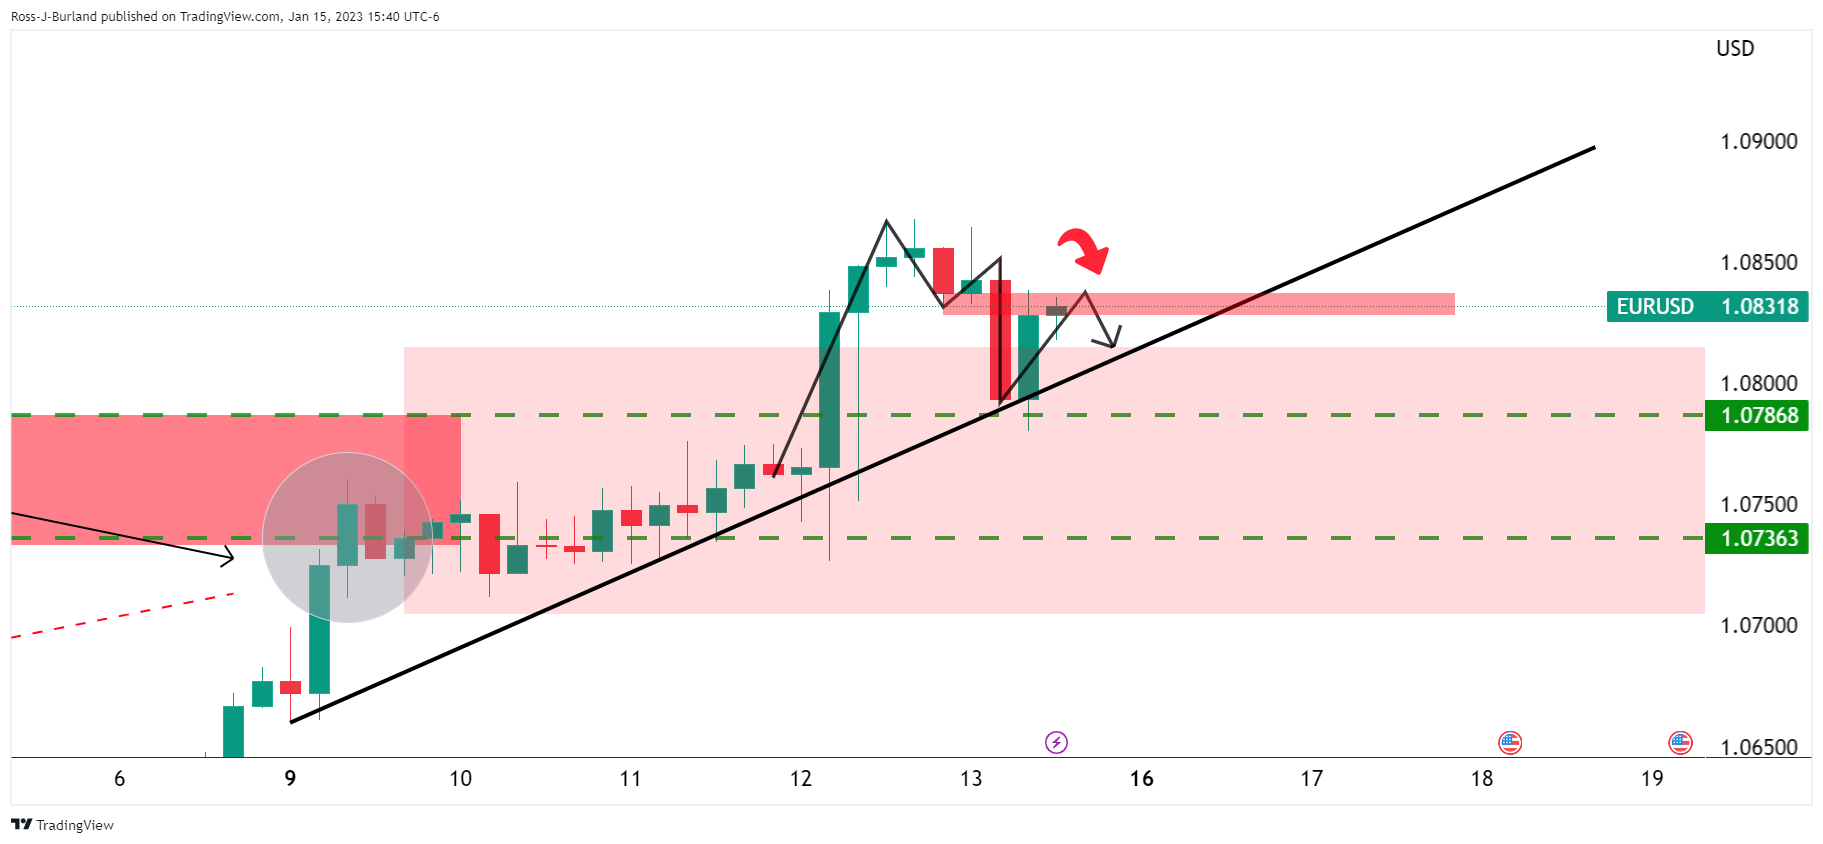
The M-formation is compelling in this regard. the neckline needs to hold for the open this week to reaffirm the bearish bias and prospects of a break of the trendline and downside potential for the week ahead.
-
20:40
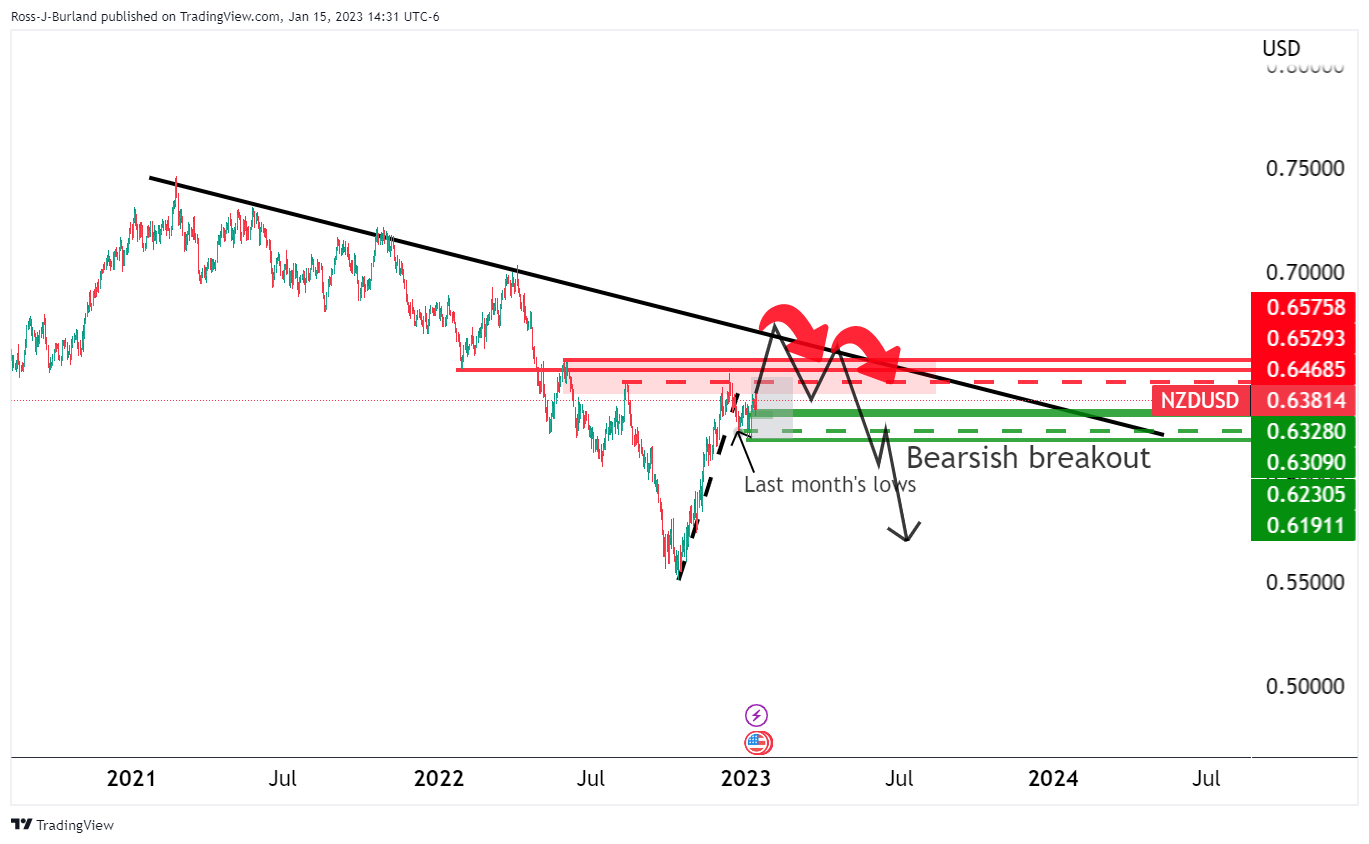
NZD/USD bulls in play with eyes on 0.6480
- NZD/USD near-term risks are balanced fundamentally.
- NZD/USD W-formation is bullish towards 0.6480 as a probable scenario for the days ahead to meet prior highs and a -61.8% ratio.
NZD/USD ended last week a touch soft and remains on the backside of the daily trend which leaves the outlook somewhat bearish for the week ahead, although there are prospects of a test of the highs, so all is to play for an open playing field. NZD/USD was losing some 0.15% by the close and fell from a high of 0.6415 to a low of 0.6335.
''In the context of the past few weeks, ranges were confined and some catalyst (NZ Consumer Price Index next week?) is likely needed to see a major breakout,'' analysts at ANZ Bank said in a note to start the week.
''Local markets have swung back to pricing broadly even odds of either a 50bp or 75bp Reserve Bank of New Zealand hike next month; that leaves near-term risks more balanced,'' the analysts argued.
For the week ahead, the analysts say the focus is on REINZ house prices. ''If they are soft, that might feed the “shock value” thesis and keep downward pressure on local rate-hike expectations, and by extension, the Kiwi.''
NZD/USD technical analysis
While being on the backside of the daily bullish impulse and trend, there are still prospects of a move into the trendline resistance. This could act as the final push before a major bearish breakout:
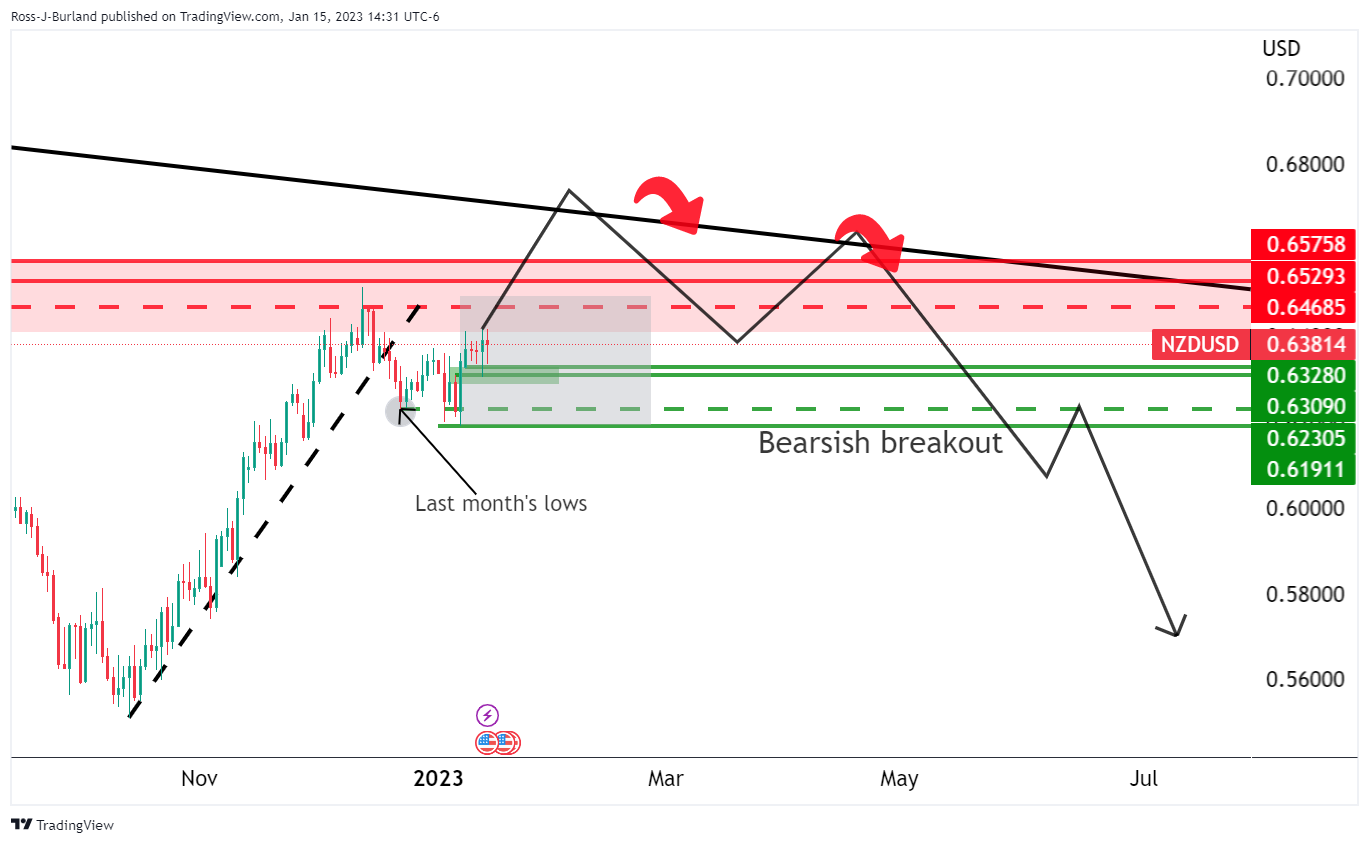
Zoomed in further...
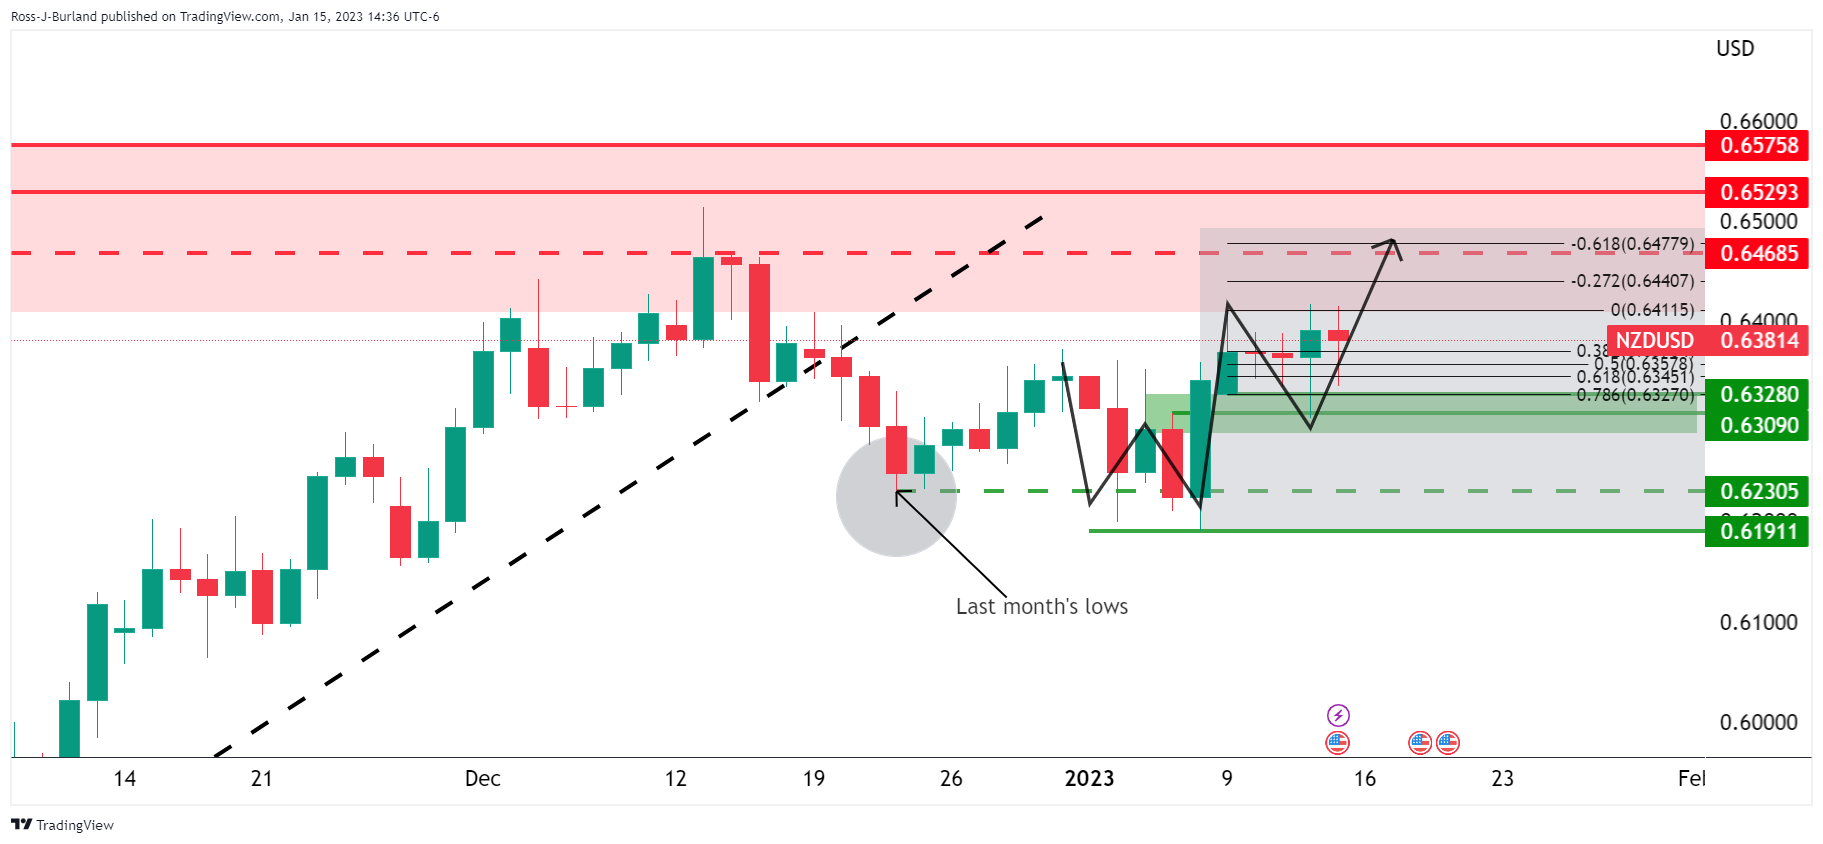
The W-formation is bullish and the fact that the price broke the monthly lows, breakout traders were trapped and the upside towards 0.6480 is a probable scenario for the days ahead to meet prior highs and a -61.8 ratio.
-
20:09
AUD/USD Price Analysis: Bullish breakout on the cards or have we seen the highs?
- AUD/USD bulls in control but there is a case for both the bulls and bears at this juncture.
- A break through the 0.6880s opens risk to 0.7050 and 0.7090 while a break below 0.6950 opens risk of a move to 0.6870.
It's been a roller coaster of a ride to start the year and AUD/USD has been one of the most volatile love the past week, driven on fundamentals, both home and away. Nevertheless, the schematic is arguably bearish but there needs to be a break of 0.6870 to confirm the downside bias. Therefore, bulls are going to be looking for a drive through 0.7000 for the initial balance for the week as the following illustrates:
AUD/USD H4 chart
Firstly, a bearish outlook and schematic could be drawn as follows:
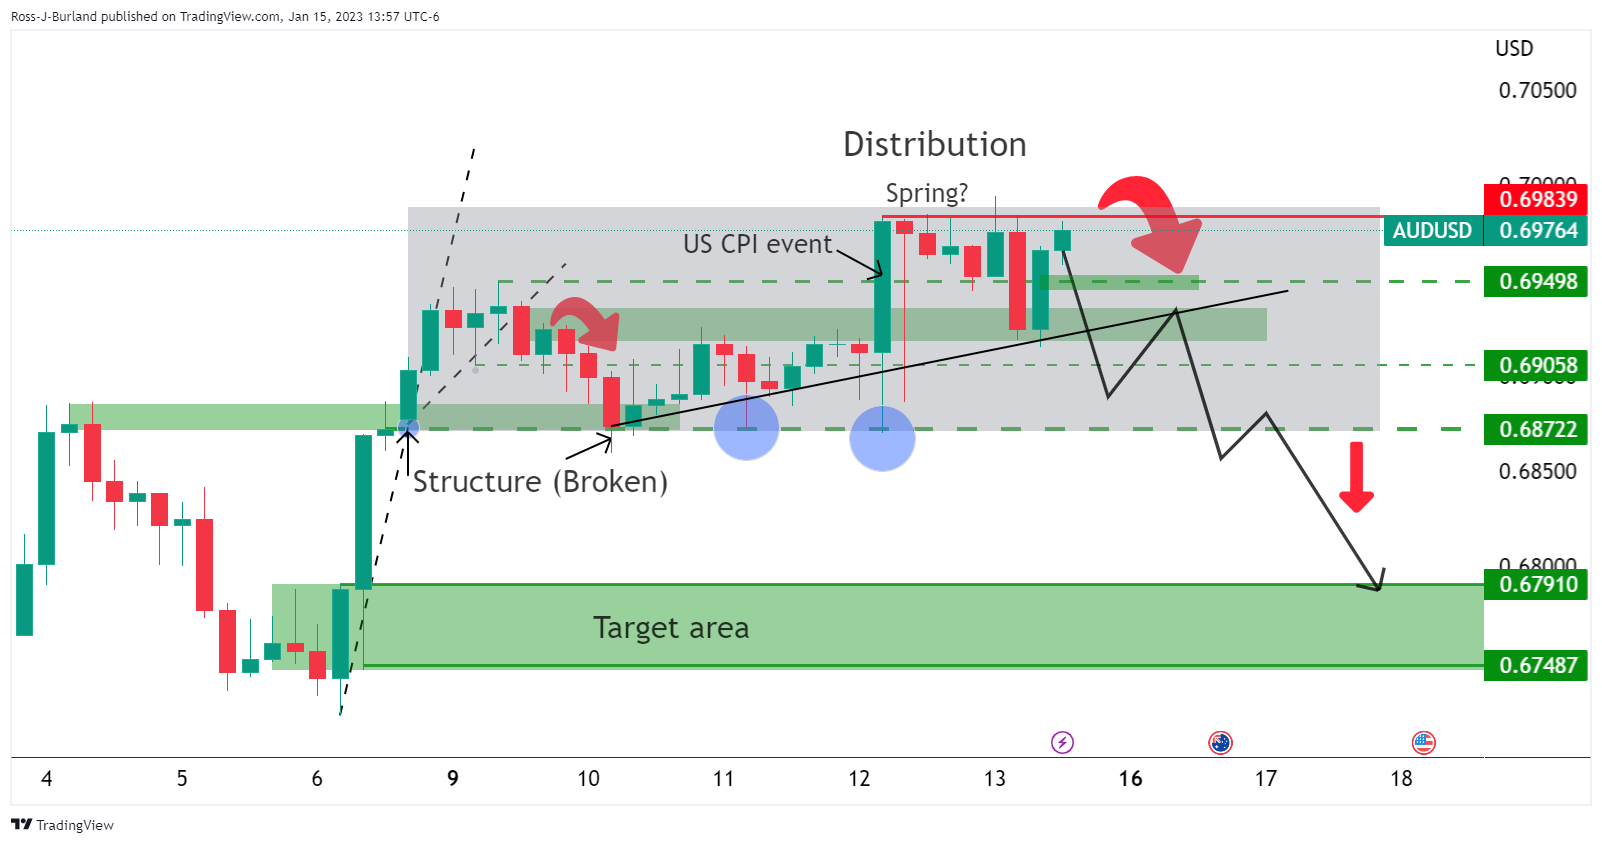
On a break of 0.6950, the trendline support could come under pressure in the coming sessions and if it were to give way, 0.6900 stops could trigger a slide towards 0.68 and below if 0.6870 breaks.
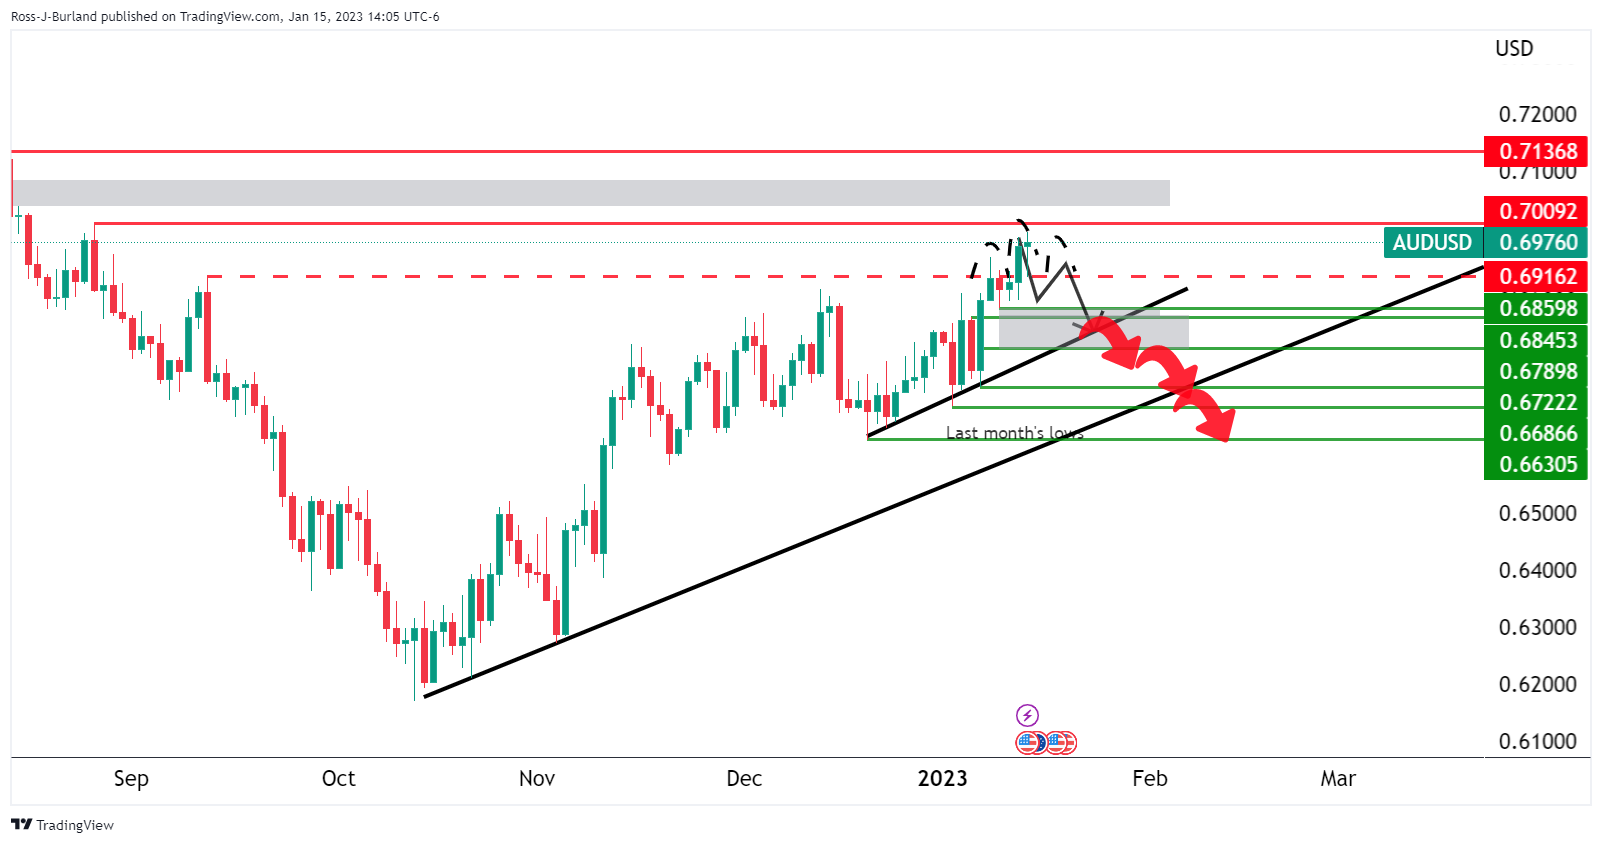
This falls in line with a bearish daily chart thesis:
AUD/USD upside bias, H4 chart
On the upside, an inverse head and shoulders could be forming:
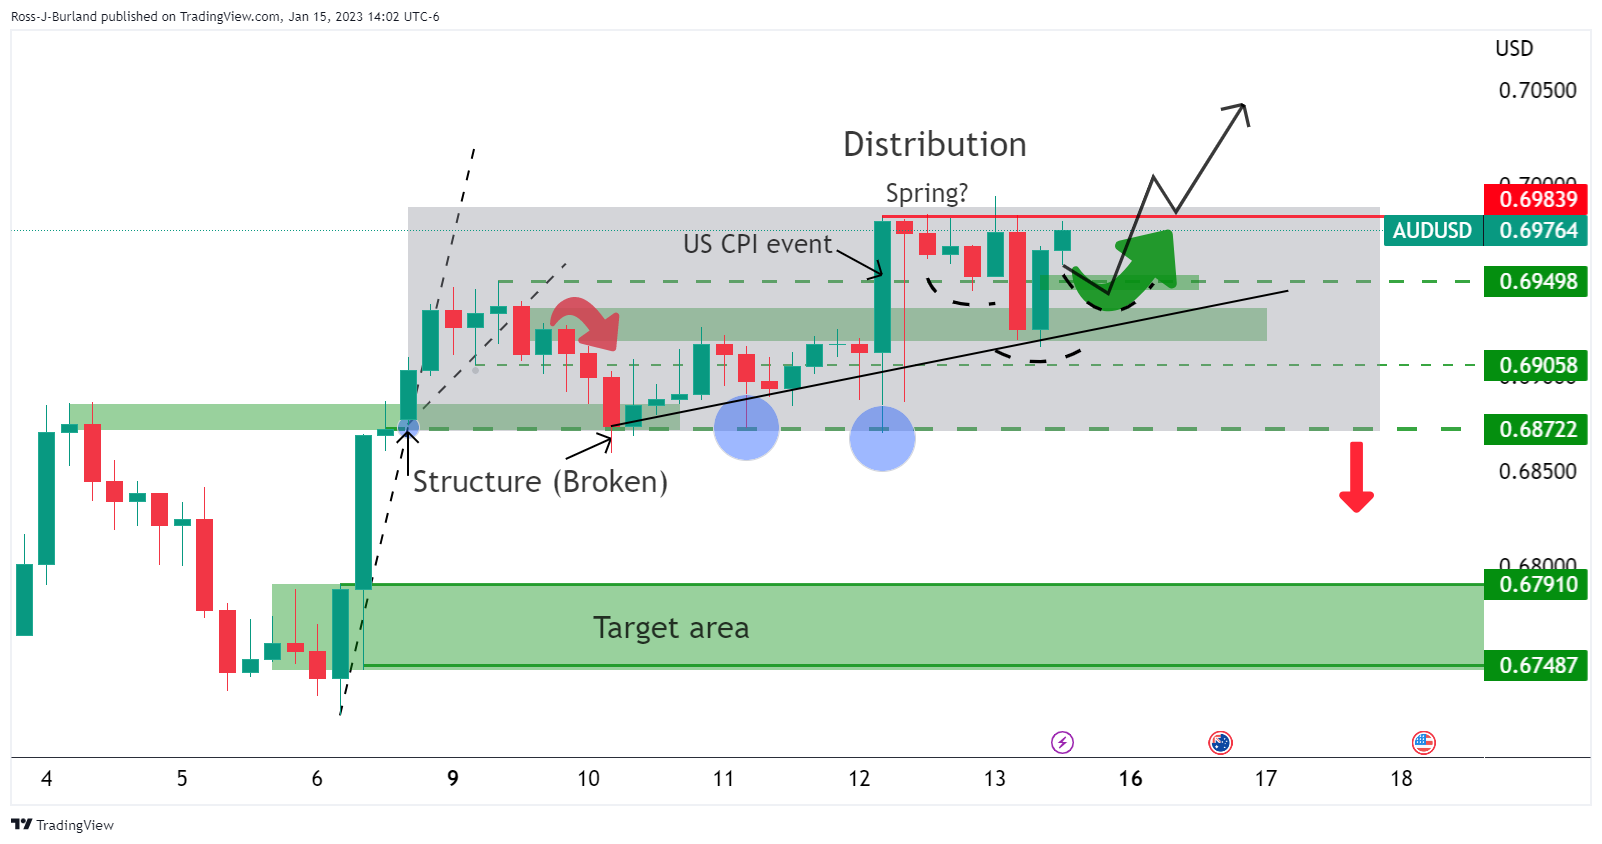
A break through the 0.6880s opens risk to 0.7050 and 0.7090 for sessions ahead, in line with the bullish trend.
-