Notícias do Mercado
-
23:50
Japan Producer Price Index (YoY) came in at 0%, above forecasts (-0.3%) in December
-
23:50
Japan Producer Price Index (MoM) registered at 0.3% above expectations (0%) in December
-
23:30
Australia Westpac Consumer Confidence: -1.3% (January) vs previous 2.7%
-
23:10
Fed's Bostic: US progress on inflation is likely to slow
Atlanta Federal Reserve (Fed) President Raphael Bostic said on the weekend that inflation could "see-saw" if policymakers cut interest rates too soon, warning that inflation's descent towards the central bank's 2% goal was likely to slow in the months ahead, per the Financial Times.
Key quotes
“Some risks that inflation may stall out altogether.”
“Inflation must be firmly and surely getting back to our 2 percent target.”
“It would be a bad outcome if we started to ease and inflation started to rise up and down like a see-saw. That would undermine people’s confidence in where the economy is going.”
“Markets hear what we are saying—our projections for rate cuts have been pretty clear.”
“It will be very interesting to see to what extent the Middle East conflict and attacks on the container ships are starting to show up in the cost structure for businesses in my district.”
“If we look at our employment mandate, we’re hitting that very firmly today.”
"But that is not the case for price stability.”
“There are signs underneath the hood that some segments of the economy have weakened.”
“Today we haven’t really seen any movements in money markets that suggest we’re close to a scenario where we don’t have ample reserves anymore.”
“Clearly at some point, there’s going to be a signal that we’re going to get closer to that threshold, and we’re going to have to do some thinking.”Market reaction
The US Dollar Index (DXY) is trading higher on the day at 102.60, as of writing.
-
22:57
AUD/USD remains on the defensive above 0.6650 amid the risk-off tone, renewed US Dollar demand
- AUD/USD remains under pressure near 0.6660 amid the risk-off mood.
- Fed’s Bostic said rates would need to remain on hold until after the summer.
- Australian TD Securities inflation arrived at 5.2% YoY in December vs. 4.4% prior.
- Investors await the Australian Westpac Consumer Confidence for January and the US New York Empire State Manufacturing Index on Tuesday.
The AUD/USD pair extends its downside above the mid-0.6600s during the early Asian session on Tuesday. The risk-off tone across markets lifts the safe-haven US Dollar (USD) and weighs on the pair. At press time, AUD/USD is trading at 0.6660, up 0.02% on the day.
Atlanta Federal Reserve (Fed) president Raphael Bostic believes the interest rate needs to stay on hold until at least summer to prevent prices from rising again. Bostic added that inflation could “see-saw” if policymakers start to ease too soon, warning that the decline towards the central bank's 2% target was likely to slow in the months ahead.
Concerns regarding geopolitical risks dominated the sentiment of market participants. According to the US Central Command, a US-owned and operated container ship on Monday was struck by an anti-ship ballistic missile from Houthi-controlled areas of Yemen. It comes only days after the United States and the United Kingdom launched joint strikes against Houthi targets in Yemen.
On the Aussie front, the Australian TD Securities inflation came in at 5.2% YoY in December from 4.4% in November. Meanwhile, the ANZ Job Advertisements grew 0.1% MoM from a 5.1% fall in the previous reading.
On Monday, the People's Bank of China (PBoC) surprised the market by maintaining the rate on its medium-term facility steady at 2.5%. This has increased anticipation that the Reserve Requirement Ratio will be reduced the following month.
Traders will focus on the Australian Westpac Consumer Confidence for January and the US New York Empire State Manufacturing Index, due later on Tuesday. Additionally, FOMC C. Waller is set to speak. Market players will take cues from the data and find trading opportunities around the AUD/USD pair. -
22:48
EUR/JPY Price Analysis: Turns bullish with buyers eyeing 160.00
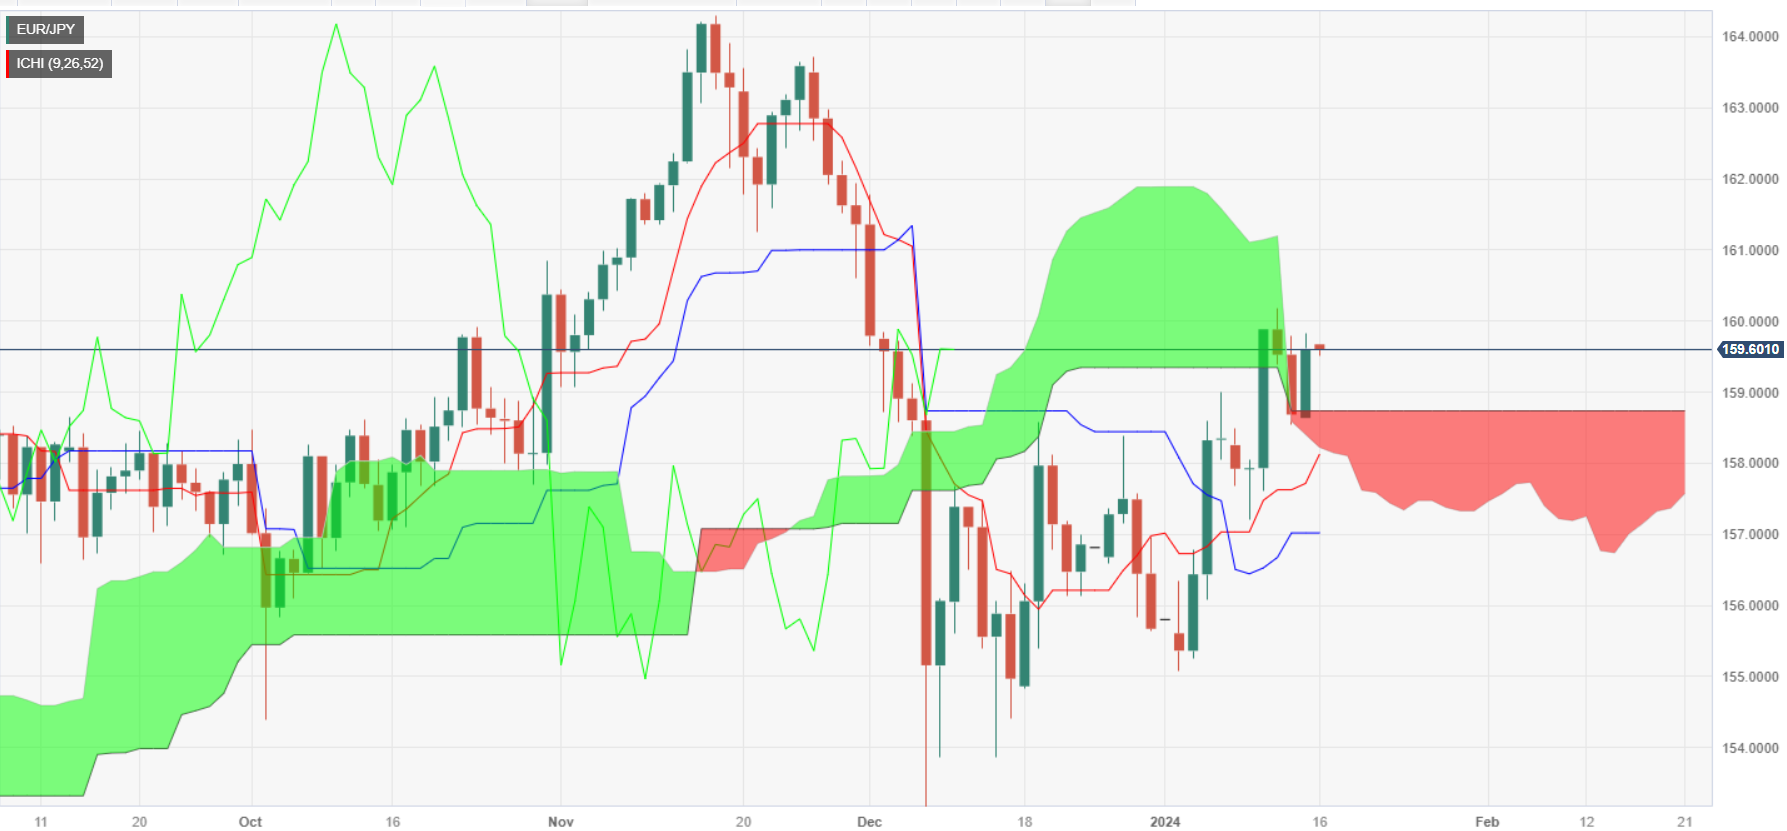
- EUR/JPY's rise above Ichimoku Cloud indicates a bullish shift, with a focus on overcoming the 160.00 barrier.
- Next resistance targets include January 11 high at 160.18 and November 21 low at 161.25.
- Downside risk persists if EUR/JPY fails to breach 160.00, opens the door to challenge key support levels at 158.71, 158.12 and 157.57.
The EUR/JPY rose above the Ichimoku Cloud (Kumo), turned bullish on Monday, and gained some 0.63% after hitting a daily low of 158.58. As the Asian session begins, the pair trades at 159.58 is virtually unchanged, loses 0.02%.
The daily chart depicts the cross-pair is bullish and would face stir resistance at around the 160.00 figure. A breach of the latter would expose the January 11 high of 160.18, followed by the November 21 daily low turned resistance at around 161.25.
On the other hand, if sellers stepped in and kept the EUR/JPY exchange rate below 160.00, that could pave the way for further losses. The first support would be the Senkou Span B at 158.71, followed by the Tenkan-Sen at 158.12. Further downside is seen at the Senkou Span A at 157.57.
EUR/JPY Price Action – Daily Chart
EUR/JPY Technical Levels
-
22:02
NZD/USD declines on Monday, falls back into 0.6190 in early week action
- The Kiwi backslid to kick off the new trading week.
- Risk appetite favored the US Dollar on Monday despite US market holiday.
- Asia market sees China GDP, Retail Sales figures due on Wednesday.
The NZD/USD skidded back into near-term lows on Monday, falling through the 0.6200 handle as the Kiwi (NZD) sold off against the US Dollar (USD) in a broad-market Greenback bid as markets rebalanced with US markets shuttered in observance of Martin Luther King Day.
Antipodean traders will be keeping an eye out for China’s headline data prints on Wednesday, with Chinese Gross Domestic Product (GDP) and Retail Sales figures slated for early in the mid-week trading session.
China’s fourth-quarter GDP is forecast to increase from 4.9% to 5.3% for the year ended December, while annualized Retail Sales through December are expected to hold flat at 6.6%. QoQ China GDP is expected to settle from 1.3% to 1.0%.
New Zealand’s NZIER QoQ Business Confidence Survey rebounded in December but still printed negative, coming in at -2% compared to the previous quarter’s -52%. The NZIER Business Outlook has printed in negative territory since July of 2021.
NZD/USD Technical Outlook
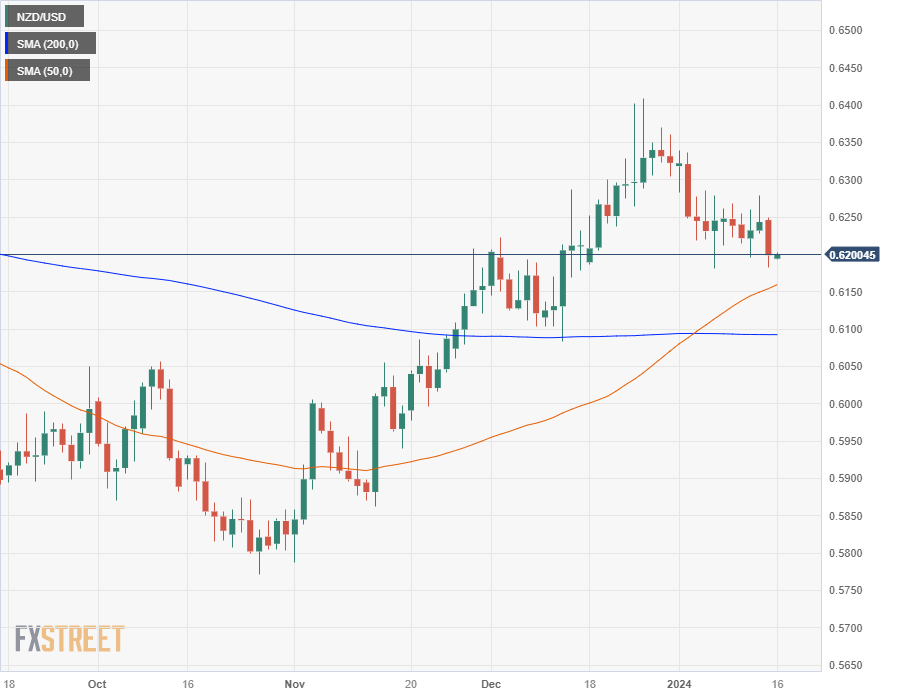
The Kiwi broke into the low side of a rough consolidation range that has plagued the NZD/USD since declining into the current chart range at the outset of 2024’s trading, testing back into the 0.6200 handle.
Monday’s backslide brings the NZD/USD closer to a technical floor at the 50-day Simple Moving Average (SMA) near 0.6150, with a bullish crossover of the 200-day SMA providing a possible bottom of near-term bearish momentum from the 0.6100 handle.
NZD/USD Hourly Chart

NZD/USD Daily Chart
NZD/USD Technical Levels
-
21:54
AUD/JPY Price Analysis: Climbs above 97.00 amid risk aversion
- AUD/JPY's gains defy typical risk aversion impact, supported by fading expectations of BoJ policy normalization.
- Technical indicators signal bullish trend; immediate targets include 97.79, 98.00, and November 30 high at 98.10.
- Downside risks for AUD/JPY include potential supports at 96.41 (Senkou Span A), 96.14 (Senkou Span B), and the 96.00 level.
The Aussie Dollar (AUD) prints gains versus the Japanese Yen (JPY) on Monday amid a risk aversion environment, which usually is a headwind for the AUD/JPY pair. Nevertheless, Japanese data revealed during January has brushed away the chances for the Bank of Japan (BoJ) to normalize policy, meaning higher interest rates. Therefore, the AUD/JPY trades at 97.08, gains 0.27%.
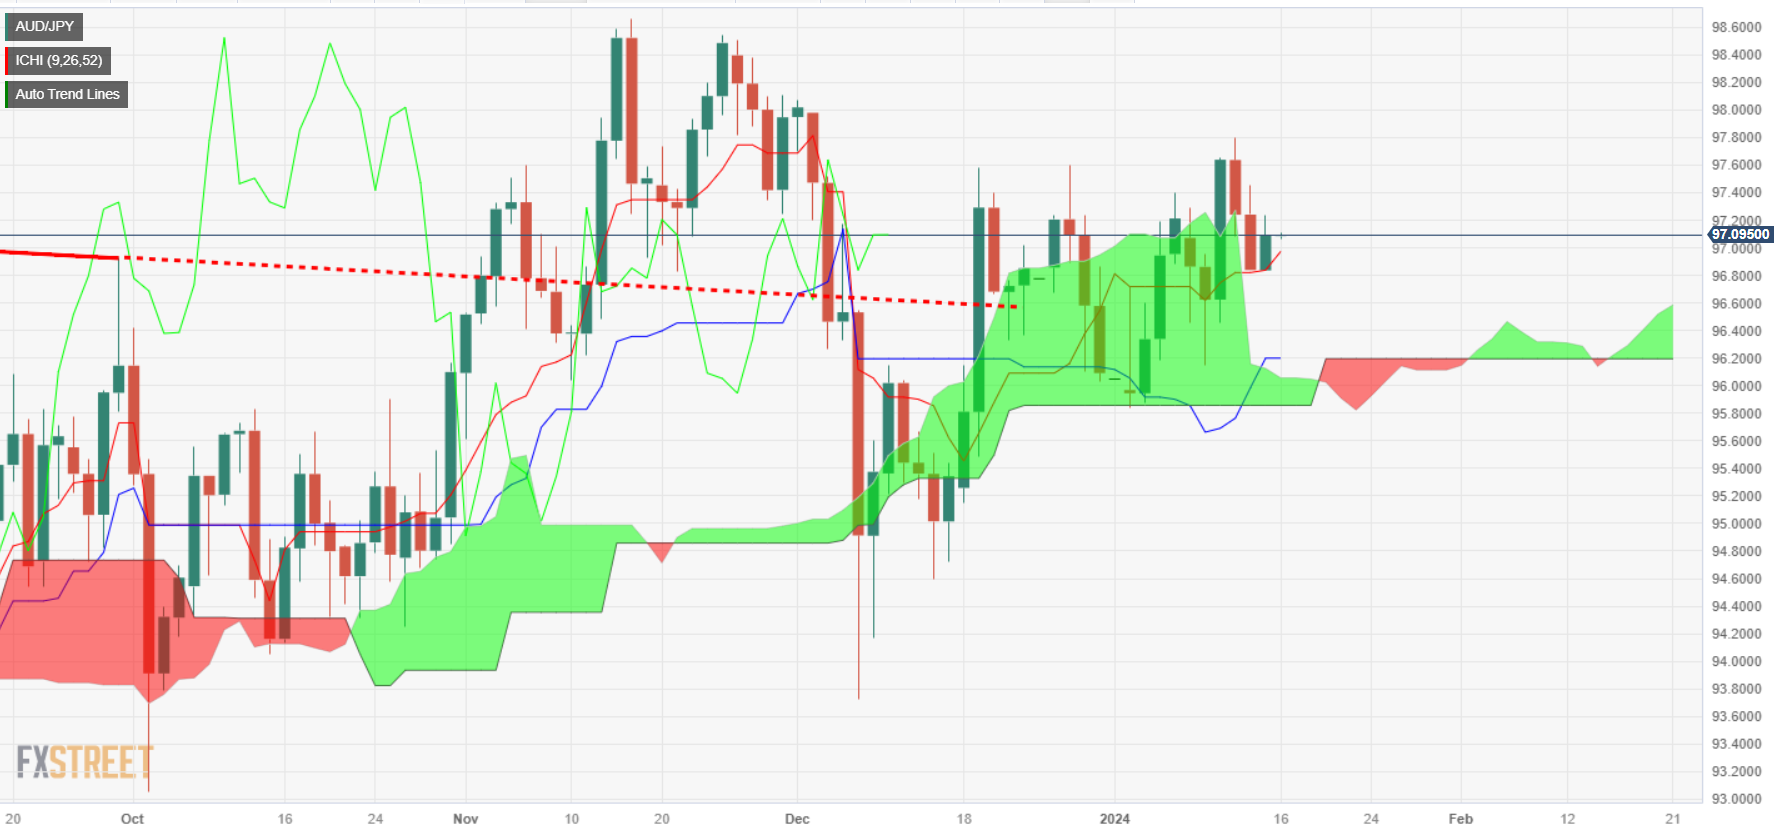
From a technical perspective, the AUD/JPY turned bullish as the Chikou Span has broken above price action in the daily chart. That, alongside the exchange rate seen above, the Ichimoku Cloud (Kumo), has opened the door for further gains, though traders must regain key resistance levels on their way north.
The first supply zone would be the January 11 high of 97.79, followed by the 98.00 figure, and the November 30 mark 1t 98.10. Further upside is at 98.58, the November 15 high.
On the other hand, if sellers would like to drag prices below 97.00. Once cleared, the next support would be the Senkou Span A at 96.41, followed by the Senkow Span B at 96.14, followed by the 96.00 figure.
AUD/JPY Price Action – Daily Chart
AUD/JPY Key Technical Levels
-
21:49
New Zealand NZIER Business Confidence declines 2% in 4Q 2023
The New Zealand Institute of Economic Research (NZIER) released their quarterly Business Confidence indicator for the fourth quarter of 2023, showing another 2% decline in headline business sentiment, though the figure represents a significant improvement from the previous quarter's -52%.
Key highlights
10% of firms expect a worsening of overall economic conditions, a significant decrease from the previous quarter's 49% negative outlook and 79% net negative the same time last year.
6% of surveyed firms reported an increase in trading activity on a seasonally-adjusted basis.
December's quarterly survey revealed an overall decline in labor shortages, owing to net migration inflows following the reopening of international borders.
Inflation indicators point to less firms reporting higher costs and increasing prices QoQ.
44% of surveyed firms expect an uptick in retail activity looking forward.
Manufacturing and services sectors remain downbeat overall.
Market reaction
The NZD/USD is trading into the 0.6200 handle in early Thursday trading after slumping to 0.6183 on Monday.
About New Zealand's NZIER Business Confidence
The NZIER Business Confidence released by the New Zealand Institute of Economic Research shows the business outlook in New Zealand. The Business Confidence allows analysis of economic situation in the short term. Increasing numbers indicates increases in business investment that lead to higher levels of output. Thus, a high reading is seen as positive (or bullish), while a low reading is seen as negative (or bearish).
-
21:39
NZD/JPY Price Analysis: Bears gains ground with eyes on 20-day SMA
- The NZD/JPY saw a minor decline to 90.35 and eyes the 20-day SMA at 89.90.
- Daily chart indicators reveal that sellers have a slight upper hand in the short term.
- Despite bearish indicators, the overall trend is still bullish.
In Monday's session, NZD/JPY experienced a slight drop to 90.35 following losses from its daily high at 90.55. With the daily chart establishing a neutral to bullish prospect, the bears are nevertheless gaining ground as the buyer's momentum remains weak. The four-hour chart indicators also remain in the red zone.
Given the current positioning within the daily time frame, the indicators reflect that the buying momentum is dominant when considering the overall trend indicated by the pair's positioning above the 20, 100, and 200-day Simple Moving Averages (SMAs). However, the Relative Strength Index (RSI) and the Moving Average Convergence Divergence (MACD) show that the momentum in the short term is waning and that bears are gaining traction.
While the broader picture carries an overall upward bias, the short-form charts tell a different story. Considering the four-hour chart, the selling pressure is gaining some ground progressively. With indicators situated within the negative terrain, the four-hour RSI is trending down while the four-hour MACD prints red bars, further reinforcing the short-term downward bias. The change in momentum on the shorter-term charts might be an early sign that the bulls are losing strength, allowing the bears to slowly take over.
NZD/JPY technical levels
NZD/JPY daily chart
-638409514888501360.png)
-
21:12
European equities decline as heads of state kick off global Davos meet-and-greet
- European stocks broadly shed value on Monday, STOXX600 falls half a percent.
- Euro area Industrial Production fell once again in November.
- Rate movement hopes from the ECB continue to run into a hard wall from officials.
European shares broadly declined and major equity indexes shed weight to kick off the new trading week, walking back Friday’s gains.
With US markets shuttered for the Martin Luther King Day holiday, European shares backslid after euro area Industrial Production in December fell in-line with market forecasts at -0.3%, better than the previous period’s -0.7% but still another decline as economic conditions within Europe continue to deteriorate.
Germany’s Real Gross Domestic Product (GDP) Growth contracted by -0.3% in 2023, compared to the average yearly gain of 1.2% (2012 - 2022), adding further fuel to the fire and dragging the German DAX down half a percent on Monday.
European Central Bank (ECB) officials continue to talk down market expectations of rate cuts from the ECB as policymakers grapple with still-high inflation and wage pressures that make it difficult to justify rate cuts.
ECB officials and several euro area heads of state headed to Davos, Switzerland to kick off the World Economic Forum hosted at a luxury ski resort this week, which runs January 14 through 19.
This year’s WEF summit in Davos is titled “Rebuilding Trust”, and is set to focus on conversation topics including global trade, inflation, supply chains, AI technology, and Middle East geopolitical tensions.
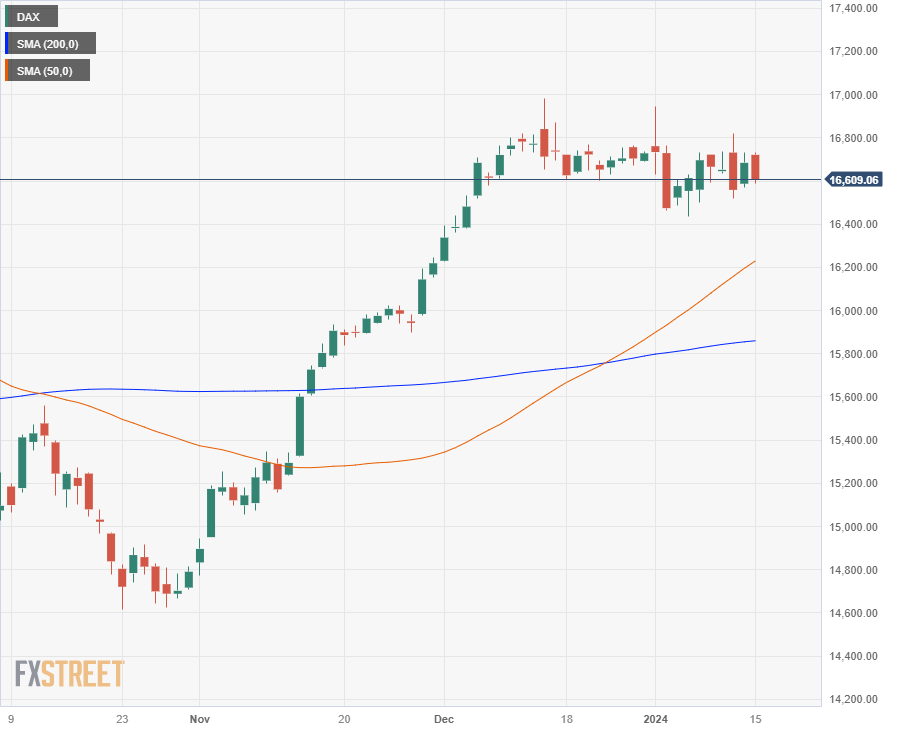
The EUROSTOXX600 major equity index declined nearly 0.55% on Monday, falling 2.578 points to end at €474.19, while Germany’s DAX index shed 0.49% to end the day down 82.34 points at €16,622.22. France’s CAC 40 lost 53.46 points to close down 0.72% at €7,422.68, and London’s FTSE major index declined around 0.4% to end Monday’s trading at £7,594.91, down a hair over 30 points.
DAX Technical Outlook
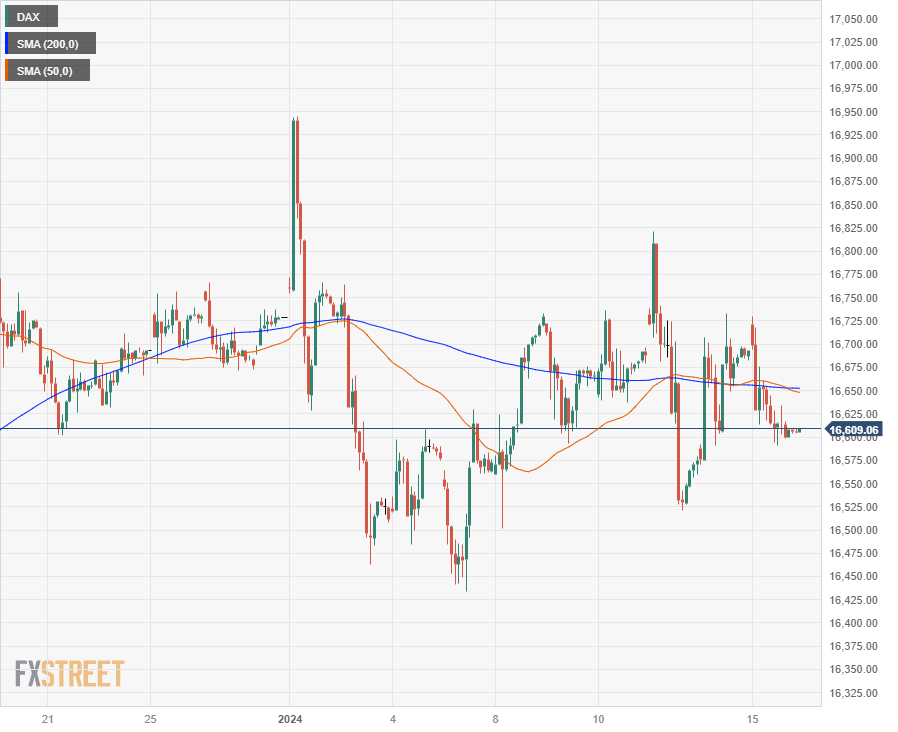
The DAX backslid on Monday, walking back Friday’s gains and sending Germany’s major equity index back below the 200-hour Simple Moving Average, (SMA), keeping German equities hamstrung in a consolidation pattern that has plagued the index since December and is beginning to see downside pressure mounting.
Despite struggling to find further topside momentum, the DAX remains deep inside bull territory after rebounding from October’s bottoms near €14,600, climbing nearly 14% and remaining within striking distance of new all-time highs at the €17,000 major price handle.
DAX Hourly Chart
DAX Daily Chart
DAX Technical Levels
-
21:00
South Korea Export Price Growth (YoY) climbed from previous -7.2% to -2.3% in December
-
21:00
South Korea Import Price Growth (YoY) increased to -4.1% in December from previous -8.5%
-
21:00
New Zealand NZIER Business Confidence (QoQ) increased to -2% in 4Q from previous -52%
-
20:24
Crude Oil struggles to pick a direction as geopolitical tensions and rebel attacks mire the outlook
- WTI cycles in red territory on Monday, stuck near $72.50.
- Crude Oil fundamentals continue to soften, global production continues unabated.
- Houthi rebels continue to hamper supply lines between Europe and Asia.
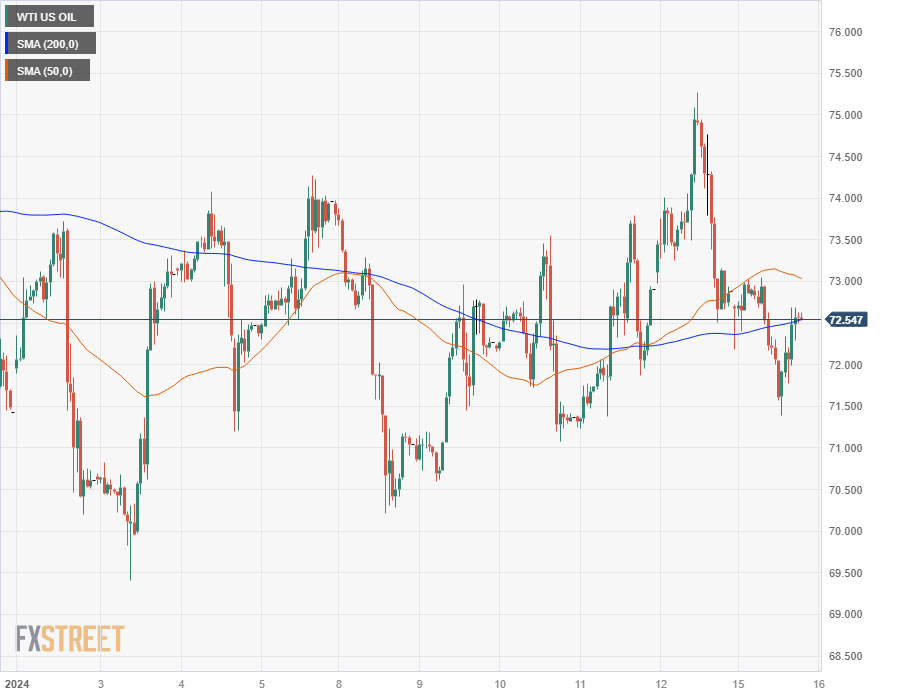
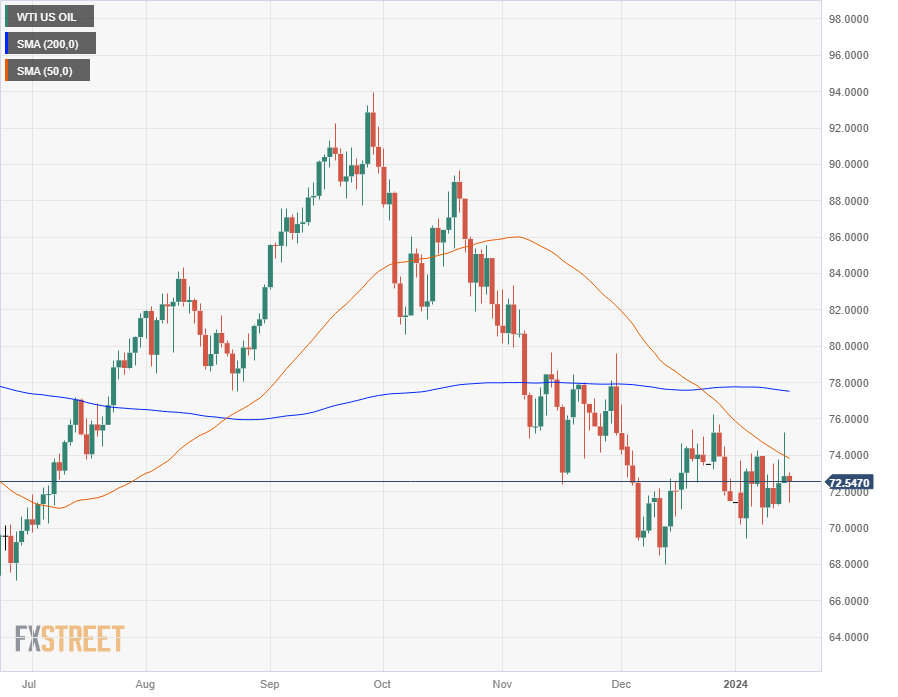
West Texas Intermediate (WTI) US Crude Oil saw weakness in early Monday trading, falling to a near-term low of $71.40 before rebounding to $72.50 following a fresh rocket attack on a civilian cargo ship by Iran-backed Houthi rebels in Yemen. The Houthis, a religious extremist organization with strong ties to Tehran, who recognize the Houthis as the official Yemeni government.
Ongoing energy market concerns continue to fret about potential supply chain disruptions, and the potential for production cuts from the Organization of the Petroleum Exporting Countries to take a bite out of global energy markets’ ability to meet fossil fuel demand, but record Crude Oil production from key non-OPEC countries such as the US and a massive buildup in petroleum gasoline and other Crude Oil derivatives are hampering barrel traders’ efforts to drive up Crude Oil costs.
The American Petroleum Institute (API) will be delivering their latest Weekly Crude Oil Stock counts for the week ended January 12th on Wednesday, followed by the Energy Information Administration’s (EIA) Natural Gas Storage and Crude Oil Stocks Change on Thursday.
WTI Technical Outlook
US Crude Oil has seen rough intraday trading in 2024, with barrel prices cycling in a rough channel between $74.00 and $70.50 as near-term price action sticks close to the 200-hour Simple Moving Average (SMA) near $72.50.
Daily candlesticks have WTI consolidating on the south side of the 200-day SMA at the $78.00 handle, with a descending 50-day SMA building out a technical ceiling and applying downside pressure to near-term price action from $74.00.
WTI Hourly Chart
WTI Daily Chart
WTI Technical Levels
-
20:09
GBP/JPY Price Analysis: Pierces Kumo as buyers’ eye 186.00
- GBP/JPY gathers steam as ‘bullish piercing pattern’ emerges, with buyers targeting 186.00 and beyond.
- The cross shifted bullish as buyers light exchange rate above the Kumo, with upside risks at 186.10, and 187.56.
- Potential downside risks lie at 184.47, followed by 183.49.
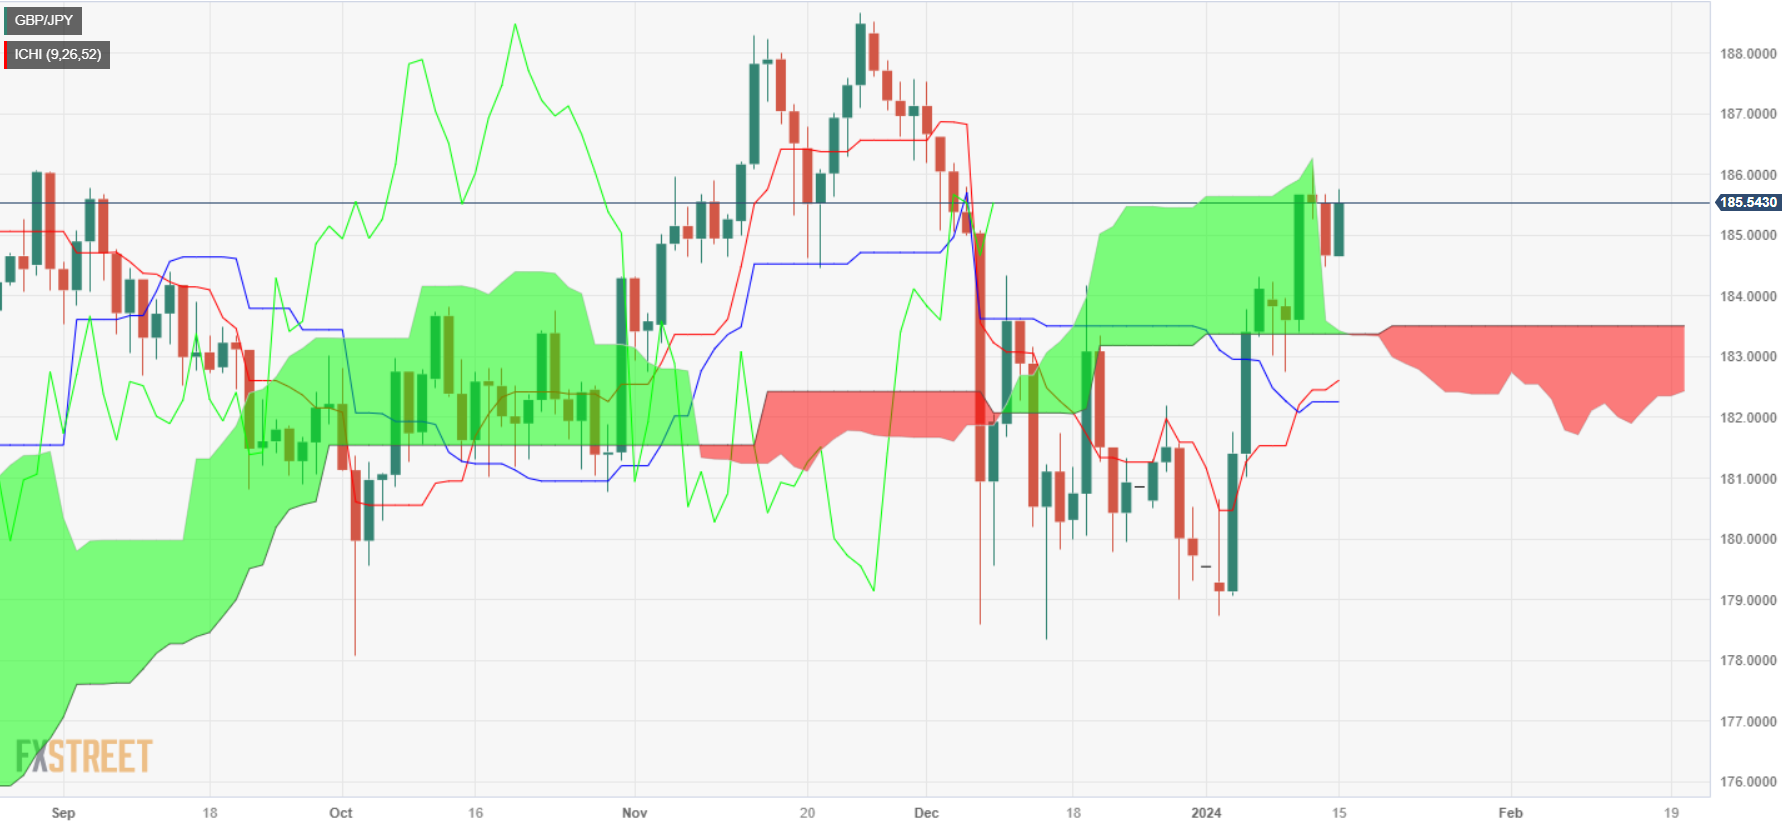
The GBP/JPY is up by 0.47% on Monday, though it remains reluctant to push above the 186.00 figure for the fourth straight day despite turning bullish. At the time of writing, the cross-currency pair is trading at 185.54 after hitting a daily low of 184.62.
The daily chart portrays the pair as having pierced above the Ichimoku Cloud (Kumo), opening the door for further gains. Besides that, the Chiou Span is about to cross above price action, which would be the second bullish signal, that could propel the GBP/JPY toward higher prices.
If buyers surpass the January 11 high at 186.10, that would pave the way for further upside. Once cleared, the next stop would be the November 30 swing high at 187.56, followed by the November 24 high at 188.66.
On the flip side, if GBP/JPY slides below the January 12 daily low of 184.47, that could put the uptrend in danger. If the cross hurdles that level, the next support would be the Senkou Span B at 183.49, followed by the Tenkan-Sen at 182.55, followed by the Senlo Span A at 182.39, and the Kijun-Sen at 182.25.
GBP/JPY Price Action – Daily Chart
GBP/JPY Technical Levels
-
20:06
Forex Today: Geopolitics dominated the headlines on Monday
Thin trade conditions due to the MLK holiday in the US and persevering geopolitical risks dominated the mood among market participants at the beginning of a new trading week. On the political front, the US election season kicked off with the Iowa caucus.
Here is what you need to know on Tuesday, January 16:
The firm demand for the greenback encouraged the USD Index (DXY) to add to Friday’s gains on the back of the resurgence of risk aversion bolstered by geopolitical concerns, particularly in the Middle East. The DXY has extended its consolidative theme in place since the beginning of the year. In the US, the New York Empire State Manufacturing Index is due on Tuesday along with a speech by FOMC C. Waller and short-term Bill Auctions.
EUR/USD managed to bounce off daily lows near 1.0930 and settled around the 1.0950 region amidst marginal gains and a decent rebound in German yields, while comments from ECB policymakers ruling out rate cuts in the near term supported the bounce in spot. In the meantime, Germany is expected to be at the centre of the debate on Tuesday with the releases of the final December CPI, the Economic Sentiment tracked by the ZEW Institute, and the speech by the Bundesbank’s J. Nagel.
GBP/USD kept its selling bias unchanged amidst the decent rebound in the greenback ahead of the publication of the key labour market report and the speech by BoE Governor A. Bailey.
In Japan, the release of Producer Prices should shed extra details on the inflationary scenario in the country, while USD/JPY managed to reverse two sessions of losses and revisit the proximity of the 146.00 barrier on Monday.
There seems to be no respite for the so-far yearly leg lower in AUD/USD, which keeps putting the key contention zone around 0.6650 to the test. Later in the Asian trading hours, Westpac will publish its monthly gauge of Consumer Confidence for the month of January.
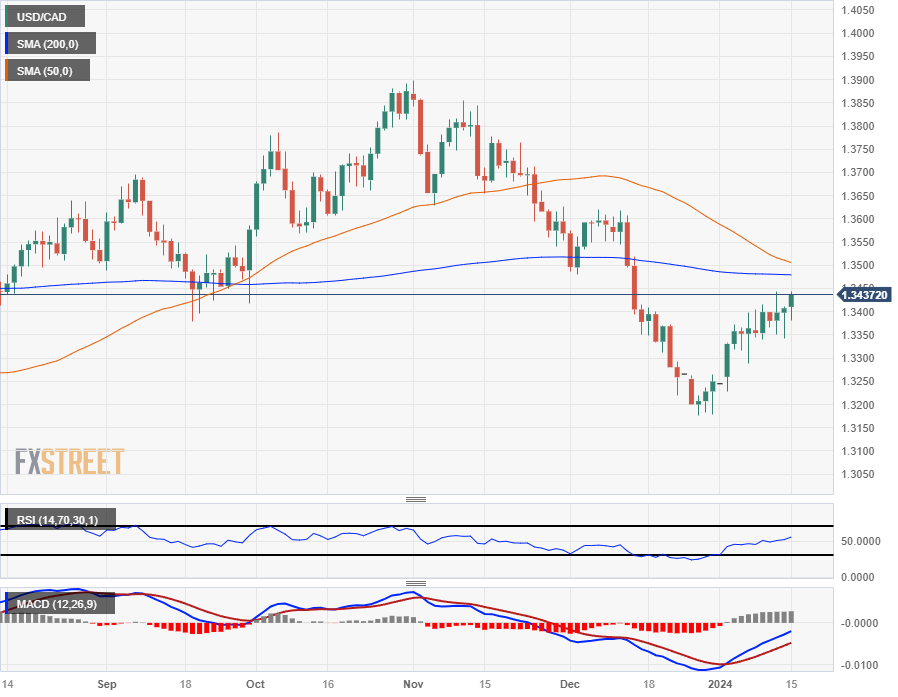
USD/CAD rose for the third session in a row, advancing to a new five-week high near 1.3450 amidst the risk-off-driven mood in the greenback, while the bearish tone in crude oil prices also favoured the selling bias in the Canadian Dollar. The latter is expected to take centre stage on Tuesday with the release of critical inflation figures for the month of December.
Modest gains in Gold and Silver appeared underpinned by the pick-up of geopolitical effervescence and its echo on the risk-off mood.
-
19:52
GBP/USD softens towards 1.2700 ahead of Tuesday’s UKJ labor figures, BoE Gov Bailey testimony
- GBP/USD slips back once again on Monday, dips into 1.2715.
- UK labor figures due on Tuesday.
- BoE Governor Bailey to testify on state of economy before UK Parliament.
The GBP/USD fell back once more on Monday, testing 1.2715 after a short-lived rally at the Modnay open reversed course. The Pound Sterling (GBP) couldn’t get over 1.2765 against the US Dollar (USD), sliding 0.4% peak-to-trough before consolidating in holiday-thinned market volumes during the US extended weekend in observance of Martin Luther King Day.
The UK’s Rightmove House Price Index rose 1.3% in January, compared to December’s -1.9%, while the annualized figure declined 0.7%, rebounding slightly from the previous period’s -1.1%. The MoM is a firm rebound in the headline figure, but still well below last May’s near-term peak of 1.8%.
Up next will be Tuesday’s UK Claimant Count Change, ILO Unemployment Rate, and Average Earnings for the annualized quarter ended in November.
December’s Claimant Count Change printed at 16K, while the ILO quarterly Unemployment Rate is forecast to hold steady at 4.2%. UK Average Earnings growth is expected to decline both with and without bonuses factored in, with Average Earnings Excluding Bonuses for the quarter through November expected to tick back from 7.3% to 6.6%.
Bank of England (BoE) Governor Andrew Bailey will be testifying before the Lords’ Economic Affairs Committee in London before departing to attend the World Economic Forum in Davos, Switzerland.
GBP/USD Technical Outlook
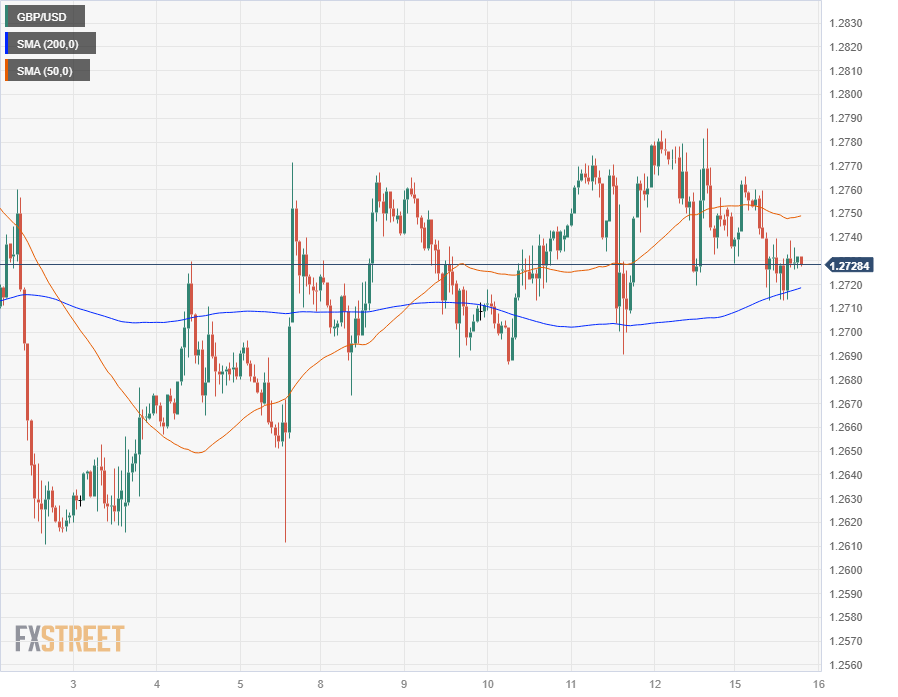
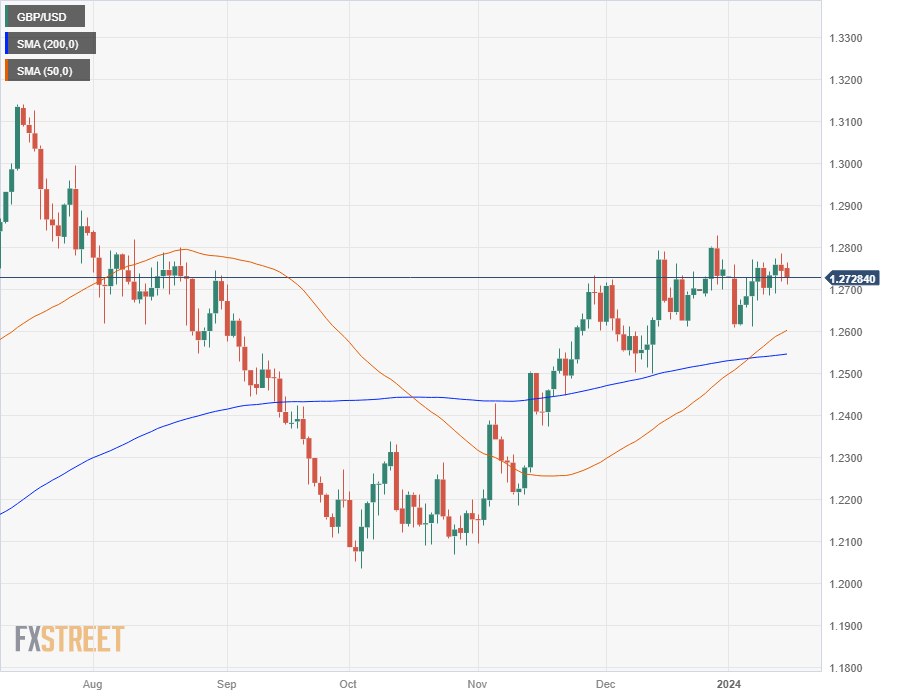
The GBP/USD is caught in a near-term sideways grind, with intraday prices getting caught up on the 200-hour Simple Moving Average (SMA) near 1.2720, while 1.2780 is proving to be a tricky technical ceiling for the pair to overcome.
Despite the pair stuck on the low side of the 1.2800 handle near December’s peak, the pair remains on the high end of momentum on daily candles, with the pair up 5.75% from October’s swing low of 1.2037.
GBP/USD Hourly Chart
GBP/USD Daily Chart
GBP/USD Technical Levels
-
19:45
Silver Price Analysis: XAG/USD advances amid reduced US yields, dovish Fed outlook
- The XAG/USD rose near the $23.20 level, challenging the 100-day SMA.
- Despite hot CPI data, the market maintains high dovish bets on the Federal Reserve.
- The 2-year bond yield hit fresh lows since May.
Starting the week, the Silver (XAG/USD) is seeing an uplift, trading around the $23.20 mark. The upward move is primarily driven by decreased US Yields and dovish expectations regarding the Federal Reserve (Fed), which have helped steer the metal upward.
Currently, data from the CME FedWatch Tool displays a high chance of interest rate reductions in March and May, calculated at 70% and 66%, respectively. It's worth noticing that the market’s dovish bets may be exaggerated as inflation in the US slightly picked up in December, and the US economy remains overheated, which may present a threat to the Fed in its battle against inflation. Investors may be discounting that the bank won’t risk an economic downturn in a year with elections.
Presently, US Treasury yields are sharply down. The 2-year rate is trading at 4.14%, whereas the 5-year and 10-year rates are observed at 3.83% and 3.96%, respectively. This pushes the price of the non-yielding metal up as the opportunity cost of holding them decreases.
On Wednesday, the US will release Retail Sales Figures from December and the Fed the Beige Book, which may affect the metal’s price dynamics..
XAG/USD levels to watch
The daily chart suggests that the metal has a bearish outlook in the short term despite the upward movements. From a technical perspective, the Relative Strength Index (RSI) is flat, indicating a lack of momentum in either direction. However, its position in the negative territory suggests that sellers have been more active recently.
The Moving Average Convergence Divergence (MACD), evidenced by flat red bars, signals a bearish bias. While the MACD itself is flat, indicating no strong momentum, the color of the histogram's bars reinforces the presence of sellers in the market.
The Simple Moving Averages (SMAs) further supplement the bearish narrative. The metal’s price is trading below the 20, 100, and 200-day SMAs, a prevailing indication that bears are in control of the bigger picture.
XAG/USD daily chart-638409447090028912.png)
-
19:26
USD/JPY climbs in light trading and faces resistance at around 146.00
- USD/JPY's ascent influenced by a stronger Dollar, with DXY up 0.15%, and market focus on Fed's monetary policy trajectory.
- Market estimates of significant Fed rate cuts in 2024 drive currency dynamics despite recent US inflation data.
- Upcoming Japanese and US economic releases, including Japan's PPI and the NY Fed Manufacturing Index, to provide further insights
The USD/JPY climbed late in the North American session on Monday amid low volume conditions as the United States (US) financial markets remained closed on Martin Luther King Day. Despite that, the Greenback (USD) remains strong across the board, as the USD/JPY exchanges hands at 145.79, up by 0.63%.
USD/JPY at the mercy of Fed’s rate cuts expectations
As mentioned above, the US Dollar Index (DXY); a gauge of the buck’s performance against a basket of six currencies including the Japanese Yen (JPY) climbs 0.15%, at 102.58, a tailwind for the USD/JPY. The lack of economic data released on the day keeps traders entertained with the Federal Reserve’s (Fed) prospects to relax monetary conditions via the Chicago Board of Trade (COT).
Interest rates market participants estimate the US Central Bank would cut rates by more than 170 basis points in the year, even though consumer prices rose above estimates and the prior readings. That was overshadowed by last Friday’s Producer Price Index (PPI), which witnessed an increase of more than 80% odds for a 25 bps cut in March.
Aside from this, the Japanese economic docket would feature the Producer Price Index for December, which is expected to show some deceleration, alongside the Reuters Tankan Index on Tuesday. On the US front, the economic docket would feature the New York Fed Empire State Manufacturing Index and a speech by US Federal Reserve Governor Christopher Waller. That comes ahead of Wednesday’s Retail Sales and Industrial Production.
USD/JPY Price Analysis: Technical outlook
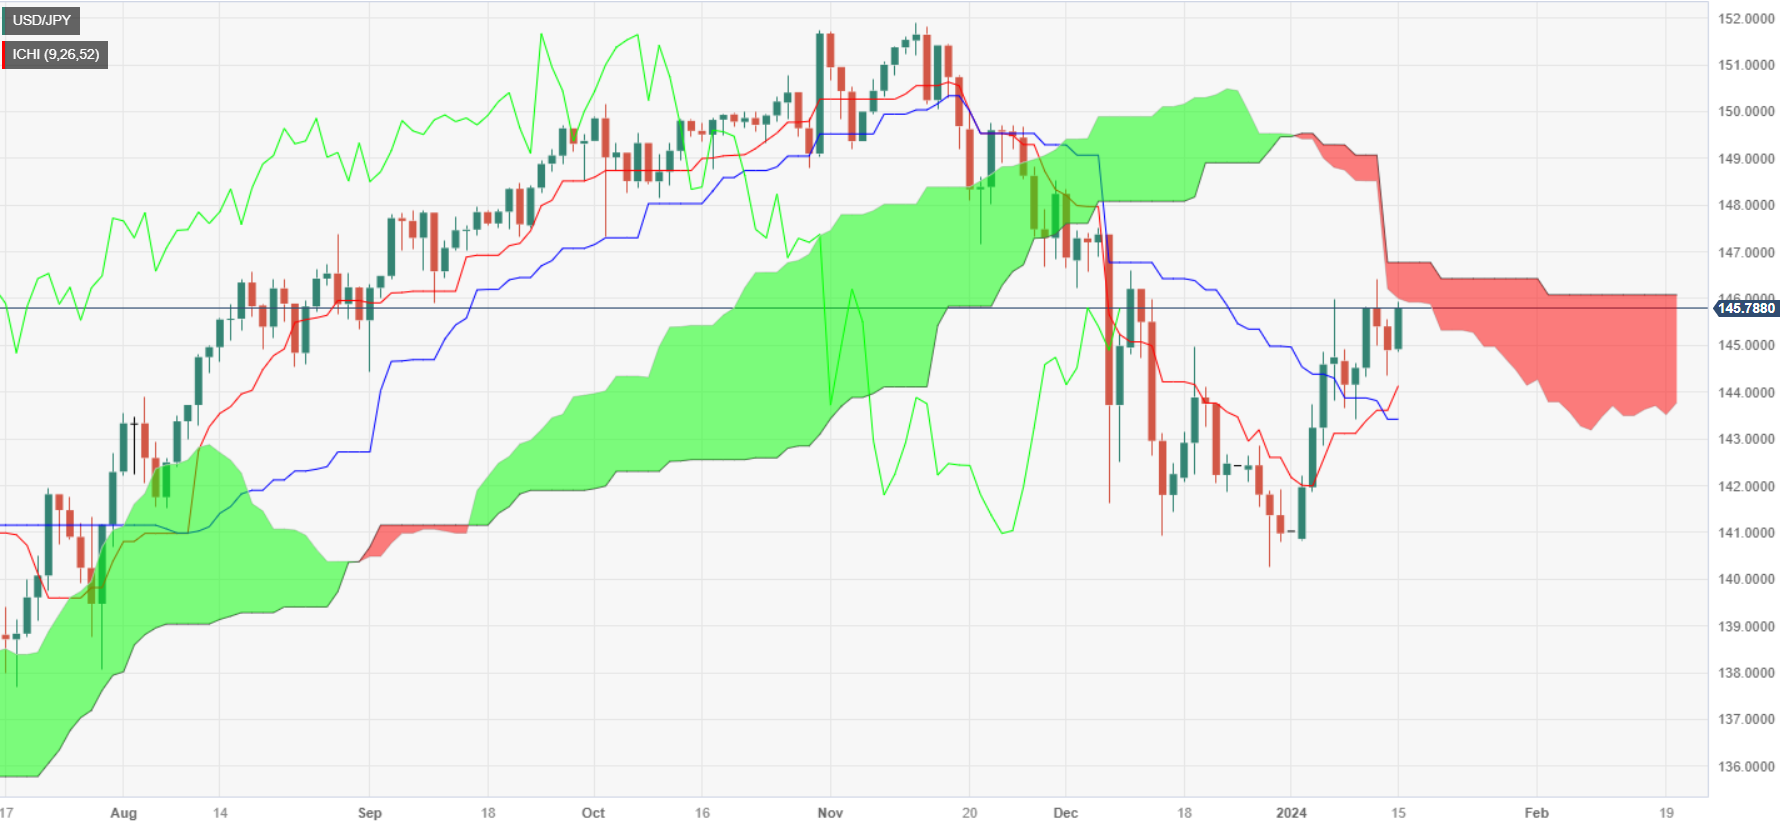
The daily chart portrays the pair at the brisk of shifting bullish, as the USD/JPY spot price is near the bottom of the Ichimoku Cloud (Kumo). A breach above the 146.00 figure and the Senkou Span B at 146.07 could pave the way for further upside at the top of the Kumo at 146.77, followed by the 147.00 figure. Once surpassed, the next resistance would emerge at 148.00. On the opposite front, sellers need to drag prices below the January 12 low of 144.34, which could pave the way toward 144.00, but firstly, it would face the Tenkan-Sen at 144.13.
-
18:58
Euro broadly higher on Monday, but holds steady against holiday-stricken Greenback
- The Euro is seeing gains across the major currency board amidst US market holiday.
- European Industrial Production declined in November, but it was still highest print in three months.
- ECB President Lagarde due to appear several times at Davos World Economic Forum.
The Euro (EUR) is in the green against its major currency pairs, taking top spot as one of the best-performing currencies in Monday trading. Despite broad-base recovery momentum behind the Euro, the US Dollar (USD) is giving only slim ground up to the EUR on Monday, with US markets shuttered in observance of Martin Luther King Day.
European Industrial Production declined again in November, but no less than market forecasts were expecting, and this week’s major data threat for EUR traders will be a smattering of appearances by European Central Bank (ECB) President Christine Lagarde at the World Economic Forum hosted in Davos, Switzerland.
Daily digest market movers: Euro wins the Monday market as it turns green across the board
- Euro is broadly higher against the rest of the major currencies for Monday trading.
- European Industrial Production in November declined as much as expected, hitting a three-month high of -0.3% compared to the previous month’s -0.7%.
- The unadjusted euro area Trade Balance rose to an eight-month high of €20.3 billion in November compared to the previous month’s €11.4 billion as declines in Imports outpace shrinking Exports.
- Intra-euro area trade also fell in November by 9.4% YoY.
- Final Harmonized Index of Consumer Prices (HICP) figures due on Wednesday.
- US Retail Sales data due in the mid-week, markets hoping for an uptick from 0.3% to 0.4% MoM in December.
- ECB President Lagarde due to make several appearances at the World Economic Forum in Davos.
- ECB President Lagarde will participate in a town hall titled “How to Trust Economics” on Wednesday, followed by Thursday’s "Uniting Europe's Markets" panel discussion.
- Friday rounds out President Lagarde’s appearances with her participation in another panel discussion titled “The Global Economic Outlook”.
Euro price today
The table below shows the percentage change of Euro (EUR) against listed major currencies today. Euro was the strongest against the New Zealand Dollar.
USD EUR GBP CAD AUD JPY NZD CHF USD -0.04% 0.06% 0.21% 0.44% 0.44% 0.51% 0.30% EUR 0.06% 0.12% 0.27% 0.48% 0.50% 0.58% 0.34% GBP -0.08% -0.11% 0.14% 0.37% 0.37% 0.45% 0.23% CAD -0.21% -0.24% -0.13% 0.23% 0.24% 0.31% 0.08% AUD -0.44% -0.47% -0.36% -0.22% 0.01% 0.09% -0.13% JPY -0.44% -0.48% -0.50% -0.23% 0.00% 0.08% -0.16% NZD -0.51% -0.56% -0.46% -0.31% -0.08% -0.08% -0.24% CHF -0.30% -0.33% -0.24% -0.09% 0.14% 0.14% 0.22% The heat map shows percentage changes of major currencies against each other. The base currency is picked from the left column, while the quote currency is picked from the top row. For example, if you pick the Euro from the left column and move along the horizontal line to the Japanese Yen, the percentage change displayed in the box will represent EUR (base)/JPY (quote).
Technical Analysis: Euro gains across the board, but EUR/USD remains tepid on Monday
The Euro (EUR) is in the green across the major currency bloc, gaining around six-tenths of a percent against the New Zealand Dollar (NZD) and half a percent against the Japanese Yen (JPY) and the Australian Dollar (AUD).
Momentum is notably thin for the Euro against the US Dollar, with the EUR/USD pair up a scant 0.05% on Monday.
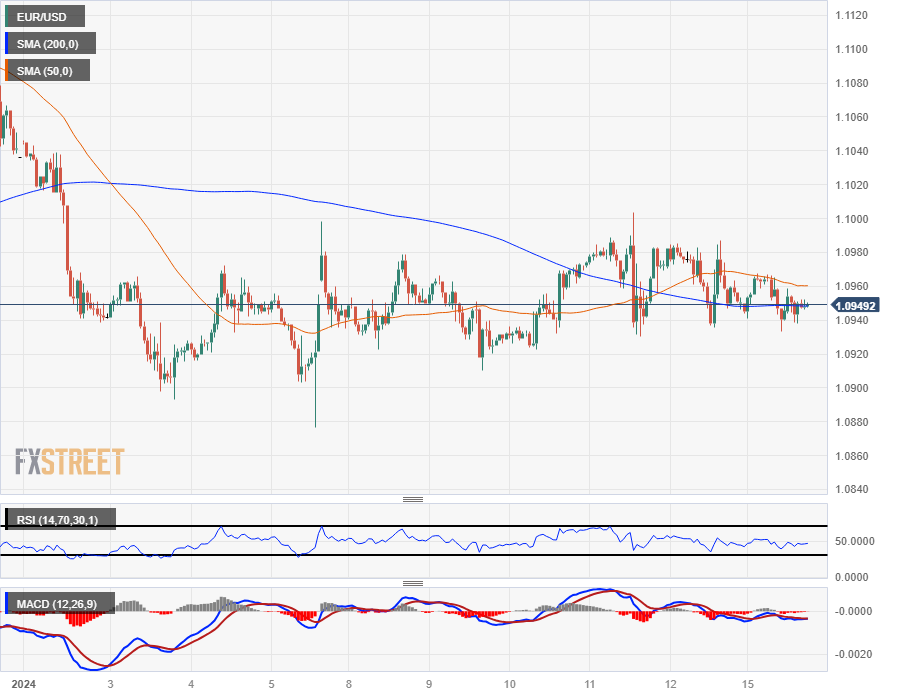
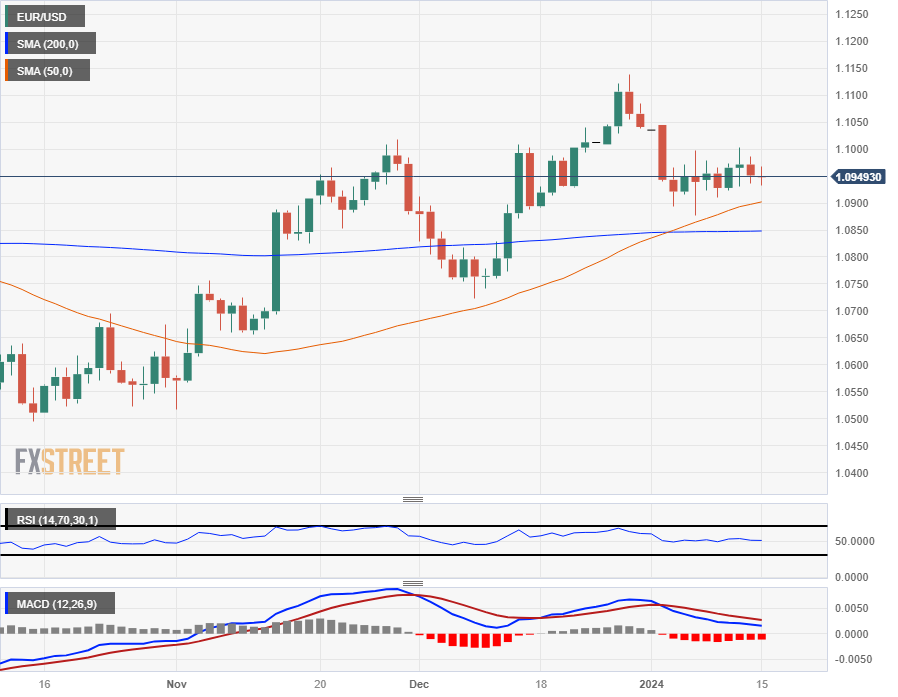
The EUR/USD has consolidated firmly into the 200-hour Simple Moving Average (SMA) near 1.0950, keeping the pair trapped below the 50-day SMA near 1.0960 as the pair slumps into the midrange. The EUR/USD remains capped by the 1.1000 major handle in the near-term as 2024 develops into a sideways grind.
Daily candlesticks suggest that downside may be limited moving forward, with the pair sticking to chart territory north of the 200-day SMA at 1.0850, with a rising 50-day SMA putting technical pressure on the EUR/USD from below. The 50-day SMA has confirmed a bullish cross of the 200-day SMA and is pressing into the 1.0900 handle, propping up prices as the pair holds to a pattern of higher lows from October’s bottom bids near 1.0450.
EUR/USD Hourly Chart
EUR/USD Daily Chart
Euro FAQs
What is the Euro?
The Euro is the currency for the 20 European Union countries that belong to the Eurozone. It is the second most heavily traded currency in the world behind the US Dollar. In 2022, it accounted for 31% of all foreign exchange transactions, with an average daily turnover of over $2.2 trillion a day.
EUR/USD is the most heavily traded currency pair in the world, accounting for an estimated 30% off all transactions, followed by EUR/JPY (4%), EUR/GBP (3%) and EUR/AUD (2%).What is the ECB and how does it impact the Euro?
The European Central Bank (ECB) in Frankfurt, Germany, is the reserve bank for the Eurozone. The ECB sets interest rates and manages monetary policy.
The ECB’s primary mandate is to maintain price stability, which means either controlling inflation or stimulating growth. Its primary tool is the raising or lowering of interest rates. Relatively high interest rates – or the expectation of higher rates – will usually benefit the Euro and vice versa.
The ECB Governing Council makes monetary policy decisions at meetings held eight times a year. Decisions are made by heads of the Eurozone national banks and six permanent members, including the President of the ECB, Christine Lagarde.How does inflation data impact the value of the Euro?
Eurozone inflation data, measured by the Harmonized Index of Consumer Prices (HICP), is an important econometric for the Euro. If inflation rises more than expected, especially if above the ECB’s 2% target, it obliges the ECB to raise interest rates to bring it back under control.
Relatively high interest rates compared to its counterparts will usually benefit the Euro, as it makes the region more attractive as a place for global investors to park their money.How does economic data influence the value of the Euro?
Data releases gauge the health of the economy and can impact on the Euro. Indicators such as GDP, Manufacturing and Services PMIs, employment, and consumer sentiment surveys can all influence the direction of the single currency.
A strong economy is good for the Euro. Not only does it attract more foreign investment but it may encourage the ECB to put up interest rates, which will directly strengthen the Euro. Otherwise, if economic data is weak, the Euro is likely to fall.
Economic data for the four largest economies in the euro area (Germany, France, Italy and Spain) are especially significant, as they account for 75% of the Eurozone’s economy.How does the Trade Balance impact the Euro?
Another significant data release for the Euro is the Trade Balance. This indicator measures the difference between what a country earns from its exports and what it spends on imports over a given period.
If a country produces highly sought after exports then its currency will gain in value purely from the extra demand created from foreign buyers seeking to purchase these goods. Therefore, a positive net Trade Balance strengthens a currency and vice versa for a negative balance. -
18:12
US Dollar posts modest gains while traders commemorate MLK holiday, markets digest US inflation
- The DXY Index trades mildly higher at around 102.60.
- Markets will remain quiet on Monday as US traders are on the sidelines celebrating MLK’s holiday.
- Investors digest last week’s inflation data from the US from December.
The US Dollar (USD) is enjoying slight gains with the DXY Index trading at 102.60, while US traders celebrate Martin Luther King Jr.’s holiday. No relevant highlights are expected in the session, and markets are still digesting last week’s US inflation readings from December.The Fed's dovish stance, based on welcoming the cooling inflation and projecting no rate hikes in 2024, has recently weakened the USD and seems to be offsetting the resilience of the US economy while other economic blocks are weakening. Despite higher CPI numbers, the market remains stubborn and expects the Fed to initiate its easing cycle sooner rather than later, and the soft PPI readings gave markets a reason to bet on a less aggressive approach.
Daily digest market movers: US Dollar registers mild gains after CPI releases
- Last week, the US Bureau of Labor Statistics revealed that the Consumer Price Index (CPI) escalated to 3.4% YoY in December, surpassing November's 3.1% and the predicted 3.2% consensus figure.
- The core CPI dropped to 3.9%, lower than November’s 4%, but higher than the expected 3.8%.
- US Producer Price Index (PPI) for final demand rose by 1% on a yearly basis in December, slightly below market expectations of 1.3% and up from the revised 0.8% increase in November.
- The annual core PPI, which excludes volatile food and energy prices, increased by 1.8% in December, falling below both the November reading and analysts' estimates of 2% and 1.9%, respectively. The monthly core PPI remained unchanged for the third consecutive month.
- As for now, The CME FedWatch Tool shows that the odds of rate cuts in March and May remain elevated at 70% and 66%, respectively.
- This week the US will release Retail Sales figures from December and the Fed’s Beige Book, which may have an impact on those expectations.
Technical Analysis: DXY gets some traction, outlook is not yet bullish
From a technical analysis standpoint, the daily chart reflects that the index gained some traction. The positive slope in the Relative Strength Index (RSI) within positive territory suggests an increase in buying pressure. This optimistic aspect is echoed by the Moving Average Convergence Divergence (MACD) with its flat green bars pointing to a stabilization in bullish sentiment.
However, the index remains above the 20-day Simple Moving Average (SMA) but below the 100 and 200-day SMAs. This underpins a sense of bearish dominance in the broader trend, but bears need to raise their game to regain short-term control as the bulls have managed to keep the pair above the shorter-term SMA. Therefore, in the short-term technical outlook, it appears the bullish momentum has an upper hand despite bearish undertones due to the position on longer-term SMAs.
Support levels: 102.30, 102.00 (20-day SMA), 101.80.
Resistance levels: 102.70, 102.80, 103.00.US Dollar FAQs
What is the US Dollar?
The US Dollar (USD) is the official currency of the United States of America, and the ‘de facto’ currency of a significant number of other countries where it is found in circulation alongside local notes. It is the most heavily traded currency in the world, accounting for over 88% of all global foreign exchange turnover, or an average of $6.6 trillion in transactions per day, according to data from 2022.
Following the second world war, the USD took over from the British Pound as the world’s reserve currency. For most of its history, the US Dollar was backed by Gold, until the Bretton Woods Agreement in 1971 when the Gold Standard went away.How do the decisions of the Federal Reserve impact the US Dollar?
The most important single factor impacting on the value of the US Dollar is monetary policy, which is shaped by the Federal Reserve (Fed). The Fed has two mandates: to achieve price stability (control inflation) and foster full employment. Its primary tool to achieve these two goals is by adjusting interest rates.
When prices are rising too quickly and inflation is above the Fed’s 2% target, the Fed will raise rates, which helps the USD value. When inflation falls below 2% or the Unemployment Rate is too high, the Fed may lower interest rates, which weighs on the Greenback.What is Quantitative Easing and how does it influence the US Dollar?
In extreme situations, the Federal Reserve can also print more Dollars and enact quantitative easing (QE). QE is the process by which the Fed substantially increases the flow of credit in a stuck financial system.
It is a non-standard policy measure used when credit has dried up because banks will not lend to each other (out of the fear of counterparty default). It is a last resort when simply lowering interest rates is unlikely to achieve the necessary result. It was the Fed’s weapon of choice to combat the credit crunch that occurred during the Great Financial Crisis in 2008. It involves the Fed printing more Dollars and using them to buy US government bonds predominantly from financial institutions. QE usually leads to a weaker US Dollar.What is Quantitative Tightening and how does it influence the US Dollar?
Quantitative tightening (QT) is the reverse process whereby the Federal Reserve stops buying bonds from financial institutions and does not reinvest the principal from the bonds it holds maturing in new purchases. It is usually positive for the US Dollar.
-
18:09
Gold Price Forecast: XAU/USD stays firm above $2050 amid geopolitical tensions
- Gold’s continued rise backed by risks in the Middle East involving Israel-Hamas, and Houthis vs. US/UK conflict.
- Market expectations of significant Fed rate cuts in 2024 boost Gold's appeal against a weakening Dollar.
- Focus on upcoming US economic data and Fed officials' speeches for further insights into Gold price dynamics.
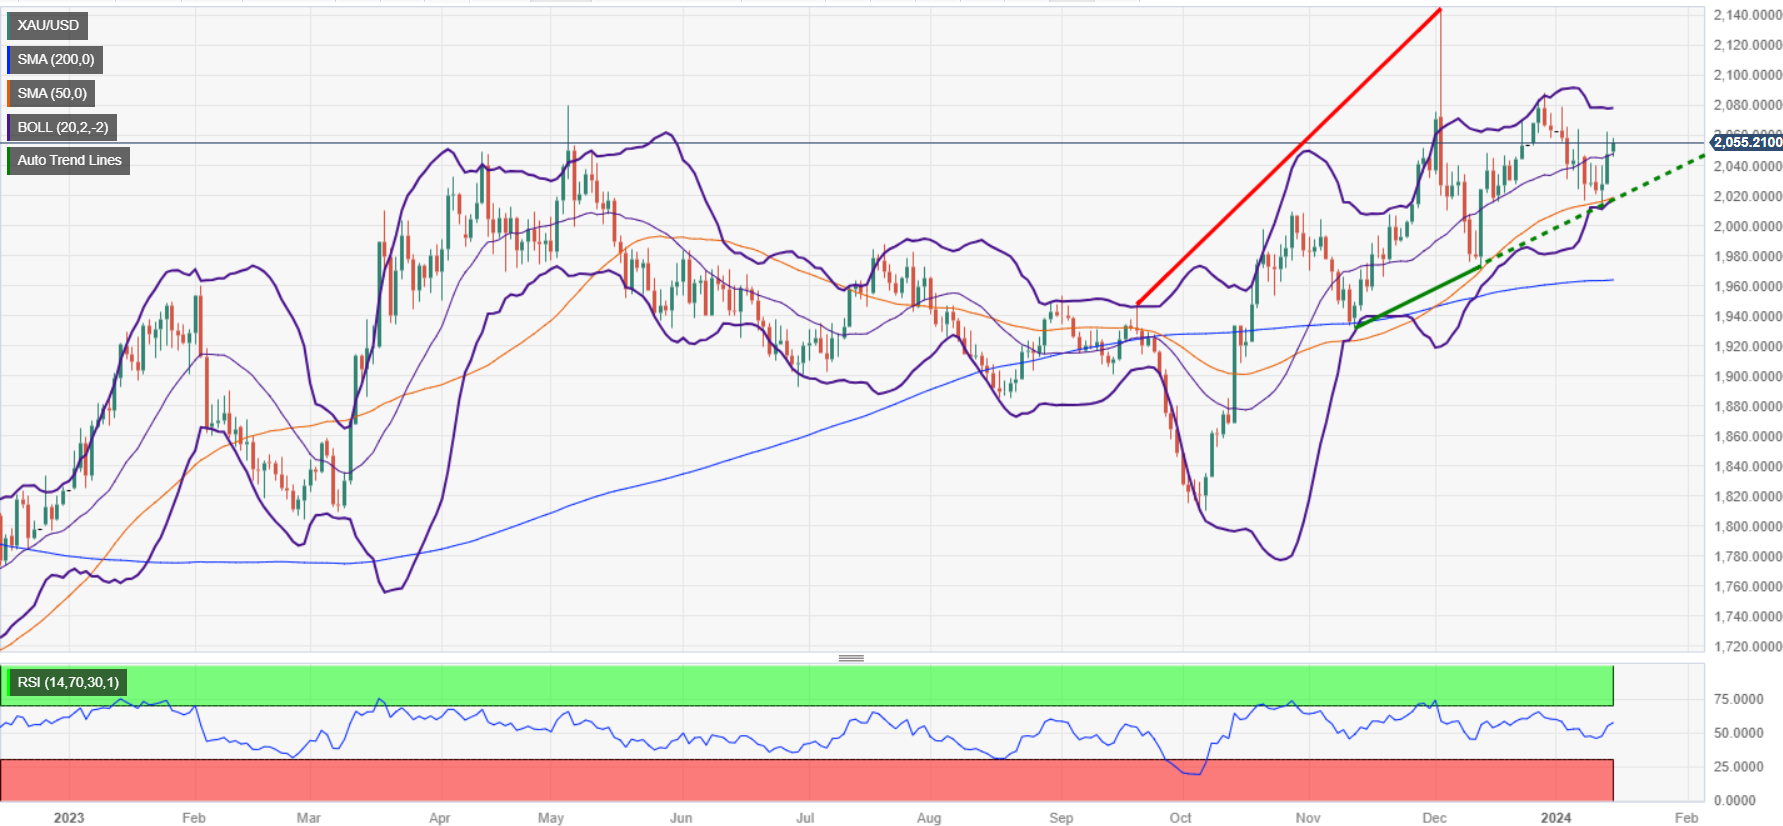
Gold price extended its gains for three straight days and stayed firm above the $2050 figure on Monday amid thin volume conditions sponsored by a holiday in the United States (US). In the meantime, geopolitical risks, remained the main driver, as the XAU/USD trades at $2055, up by 0.32%, after hitting a low of $2046.
XAU/USD rallies on sour sentiment weighing on risk-perceived assets
Tensions in the Middle East stay high as the Israel-Hamas conflict has extended to a hundred days, while the Houthi militia continued to launch missiles against ships and vessels that would like to go through the Red Sea. Consequently, the US and the UK retaliated vs. the Iran-backed group, attacking the strategic objectives of the group and spurring risk aversion in the financial markets.
Besides that, increasing odds that the US Federal Reserve (Fed) would cut rates by 170 basis points in 2024 gave the precious metals a leg-up against the already battered Greenback. Additionally, to this, US Treasury yields continued to edge lower, particularly the short-end of the curve, as the US 10s-2s yield curve is at -0.20 basis points, as the 2-year note rate coupon is at 4.14%, while the 10-year benchmark yields 3.941%
Ahead of the week, the US economic docket will feature Fed speakers led by Governor Christopher Waller, Michael Barr, Michelle Bowman, and the New York Fed President John Williams on Tuesday and Wednesday. Data-wise, the calendar will feature Retail Sales, Industrial Production, and the University of Michigan’s (UoM) Consumer Sentiment.
XAU/USD Price Analysis: Technical outlook
The daily chart portrays the yellow metal as neutral-upwards biased, but in the short term, it has remained sideways. For a bullish continuation, buyers must crack the December 28 high of $2088.48 to challenge the $2100 figure. A breach of the latter will expose the all-time high at $2146.79. On the flip side, if sellers drag Gold’s spot price below the 50-day moving average (at $2019, that could pave the way for testing the $2000 figure.
-
16:48
AUD/USD falls amid sour sentiment, PBoC rate decision
- AUD/USD drop influenced by a surprise PBoC rate hold decision amid thin liquidity conditions on the US market holiday.
- Mixed economic data throughout January could prevent the RBA from raising rates in the near term.
- The pair is at the mercy of Aussie’s economic data, along with US NY Empires State Index and Fed’s Waller speech.
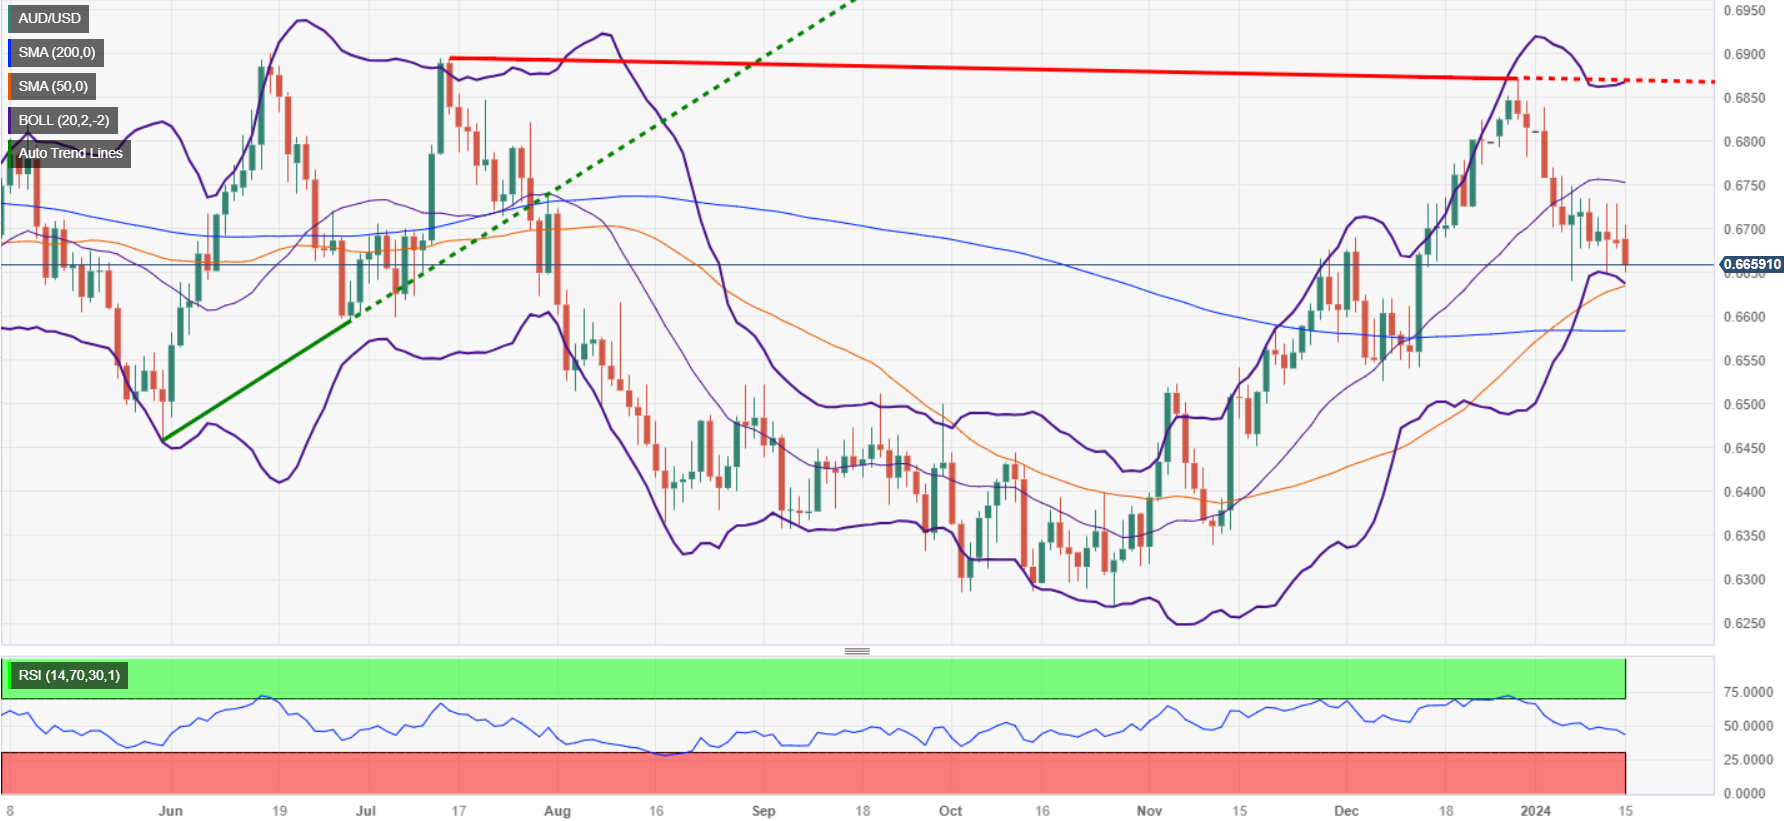
The Aussie Dollar (AUD) dropped during the North American session by some 0.42% against the US Dollar (USD) due to sentiment deterioration and low volume conditions, as the financial markets in the United States (US) remained closed on Martin Luther King (MLK) holiday. The AUD/USD trades at 0.6655 after hitting a high of 0.6705.
AUD/USD driven by risk aversion at the beginning of the week
AUD/USD was hurt by risk appetite as well as the People’s Bank of China (PBoC) keeping rates unchanged at 2.50%, coughing traders off guard, even though China’s economy crawls to grow at the levels expected by China’s President Xi Jinping.
Meanwhile, economic conditions in Australia continued to be challenging, as most of its PMIs remained in contractionary territory despite a slight improvement. Further data was positive, with Retail Sales exceeding the forecast of 1.2%, coming at 2% on January 6, adding to inflationary pressures, which were dissipated by the latest report. On January 9, the Australian Bureau of Statistics (ABS) revealed that headline inflation hit 4.3%, diving for the third straight month, which could deter the Reserve Bank of Australia (RBA) from hiking rates.
Ahead of the week, Australia’s economic docket will feature Westpac Consumer Confidence alongside housing data release. On the US front, the calendar would feature the NY Empire State Manufacturing Index on Tuesday, along with the Federal Reserve Governor Christoper Waller's speech.
AUD/USD Price Analysis: Technical outlook
The daily chart portrays the pair as neutral to upward biased, but in the last week, it has been trading sideways, unable to gather direction. If buyers lift the AUD/USD past the first resistance seen at 0.6700, they will face the next ceiling at the January 12 high of 0.6727. Once hurdled, the next stop would be the January 5 high of 0.6747, ahead of 0.6800. on the flip side, downside risks remain at the January 5 low of 0.6640, followed by the 0.6600 threshold.
-
16:23
Canadian Dollar mixed on quiet Monday, Loonie eases against Greenback amidst holiday trading
- The Canadian Dollar is broadly mixed on the day but slides against US Dollar.
- Bank of Canada Business Outlook Survey shows further declines in sentiment.
- Canada CPI inflation is due out Tuesday.
The Canadian Dollar (CAD) is mixed against its major currency peers on Monday but shed weight against the US Dollar (USD) with market volumes thinned out by a US market holiday.
Canada Wholesale & Manufacturing Sales data beat expectations but is still recovering from recent slumps. The Bank of Canada’s (BoC) Business Outlook Survey also showed that business sentiment soured at an accelerated pace in the fourth quarter of 2023, and investors will look ahead to Tuesday’s Canadian Consumer Price Index (CPI) inflation, which is expected to tick slightly higher YoY.
Daily digest market movers: Canadian Dollar softens against Greenback to kick off new trading week
- Market volumes are notably thin with US markets off for the Federal holiday on Monday.
- Canada Wholesale Sales in November beat expectations to print at a three-month high of 0.9%, beating the market forecast of 0.8% and recovering from the previous month’s -0.3% (revised upward from -0.5%).
- Canada Manufacturing Sales rebounded more than expected, printing at a four-month high of 1.2% in November compared to the forecast for 1.0%, but still well back from October’s -2.9% contraction (revised down slightly from -2.8%).
- The BoC’s latest Business Outlook Survey showed firms’ outlooks have broadly swung to concerns about declining sales volumes and ongoing price pressures with higher interest rates cited as a major roadblock to continued investment.
- US markets are dark on Monday in observation of Martin Luther King Day.
- NA market session sees trading volumes draw tight.
- CAD traders will be looking forward to Tuesday’s Canada CPI print, forecast to tick higher from 3.1% to 3.3% on an annualized basis.
- MoM Canada CPI is expected to decline MoM, with December’s CPI forecast to print at -0.3% versus the previous month’s 0.1%.
- Canada CPI Preview: Forecasts from five major banks
- US Retail Sales figures due Wednesday, expected to show limited growth in December.
Canadian Dollar price today
The table below shows the percentage change of Canadian Dollar (CAD) against listed major currencies today. Canadian Dollar was the weakest against the Euro.
USD EUR GBP CAD AUD JPY NZD CHF USD -0.03% 0.03% 0.19% 0.43% 0.45% 0.56% 0.21% EUR 0.04% 0.06% 0.22% 0.47% 0.49% 0.61% 0.25% GBP -0.04% -0.07% 0.16% 0.40% 0.42% 0.53% 0.18% CAD -0.21% -0.24% -0.15% 0.24% 0.27% 0.37% 0.01% AUD -0.44% -0.46% -0.39% -0.24% 0.03% 0.13% -0.22% JPY -0.45% -0.48% -0.54% -0.26% -0.02% 0.12% -0.24% NZD -0.57% -0.61% -0.53% -0.38% -0.14% -0.12% -0.37% CHF -0.21% -0.24% -0.18% -0.02% 0.22% 0.24% 0.35% The heat map shows percentage changes of major currencies against each other. The base currency is picked from the left column, while the quote currency is picked from the top row. For example, if you pick the Euro from the left column and move along the horizontal line to the Japanese Yen, the percentage change displayed in the box will represent EUR (base)/JPY (quote).
Technical Analysis: Canadian Dollar sees limited topside, USD/CAD tests back into 1.3440
The Canadian Dollar (CAD) sees some gains against the Pacific currency bloc, gaining around four-tenths of a percent against the New Zealand Kiwi (NZD) and about a quarter of a percent against the Australian Dollar (AUD) and the Japanese Yen (JPY). The CAD is down about a quarter of a percent against the Pound Sterling, and in the red about a fifth of a percent against both the US Dollar and the Euro (EUR).
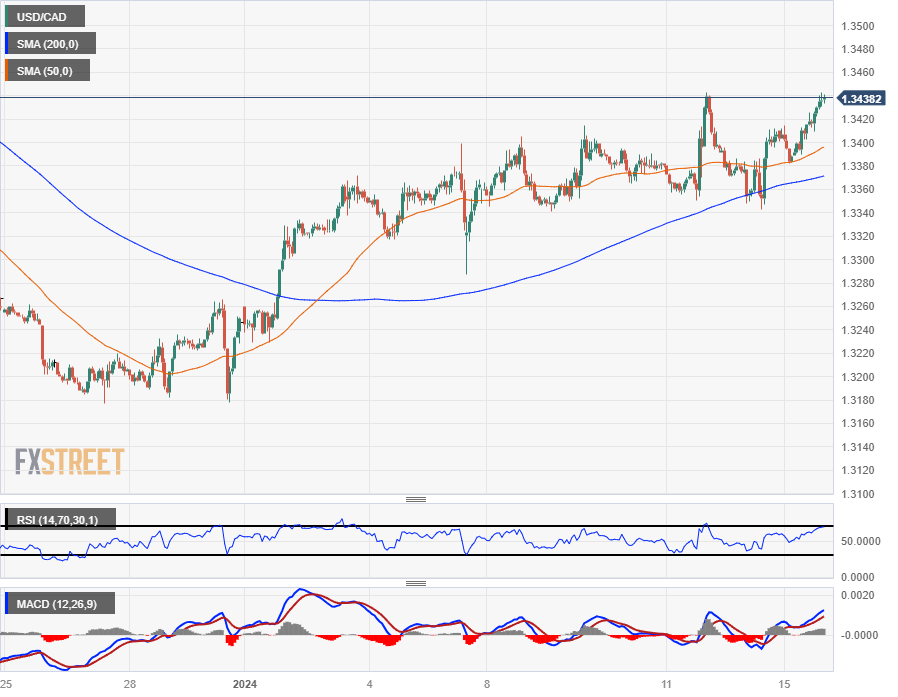
With the US Dollar broadly higher on Monday, the USD/CAD pair is retesting into the 1.3440 region, taking a run at setting a new high for 2024 as the Canadian Dollar continues to shed weight in choppy trading against the USD.
The USD/CAD is now up 2% from December’s swing low into 1.3177, and ongoing bullish momentum has the pair running straight into a technical ceiling at the 200-day Simple Moving Average (SMA) just below the 1.3500 handle.
USD/CAD Hourly Chart
USD/CAD Daily Chart
Canadian Dollar FAQs
What key factors drive the Canadian Dollar?
The key factors driving the Canadian Dollar (CAD) are the level of interest rates set by the Bank of Canada (BoC), the price of Oil, Canada’s largest export, the health of its economy, inflation and the Trade Balance, which is the difference between the value of Canada’s exports versus its imports. Other factors include market sentiment – whether investors are taking on more risky assets (risk-on) or seeking safe-havens (risk-off) – with risk-on being CAD-positive. As its largest trading partner, the health of the US economy is also a key factor influencing the Canadian Dollar.
How do the decisions of the Bank of Canada impact the Canadian Dollar?
The Bank of Canada (BoC) has a significant influence on the Canadian Dollar by setting the level of interest rates that banks can lend to one another. This influences the level of interest rates for everyone. The main goal of the BoC is to maintain inflation at 1-3% by adjusting interest rates up or down. Relatively higher interest rates tend to be positive for the CAD. The Bank of Canada can also use quantitative easing and tightening to influence credit conditions, with the former CAD-negative and the latter CAD-positive.
How does the price of Oil impact the Canadian Dollar?
The price of Oil is a key factor impacting the value of the Canadian Dollar. Petroleum is Canada’s biggest export, so Oil price tends to have an immediate impact on the CAD value. Generally, if Oil price rises CAD also goes up, as aggregate demand for the currency increases. The opposite is the case if the price of Oil falls. Higher Oil prices also tend to result in a greater likelihood of a positive Trade Balance, which is also supportive of the CAD.
How does inflation data impact the value of the Canadian Dollar?
While inflation had always traditionally been thought of as a negative factor for a currency since it lowers the value of money, the opposite has actually been the case in modern times with the relaxation of cross-border capital controls. Higher inflation tends to lead central banks to put up interest rates which attracts more capital inflows from global investors seeking a lucrative place to keep their money. This increases demand for the local currency, which in Canada’s case is the Canadian Dollar.
How does economic data influence the value of the Canadian Dollar?
Macroeconomic data releases gauge the health of the economy and can have an impact on the Canadian Dollar. Indicators such as GDP, Manufacturing and Services PMIs, employment, and consumer sentiment surveys can all influence the direction of the CAD. A strong economy is good for the Canadian Dollar. Not only does it attract more foreign investment but it may encourage the Bank of Canada to put up interest rates, leading to a stronger currency. If economic data is weak, however, the CAD is likely to fall.
-
16:19
EUR/GBP Technical Analysis: Bears take a breather as support at 0.8600 holds steady, bulls advance
- EUR/GBP shows strength at 0.8600, up by 0.20%.
- Daily chart indicators highlight increased buying sentiment despite being negative territory.
- The position below main SMAs suggests underlining bear dominance in the long-term view.
In Monday's session, the EUR/GBP pair is seen trading at 0.8600 with a gain of 0.20% and hit a high of 0.8615. The daily chart presents a mixed sentiment leaning towards bearish, as the bears seem to take a breather after two days of losses. However, the strong support at 0.8600 has curbed further downside. Still, the bearish bias is more evident in the four-hour chart, with sellers trimming some daily gains, indicating a potential continuation of the downward trend for the rest of the session.
The indicators on the daily chart show that the bearish impulse is taking a breather. The Relative Strength Index (RSI) is indicating a positive slope while remaining under 50, signifying that the bears are not done just yet. The bearish pressure is further confirmed when observing the Moving Average Convergence Divergence (MACD), which prints flat red bards. In addition, the cross trades below the trio of 20, 100, and 200-day Simple Moving Averages (SMAs) indicate that the overall trend still favors the sellers.
In the four-hour chart, the bearishness is marked more notably. The tilt towards the negative side emerges stronger as the Relative Strength Index (RSI) shows a negative slope in negative territory. Also, the decreasing green bars of the MACD enforce the impression of the bull’s momentum being weak and transitory. Despite a brief pause in the bearish continuation, the selling force continues to have a prevailing grip on the market, suggesting an ongoing potential for further downside in the next sessions.
EUR/GBP technical levels
EUR/GBP daily chart
-638409323352133459.png)
-
15:57
Mexican Peso weakens against US Dollar on risk aversion despite Fed rate cut speculation
- Mexican Peso gets hit by sentiment shifting, down 0.13% against Greenback.
- Mexico’s economy continues to slow down amid the ongoing disinflation process.
- Expectations that Banxico would begin easy monetary policy in Q1 2024 could pave the way for further upside in USD/MXN.
The Mexican Peso (MXN) made a U-turn after posting solid gains versus the US Dollar (USD) on Friday, weakening amid thin liquidity conditions in the observance of Martin Luther King (MLK) day in the United States (US). The emerging market currency is soft despite interest rate traders expecting the US Federal Reserve (Fed) to cut rates by 170 basis points in 2024, undermining the prospects of the buck. Nevertheless, the USD/MXN exchanges hands at 16.90 on Monday, gaining 0.23%.
Risk aversion is taking its toll on European stocks, bolstering the Greenback (USD), a headwind for the Mexican currency. Even though the Peso continues to edge lower, futures positions on the Mexican Peso show investors had remained long for the last 44 weeks, according to data revealed by the Chicago Board of Trade (CBOT). Net speculative contracts rose by 88,439 longs, -0.7% less than last week’s 89,100.
Despite that, the USD/MXN had resumed its uptrend on speculation that the Bank of Mexico (Banxico) will begin easing its monetary policy. However, the latest inflation report could prevent them from relaxing monetary conditions.
Daily digest market movers: Mexican Peso retreats as investor mood deteriorates
- The latest US inflation report on the producer side affected the markets the most, according to Société Generale. Even though the Consumer Price Index (CPI) in the US was hotter than expected last Thursday, a day later the Producer Price Index (PPI) came lower than estimates, prompting investors to increase odds for a Fed rate cut in March from 78% to 83%. Nevertheless, those odds had eased to 70% at the time of writing.
- Mexican economic data revealed throughout the month suggests the country faces some challenges. Inflation rose from 4.32% to 4.66% YoY in December, exceeding the 4.55% forecast. The same report revealed that underlying inflation is easing toward 5% but remains high, which might deter Banxico officials from easing policy in the first quarter of 2024.
- In addition to that, Industrial Production plunged -1.0% MoM after achieving eight months of expansion, indicating that higher interest rates set by Banxico at 11.25% are beginning to impact the economy.
- In that regard, Auto Production for December slumped from 18.1% to -9.9% YoY.
- Confidence surveys released on January 3 and 8 showed that businesses' confidence remained high at 54.6, bolstered by “nearshoring” prospects. However, consumers have begun to turn pessimistic as they expect inflation and economic deceleration to weigh on their economies.
- The week’s Mexican economic docket will feature Retail Sales for November, expected to remain unchanged at 3.4% YoY, according to the consensus.
- Last Wednesday, the World Bank revised its economic projections for Mexico in 2024. The updated forecast anticipates that Mexico's Gross Domestic Product (GDP) will grow by 2.6%, an increase from the bank’s initial prediction of 1.9%. Analysts at the bank attribute this expected growth to the rise in near-shoring activities, which they believe will positively impact the Mexican economy.
- Although the recent meeting minutes from Banxico (the Central Bank of Mexico) suggest that the central bank might contemplate easing its monetary policy, the inflation report for December could hinder any move toward policy relaxation.
- Analysts at Standard Chartered noted, “We expect the policy rate to be lowered to 9.25% by end-2024, although an official downward revision in the output gap could open the door for more aggressive rate cuts.”
- On January 5, a Reuters poll suggested the Mexican Peso could weaken 5.4% to 18.00 per US Dollar in the 12 months following December.
Technical analysis: Mexican Peso weakens as USD/MXN climbs toward 16.90
The USD/MXN remains downward biased, but today’s bullish impulse can open the door to challenging the 17.00 figure. A decisive breach of the latter would expose the 50-day Simple Moving Average (SMA) at 17.19, followed by the confluence of the 100 and 200-day SMAs at around 17.38/40.
On the flip side, if sellers drag prices toward last Friday’s low of 16.82, that could open the door for further downside. Once cleared, the next support would be the January 8 low of 16.78, followed by the August 28 cycle low of 16.69, ahead of last year’s low of 16.62.
USD/MXN Price Action – Daily Chart

Mexican Peso FAQs
What key factors drive the Mexican Peso?
The Mexican Peso (MXN) is the most traded currency among its Latin American peers. Its value is broadly determined by the performance of the Mexican economy, the country’s central bank’s policy, the amount of foreign investment in the country and even the levels of remittances sent by Mexicans who live abroad, particularly in the United States. Geopolitical trends can also move MXN: for example, the process of nearshoring – or the decision by some firms to relocate manufacturing capacity and supply chains closer to their home countries – is also seen as a catalyst for the Mexican currency as the country is considered a key manufacturing hub in the American continent. Another catalyst for MXN is Oil prices as Mexico is a key exporter of the commodity.
How do decisions of the Banxico impact the Mexican Peso?
The main objective of Mexico’s central bank, also known as Banxico, is to maintain inflation at low and stable levels (at or close to its target of 3%, the midpoint in a tolerance band of between 2% and 4%). To this end, the bank sets an appropriate level of interest rates. When inflation is too high, Banxico will attempt to tame it by raising interest rates, making it more expensive for households and businesses to borrow money, thus cooling demand and the overall economy. Higher interest rates are generally positive for the Mexican Peso (MXN) as they lead to higher yields, making the country a more attractive place for investors. On the contrary, lower interest rates tend to weaken MXN.
How does economic data influence the value of the Mexican Peso?
Macroeconomic data releases are key to assess the state of the economy and can have an impact on the Mexican Peso (MXN) valuation. A strong Mexican economy, based on high economic growth, low unemployment and high confidence is good for MXN. Not only does it attract more foreign investment but it may encourage the Bank of Mexico (Banxico) to increase interest rates, particularly if this strength comes together with elevated inflation. However, if economic data is weak, MXN is likely to depreciate.
How does broader risk sentiment impact the Mexican Peso?
As an emerging-market currency, the Mexican Peso (MXN) tends to strive during risk-on periods, or when investors perceive that broader market risks are low and thus are eager to engage with investments that carry a higher risk. Conversely, MXN tends to weaken at times of market turbulence or economic uncertainty as investors tend to sell higher-risk assets and flee to the more-stable safe havens.
-
15:43
Canada CPI Preview: Forecasts from five major banks, inflation likely ticked up in December
Statistics Canada will release December Consumer Price Index (CPI) data on Tuesday, January 16 at 13:30 and as we get closer to the release time, here are the forecasts by the economists and researchers of five major banks regarding the upcoming Canadian inflation data.
The headline inflation is expected at 3.3% year-on-year from 3.1% in November. If so, this would be the first acceleration since August to the highest since September and further above the 2% target. Core trim is expected to fall a tick to 3.4% YoY while core median is also expected to drop a tick to 3.3% YoY.
TDS
We look for headline CPI inflation to firm by 0.2pp to 3.3% YoY in December as base effects from 2022 more than offset a 0.4% decline on the month. Our forecast would also see core inflation rates ease further with a 0.1-0.2pp decline for CPI-trim/median, leaving the average at 3.3% YoY, even as these measures firm on a 3m annualized basis. Even with headline CPI printing slightly below Bank of Canada projections for Q4, we believe the Bank still needs to see additional evidence of cooling inflation pressures before it drops the threat of further hikes.
RBC Economics
Canadian headline CPI growth is expected to tick slightly higher (+3.4% YoY) from November’s 3.1% increase, but with the gain largely coming from energy price ‘base-effects’ as a large drop in gasoline prices a year ago falls out of the YoY growth calculation. YoY growth in the BoC’s preferred median and trim ‘core’ CPI measures should be little changed in December, and the more recent three-month annualized growth rate that the central bank has been watching is more likely to tick a touch higher (from 2.3% and 2.6%, respectively, growth rates in November.) Still, the breadth and magnitude of inflation have continued to edge lower on balance. Growth in mortgage interest costs is accounting for roughly a third of total price growth excluding food and energy products. The BoC will continue to look through price growth from that component because the increase is a direct result of earlier interest rate hikes, and price increases excluding that component have been running within the 1% to 3% inflation target range.
NBF
The drop in gasoline prices may translate into a -0.3% for the headline index before seasonal adjustment. Despite this drop, the 12-month rate could still go up from 3.1% to 3.4%, reflecting a highly negative base effect. Contrary to the headline print, the core measures preferred by the BoC should ease, with CPI-med likely moving from 3.4% to 3.3% and CPI-trim from 3.5% to 3.4%.
Citi
We expect a 0.2% MoM decline in CPI in December as prices typically fall on a non-seasonally adjusted basis at the end of the year. This would include declines in energy prices. Services prices, however, should be mixed. But the most important element of monthly CPI reports will be the core inflation measures. There should be further declines in annual readings over the coming months in line with trends in survey data such as the CFIB’s price plans. But the 3-month pace will be most important for BoC policy as BoC officials will need to see at least 3-4 months of 3-month core inflation trending around 2.5% to feel comfortable cutting rates. 3-month core inflation was at 2.5% in November data, but ‘base effects’ would suggest upward risks in December. An uptick in 3-month core inflation could push back market pricing for a full rate cut by the BoC by April (there will only be two more CPI reports before the April meeting after this release).
CIBC
The annual rate of inflation likely accelerated modestly in December, albeit largely because gasoline prices fell less than they did during the same month of 2022. Elsewhere, rents and mortgage interest costs will keep shelter prices rising quickly, although there should be further signs that food price inflation is easing. Airline fares weren’t as weak as normal in November, which could mean that they didn’t rise as much as they typically do in December. With overall inflationary pressures becoming less broad-based, we should see a further deceleration in the Bank of Canada’s preferred CPI-trim and CPI-median measures of inflation.
-
15:27
Further US Dollar weakness is likely in the months ahead – SocGen
The correlation between the Dollar and Fed Funds futures is unusually strong now, and if it persists, further USD upside is limited, economists at Société Générale report.
The US Dollar has rarely tracked Fed rate expectations more closely
The US Dollar was the weakest of the major currencies in the last two months of 2023, as markets grew increasingly confident that the Fed could engineer a soft landing for the economy, delivering multiple rate cuts and avoiding recession. Strong sensitivity to rate expectations will fade eventually, but only slowly and suggests that after a pause, further Dollar weakness is likely in the months ahead.
With markets priced for continued economic weakness in Europe and China, the biggest driver of the Dollar will continue to be how expectations about the US economy evolve, but easier Chinese fiscal policy would be supportive of regional growth and the AUD, in particular, would benefit from the prospect of slower RBA than Fed easing.
-
14:52
USD/JPY will struggle to hold above 146/147 levels – ING
Economists at ING analyze the USD/JPY outlook for the coming months.
152 probably was the top
We think 152 probably was the top for USD/JPY and it will struggle to hold above 146/147 levels now. Also, the better terms of trade story is providing external support for the Yen.
Two outside risks: 1) Geopolitics and a spike in oil prices are JPY negative 2) US Treasury Refunding risk on 29 Jan & higher UST yields.
USD/JPY – 1M 145.00 3M 140.00 6M 135.00 12M 130.00
-
14:18
NZD/USD plummets below 0.6200 as PBoC kept interest rates surprisingly unchanged
- NZD/USD plunges slightly below 0.6200 as PBoC maintains interest rates steady.
- The safe-haven bets have strengthened amid geopolitical tensions.
- Market participants will focus on the US Retail Sales data.
The NZD/USD pair faces an intense sell-off as the People’s Bank of China (PBoC) has kept the medium-term lending facility rates surprisingly unchanged at 2.5%. The market participants were anticipating a dovish interest rate decision by the PBoC amid an uneven recovery post-pandemic.
A steady monetary policy stance by the PBoC has deepened fears of a decline in credit growth, which would dampen overall economic prospects further. Being a proxy to the China’s economic prospects, the New Zealand Dollar was heavily dumped by market participants.
S&P500 futures have generated some losses in the early New York session, portraying a decline in the risk-appetite of the market participants. The risk-perceived assets are facing the consequences of high volatility induced by long weekend in the United States economy on account of Martin Luther King Birthday.
Meanwhile, deepening Middle East tensions have improved the appeal for safe-haven assets significantly. The US Dollar Index (DXY) has climbed to near 102.60 amid hopes that optimism about Federal Reserve (Fed) taking down interest rates will fade sooner as other central banks are also expected to start reducing borrowing costs sooner.
Going forward, market participants will focus on the monthly US Retail Sales data for December, which will be published on Wednesday. As per the expectations, consumer spending rose by 0.4% against 0.3% growth in November. Retail Sales excluding automobiles grew steadily by 0.2%.
-
14:16
Technical signals and seasonality lean towards USD strengthening somewhat in the next few weeks – Scotiabank
The USD is trading a little firmer to start the week but the US Dollar Index (DXY) remains effectively range-bound. Economists at Scotiabank analyze Greenback’s outlook.
USD firmer in quiet trade
The MLK Day federal holiday today will keep things relatively quiet, and ranges are unlikely to extend significantly in the absence of US market participants. But the somewhat firmer USD tone is appropriate given the recent strength in US economic data and comments from Federal Reserve officials who have suggested market pricing for a March rate cut (19 bps at writing) is optimistic.
This week’s US data run – regional Fed activity data, Retail Sales, IP, U. Michigan Sentiment and the Beige Book etc. – may help resolve the apparent disparity between market pricing for early rate cuts and the undertone of the US economy one way or another.
Technical signals and seasonality lean towards the USD strengthening somewhat in the next few weeks still, however.
-
13:58
EUR/JPY approaches 160.00 amid broad-based Yen weakness
- The Euro has bounced higher favoured by generalised Yen weakness.
- The weak Eurozone Industrial production and German GDP data have been ignored.
- The BoJ is expected to maintain its ultra-loose policy at next week's meeting.
The Euro has resumed its brooder upside trend against a weaker Japanese Yen. Investors' hopes that the BoJ will keep its ultra-loose monetary policy unchanged next week have offset the impact of the downbeat Eurozone data, pushing the pair near one-month highs.
Earlier today, Eurozone data revealed that industrial production contracted for the third consecutive month in November. Beyond that German GDP contracted at a 0.3% rate in 2023, casting doubt about the Region’s economic outlook.
These figures, however, have been offset by investors’ confidence that the Bank of Japan will stand pat next week. The weak Tokyo CPI and earnings data seen last week have eased pressure on the BoJ to normalize its monetary policy, which is likely to keep the yen on the back foot, especially if the national CPI confirms these figures on Thursday.
The pair is trading on a bullish trend with the next resistance at 160.15, the 61.8% Fibo retracement of the November - December decline, ahead of 161.74. Supports are 158.50 and 157.25.Technical levels to watch
-
13:38
USD/CAD: Risks still appear tilted to the topside – Scotiabank
USD/CAD returns above 1.34. Economists at Scotiabank analyze the pair’s outlook.
Corrective pressure for a higher USD/CAD should be sustained
The USD advanced to near the 38.2 % retracement derived from the Q4 USD sell-off at 1.3454 Thursday before easing back. USD resistance in the mid-1.34 area is reinforced by the 40-Day Moving Average (1.3442 today).
Choppy trading late last week clouds the very near-term technical outlook for the USD but broader (weekly) signals remain USD-bullish and suggest corrective pressure for a higher USD should be sustained.
Look for support on USD dips to the mid-1.33s and (stronger) at 1.3275/1.3300.
Above 1.3450 targets 1.3538 (50% retracement resistance).
-
13:30
Canada Wholesale Sales (MoM) registered at 0.9% above expectations (0.8%) in November
-
13:30
Canada Manufacturing Sales (MoM) above expectations (1%) in November: Actual (1.2%)
-
13:27
USD/CHF edges up on risk-off trading, aiming for 0.8575
- The edges up on risk aversion but remains trapped within previous ranges.
- Trading is light with US markets closed on bank holidays.
- USD/CHF is on a corrective recovery, aiming for 0.8575 and 0.8665.
The US Dollar is going through a moderate recovery against the Swiss Franc on Monday. The Dollar Index is trimming some losses, favoured by the sourer market sentiment although it remains trapped within previous ranges.
The USD Index remains capped below the 102.75 resistance area, which is coincident with the USD/CHF’s 0.8575 level. The weaker market sentiment is providing some support to the safe-haven USD yet, trading volume is light with US markets closed on bank holidays.
The economic docket is thin today. In the US, the New York Fed Empire State Manufacturing Index might provide some guidance for traders, although the highlights will be Wednesday’s Retail Sales and Friday’s Michigan Consumer Sentiment Index.
The pair is now in a corrective recovery after having depreciated nearly 10% in the last quarter of 2023. Immediate resistance is the mentioned 0.8575 and above here, the 38.2% Fibonacci retracement of the mentioned decline, at 0.8665.
Supports are 0.8460 and December’s low at 0.8325.Technical levels to watch
-
13:06
Silver Price Analysis: XAG/USD juggles around $23.30, remains upbeat on renewed Fed rate cut bets
- Silver price consolidates around $23.60 as trading volume is lower than average due to closed US markets.
- Investors are more confident about Fed reducing interest rates from March after soft US PPI data.
- Deepening Middle East tensions have improved safe-haven appeal.
Silver price (XAG/USD) trades back-and-forth around $23.30 in a thin-volume trading session due to holiday in the US markets on account of Martin Luther King Birthday.
The broader appeal for non-yielding assets is still upbeat as investors seem more convinced about a reduction in interest rates by the Federal Reserve (Fed) from March after the release of the softer-than-projected United States Producer Price Index (PPI) for December. A surprisingly soft US PPI report has eased fears for inflation remaining stubborn ahead.
S&P500 futures have witnessed some losses in the European session, portraying a decline in risk-appetite of the market participants. The US Dollar Index (DXY) has rebounded to near $102.50 as investors expect that optimism about the Fed cutting interest rates earlier than other central banks is reaching maturity. The market participants see the European Central Bank (ECB) and the Bank of England (BoE) also reducing borrowing costs sooner due to vulnerable economic outlook.
This week, market participants will keenly focus on the US monthly Retail Sales data for December. Investors anticipate that the consumer spending grew at a higher pace of 0.4% against 0.3% increase in November.
Meanwhile, the appeal for safe-haven assets has also improved due to deepening Middle East crisis. Iran-backed Houthis rebels have warned about a retaliation for airstrikes by the US and the UK military.
Silver technical analysis
Silver price delivers a sharp recovery after witnessing a selling climax near $22.50. On a 60-minute timeframe, the downside in the Silver price will be supported around January 4 low at $22.69 while the upside will remain capped near December 2023 low at $23.54.
The near-term demand seems positive as the asset is holding above the 50-period Exponential Moving Average (EMA), which trades around $23.10.
Meanwhile, the 14-period Relative Strength Index (RSI) has slipped into the 40.00-60.00 range. This indicates that momentum has faded but upside bias is still intact.
Silver hourly chart
-638409207147567763.png)
-
12:59
GBP/USD: Range trade outlook for now – Scotiabank
GBP/USD is modestly lower on the session. Economists at Scotiabank analyze the pair’s outlook.
Daily and weekly signals continue to flash bullish
Sterling sits more or less mid-way between key support at 1.2600/1.2610 and resistance at 1.2830.
Trend momentum is tilting bearish on the intraday study but the signal is weak.
Daily and weekly signals continue to flash bullish, which complicates the near-term outlook and perpetuates the range trade outlook for now.
See – UK: Further evidence of disinflation would weaken the GBP – MUFG
-
12:44
USD/JPY regains upside momentum and approaches the 146.00 level
- The Greenback's recovery accelerates as market sentiment fades.
- The Yen is on the defensive on hopes that the BoJ will keep its ultra-loose policy unchanged.
- Markets are calm today with US markets closed on bank holiday.
The US Dollar bounced higher on Monday, favoured by sourer market sentiment and a weaker Japanese Yen. The pair has regained most of the ground lost on Friday and reaching Intra-day highs nearing 146.00.
The Greenback seems to have shrugged off the post-US PPI weakness in a calm trading session, with US markets closed for the Martin Luther King birthday.
With the Bank of Japan monetary policy meeting approaching, the weak Tokyo CPI index and wage data seen last week have practically discarded any monetary policy normalization in January’s meeting. This is likely to keep the Yemn on the defensive this week.
The calendar is light today with only the NY Empire State Manufacturing Index. The Highlight in the US calendar will be the Retail Sales release on Wednesday. In Japan, all eyes are on the National CPI data due on Thursday. The risk of this event is negative for the Yen.
Technical indicators are pointing higher, with bulls aiming for Thursday’s high at 146.40 ahead of 147.45. Immediate support is at 144.35 and then 143.55.Technical levels to watch
-
12:32
EUR/USD: A push back to the 1.07/1.08 range remains a risk in the coming weeks – Scotiabank
Economists at Scotiabank analyze EUR/USD outlook as the pair holds range.
Key support in the low 1.09s remains vulnerable
Trading remains range-bound in effect but the EUR lost ground late last week, after being blocked by resistance at 1.10 and retains a weak technical undertone today.
Key support in the low 1.09s (bull channel base at 1.0923 and 40-Day Mvong Average at 1.0931) remains vulnerable.
A push back to the 1.07/1.08 range remains a risk in the coming weeks.
See – EUR/USD: Trading sustainably above 1.10 is premature – ING
-
12:30
US Dollar sideways with technical pressure for more downside still present
- The US Dollar trades in a range despite rising tensions in the Middle East and Asia.
- Traders are gearing up for US Retail Sales and Michigan Consumer Sentiment numbers this week.
- The US Dollar Index in the mid-102 area while world leaders convene in Davos for the World Economic Forum.
The US Dollar (USD) is still stuck in a range while markets are puzzling to see where to go next. Several moving parts are in the mix with US economic data starting to show a very mixed picture with several data points in contraction while the labour market remains very tight. Add to that the World Economic Forum taking place in Davos, while at the same time Israel, Gaza, Red Sea, Yemen, Ukraine and Russia remain the hot topics smouldering in the background.
On the economic data front focal points this week will be Wednesday and Friday, while traders enjoy a day off on Monday. With Martin Luther King Day, the US trading session will be moving on very low volumes. Wednesday traders will gear up for US retail sales and on Friday the University of Michigan will tell markets more on the Consumer Sentiment.
Daily digest market movers: Closed for business
- US markets are closed for Martin Luther King Day.
- Headlines will be coming out of the Swiss town of Davos with the World Economic Forum taking place.
- The key state Iowa is set to have its Primary this Monday evening with Trump set to win.
- Tensions are building in Asia with the Democratic party winning the elections in Taiwan, reinforcing the vote for independence away from China.
- German Gross Domestic Product (GDP) falls into contraction, at -0.3% against 1.8% previous.
- Equity markets are setting a new record with Japan’s Nikkei jumping over 1% and printing a new 34-year high. Meanwhile European equities are looking for direction after a negative Gross Domestic Product print from Germany.
- The CME Group’s FedWatch Tool shows that markets are pricing in a 94.8% chance that the Federal Reserve will keep interest rates unchanged at its January 31 meeting. Around 5.2% expect the first cut already to take place.
- The benchmark 10-year US Treasury Note holds near 3.94%, and will not move this Monday due to closed trading.
US Dollar Index Technical Analysis: Things are set to get ugly
The US Dollar Index (DXY) is starting to develop a pattern for 2024, and it looks to be completely different from 2023. The economic data points are not moving the needle anymore like they did in 2023, with rather macroeconomic news to drive the DXY either up or down. The overnight outcome of the Iowa Primary, which counts as a litmus test for the Presidential Elections in November, could send the DXY off in a direction that will build up all the way back to November levels.
The first level on the upside to watch is 102.70, which falls nearly in line with the trend line from the top of October 3 and December 8. If broken and closed above, the 200-day Simple Moving Average (SMA) at 103.44 comes into play. The 104.00 level might be too far off, with 103.56 (55-day SMA) coming in as the next resistance.
A rejection by the descending trendline will give fuel to Greenback bears leading to a further downturn. The line in the sand here is 101.74 – the floor which held halfway through December before breaking down in the last two weeks. In case the DXY snaps this level, expect to see a test at the low near 100.80.
US Dollar FAQs
What is the US Dollar?
The US Dollar (USD) is the official currency of the United States of America, and the ‘de facto’ currency of a significant number of other countries where it is found in circulation alongside local notes. It is the most heavily traded currency in the world, accounting for over 88% of all global foreign exchange turnover, or an average of $6.6 trillion in transactions per day, according to data from 2022.
Following the second world war, the USD took over from the British Pound as the world’s reserve currency. For most of its history, the US Dollar was backed by Gold, until the Bretton Woods Agreement in 1971 when the Gold Standard went away.How do the decisions of the Federal Reserve impact the US Dollar?
The most important single factor impacting on the value of the US Dollar is monetary policy, which is shaped by the Federal Reserve (Fed). The Fed has two mandates: to achieve price stability (control inflation) and foster full employment. Its primary tool to achieve these two goals is by adjusting interest rates.
When prices are rising too quickly and inflation is above the Fed’s 2% target, the Fed will raise rates, which helps the USD value. When inflation falls below 2% or the Unemployment Rate is too high, the Fed may lower interest rates, which weighs on the Greenback.What is Quantitative Easing and how does it influence the US Dollar?
In extreme situations, the Federal Reserve can also print more Dollars and enact quantitative easing (QE). QE is the process by which the Fed substantially increases the flow of credit in a stuck financial system.
It is a non-standard policy measure used when credit has dried up because banks will not lend to each other (out of the fear of counterparty default). It is a last resort when simply lowering interest rates is unlikely to achieve the necessary result. It was the Fed’s weapon of choice to combat the credit crunch that occurred during the Great Financial Crisis in 2008. It involves the Fed printing more Dollars and using them to buy US government bonds predominantly from financial institutions. QE usually leads to a weaker US Dollar.What is Quantitative Tightening and how does it influence the US Dollar?
Quantitative tightening (QT) is the reverse process whereby the Federal Reserve stops buying bonds from financial institutions and does not reinvest the principal from the bonds it holds maturing in new purchases. It is usually positive for the US Dollar.
-
12:13
Gold Price Forecast: XAU/USD to confirm clear breakout from multi-year range on a move above $2,088 – SocGen
Economists at Société Générale analyze Gold (XAU/USD) technical outlook.
Risk of a deeper pullback on failure to hold $2,012
Gold has evolved within a large sideways consolidation since 2020. It attempted a breakout from this range last month however faced stiff resistance near $2,135. Recent breakout attempt too has petered out near $2,088.
A sideways consolidation is taking shape.
Defence of the 50-DMA near $2,012 would be crucial for continuation in up move. It would be interesting to see if Gold can establish beyond recent lower peak at $2,088 to confirm clear breakout from multi-year range.
Failure to hold above $2,012 could denote risk of a deeper pullback.
-
11:44
EUR/CHF to enjoy a mild rise in the coming months – Erste Group
Economists at Erste Group Research are forecasting a strengthening of the Euro (EUR) against the Swiss Franc (CHF).
Convergence of inflation differential should hamper further strengthening of Franc
Inflation rates in the two currency areas should be close to one other in the coming months. From this perspective, there should therefore be little reason for the Franc to strengthen further against the Euro.
In addition, the development of the currency pair also depends on the further course of the economy and the risk appetite of global investors. If the economic picture in the Eurozone gradually brightens, which we expect, this should also support the Euro against the Franc.
We continue to forecast a slight strengthening of the EUR against the CHF in the coming months.
In the event of a renewed rise in the recently reduced uncertainty in the global financial system (or the flare-up of any geopolitical conflicts), the Franc could strengthen sharply against the Euro at any time.
-
11:34
GBP/JPY recovery stalls below 185.55 as risk appetite fades
- The Sterling stalls below 185.50 with the upside trend intact.
- Hopes of a dovish BoJ are likely to weigh on the Yen.
- Investors await the release of key UK indicators this week.
The Sterling is trading higher against the Japanese Yen on Monday, although bullish momentum has faded at the mid-range of 185.00 during the London morning session as the market mood deteriorated.
In the absence of key macroeconomic releases today, the risk appetite that had fuelled the Pound’s recovery from Friday’s lows at 184.85 has waned on Monday, giving some oxygen to the safe-haven Yen.Key UK macroeconomic releases ahead
JPY bulls, however, are likely to remain subdued. The weak Tokyo CPI and wage growth data seen last week have boosted expectations that the Bank of Japan will maintain its ultra-loose policy after next week’s meeting, which is acting as a headwind for the Yen.
In the UK we have a busy calendar this week, starting with the employment report on Tuesday, consumer prices on Wednesday and the Retail sales figures on Friday.
In Japan, all eyes will be on Thursday’s National CPI data for confirmation of the deflationary trend anticipated by the Tokyo inflation reading. The risk of the Yen is skewed to the downside.
The pairs’ broad trend is bullish, with downside attempts seen as good entry options for bulls. Above 185.55 the next resistance is 186.16. Supports are at 184.48 and 182.70.Technical levels to watch
-
11:30
Oil takes a step back on calm start of fresh week
- WTI Oil slips back below line in the sand at $74.
- Tensions in the Middle East and Asia are not enough to demand a bigger risk premium in Oil.
- The DXY US Dollar Index holds above 102, with the US closed for Martin Luther King Day.
Oil prices are retreating further despite several geopolitical events taking place over the weekend. The main risk event is a possible retaliation or action from China against the election outcome in Taiwan where the ruling Democratic party won with its demands for more sovereignty and independence. Meanwhile several world leaders are joining Davos for the World Economic forum, with several side meetings to discuss hot topics like Ukraine, Taiwan, the Red Sea and Gaza tensions.
Meanwhile, the DXY US Dollar Index is drifting sideways with markets on edge on any change in equilibrium in any of the above mentioned hot topics. Intrinsically US Dollar strength is abating a bit as US economic data no longer beats estimates on all fronts, with several indicators starting to fall in contraction while the US labor data remains strong (for now). Traders have a holiday in the US, ahead of US Retail Sales and University of Michigan Consumer Sentiment later this week.
Crude Oil (WTI) trades at $72.27 per barrel, and Brent Oil trades at $77.61per barrel at the time of writing.
Oil News and Market Movers: Tension on high alert
- A second batch of airstrikes unfolded against Houthi rebels in Yemen by the US and UK on Friday and Saturday.
- Despite rising tensions in the Middle East, Red Sea and between China and Taiwan, Oil flows are still expected to stay normal and undisrupted.
- The monthly OPEC report is due on Tuesday with no big changes expected as crude prices remain unable to jump and stay above $74.
- Several companies in Europe are starting to report shortage of supplies due to longer routes along Africa while freight ships are no longer passing the Red Sea passage. This could unfold as stuck Oil supply in certain dependent regions.
Oil Technical Analysis: No means No
Oil prices remain unfit to substantially head higher in 2024. Though several big geopolitical elements are hanging in the balance, no one alone looks to bear enough risk to demand a higher premium in Oil prices. While OPEC+ is still unable to jack prices up, or at least support them, it will be up to traders not to miss the boat if Oil prices jump on a geopolitical breakout.
On the upside, $74 remains acting as a line in the sand after yet another failed break above it on Friday. Although quite far off, $80 comes into the picture should tensions build up further. Once $80 is broken, $84 is next on the topside once Oil sees a few daily closes above the $80 level.
Below $74, the $67 level could still come into play as the next support to trade at, as it aligns with a triple bottom from June. Should that triple bottom break, a new low for 2023 could be close at $64.35 – the low of May and March – as the last line of defence. Although still quite far off, $57.45 is worth mentioning as the next level to keep an eye on if prices fall sharply.
-638409129899654811.png)
US WTI Crude Oil: Daily Chart
WTI Oil FAQs
What is WTI Oil?
WTI Oil is a type of Crude Oil sold on international markets. The WTI stands for West Texas Intermediate, one of three major types including Brent and Dubai Crude. WTI is also referred to as “light” and “sweet” because of its relatively low gravity and sulfur content respectively. It is considered a high quality Oil that is easily refined. It is sourced in the United States and distributed via the Cushing hub, which is considered “The Pipeline Crossroads of the World”. It is a benchmark for the Oil market and WTI price is frequently quoted in the media.
What factors drive the price of WTI Oil?
Like all assets, supply and demand are the key drivers of WTI Oil price. As such, global growth can be a driver of increased demand and vice versa for weak global growth. Political instability, wars, and sanctions can disrupt supply and impact prices. The decisions of OPEC, a group of major Oil-producing countries, is another key driver of price. The value of the US Dollar influences the price of WTI Crude Oil, since Oil is predominantly traded in US Dollars, thus a weaker US Dollar can make Oil more affordable and vice versa.
How does inventory data impact the price of WTI Oil
The weekly Oil inventory reports published by the American Petroleum Institute (API) and the Energy Information Agency (EIA) impact the price of WTI Oil. Changes in inventories reflect fluctuating supply and demand. If the data shows a drop in inventories it can indicate increased demand, pushing up Oil price. Higher inventories can reflect increased supply, pushing down prices. API’s report is published every Tuesday and EIA’s the day after. Their results are usually similar, falling within 1% of each other 75% of the time. The EIA data is considered more reliable, since it is a government agency.
How does OPEC influence the price of WTI Oil?
OPEC (Organization of the Petroleum Exporting Countries) is a group of 13 Oil-producing nations who collectively decide production quotas for member countries at twice-yearly meetings. Their decisions often impact WTI Oil prices. When OPEC decides to lower quotas, it can tighten supply, pushing up Oil prices. When OPEC increases production, it has the opposite effect. OPEC+ refers to an expanded group that includes ten extra non-OPEC members, the most notable of which is Russia.
-
11:07
UK: Further evidence of disinflation would weaken the GBP – MUFG
The Pound Sterling (GBP) has outperformed at the start of 2024. GBP outperformance at the start of 2024 will be tested in the week ahead, economists at MUFG Bank report.
Will investor concerns over a higher risk of persistent inflation in the UK ease further?
The releases of the latest UK CPI and labour markets reports in the week ahead will provide important tests for the GBP. The reports will be scrutinized closely to better assess whether the disinflationary developments evident in December will be sustained.
Further evidence of disinflationary pressures poses the main downside risk to GBP outperformance at the start of this year.
-
11:00
USD/CAD returns above 1.3400 amid a weaker market sentiment and lower Oil prices
- The US Dollar is building up favoured by a weaker market sentiment.
- Oil prices are trading lower, increasing negative pressure on the CAD.
- Later today Canada's business outlook and manufacturing sales might give some support to the loonie.
The US Dollar is staging a comeback on Monday’s European session. The sourer market sentiment, with equity markets dipping to negative territory after a positive opening, and the lower oil prices are pushing the pair higher.
Investors seem to have digested the weaker-then-expected US PPI data seen on Friday, with the Greenback building up in a light trading session. The calendar is light and US stock markets are closed on bank holidays, this is leading to choppy and volatile trading.
Oil prices, Canada’s main export, are extending their reversal from Friday’s highs above $75. This is adding negative pressure on the loonie.
Later today, the Bank of Canada Business Outlook Survey and Manufacturing Sales data might give some support to the CAD. On Tuesday, Canadian CPI will be observed with attention for fresh cues on the BoC’s monetary policy ahead of Friday’s retail sales data.
In the US, the highlights of the week will be the US Retail Sales, due on Wednesday and the Michigan Consumer Sentiment Index, on Friday.
From a technical perspective, the US Dollar seems gaining bullish traction, aiming for 1.3455, the 61.8% retracement of the December sell-off. Above here, the next resistance is 1.3480 and 1.3545. Supports are 1.3375 and 1.3335.Technical levels to watch
-
10:41
EUR/USD drops to near 1.0940 as US Dollar recovers in a thin-volume trading session
- EUR/USD slips to near 1.0940 as investors’ risk-appetite eases amid long-weekend-induced volatility.
- The USD Index has rebounded sharply to near 102.60 despite persistent Fed rate-cut bets.
- German real Q4 GDP contracted by 0.3% as expected.
The EUR/USD pair falls to near 1.0940 in the European session. The major currency pair has faced selling pressure as the US Dollar Index (DXY) has recovered in a thin-volume trading session. Investors’ risk-appetite has trimmed amid volatility-induced by extended weekend in the United States on account of Martin Luther King Birthday.
S&P500 futures have witnessed some losses in the London session, indicating a risk-averse market mood. The USD index has recovered sharply 102.60 as investors see other central banks following Federal Reserve’s (Fed) path of rate cuts.
After the Fed, investors see other central banks also reducing interest rates due to easing price pressures and deepening risks of a technical recession. Unlike the Eurozone and the United Kingdom, the US economy is resilient on the grounds of Gross Domestic Product (GDP) growth, consumer spending, and labor market.
Meanwhile, investors await the US monthly Retail Sales data for December, which will be published on Thursday. As per the consensus, the economic data grew by 0.4% against 0.3% increase in November.
The USD Index will continue to be guided majorly by perception towards rate cuts by the Fed. As per the CME Fedwatch tool, traders see a 70% chance in support of rate cut by the Fed in March.
On the Eurozone front, the preliminary GDP of Germany has contracted by 0.3% in the fourth-quarter of 2023 as anticipated. Previously, the German economy grew by 1.8%.
While investors see the European Central Bank (ECB) reducing interest rates sooner, ECB Chief economist Philip Lane has commented that interest rate cut is not a near-term debate considering recent inflation data.
-
10:32
AUD/USD drops as market sentiment falters, approaching support at 0.6640
- The Aussie is under growing bearish pressure amid a deteriorating market mood.
- The PBoC decision to keep interest rates on hold has increased negative pressure on the Aussie.
- Below 0.6640, the next target is the 0.6520/40 area.
The Australian Dollar is accelerating its reversal from Friday’s highs during the European morning session. The sourer market sentiment, with European equity markets turning red after a positive opening, is providing support to the safe-haven US Dollar, and increasing Aussie’s weakness.
The calendar is light today, with US markets closed for the Martin Luther King bank holidays, which results in choppy and volatile trading. Later this week, the US Retail SalesUpbeat Australian data has failed to support the AUD
In Australia, higher TD Securities Inflation data suggests higher price pressures in the coming months. Furthermore, job advertisements increased in December, following three consecutive declines. These figures, however, have failed to provide any significant support to the Aussie.
Earlier today, the People’s Bank of China left its benchmark rate unchanged, disappointing investors who expected a rate cut to support the country’s stuttering economic recovery.
In this context, the China-proxy AUD is under increasing bearish pressure, with bears aiming for a key support area at 0.6640. Below here, the next target would be the 0.6520/40 area. Resistances are 0.6735 and 0.6760.Technical levels to watch
-
10:32
USD/JPY: Yen weakness can remain for longer – MUFG
The biggest mover amongst G10 currencies at the start of this year has been the Japanese Yen (JPY). USD/JPY higher for longer? Economists at MUFG Bank analyze the pair’s outlook.
Carry-seeking market participants likely see value in long USD/JPY
The return to carry will help support USD/JPY.
The BoJ risk to that trade looks limited for now. The escalation of geopolitical risks could also help support USD/JPY.
Higher crude oil prices are a Yen negative while increased global inflation risks may leave the Fed a little reluctant to push a dovish narrative, at least over the short-term as inflation risks could be seen to be rising.
-
10:19
Euro ticks higher as soft US PPI reinforces hopes of Fed interest-rate cuts
- The Euro nudges higher with the US Dollar weighed in heightened hopes of Fed cuts in March.
- A softer-than-expected US PPI on Friday sent the US Dollar lower across the board.
- Trading is light on Monday, with US markets closed on bank holiday.
The Euro (EUR) has opened the week on a moderately positive tone, with a mild appetite for risk prevailing in the European session. Trading volumes are expected to remain subdued, as US markets are closed for Martin Luther King's birthday, and the Eurozone industrial production is the only data worth mentioning today.
The US Dollar remains on the defensive, with the Dollar Index (DXY) unable to put a significant distance from late December lows. The inflation data released last week has failed to ease investors’ hopes that the Federal Reserve (Fed) will slash interest rates aggressively this year, starting with a 25 bps rate cut in March.
Traders welcomed December’s unexpected decline of the US Producer Prices Index (PPI), increasing their bets for Fed easing and ignoring the uptick in the CPI figures and Fed officials’ warnings about excessive optimism. US Treasury Yields retreated, with the benchmark 10-year yield dipping below the 4% level, and the US Dollar eased, to close the week practically flat.
This week, the focus will be on the Eurozone Consumer Price Index (CPI) and US Retail Sales data. These figures will give further insight into the Eurozone and US economic outlook and might help the EUR/USD to break the horizontal range that is constraining price action.Daily digest market movers: Euro maintains a mildly positive tone in risk-on environment
- The Euro is ticking up on a calm session on Monday with hopes of Fed cuts weighing on the US Dollar.
- Eurozone Industrial Production contracted at a 0.3% pace, as expected in December. Year-on-year, production declined 6.8%, well beyond the 5.9% expected.
- US PPI declined 0.1% in December on month, against expectations of a 0.1% increase, which has revived hopes of Fed cuts in March.
- The CME Group FedWatch Tool shows a more than 70% chance that the Fed will lower interest rates in March and a 75% possibility of another rate cut in May.
- Investors have ignored the uptick in the CPI and Fed officials’ comments affirming that it is still too early for rate cuts.
- European Central Bank (ECB) President Christine Lagarde showed an unprecedented bearish tone on Friday signaling the end of interest rate hikes, which is weighing on Euro bulls.
- ECB Board member and Governor of the Bank of Ireland, Philip Lane, has discarded any rate cut until June in an interview over the weekend. This has given some support to the Euro.
- In the Eurozone calendar on Wednesday, Eurostat is expected to confirm that the CPI accelerated to 2.9% year-on-year in December from 2.5% in November, while the Core inflation eased to a 3.4% yearly pace from the previous 3.6% rate.
- Also on Wednesday, US Retail Sales are expected to have increased in December, which might limit the US Dollar weakness.
Technical Analysis: EUR/USD maintains the broader positive trend
The EUR/USD keeps trading within a narrow range on Monday, with price action trapped between the 4-hour 100 and 200 SMAs, with the RSI flattening around the 50 level, which suggests a lack of clear direction.
The broader trend, however, remains positive, with price action reflecting higher highs and higher lows. Immediate support remains at 1.0930, where the 4-hour 200 SMA meets the price. Below here, the trendline support from early November lows, now around 1.0900, and the January 5 low at 1.0875 are likely to challenge bears.
On the upside, the pair needs to breach a strong resistance at 1.1000, where the pair has printed a double top. This level is closing the path toward a minor resistance at 1.1075, ahead of December’s peak at 1.1145.
Euro FAQs
What is the Euro?
The Euro is the currency for the 20 European Union countries that belong to the Eurozone. It is the second most heavily traded currency in the world behind the US Dollar. In 2022, it accounted for 31% of all foreign exchange transactions, with an average daily turnover of over $2.2 trillion a day.
EUR/USD is the most heavily traded currency pair in the world, accounting for an estimated 30% off all transactions, followed by EUR/JPY (4%), EUR/GBP (3%) and EUR/AUD (2%).What is the ECB and how does it impact the Euro?
The European Central Bank (ECB) in Frankfurt, Germany, is the reserve bank for the Eurozone. The ECB sets interest rates and manages monetary policy.
The ECB’s primary mandate is to maintain price stability, which means either controlling inflation or stimulating growth. Its primary tool is the raising or lowering of interest rates. Relatively high interest rates – or the expectation of higher rates – will usually benefit the Euro and vice versa.
The ECB Governing Council makes monetary policy decisions at meetings held eight times a year. Decisions are made by heads of the Eurozone national banks and six permanent members, including the President of the ECB, Christine Lagarde.How does inflation data impact the value of the Euro?
Eurozone inflation data, measured by the Harmonized Index of Consumer Prices (HICP), is an important econometric for the Euro. If inflation rises more than expected, especially if above the ECB’s 2% target, it obliges the ECB to raise interest rates to bring it back under control.
Relatively high interest rates compared to its counterparts will usually benefit the Euro, as it makes the region more attractive as a place for global investors to park their money.How does economic data influence the value of the Euro?
Data releases gauge the health of the economy and can impact on the Euro. Indicators such as GDP, Manufacturing and Services PMIs, employment, and consumer sentiment surveys can all influence the direction of the single currency.
A strong economy is good for the Euro. Not only does it attract more foreign investment but it may encourage the ECB to put up interest rates, which will directly strengthen the Euro. Otherwise, if economic data is weak, the Euro is likely to fall.
Economic data for the four largest economies in the euro area (Germany, France, Italy and Spain) are especially significant, as they account for 75% of the Eurozone’s economy.How does the Trade Balance impact the Euro?
Another significant data release for the Euro is the Trade Balance. This indicator measures the difference between what a country earns from its exports and what it spends on imports over a given period.
If a country produces highly sought after exports then its currency will gain in value purely from the extra demand created from foreign buyers seeking to purchase these goods. Therefore, a positive net Trade Balance strengthens a currency and vice versa for a negative balance.Fed FAQs
What does the Federal Reserve do, how does it impact the US Dollar?
Monetary policy in the US is shaped by the Federal Reserve (Fed). The Fed has two mandates: to achieve price stability and foster full employment. Its primary tool to achieve these goals is by adjusting interest rates.
When prices are rising too quickly and inflation is above the Fed’s 2% target, it raises interest rates, increasing borrowing costs throughout the economy. This results in a stronger US Dollar (USD) as it makes the US a more attractive place for international investors to park their money.
When inflation falls below 2% or the Unemployment Rate is too high, the Fed may lower interest rates to encourage borrowing, which weighs on the Greenback.How often does the Fed hold monetary policy meetings?
The Federal Reserve (Fed) holds eight policy meetings a year, where the Federal Open Market Committee (FOMC) assesses economic conditions and makes monetary policy decisions.
The FOMC is attended by twelve Fed officials – the seven members of the Board of Governors, the president of the Federal Reserve Bank of New York, and four of the remaining eleven regional Reserve Bank presidents, who serve one-year terms on a rotating basis.What is Quantitative Easing (QE) and how does it impact USD?
In extreme situations, the Federal Reserve may resort to a policy named Quantitative Easing (QE). QE is the process by which the Fed substantially increases the flow of credit in a stuck financial system.
It is a non-standard policy measure used during crises or when inflation is extremely low. It was the Fed’s weapon of choice during the Great Financial Crisis in 2008. It involves the Fed printing more Dollars and using them to buy high grade bonds from financial institutions. QE usually weakens the US Dollar.What is Quantitative Tightening (QT) and how does it impact the US Dollar?
Quantitative tightening (QT) is the reverse process of QE, whereby the Federal Reserve stops buying bonds from financial institutions and does not reinvest the principal from the bonds it holds maturing, to purchase new bonds. It is usually positive for the value of the US Dollar.
-
10:14
India Gold price today: Gold rises, according to MCX data
Gold prices rose in India on Monday, according to data from India's Multi Commodity Exchange (MCX).
Gold price stood at 62,178 Indian Rupees (INR) per 10 grams, up INR 112 compared with the INR 62,066 it cost on Friday.
As for futures contracts, Gold prices increased to INR 62,615 per 10 gms from INR 62,362 per 10 gms.
Prices for Silver futures contracts decreased to INR 72,777 per kg from INR 72,480 per kg.
Major Indian city Gold Price Ahmedabad 64,710 Mumbai 64,485 New Delhi 64,580 Chennai 64,690 Kolkata 64,640 Global Market Movers: Comex Gold price extends gains on renewed Fed cut bets
- Comex Gold price shows stabilization above the crucial support of $2,050, supported by persistent rate cut expectations and a potential spillover of the Middle East crisis.
- Investors’ confidence that the Federal Reserve (Fed) will reduce interest rates from March has increased after the release of the softer-than-projected United States PPI report for December.
- The annual PPI grew 1.0%, slower than the 1.3% anticipated by investors. The core PPI decelerated to 1.8% against the consensus of 1.9% and the prior reading of 2.0%.
- Producers cut prices of goods and services at factory gates amid the decline in gasoline and food prices, which indicates a soft outlook for consumer price inflation and increasing odds that interest rates decline from March.
- As per the CME Fedwatch Tool, chances in favor of a 25-basis-points (bps) interest rate cut to 5.00%-5.25% in March jumped to 70% from 62% after the PPI report.
- Fed policymakers continue to reiterate the need to maintain interest rates in a restrictive trajectory to ensure that underlying inflation will return to 2% in a timely manner.
- The next trigger for Gold price will be the monthly US Retail Sales data for December and the Fed’s Beige Book, which will be released on Wednesday.
- Investors expect the US monthly Retail Sales to have grown by 0.4% against a 0.3% jump in November. Retail sales excluding automobiles are seen growing steadily by 0.2%.
- On the global front, fears of a widening Israel-Hamas war have escalated after the airstrikes from the US and the UK on Houthis..
- Deepening Middle East tensions have improved demand for non-yielding assets.
- Meanwhile, the US Dollar Index (DXY) is stuck in a tight range around 102.50 amid lower trading volume as US markets are closed on account of Martin Luther King Birthday. The 10-year US Treasury yields have rebounded to near 3.98%.
(An automation tool was used in creating this post.)
Gold FAQs
Why do people invest in Gold?
Gold has played a key role in human’s history as it has been widely used as a store of value and medium of exchange. Currently, apart from its shine and usage for jewelry, the precious metal is widely seen as a safe-haven asset, meaning that it is considered a good investment during turbulent times. Gold is also widely seen as a hedge against inflation and against depreciating currencies as it doesn’t rely on any specific issuer or government.
Who buys the most Gold?
Central banks are the biggest Gold holders. In their aim to support their currencies in turbulent times, central banks tend to diversify their reserves and buy Gold to improve the perceived strength of the economy and the currency. High Gold reserves can be a source of trust for a country’s solvency. Central banks added 1,136 tonnes of Gold worth around $70 billion to their reserves in 2022, according to data from the World Gold Council. This is the highest yearly purchase since records began. Central banks from emerging economies such as China, India and Turkey are quickly increasing their Gold reserves.
How is Gold correlated with other assets?
Gold has an inverse correlation with the US Dollar and US Treasuries, which are both major reserve and safe-haven assets. When the Dollar depreciates, Gold tends to rise, enabling investors and central banks to diversify their assets in turbulent times. Gold is also inversely correlated with risk assets. A rally in the stock market tends to weaken Gold price, while sell-offs in riskier markets tend to favor the precious metal.
What does the price of Gold depend on?
The price can move due to a wide range of factors. Geopolitical instability or fears of a deep recession can quickly make Gold price escalate due to its safe-haven status. As a yield-less asset, Gold tends to rise with lower interest rates, while higher cost of money usually weighs down on the yellow metal. Still, most moves depend on how the US Dollar (USD) behaves as the asset is priced in dollars (XAU/USD). A strong Dollar tends to keep the price of Gold controlled, whereas a weaker Dollar is likely to push Gold prices up.
-
10:02
US Dollar is more at risk of a rebound than a further correction from these levels – ING
In the United States (US), rate expectations are still disjointed from data. Economists at ING analyze Dollar’s outlook as investors are waiting on central bankers to shake data-resistant markets.
USD may stay rangebound
Investors have cemented Fed easing expectations despite some hotter-than-expected US data.
We suspect a market reluctant to price out rate cuts will need strong words from the Fed – perhaps Fed Chief Jerome Powell himself – to reconnect rate expectations with data.
We think the Dollar is more at risk of a rebound than a further correction from these levels, although the chances of another rangebound trading week in FX (DXY still hovering in the 102/103 region) are high.
-
10:01
Gold price nears weekly high, supported by macroeconomic and geopolitical tailwinds
- Gold price is aiming to reclaim weekly high as bets supporting Fed rate cuts deepen.
- Fears of stubborn US inflation have faded after a surprisingly soft PPI report.
- Deepening Middle East tensions have improved the appeal for safe-haven assets.
Gold price (XAU/USD) continues to enjoy decent demand on Monday’s European session amid multiple tailwinds. The precious metal is attracting investments as market participants seem more convinced about the Federal Reserve (Fed) reducing borrowing costs from March after the release of the surprisingly soft Producer Price Index (PPI) numbers for December.
Investors expect that a decline in the prices of goods and services at their factory gates will eventually result in easing inflation pressures further. This also suggests that inflation is progressively declining towards the 2% target.
Meanwhile, the appeal for Gold has also improved due to escalating geopolitical tensions in the Middle East. US and the UK military have launched airstrikes targeting Houthis in retaliation for attacking commercial shipments of Oil in the Red Sea. This has deepened fears of an escalating war in Gaza amid the potential participation of Iran in the Israel-Hamas war.
Daily digest market movers: Gold extends gains on renewed Fed cut bets
- Gold price shows stabilization above the crucial support of $2,050, supported by persistent rate cut expectations and a potential spillover of the Middle East crisis.
- Investors’ confidence that the Federal Reserve (Fed) will redue interest rates from March has increased after the release of the softer-than-projected United States PPI report for December.
- The annual PPI grew 1.0%, slower than the 1.3% anticipated by investors. The core PPI decelerated to 1.8% against the consensus of 1.9% and the prior reading of 2.0%.
- Producers cut prices of goods and services at factory gates amid the decline in gasoline and food prices, which indicates a soft outlook for consumer price inflation and increasing odds that interest rates decline from March.
- As per the CME Fedwatch Tool, chances in favour of a 25-basis-points (bps) interest rate cut to 5.00%-5.25% in March jumped to 70% from 62% after the PPI report.
- Fed policymakers continue to reiterate the need to maintain interest rates in a restrictive trajectory to ensure that underlying inflation will return to 2% in a timely manner.
- The next trigger for Gold price will be the monthly US Retail Sales data for December and the Fed’s Beige Book, which will be released on Wednesday.
- Investors expect the US monthly Retail Sales to have grown by 0.4% against a 0.3% jump in November. Retail sales excluding automobiles are seen growing steadily by 0.2%.
- On the global front, fears of a widening Israel-Hamas war have escalated after the airstrikes from the US and the UK on Houthis..
- Deepening Middle East tensions have improved demand for non-yielding assets.
- Meanwhile, the US Dollar Index (DXY) is stuck in a tight range around 102.50 amid lower trading volume as US markets are closed on account of Martin Luther King Birthday. The 10-year US Treasury yields have rebounded to near 3.98%.
Technical Analysis: Gold price aims to recapture weekly high slightly above $2,060
-638409095969899458.png)
Gold price is an inch far from recapturing a weekly high of $2,063 amid persistent bets that the Fed will cut interest rates in March. The precious metal delivered a sharp recovery after discovering strong buying interest while re-testing the crucial support around $2,040. The 14-period Relative Strength Index (RSI) has shifted into the upper range of 60.00-80.00, which indicates that a bullish momentum is active.
The broader appeal for Gold is also bullish as short-to-long-term daily Exponential Moving Averages (EMAs) are sloping higher. The 14-period RSI, on the daily timeframe, is aiming to climb above 60.00.
Gold FAQs
Why do people invest in Gold?
Gold has played a key role in human’s history as it has been widely used as a store of value and medium of exchange. Currently, apart from its shine and usage for jewelry, the precious metal is widely seen as a safe-haven asset, meaning that it is considered a good investment during turbulent times. Gold is also widely seen as a hedge against inflation and against depreciating currencies as it doesn’t rely on any specific issuer or government.
Who buys the most Gold?
Central banks are the biggest Gold holders. In their aim to support their currencies in turbulent times, central banks tend to diversify their reserves and buy Gold to improve the perceived strength of the economy and the currency. High Gold reserves can be a source of trust for a country’s solvency. Central banks added 1,136 tonnes of Gold worth around $70 billion to their reserves in 2022, according to data from the World Gold Council. This is the highest yearly purchase since records began. Central banks from emerging economies such as China, India and Turkey are quickly increasing their Gold reserves.
How is Gold correlated with other assets?
Gold has an inverse correlation with the US Dollar and US Treasuries, which are both major reserve and safe-haven assets. When the Dollar depreciates, Gold tends to rise, enabling investors and central banks to diversify their assets in turbulent times. Gold is also inversely correlated with risk assets. A rally in the stock market tends to weaken Gold price, while sell-offs in riskier markets tend to favor the precious metal.
What does the price of Gold depend on?
The price can move due to a wide range of factors. Geopolitical instability or fears of a deep recession can quickly make Gold price escalate due to its safe-haven status. As a yield-less asset, Gold tends to rise with lower interest rates, while higher cost of money usually weighs down on the yellow metal. Still, most moves depend on how the US Dollar (USD) behaves as the asset is priced in dollars (XAU/USD). A strong Dollar tends to keep the price of Gold controlled, whereas a weaker Dollar is likely to push Gold prices up.
-
10:00
Eurozone Trade Balance s.a. increased to €14.8B in November from previous €10.9B
-
10:00
Eurozone Industrial Production w.d.a. (YoY) registered at -6.8%, below expectations (-5.9%) in November
-
10:00
Eurozone Trade Balance n.s.a. rose from previous €11.1B to €20.3B in November
-
10:00
Eurozone Industrial Production s.a. (MoM) meets forecasts (-0.3%) in November
-
09:32
EUR/GBP can retest the 0.8573 lows – ING
The UK Consumer Price Index (CPI) report will be released on Wednesday. Economists at ING analyze the Pound Sterling (GBP) outlook ahead of inflation data.
Services inflation to stay above 6%
Services inflation is what matters the most for the Bank of England at the current stage and we expect to see it at 6.1% this week, considerably below the Bank of England's estimates. Despite the improvement in services disinflation, 6%+ remains too high and is unlikely to make the BoE endorse dovish rate expectations just yet.
EUR/GBP can retest the 0.8573 lows, but we expect it to find a bit more support this week as the Euro may benefit from some hawkish comments by ECB President Christine Lagarde in Davos. Our medium-term view on the pair remains bullish.
-
09:25
German Economy Ministry: Key stress factors for economy are likely to reduce over course of 2024
In a report published on Monday, the German Economy Ministry noted that “key stress factors for the economy are likely to reduce over course of this year.”
Additional points
A recovery will be primarily driven by the domestic economy.
Current early indicators do not signal a quick economic recovery.
Related reads
- German 2023 preliminary GDP contracts 0.3% YoY, as expected
- EUR/USD: Trading sustainably above 1.10 is premature – ING
-
09:07
USD/CHF hangs around 0.8530, risk-aversion emerges after Houthi’s attack USS Laboon
- USD/CHF treads water to continue its winning streak as the US Dollar improves.
- The escalated concern in the Red Sea could have supported the safe-haven CHF.
- The 28,000 leaders are expected to participate in the 54th World Economic Forum Annual Meeting in Davos.
The USD/CHF pair moves sideways in the presence of heightened geopolitical conflict in the Middle East, hovering around 0.8530 during the European session on Monday. The Iran-backed Houthi militia launched an anti-ship missile at the USS Laboon in the Red Sea on Monday, which was intercepted by a US fighter jet, resulting in no harm to the navy vessel or the aircraft. This situation follows the military attacks on Iran-led Houthi targets carried out by the United States (US) and the United Kingdom (UK) on Friday. These events are perceived to have bolstered the demand for the safe-haven currency Swiss Franc (CHF).
US Dollar Index (DXY) trims intraday losses, improving toward 102.50 at the time of writing. The Greenback faced challenges after the release of the downbeat Producer Price Index (PPI) data on Friday as it reinforces the market speculation of Federal Reserve’s rate cuts as early as March by 25 basis points. The US Producer Price Index (PPI) figure was reported at 1.0% year-on-year in December, surpassing the previous reading of 0.8%. However, the Core PPI year-on-year arrived at 1.8%, down from 2.0% in November. The monthly headline and Core PPI indices remained at a 0.1% decline and 0.0%, respectively.
On the Swiss side, the Swiss Franc (CHF) gained support and recorded profits last week, driven by positive economic data. The Consumer Price Index (YoY) for December showed continued growth, and there was an improvement in Real Retail Sales. These positive economic indicators contributed to the overall strength of the Swiss Franc.
Additionally, the upcoming five-day World Economic Forum in Davos is anticipated to have an impact. More than 28,000 leaders from around the world are expected to participate in the 54th World Economic Forum Annual Meeting, starting on Monday. The event could provide insights and discussions on various economic and geopolitical issues.
-
09:07
German 2023 preliminary GDP contracts 0.3% YoY, as expected
Germany’s preliminary Real GDP for 2023 contracted at an annual pace of 0.3%, as widely expected, the latest data published by the federal statistics authority Destatis showed Monday.
Additional takeaways
Meanwhile, the German fourth-quarter (Q4) GDP in 2023 fell 0.3% compared with the previous quarter.
Measured as a percentage of nominal GDP, there was a 2.0% deficit ratio of general government for 2023.
German general government budget recorded financial deficit of EUR82.7 billion at end of 2023.
Market reaction
EUR/USD is defending minor bids near 1.0950 following the German data. The pair is stuck in a narrow range due to the US holiday-led thin trading.
Euro price today
The table below shows the percentage change of Euro (EUR) against listed major currencies today. Euro was the strongest against the .
USD EUR GBP CAD AUD JPY NZD CHF USD -0.04% 0.00% -0.03% 0.03% -0.03% 0.06% 0.01% EUR 0.06% 0.03% -0.01% 0.06% 0.01% 0.10% 0.05% GBP -0.01% -0.03% -0.04% 0.02% -0.02% 0.07% 0.02% CAD 0.05% 0.00% 0.05% 0.06% 0.00% 0.10% 0.06% AUD -0.03% -0.06% 0.00% -0.05% -0.03% 0.05% 0.01% JPY 0.04% -0.04% -0.11% -0.01% 0.06% 0.09% 0.04% NZD -0.06% -0.13% -0.07% -0.11% -0.05% -0.09% -0.05% CHF 0.00% -0.06% -0.02% -0.06% 0.01% -0.05% 0.04% The heat map shows percentage changes of major currencies against each other. The base currency is picked from the left column, while the quote currency is picked from the top row. For example, if you pick the Euro from the left column and move along the horizontal line to the Japanese Yen, the percentage change displayed in the box will represent EUR (base)/JPY (quote).
-
09:01
Gold Price Forecast: XAU/USD likely to see data-driven volatility as $2,200 Q2 target is in sight – TDS
Gold (XAU/USD) is sitting near the highest level in five days above $2,050. Strategists at TD Securities analyze the yellow metal’s outlook.
Strong labor markets are associated with continued inflation pressures
Strong labor markets are associated with continued inflation pressures. And with core CPI much above the two percent target, the market concluded that a very early Fed easing is not in the cards. But with the most recent production prices coming in at below expectations, the market is once again going long, as it anticipates an early end to restrictive policy.
There will likely be data-driven volatility as Gold trends to our $2,200 Q2 target.
-
09:01
Italy Trade Balance EU fell from previous €-0.684B to €-2.385B in November
-
09:01
Italy Global Trade Balance fell from previous €4.699B to €3.889B in November
-
09:00
Germany Real GDP Growth meets forecasts (-0.3%)
-
08:30
The US Dollar might benefit from some outflows from exposed EM FX – ING
USD Index fluctuates at around 102.40. Economists at ING analyze Dollar’s outlook for the week ahead.
US Dollar will be driven more by other events than data this week
The US data calendar isn’t very busy this week. Retail Sales and the University of Michigan inflation expectations will attract the most attention along with jobless claims – which came in well below expectations last week, reinforcing the narrative of a still-tight labour market. We think the Dollar will be driven more by other events than data this week, barring major surprises.
First, the results of the election in Taiwan have raised again the delicate question of Taipei-Beijing relationships, with tensions among the two seen as a major risk for Asian and global risk sentiment this year. The Dollar might benefit from some outflows from exposed EM FX. The situation in the Gulf also looks rather volatile after the US and UK military operations last week, even though the impact on Oil prices has been muted so far.
Domestically, we’ll monitor the market reaction to the business tax relief extension currently being discussed in the US Congress. The impact of fiscal support may turn out to be negative for risk sentiment – and positive for the Dollar – as markets see a greater risk of sticky inflation and a lower chance of Fed rate cuts.
-
08:28
Pound Sterling turns sideways ahead of UK labor market data
- Pound Sterling trades back and forth as investors shift focus towards the UK Employment data.
- Soft wage growth data would soften inflation outlook and increase expectations of the BoE cutting interest rates.
- Market volume to remain thin amid extended weekend in US markets.
The Pound Sterling (GBP) remains muted as investors await the United Kingdom labor market data for three-months ending November, which will be published on Tuesday. Investors are anticipating a sharp decline in the wage growth and see labor market conditions cooling further due to higher interest rates by the Bank of England (BoE) and deepening cost-of-living crisis amid stubborn consumer inflation.
Soft wage growth data would improve progress in inflation returning towards 2% as lower earnings will eventually result in a decline in households’ spending power. Stubbornly higher wage growth has remained a major booster of sticky consumer price inflation and a decline in the same will provide more relief to BoE policymakers.
The GBP/USD pair is likely to remain inside the woods as the United States markets are closed on Monday. Trading volume is expected to remain thin due to an extended weekend. However, persistent bets in favour of rate cuts from the Federal Reserve (Fed) in the March monetary policy meeting would keep the US Dollar Index (DXY) on the backfoot.
Daily Digest Market Movers: Pound Sterling remains sideways on closed US markets
- Pound Sterling struggles for a decisive move as investors await the United Kingdom labor market data for three months ending November, which will be published on Tuesday.
- Demand for labor is expected to remain vulnerable as job postings by the United Kingdom employers were 32% lower in December from a year ago. The Recruitment and Employment Confederation (REC) department said that permanent jobs declined all through 2023.
- Investors have projected a slight rise in the Unemployment Rate to 4.3% against the prior reading of 4.2%.
- The market participants will keenly focus on the Average Earnings data as robust wage growth has remained a key driver keeping consumer price inflation elevated in the United Kingdom economy.
- Average Earnings excluding bonuses is expected to decelerate sharply to 6.6% against 7.3% growth in the period of quarter-to-October while earnings data including bonuses is expected to soften to 6.8% from 7.2% in a similar period.
- A sharp decline in wage growth would wane fears of persistent inflation and escalate odds of early rate cuts by the Bank of England.
- The Bank of America (BofA) predicts the BoE will consider cutting interest rates after its August monetary policy meeting. This contrasts with prior expectations of February 2025.
- On the contrary, BoE policymakers have not publicly discussed rate cuts at all as the consumer price inflation in the UK economy is highest in comparison with other Group of Seven economies.
- BoE policymakers have been reiterating the need to keep interest rates in an elevated trajectory to ensure that inflation will return to 2% in a sustainable manner.
- After being vulnerable in 2023, the British real estate sector has made a decent start to2024. The UK’s leading real estate platform Rightmove reported a 1.3% increase in asking prices in the period of December 3 to January 6, the highest since 2020.
- The market mood is quiet amid an extended weekend in the United States market due to it being Martin Luther King Day.
- The US Dollar Index (DXY) trades back-and-forth around 102.40 as investors shift focus towards the monthly Retail Sales data and the release of the Federal Reserve’s (Fed) Beige Book on Wednesday.
- Meanwhile, investors’ confidence towards a rate cut decision from the Fed in March has improved after the release of the softer-than-projected Producer Price Index (PPI) report for December.
- As per the CME FedWatch tool, chances supporting a rate cut in March have improved to 70% after declining to 62% last week.
Technical Analysis: Pound Sterling consolidates above 1.2700
Pound Sterling trades listless above the crucial support of 1.2700 as investors await the crucial UK data for further action. The GBP/USD pair has oscillated in a range between 1.2674-1.2784 for the past week. The broader appeal is still bullish as the 20 and 50-day Exponential Moving Averages (EMAs) are sloping higher. The 14-period Relative Strength Index (RSI) oscillates in the 40.00-60.00 range, indicating a consolidation ahead. Fresh upside in Cable is expected if it manages to climb above five-month high around 1.2820.
Pound Sterling FAQs
What is the Pound Sterling?
The Pound Sterling (GBP) is the oldest currency in the world (886 AD) and the official currency of the United Kingdom. It is the fourth most traded unit for foreign exchange (FX) in the world, accounting for 12% of all transactions, averaging $630 billion a day, according to 2022 data.
Its key trading pairs are GBP/USD, aka ‘Cable’, which accounts for 11% of FX, GBP/JPY, or the ‘Dragon’ as it is known by traders (3%), and EUR/GBP (2%). The Pound Sterling is issued by the Bank of England (BoE).How do the decisions of the Bank of England impact on the Pound Sterling?
The single most important factor influencing the value of the Pound Sterling is monetary policy decided by the Bank of England. The BoE bases its decisions on whether it has achieved its primary goal of “price stability” – a steady inflation rate of around 2%. Its primary tool for achieving this is the adjustment of interest rates.
When inflation is too high, the BoE will try to rein it in by raising interest rates, making it more expensive for people and businesses to access credit. This is generally positive for GBP, as higher interest rates make the UK a more attractive place for global investors to park their money.
When inflation falls too low it is a sign economic growth is slowing. In this scenario, the BoE will consider lowering interest rates to cheapen credit so businesses will borrow more to invest in growth-generating projects.How does economic data influence the value of the Pound?
Data releases gauge the health of the economy and can impact the value of the Pound Sterling. Indicators such as GDP, Manufacturing and Services PMIs, and employment can all influence the direction of the GBP.
A strong economy is good for Sterling. Not only does it attract more foreign investment but it may encourage the BoE to put up interest rates, which will directly strengthen GBP. Otherwise, if economic data is weak, the Pound Sterling is likely to fall.How does the Trade Balance impact the Pound?
Another significant data release for the Pound Sterling is the Trade Balance. This indicator measures the difference between what a country earns from its exports and what it spends on imports over a given period.
If a country produces highly sought-after exports, its currency will benefit purely from the extra demand created from foreign buyers seeking to purchase these goods. Therefore, a positive net Trade Balance strengthens a currency and vice versa for a negative balance. -
08:19
USD/JPY halts its losses despite downbeat US Treasury yields, trades higher near 145.40
- USD/JPY gains ground on improved US Dollar.
- Risk-averse sentiment contributes support to strengthening the Greenback
- BOJ is expected to maintain its inflation projection near 2.0% target in the coming years.
USD/JPY trades higher after registering two days of losses. The USD/JPY pair hovers around 145.40 during the early European session on Monday. The US Dollar Index (DXY) retraces its intraday losses, trading around 102.40, at the time of writing. However, the US Federal Reserve (Fed) is expected to cut interest rates by 25 basis points in its March meeting, which puts downward pressure on the US Dollar.
Moreover, the Greenback also faces a challenge on downbeat US Treasury yields, which could be attributed to the weaker-then-expected Producer Price Index (PPI) data from the United States (US). The 2-year and 10-year yields on US bond coupons stand lower at 4.14% and 3.94%, respectively, by the press time.
The Bank of Japan released the Money Supply M2+CD (YoY) for December, which remained consistent at 2.3% as previously. Machine Tool Orders (YoY) decline by 9.9% from the previous decline of 13.6, respectively. Moreover, Japan's two-year yield has dropped back under zero for the first time since July 2023.
On Friday, reports indicated that the Bank of Japan (BOJ) is likely to lower its core inflation forecast for the fiscal year 2024 due to the recent decline in oil prices. Despite global economic uncertainty and subdued spending, the BOJ is expected to maintain its projection that trend inflation will remain near its 2.0% target in the coming years. This updated forecast will be included in the bank's quarterly outlook report scheduled for its upcoming January meeting. It is widely anticipated that the BOJ will keep its ultra-loose policy settings unchanged during this policy meeting.
Japan’s Consumer Price Index (CPI) data will be observed on Friday by the traders. On the US docket, traders will likely observe the Retail Sales data on Wednesday and housing data on Thursday.
-
08:01
EUR/USD: Trading sustainably above 1.10 is premature – ING
The World Economic Forum in Davos kicks off Monday. Economists at ING analyze EUR/USD outlook ahead of ECB President Christine Lagarde’s remarks.
Lagarde may sound more hawkish in Davos
Despite ECB hawks' protests against dovish expectations having had little impact on the market, the WEF event in Davos this week – which sees many ECB speakers including President Christine Lagarde – should not be overlooked.
Lagarde has a greater potential to influence markets given a clearly divided Governing Council, and we suspect that she will opt for a more hawkish tone compared to last week’s comments.
There may be some help for the Euro coming from Davos, although we should be wary. Fed expectations have been resistant to data and the same could hold true for the ECB as well. The minutes from the December policy meeting are also released this week.
We still think it is premature for EUR/USD to trade sustainably above 1.10.
-
08:00
Turkey Budget Balance fell from previous 75.63B to -842.53B in December
-
07:27
USD/IDR set to move toward 15,000 by end-2024 – Standard Chartered
Economists at Standard Chartered analyze Indonesia’s macroeconomic outlook and share their forecast for the Rupiah (IDR.)
2024 GDP growth to pick up to 5.2% YoY
We expect 2024 GDP growth to pick up to 5.2% YoY on a continued cyclical recovery, election spending, and still-healthy demand for Indonesia’s main export commodities.
We expect BI to start cutting rates in H2, with a risk of an earlier cut should the Fed move faster on a sharper US economic downturn.
We stay constructive on the Indonesian Rupiah and see USD/IDR appreciating to 15,000 by end-2024 on resumed portfolio flows.
-
07:06
FX option expiries for Jan 15 NY cut
FX option expiries for Jan 15 NY cut at 10:00 Eastern Time, via DTCC, can be found below.
- EUR/USD: EUR amounts
- 1.0890 1.1b
- 1.0950 1.3b
- 1.1000 1.3b
- 1.1050 3b
- GBP/USD: GBP amounts
- 1.2710 437m
- USD/JPY: USD amounts
- 144.00 644m
- 145.00 730m
- AUD/USD: AUD amounts
- 0.6690 637m
- 0.6840 1b
- USD/CAD: USD amounts
- 1.3470 480m
- NZD/USD: NZD amounts
- 0.6175 533m
- 0.6195 581m
- 0.6340 972m
-
07:01
Sweden Consumer Price Index (MoM) came in at 0.7%, above forecasts (0.6%) in December
-
07:00
Germany Wholesale Price Index (MoM) down to -0.6% in December from previous -0.2%
-
07:00
Norway Trade Balance fell from previous 80.1B to 77.3B in December
-
07:00
Germany Wholesale Price Index (YoY) up to -2.6% in December from previous -3.6%
-
07:00
Sweden Consumer Price Index (YoY) came in at 4.4%, above forecasts (4.3%) in December
-
06:43
EUR/JPY Price Analysis: Snaps the two-day losing streak above the 159.00 mark
- EUR/JPY rebounds to 159.25 ahead of the Eurozone Industrial Production data.
- The cross keeps the bullish vibe unchanged above the key EMA; RSI indicator stands above the 50 midline.
- The critical upside barrier is seen at 160.00; the key support level is located at the 158.30–158.40 zone.
The EUR/JPY cross snaps the two-day losing streak during the early European session on Monday. The European Central Bank (ECB) chief economist Philip Lane said on Saturday that the central bank will have important data by June to decide on a likely series of interest rate cuts, but moving prematurely may prove self-defeating. Investors anticipate that the ECB may cut interest rates sooner than anticipated. At the press time, EUR/JPY is trading at 159.25, gaining 0.36% on the day.
According to the four-hour chart, the bullish outlook of EUR/JPY remains intact as the cross holds above the 50- and 100-hour Exponential Moving Averages (EMA). The positive bias is backed by the 14-day Relative Strength Index (RSI) which stands above the 50 midline, indicating the further upside looks favorable.
The critical upside barrier is seen near a high of January 10, and the psychological round mark at 160.00. A break above the latter will see a rally to the upper boundary of Bollinger Band at 160.15. Any follow-through buying will pave the way to a high of December 1 at 161.77.
On the flip side, the key support level to watch is the confluence of the lower limit of the Bollinger Band and the 50-hour EMA at the 158.30–158.40 region. Further south, the next contention level is located at the 100-EMA at 157.95. A breach of this level will see a drop to a low of January 9 at 157.20.EUR/JPY four-hour chart
-638408966040747842.png)
-
06:30
India WPI Inflation came in at 0.73% below forecasts (0.9%) in December
-
06:29
Japan Machine Tool Orders (YoY) rose from previous -13.6% to -9.9% in December
-
06:10
Forex Today: Choppy action to extend amid holiday-thinned trading
Here is what you need to know on Monday, January 15:
After a mixed Asian trading, cautious optimism appears to extend into the European morning on Monday, as investors remain rather cautious starting out a fresh week. Also, it’s a US market holiday, in observance of Martin Luther King Jr. Day, justifying the subdued market action.
Further, they assess a slew of the latest fundamental factors and their implications on the financial markets, leaving the US Dollar (USD) scouting for a clear direction against its major peers. At the time of writing, the US Dollar Index is moving back and forth in a tight band, having slipped from higher levels on Friday after the US Producer Price Index (PPI) unexpectedly fell in December, ramping up Fed March rate cut bets that dragged US Treasury bond yields lower.
US Dollar price today
The table below shows the percentage change of US Dollar (USD) against listed major currencies today. US Dollar was the weakest against the Euro.
USD EUR GBP CAD AUD JPY NZD CHF USD -0.04% 0.00% -0.03% 0.03% -0.03% 0.06% 0.01% EUR 0.06% 0.03% -0.01% 0.06% 0.01% 0.10% 0.05% GBP -0.01% -0.03% -0.04% 0.02% -0.02% 0.07% 0.02% CAD 0.05% 0.00% 0.05% 0.06% 0.00% 0.10% 0.06% AUD -0.03% -0.06% 0.00% -0.05% -0.03% 0.05% 0.01% JPY 0.04% -0.04% -0.11% -0.01% 0.06% 0.09% 0.04% NZD -0.06% -0.13% -0.07% -0.11% -0.05% -0.09% -0.05% CHF 0.00% -0.06% -0.02% -0.06% 0.01% -0.05% 0.04% The heat map shows percentage changes of major currencies against each other. The base currency is picked from the left column, while the quote currency is picked from the top row. For example, if you pick the Euro from the left column and move along the horizontal line to the Japanese Yen, the percentage change displayed in the box will represent EUR (base)/JPY (quote).
Markets are now pricing about a 75% chance that the US Federal Reserve (Fed) will begin cutting rates in March, as compared to a 68% probability a week ago, according to the CME Group’s FedWatch tool. The US Treasury bond yields are consolidating the previous week’s decline, checking the upside attempts in the US Dollar.
However, the US Dollar manages to find some support from safe-haven flows amid escalating Middle East geopolitical risks and simmering China-Taiwan tensions. Reuters reported that Iran-backed Houthi militants launched an anti-ship cruise missile at a US Navy ship.
Over the weekend, Taiwan’s ruling Democratic Progressive Party (DPP) won the presidential election while losing its legislative majority. US Secretary of State Antony Blinken sent Taiwanese president-elect William Lai a message of congratulations following the result. China's Foreign Ministry responded, saying that "China firmly opposes the US having any form of official interaction with Taiwan and interfering in Taiwan affairs in any way or under any pretext."
Additionally, investors refrain from placing fresh bets on major currency pairs ahead of the crucial Gross Domestic Product (GDP) from China, especially after the People’s Bank of China (PBOC) surprised markets with no reduction to the Medium-Term Lending Facility (MLF) rate.
Against this backdrop, the optimism surrounding the Antipodeans remains checked, with AUD/USD defending small gains just below 0.6700 while the NZD/USD pair is pressured toward 0.6200 after facing rejection at 0.6250. The US S&P 500 futures, a risk barometer, are trading flat on the day.
The Japanese Yen seems to be weakest against the US Dollar so far, as USD/JPY has recaptured the 145.00 level. US Senate Democratic leader Schumer said congressional leaders have agreed to a stopgap funding measure, preventing a government shutdown until March. This political headline has also acted as a tailwind for the US Dollar. Meanwhile, Japan's 2-year yield dropped back under zero for the first time since July 2023, weighing on the Yen.
EUR/USD is posting small gains above 1.0950, underpinned by European Central Bank’s (ECB) Chief Economist Philip Lane’s comments, which helped push back against the market expectations for an ECB April rate cut. Lane said that the ECB will have key data by June to decide on the first of a likely series of rate cuts. Focus shifts to the German 2023 GDP report and Eurozone Industrial Production data due later in the European session.
GBP/USD is trading better bid at around 1.2750, struggling amid sluggish markets. Data published by the Office for National Statistics (ONS) showed on Friday, Britain's economy grew 0.3%, slightly more strongly than expected in November but remains at risk of slipping into a mild recession.
USD/CAD is battling 1.3400 even though the WTI oil price is on the defensive just shy of $73 early Monday. The geopolitical developments surrounding the West and Houthis in the Red Sea will be closely followed.
Gold price is looking to build on the previous’s week recovery above $2,050, underpinned by the dovish Fed expectations and the Middle East geopolitical risks.
-
06:01
Japan Machine Tool Orders (YoY): -15.5% (December) vs previous -13.6%
-
05:58
NZD/USD edges lower to near 0.6230 on risk averse sentiment
- NZD/USD retraces its gains on risk-averse sentiment due to the Middle East situation.
- Softer US PPI data boosted the market sentiment toward the Fed rate cut.
- Chinese inflation remains in deflationary territory, keeping the antipodean currencies, including the New Zealand Dollar (NZD).
NZD/USD snaps its two-day winning streak as market sentiment shifts to risk-averse on escalated geopolitical tension in the Middle East. The NZD/USD pair trades lower near 0.6230 during the Asian session on Monday. However, the softer Producer Price Index (PPI) data reinforces market sentiment regarding the possibility of the Federal Reserve (Fed) initiating monetary policy easing. This sentiment has contributed to a weakening of US bond yields, subsequently putting downward pressure on the US Dollar (USD).
Iran-led Houthis launched an anti-ship cruise missile at the USS Laboon in the Red Sea on Monday. This development has contributed support for the Greenback, a safe-haven currency during times of heightened geopolitical uncertainty.
According to the US Bureau of Labor Statistics, the December Producer Price Index (PPI) figure was 1.0% year-on-year, surpassing the previous reading of 0.8%. The Core PPI year-on-year arrived at 1.8%, down from 2.0% in November. The monthly headline and Core PPI indices remained at a 0.1% decline and 0.0%, respectively. These figures indicate a less robust inflationary environment, contributing to the perception of potential monetary policy easing by the Federal Reserve and impacting the US Dollar.
On the New Zealand Dollar (NZD) front, with the absence of high-impact data during the last week, Chinese data was released on Friday. China's Consumer Price Index (YoY) remained in deflationary territory for the third consecutive month in December.
Additionally, the Chinese Producer Price Index (PPI) experienced a decline for the 15th consecutive month. These developments fuel speculations about the potential for additional government stimulus and provide a modest lift to antipodean currencies, including the New Zealand Dollar (NZD). NZIER Business Confidence and GDT Price Index are scheduled to be released on Friday.
-
05:47
USD/CAD remains capped below the 1.3400 mark, BoC Business Outlook Survey eyed
- USD/CAD trades on a softer note near 1.3391 on the softer USD.
- The swaps market anticipates nearly 175 basis points (bps) of Federal Reserve (Fed) easing this year.
- The Bank of Canada (BoC) is widely expected to start cutting interest rates this year after a series of rate hikes.
- The Canadian Consumer Price Index (CPI), and US Retail Sales for December will be in the spotlight this week.
The USD/CAD pair remains capped under the 1.3400 mark during the early European trading hours on Monday. The downtick of the pair is backed by the decline of the US Dollar (USD) and the weaker US Producer Price Index (PPI) report. The pair currently trades around 1.3391, gaining 0.19% on the day.
The Federal Reserve's (Fed) easing expectations remain elevated. According to the WIRP, the markets have priced in nearly 85% odds of a rate cut at their March meeting versus 75% at the start of last week. Additionally, the swaps market anticipates nearly 175 basis points (bps) of Fed easing this year, compared to less than 150 bps at the start of last week. The US December Retail Sales data Wednesday will be in the spotlight. The headline figure is estimated to show an increase of 0.4% MoM from 0.3% in November.
On the Loonie front, the Bank of Canada (BoC) is widely expected to start cutting interest rates this year after a series of rate hikes. The first rate cuts might take place as early as this spring. WIRP suggests a rate cut is fully priced at its April meeting, with nearly 150 bps of total rate cut priced in for this year. Meanwhile, the Canadian Consumer Price Index (CPI) for December on Tuesday could offer some hints about further monetary policy by BoC. The headline inflation is expected at 3.3% YoY from 3.1% in November.
Later on Monday, the Canadian Wholesale Sales, Manufacturing Sales, and Bank of Canada Business Outlook Survey will be released. On Tuesday, market players will keep an eye on the December Canadian Consumer Price Index (CPI). The attention will shift to the December US Retail Sales on Wednesday. Traders will take cues from these figures and find trading opportunities around the USD/CAD pair. -
04:46
Gold Price Forecast: XAU/USD advances to near $2,055 as US yields decline
- Gold price gains ground on risk-averse sentiment due to the Red Sea situation.
- Israel-Gaza conflict intensified after Houthi attacked a US Navy vessel.
- US Treasury yields contribute to downward pressure on the US Dollar.
- Barclays revision of the Fed rate cut has changed market sentiment.
Gold prices continue to advance for the third consecutive day on Monday, trading higher and reaching around $2,055 per troy ounce during the Asian session. The upward movement in the price of the yellow metal is attributed to the risk-averse due to the geopolitical tensions in the Middle East, coupled with the speculation regarding potential rate cuts by the Federal Reserve (Fed) in March.
The concerns over the escalation of the Israel-Gaza conflict have intensified, especially after Iran-led Houthis fired an anti-ship cruise missile at the USS Laboon in the Red Sea on Monday. This development has contributed to increased demand for Gold prices, a traditional safe-haven asset during times of heightened geopolitical uncertainty. Market participants remain vigilant for potential impacts on shipments in the Strait of Hormuz while closely monitoring Iran's response to recent geopolitical developments.
The US Dollar (USD) hovers around 102.40 with a negative bias, influenced by the decline in US Treasury yields, possibly triggered by the softer Producer Price Index (PPI) data from the United States (US). The DXY has trimmed its intraday gains as a result of the drop in US Treasury yields. The 2-year and 10-year yields on US bond coupons trade lower at 4.14% and 3.94%, respectively, at the moment.
Additionally, Barclays revised its forecast on Friday for the first Federal Reserve rate cut, moving it to March from June. This change in outlook has shifted market sentiment towards expectations of an easing monetary policy by the Fed, putting downward pressure on the Greenback. In a note released on Friday, analysts from Barclays expressed their expectation for the Federal Open Market Committee (FOMC) to reduce the Fed Funds rate by 25 basis points at the March meeting.
-
04:17
Indonesia Trade Balance registered at $3.3B above expectations ($1.92B) in December
-
04:17
Indonesia Imports below expectations (0.4%) in December: Actual (-3.81%)
-
04:07
South Korea Trade Balance: $4.46B (December) vs previous $4.48B
-
04:04
WTI consolidates near $72.90 after Houthi’s attack on USS Laboon in the Red Sea
- WTI price gains ground for the third session on fear of conflict escalation in the Red Sea.
- Iran-led Houthis launched a cruise missile at the US Navy vessel in the Red Sea.
- Protesters threatened to close down two additional oil and gas facilities in Libya.
West Texas Intermediate (WTI) price attempts to move on an upward trajectory, trading near $72.90 per barrel during the Asian session on Monday. Crude oil prices could potentially experience further gains due to concerns over the escalation of the Israel-Gaza conflict. This speculation has heightened, particularly after Iran-led Houthis fired an anti-ship cruise missile at the USS Laboon in the Red Sea on Monday. The missile was intercepted by a US fighter jet, resulting in no harm to the navy vessel or the aircraft.
The current situation follows the military attacks on Iran-led Houthi targets carried out by the United States (US) and the United Kingdom (UK) on Friday. In response to the strikes, several tanker owners chose to avoid the Red Sea, and multiple tankers altered their course on Friday. While traders remained vigilant for potential impacts on shipments in the Strait of Hormuz, they were also closely monitoring Iran's response. On Sunday, the Houthi militia group issued a threat of a "strong and effective response" after the United States conducted another strike overnight, escalating tensions.
US President Joe Biden expressed concern about the potential impact of the war in the Middle East on oil prices. This concern comes in the wake of increased tensions in the region after the United States and Britain launched numerous air strikes across Yemen on Houthi targets. The military actions have contributed to a rise in oil prices, prompting President Biden to acknowledge the potential economic repercussions of the conflict on global oil markets.
Protesters threatened to close down two additional oil and gas facilities in Libya. This comes after the shutdown of the Sharara field on January 7. The protests are driven by concerns about corruption, and the threat to shut down more facilities indicates ongoing tensions and challenges within the country's energy sector.
-
04:03
Indonesia Exports above expectations (-8.1%) in December: Actual (-5.76%)
-
03:39
USD/INR extends its downward move ahead of Indian WPI Inflation data
- Indian Rupee holds positive ground on the softer USD.
- India’s retail inflation came in at 5.69% in December vs. 5.55% prior, weaker than the 5.87% expected.
- Investors will closely monitor the Indian Wholesale Price Index (WPI) inflation report, due on Monday.
Indian Rupee (INR) kicks off the new week on a positive note on Monday amid the US Dollar (USD) weakness. The Ministry of Statistics and Programme Implementation revealed on Friday that India’s retail inflation hit a four-month high of 5.69% in December from 5.55% in November, weaker than the market expectation of 5.87%. While headline retail inflation rose again in December and now spent 51 consecutive months above the Reserve Bank of India's (RBI) medium-term target of 4%, it continues to remain close to the Reserve Bank of India's (RBI) tolerance range of 2–6%.
The India Wholesale Price Index (WPI) Inflation report will be in the spotlight on Monday. Furthermore, the Indian WPI Fuel, WPI Food, and Trade Balance data will be released later in the day. Risk sentiment is likely to remain the key driver behind the USD/INR’s price action in the absence of US top-tier economic data due to the Martin Luther King Jr.'s Birthday bank holidayDaily Digest Market Movers: Indian Rupee’s upside might be limited amid the ongoing tensions in the Red Sea
- According to the PHD Research Bureau, India's economy will grow to over USD 4 trillion in the next two years, with a stabilized inflation rate of 4.5%.
- Houthi attacks on commercial ships in the Red Sea would negatively impact oil-importing countries, including India, said the World Economic Forum (WEF) president Borge Brende.
- The US Producer Price Index (PPI) for December rose by 1.0% YoY from the revised 0.8% increase in November, below the market consensus of 1.3%.
- The annual core PPI, which excludes volatile food and energy prices, climbed by 1.8% in December from 2.0% in the previous reading and weaker than the expectation of 1.9%. The monthly core PPI remained unchanged for the third consecutive month.
- According to the CME FedWatch Tool, investors are pricing in 74.2% odds of a rate cut in March, up from 70% last week.
Technical Analysis: Indian Rupee’s outlook remains weak in the shorter term
Indian Rupee trades strongly on the day. The USD/INR pair has remained stuck within the 82.80-83.40 trading range since September 2023. Technically, USD/INR exhibits a bearish vibe as the pair holds below the key 100-period Exponential Moving Average (EMA) on the daily chart. The negative outlook is supported by the 14-day Relative Strength Index (RSI) which is below the 50.0 midpoint, suggesting the path of least resistance is to the downside.
A breach of the key support level of 82.80, the lower limit of the trading range and a low of September 12, will see a drop to a low of August 11 at 82.60. The next contention level is seen near a low of August 24 at 82.40. On the upside, the support-turned-resistance at 83.00 acts as an immediate upside barrier for USD/INR. Further north, the upper boundary of the trading range at 83.40 will be the additional upside filter to watch, followed by the psychological figure at 84.00.US Dollar price today
The table below shows the percentage change of US Dollar (USD) against listed major currencies today. US Dollar was the weakest against the Euro.
USD EUR GBP CAD AUD JPY NZD CHF USD -0.04% 0.00% -0.03% 0.03% -0.03% 0.06% 0.01% EUR 0.06% 0.03% -0.01% 0.06% 0.01% 0.10% 0.05% GBP -0.01% -0.03% -0.04% 0.02% -0.02% 0.07% 0.02% CAD 0.05% 0.00% 0.05% 0.06% 0.00% 0.10% 0.06% AUD -0.03% -0.06% 0.00% -0.05% -0.03% 0.05% 0.01% JPY 0.04% -0.04% -0.11% -0.01% 0.06% 0.09% 0.04% NZD -0.06% -0.13% -0.07% -0.11% -0.05% -0.09% -0.05% CHF 0.00% -0.06% -0.02% -0.06% 0.01% -0.05% 0.04% The heat map shows percentage changes of major currencies against each other. The base currency is picked from the left column, while the quote currency is picked from the top row. For example, if you pick the Euro from the left column and move along the horizontal line to the Japanese Yen, the percentage change displayed in the box will represent EUR (base)/JPY (quote).
Indian Rupee FAQs
What are the key factors driving the Indian Rupee?
The Indian Rupee (INR) is one of the most sensitive currencies to external factors. The price of Crude Oil (the country is highly dependent on imported Oil), the value of the US Dollar – most trade is conducted in USD – and the level of foreign investment, are all influential. Direct intervention by the Reserve Bank of India (RBI) in FX markets to keep the exchange rate stable, as well as the level of interest rates set by the RBI, are further major influencing factors on the Rupee.
How do the decisions of the Reserve Bank of India impact the Indian Rupee?
The Reserve Bank of India (RBI) actively intervenes in forex markets to maintain a stable exchange rate, to help facilitate trade. In addition, the RBI tries to maintain the inflation rate at its 4% target by adjusting interest rates. Higher interest rates usually strengthen the Rupee. This is due to the role of the ‘carry trade’ in which investors borrow in countries with lower interest rates so as to place their money in countries’ offering relatively higher interest rates and profit from the difference.
What macroeconomic factors influence the value of the Indian Rupee?
Macroeconomic factors that influence the value of the Rupee include inflation, interest rates, the economic growth rate (GDP), the balance of trade, and inflows from foreign investment. A higher growth rate can lead to more overseas investment, pushing up demand for the Rupee. A less negative balance of trade will eventually lead to a stronger Rupee. Higher interest rates, especially real rates (interest rates less inflation) are also positive for the Rupee. A risk-on environment can lead to greater inflows of Foreign Direct and Indirect Investment (FDI and FII), which also benefit the Rupee.
How does inflation impact the Indian Rupee?
Higher inflation, particularly, if it is comparatively higher than India’s peers, is generally negative for the currency as it reflects devaluation through oversupply. Inflation also increases the cost of exports, leading to more Rupees being sold to purchase foreign imports, which is Rupee-negative. At the same time, higher inflation usually leads to the Reserve Bank of India (RBI) raising interest rates and this can be positive for the Rupee, due to increased demand from international investors. The opposite effect is true of lower inflation.
-
02:46
GBP/USD consolidates around 1.2760 on a softer US Dollar, focus on UK labor data
- GBP/USD recovers its intraday losses on the weaker US Dollar.
- The risk-on mood fades on escalated tension in the Middle East.
- Barclays revised its forecast on the Fed rate cut to March from June.
The GBP/USD treads water near 1.2760 during the European session on Monday, recovering intraday losses as the US Dollar (USD) loses ground on the weaker US bond yields, coupled with the softer Producer Price Index (PPI) data from United States (US). The heightened tension in the Middle East has balanced the risk-on sentiment, particularly following military attacks on Iran-led Houthi targets, conducted by the United States (US) and the United Kingdom (UK) on Friday. This geopolitical development has influenced both the USD's strength and the overall sentiment in the GBP/USD pair.
The US Dollar Index (DXY) trims its intraday gains due to the decline in the US Treasury yields. The 2-year and 10-year yields on US bond coupons stand lower at 4.14% and 3.94%, respectively, by the press time. The increased market speculation regarding potential rate cuts by the US Federal Reserve (Fed) in March has exerted pressure on US yields. This speculation gained momentum, particularly after Barclays revised its forecast on Friday for the first Federal Reserve rate cut, advancing it to March from June.
Moreover, the softer-than-expected Producer Price Index (PPI) data released on Friday might have exerted downward pressure on the US Dollar. According to the US Bureau of Labor Statistics, the December Producer Price Index (PPI) figure was 1.0% year-on-year, compared to the previous reading of 0.8%. The Core PPI year-on-year arrived at 1.8%, down from 2.0% in November. On a monthly basis, both the headline and Core PPI indices remained at 0.1% decline and 0.0%, respectively.
The GBP/USD pair might have gained some ground on on improved production data from the United Kingdom (UK) released on Friday. In November, the United Kingdom's (UK) industrial sector activity rebounded, according to data from the Office for National Statistics (ONS) released on Friday. Total Industrial Production (MoM) remained consistent in line with expectations and contrasted with the previous decline. On an annual basis, UK Manufacturing Production increased in November. However, Total Industrial Output declined by 0.1% in the same period.
Additionally, on Monday, January’s Rightmove House Price Index (MoM) improved by 1.3% against the previous decline of 1.9%. While the year-over-year eased at a 0.7% decline against December’s decline of 1.1%. Traders will likely observe the labor market data including Claimant Count Change and ILO Unemployment Rate (3M).
-
02:20
USD/JPY holds above 145.00 despite weaker US Dollar
- USD/JPY snaps a two-day losing streak near 145.00 on Monday.
- The downbeat US PPI has triggered the possibility that the Federal Reserve (Fed) will start cutting interest rates this year.
- Japan's two-year yield has declined back under zero for the first time since July 2023.
The USD/JPY pair gained traction above the 145.00 mark during the early Asian session on Monday. The pair rebounds despite the decline of the US Dollar (USD). The market is likely to have a quiet session amid the US bank holiday. At press time, USD/JPY is trading at 145.06, up 0.12% for the day.
The US Producer Price Index (PPI) unexpectedly fell in December, raising the possibility that the Federal Reserve (Fed) would start cutting interest rates this year. The market has priced in 86% odds of a rate cut by March, with the overall 2024 easing cycle priced at around 166 basis points (bps), compared to 75 bps projected by the Fed dot plot. This, in turn, might cap the upside of the Greenback and act as a headwind for the USD/JPY pair.
Japan's two-year yield has dropped back under zero for the first time since July 2023. On Friday, the report said the Bank of Japan (BOJ) is likely to cut its core inflation forecast for the fiscal year 2024 (currently 2.8%) amid the recent decline in oil prices. Additionally, the BOJ is expected to maintain its projection that trend inflation will stay near its 2% target in the coming years, despite global economic uncertainty and lacklustre spending. The projection will be part of the bank's quarterly outlook report due at its next rate review on January 22–23. The BoJ board is widely expected to keep ultra-loose policy settings unchanged.
Looking ahead, the Japanese Machine Tool Orders are due on Monday. However, this low-tier data might not impact the market. Later this week, the Japanese Producer Price Index and the US NY Empire State Manufacturing Index will be released on Tuesday. The US Retail Sales will be due on Wednesday. Traders will take cues from these figures and find trading opportunities around the USD/JPY pair. -
02:08
Top US Senae Democrat Schumer: Congressional leaders agree to a stopgap funding measure
US Senate Democratic leader Chuck Schumer announced on Monday that “congressional leaders agree to a stopgap funding measure.”
Additional comments
New bipartisan stopgap measure would fund some gov't agencies through March 1, others through March 8.
Stopgap bill aims to avert partial US government shutdown before Friday.
Will require bipartisan cooperation in the Senate and the House to quickly pass the CR and send it to the President’s desk before Friday’s funding deadline.
Earlier, the Financial Times (FT) reported that US Senate Majority leader Schumer had submitted a stopgap budget measure aimed at postponing the threat of a costly government shutdown until March.
Market reaction
The US Dollar Index paused its recovery mode on the above headlines, currently trading modestly flat at around 102.40.
-
01:45
Australia TD Securities Inflation (YoY) up to 5.2% in December from previous 4.4%
-
01:44
Australia TD Securities Inflation (MoM) climbed from previous 0.3% to 1% in December
-
01:34
Australian Dollar hovers below a psychological level amid a stable US Dollar
- Australian Dollar retraces its losses on risk-on sentiment.
- Australian job advertisements improved by 0.1% in December, from the 4.6% prior.
- PBoC former director Sheng Songchen stated that China’s property downturn might persist for another two years.
- US Dollar remains steady amid downbeat US bond yields.
The Australian Dollar (AUD) attempts to recover its losses on Monday after a decline in the previous two sessions. Surprisingly, the Australian Dollar gains ground despite a stable US Dollar (USD) amid subdued US Treasury yields. The market is anticipated to be relatively quiet regarding US economic data due to the observance of Martin Luther King Jr. Day on Monday.
Australia’s currency experienced upward support due to heightened market speculation about potential rate cuts by the US Federal Reserve (Fed) in March. This speculation gained momentum, especially after Barclays revised its forecast on Friday for the first Federal Reserve (Fed) rate cut, moving it up to March from June. In a note released on Friday, Barclays analysts expressed their expectation for the Federal Open Market Committee (FOMC) to reduce the Fed Funds rate by 25 basis points at the March meeting.
Australia's job advertisements released by the Australia and New Zealand Banking Group Limited (ANZ) showed an improvement of 0.1% in December, swinging from the previous decline of 4.6%. Market participants are expected to closely observe the Westpac Consumer Confidence for January and the TD Securities Inflation for December, both scheduled for release on Tuesday. The focus will be shifted toward Consumer Inflation Expectations and labor market data on Thursday.
The People’s Bank of China's (PBoC) former director Sheng Songchen stated at a forum in Shanghai on Saturday that the property downturn in China might persist for an additional two years before stabilizing, according to Bloomberg. He anticipates that new-home sales nationwide will likely decrease by another 50 million square meters in 2024 and 2025. The annual total for 2025 is expected to plateau around 850 million square meters.
The US Dollar Index (DXY) continues to gain ground for the third successive session. However, the softer Producer Price Index (PPI) data from the United States (US) on Friday might have contributed downward for the US Dollar. US Retail Sales data will be eyed on Wednesday.
Daily Digest Market Movers: Australian Dollar experiences gains despite a steady US Dollar
- Australia's trade surplus increased to 11,437M MoM in December, surpassing the market expectation of 7,500M and exceeding the previous reading of 7,129M.
- Australian Monthly Consumer Price Index (YoY) for November showed a slight reduction to 4.3%, falling slightly short of the market expectation of 4.4% from the previous figure of 4.9%.
- Chinese Consumer Price Index (YoY) decreased by 0.3% in December, against the expected 0.4% decline. The monthly Consumer Price Index eased at 0.1%, compared to the market expectation of 0.2%. The yearly Producer Price Index fell by 2.7%, slightly exceeding the expected decline of 2.6%.
- Chinese Trade Balance in USD increased to $75.34B from the previous $68.39B, surpassing the expected $74.75B. The Exports (YoY) figure grew by 2.3%, exceeding the market consensus of 1.7%. The yearly Imports in CNY increased by 1.6%, compared to the previous 0.6%.
- US Bureau of Labor Statistics reported that the December Producer Price Index (PPI) figure was 1.0% year-on-year, compared to the previous reading of 0.8%. The Core PPI YoY arrived at 1.8%, down from 2.0% in November. Monthly, the headline and Core PPI indices remained flat at -0.1% and 0.0%, respectively.
- US Bureau of Labor Statistics reported that the Consumer Price Index (CPI) surged to 3.4% YoY in December, exceeding both November's 3.1% and the anticipated market figure of 3.2%. The monthly CPI growth for December showed a 0.3% increase, surpassing the market analysts' estimated projection of 0.2%. The annual Core CPI stood at 3.9%, a slight decrease from November's 4.0%, while the monthly figure remained steady at 0.3%, in line with expectations.
Technical Analysis: Australian Dollar consolidates below 0.6700 psychological level
The Australian Dollar trades near 0.6690 on Monday, positioned below the psychological barrier at 0.6700 followed by the 14-day Exponential Moving Average (EMA) at 0.6721. A potential breakthrough above the EMA might propel the AUD/USD pair toward the key resistance at 0.6750. On the downside, crucial support lies at 0.6650, in conjunction with the 38.2% Fibonacci retracement level, situated at 0.6637.
AUD/USD: Daily Chart
-638408789739380072.png)
Australian Dollar price today
The table below shows the percentage change of Australian Dollar (AUD) against listed major currencies today. Australian Dollar was the strongest against the New Zealand Dollar.
USD EUR GBP CAD AUD JPY NZD CHF USD -0.04% 0.00% -0.03% 0.03% -0.03% 0.06% 0.01% EUR 0.06% 0.03% -0.01% 0.06% 0.01% 0.10% 0.05% GBP -0.01% -0.03% -0.04% 0.02% -0.02% 0.07% 0.02% CAD 0.05% 0.00% 0.05% 0.06% 0.00% 0.10% 0.06% AUD -0.03% -0.06% 0.00% -0.05% -0.03% 0.05% 0.01% JPY 0.04% -0.04% -0.11% -0.01% 0.06% 0.09% 0.04% NZD -0.06% -0.13% -0.07% -0.11% -0.05% -0.09% -0.05% CHF 0.00% -0.06% -0.02% -0.06% 0.01% -0.05% 0.04% The heat map shows percentage changes of major currencies against each other. The base currency is picked from the left column, while the quote currency is picked from the top row. For example, if you pick the Euro from the left column and move along the horizontal line to the Japanese Yen, the percentage change displayed in the box will represent EUR (base)/JPY (quote).
Australian Dollar FAQs
What key factors drive the Australian Dollar?
One of the most significant factors for the Australian Dollar (AUD) is the level of interest rates set by the Reserve Bank of Australia (RBA). Because Australia is a resource-rich country another key driver is the price of its biggest export, Iron Ore. The health of the Chinese economy, its largest trading partner, is a factor, as well as inflation in Australia, its growth rate and Trade Balance. Market sentiment – whether investors are taking on more risky assets (risk-on) or seeking safe-havens (risk-off) – is also a factor, with risk-on positive for AUD.
How do the decisions of the Reserve Bank of Australia impact the Australian Dollar?
The Reserve Bank of Australia (RBA) influences the Australian Dollar (AUD) by setting the level of interest rates that Australian banks can lend to each other. This influences the level of interest rates in the economy as a whole. The main goal of the RBA is to maintain a stable inflation rate of 2-3% by adjusting interest rates up or down. Relatively high interest rates compared to other major central banks support the AUD, and the opposite for relatively low. The RBA can also use quantitative easing and tightening to influence credit conditions, with the former AUD-negative and the latter AUD-positive.
How does the health of the Chinese Economy impact the Australian Dollar?
China is Australia’s largest trading partner so the health of the Chinese economy is a major influence on the value of the Australian Dollar (AUD). When the Chinese economy is doing well it purchases more raw materials, goods and services from Australia, lifting demand for the AUD, and pushing up its value. The opposite is the case when the Chinese economy is not growing as fast as expected. Positive or negative surprises in Chinese growth data, therefore, often have a direct impact on the Australian Dollar and its pairs.
How does the price of Iron Ore impact the Australian Dollar?
Iron Ore is Australia’s largest export, accounting for $118 billion a year according to data from 2021, with China as its primary destination. The price of Iron Ore, therefore, can be a driver of the Australian Dollar. Generally, if the price of Iron Ore rises, AUD also goes up, as aggregate demand for the currency increases. The opposite is the case if the price of Iron Ore falls. Higher Iron Ore prices also tend to result in a greater likelihood of a positive Trade Balance for Australia, which is also positive of the AUD.
How does the Trade Balance impact the Australian Dollar?
The Trade Balance, which is the difference between what a country earns from its exports versus what it pays for its imports, is another factor that can influence the value of the Australian Dollar. If Australia produces highly sought after exports, then its currency will gain in value purely from the surplus demand created from foreign buyers seeking to purchase its exports versus what it spends to purchase imports. Therefore, a positive net Trade Balance strengthens the AUD, with the opposite effect if the Trade Balance is negative.
-
01:30
PBoC keeps Medium-term Lending Facility (MLF) rate unchanged at 2.5%
The People’s Bank of China (PBOC), China's central bank kept the one-year Medium-term Lending Facility (MLF) rate steady at 2.50% on Monday. Injects 995 billion yuan vs. the 779 billion yuan in MLF maturing today.
The MLF was last cut in August 2023, from 2.65%. -
01:19
PBoC sets USD/CNY reference rate at 7.1084 vs. 7.1050 previous
The People’s Bank of China (PBoC) sets the USD/CNY central rate for the trading session ahead on Monday at 7.1084 as compared to the previous day's fix of 7.1050 and 7.1684 Reuters estimates.
-
01:10
EUR/USD posts modest gains above 1.0950 ahead of Eurozone Industrial Production data
- EUR/USD holds positive ground above the mid-1.0900s amid the USD weakness.
- European Central Bank (ECB) officials emphasized the need to wait for more data before making decisions on rate normalization.
- The US Producer Price Index (PPI) unexpectedly dropped in December.
- Investors will focus on Eurozone Industrial Production, due later on Monday.
The EUR/USD pair posts modest gains during the early Asian session on Monday. The softer US Dollar (USD) and risk-on environment lend some support to the major pair. Due to the lack of top-tier US economic data from the US due to the Martin Luther King Jr. holiday, risk sentiment is anticipated to remain the primary driver of the major pair price movement. EUR/USD currently trades near 1.0953, up 0.03% on the day.
The European Central Bank (ECB) officials emphasized the need to wait for additional economic data before making decisions on rate normalization. On Saturday, ECB chief economist Philip Lane stated that the central bank will have important data by June to decide on a likely series of interest rate cuts, but moving prematurely may prove self-defeating. Last week, ECB President Christine Lagarde said that the 'hardest and worst bit' regarding inflation was likely past, and the interest rates would be cut if the ECB had confidence that inflation had fallen below 2%.
Across the pond, the US Producer Price Index (PPI) unexpectedly dropped in December, which triggered the potential that the Federal Reserve (Fed) will begin cutting interest rates this year. According to data released on Friday by the Bureau of Labor Statistics, the PPI rose 1.0% annually in December from November’s reading of 0.8%, while the core PPI was flat for the month, bringing the yearly increase down from 2.0% to 1.8%. With the signal of cooling inflation, investors anticipate additional monetary easing through 2024. The markets place a bet on 160 basis points (bps) of rate cuts from the Fed this year.
Traders will take more cues from ECB speakers this week, including Villeroy (Tuesday) and Nagel (Wednesday). Also, the ECB President Lagarde is set to speak on Wednesday, Thursday, and Friday. Apart from this, ECB Minutes will be released on Thursday. -
00:30
Australia ANZ Job Advertisements rose from previous -4.6% to 0.1% in December
-
00:15
Currencies. Daily history for Friday, January 12, 2024
Pare Closed Change, % AUDUSD 0.66843 0.06 EURJPY 158.701 -0.39 EURUSD 1.09528 -0.14 GBPJPY 184.68 -0.26 GBPUSD 1.27456 -0.04 NZDUSD 0.62426 0.26 USDCAD 1.34038 0.1 USDCHF 0.85237 0.06 USDJPY 144.898 -0.26 -
00:14
Ex-PBoC official: China’s property downturn may continue for two more years
The People’s Bank of China's (PBoC) former director Sheng Songchen said on Saturday at a forum in Shanghai that the property downturn in China may continue for two more years before gaining stability, per Bloomberg.
Key quotes
“New-home sales nationwide will likely shrink by another 50 million square meters both in 2024 and 2025.”
“2025 annual total will plateau around 850 million square meters.”
“There were some 'green shoots' appearing in November and December, such as the pace of sales decline moderating by a half in 2023 from a year earlier.”Market reaction
At the time of writing, AUD/USD is holding lower ground near 0.6681, losing 0.03% on the day.
-
00:06
United Kingdom Rightmove House Price Index (YoY) up to -0.7% in January from previous -1.1%
-
00:03
Gold Price Forecast: XAU/USD flat-lines below $2,050, focus on geopolitical tensions
- Gold price trades flat around $2,045 amid the US bank holiday.
- US Producer Price Index (PPI) for December rose by 1.0% YoY versus 0.8% prior, below market expectations.
- The escalating geopolitical tensions in the Middle East might boost safe-haven buying and benefit gold price.
Gold price (XAU/USD) trades on a flat note during the early Asian session on Monday. That being said, the uptick of the yellow metal is supported by the softer US Producer Price Index (PPI) data and rising geopolitical tensions in the Middle East. At press time, the gold price is trading at $2,045, losing 0.01% on the day.
On Friday, the US Producer Price Index (PPI) for December rose by 1.0% on a yearly basis from the revised 0.8% increase in November, below market expectations of 1.3%. The annual core PPI, which excludes volatile food and energy prices, climbed by 1.8% in December from 2.0% in the previous reading and was below the market consensus of 1.9%. The monthly core PPI remained unchanged for the third consecutive month.
The PPI report reveals some deflationary signs, which help boost confidence in the Federal Reserve's (Fed) cutting interest rates in March. Investors are pricing in 74.2% odds of a rate cut in March, up from 70% last week, according to the CME FedWatch Tool. This, in turn, weighs on the Greenback and acts as a tailwind for the gold price.
Apart from this, the gains of yellow metal were driven by safe-haven buying amid rising geopolitical tensions. The United States and the United Kingdom launched strikes against Houthi targets in Houthi-controlled areas of Yemen last week, marking a significant response after the Biden administration and its allies warned that the Iran-backed militant group would bear the consequences of its attacks on commercial shipping in the Red Sea.
In the absence of top-tier US economic data from the US due to the Martin L. King's Birthday bank holiday, risk sentiment is likely to remain the key driver behind the gold price action. Later this week, the US NY Empire State Manufacturing Index will be due on Tuesday, Retail Sales will be released on Wednesday, and the Michigan Consumer Sentiment Index report will be published on Friday. -
00:02
United Kingdom Rightmove House Price Index (MoM) increased to 1.3% in January from previous -1.9%
-