Notícias do Mercado
-
23:37
Breaking: NZD/USD breaks 0.71 following surprise CPI print
In thin trade at the start of the week, New Zealand Consumer Prices, which surprised to the upside at the start of the day, has seen NZD/USD rally to test 0.7100 and print 0.7105 the high.
New-Zealand (Sep) CPI (YoY) actual: 4.9% vs 3.3% previous;est 4.2%.
New-Zealand (Sep) CPI (qoq) actual: 2.2% vs 1.3% previous;est 1.5%.
NZD/USD 5-min chart
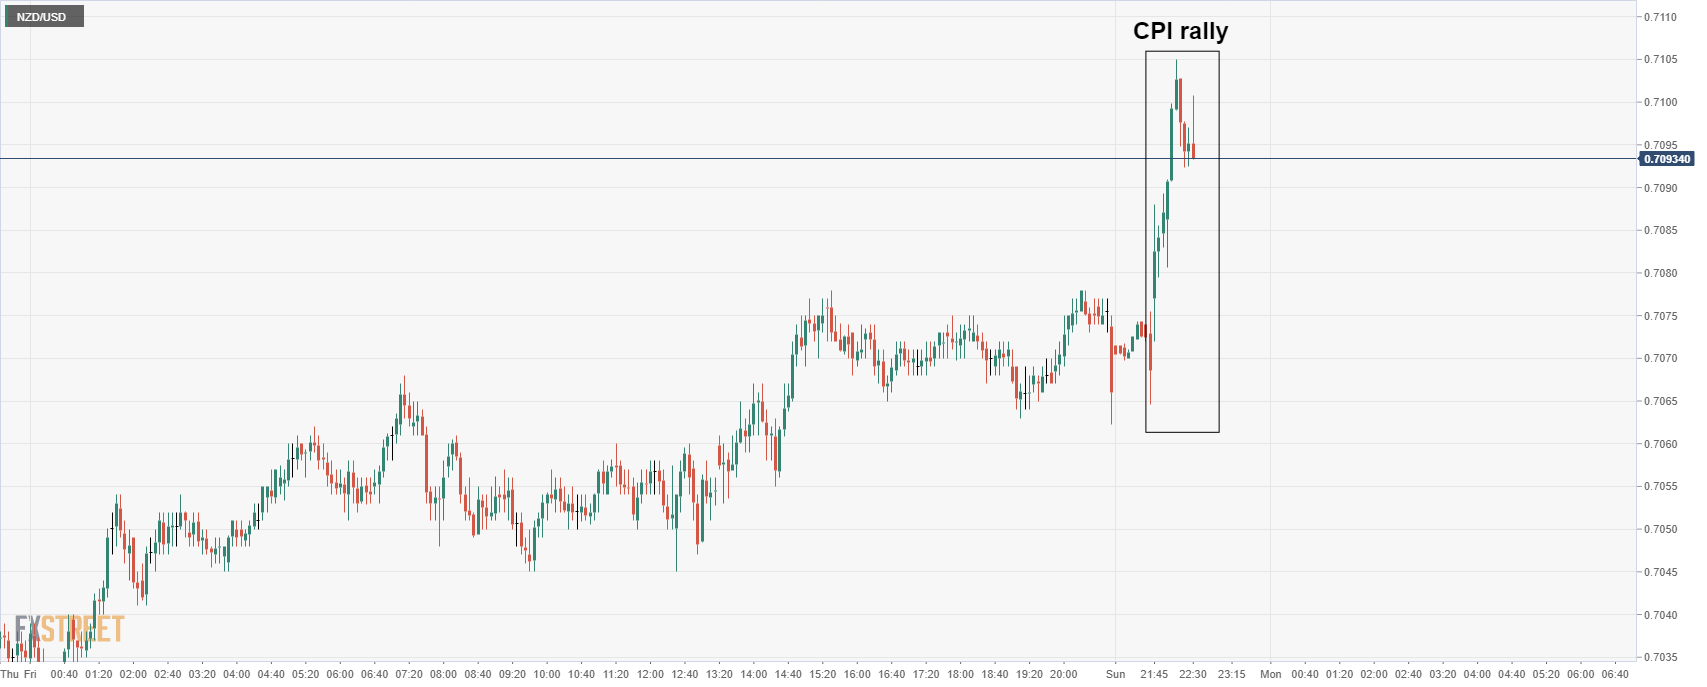
However, given the spread in early Asia, traders would find this data difficult to trade at the time of the release. Instead, this will be digested and factored into Tokyo's session. That, coupled with Chinese Gross Domestic Data later today, makes for a potentially busy day ahead.
-
23:33
AUD/NZD Price Analysis: More downside below 21-day SMA near 1.0465
- AUD/NZD edges lower on Monday in the Asian trading hours.
- Kiwi gains momentum against majors post-CPI data.
- Momentum oscillator holds onto the overbought zone with receding momentum.
AUD/NZD extends the previous week’s downside momentum on Monday in the initial Asian trading hours. The cross-currency pair opens the session’s higher but fails to sustain the momentum. At the time of writing, AUD/NZD is trading at 1.0473, down 0.27% for the day.
AUD/NZD daily chart
-637701066195744218.png)
On the daily chart, the AUD/NZD pair has been under selling pressure after testing multi-month highs above 1.0600 on Wednesday. The downside momentum catches further momentum after breaking the 100-day Simple Moving Average (SMA) at 1.0549.
Having said that, if the price breaks the 21-day SMA near 1.0465, it would test the 1.0450 horizontal support level. Overbought Moving Average Convergence (MACD) suggests the possibility of the September 29 low of 1.0397 followed by the 1.0365 horizontal support level.
Alternatively, if the price moves higher, it would first retest the 1.0500 horizontal resistance level followed by Friday’s high at 1.0552. A successful daily close above 100-day SMA would pave the way for the psychological 1.0600 mark.
AUD/NZD additional levels
-
23:07
AUD/USD hidden bearish divergence opens risk to 0.7315
- AUD/USD is at the mercy of external factors for the week ahead.
- AUD/USD is on the verge of correcting from the recent rally as it starts to decelerate.
- The neckline of the W-formation has a confluence with both the 21-day moving average and the 61.8% golden ratio.
AUD/USD is starting out flat in the open in a quiet start to the week, so far. At the time of writing, AUD/USD is trading at 0.7414 and oscillating within a few pips of a range sat on the 1-hour 10 smoothed moving average.
Conditions for commodity currencies have been positive for AUD which has enjoyed the inflation hedge taking place in forex since the Federal reserve turned a lot more hawkish of late. There has also been a specific notice paid to both offshore equities and US rates. In this regard, US stocks retained their firmer bias on Friday, with investors cheering better-than-expected Retail Sales growth for September as well as positive earnings results.
Stagflation concerns soothed
Stagflation concerns have been a thorn in the side for markets recently as the Federal Reserve has started to acknowledge that inflation may not be so transitory after all. This same at a time when data had started to tale off as well lead into a potentially cold winter and in the wake of the global energy crisis, underpinning stagflation fears. However, the better data and performances of US stocks coupled with softer core September CPI and PPI data earlier in the week went a long way to soothe those fears and to support risk related forex, such as AUD.
In markets, the S&P 500 ended higher by 0.8%, the Euro Stoxx 50 up 0.8% and the FTSE 100 rose 0.4%. The yield on the US 10-year note rose 6bps to 1.57% with bond prices feeling the pinch of a better risk tone. Meanwhile, Oil prices continued to be problematic with WTI rising a further 1.7% to USD82.7/bbl. On the other hand, iron ore futures found support from renewed supply-side issues. ''Rio Tinto downgraded its expectations for iron ore exports this year to 320-325m tonnes from 325-340m tonnes, due to labour shortages in Western Australia,'' analysts at ANZ Bank said in a note today.''
However, there are dark clouds forming over the Australian economy despite the news that the nations second-largest city will see an easing of restrictions later this week. Instead, there is a watchful eye over Evergrande contagion, a housing sector meltdown in China and negative ramifications for Australia's export-dependent economy. When Cina sneezes, Australia catches a cold. In this regard, investors will be watching key economic data from China today (including Gross Domestic Product) for any signs of weakness amid the energy shortages.
External factors to impact AUD this week
Meanwhile, markets largely overlooked some quite grim jobs data in Australia, which clearly showed the deep impact of recent Covid-19 restrictions in the country. With that being said, the markets are not expecting the Reserve Bank of Australia to be so concerned for the outcome considering it has already been factoring some anticipated poor results pertaining to the summer covid crisis.
The RBA has already pledged to keep policy on hold until February. However, there will be some focus on the October RBA policy meeting minutes in this regard but external factors, such as Chines data will be key. On a poor outcome, AUD/USD may struggle towards the 0.7460 September high.
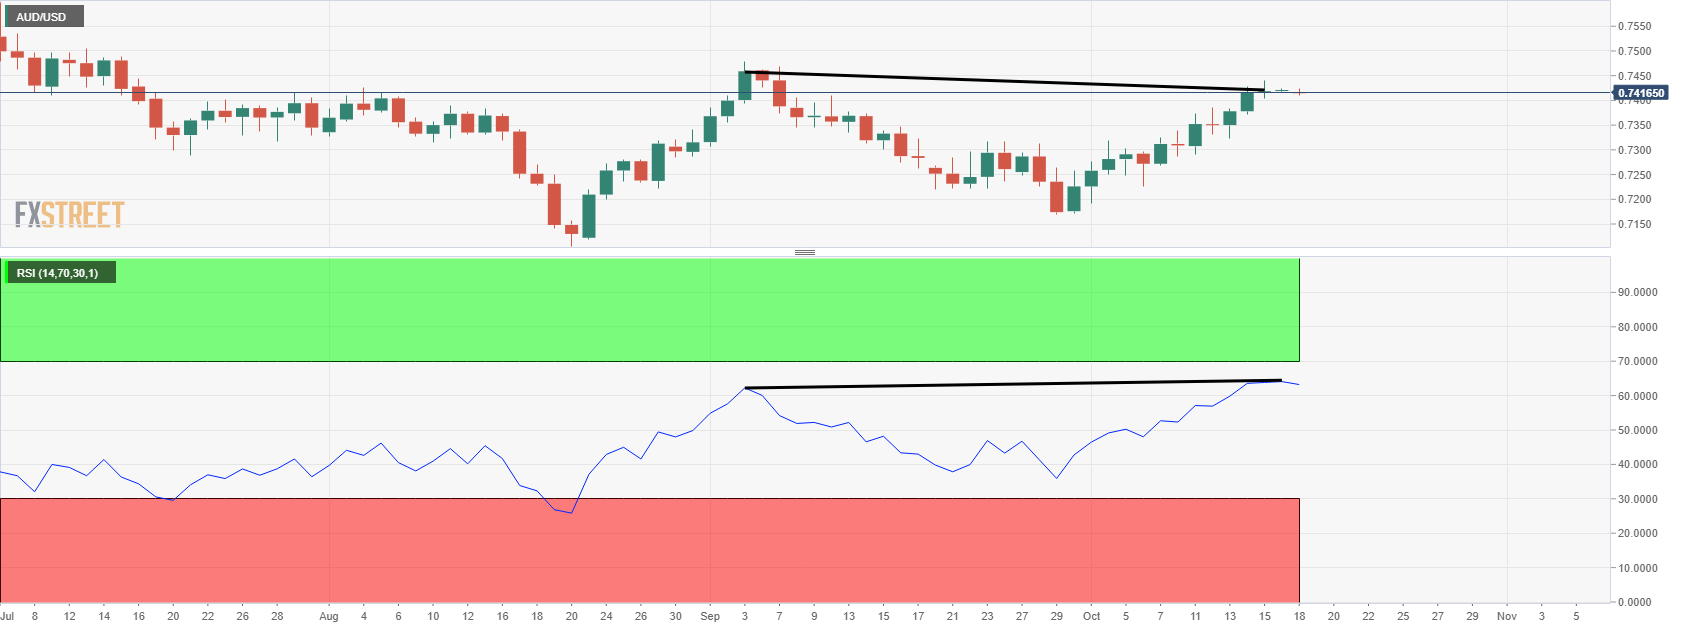
AUD/USD technical analysis
From a technical perspective, we have some hidden bearish RSI divergence on the daily chart as follows:
We saw the same not long ago which lead to a downside continuation in the trend as follows:
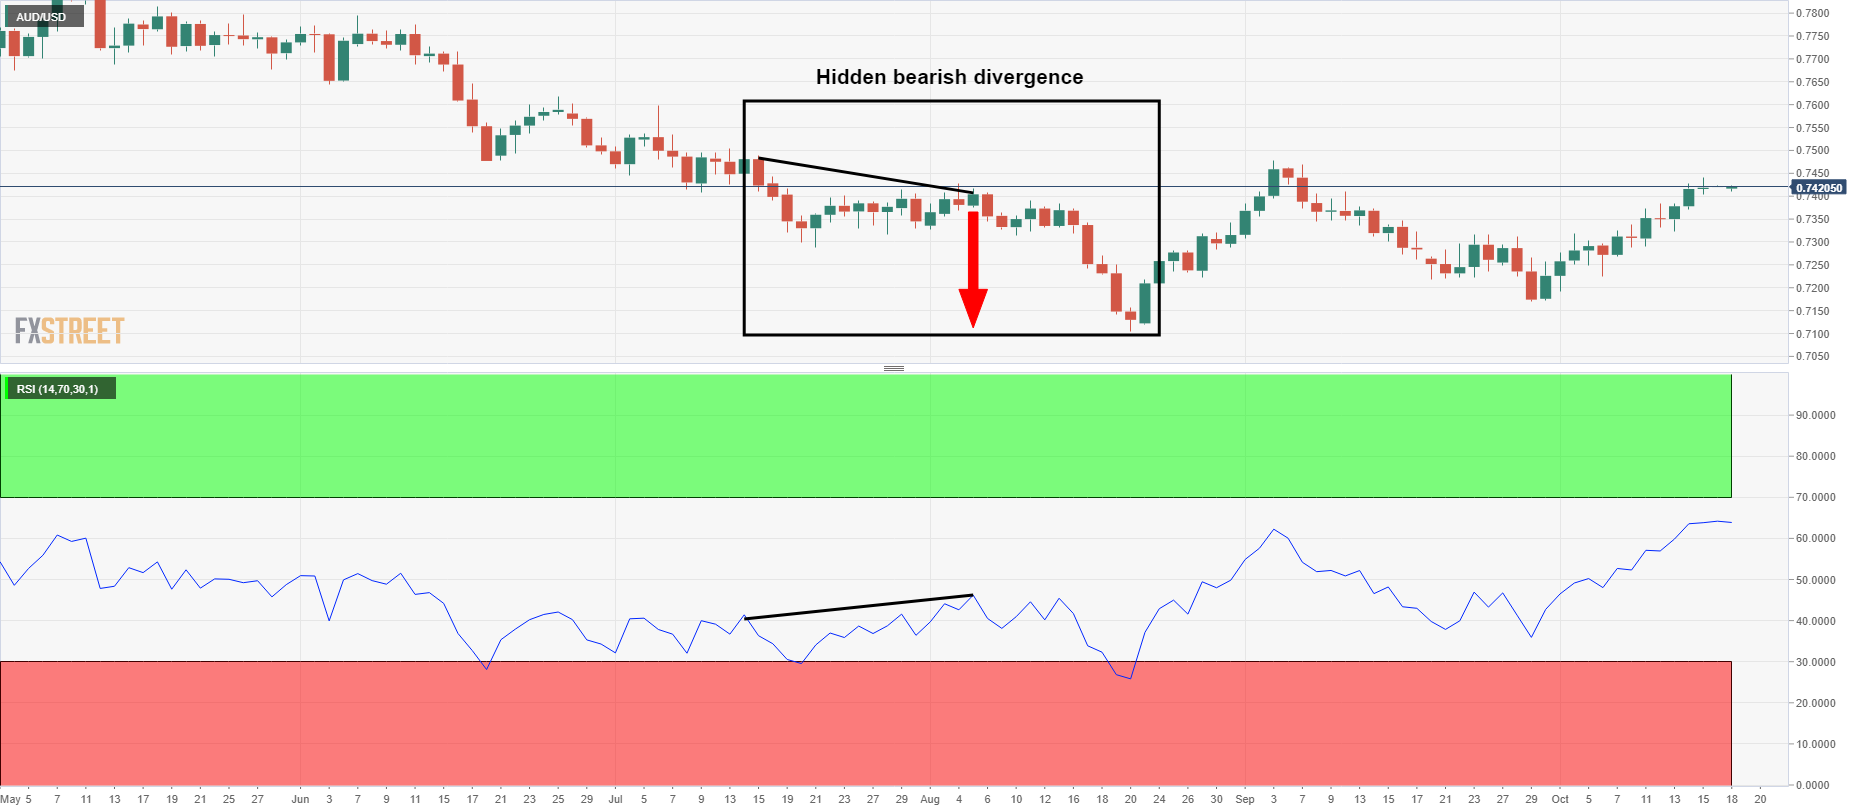
As illustrated, the HBD led to a fresh low in the cycle. HBD is a continuation leading indicator that traders can use to help them to make trading decisions. In this regard, there are prospects of the following playing out in the next few days:
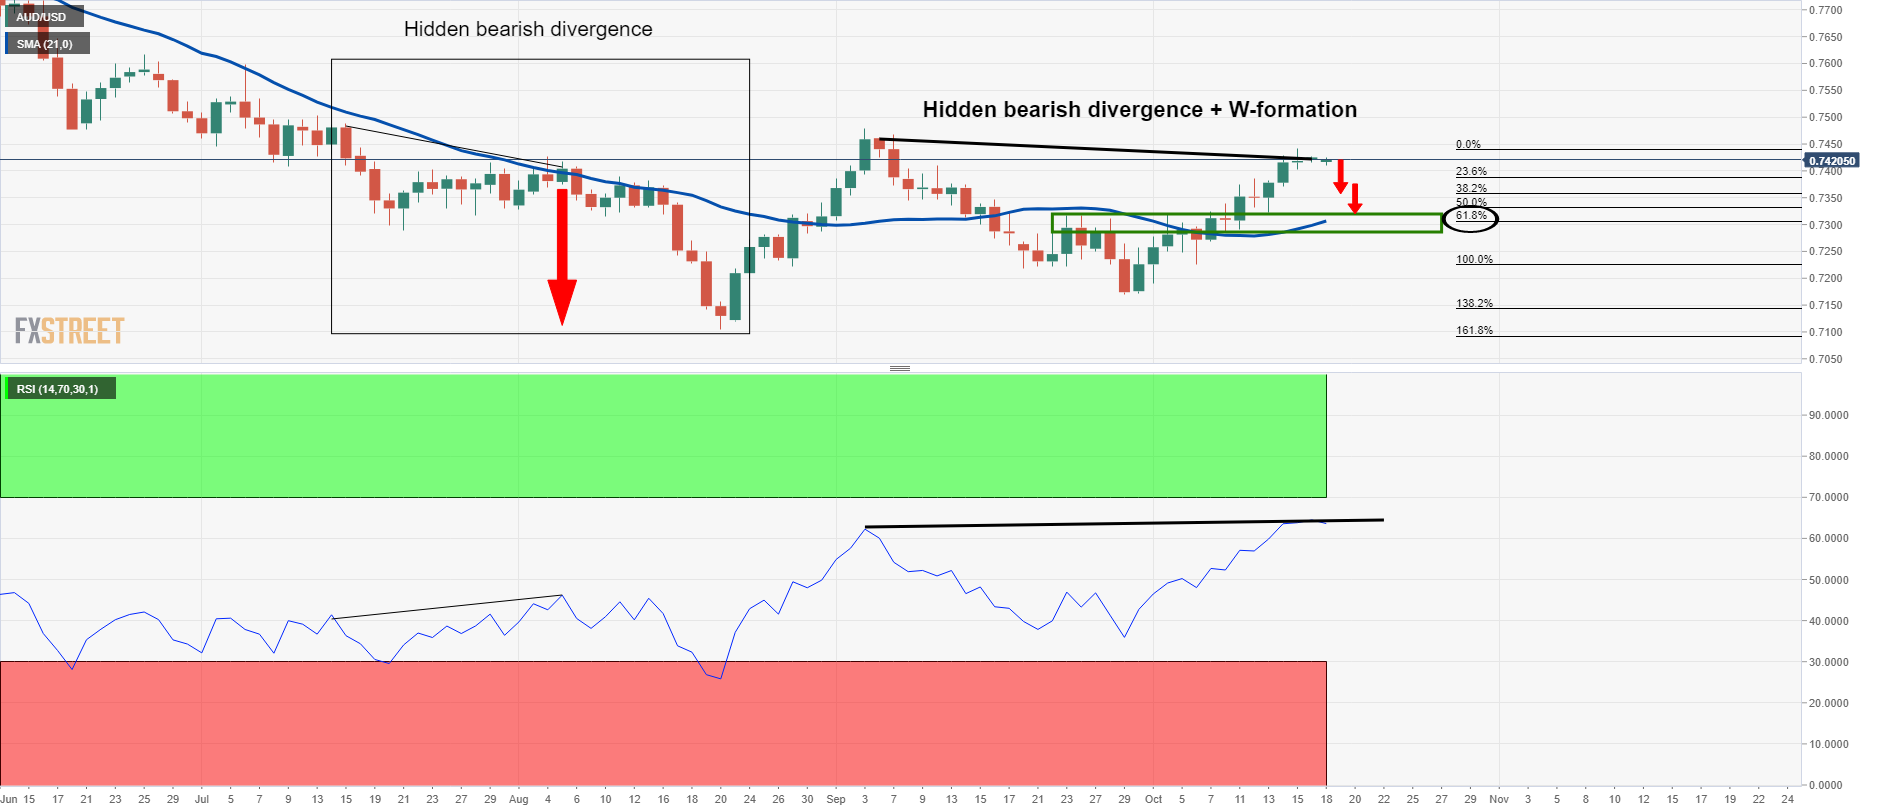
AUD/USD is on the verge of correcting from the recent rally as it starts to decelerate. This exposes the neckline of the W-formation that has a confluence with both the 21-day moving average, the 61.8% golden ratio and within hidden bearish divergence. 0.7315 is eyed.
-
23:06
NZD/USD reclaims monthly highs above 0.7070 post-inflation data, risk-on mood
- NZD/USD kickstarts the first trading session of the new trading week on a higher note
- US Dollar Index remains subdued below 94.00 helping NZD/USD to push higher.
- Higher Inflation and business sentiment support the recent rally for kiwi.
NZD/USD ticks higher on Monday in the early Asian trading hours post-critical inflation data. The depreciative move in the US dollar pushes NZD/USD higher. At the time of writing, NZD/USD is trading at 0.7075, up 0.17% for the day.
Kiwi extends the previous week’s momentum and reaches the levels last seen in September. The sentiment is upbeat following the higher Consumer Inflation data (CPI), which comes at 2.2% in September, beating the market expectations of 1.4% whereas the BusinessNZ Performance of Service Index (PSI) reads at 46.9 in September as compared to 35.6 in the previous month. Nevertheless, the upside seems limited as the policymakers are considering tightening restrictions in Auckland again due to rising coronavirus infections.
On the other hand, the greenback remains under pressure on improved risk appetite. On Friday, the US Retail Sales data came at 0.7% in September, much above the market consensus of 0.2 declines. It is worth noting, that S&P 500 Futures is trading at 4,465, up 0.82% for the day.
As for now, all eyes are China’s Gross Domestic Product (GDP) data to take fresh trading impetus.
NZD/USD additional levels
-
22:46
New Zealand Consumer Price Index (YoY) above expectations (4.1%) in 3Q: Actual (4.9%)
-
22:46
New Zealand Consumer Price Index (QoQ) above forecasts (1.4%) in 3Q: Actual (2.2%)
-
21:22
UK's Sunak considers cutting VAT on household energy bills
Reuters has reported on the Financial Times Sunday article that the British finance minister Rishi Sunak is considering a cut to the 5% rate of value-added tax on household energy bills.
''Government officials briefed on the Budget preparations said Sunak had looked at reducing the 5% VAT, but no decisions had been taken yet, the newspaper added.''
Market implications
This is unlikely to have any material impact on the pound in the open but is bullish for the long term as the UK resolves a means to mitigate the risks of the energy crisis to UK businesses.
Meanwhile, the pound rose on Friday for its biggest weekly gain against both the dollar and the euro since May, boosted by a combination of dollar weakness and expectations that the Bank of England will raise rates this year.
-
21:05
Evergrande contagion risks intensify, but PBoC says can be contained in China
Bloomberg has reported that the People’s Bank of China Governor Yi Gang said authorities can contain risks posed to the Chinese economy and financial system from the struggles of the China Evergrande Group.
at a virtual meeting of the Group of 30 on Sunday. Yi Gang said that the property developer’s trouble “casts a little bit of concern,” but, “overall, we can contain the Evergrande risk.”
These comments follow the past couple of weeks of heightened concerns over contagion risks due to a surprise default by Fantasia Holdings Group Co. and a warning from Sinic Holdings Group Co. that its default was imminent.
However, Yi said Evergrande’s liabilities were spread across “hundreds” of entities in the financial system so that there is “not much concentration.”
“The rights and interests of creditors and shareholders will be fully respected in strict accordance with the law. And also the law has clearly indicated the seniority of those liabilities,” he added.
“I think we can prevent systemic risk,” he said, by keeping risk contained.
Market implications
There is a very watchful eye over the situation and the Aussie is likely the most exposed of the majors to the crisis for its reliance on iron ore and various exports with their largest trade partner.
-
20:27
ECB’s Lagarde: Inflation spike is ‘largely transitory’
The European Central Bank will continue aiding the euro-area economy as the fallout from the pandemic lingers, President Christine Lagarde said at an International Monetary Fund event on Saturday.
“Monetary policy will continue supporting the economy in order to durably stabilize inflation at our 2% inflation target over the medium term,” Lagarde said in the 2021 Per Jacobsson Lecture at the International Monetary Fund on Saturday.
“The ECB is committed to preserving favourable financing conditions for all sectors of the economy over the pandemic period,” she said, according to a prepared text released by the ECB.
She also said, however, that “Inflation is largely transitory”, adding, ''once the pandemic emergency comes to an end, which is drawing closer, our forward guidance on rates, as well as asset purchases, will ensure that monetary policy remains supportive of the timely attainment of our target.”
Market implications
Will the markets buy into this move dovish rhetoric from the ECB's governor or will it take the view that inflation appears to be less transitory?
The ECB rolled out a 1.85 trillion-euro ($2.15 trillion) emergency scheme to support the region during the Covid period. That program is due to end in March which is yet to support the euro in any meaningful way. In fact, EUR/USD broke below the 200-day moving average mid-Sep.
Instead, traders might be more inclined to note that the central bank is already preparing to transition to post-pandemic stimulus. ''It is studying a new bond-buying program to prevent any market turmoil once when crisis purchases end, officials familiar with the matter told Bloomberg last week''.
-
19:56
Gold Chart of the Week: XAU hit the $1,800 target, now what?
- Gold bulls eye the Sep highs near $1,830 for the weeks ahead.
- $1,770 is a key level that bulls need to overcome this week.
- Stagflation risks should underpin the precious metal.
AS per the prior week's Gold Chart of the Week: XAU/USD bulls step in, $1,770, $1,790 and then the 200-day MA was eyed as targets for last week, all of which were achieved into $1,800.
Gold daily chart, prior analysis
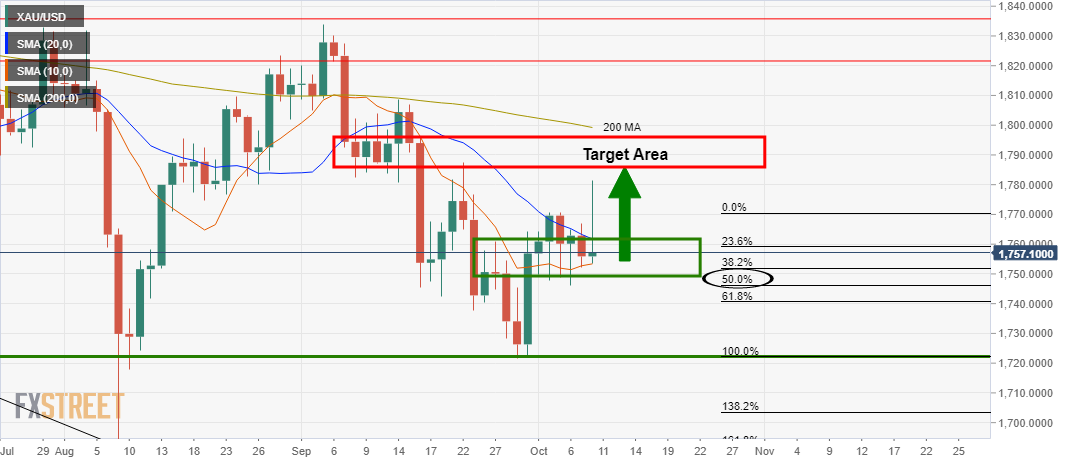
The upside projection was based on a longer-term analysis, but also the given the daily bullish close at support and the wick: It was stated that ''the expectations are for it to be filled in by price action in the next few sessions. The target area for gold is based on a -272% Fibonacci retracement of the 50% mean reversion and corrective range. This comes in at $1,790 with a confluence of the prior structure en route to gold's 200-day moving average.''
Gold's prior 4-hour analysis
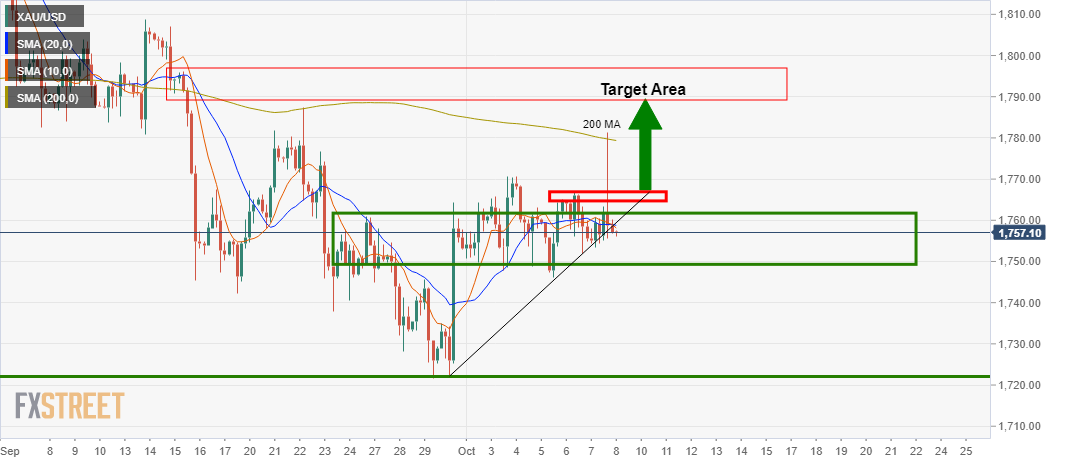
From a 4-hour perspective, gold bulls would be prudent to see the price make a move in the direction of the target to break the near term resistance around $1,770. In engaging above this area, there is a higher probability of a bullish continuation for gold this week.
Gold, live market update
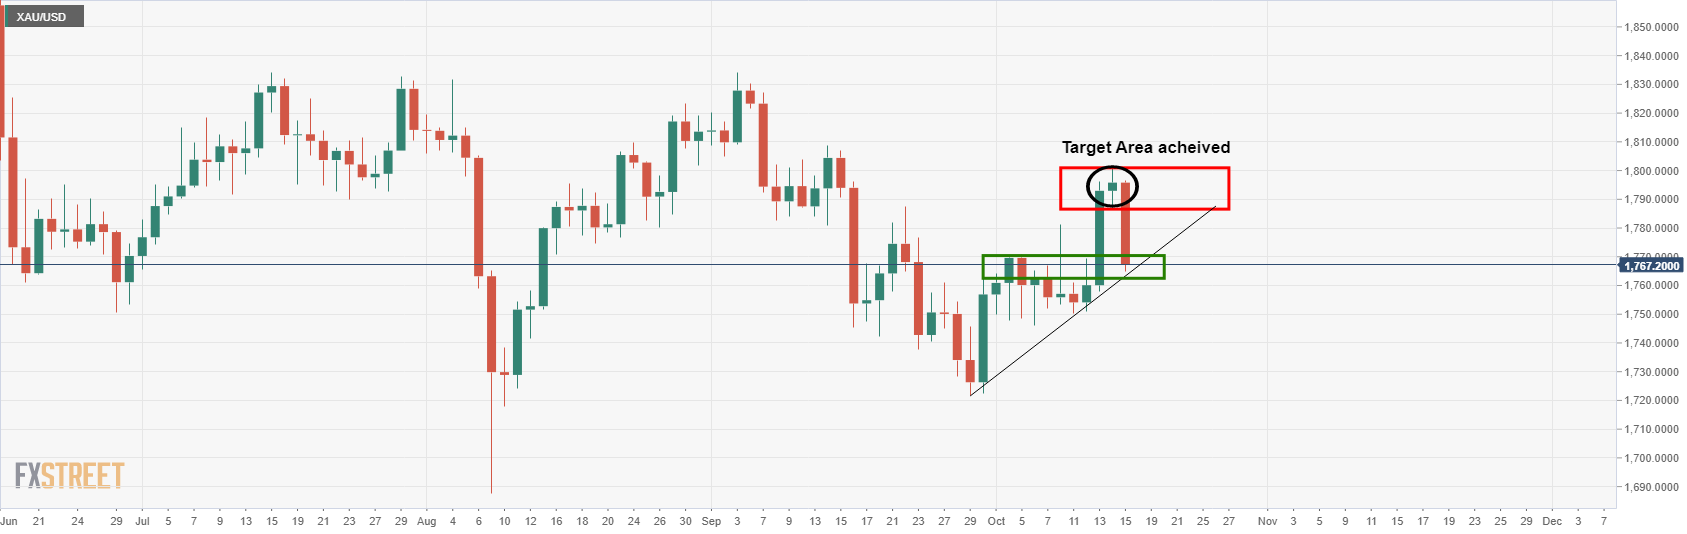
The price has met the target area but was rejected heavily on the last day of trade last week. The move was blamed on a spike in US yields, Retail Sales surprising to the upside and risk-on appetite. The data likely sent the algos into sell mode as the data pointed to a stronger economy and higher expectations of the Federal Reserve to hike rates sooner than what was priced in.
However, the real focus has to be on inflation and as well as the energy crisis. Stagflation is a real risk that is bound to start to gain some traction for the week ahead as traders survey a number of macro risks, including China's economy and supply shocks.
''Gold is an ideal hedge against rising stagflationary winds, but market pricing for Fed hikes fails to consider that a potential energy supply shock would be unlikely to elicit a Fed response,'' analysts at TD Securities explained. ''In turn, market pricing for Fed hikes is too hawkish relative to TD Securities' expectations.''
Putting fundamentals aside, technically, the drop On Friday will have sent weaker bulls to the sidelines and we are likely to see some consolidation to start the week off.
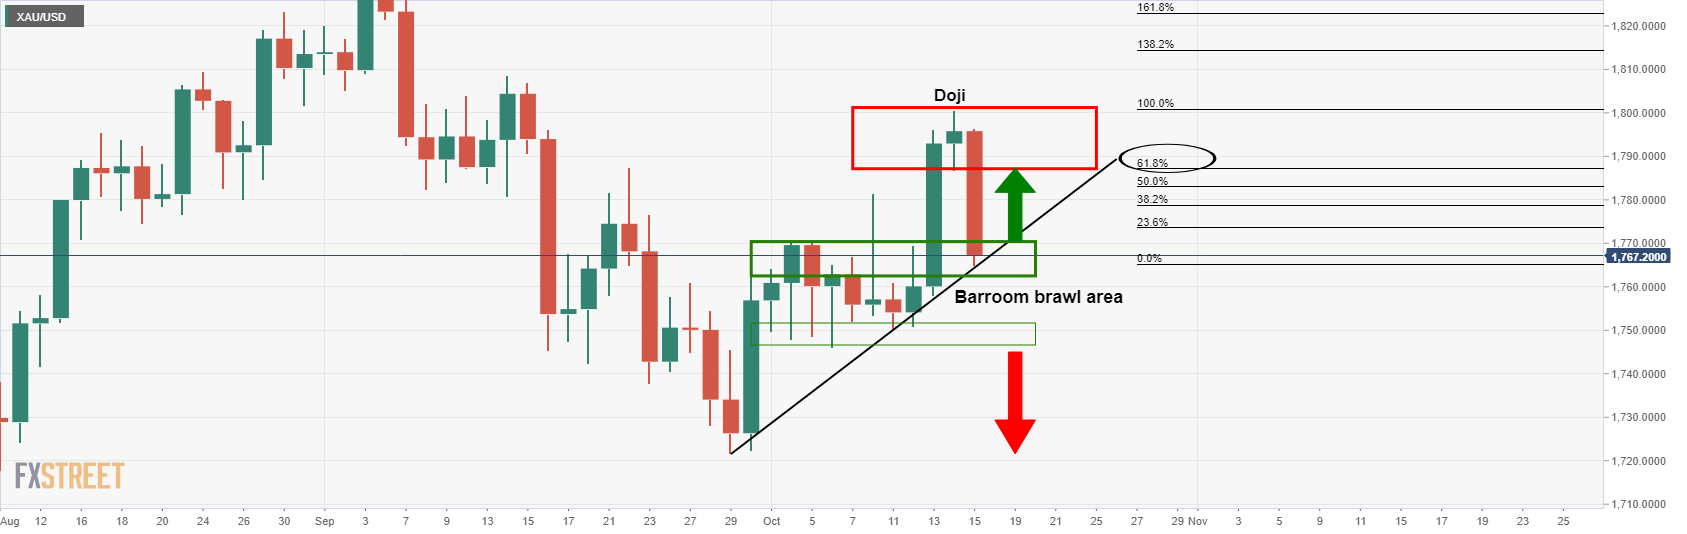
As illustrated above, the price is testing not only dynamic support but horizontal also. This would be expected to hold initial tests and potentially lead to a restest of the prior day's lows of the Doji candle which has a confluence with the 61.8% Fibonacci retracement level near 1,786.
If gold does manage to break the dynamic trendline support, there is still going to be room into the 1,750s where price could find itself stuck in a range, aka, the ''barroom brawl''.
If, on the other hand, the price holds and moves up beyond 1,770 again, that would be bullish as follows on the weekly chart:
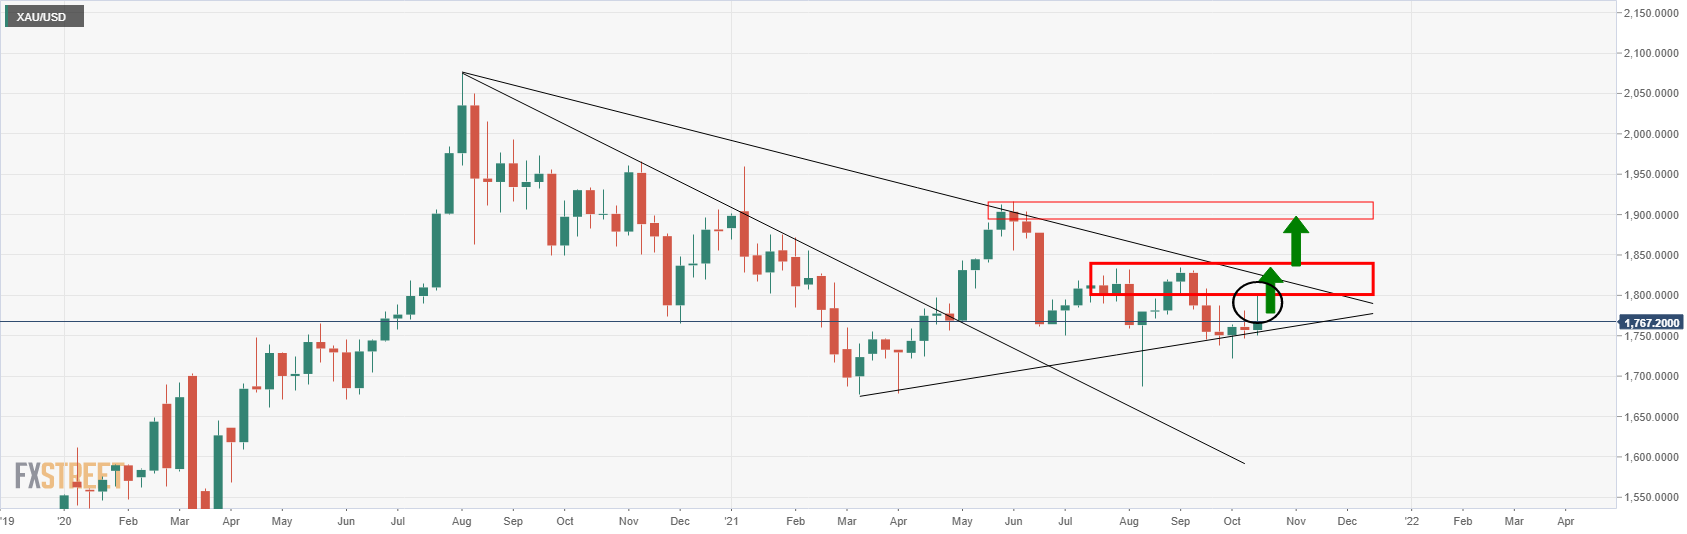
The wick on the weekly chart and bullish close are compelling. The wick would be expected to be filled over the course of the next week from a lower time frame perspective and this leaves the prior tops between July - Sep exposed near 1,835.
-