Notícias do Mercado
-
23:29
Currencies. Daily history for Jan 18’2018:
(pare/closed(GMT +3)/change, %)
EUR/USD $1,2238 +0,45%
GBP/USD $1,3893 +0,47%
USD/CHF Chf0,95891 -0,66%
USD/JPY Y111,10 -0,18%
EUR/JPY Y135,97 +0,27%
GBP/JPY Y154,343 +0,30%
AUD/USD $0,7998 +0,35%
NZD/USD $0,7300 +0,41%
USD/CAD C$1,24157 -0,14%
-
22:50
Schedule for today, Friday, Jan 19’2018 (GMT0)
07:00 Germany Producer Price Index (YoY) December 2.5% 2.3%
07:00 Germany Producer Price Index (MoM) December 0.1% 0.2%
08:15 Switzerland Producer & Import Prices, y/y December 1.8%
09:00 Eurozone Current account, unadjusted, bln November 35.9
09:30 United Kingdom Retail Sales (MoM) December 1.1% 0.3%
09:30 United Kingdom Retail Sales (YoY) December 1.6% 2.1%
13:30 Canada Foreign Securities Purchases November 20.81
13:30 Canada Manufacturing Shipments (MoM) November -0.4% 2%
15:00 U.S. Reuters/Michigan Consumer Sentiment Index (Preliminary) January 95.9 97
17:15 U.S. FOMC Member Quarles Speaks
18:00 U.S. Baker Hughes Oil Rig Count January 752
-
21:30
New Zealand: Business NZ PMI, December 51.2
-
16:02
U.S. commercial crude oil inventories decreased by 6.9 million barrels from the previous week
U.S. commercial crude oil inventories (excluding those in the Strategic Petroleum Reserve) decreased by 6.9 million barrels from the previous week. At 412.7 million barrels, U.S. crude oil inventories are in the middle of the average range for this time of year.
Total motor gasoline inventories increased by 3.6 million barrels last week, and are in the middle of the average range. Both finished gasoline inventories and blending components inventories increased last week. Distillate fuel inventories decreased by 3.9 million barrels last week and are in the lower half of the average range for this time of year. Propane/propylene inventories decreased by 3.7 million barrels last week, and are in the lower half of the average range. Total commercial petroleum inventories decreased by 13.8 million barrels last week.
-
16:00
U.S.: Crude Oil Inventories, January -6.861 (forecast -3.536)
-
15:53
French finance minister Le Maire says we are prepared to look into issues that worry Germany on Euro Zone reform, such as banks non-performaing loans
-
15:05
French finance minister Le Maire says to make joint german and french proposal on bitcoin regulation to G20
-
14:21
U.S. 10-year treasury yield hits 2.616 pct, highest since march 14 2016
-
13:41
U.S economic growth continued in January, according to the firms responding to Philadelphia Fed Manufacturing Index
The broadest measures of current conditions remained positive this month, although indexes for general activity, new orders, and employment declined from their readings in December. The firms reported higher prices for both inputs and their own manufactured goods this month. The future indexes reflecting expected growth over the next six months remained at high levels, although the indexes fell from their readings in December.
The index for current manufacturing activity in the region decreased from a revised reading of 27.9 in December to 22.2 this month.
-
13:39
U.S building permits and housing starts mixed in December
Privately-owned housing units authorized by building permits in December were at a seasonally adjusted annual rate of 1,302,000. This is 0.1 percent below the revised November rate of 1,303,000, but is 2.8 percent above the December 2016 rate of 1,266,000. Single-family authorizations in December were at a rate of 881,000; this is 1.8 percent above the revised November figure of 865,000. Authorizations of units in buildings with five units or more were at a rate of 382,000 in December. An estimated 1,263,400 housing units were authorized by building permits in 2017. This is 4.7 percent (±0.6%) above the 2016 figure of 1,206,600.
Privately-owned housing starts in December were at a seasonally adjusted annual rate of 1,192,000. This is 8.2 percent below the revised November estimate of 1,299,000 and is 6.0 percent below the December 2016 rate of 1,268,000. Single-family housing starts in December were at a rate of 836,000; this is 11.8 percent below the revised November figure of 948,000. The December rate for units in buildings with five units or more was 352,000. An estimated 1,202,100 housing units were started in 2017. This is 2.4 percent above the 2016 figure of 1,173,800.
-
13:37
U.S initial jobless claims lower than expected last week
In the week ending January 13, the advance figure for seasonally adjusted initial claims was 220,000, a decrease of 41,000 from the previous week's unrevised level of 261,000. This is the lowest level for initial claims since February 24, 1973 when it was 218,000. The 4-week moving average was 244,500, a decrease of 6,250 from the previous week's unrevised average of 250,750.
-
13:30
U.S.: Philadelphia Fed Manufacturing Survey, January 22.2 (forecast 25.0)
-
13:30
U.S.: Initial Jobless Claims, January 220 (forecast 250)
-
13:30
U.S.: Continuing Jobless Claims, January 1952 (forecast 1900)
-
13:30
U.S.: Building Permits, December 1.302 (forecast 1.29)
-
13:30
U.S.: Housing Starts, December 1.192 (forecast 1.275)
-
11:53
ANALISE BITCOIN - USD (GRÁFICO SEMANAL)
ANALISE BITCOIN - USD (GRÁFICO SEMANAL) 17-01-18
Para nossa análise utilizamos os seguintes indicadores técnicos:
*Média móvel exponencial de 9 períodos (azul)
*Média móvel simples de 21 períodos (magenta)
*Bandas Bollinger
*RSI
*Volume
*Retração (amarela) de Fibonacci sobre tendência
Conforme acompanhamos desde dezembro /17 os preços do bitcoin vem passando por uma correção (61.8% da retração de Fibonacci) do gráfico semanal. Essa correçao neste ponto específico é uma zona de forte resistência onde os investidores posicionam ordens de compra na média de 21 períodos. Percebe-se que as médias móveis estão distantes seguindo o padrão de alta de longo prazo. O RSI recuou e agora esta abaixo dos 70 fato que garante mais fôlego para que os touros retomem a força e o bitcoin continue sua escalada a valores mais altos no longo prazo
*Apontamos a retração de Fibonacci de 61.8% como um bom ponto de entrada para um swing trade.
*O stop Loss para esta operação fica um pouco abaixo da média móvel de 21 períodos
* Se a tendencia de alta de longo prazo for retomada temos nosso alvo (Profit) acima do último topo histórico de alta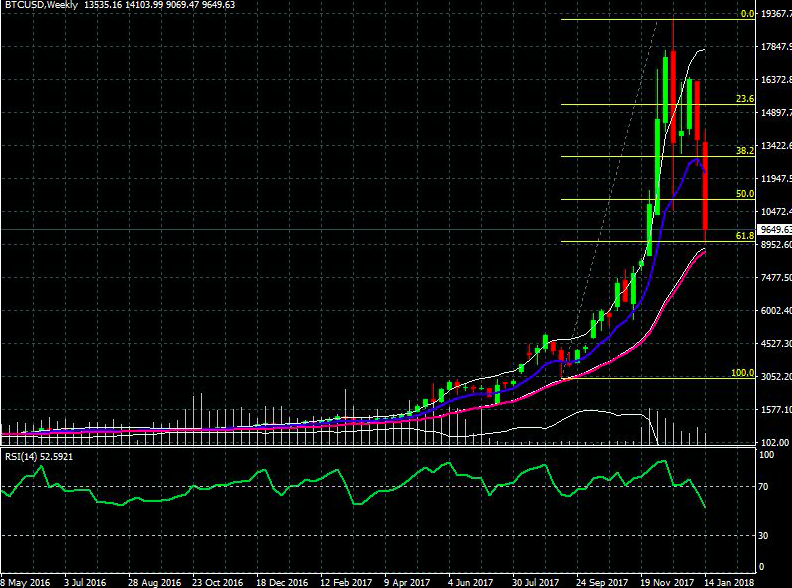
-
10:57
Bundesbank’s Weidmann: marked reduction in german growth potential could translate into lower long-term interest rates @livesquawk
-
10:28
Norway central bank survey: banks expect small or no changes in demand, credit standards, loan conditions, lending rates or lending margins in 2018 Q1
-
10:02
Forex option contracts rolling off today at 14.00 GMT:
EUR/USD: 1.2000 (2.4 b), 1.2100-05 (781 m), 1.2180 (553 m), 1.2200 (549 m), 1.2220(767 m), 1.2300 (627 m)
USD/JPY: 110.80 (1.5 b), 111.00-05 (1.5 b), 112.50 (701 m)
USD/CAD: 1.2400 (570 m), 1.2460 (780 m)
NZD/USD: 0.7025 (2.0 b)
EUR/GBP: 0.8650 (860 m), 0.8765 (862 m)
-
08:08
Russia says Washington's allegation that Russia is violating U.N. sanctons on N.Korea is groundless - Interfax cites source at Russia's foreign ministry
-
07:43
Options levels on thursday, January 18, 2017
EUR/USD
Resistance levels (open interest**, contracts)
$1.2340 (4044)
$1.2310 (5514)
$1.2287 (3098)
Price at time of writing this review: $1.2188
Support levels (open interest**, contracts):
$1.2144 (1506)
$1.2111 (1757)
$1.2073 (2246)
Comments:
- Overall open interest on the CALL options and PUT options with the expiration date February, 9 is 106667 contracts (according to data from January, 17) with the maximum number of contracts with strike price $1,2100 (5514);
GBP/USD
Resistance levels (open interest**, contracts)
$1.3944 (3177)
$1.3928 (3482)
$1.3909 (897)
Price at time of writing this review: $1.3817
Support levels (open interest**, contracts):
$1.3735 (228)
$1.3700 (508)
$1.3663 (208)
Comments:
- Overall open interest on the CALL options with the expiration date February, 9 is 33837 contracts, with the maximum number of contracts with strike price $1,3600 (3482);
- Overall open interest on the PUT options with the expiration date February, 9 is 28546 contracts, with the maximum number of contracts with strike price $1,3500 (3055);
- The ratio of PUT/CALL was 0.84 versus 0.86 from the previous trading day according to data from January, 17
* - The Chicago Mercantile Exchange bulletin (CME) is used for the calculation.
** - Open interest takes into account the total number of option contracts that are open at the moment.
-
07:42
Chinese GDP and industrial production rose more than expected in December
China's economy expanded at a steady pace at the end of 2017, data from the National Bureau of Statistics showed, cited by rttnews.
Gross domestic product climbed 6.8 percent year-on-year in the fourth quarter, the same pace of growth as seen in the third quarter. The rate was forecast to slow to 6.7 percent.
In 2017, the economy expanded at a faster pace of 6.9 percent after rising 6.7 percent in 2016, and exceeded the government's 2017 target of about 6.5 percent.
Another report showed that industrial production advanced 6.2 percent annually, slightly faster than the 6.1 percent increase seen in November. The rate was forecast to remain unchanged at 6.1 percent.
For the whole year of 2017, industrial production grew 6.6 percent, as expected.
-
07:14
U.S. 10-year treasury yield at 2.587 pct vs U.S. close of 2.578 pct on wednesday
-
07:06
Australian unemployment rate up 0.1% to 5.5% in December
Trend estimates (monthly change)
-
Employment increased 25,000 to 12,419,800.
-
Unemployment increased 100 to 715,000.
-
Unemployment rate decreased by less than 0.1 pts to 5.4%.
-
Participation rate remained steady at 65.5%.
-
Monthly hours worked in all jobs increased 4.0 million hours (0.2%) to 1,738.4 million hours.
Seasonally adjusted estimates (monthly change)
-
Employment increased 34,700 to 12,440,800. Full-time employment increased 15,100 to 8,518,900 and part-time employment increased 19,500 to 3,921,800.
-
Unemployment increased 20,500 to 730,600. The number of unemployed persons looking for full-time work increased 9,900 to 501,800 and the number of unemployed persons only looking for part-time work increased 10,600 to 228,800.
-
Unemployment rate increased 0.1 pts to 5.5%
-
Participation rate increased by 0.2 pts to 65.7%.
-
Monthly hours worked in all jobs decreased 4.2 million hours (0.2%) to 1,736.4 million hours.
-
-
07:00
China: GDP y/y, Quarter IV 6.8% (forecast 6.7%)
-
07:00
China: Retail Sales y/y, December 9.4% (forecast 10.1%)
-
07:00
China: Industrial Production y/y, December 6.2% (forecast 6%)
-
04:38
Japan: Industrial Production (MoM) , November 0.5% (forecast 0.6%)
-
04:38
Japan: Industrial Production (YoY), November 3.6% (forecast 3.7%)
-
00:30
Australia: Unemployment rate, December 5.5% (forecast 5.4%)
-
00:30
Australia: Changing the number of employed, December 34.7 (forecast 9)
-
00:00
Australia: Consumer Inflation Expectation, January 3.7%
-