Notícias do Mercado
-
23:48
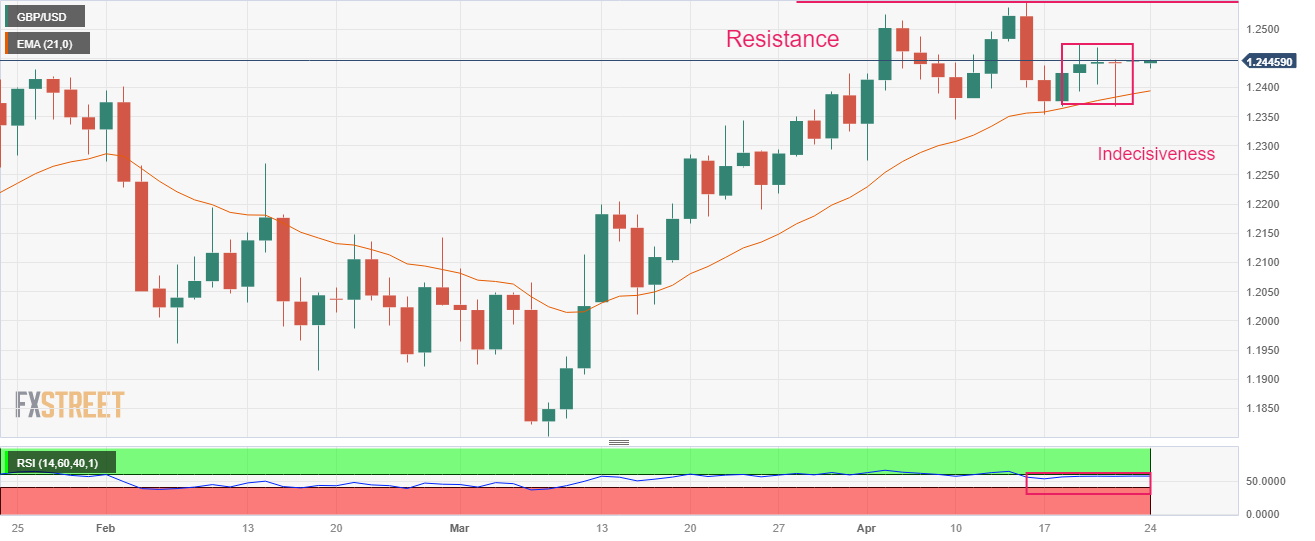
GBP/USD Price Analysis: Consecutive Dojis indicate indecisiveness
- GBP/USD has stretched its recovery above 1.2440 as USD Index is struggling to defend its four-day support.
- BoE Ramsden warned that the central bank must stop the risk of high inflation becoming embedded in the economy.
- Consecutive Doji formations by GBP/USD indicate a sheer contraction in volatility.
The GBP/USD pair has rebounded sharply above 1.2440 in the early Tokyo session. The Cable is looking to extend its recovery ahead as investors are very much confident of further rate hikes from the Bank of England (BoE).
BoE Deputy Governor Dave Ramsden said in an interview with The Times that the central bank must stop the risk of high inflation becoming embedded in the economy. He added there were still signs of stubbornly high inflation. However, the United Kingdom Retail Sales data landed on Friday contracted more than expected. Monthly (March) Retail Sales data contracted by 0.9% while the street was anticipating a contraction of 0.5%. UK’s stubborn inflation has heavily impacted households’ retail demand.
Meanwhile, S&P500 futures are showing some losses in the early Asian session after a choppy Friday. Investors are witnessing a stock-specific action amid the quarterly earnings season, keeping investors risk-averse. The US Dollar Index (DXY) is struggling to defend the crucial support of 101.70.
Consecutive Doji candlesticks formation on the daily scale by GBP/USD indicates a sheer contraction in volatility. The Cable is struggling to find decisive movements amid an absence of a potential trigger. The 20-period Exponential Moving Average (EMA) at 1.2395 is providing cushion to the Pound Sterling.
Meanwhile, the Relative Strength Index (RSI) (14) has shown a loss in the upside momentum and has shifted into the 40.00-60.00 range.
Further stretch in recovery above April 13 high at 1.2537 will drive the asset towards a fresh 10-month high at 1.2597, which is 08 June 2022 high. A breach of the latter will expose the asset to May 27 high at 1.2667.
On the flip side, a slippage below April 10 low at 1.2345 will expose the asset to March 30 low at 1.2294 followed by March 27 low at 1.2219.
GBP/USD daily chart
-
23:20
Gold Price Forecast: XAU/USD extends gains above $1,980 despite solid US activity backs hawkish Fed bets
- Gold price has stretched its recovery above $1,980.00 despite bets supportive of more rate hikes from the Fed.
- The US Preliminary Manufacturing PMI figure landed above 50.0 for the first time in the past six months.
- Gold price is struggling to defend the cushion from the lower portion of a Rising Channel chart pattern.
Gold price (XAU/USD) showed a recovery move from near the crucial support of $1,970.00 and has stretched its recovery above $1,980.00 in the early Asian session. The precious metal has rebounded after a sheer sell-off despite solid preliminary United States S&P PMI data released on Friday.
S&P500 ended mild positive on Friday as significant movements remained stock-specific due to the quarterly result season, portraying a quiet market mood. The US Dollar Index (DXY) has remained topsy-turvy, ranging in a tight boundary of 101.63-102.14 for the past four trading sessions. Meanwhile, the demand for US government bonds trimmed further as bets for one more rate hike remain solid. This has led to a further jump in US Treasury yields. The yields offered on 10-year US bonds jumped to near 3.57%.
On Friday, the preliminary S&P Manufacturing data jumped to 50.4 from the consensus of 49.0 and the former release of 49.2. The figure landed above 50.0 for the first time in the past six months. A recovery in manufacturing activities in spite of higher interest rates from the Federal Reserve (Fed) and tight credit conditions from US commercial banks supports further policy tightening. This also hints that demand for labor will remain extremely tight.
In addition, preliminary Services PMI jumped to 53.7 from the estimates of 51.5 and the former release of 52.6. An all-around strength in the US economic activities is backing the need for more rate hikes from the Fed.
Gold technical analysis
Gold price is struggling to defend the cushion from the lower portion of a Rising Channel chart pattern formed on a two-hour scale. The precious metal has shifted below the 200-period Exponential Moving Average (EMA) at $1,991.20, which indicates that the long-term trend has turned bearish. A slippage below the immediate support plotted from April 19 low at $1,969.26 will expose the asset to a fresh downside.
The Relative Strength Index (RSI) (14) has shifted its oscillation range into the 20.00-60.00 range indicating a bearish range shift.
Gold two-hour chart

-
23:10
NZD/USD bears lurking front side of bearish trendline
- NZD/USD is correcting into bearish resistance between 0.6150 and the 0.6170s.
- Bears eye a move lower while front side of the bearish trendline.
NZD/USD is flat in the early Asian session and start of the week. The pair is around 0.6135 within a bearish trend and near a fresh low for the month as the US Dollar leads the pack.
´´That was likely a hangover from soft CPI numbers earlier in the week, with markets likely taking the view that soft NZ Consumer Price Index, CPI, might be a harbinger of things to come in AU this week, with neither the Kiwi or Aussie following other correlated currencies like EUR and GBP higher,´´ analysts at ANZ Bank said.
As for the US data, ´´preliminary PMI data indicated a firming in economic activity this month as composite indices recovered to their highest levels in 12 months,´´ the analysts said in a note on Monday morning.
´´ The FOMC is now beginning its blackout period and the ECB will start its quiet period late next week. The market is currently over 90% priced for a 25bp rate rise from the FOMC.´´
On the domestic front, after the surprise from the Reserve Bank of New Zealand, there was little public communication from Bank's officials on the rationale behind the decision, analysts at TD Securities explained. ´´Chief Economist Conway will speak at the universities with comments on monetary policy. Markets will watch Conway's comments on inflation and the Board's reaction function for the May policy decision, especially after the first quarter CPI downside miss.´´
NZD/USD daily charts
As per the prior analysis, NZD/USD Price Analysis: Bears about to reengage for another push to fresh lows, NZD/USD has indeed pushed lower.
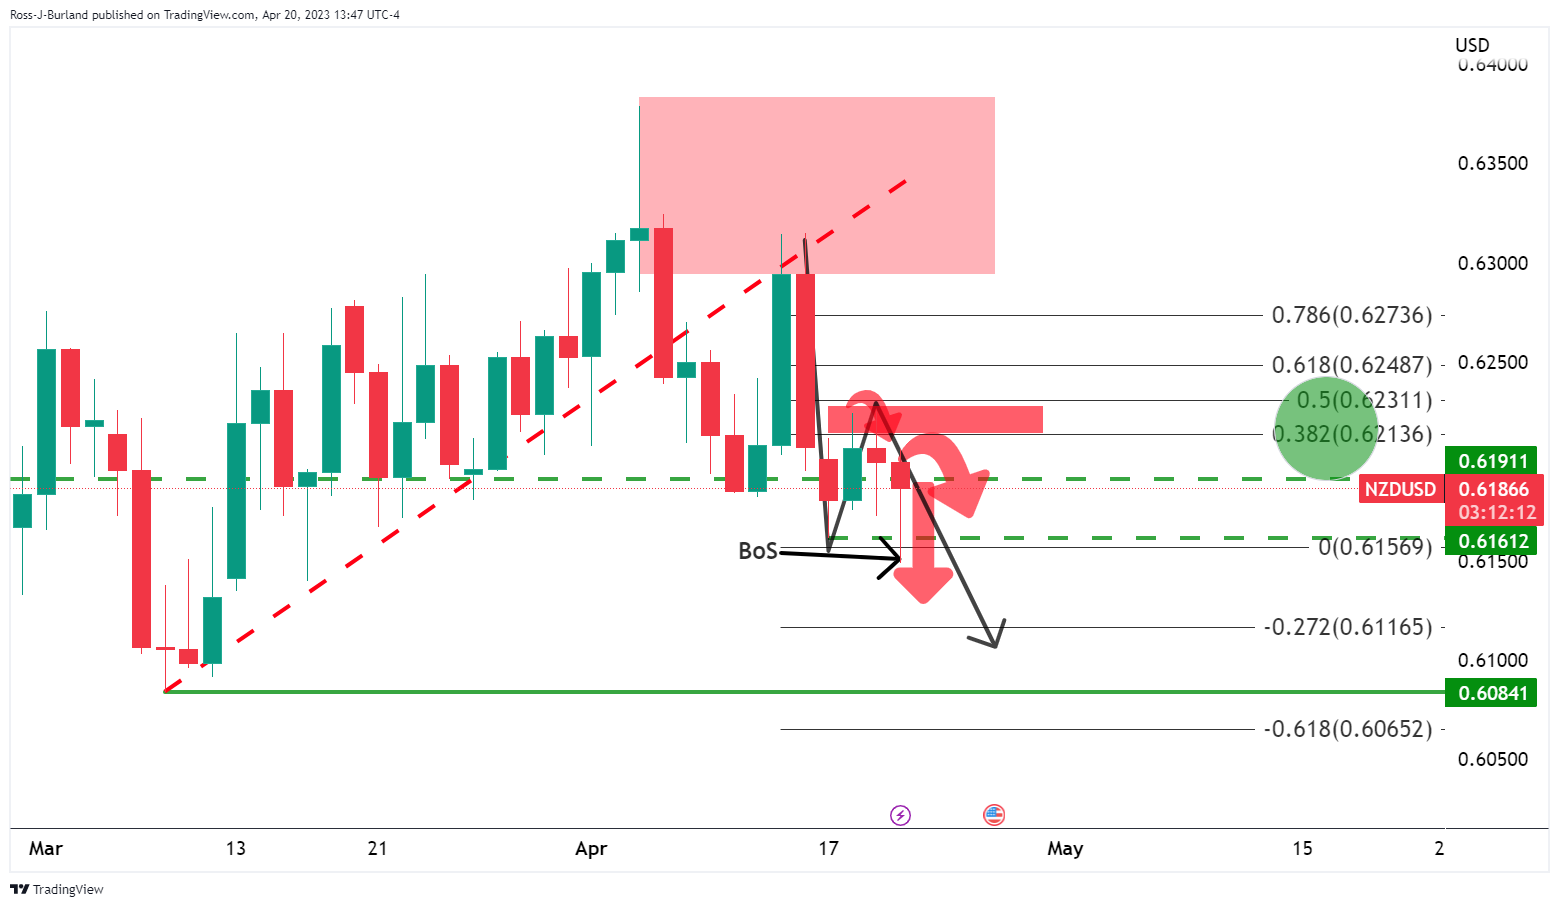
(Prior analysis above, update below)

NZD/USD H4 charts
We have seen a firm move lower and the lower time frames can offer clues as to whether this has momentum.
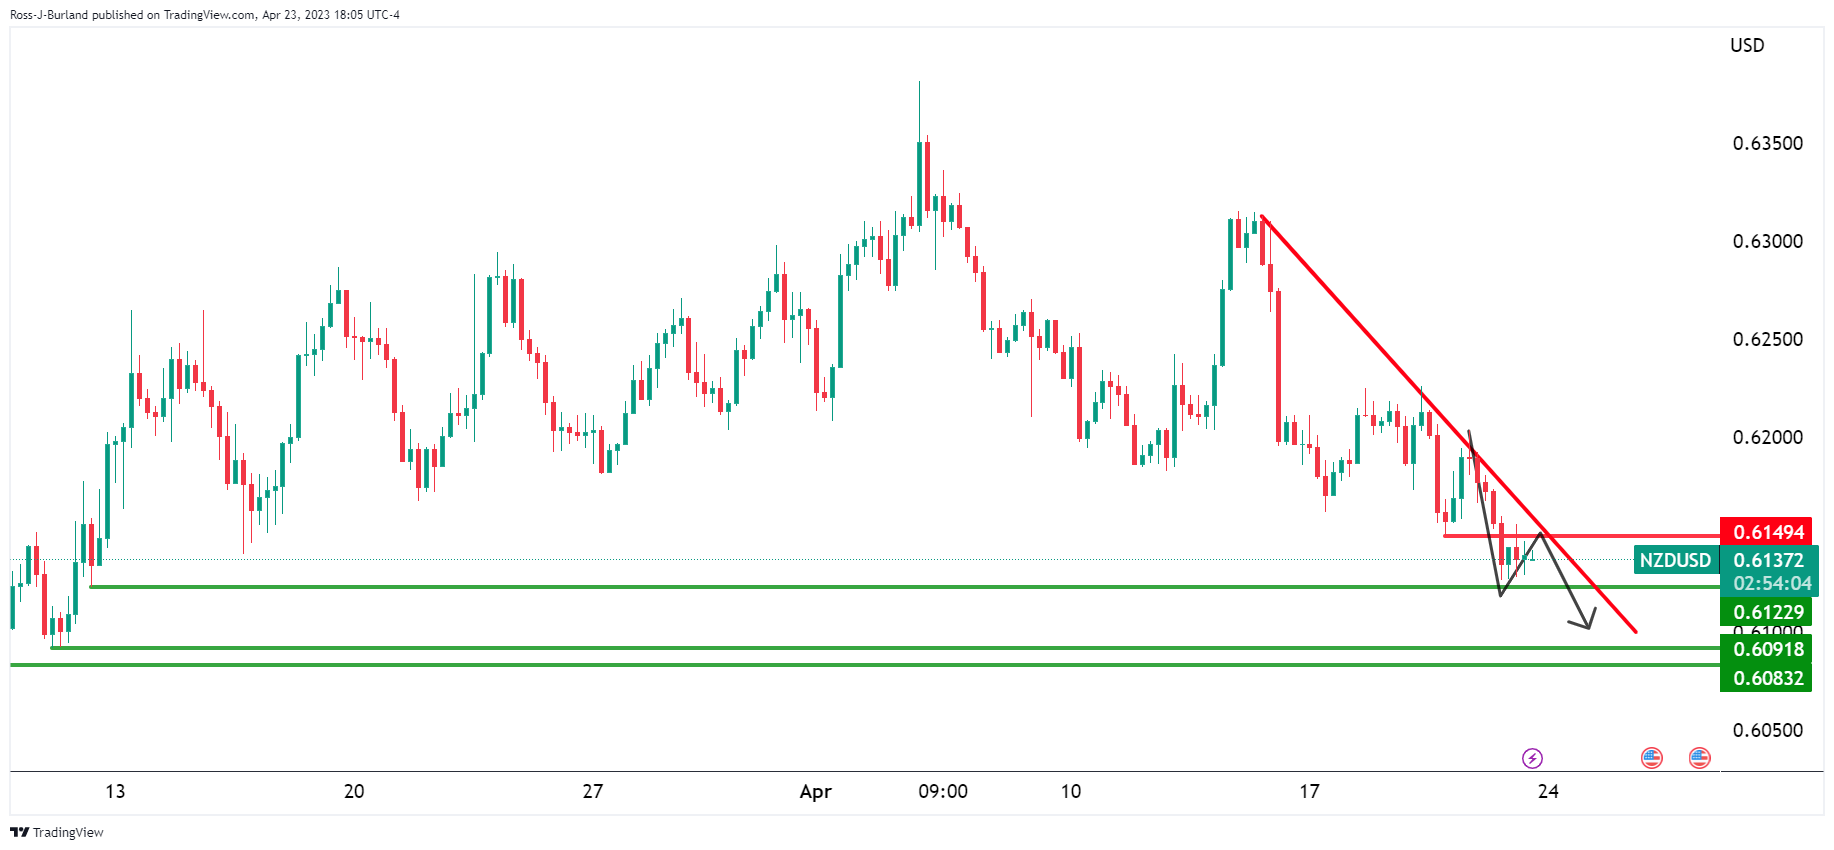

NZD/USD is on the front side of the micro-bear trend and a pullback into the Fibonacci scale aligns with a test of the bearish resistance between 0.6150 and the 0.6170s.
-
22:31
EUR/USD Price Analysis: Bears in the market and eye break of 1.0909
- EUR/USD is on the verge of a breakout.
- EUR/USD bears on the backside of the bullish trend.
EUR/USD has moved to the backside of the bullish trend and below 1.0990 which is now acting as a resistance structure.
EUR/USD weekly chart
The weekly chart shows that the price is pausing at a longer-term resistance area:
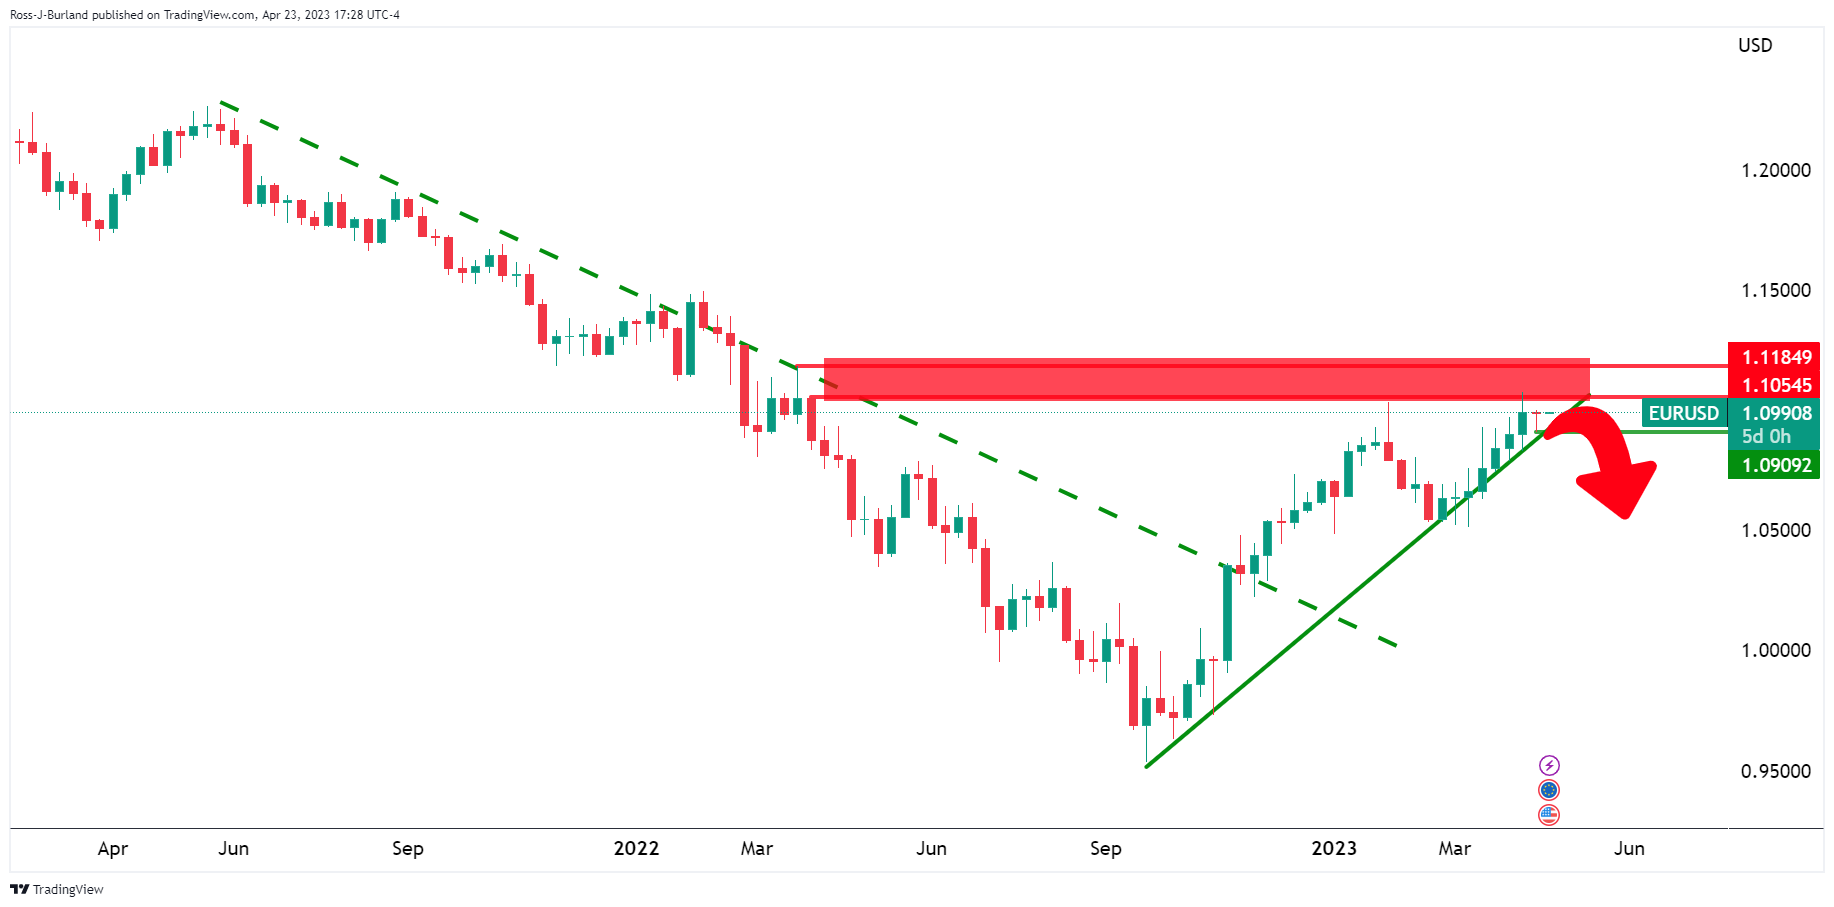
The following is a daily and lower timeframe analysis that illustrates the prospects of a move to test 1.0909 and the 1.0830s for the week ahead.
EUR/USD daily chart
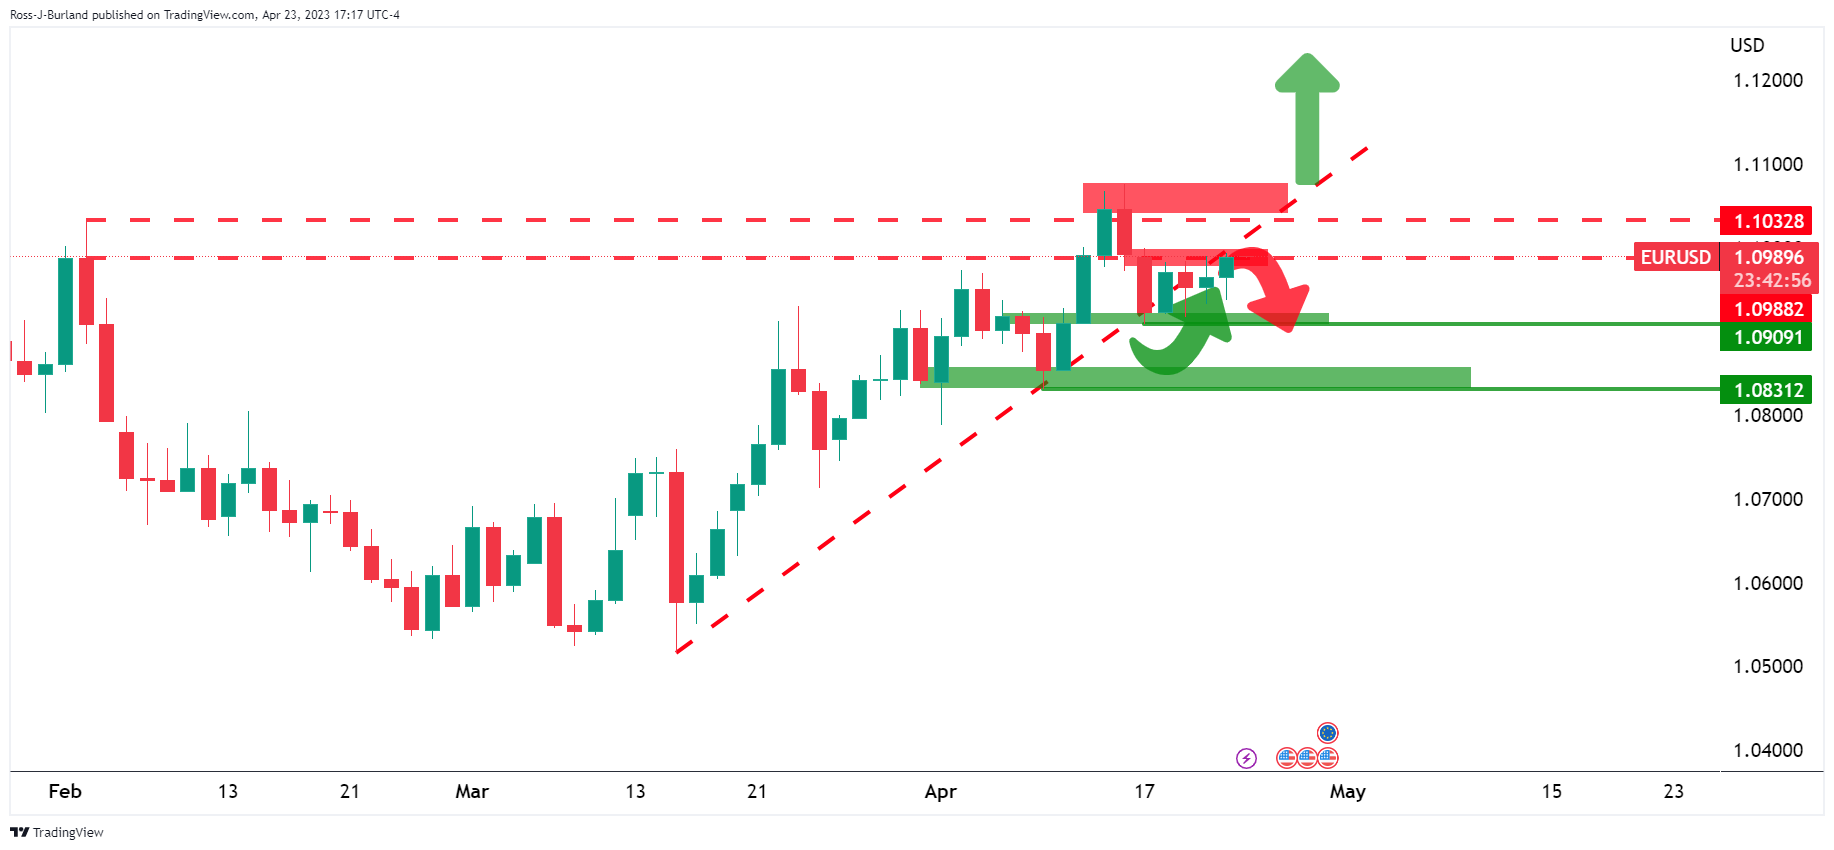
If the bears stay committed to the move below 1.1000 and to the back side of the bullish trend, then a break of 1.0910 opens the risk for lower levels:
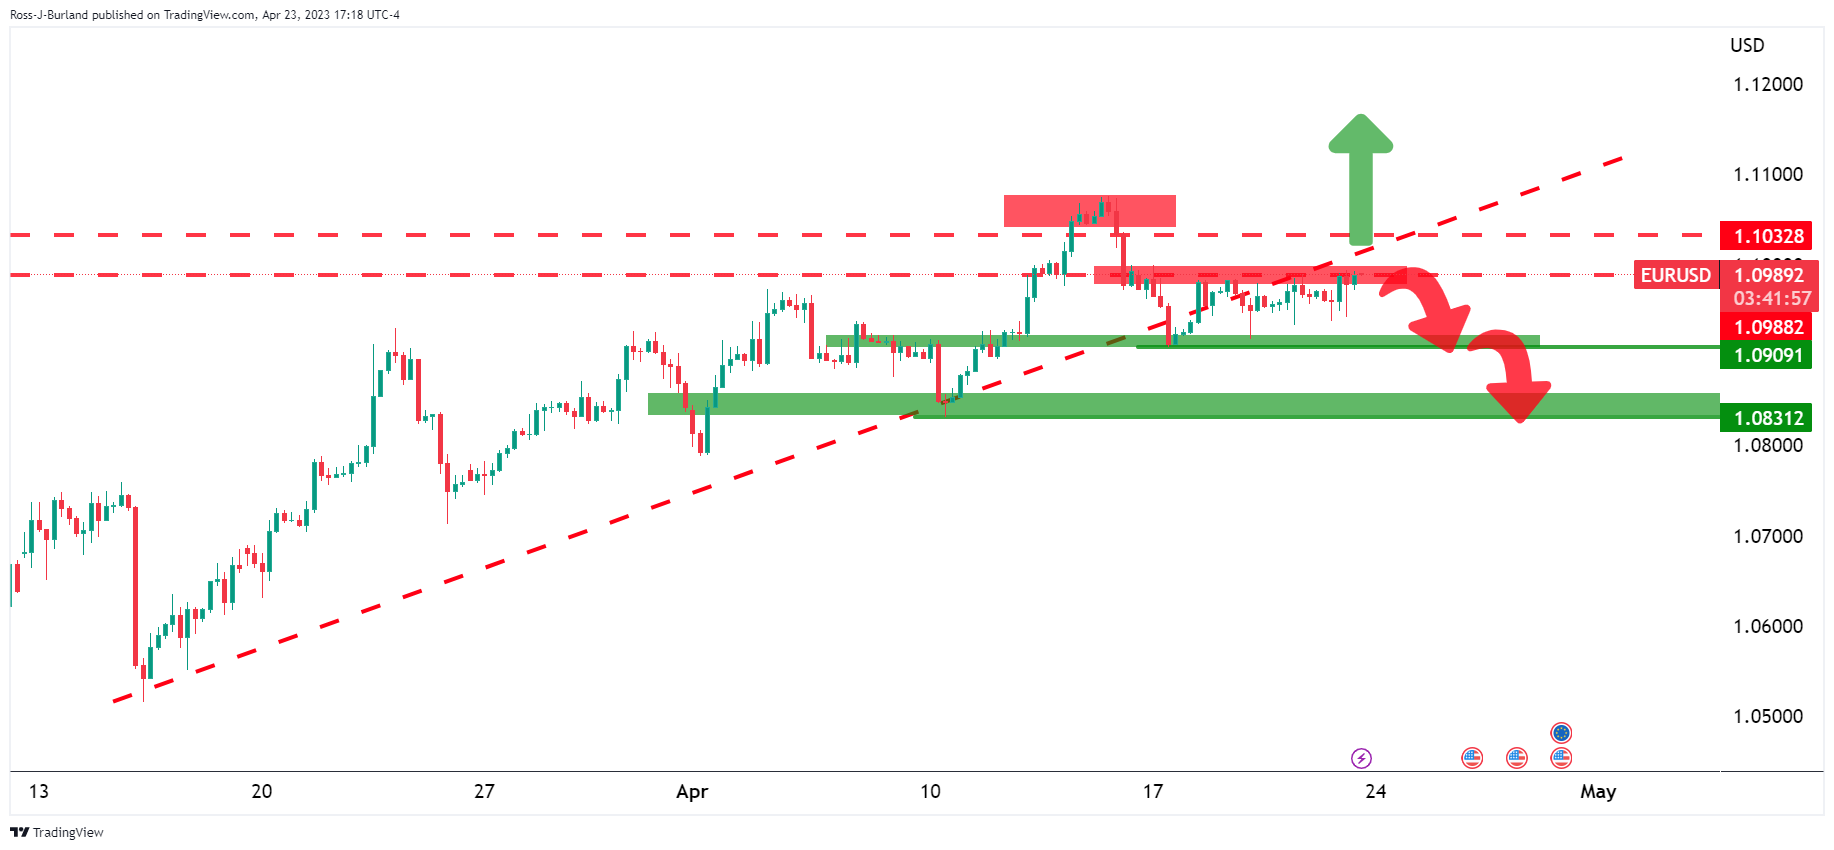
The 4-hour chart shows that the bulls are attempting to take back control and a break of 1.1090 and 1.1030 will possibly see further demand for higher to come.
-
21:45
EU said to get ready a ban on many goods passing through Russia
The EU is said to get ready a ban on many goods passing through Russia.
Meanwhile, it is reported that Russian troops are concentrating their efforts on conducting offensives toward Bakhmut, Avdiivka, and Marinka in Donetsk Oblast. Ukrainian troops repelled 58 Russian attacks in those directions on April 22, according to the military.
-
21:20
BoJ plans to examine its policy taken over past decades
The Sankei newspaper reported Sunday that the Bank of Japan is planning to review and inspect policies taken over the past decades, kicking off discussions at a two-day meeting scheduled for April 27 and 28 under newly-appointed Governor Kazuo Ueda.
Sankei reported that the BOJ will examine the reasons undergirding Japan’s stagnant economy so the central bank can come up with effective policies under Ueda.
Earlier this month, Ueda said he was open to the idea of a longer-term policy review.
-
21:19
AUD/USD Price Analysis: Bears aligned below 0.6710
- AUD/USD bears are in the market and price is offered below 0.6710.
- Bears seeking a break in support structure.
AUD/USD has been under pressure over the course of the past few days, despite a strong Australian labour market report for March and the resultant boost in expectations that the RBA may hike rates again as soon as early May. The US Dollar has been firmer, however, as this is seeing to an offer in the pair as the following illustrates:
AUD/USD weekly chart
The weekly chart has the price coiling in the correction with the possibility of a downside continuation while stuck below 0.6790.
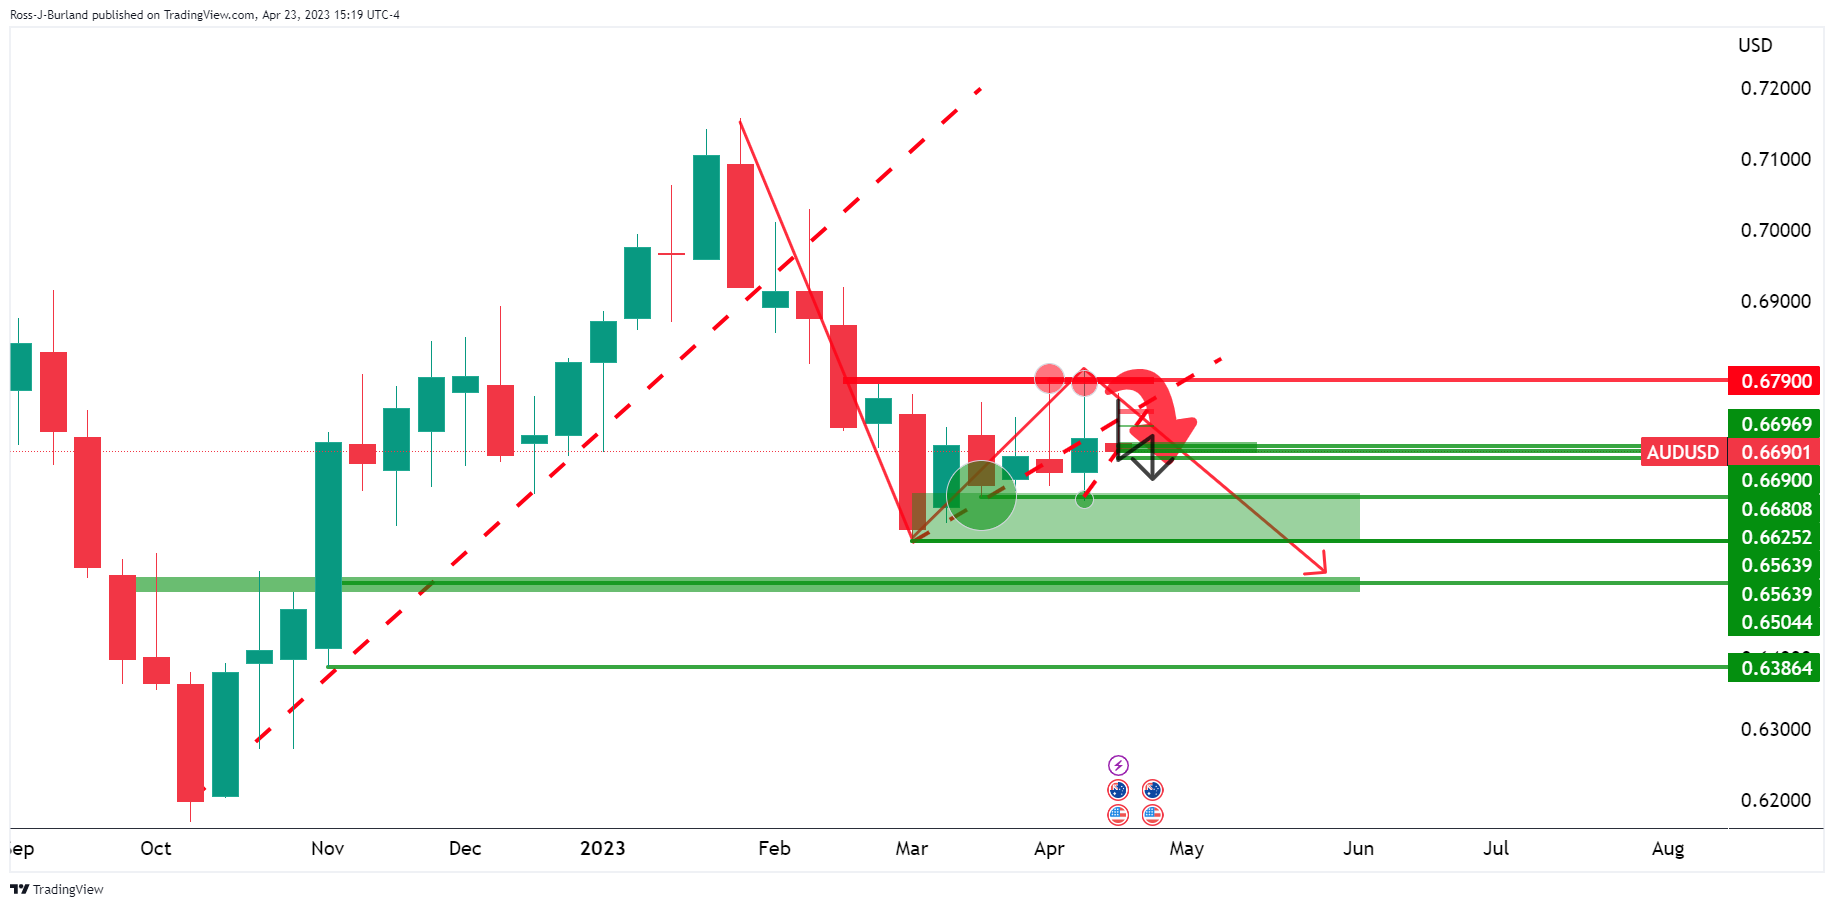
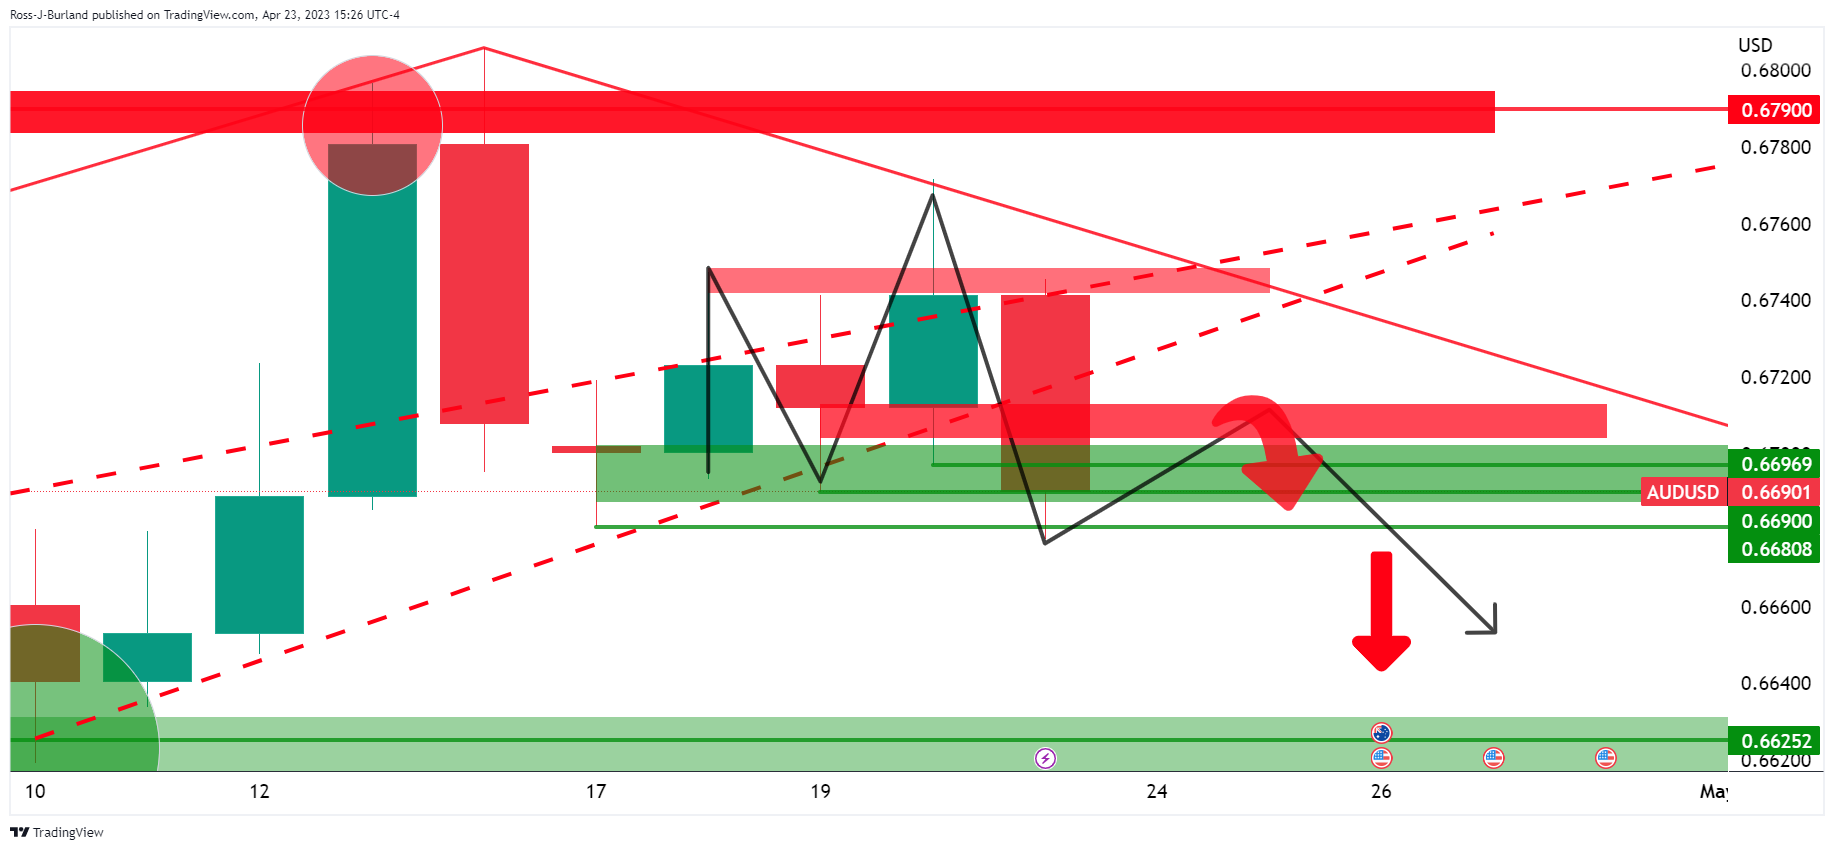
AUD/USD daily charts
The M-formation on the daily chart may act as the peak formation in the correction and lead to a move lower to break the structure on the downside.
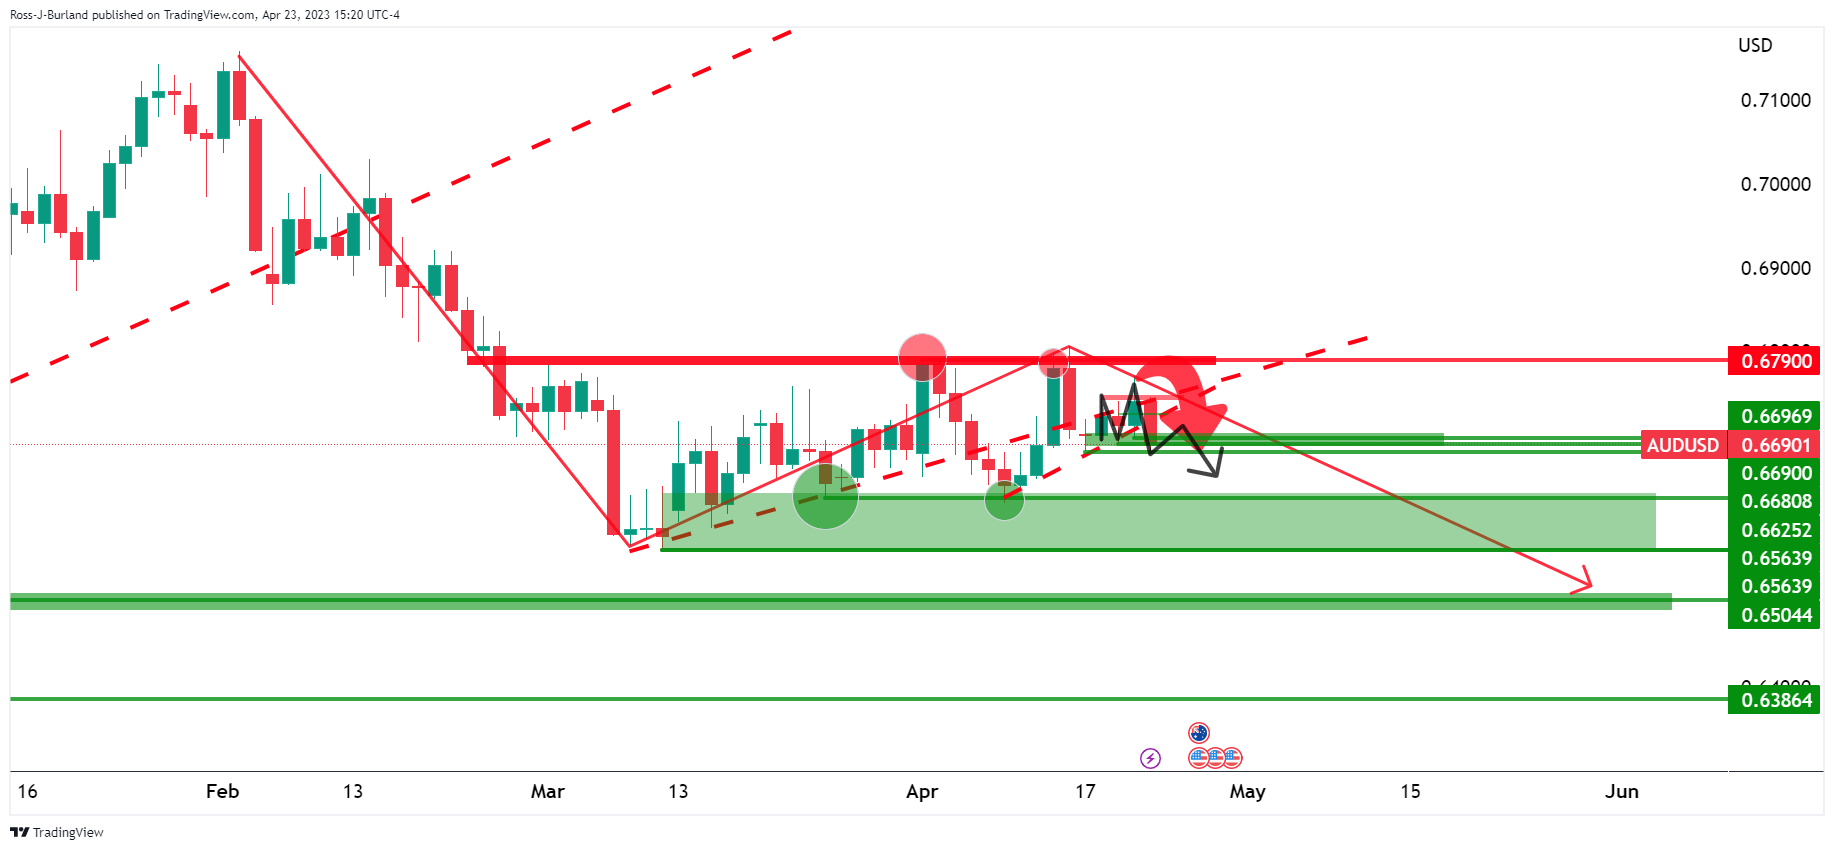
AUD/USD H4 chart
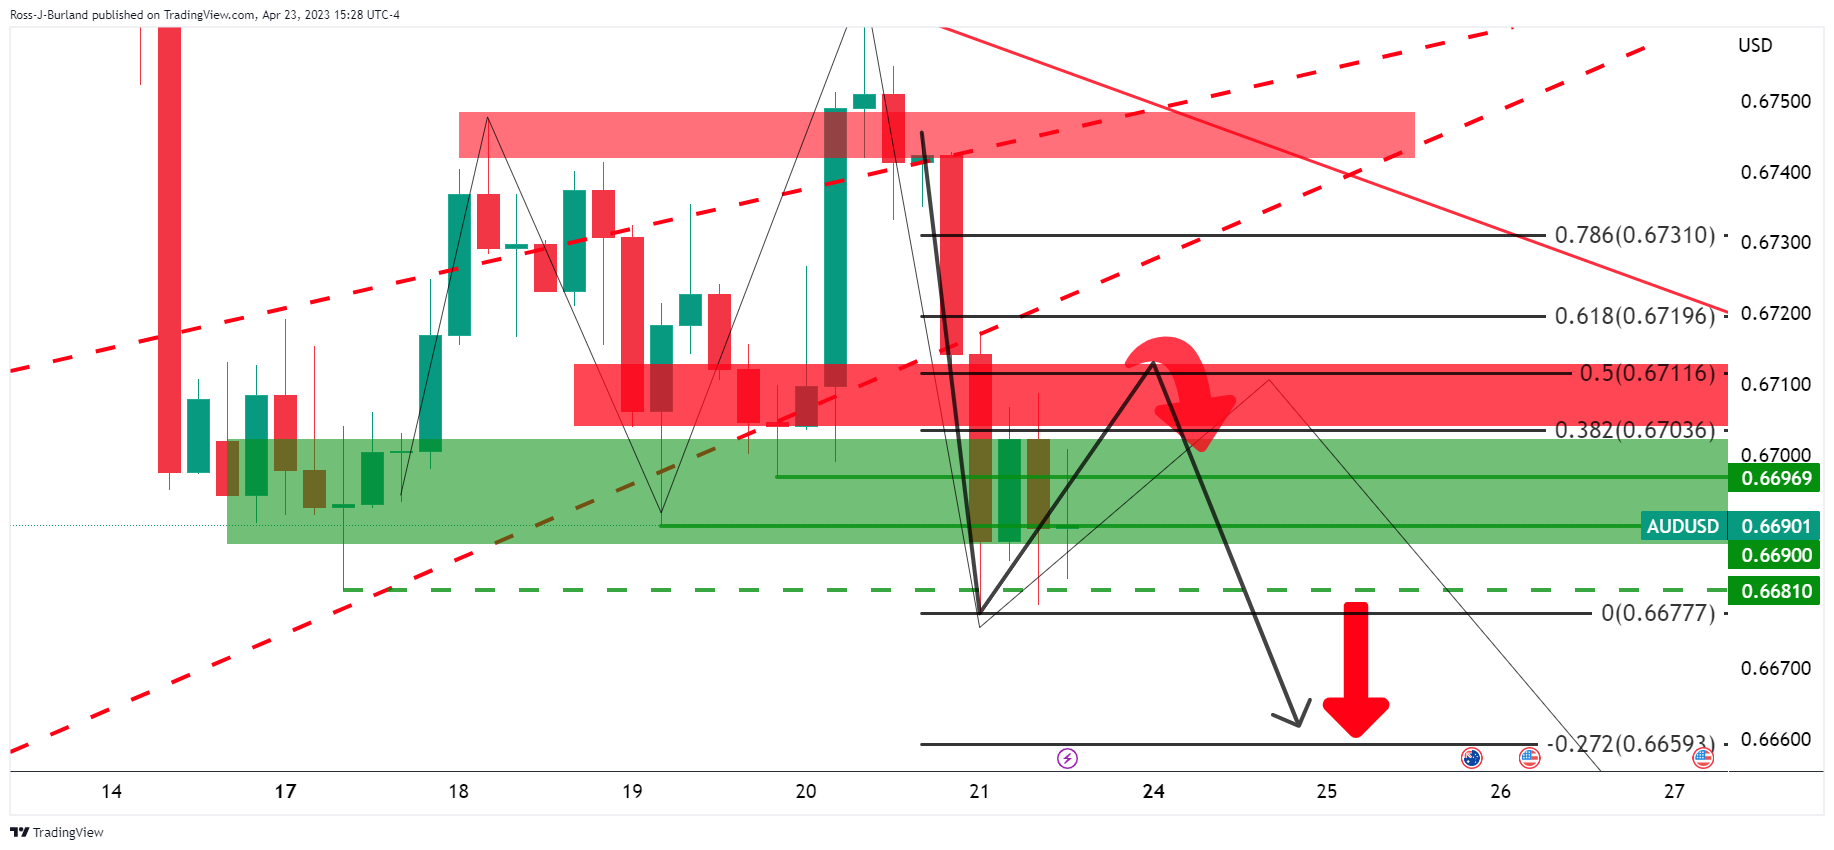
The four-hour chart´s 50% mean reversion level near 0.6710 aligns with the neckline of the pattern that could continue to act as resistance.
-