Notícias do Mercado
-
23:36
Commodities. Daily history for October 01’ 2018:
Raw materials
Closing price
% change
Oil
$75.47
+3.03%
Gold
$1,192.60
+0.44%
-
23:33
Stocks. Daily history for October 01’ 2018:
Index
Change items
Closing price
% change
Nikkei
+125.72
24245.76
+0.52%
ASX 200
-35.30
6172.30
-0.57%
KOSPI
-4.19
2338.88
-0.18%
NZ50
-23.79
9327.27
-0.25%
FTSE 100
-14.53
7495.67
-0.19%
DAX
+92.30
12339.03
+0.75%
CAC 40
+13.33
5506.82
+0.24%
DJIA
+192.90
26651.21
+0.73%
S&P 500
+10.61
2924.59
+0.36%
NASDAQ
-9.05
8037.30
-0.11%
-
23:32
Currencies. Daily history for October 01’ 2018:
Pare
Closed
% change
EUR/USD
$1,1574
-0,25%
GBP/USD
$1,3035
+0,06%
USD/CHF
Chf0,98345
+0,17%
USD/JPY
Y113,99
+0,27%
EUR/JPY
Y131,93
+0,02%
GBP/JPY
Y148,599
+0,33%
AUD/USD
$0,7221
+0,05%
NZD/USD
$0,6594
-0,32%
USD/CAD
C$1,2816
-0,75%
-
23:03
-
22:00
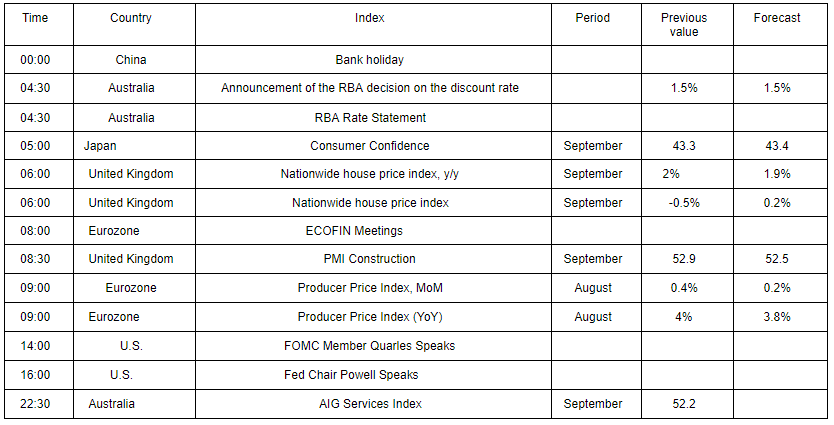
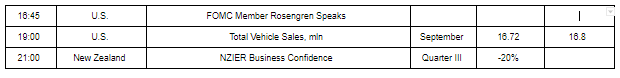
New Zealand: NZIER Business Confidence, Quarter III -30%
-
21:14
The main US stock indexes mostly rose as a result of today's trading
The main US stock indexes finished trading mostly in the black on the back of rising prices for technology sector shares and industrial companies, as the latest deal to save the North American Free Trade Agreement (NAFTA) increased hopes for progress in US negotiations with other countries at the beginning of the fourth quarter.
The focus of investors' attention was also data on the United States. The report, published by the Institute for Supply Management (ISM), showed that in September, activity in the US manufacturing sector weakened more than economists had expected. The PMI index for the manufacturing sector fell in September to 59.8 points from 61.3 points in August. Analysts had expected that the figure would drop to 60.3 points. In addition, the report showed: the price index fell to 66.9 from 72.1 in August, the employment index rose to 58.8 from 58.5, the index of new orders fell to 61.8 from 65.1, and the stock index fell to 53.3 s, 55.4.
Oil futures rose by about 3% on Monday, the reason for which was concern over the reduction of supplies, as soon as US sanctions against Iran take effect next month.
Most of the components of DOW finished trading in positive territory (23 out of 30). The leader of growth was the shares of The Boeing Company (BA, + 2.74%). Outsider were shares of Intel Corporation (INTC, -1.88%).
Most S & P sectors recorded a decline. The utilities sector showed the greatest decrease (-0.4%). The commodities sector grew most (+ 1.3%).
At closing:
Dow 26,651.21 +192.90 +0.73%
S & P 500 2,924.59 +10.61 +0.36%
Nasdaq 100 8,037.30 -9.05 -0.11%
-
20:00
DJIA +0.78% 26,664.79 +206.48 Nasdaq +0.02% 8,047.74 +1.39 S&P +0.45% 2,927.14 +13.16
-
17:00
European stocks closed: FTSE 100 -14.53 7495.67 -0.19% DAX +92.30 12339.03 +0.75% CAC 40 +13.33 5506.82 +0.24%
-
16:04
Prev Story Italian Dep. PM Di Maio: Some EU Institutions Are Creating Market ‘Terrorism’ With Their Comments On Italy Budget @LiveSquawk
-
15:04
The September U.S ISM manufacturing registered 59.8 percent, a decrease of 1.5 percentage points from the August reading
The September PMI registered 59.8 percent, a decrease of 1.5 percentage points from the August reading of 61.3 percent. The New Orders Index registered 61.8 percent, a decrease of 3.3 percentage points from the August reading of 65.1 percent. The Production Index registered 63.9 percent, a 0.6 percentage point increase compared to the August reading of 63.3 percent. The Employment Index registered 58.8 percent, an increase of 0.3 percentage point from the August reading of 58.5 percent.
"Comments from the panel reflect continued expanding business strength. Demand remains strong, with the New Orders Index at 60 percent or above for the 17th straight month, and the Customers' Inventories Index remaining low. The Backlog of Orders Index continued to expand, but at lower levels compared to the previous month. Consumption improved, with production and employment continuing to expand, at higher levels compared to August, despite shortages in labor and materials. Inputs - expressed as supplier deliveries (decreased), inventories and imports - improved compared to the previous month's activity".
-
15:00
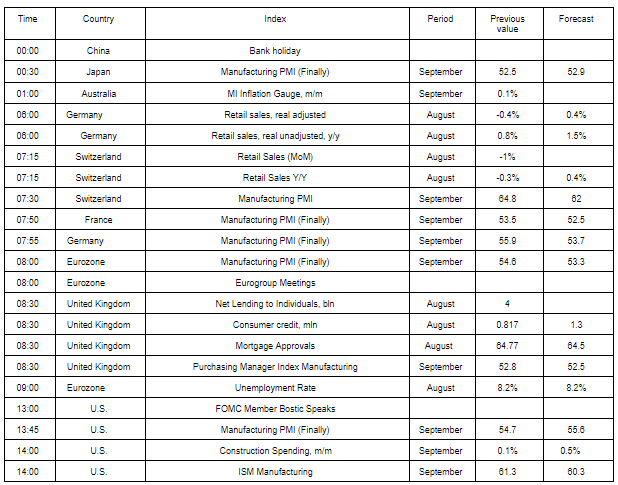
U.S.: ISM Manufacturing, September 59.8 (forecast 60.3)
-
15:00
U.S.: Construction Spending, m/m, August 0.1% (forecast 0.5%)
-
14:45
U.S.: Manufacturing PMI, September 55.6 (forecast 55.6)
-
14:33
U.S. Stocks open: Dow +0.71%, Nasdaq +0.49%, S&P +0.54%
-
14:22
Before the bell: S&P futures +0.48%, NASDAQ futures +0.56%
U.S. stock-index futures rose on Monday, supported by reports the U.S. and Canada reached a trade deal.
Global Stocks:
Index/commodity
Last
Today's Change, points
Today's Change, %
Nikkei
24,245.76
+125.72
+0.52%
Hang Seng
-
-
-
Shanghai
-
-
-
S&P/ASX
6,172.30
-35.30
-0.57%
FTSE
7,523.58
+13.38
+0.18%
CAC
5,512.25
+18.76
+0.34%
DAX
12,330.09
+83.36
+0.68%
Crude
$73.35
+0.14%
Gold
$1,194.80
-0.12%
-
13:47
Wall Street. Stocks before the bell
(company / ticker / price / change ($/%) / volume)
ALCOA INC.
AA
40.88
0.48(1.19%)
5150
Amazon.com Inc., NASDAQ
AMZN
2,022.59
19.59(0.98%)
60852
AMERICAN INTERNATIONAL GROUP
AIG
53.5
0.26(0.49%)
200
Apple Inc.
AAPL
227.65
1.91(0.85%)
257163
AT&T Inc
T
33.79
0.21(0.63%)
45706
Barrick Gold Corporation, NYSE
ABX
11.05
-0.03(-0.27%)
25086
Boeing Co
BA
375.39
3.49(0.94%)
15280
Caterpillar Inc
CAT
154.03
1.54(1.01%)
14866
Chevron Corp
CVX
122.95
0.67(0.55%)
623
Cisco Systems Inc
CSCO
49
0.35(0.72%)
10780
Citigroup Inc., NYSE
C
72.53
0.79(1.10%)
19306
Deere & Company, NYSE
DE
151.08
0.75(0.50%)
287
Exxon Mobil Corp
XOM
85.5
0.48(0.56%)
2438
Facebook, Inc.
FB
163.99
-0.47(-0.29%)
169167
FedEx Corporation, NYSE
FDX
242
1.21(0.50%)
631
Ford Motor Co.
F
9.41
0.16(1.73%)
419055
Freeport-McMoRan Copper & Gold Inc., NYSE
FCX
13.85
-0.07(-0.50%)
30575
General Electric Co
GE
13
1.71(15.15%)
29342563
General Motors Company, NYSE
GM
34.4
0.73(2.17%)
41196
Goldman Sachs
GS
226.25
2.01(0.90%)
10856
Hewlett-Packard Co.
HPQ
25.9
0.13(0.50%)
549
Home Depot Inc
HD
208.23
1.08(0.52%)
930
Intel Corp
INTC
46.46
-0.83(-1.76%)
244175
International Business Machines Co...
IBM
152.33
1.12(0.74%)
2271
International Paper Company
IP
49.98
0.83(1.69%)
1430
JPMorgan Chase and Co
JPM
113.65
0.81(0.72%)
28612
McDonald's Corp
MCD
167.54
0.25(0.15%)
546
Merck & Co Inc
MRK
71.24
0.30(0.42%)
846
Microsoft Corp
MSFT
115.13
0.76(0.66%)
47942
Nike
NKE
85.24
0.52(0.61%)
4574
Pfizer Inc
PFE
44.24
0.17(0.39%)
7667
Procter & Gamble Co
PG
83.54
0.31(0.37%)
2666
Starbucks Corporation, NASDAQ
SBUX
57
0.16(0.28%)
1307
Tesla Motors, Inc., NASDAQ
TSLA
305.92
41.15(15.54%)
1801131
The Coca-Cola Co
KO
46.28
0.09(0.19%)
384
Twitter, Inc., NYSE
TWTR
28.6
0.14(0.49%)
57280
Verizon Communications Inc
VZ
53.62
0.23(0.43%)
2981
Visa
V
151.4
1.31(0.87%)
17092
Wal-Mart Stores Inc
WMT
94.26
0.35(0.37%)
5109
Walt Disney Co
DIS
117.6
0.66(0.56%)
5779
-
13:44
U.K. said to plan compromise on Irish border to get Brexit deal From. GBP/USD rally 100 pips so far
-
13:37
Downgrades before the market open
Intel (INTC) downgraded to Underweight from Equal-Weight at Morgan Stanley
-
12:56
Erdogan says U.S. Pastor Brunson has dark ties to terror groups @zerohedge
-
12:01
UK Brexit Sec Raab: We Need Unity Of Purpose Fore Brexit Talks @LiveSquawk
-
10:55
UK household borrowing growth moderated slightly in August
-
Household borrowing growth moderated slightly in August. Annual consumer credit growth slowed to 8.1%, while secured lending growth ticked down to 3.1%.
-
The number of approvals for remortgaging, which has been volatile in recent months, increased to 53,125 in August.
-
Net finance raised by private non-financial corporations (PNFCs) remained positive in August. Within this, net bank lending to businesses was positive, whilst finance raised through financial markets was negative.
The net amount of new consumer borrowing, excluding mortgages, increased slightly to £1.1 billion in August, up from £0.8 billion in July. Despite this increase, lending remains a bit lower compared to much of the past two years. This weakness reflects subdued net lending for other loans and advances (which includes personal loans, overdrafts and car finance), which increased slightly to £0.7 billion from £0.6 billion in July. Net credit card lending increased to £0.5 billion on the month, in line with the average of the previous 6 months.
-
-
10:17
The euro area (EA19) seasonally-adjusted unemployment rate was 8.1% in August 2018, down from 8.2% in July
The euro area (EA19) seasonally-adjusted unemployment rate was 8.1% in August 2018, down from 8.2% in July 2018 and from 9.0% in August 2017. This is the lowest rate recorded in the euro area since November 2008. The EU28 unemployment rate was 6.8% in August 2018, stable compared with July 2018 and down from 7.5% in August 2017. This remains the lowest rate recorded in the EU28 since April 2008.
Eurostat estimates that 16.657 million men and women in the EU28, of whom 13.220 million in the euro area, were unemployed in August 2018. Compared with July 2018, the number of persons unemployed decreased by 114 000 in the EU28 and by 102 000 in the euro area. Compared with August 2017, unemployment fell by 1.921 million in the EU28 and by 1.419 million in the euro area.
-
10:00
Eurozone: Unemployment Rate , August 8.1% (forecast 8.2%)
-
09:42
The end of the third quarter saw a mild improvement in the performance of the UK manufacturing sector
Rates of expansion in output and new orders gained traction, while the trend in new export business saw a modest recovery following August's solid contraction. On the price front, rates of input cost and output charge inflation both strengthened.
The seasonally adjusted IHS Markit/CIPS Purchasing Managers' Index posted 53.8 in September, following an upwardly revised figure of 53.0 in August (originally published as 52.8). The PMI has remained above the neutral 50.0 mark for 26 months.
-
09:31
United Kingdom: Net Lending to Individuals, bln, August 4
-
09:30
United Kingdom: Purchasing Manager Index Manufacturing , September 53.8 (forecast 52.5)
-
09:30
United Kingdom: Mortgage Approvals, August 66.44 (forecast 64.5)
-
09:30
United Kingdom: Consumer credit, mln, August 1.118 (forecast 1.3)
-
09:15
Euro zone manufacturing PMI in line with expectations in September
September's survey of eurozone manufacturers indicated a further improvement in operating conditions, extending the current period of expansion to 63 months. Growth was the weakest since September 2016, however, in line with the downward trend seen since the start of the year. This was reflected by the IHS Markit Eurozone Manufacturing PMI, which slipped to 53.2, broadly unchanged on the earlier flash reading of 53.3 and down from August's 54.6.
Commenting on the final Manufacturing PMI data, Chris Williamson, Chief Business Economist at IHS Markit said: "Eurozone manufacturing shifted down yet another gear at the end of the third quarter. The sector has seen booming growth at the start of the year rapidly fade to the worst performance for two years in September as production and jobs growth have slowed in response to a stalling of export trade. "The survey paints the worst trade picture for over five years, with export growth having slumped sharply from a series record high in late 2017 to near-stagnation in September.
-
09:08
Growth of Germany's manufacturing sector slowed in September, subdued by the steepest drop in new export orders in over five years
Growth of Germany's manufacturing sector slowed in September, subdued by the steepest drop in new export orders in over five years, the latest PMI survey data from IHS Markit showed. Production levels exhibited their smallest gain since April 2016, while business confidence towards the year-ahead outlook for output was the gloomiest for over three years.
September saw the headline IHS Markit/BME Germany Manufacturing PMI - a single-figure snapshot of the performance of the manufacturing economy - sink to a 25-month low of 53.7 from 55.9 in August. The fall in the index reflected slower growth in output, new orders and employment, as well as a reduction in the incidence of supplier delivery delays. The only positive directional influence was from stocks of purchases, which showed a marginal rebound following a slight drop in August.
-
09:00
Eurozone: Manufacturing PMI, September 53.2 (forecast 53.3)
-
08:56
Germany: Manufacturing PMI, September 53.7 (forecast 53.7)
-
08:55
September data points to another disappointing month for the French manufacturing sector - Markit
At 52.5 in September, down from 53.5 in August, the seasonally adjusted final IHS Markit France Manufacturing Purchasing Managers' Index (PMI) signalled a slower improvement in business conditions. The index was unchanged from the earlier 'flash' reading for September and signalled the jointweakest rate of manufacturing growth since February 2017.
Tim Moore, Associate Director at IHS Markit, which compiles the France Manufacturing PMI® survey, said: "September data points to another disappointing month for the French manufacturing sector. Global trade frictions and stretched supply chain capacity were the main headwinds faced by goods producers, which contributed to an unhealthy mix of falling export sales and rising input prices. "Softer demand growth and more subdued business confidence towards the near-term outlook meant that output levels increased at the slowest pace for exactly two years. Survey respondents noted that a soft patch for business conditions in the automotive sector had weighed on growth during September"
-
08:51
France: Manufacturing PMI, September 52.5 (forecast 52.5)
-
08:38
Swiss retail sales rose less than expected on year
Turnover in the retail sector rose by 1.1% in nominal terms in August 2018 compared with the previous year. Seasonally adjusted, nominal turnover rose by 0.3% compared with the previous month. These are the provisional findings from the Federal Statistical Office (FSO).
Real turnover in the retail sector also adjusted for sales days and holidays rose by 0.4% in August 2018 compared with the previous year. Real growth takes inflation into consideration. Compared with the previous month, real, seasonally adjusted retail trade turnover registered an increase of 0.3%.
-
08:35
FTSE -33.53 7476.67 -0.45% DAX +20.55 12267.28 +0.17% CAC -0.57 5492.92 -0.01%
-
08:32
Switzerland: Manufacturing PMI, September 59.7 (forecast 62)
-
08:31
The Spanish manufacturing sector saw growth slow at the end of the third quarter
The Spanish manufacturing sector saw growth slow at the end of the third quarter of 2018, with weaker increases in output, new orders and employment all recorded. This continued the broad trend in recent months of a subdued manufacturing performance. On the price front, the rate of input cost inflation ticked up and remained sharp. Meanwhile, output prices were raised, following the first decline in almost two years in August.
The headline IHS Markit Spain Manufacturing PMI dropped to 51.4 in September, down from 53.0 in August and signalling only a slight monthly improvement in the health of the sector. In fact, the latest strengthening of business conditions was the least marked since August 2016.
-
08:31
Switzerland: Retail Sales (MoM), August 0.3%
-
08:15
Switzerland: Retail Sales Y/Y, August 0.3% (forecast 0.4%)
-
08:09
German retail sales down 0.1% in August
According to provisional results of the Federal Statistical Office (Destatis), the real (price-adjusted) turnover of the retail enterprises in Germany was 1.6% and the nominal (not price-adjusted) turnover 3.3% higher in August 2018 compared with August 2017. The number of sales days was 27 in each of these two months.
-
-0.1% on the previous month (in real terms, calendar and seasonally adjusted, provisional)
-
+0.3% on the previous month (in nominal terms, calendar and seasonally adjusted, provisional)
-
+1.6% on the same month a year earlier (in real terms, provisional)
-
+3.3% on the same month a year earlier (in nominal terms, provisional)
-
-
07:00
Germany: Retail sales, real unadjusted, y/y, August 1.6% (forecast 1.5%)
-
07:00
Germany: Retail sales, real adjusted , August -0.1% (forecast 0.4%)
-
06:46
WTO, IMF, World Bank Seek 'Urgent' International Trade Reforms - Bloomberg
-
06:45
Chinese manufacturers signalled stagnant operating conditions at the end of the third quarter
Chinese manufacturers signalled stagnant operating conditions at the end of the third quarter, following improvements in the prior 15 months. Production growth eased to a marginal pace, while total new work was broadly unchanged from the previous month. New export business fell at the quickest rate since early 2016. At the same time, companies continued to reduce their headcounts, while subdued demand conditions led to more cautious approaches to inventories and buying activity.
The headline seasonally adjusted Purchasing Managers' Index (PMI) - a composite indicator designed to provide a single-figure snapshot of operating conditions in the manufacturing economy - fell from 50.6 in August to the neutral level of 50.0 in September
-
06:44
Japan’s manufacturing economy continued along an expansionary path in September, with output, demand and employment all rising - Markit
That said, production growth dipped to a 14-month low, and although total new business growth accelerated, manufacturers faced a further month of declining export sales. The slower rise in output contributed to a stronger accumulation in backlogs of work, while slower input delivery times also weighed on operating capacities. Looking ahead, firms were upbeat, but the level of positive sentiment was the weakest for nearly two years.
-
06:43
Canada and the U.S. have agreed on a new North American Free Trade Agreement, two Canadian officials said late Sunday, concluding an acrimonious 13-month negotiation
-
06:04
Options levels on monday, October 1, 2018
EUR/USD
Resistance levels (open interest**, contracts)
$1.1767 (3067)
$1.1711 (1729)
$1.1684 (260)
Price at time of writing this review: $1.1594
Support levels (open interest**, contracts):
$1.1543 (3757)
$1.1496 (3256)
$1.1448 (2774)

Comments:
- Overall open interest on the CALL options and PUT options with the expiration date October, 15 is 91048 contracts (according to data from September, 28) with the maximum number of contracts with strike price $1,1600 (5131);
GBP/USD
Resistance levels (open interest**, contracts)
$1.3155 (2662)
$1.3133 (2207)
$1.3099 (722)
Price at time of writing this review: $1.3025
Support levels (open interest**, contracts):
$1.2969 (1650)
$1.2930 (2107)
$1.2909 (405)

Comments:
- Overall open interest on the CALL options with the expiration date October, 15 is 29367 contracts, with the maximum number of contracts with strike price $1,3200 (2954);
- Overall open interest on the PUT options with the expiration date October, 15 is 37914 contracts, with the maximum number of contracts with strike price $1,2900 (2249);
- The ratio of PUT/CALL was 1.29 versus 1.28 from the previous trading day according to data from September, 28.

* - The Chicago Mercantile Exchange bulletin (CME) is used for the calculation.
** - Open interest takes into account the total number of option contracts that are open at the moment.
-
02:04
Australia: MI Inflation Gauge, m/m, September 0.3%
-
01:34
Japan: Manufacturing PMI, September 52.5 (forecast 52.9)
-
00:50
Japan: BoJ Tankan. Non-Manufacturing Index, Quarter III 22 (forecast 22)
-
00:50
Japan: BoJ Tankan. Manufacturing Index, Quarter III 19 (forecast 22)
-
00:27
Commodities. Daily history for September 28' 2018:
Raw materials
Closing price
% change
Oil
$73.47
+0.30%
Gold
$1,194.70
+0.61%
-
00:24
Stocks. Daily history for September 28’ 2018:
Index
Change items
Closing price
% change
Nikkei
+323.30
24120.04
+1.36%
TOPIX
+17.14
1817.25
+0.95%
Hang Seng
+72.85
27788.52
+0.26%
CSI 300
+35.27
3438.86
+1.04%
FTSE 100
-35.24
7510.20
-0.47%
DAX
-188.86
12246.73
-1.52%
CAC 40
-46.92
5493.49
-0.85%
DJIA
+18.38
26458.31
+0.07%
S&P 500
-0.02
2913.98
+0.00%
NASDAQ
+4.39
8046.35
+0.05%
-
00:22
Currencies. Daily history for September 28’ 2018:
Pare
Closed
% change
EUR/USD
$1,1602
-0,31%
GBP/USD
$1,3027
-0,39%
USD/CHF
Chf0,98181
+0,46%
USD/JPY
Y113,68
+0,25%
EUR/JPY
Y131,91
-0,05%
GBP/JPY
Y148,114
-0,13%
AUD/USD
$0,7217
+0,16%
NZD/USD
$0,6616
+0,10%
USD/CAD
C$1,29116
-0,95%
-
00:01
-