Notícias do Mercado
-
23:52
Gold Price Forecast: XAU/USD struggles to cross $1,700, upside seems favored ahead of US NFP
- Gold price is facing less-confident hurdles around $1,700.00 after a vertical rally.
- Downbeat performance from US ISM Manufacturing data has weakened the DXY.
- Lower consensus for labor cost index data is becoming a concern for the DXY.
Gold price (XAU/USD) is hovering around the psychological resistance of $1,700.00 in the early Asian session. The precious metal displayed a juggernaut rally after delivering an upside break of the consolidation formed in a range of $1,660.00-1,675.70 in the past three trading sessions and is now facing pressure around $1,700.00. The yellow metal is expected to spend a little time around the critical resistance and will prepare for a further impulsive wave.
Meanwhile, the US dollar index (DXY) has printed a fresh weekly low at 111.47 and is looking to decline further on sluggish economic fundamentals. Weaker US ISM Manufacturing PMI data and lower consensus for US employment data are responsible for corrective action in the DXY. The US ISM Manufacturing PMI declined to 50.9 vs. the expectations of 52.2 and the prior release of 52.8.
This week, the release of the US NFP data will keep the DXY on the tenterhooks. The US NFP is seen lower at 250k vs. the prior release of 315k. While the Unemployment Rate is seen stabilizing at 3.7%. Apart from that, investors will keenly focus on the Average Hourly Earnings data. As price pressures have not shifted significantly to the lower side, the earnings data holds meaningful importance. The labor cost index is seen lower by 10 basis points (bps) to 5.1% on an annual basis.
Gold technical analysis
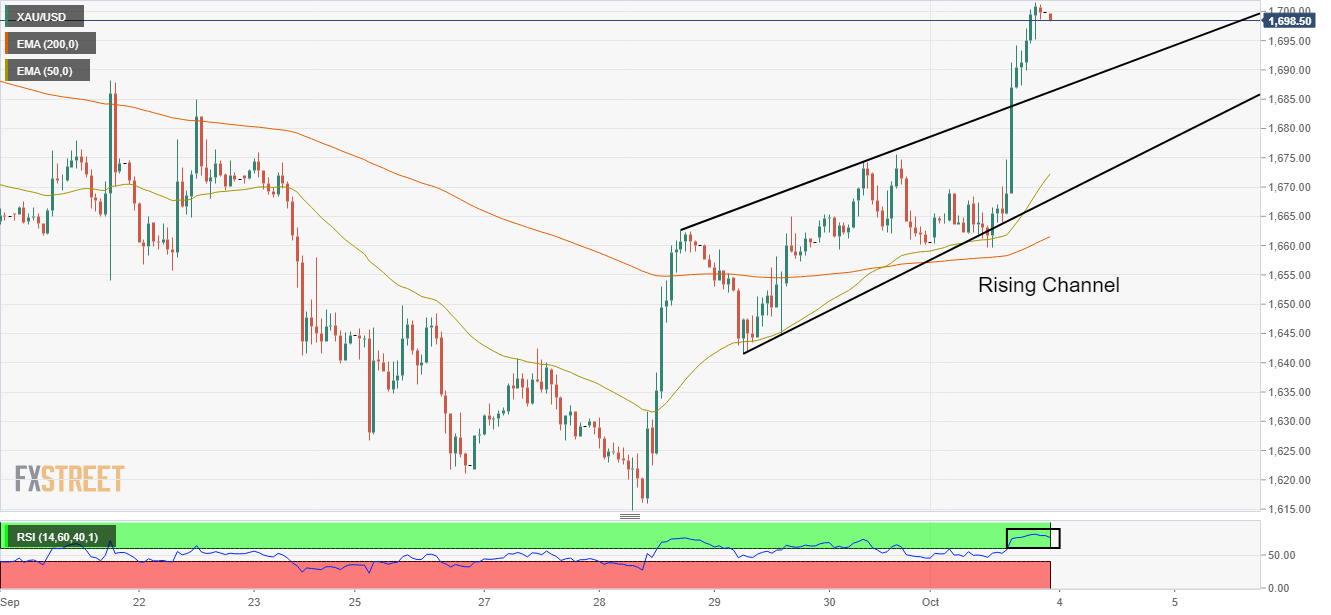
Gold prices have witnessed a juggernaut rally after an upside break of the Rising Channel chart pattern on an hourly scale. An upside break of the above-mentioned chart pattern plotted from Wednesday’s high at $1,662.80 and Thursday’s low at $1,641.59 displays the sheer confidence of bulls.
A formation of a golden cross, represented by the 50-and 200-period Exponential Moving Averages (EMAs) at $1,656.50 is indicating more upside ahead.
Also, the Relative Strength Index (RSI) (14) is oscillating in a bullish range of 60.00-80.00, which advocates the continuation of upside momentum.
Gold hourly chart
-
23:26
USD/CHF Price Analysis: Double bottom in the hourly chart, targets 0.9970s
- The USD/CHF reclaims 0.9900, as a double bottom chart pattern, targets 0.9974.
- Short term, the USD/CHF is neutral-to-downward biased, but it could reach the double bottom target before retracing towards the 20-EMA at 0.9899.
The USD/CHF is slightly down as the Asian Pacific session begins, though in the week it is gaining some 0.49%, after hitting a weekly high in the mid-0.99-1.00 range, due to improvement in sentiment; however, it retraced some to the current spot prices. At the time of writing, the USD/CHF is trading at 0.9922, down 0.01%.
USD/CHF Price Analysis: Technical outlook
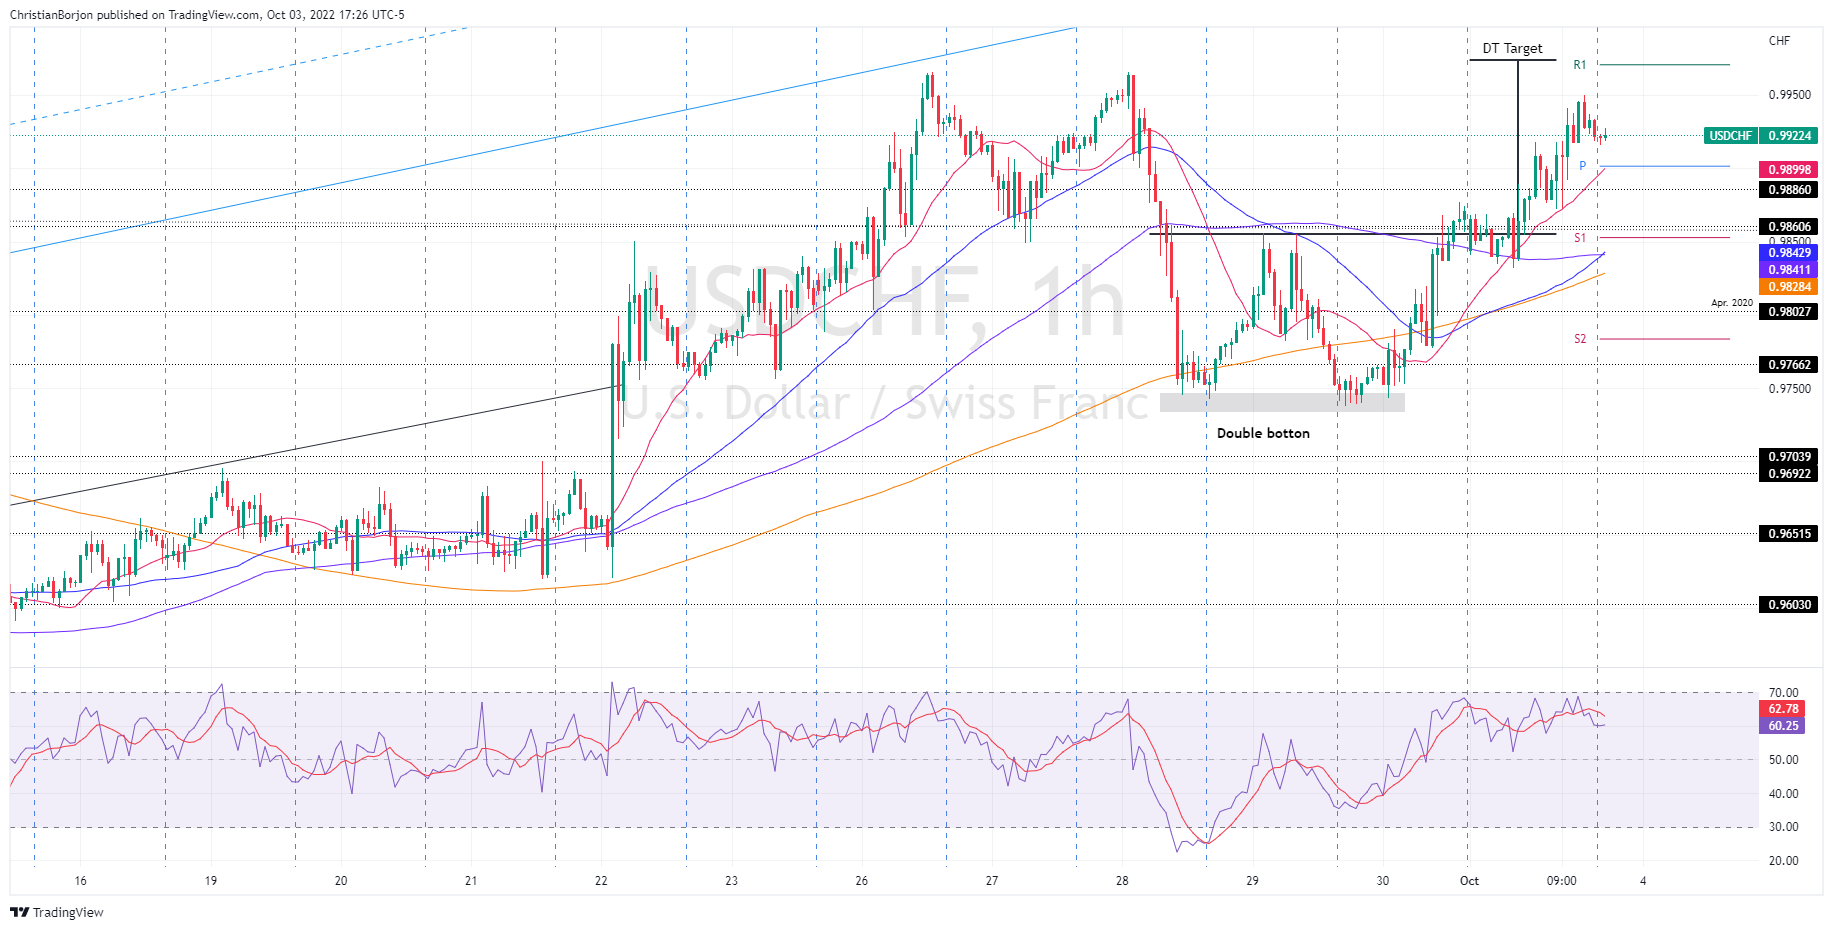
From a daily chart perspective, the USD/CHF remains upward biased, though it failed to break above the September monthly high of 0.9966. It should be noted that the major has printed a higher low, but to continue its uptrend, it would need to clear September’s high to open the door for a parity re-test.
Since September 28, the USD/CHF bottomed around the 0.9740 area, forming a double bottom chart pattern. During Monday’s session, the USD/CHF decisively cleared the September 29 daily high at 0.9855, validating the pattern, which targets a rally towards 0.9974.
Therefore, the USD/CHF first resistance would be the October 3 high at 0.9966. Once cleared, the next resistance would be the double bottom target, at 0.9974, followed by the parity.
USD/CHF Key Technical Levels
-
23:05
EUR/USD gyrates in a 0.9750-0.9850 range as focus shifts to US NFP data
- EUR/USD is going through a tad wider range bound moves in a 100-pips territory ahead of US NFP data.
- A downbeat US ISM Manufacturing PMI data has weakened the DXY.
- Eurozone bulls are awaiting the release of the German Retail Sales data.
The EUR/USD pair is witnessing topsy-turvy moves in a wider range of 0.9750-0.9850 from the past two trading sessions. The asset has turned sideways as investors are preparing for the release of the mega event of US Nonfarm Payrolls (NFP) data this week. The major is displaying a balanced auction profile and is expected to convert into an imbalanced bullish move sooner.
On Monday, the US dollar index (DXY) witnessed an intense sell-off as a pullback move to near 112.50 was capitalized by the market participants as a selling opportunity. The DXY printed a fresh weekly low at 111.47 after the release of downbeat US ISM Manufacturing data.
The economic PMI data declined to 50.9 vs. the expectations of 52.2 and the prior release of 52.8. As interest rates are escalating by the Federal Reserve (Fed), the extent of manufacturing activities is declining. Also, corporate have postponed their expansion plans too. Apart from that, weaker New Orders Index data has also plunged. The economic indicator that reflects forward demand for manufacturing activities slipped to 47.1 against the projections of 49.6 and the former figure of 51.3.
Going forward, the release of the US employment data will be of utmost importance. The US NFP is seen lower at 250k vs. the prior release of 315k. While the Unemployment Rate is seen stabilizing at 3.7%.
On the Eurozone front, the Eurozone Retail Sales data will be of utmost importance. The economic data is expected to decline by 1.7% against a decline of 0.9% reported earlier. In times, when the inflation rate is mounting firmly, a decline in Retail Sales is a cause of worry.
-
22:55
New Zealand NZIER Business Confidence (QoQ) increased to -42% in 3Q from previous -65%
-
22:30
Australia AiG Performance of Mfg Index increased to 50.2 in September from previous 49.3
-
22:28
AUD/USD bulls move in on a key resistance ahead of RBA
- AUD/USD bulls ta,e the lead ahead of the RBA today.
- The US dollar is soft on the back of lower US yields and poor US data.
AUD/USD rallied on Monday on the back of a softer US dollar and yields. The greenback fell within demand while the 10-year yield slipped to test critical support levels on the downside. AUD/USD is trading some 1.8% higher into early Asian markets following a rise from 0.6399 to 0.6522 the high and is recovering slightly from an over 2-year closing low ahead of the main domestic event for the week in the Reserve Bank of Australia interest meeting.
The RBA is expected to raise the cash rate by 50 basis points to combat inflation but the Aussie could come under pressure should there be any dovish hints given that policymakers said last time around that the central bank was looking for opportunities to slow the pace of rate hikes at some point. The latest inflation data showed that consumer prices in Australia eased to 6.8% in August from a record high of 7% in July on a year-to-date basis. The RBA has already hiked the cash rate by an aggregate of 225 basis points to a seven-year high of 2.35%.
Meanwhile, the US dollar was softer by 0.4% and stocks on Wall Street ended sharply higher on Monday. The Dow finished +2.7%, the S&P 500 closed +2.6% and the Nasdaq Composite ended +2.3%. The 10-year Treasury yield fell 14 basis points to 3.66% and at one point dropped by 20 basis points. The 2-year yield declined 9 basis points to 4.12%.
In economic data, ISM manufacturing index data, which provides a gauge for manufacturing activity in the US, came in lower than expected. The ISM reported a figure of 50.9 for September, lower than the forecasted 52.2.
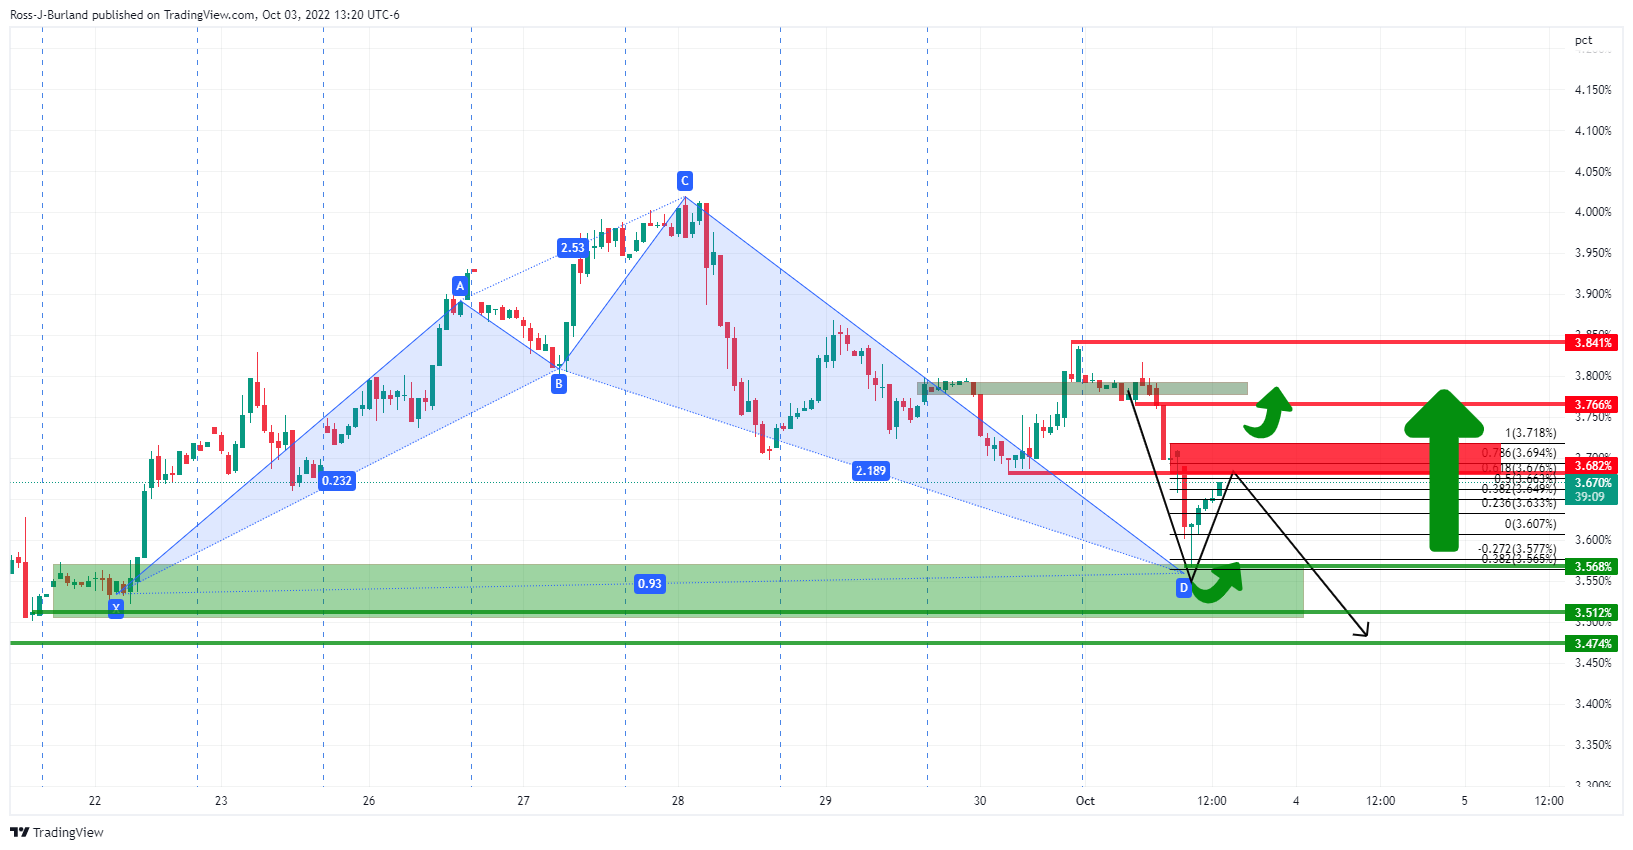
AUD/USD and DXY technical analysis
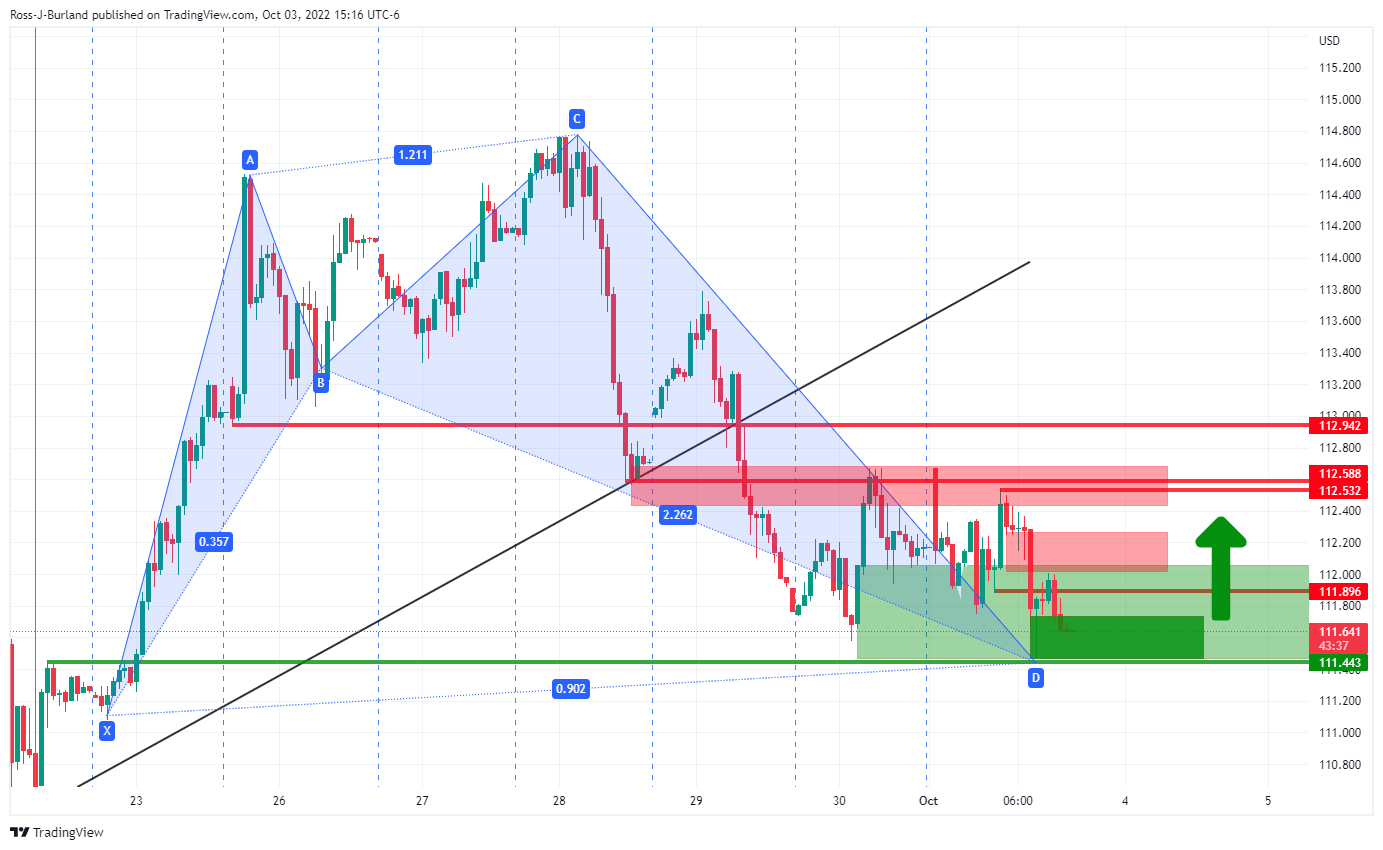
The dollar is offered to a key support level but the bullish harmonic shark pattern could see the price move in again on the 112 area imminently. This would be the basis for a bearish thesis on AUD/USD that is testing resistance currently:
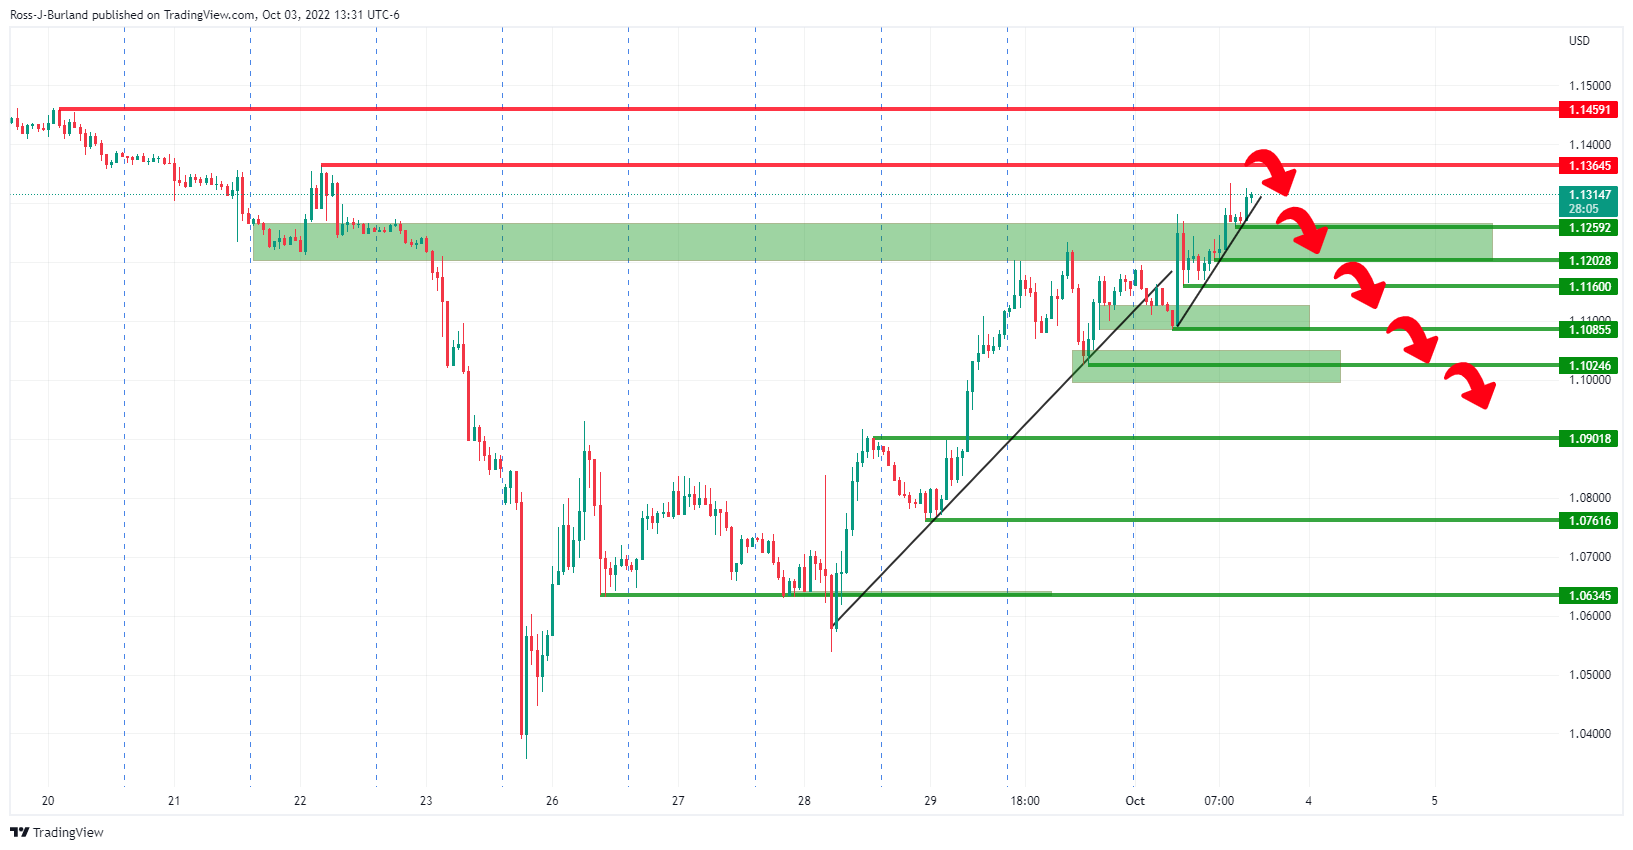
However, should the bulls get above resistance, there will be a case for a bullish W-formation, as per the daily chart above.
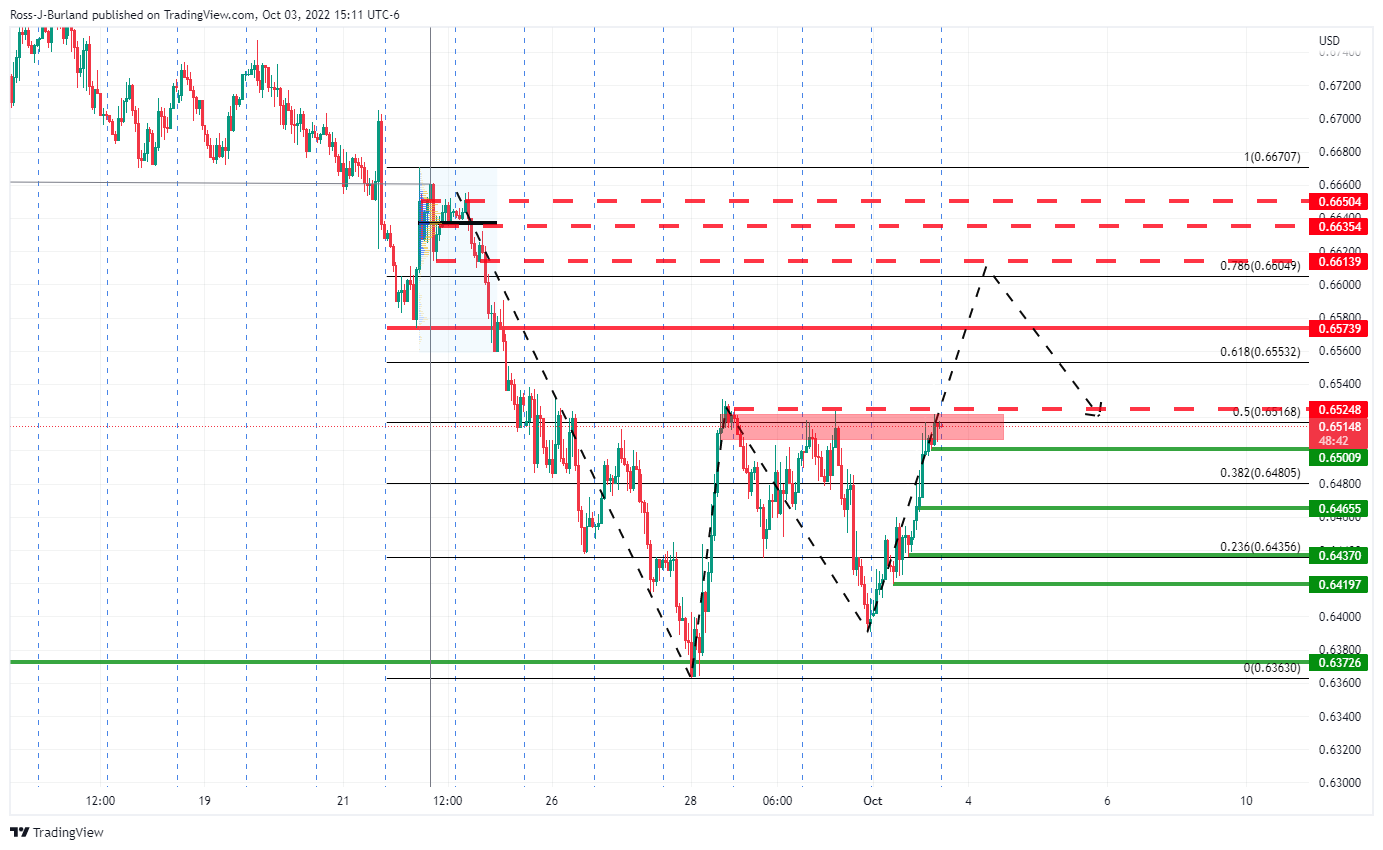
The hourly chart's bullish scenario levels to watch are in red, and bearish in green.
-
22:06
Brazil Trade Balance registered at 3.99B, below expectations (4.75B) in September
-
21:48
NZD/USD reclaims 0.5700 after hitting a weekly low below 0.5600
- NZD/USD is gaining ground, up by more than 2% amid a soft US dollar.
- The US ISM Manufacturing PMI was weaker-than-expected, flashing signs that demand is slowing.
- NZD/USD traders are eyeing the NZIER Report, alongside US Durable Goods, JOLTs Openings, ahead of Friday’s US NFP.
The New Zealand dollar erases trims some of the last Friday’s losses, reclaiming the 0.6700 figure on a risk-on impulse. Measures of US economic activity in the US weakening, and some readings showing that inflation in the manufacturing sector is easing, is perceived by market players as a reason for the Fed to slow its pace of tightening. Hence, the NZD/USD is trading at 0.5720, above its opening price by 2.25%.
On Monday, the NZD/USD began trading around 0.5600 and climbed towards its daily high at 0.5731, late in the European session.
The Institute for Supply Management (ISM) revealed that Manufacturing PMI expanded at its slowest rhythm in two years, with September PMI decelerating to 50.9 from 52.8 in August. In the same report, new orders declined to 47.1 from 51, flashing that demand is softening, while prices retreated for the six-consecutive month.
Elsewhere, the US Dollar Index, a gauge of the buck’s value vs. a basket of peers, continued dropping as I type, is losing 0.45%, down at 111.671. Furthermore, US Treasury bond yields moved lower, following the release of weaker-than-expected ISM Manufacturing readings, alongside the U-turn in the UK’s 45% tax cuts budget.
Aside from this, the New Zealand calendar on Monday was absent. Still, it will report the NZIER Quarterly Survey of Business Opinion on Tuesday, which will be revealed at around 21:00 GMT.
What to watch
Nearby New Zealand, the Reserve Bank of Australia (RBA) is expected to hike rates by 50 bps late this Tuesday. On the United States front, the calendar will reveal Durable Good Orders alongside JOLTs Jobs Openings on Tuesday, ahead of September’s Nonfarm Payrolls report, announced on Friday.
NZD/USD Key Technical Levels
-
21:34
Fed's Williams: Fed still has a way to go, cites 4.6% median `23 dot
New York Fed President John C. Williams has been speaking on Monday at the 2022 U.S. Hispanic Chamber of Commerce National Conference.
He said in more recent trade that the Fed still has a way to go, cites 4.6% median `23 dot.
In earlier comments, Williams pointed to three layers of inflation, comparing it to an onion. "The outer layer consist of prices of globally traded commodities such as lumber, steel, grains, and oil."
Prices soared as demand rebounded from the pandemic. Russia's war in Ukraine also added to the pressure, he said.
Market update
Meanwhile, the US dollar was softer by 0.4% and stocks on Wall Street ended sharply higher on Monday. The Dow finished +2.7%, the S&P 500 closed +2.6% and the Nasdaq Composite ended +2.3%.
The 10-year Treasury yield fell 14 basis points to 3.66% and at one point dropped by 20 basis points. The 2-year yield declined 9 basis points to 4.12%.
ISM manufacturing index data, which provides a gauge for manufacturing activity in the US, came in lower than expected. The ISM reported a figure of 50.9 for September, lower than the forecasted 52.2.
-
20:38
Forex Today: Markets start the week with optimism
What you need to take care of on Tuesday, October 4:
The greenback resumed its decline at the beginning of the week, ending Monday with losses across the FX board. The EUR/USD pair was able to post a modest advance and settled around 0.9820, with the shared currency among the worst performers against the USD. Downwardly revised S&P Global Manufacturing PMIs weighed on the EUR.
Financial markets traded with optimism, despite persistent recession concerns. Political and financial turmoil in the United Kingdom keeps triggering volatile market reactions and leading the way. The UK government came up with a potential tax cut of a 45% rate on income, but British Finance Minister Kwasi Kwarteng later said they were dropping the idea. The announcement underpinned GBP/USD, which ended the day near an intraday high of 1.1333. Following UK news, European indexes reverted early losses and settled in the green.
The greenback tried to advance ahead of the US opening, but tepid local data put it back on the bearish path. The ISM Manufacturing PMI contracted to 50.9 in September, barely holding in expansion territory.
Wall Street picked up where European indexes left and posted a substantial advance, further undermining demand for the USD. US Treasury yields retreated, with the yield on the 10-year Treasury note down roughly 15 bps.
The AUD/USD pair regained the 0.6500 threshold ahead of the Reserve Bank of Australia monetary policy decision. USD/CAD settle near its intraday low at around 1.3630.
Finally, the dollar posted uneven advances against its safe-haven rivals, with USD/CHF now trading at 0.9930 and USD/JPY at 144.75.
Gold soared and flirts with $1,700 a troy ounce, while crude oil prices also advanced. WTI is currently trading at around $83.50 a barrel.
Government bond yields were sharply lower but moved off their intraday lows ahead of the close.
Dogecoin’s 4-month long consolidation set to drive investors away unless DOGE reclaims this level
Like this article? Help us with some feedback by answering this survey:
Rate this content -
20:34
GBP/USD Price Analysis: Bulls take out key longer term levels, but bears are lurking
- GBP/USD has rallied through critical daily and weekly resistance.
- Bears, however, could be lurking with a focus on 1.1200/60 which guards the risk of a significant cascade of offers below targeting 1.1100 and 1.1020.
GBP/USD is rallying and defying gravity as the US dollar runs into bears with the US yields softening at the start of the week. The following illustrates the current trajectory across the three mentioned assets and the potential for a downside correction in the coming sessions or days in cable.
DXY & US 10-year yields
The 10-year US treasury yield has slumped into a key area of support leaving a bullish harmonic shark pattern on the hourly time frame. The price has subsequently moved up to test an old support area that could act as resistance for the sessions ahead. However, if this area were to break, then that would be supportive of an otherwise softer US dollar and be expected to weigh on cable.
DXY H1:
GBP/USD technical analysis
The weekly and daily charts, above and below respectively, have seen a significant correction along the Fibonacci scales.
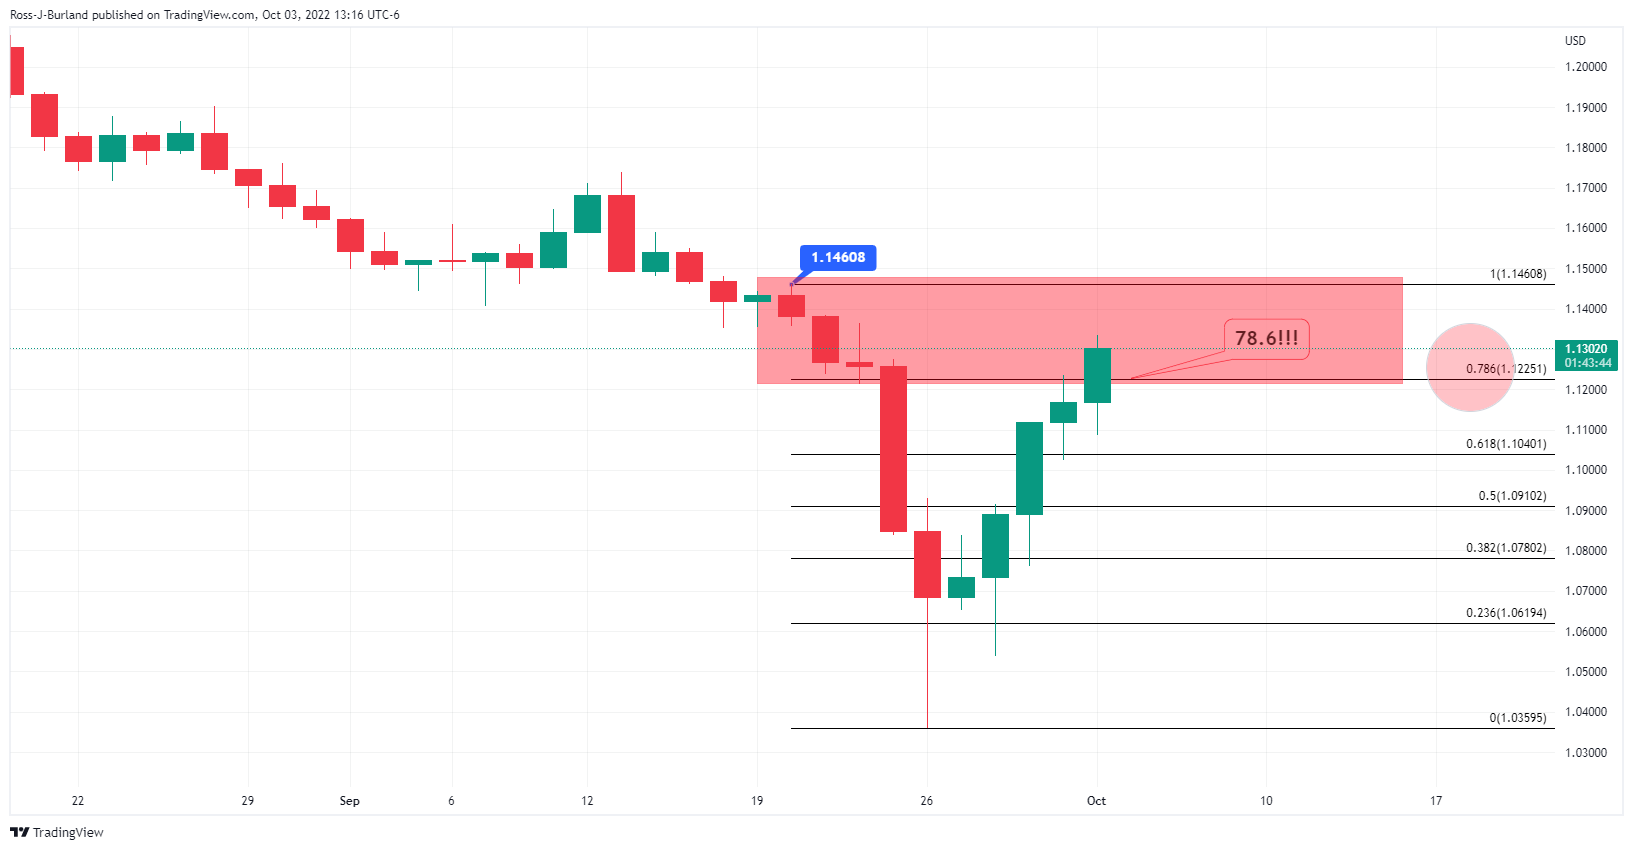
The price is attempting to come around in a full circle on the daily chart with the break of the 78.6% ratio. However, the structure on the hourly chart can be monitored in the case of a downside correction as follows:
GBP/USD H1 chart
1.1200/60 guards risk of a significant cascade of offers below targeting 1.1100 and 1.1020.
-
20:04
BoE Mann: UK inflation expectations are not de-anchored
Bank of England policymaker Catherine Mann is crossing the wires.
Key comments
UK inflation expectations are not de-anchored, has some concerns about medium-term upward drift.
More to come...
-
19:36
EUR/GBP extends its losses to four-straight days, below 0.8680
- EUR/GBP is registering weekly losses of more than 1% due to UK’s Chancellor Kwarteng U-Turn in the tax cut program.
- EU and UK’s S&P Global PMIs, paint a gloomy outlook for both economies.
- EUR/GBP is headed to the downside, as the pair extended its losses below last week’s low.
The EUR/GBP extends its losses for the fourth consecutive day, down by more than 1%, as UK’s new government, led by PM Liz Truss, backpedaled a 45% tax cut, improving investors’ sentiment around the globe. Therefore, the EUR/GBP is falling from around daily highs at 0.8830, below the 0.8700 threshold as the North American session progresses. At the time of writing, the EUR/GBP is trading at 0.8675.
Traders’ sentiment improved on Monday. Even though the EU’s energy crisis continues and geopolitical tensions between Russia/Ukraine escalate, was no reason to impede the British pound from appreciating vs. the single currency.
Data-wise, S&P Global PMIs revealed in the Euro area fell to a 27-month low of 48.4 in the previous month, from August’s 49.6, further reinforcing the thesis that the single-currency economy headed into a recession.
Chris Williamson, the chief business economist at S&P Global, said, “The ugly combination of a manufacturing sector in recession and rising inflationary pressures will add further to concerns about the outlook for the eurozone economy.” In a Reuters poll in September, analysts see a 60% chance of a recession in the bloc.
Meanwhile, the UK’s figure for manufacturing activity increased from 47.3 in August to 48.4 in September yet remained in contractionary territory.
Aside from this, UK turmoil abated some following the release of PM Liz Truss’s budget presented on September 23, which announced more than GBP 45 billion in tax cuts, which sent 30-year Gilts bond yield above 5%, spurring a crisis in the UK. Pension funds, unable to meet margin calls, were forced to sell assets to meet additional funding needs, while the Bank of England (BoE) intervened to stabilise the markets.
EUR/GBP Technical Analysis
During the day, the EUR/GBP tumbled below the 20-day EMA, which at 0.8756 opposed less to no resistance, as demand for GBP augmented as the UK’s Finance Minister, Kwasi Kwarteng, reversed the 45% tax cut. It should be noted that the RSI punched below the 50-midline, showing that sellers are gathering momentum. Intraday-wise, the EUR/GBP one-hour chart delineates the cross below the S2 daily pivot at 0.8695 and trading well below the EMAs. Therefore, a break below the September 22 cycle low at 0.8691 could open the door toward 0.8600.
-
19:18
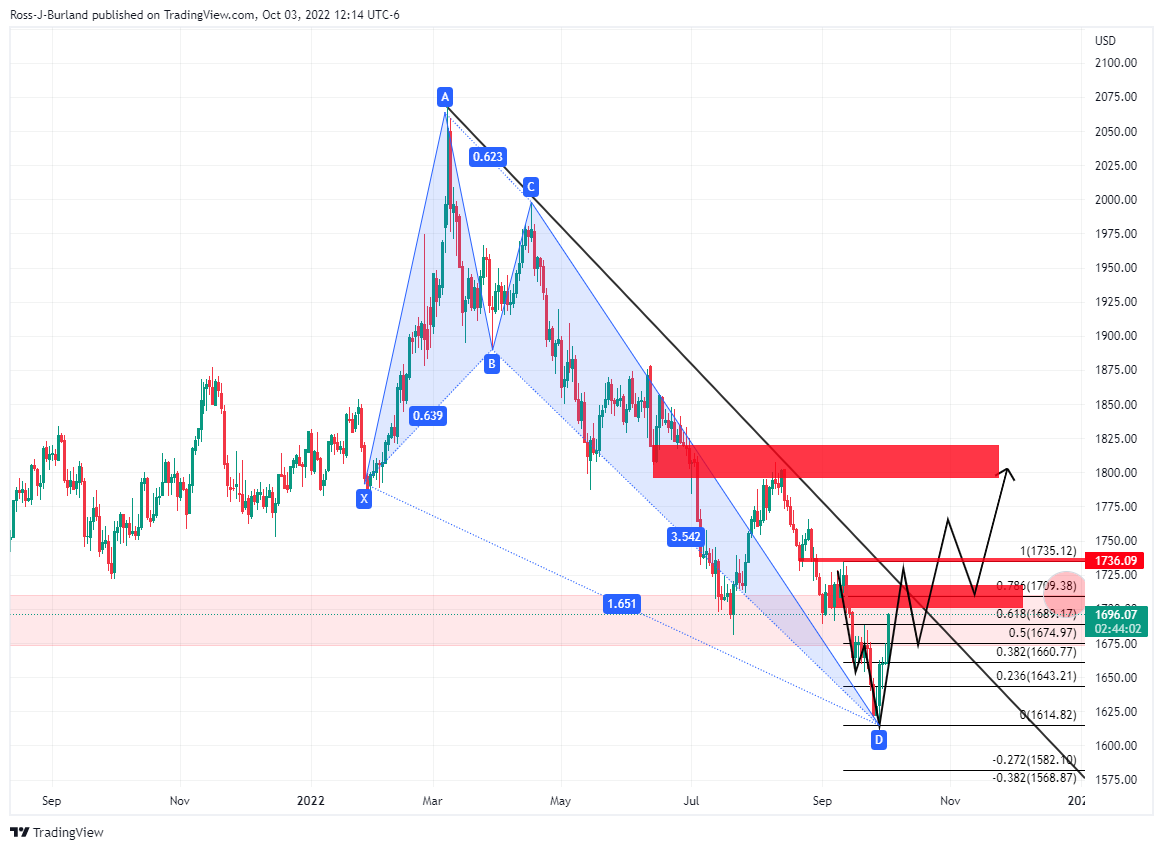
Gold Price Forecast: XAU/USD bulls coming up for air into critical daily structures
- Gold bulls move in on a critical technical area on the daily chart.
- US data sink the US dollar further in a weaker US yield environment.
The gold price exploded in the New York trade around the disappointment in the US data. Gold has travelled between a low of $1,696.26 and $1,697.13 and is higher by some 2.13% on the day. The price is homing in on a 78.6% Fibonacci retracement on the daily chart, as illustrated below having already breached the golden 61.8% ratio in trade today.
US data missed expectations despite a September beat in S&P Global Manufacturing PMI. The Institute for Supply Management’s (ISM) Manufacturing Purchasing Managers Index (PMI) arrived at 50.9 vs 52.2 expected and the prior 52.5 which was the catalyst for the sell-off in the greenback that was already being weighed by softer US yields. Boosting safe-haven demand for metals, U.S. manufacturing activity grew at its slowest pace in nearly 2-1/2 years in September. In turn, gold shot through resistance triggering stops along the way no doubt, exuberating a move into 270 pips to the highs of the day.
The US dollar has eased, helping demand for the greenback-priced bullion among overseas buyers. DXY, an index that measures the greenback vs. a basket of currencies is now down some 0.2% after falling from a high of 112.543 to a low of 111.470. This softness in the safe-haven currency has afforded gold some respite that has staged a mini-recovery after dropping to its lowest since April 2020 on Sept. 28. The benchmark US 10-year Treasury yields have also fallen and are now making an advance on key support structure: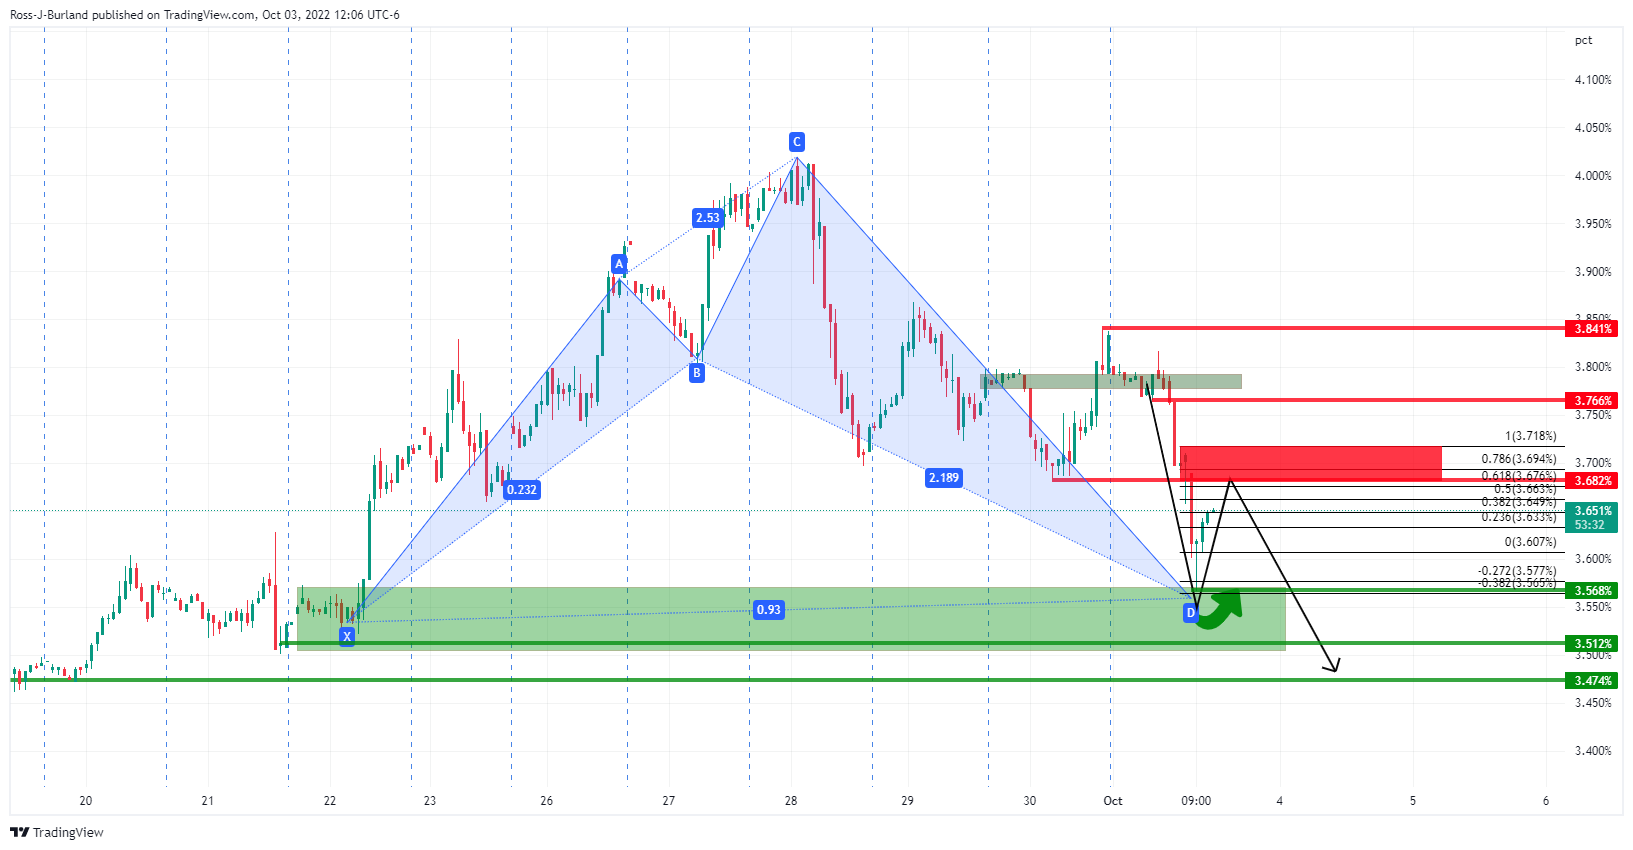
This is supporting the demand for zero-yield gold.
However, analysts at TD Securities argue that ''gold prices remain in a strengthening downtrend, despite the recent respite afforded by the slump in USD. The risk of capitulation remains prevalent for the yellow metal moving into October, with strong data continuing to point to a more aggressive Fed rate path ahead.''
Gold technical analysis
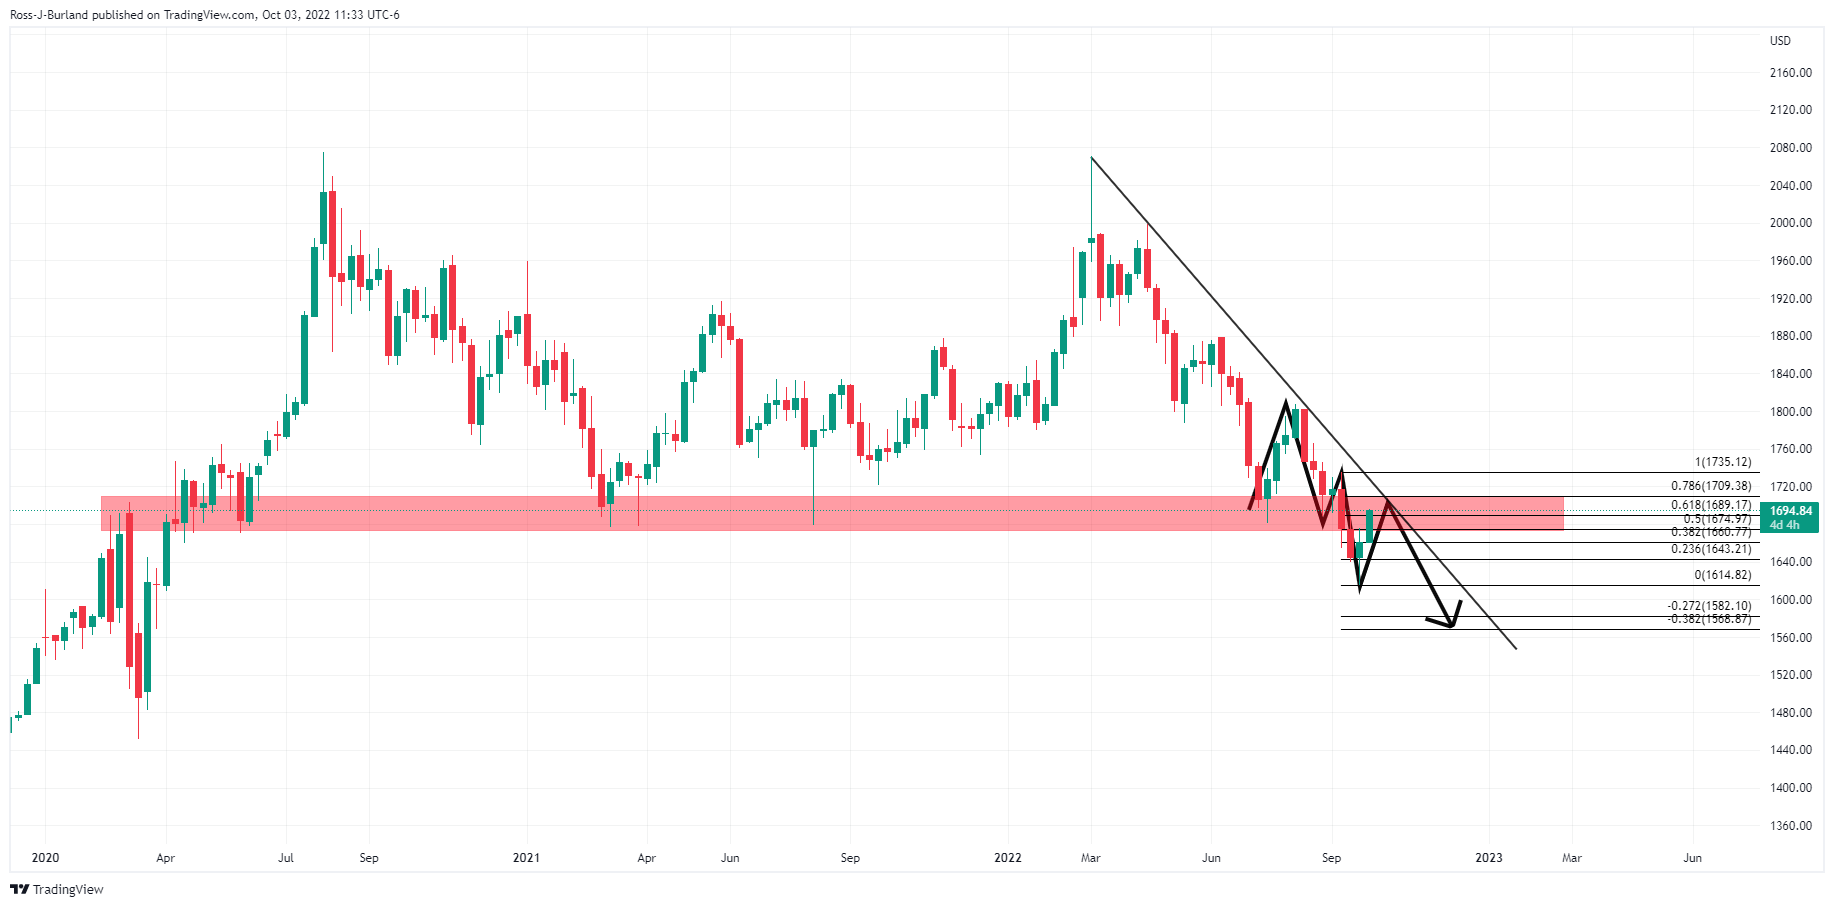
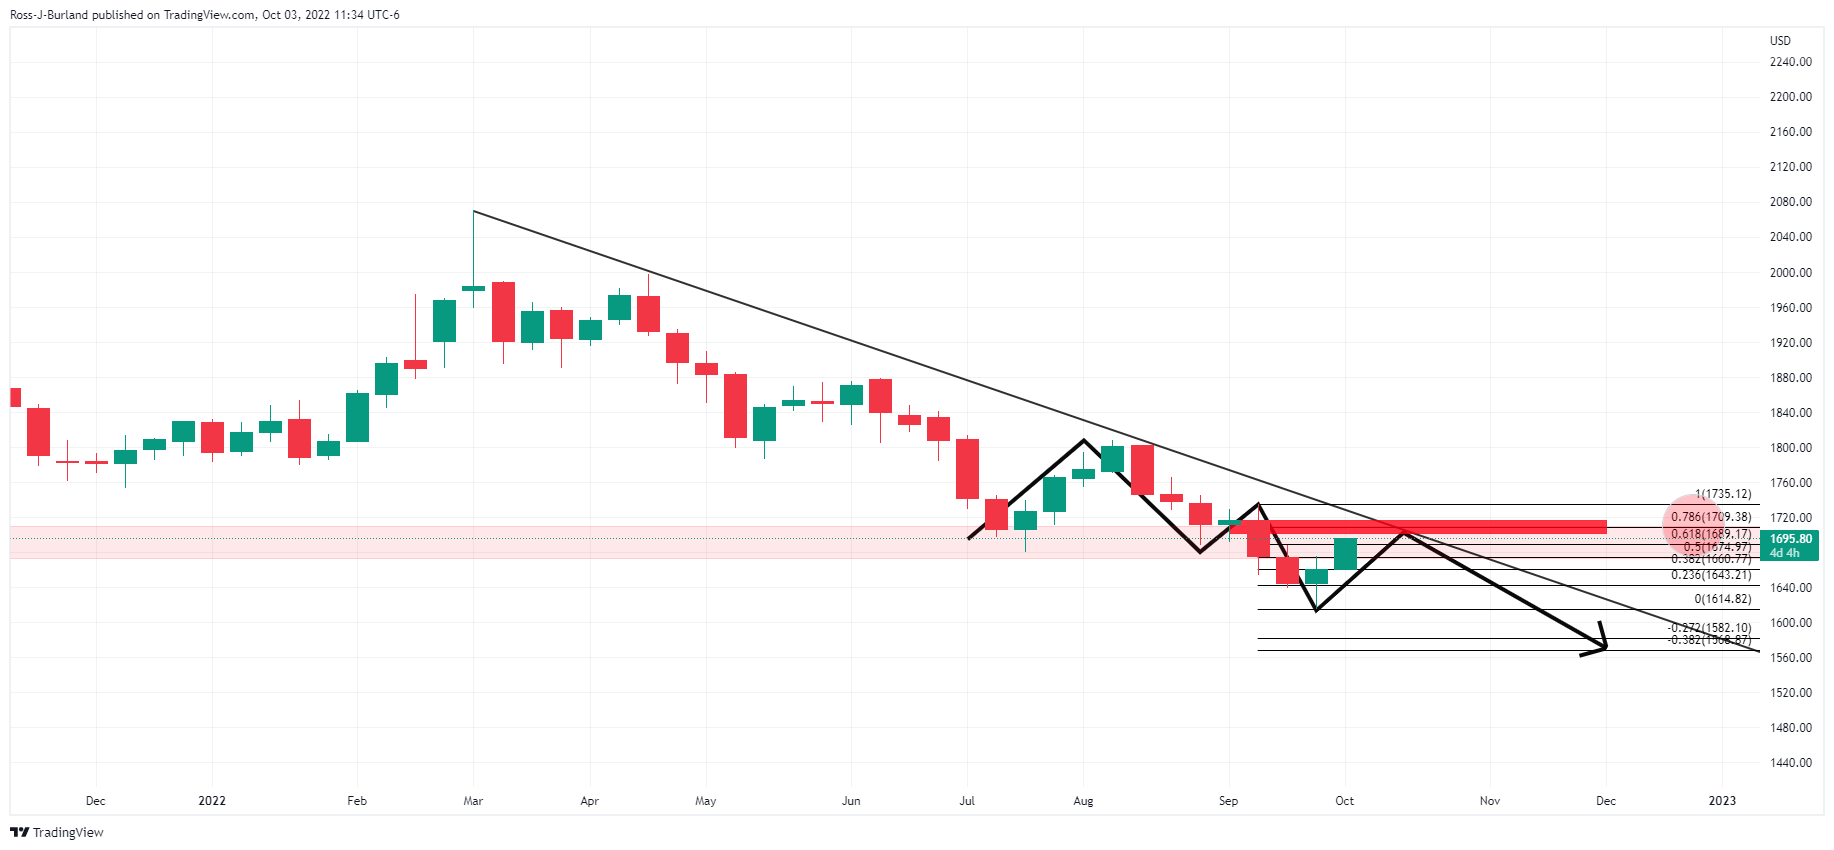
The daily charts above illustrate the price's trajectory below trendline resistance, on the way to the 78.6% Fibonacci retracement level near $1,710/oz. If resistance holds, then the price would be expected to continue with its southerly trajectory. On the other hand, should the bulls stay committed, then a break of resistance structure could lead to a significant upside continuation as per the bullish harmonic crab pattern:
-
18:25
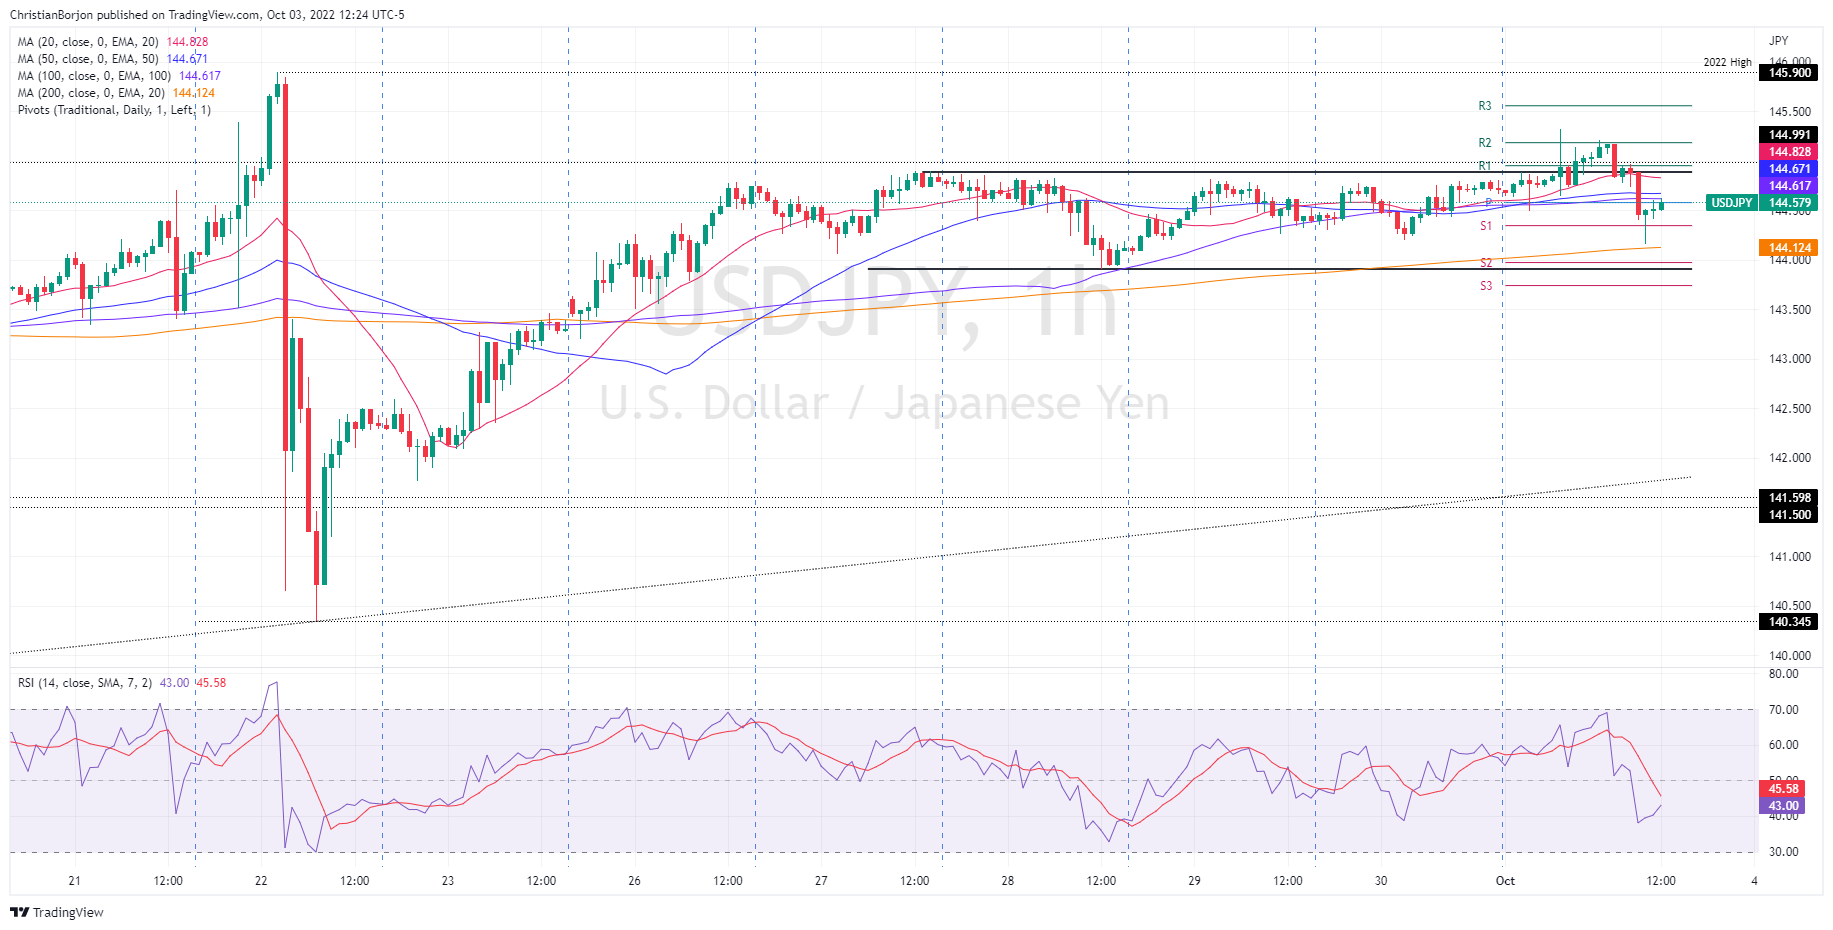
USD/JPY Price Analysis: Retraces from daily highs around 145.30s, on fears of Japanese intervention
- USD/JPY slightly falls by 0.09% on Monday after hitting a daily high at 145.32.
- The Japanese Finance Minister expressed that Japan is ready to take action to stabilize the exchange rate,
- The short term is neutral-to-downward biased, and if it breaks below 144.00, it will pave the way for a fall to 143.90.G
The USD/JPY dropped after testing the YTD highs at around 145.32 during Monday’s overnight session, though retreated as US T-bond yields, namely the 10-year, collapsed more than 20 bps as sentiment improved. Therefore, the USD/JPY is trading at 144.57, below its opening price by 0.13%.
Given the vocal expression of the Japanese Finance Minister Suzuki saying that Japan is ready to take “decisive” steps in the Forex market aimed to stabilize the yen, put a lid on the major’s rally throughout the Asian-European sessions.
USD/JPY Price Analysis: Technical outlook
Therefore, the USD/JPY daily chart stills show the major advancing steadily, though with less conviction than previously witnessed, when price action rallied towards July’s high at 139.39 and when the pair’s edged up from around 130.00 to 144.99. Oscillators stabilized after the Bank of Japan’s intervention, with the Relative Strength Index (RSI) almost flat around 62.45 in positive territory, suggesting that the exchange rate might consolidate around current price levels
The USD/JPY one-hour scale dictates that the major Is neutral-to-downward biased in the near term. During the day, the USD/JPY tumbled below the 20, 50, and 100-EMAs, opening the door for further losses. Even Monday’s low was shy of clearing the 200-EMA at 144.12, which could have shifted the bias downwards.
Hence, the USD/JPY first support would be the S1 daily pivot at 144.34, which, once cleared, will expose the 200-EMA at 144.12. A breach of the latter will tumble the major towards the S2 daily pivot at 143.97, ahead of the September 28 daily low at 143.90.
USD/JPY Key Technical Levels
-
17:37
USD/CAD drops from 2-year highs toward 1.3650, trimming last Friday’s gains
- USD/CAD plummets more than 1.20% on Monday as sentiment improves.
- Manufacturing activity in the US slowed its pace but remained growing.
- Canada’s S&P Manufacturing PMI improved but stayed below 50, signs of an ongoing economic slowdown blamed on elevated interest rates.
The USD/CAD dropped from around two-year highs at around 1.3837, plunging 200 pips on Monday, as the US dollar weakened across the board, as sentiment shifted positively due to a U-turn of the UK’s budget. Rumors of a slash in global oil production spurred a jump in oil prices, bolstering the oil-linked loonie. At the time of writing, the USD/CAD is trading at 1.3649, down by 1.25%.
European and US equities continue to recover after diving toward the YTD lows. After Wall Street opened, the ISM Manufacturing PMI for September was revealed, showing that activity, even though slowed, remained in expansionary territory, a 50.9, below 52.8 from the previous month. Worth noting that the report showed that New Orders dropped, suggesting that spending is decelerating, while prices paid decreased to 51.7, the lowest reading since June 2020, from 52.5 in August.
On the Canadian side, the S&P Global Manufacturing PMI for September jumped to 49.8, improving compared to the August 48.7 reading. According to the report, new orders decelerated at a faster pace, impacting prices paid by producers. Additionally, high-interest rates and weak economic conditions led clients to refrain from placing orders.
Elsewhere, the US Dollar Index continues to weaken across the board, with the DXY losing 0.27%, at 111.869, a headwind for the USD/CAD. Also, traders need to be aware of crude oil prices, with WTI increasing by 3.13%, at $82.63 per barrel, a tailwind for the Canadian dollar.
What to watch
The Canadian docket will feature the Bank of Governor speech by Tiff Macklem on Thursday, alongside employment figures on Friday. In the United States, the calendar will reveal Durable Good Orders alongside JOLTs Jobs Openings on Tuesday, ahead of September’s Nonfarm Payrolls report, revealed on Friday.
USD/CAD Key Technical Levels
-
17:01
US ISM: Inventories hold the key to understanding what is happening – Wells Fargo
Data released on Monday showed the ISM Manufacturing Index dropped during September more than expected to the lowest level in two years. According to analysts at Wells Fargo, key measures point to slowing activity, but it is inventoried that hold the key to understanding what is happening in the sector today. They argue that “firms are tired of having input prices weigh on profits, but are also leery of procuring hard-to-get supplies. In an effort to mitigate both of these risks, they are making sure someone else is holding the inventories.”
Key Quotes:
“To understand what is happening in the manufacturing sector today it is helpful to consider everything in the context of inventories.”
“Employment dropped 5.5 points to fall back into contraction territory, though with respondent comments still focused on tight labor market conditions, we suspect this remains a supply problem rather than a demand one. Still this was the largest monthly component swing and could signal slower payroll growth or at least less of a boost from manufacturing jobs.”
“Tired of having input prices weigh on profits but also leery of procuring hard-to-get supplies, firms are now trying to mitigate both risks by making sure someone else in their supply chain is holding the inventories. This is clearly stated by a representative from the food & beverage industry said, "It seems no one wants to keep inventory on hand anymore.”
“We expect these supply and inventory dynamics to direct manufacturing activity for some time. To the extent supply issues continue to ease, production held up in September but only modestly so. At 50.6, the production index remained dangerously close to the 50-line distinguishing expansion from contraction. Continued production amid some supply easing has allowed producers to chip away at order backlog and is driving supplier devliery times lower.”
-
16:54
Fed's Barkin: Never count disinflationary forces out
"I don’t want to declare a long-term shift in the prevailing winds when we still don’t know exactly how the pandemic era will play out," Richmond Fed President Thomas Barkin said at an Atlanta Fed technology conference. "Never count disinflationary forces out."
"Over the last 10 years, our inflation and employment goals have not been in conflict while making policy," Barkin explained, as reported by Reuters. "We will need to be crystal clear that a growing economy and maximum employment require stable prices and that we will remain committed to addressing inflationary gusts."
Market reaction
These comments failed to help the greenback find demand and the US Dollar Index was last seen losing 0.42% on the day at 111.70.
-
16:53
EUR/USD rises to test last week's highs amid a weaker dollar
- Us dollar tumbles across the board amid risk appetite, lower US yields.
- US ISM Manufacturing Index below expectations in September.
- EUR/USD holds a bullish tone, in ranges.
The EUR/USD found support above 0.9750 and rose during the American session to 0.9844, hitting a fresh daily high. The pair finally received some impulse from a weak US dollar.
The DXY printed a new weekly low at 111.47 and it is hovering around 111.65. The greenback is falling across the board weakened by several factors, including a recovery in Treasuries. The US 10-year yield bottomed at 3.57%, moving further away from the 4% area it traded just a few days ago. European yields are also lower on Monday.
After a cautious opening, equity prices in Europe finally turned positive. With the DAX ending with a 0.77% gain and the CAC 40 up by 0.55%. In Wall Street, the Nasdaq rises by 1.39% and the Dow Jones climbs by more than 2%. Commodity prices are sharply higher on Monday.
US economic data came in below expectations with the ISM Manufacturing Index at 50.2 in September down from 52.8 in August and below the 52.2 of market consensus. It was the lowest reading in over two years.
The weaker dollar has been unable so far to boost EUR/USD above the 0.9850 area, a critical short-term resistance area. A firm break above would strengthen the recovery of the euro from the multi-year low it hit last week, targeting first 0.9870 and then the resistance area at 0.9910.
A slide below the 0.9750 zone (daily low and 20-Simple Moving Average in 4 hours chart) should weigh on the euro. Support levels are seen at 0.9730 followed by 0.9700 and 0.9670.
Technical levels
-
16:28
UK's Kwarteng: The plan we put forward caused a little turbulence
UK Finance Minister Kwasi Kwarteng acknowledged on Monday that the fiscal they have introduced caused "a little disturbance" in markets, as reported by Reuters.
Additional takeaways
"No more distractions."
"Our growth plan makes sure we focus relentlessly on growth."
"People should keep more of the money they earn."
"We will forge a new economic deal for Britain."
"We will focus relentlessly on economic growth."
"Now I want to focus on delivering the major parts of the growth plan."
"Economic deal will be backed by an iron-clad commitment to fiscal discipline."
Market reaction
GBP/USD preserves its bullish momentum after these comments and it was last seen rising 1.35% on the day at 1.1312.
-
16:19
Silver Price Forecast: XAG/USD climbs more than 1.30%, back above $20.30
- On Monday, silver is climbing solid, courtesy of falling US Treasury bond yields, meaning US bond real yields are down, a tailwind for precious metals.
- The US Dollar is also down by more than 0.50% after US manufacturing activity dropped but remained above recessionary territory.
- Traders are focused on Tuesday’s data ahead of Friday’s US Nonfarm Payrolls report.
Silver price rallies sharply as the fourth quarter begins, amidst a risk-on impulse in the financial markets, due to overnight news that the newest UK government has backpedaled with some tax cuts, easing traders’ fears. Demand for US Treasures jumped, so yields edged lower, meaning higher precious metals prices. At the time of writing, the XAG/USD is trading at $20.35 a troy ounce in the North American session.
US equities portray a positive sentiment across the board. The Institute for Supply Management (ISM) reported that manufacturing activity grew at the slowest pace in 2 and half years in September, dropping to 50.9, below August 52.8, but staying in expansionary territory, negating the “technical recession” in the US, as 2022 Q1 and Q2 GDP showed negative readings. In the same report, New Orders dropped to 47.1 from 51.3, while prices paid edged lower.
The US data began to flash the effects of the Fed’s tightening monetary conditions. Since Fed officials remained with their hawkish rhetoric throughout the last week, market players should expect additional rate hikes by November’s meeting, namely 75 bps.
Meanwhile, the US Dollar Index, a gauge of the buck’s value vs. a basket of peers, edges down by 0.57% down at 111.546, while the US 10-year Treasury bond yield collapses 25 bps to the 3.582% threshold, a headwind for the greenback.
Therefore, the fall in US 10-year TIPS yield, a proxy for real yields, is down at 1.45%, after reaching a YTD high at 1.70%, further explaining the appreciation of precious metals.
What to watch
On Tuesday, the US economic docket will feature Durable Goods Orders, alongside JOLTs Jobe Openings, ahead of September’s Nonfarm Payrolls report, revealed on Friday.
Silver (XAG/USD) Key Technical Levels
-
16:06
GBP/USD rises above 1.1300 amid renewed dollar weakness
- UK government's U-turn on tax cuts provided a boost to the British pound on Monday.
- The US Dollar Index turned negative on the day below 112.00.
- The dollar came under renewed selling pressure after ISM PMI data.
Following the sharp upsurge witnessed in the early European morning, the GBP/USD pair stayed in a consolidation phase near 1.1200 before gathering bullish momentum in the American session. The pair was last seen trading at its highest level in 10 days at 1.1310, rising 1.35% on a daily basis.
Reports suggesting that British Prime Minister Liz Truss and Finance Minister Kwasi Kwarteng would reverse a cut to the higher rate income tax caused UK gilt yields to fall sharply and provided a boost to the British pound at the beginning of the week. After Kwarteng confirmed the reports by saying "we are not proceeding with the abolition of the 45p tax rate. We get it, and we have listened," the pair held its ground despite the modest dollar strength.
In the second half of the day, the ISM Manufacturing PMI weighed on the dollar and opened the door for an extended rally in GBP/USD.
Although the headline PMI arrived above 50, the Employment Index fell to 48.7, revealing a contraction in manufacturing sector jobs ahead of the September Nonfarm Payrolls data on Friday. Additionally, the Prices Paid Index fell to 51.7 from 52.5 in August. Softening input inflation and declining employment in the sector caused investors to reassess the Fed's policy outlook with the CME Group FedWatch Tool's probability for a 75 basis points rate hike falling toward 50. Reflecting the broad-based dollar weakness, the US Dollar Index was last seen losing 0.4% on the day at 111.73.
Later in the session, Kansas Fed President Esther George and New York Fed President John Williams will be delivering speeches.
Technical levels to watch for
-
16:01
AUD/USD extends gains, hits fresh daily highs above 0.6500
- US Dollar weakens at the beginning of a busy week.
- AUD/USD rises above 0.6500, next resistance at 0.6530.
- RBA to announce monetary policy decision on Tuesday.
The AUD/USD opened the week under 0.6400 and recently printed fresh daily highs above 0.6500. The pair has been rising constantly since the Asian session and gained momentum on American hours amid a weaker dollar and risk appetite. It peaked at 0.6509 and is still moving with a bullish tone.
Dollar under pressure
The greenback weakened further across the board following the release of US data. The ISM Manufacturing Index dropped more than expected to 50.9 from 52.8. All details of the report showed numbers below market consensus.
US yields hit fresh lows after the ISM. The US 10-year yield that just a week ago was above 4%, is at 3.60%. In Wall Street, stocks are up significantly with the Dow Jones gaining more than 2%. Gold and silver are up sharply at weekly highs.
The combinations of risk appetite and lower yields are helping the AUD/USD but not the AUD/NZD that is falling, currently below 1.1380.
The next critical even for the aussie is the Reserve Bank of Australia (RBA) meeting on Tuesday. Market consensus expects a 50 basis points rate hike. The announcement and the tone of the statement will likely have a significant impact on AUD/USD.
-
15:57
Gold Price Forecast: XAU/USD remains in a strengthening downtrend – TDS
Gold is defending gains amid a broadly weaker US dollar. However, strategists at TD Securities note that the yellow metal stays immersed in a strong downtrend.
The pain trade is still to the downside
“Gold prices remain in a strengthening downtrend, despite the recent respite afforded by the slump in USD.”
“The risk of capitulation remains prevalent for the yellow metal moving into October, with strong data continuing to point to a more aggressive Fed rate path ahead.”
“Considering the increase in inflation's persistence this cycle, a restrictive regime may last longer than historical precedents with the Fed likely to keep rates elevated for some time, even as recession risks rise, which argues for a prolonged period of pronounced weakness in precious metals.”
-
15:48
Gold extends rally to fresh multi-week highs, closes in on $1,700
- Gold rose to its highest level in over two weeks on Monday.
- Falling US T-bond yields, broad dollar weakness fuel XAU/USD's rally.
- ISM Manufacturing PMI's Priced Paid component continued to fall in September.
Gold gathered bullish momentum and climbed above $1,690 for the first time since mid-September. As of writing, XAU/USD was trading at $1,690, where it was up 1.7% on a daily basis.
The sharp decline witnessed in the US Treasury bond yields seems to be fueling gold's rally on the first trading day of the fourth quarter. The benchmark 10-year US T-bond yield was last seen losing 5.5% on the day at 3.6%. Reflecting the negative impact of falling yields' on the dollar's market valuation, the US Dollar Index is down 0.3% on the day below 112.00.
The data published by the ISM showed on Monday that the Manufacturing PMI declined to 50.9 in September from 52.8 in August. This pring fell short of analysts' estimate of 52.2. Additionally, the Prices Paid component of the PMI survey fell to 51.7 from 52.2, pointing to a further easing of input price pressures.
After this report, the probability of one more 75 basis points Fed rate hike in November declined toward 50%, revealing a shift in market positioning ahead of this week's highly-anticipated September jobs report.
Meanwhile, the improving market mood, as reflected by Wall Street's main indexes' impressive gains, is not allowing the dollar to stage a rebound.
Several FOMC policymakers will be delivering speeches later in the session but gold should manage to end the day with strong gains unless there is a decisive rebound in US T-bond yields.
Technical levels to watch for
-
15:43
USD/CAD to advance nicely towards 1.4097 – Credit Suisse
USD/CAD’s rise has slowed, and the market has entered a consolidation. Nonetheless, the core uptrend remains intact, and analysts at Credit Suisse continue to look for a move to 1.4097.
Broader uptrend remains strong
“Whilst a minor bearish divergence in daily RSI warns of a potentially lengthier correction, the broader uptrend remains strong and with our bullish USD and bearish Brent Crude Oil views in mind, we continue to look for an eventual resumption of the recent upside.”
“Resistance is seen at the highs from last week at 1.3832/38, which we look to be broken to reassert strength and trigger a move to 1.4097 – the 78.6% retracement of the 2020/21 downtrend.”
“We look for support at the recent price lows at 1.3603/01 and then at the 13-day moving average at 1.3560 to try to hold any sharper move lower to prevent a lengthier downside correction.”
-
15:15
RBA Preview: Forecasts from eight major banks, another 50 bps hike
The Reserve Bank of Australia (RBA) will announce its monetary policy decision on Tuesday, October 4 at GMT 04:30 GMT and as we get closer to the release time, here are the forecasts by the economists and researchers of eight major banks regarding the upcoming central bank's decision.
The RBA is expected to hike rates by 50 basis points to 2.85%, making it the fourth consecutive rate hike of such a degree. Since updated macro forecasts were released at the August 2 meeting, we will not see the next update until the November 1 meeting.
ANZ
“We expect a 50 bps rate hike from the RBA, reflecting strength in recent domestic data, including solid household spending, ongoing inflation momentum and near-record job vacancies. We also expect the RBA to ‘soften’ its message by removing the reference to ‘over the months ahead’ in the context of further rate increases.”
Westpac
“We anticipate that the RBA will lift the cash rate by 50 bps – the fifth consecutive move of 50 bps. That will take the cash rate to 2.85%, a touch on the high side of ‘neutral’. Moves beyond this point are likely to be more measured. Globally and domestically, the inflation outlook is challenging, with risks that inflation expectations ratchet higher. In Australia, headline inflation is expected to climb to over 7% by year-end, the labour market is the tightest in 50 years, and wages growth is accelerating, albeit from modest levels. It is in this environment that the RBA is removing ultra-easy monetary conditions and will shift to a contractionary stance. We anticipate that the cash rate will peak at 3.60% in February 2023 – with further moves of 25 bps at each of the three meetings from November to February.”
Standard Chartered
“We expect the RBA to hike the cash rate by 50 bps to 2.85% from 2.35% previously. We expect the RBA to continue to front-load rate hikes and raise rates into restrictive territory above 3%; we expect the pace of hikes to ease, however, once the policy rate crosses the 3% level.”
ING
“Following some reasonable August labour market data, and stronger-than-expected retail sales figures, recent hints from the RBA that it may soon start to tighten rates at a slower pace are looking a bit less credible right now. With a strong and unified hawkish chorus from US Fed officials, the apparent ruling out by the US White House of a plaza-style currency agreement, and a further sliding of the Australian dollar, the odds are swinging back towards another 50 bps RBA move at the coming meeting.”
TDS
“In the RBA Sep minutes, the Board judged that it may be appropriate 'at some point' to scale back to 25 bps hikes, but we think it is too soon for that. Data on balance is still strong, which suggests the economy is holding up well. Thus, this affords room for the RBA to front-load hikes further as the Governor notes the current cash rate is ‘still probably on the low side’.”
SocGen
“We expect the RBA to increase the cash rate target from 2.35% to 2.85%, which would mark five consecutive 50 bps rate hikes since the initial one back in June. The policy statement will continue to say that the RBA is committed to returning inflation to the 2-3% target range over time while keeping the economy on an even keel and that the size and timing of future interest rate increases will be guided by the data and the outlook by policymakers on inflation and the labour market. The statement will also continue to skip the words ‘normalising monetary conditions’, which we think implies the intention of policymakers to adjust its policy stance to one of outright tightening.”
Citibank
“We do not expect any moderation in the pace of tightening from the RBA in October given the threat of wider rate differentials caused by expectations of a higher peak in global policy rates. Instead, we now expect 50 bps from the RBA this week to take the cash rate to 2.85%. Smaller rate hikes are likely to follow in November and December, when the RBA Board shifts to 25 bps rate hikes, leaving the cash rate target at 3.35% by year-end with a further 25 bps increase in Q1 2023, leaving the terminal rate next year at 3.6% where RBA policy will be firmly restrictive territory.”
Wells Fargo
“We expect the RBA to deliver a 25 bps hike, bringing the Cash Rate to 2.60%. More specifically, after a 25 bps hike at its October meeting, we expect two more 25 bps hikes in November and December, bringing the Cash Rate to 3.10%.”
-
15:13
GBP/USD points to the 1.14 zone so long as 1.12 holds – Scotiabank
Cable gains extended to near 1.13 earlier before losing close to a cent. So long as 1.12 holds, the pair could enjoy further gains to the 1.14 area, economists at Scotiabank report.
GBP does look very cheap from a long-run perspective
“Holding the 1.12 area would be a technical plus and point to further, corrective gains to the 1.14+ zone.”
“The sharp bounce from last week’s extreme low might indicate that the worst is over for the GBP but additional gains on a weekly basis are needed to instill more confidence in the still quite uncertain outlook. The GBP does look very cheap from a long-run perspective, however.”
-
15:04
US: ISM Manufacturing PMI declines to 50.9 in September vs. 52.2 expected
The US ISM Manufacturing PMI declined to 50.9 in September from 52.8 in August, pointing to a loss of momentum in the manufacturing sector's growth. This was the lowest reading in over two years and was weaker than the market expectation of 52.2.
Further details of the publication revealed that the Prices Paid Index declined to 51.7 from 52.5, the Employment Index fell to 48.7 from 54.2 and the New Orders Index slumped to 47.1 from 51.3.
Developing story...
Market reaction
The US Dollar Index came under modest bearish pressure and declined toward 112.00 with the initial reaction to this report.
-
15:01
United States ISM Manufacturing PMI came in at 50.9, below expectations (52.2) in September
-
15:00
United States ISM Manufacturing Prices Paid came in at 51.7, below expectations (51.9) in September
-
15:00
United States Construction Spending (MoM) registered at -0.7%, below expectations (-0.3%) in August
-
15:00
United States ISM Manufacturing Employment Index registered at 48.7, below expectations (52.1) in September
-
15:00
United States ISM Manufacturing New Orders Index registered at 47.1, below expectations (49.6) in September
-
14:54
Gold Price Forecast: XAU/USD hovers around one-week high, just below $1,675 level
- Gold gains some positive traction on Monday and inches back closer to a one-week high.
- A further pullback in the US bond yields turns out to be a key factor benefiting the metal.
- A modest USD strength, the risk-on impulse should keep a lid on any meaningful upside.
Gold attracts some dip-buying near the $1,660 area on Monday and is now looking to build on last week's goodish recovery from its lowest level since April 2020. The XAU/USD sticks to its intraday gains near the $1,670 area through the early North American session and is currently placed just below a one-week high touched on Friday.
The recent pullback in the US Treasury bond yields from a multi-year peak picks up the pace on the first day of a new week after the UK government announced that it will not go ahead with tax cut plans. This, in turn, is seen as a key factor offering some support to the non-yielding gold, though a modest US dollar strength could cap any meaningful upside.
Growing acceptance that the Fed will stick to its aggressive rate hiking cycle to curb stubbornly high inflation continues to act as a tailwind for the greenback. Apart from this, the risk-on impulse - as depicted by the early strong rally in the US equity markets - might further contribute to keeping a lid on the safe-haven precious metal, at least for now.
Investors also seem reluctant and might prefer to move on the sidelines ahead of important US economic data scheduled at the beginning of a new month. A rather busy week kicks off with the release of the ISM Manufacturing PMI on Monday. The focus, however, will remain on the closely-watched US monthly employment details, popularly known as NFP, due on Friday.
The key US labour market report will play a key role in influencing Fed rate hike expectations. This, in turn, will determine the near-term USD price dynamics and provide a fresh directional impetus to gold. In the meantime, traders are likely to take cues from the US bond yields, which, along with the broader risk sentiment, might provide some impetus to the XAU/USD.
Technical levels to watch
-
14:51
US: S&P Global Manufacturing PMI rises to 52 (final) in September vs. 51.8 expected
- US S&P Global Manufacturing PMI edged higher to 52 in September.
- US Dollar Index stays in daily range above 112.00 after the data.
The economic activity in the US manufacturing sector expanded at a slightly stronger pace in September than it did in August with the S&P Global Manufacturing PMI rising to 52.0 from 51.5. This reading came in better than the flash estimate and the market expectation of 51.8.
Commenting on the survey's findings, "with US manufacturers reporting a return to growth of order books for the first time in four months, as well as improved job gains, the September survey brings welcome news that business conditions are starting to improve again," said Chris Williamson, Chief Business Economist at S&P Global Market Intelligence.
"However, even with the latest improvement, the weakness of the data in recent months still point to manufacturing acting as a drag on the economy in the third quarter," Williamson added. "Demand will need to revive further if any meaningful positive contribution to GDP is going to be seen in the rest of the year."
Market reaction
The US Dollar Index showed no immediate reaction to this report and was last seen posting small daily gains at 112.25.
-
14:49
India: RBI raised rates further – UOB
UOB Group’s Head of Research Suan Teck Kin, CFA, reviews the latest interest rate decision by the RBI.
Key Takeaways
“The Reserve Bank of India (RBI) lifted its benchmark repo rate by 50 bps to 5.90% from 5.40% in its Sep monetary policy meeting in a 5-1 decision. The move was in line with majority of Bloomberg survey but exceeded our expectation of 25bps move as RBI focuses on keeping inflation within the target going forward, while supporting growth. This is the third straight 50-bps hike for the RBI, underlining its concerns over the inflation trajectory so far this year.”
“The Monetary Policy Committee (MPC) noted that despite a challenging global environment, domestic aggregate supply conditions are improving, while urban consumption is being lifted by discretionary spending ahead of the festival season and rural demand is gradually improving.”
“The MPC said elevated imported inflation pressures remain an upside risk for the future trajectory of inflation, amplified by the continuing appreciation of the USD. The outlook for crude oil prices is highly uncertain and tethered to geopolitical developments, with attendant concerns relating to both supply and demand. The MPC lowered its forecasts for average crude oil price (Indian basket) to US$100/barrel (from previous forecast of US$105), and kept its inflation forecast of 6.7% in 202223 (which was last raised from previous forecast of 5.7% at the Jun MPC), with 2Q at 7.1%; 3Q at 6.5%; and 4Q at 5.8%, and risks are evenly balanced. CPI inflation for 1Q FY2023-24 is projected at 5.0%.”
“Nevertheless, GDP growth forecast for 2022-23 is trimmed to 7.0% (in line with our projection), from 7.2% (after having downgraded it from 7.8% in Apr). RBI noted headwinds from global forces - protracted geopolitical tensions, rising global financial market volatility, tightening global financial conditions; and global recession risks. The MPC highlighted headwinds from geopolitical tensions, tightening global financial conditions and the slowing external demand pose downside risks to net exports and hence to India’s GDP outlook.”
“With the policy priority on containing inflationary pressures from second-round effects of supply side shocks and anchoring long term inflation expectations, there is still room for RBI’s rate hike cycle. After kicking off with the surprise unscheduled 40bps move on 4 May and the consecutive 50bps hikes in Jun, Aug and Sep MPC, we think that the RBI will hike further to rein in inflation while keeping a close watch on downside risks to growth. In the two remaining MPCs in FY2022-23, we anticipate the RBI raising the repo rate to 6.50% to match the level last seen in Jan 2019, just before RBI entered its accommodative phase.”
-
14:46
United States S&P Global Manufacturing PMI came in at 52, above forecasts (51.8) in September
-
14:43
NZD/USD to break below YTD low at 0.5563 as risk remains seen as lower – Credit Suisse
NZD/USD’s firm decline stalled last week. Nevertheless, economists at Credit Suisse continue to look for a break below the YTD low at 0.5563 to prompt a move to the 2020 low at 0.5468.
Pause seen as temporary
“Though the current pause may continue in the short-term, we continue to see the risk as lower whilst below the recent price highs at .5750/59 and thus, look for a break below the YTD low at 0.5563 to eventually occur. Below here should then reassert the recent weakness and expose the low from 2020 at 0.5468, a close below here would mark a major break lower and provide a platform for further decline to 0.5250.
“Meaningful near-term resistance stays seen at 0.5750/59 and then above at the 13-day exponential average at 0.5771, which ideally holds to avoid a lengthier recovery.”
-
14:43
USD/TRY advances to fresh all-time highs near 18.6000
- USD/TRY gathers extra upside traction near 18.60.
- Türkiye Manufacturing PMI eased to 46.90 during last month.
- Inflation rose to 24-year highs above 83% in September.
The Turkish lira accelerates its depreciation and lifts USD/TRY to a new all-time high past 18.57 on Monday.
USD/TRY stronger post-CPI, looks to USD rally
USD/TRY resumes the upside on Monday after another release of Turkish inflation figures saw the CPI run at the hottest pace since July 1998 at 83.45% YoY, while consumer prices rose 3.08% vs. the previous month. Also weighing on the sentiment, Producer Prices increased at an annualized 151.50% YoY and 4.78% MoM.

Furthermore, higher costs in transportation and food coupled with an important increase in housing prices were behind another uptick in the domestic CPI in September.
Additional releases noted the Manufacturing PMI ticked a tad lower to 46.90 in September (from 47.40).
Extra gains in the pair also come from the better tone in the greenback, which adds to Friday’s advance and keeps the mood in the risk complex subdued.
The lira, therefore, enters its 10th consecutive month with losses and already retreats more than 40% so far this year (vs. 44% in all 2021).
What to look for around TRY
USD/TRY keeps navigating the area of all-time tops near 18.60 amidst the combination of omnipresent lira weakness and the unabated rally in the dollar.
So far, price action around the Turkish lira is expected to keep gyrating around the performance of energy and commodity prices - which are directly correlated to developments from the war in Ukraine - the broad risk appetite trends and the Fed’s rate path in the next months.
Extra risks facing the Turkish currency also come from the domestic backyard, as inflation gives no signs of abating (despite rising less than forecast in July and August), real interest rates remain entrenched well in negative territory and the political pressure to keep the CBRT biased towards low interest rates remains omnipresent.
In addition, the lira is poised to keep suffering against the backdrop of Ankara’s plans to prioritize growth (via higher exports and tourism revenue) and the improvement in the current account.
Key events in Türkiye this week: CPI, Producer Prices, Manufacturing PMI (Monday).
Eminent issues on the back boiler: FX intervention by the CBRT. Progress of the government’s scheme oriented to support the lira via protected time deposits. Constant government pressure on the CBRT vs. bank’s credibility/independence. Bouts of geopolitical concerns. Structural reforms. Presidential/Parliamentary elections in June 23.
USD/TRY key levels
So far, the pair is gaining 0.59% at 18.5616 and faces the next hurdle at 18.5737 (all-time high October 3) followed by 19.00 (round level). On the downside, a break below 18.0801 (55-day SMA) would expose 17.8590 (weekly low August 17) and finally 17.7586 (monthly low).
-
14:38
EUR/USD to affirm a sustainable rebound once above 1.0050/1.0200 – SocGen
EUR/USD has tested the lower limit of the channel at 0.9500 resulting in a bounce. But the pair needs to surpass the 1.0050/1.0200 resistance zone to confirm a sustainable rebound, economists at Société Générale, report.
EUR/USD could test 0.9380 on a dip below 0.9500
“The pair has tested the lower limit of the channel at 0.9500 resulting in a bounce. However, it must establish itself beyond the 50-DMA and recent high of 1.0050/1.0200 to affirm a sustainable rebound.”
“In case the decline persists below 0.9500, EUR/USD could test next projections at 0.9380 and 0.9200/0.9150.”
-
14:35
Canada: S&P Global Manufacturing PMI recovers to 49.8 in September vs. 50.6 expected
- Canada S&P Global Manufacturing PMI rebounded modestly in September.
- USD/CAD trades deep in red near 1.3700 after the data.
The business activity in the Canadian manufacturing sector contracted at a modest pace in September with the S&P Global Manufacturing PMI coming in at 49.8. This print followed's August reading of 48.7 but came in lower than the market expectation of 50.6.
Commenting on the data, "the close of the third quarter yielded a mixed bag of results for Canada's manufacturing sector with a back-to-back deterioration in operating conditions recorded during September," said Shreeya Patel, Economist at S&P Global Market Intelligence."
"Output and new orders continued to fall with the sector still feeling the repercussions of material shortages and delivery delays," Patel added. "Demand was once again hit by client hesitancy in the wake of rising interest rates and weak macroeconomic conditions."
Market reaction
USD/CAD stays under bearish pressure after this data and was last seen losing nearly 1% on the day at 1.3695.
-
14:30
Canada S&P Global Manufacturing PMI registered at 49.8, below expectations (50.6) in September
-
14:16
GBP/USD to face stubborn resistance at the 1.1409/1.1500 zone – Credit Suisse
The rollercoaster ride for GBP/USD continues. Economists at Credit Suisse see scope for a deeper but still corrective recovery to 1.1405/09.
Initial support aligns at 1.1195
“Whilst our bias, for now, is to view this strength as a corrective rebound, with resistance from the 13-day exponential average cleared, we see scope for strength to extend further still.”
“Resistance is seen next at 1.1321, ahead of 1.1364 and then what we see as much tougher resistance from the lower end of the 2016/2022 range at 1.1409/1.1500. We look for this to then prove a major barrier and for the broader risk to turn lower again.”
“A close above the 1.1739 September high is needed to suggest we may have seen a more important low.”
“Support is seen at 1.1195 initially, then 1.1085 with a break below 1.1025 needed to ease the immediate upside bias for a fall to test support next at 1.0933/16.”
-
14:12
When is the September US ISM Manufacturing PMI and how could it affect EUR/USD?
US ISM Manufacturing PMI overview
The Institute of Supply Management (ISM) will release its latest manufacturing business survey result, also known as the ISM Manufacturing PMI at 14:00 GMT this Monday. The index is anticipated to have edged down to 52.2 in September from the 52.8 previous. Among the sub-components of the report, the focus will be on Prices Paid as it reflects business sentiment around future inflation. The index is expected to retreat from 52.5 in August to 51.9 during the reported month. Nevertheless, the data will provide a fresh update on the manufacturing sector activity amid rising borrowing costs and growing worries about a deeper economic downturn.
How could it affect EUR/USD?
Ahead of the key release, a modest US dollar strength keeps the EUR/USD pair depressed below the 0.9800 mark. A stronger headline print will be enough to reaffirm bets for another supersized 75 Fed rate hike move in November. This, in turn, should provide a fresh lift to the US Treasury bond yields and boost the greenback.
Conversely, a softer report will add to recession fears and offer some support to the safe-haven buck. This, along with the risk-off of a further escalation in the Russia-Ukraine conflict, suggests that the path of least resistance for the EUR/USD pair is to the downside and attempted recovery could still be seen as a selling opportunity.
The EUR/USD pair is down for a second consecutive day and overall bearish. The pair is developing below the 38.2% retracement of its latest daily decline at around 0.9790 while still below bearish moving averages in the daily chart. The 20 SMA approaches from above the 50% retracement of the same slide at 0.9865. Additionally, technical indicators remain within negative levels, with the Momentum still grinding higher, but the RSI is flat at around 41.”
Eren Sengezer, Editor at FXStreet, offers a brief technical overview of the EUR/USD pair and writes: “The Relative Strength Index (RSI) indicator on the four-hour chart holds comfortably above 50 on Monday. Additionally, the 20-period SMA crossed above the 50-period SMA, confirming the bullish bias in the near term.”
Eren also outlines important technical levels to trade the EUR/USD pair: “On the upside, the Fibonacci 61.8% retracement of the latest downtrend forms initial resistance at 0.9850 ahead of 0.9875 (100-period SMA). With a four-hour close above the latter, the pair could target 0.9925 (200-period SMA) next.”
“0.9800 (psychological level, Fibonacci 50% retracement) aligns as first support before 0.9750 (Fibonacci 38.2% retracement, 50-period SMA) and 0.9700 (psychological level),” Eren adds further.
Key Notes
• EUR/USD Forecast: Risk-off flows hurting the EUR the most
• EUR/USD Forecast: Euro needs to clear 0.9850 to extend recovery
• EUR/USD remains in a downtrend with levels as low as 0.9200 possible – Credit Suisse
About the US ISM manufacturing PMI
The Institute for Supply Management (ISM) Manufacturing Index shows business conditions in the US manufacturing sector. It is a significant indicator of the overall economic condition in the US. A result above 50 is seen as positive (or bullish) for the USD, whereas a result below 50 is seen as negative (or bearish).
-
14:07
Brazil S&P Global Manufacturing PMI registered at 51.1, below expectations (53) in September
-
14:05
RBA expected to hike rates by 25 bps this week – UOB
Economist at UOB Group Lee Sue Ann suggests the RBA could raise the OCR by 25 bps at its meeting on October 4.
Key Quotes
“After having raised rates by 2.25ppts since May, the OCR is now approaching a neutral rate, allowing the RBA to return to smaller moves.”
“We have thus penciled in 25bps hikes for the remaining three meetings in 2022. Our call for shallower rate hikes is also largely due to a slowdown in the economy towards year-end, as the post-lockdown bounce in activity wanes.”
-
14:02
EUR/USD Price Analysis: Further weakness not ruled out near term
- EUR/USD extends the corrective downside to the mid-0.9500s.
- A deeper move could see the 2022 low at 0.9535 revisited.
EUR/USD faces extra selling pressure and breaks below the 0.9800 mark to drop to the 0.9750 region on Monday.
Odds for extra weakness in the European currency remain well in store so far, with the immediate target at the 2022 low at 0.9535 (September 28). The loss of the latter should pave the way for a visit to the round level at 0.9500 prior to the weekly low at 0.9411 (June 17 2002).
In the longer run, the pair’s bearish view should remain unaltered while below the 200-day SMA at 1.0645.
EUR/USD daily chart
-
14:00
Singapore Purchasing Managers Index: 49.9 (September) vs previous 50
-
14:00
S&P 500 Index to stage a sustained move lower towards 3235/3195 – Credit Suisse
S&P 500 has closed at a new low for the year. Analysts at Credit Suisse stay bearish for a conclusive break below the 200-week average for a fall to 3505/3494 and then 3235/3195.
Initial resistance seen at 3646
“With volume rising as the market falls we maintain our core negative outlook and we look for a clear and closing break below the 200-week average, currently at 3589, with support then seen next at the Q1 2020 pre-pandemic high and 50% retracement of the 2020/2021 uptrend at 3505/3494.”
“Our core objective remains the 3235/3195 support cluster, which includes the 38.2% retracement of the uptrend from the 2009 low.”
“Resistance is seen at 3646 initially, with 3671 ideally capping to keep the immediate risk lower. We shall though maintain an immediate tactical negative stance whilst below 3737/58.”
-
13:56
USD/IDR: Risks remain tilted to the upside – UOB
FX Strategist at UOB Group’s Global Economics & Markets Research Quek Ser Leang does not rule out further strength in USD/IDR in the near term.
Key Quotes
“Last Monday (26 Sep, spot at 15,120), we held the view that USD/IDR ‘appears to be on track for further gains’. We indicated, ‘The next resistance is at 15,150 followed by 15,200’. We underestimated USD/IDR strength as it surged to 15,273 last Thursday. Upward momentum remains strong and the risk for USD/IDR is still on the upside.”
“However, in view of the overbought conditions, any advance is unlikely to break clearly above 15,350. The rising trend-line support at 15,150 is a solid support level for this week.”
-
13:44
EUR/GBP drops to over one-week low, bears flirt with 0.8700 mark
- EUR/GBP turns lower for the fifth straight day and drops to over a one-week low on Monday.
- UK government withdraws tax cut plan, which boosts sterling and exerts pressure on the cross.
- Recession fears, modest USD strength weighs on the euro and contributes to the offered tone.
The EUR/GBP cross attracts fresh selling following an early uptick to the 0.8830 region and turns lower for the fifth successive day on Monday. Spot prices drop to over a one-week low during the mid-European session, with bears now awaiting sustained weakness below the 0.8700 round-figure mark.
UK Finance minister Kwasi Kwarteng takes a U-turn on Monday and confirms that his government will not go ahead with a plan to cut the top rate of income tax from 45%. This, in turn, is seen as a key factor behind the British pound's relative outperformance against its European counterpart and exerting downward pressure on the EUR/GBP cross.
The shared currency, on the other hand, is undermined by speculation of a potential recession in the region amid the risk of a further escalation in the Russia-Ukraine conflict. This, along with a modest US dollar strength, weighs on the euro and contributes to the offered tone surrounding the EUR/GBP cross, supporting prospects for further losses.
That said, a bleak outlook for the UK economy might hold back the GBP bulls from placing aggressive bets and lend some support to the EUR/GBP cross, at least for the time being. Nevertheless, spot prices have retreated over 500 pips from a two-year high, around the 0.9235 region touched in September and seem vulnerable to prolonging the descending trend.
Technical levels to watch
-
13:09
EUR/USD to remain glued into the lower half of September’s 0.95-1.02 range – SocGen
The US economy dictates EUR/USD prospects. Therefore, the EUR/USD is unlikely to race higher as the American economy continues to outperform the eurozone, Kit Juckes, Chief Global FX Strategist at Société Générale, reports.
It is hard to see the euro staging much of a rally
“The US has been outperforming the eurozone since mid-2021, and that outperformance has been accompanied by a rising dollar. It shows no signs of abating.”
“We’ll see what this afternoon’s US ISM data throws out (the consensus looks for a fall from 53.8 to 52.4), but if the US economy continues to outperform (in both manufacturing and services ISMs, and in the payroll report at the end of the week), then it’s hard to see the euro staging much of a rally.”
“Easier to see it mostly glued into the lower half of September’s EUR/USD 0.95-1.02 range.”
-
13:00
South Africa Total New Vehicle Sales dipped from previous 47420 to 47.786 in September
-
13:00
South Africa Total New Vehicle Sales declined to 48 in September from previous 47420
-
12:59
WTI rises to $83 as OPEC+ reportedly discusses in excess of 1 million bpd
Crude oil prices surged higher during the European trading hours on Monday and the barrel of West Texas Intermediate (WTI) was last seen gaining more than 4% on a daily basis at around $83.
Earlier in the day, Reuters reported that the OPEC+ group was discussing a potential output reduction of more than 1 million barrels per day (bpd).
One of the sources told Reuters that the supply cut could be "as significant as the April 2020 meeting," when the group stepped in to rebalance the pandemic-hit oil market.
OPEC+ meeting will take place on Wednesday, October 5.
-
12:43
GBP/USD to give up gains despite UK withdraws cut to higher rate tax – BBH
The GBP/USD pair has traded as high as 1.1280 at the start of a new week. But sterling gains from the reversal on the top tax rate are fleet, according to economists at BBH report.
The bulk of the fiscal plan remains intact
“The elimination of the top income tax rate was reversed but we see limited upside as the bulk of the fiscal plan remains intact.”
“With policymaking credibility in tatters, we look for an eventual test of last week’s new all-time low near 1.0350.”
-
12:31
Chile IMACEC registered at 0% above expectations (-1.2%) in August
-
12:25
US: Hiking into the second recession – Rabobank
With the Atlanta Fed’s GDPNow-cast for Q3 at 2.4% (as of September 30), the US economy may be coming out of the technical recession that started in Q1. But in the view of economists at Rabobank, the Fed’s Volcker-esque hiking cycle and the inverted yield curve point to an NBER-approved recession next year.
The probability of the second recession is 70%
“After the technical recession in the first half of this year, the Fed’s Volcker-esque hiking cycle and the inverted yield curve point to an official recession next year. Both recessions are linked to negative supply shocks, elevated inflation, and the Fed’s policy response.”
“The current inversion of the yield curve indicates that the probability of the second recession is 70%.”
-
12:22
USD Index Price Analysis: Initial support emerges around 111.50
- DXY adds to Friday’s recovery attempt and advances past 112.00.
- Bulls continue to target the 2022 peak near 114.80 near term.
DXY extends the ongoing bull run to the 112.50 zone at the beginning of the week.
The index retreated from recent extreme overbought levels and seems to have met some decent contention near 111.50 so far. If the recovery picks up extra pace the index could see the 2022 high at 114.77 (September 28) revisited in the short-term horizon.
The prospects for extra gains in the dollar should remain unchanged as long as the index trades above the 7-month support line near 107.20.
In the longer run, DXY is expected to maintain its constructive stance while above the 200-day SMA at 102.53.
DXY daily chart
-
12:15
USD/MYR could surpass the 4.6600 area near term – UOB
Further upside remains in the pipeline for USD/MYR, suggests FX Strategist at UOB Group’s Global Economics & Markets Research Quek Ser Leang.
Key Quotes
“We highlighted last Monday (26 Sep, spot at 4.5960) that USD ‘a break of 4.6000 would not be surprising’ and we indicated that ‘The next resistance is at 4.6200, followed by 4.6500’. USD/MYR subsequently soared to a high of 4.6450. While conditions are overbought, there is room for the advance in USD/MYR to extend to 4.6610 before a pullback is likely.”
“On the downside, a breach of the rising trend-line support at 4.6120 (minor support is at 4.6280) would indicate the current upward pressure has subsided.”
-
12:11
EUR/JPY Price Analysis: Next on the upside comes 144.00
- EUR/JPY adds to the recent rebound and surpasses 142.00.
- Further upside could see the 144.00 region revisited.
EUR/JPY maintains the bullish bias and reclaims the area beyond the 142.00 barrier at the beginning of the week.
The continuation of the rebound from last week’s lows remains well in place for the time being. That said, the cross could therefore extend the bullish attempt to the weekly top at 144.04 (September 20), which is deemed as the last defense for a move to the 2022 peak at 145.63 (September 12).
In the meantime, while above the key 200-day SMA at 135.90, the constructive outlook for the cross should remain unchanged.
EUR/JPY daily chart
-
11:58
Silver Price Analysis: XAG/USD retests descending trend-line hurdle, around mid-$19.00s
- Silver prolongs its upward trajectory and climbs to over a one-week high on Monday.
- Bulls still seem to struggle to make it through a multi-month-old descending trend line.
- Sustained break below the $18.35 area will expose the YTD low touched in September.
Silver builds on last week's bounce from sub-$18.00 levels and gains some follow-through traction for the second successive day on Monday. This also marks the fourth day of a positive move in the previous five and lifts the white metal to over a one-week high, around mid-$19.00s during the early part of the European session.
Bulls, however, still seem to struggle to make it through a downward sloping trend-line extending from May swing high. The said barrier, around the $19.50 region, should now act as a pivotal point, which if cleared decisively will set the stage for additional gains and allow the XAG/USD to aim to reclaim the $20.00 psychological mark.
The latter coincides with the 100-day SMA, above which the XAG/USD could accelerate the move towards the $20.50 intermediate resistance en route to the $21.00 round-figure mark. Some follow-through buying should pave the way for an extension of the momentum towards the next relevant hurdle near the $21.50-$21.55 horizontal zone.
On the flip side, the $19.00 mark could act as immediate support ahead of the $18.85-$18.80 zone and the $18.35 area. Failure to defend the said support levels will shift the bias in favour of bears and make the XAG/USD vulnerable to breaking below the $18.00 mark and test the YTD low, around the $17.55 region touched in September.
Silver daily chart
-638003905734497963.png)
Key levels to watch
-
11:45
GBP/USD: Bulls to dominate the action as long as 1.1130 stays intact
GBP/USD clings to modest daily gains near 1.1200. Bulls are expected to remain interested as long as 1.1130 holds, FXStreet’s Eren Sengezer reports.
Key near-term support aligns at 1.1130
“On the upside, the 100-period SMA forms immediate resistance at 1.1240 ahead of 1.1300 (Fibonacci 61.8% retracement of the latest downtrend). In case buyers managed to flip the latter into support, additional gains toward 1.1450 (200-period SMA) could be witnessed.”
“Supports are located at 1.1130 (Fibonacci 50% retracement), 1.1100 (psychological level) and 1.1000 (Fibonacci 38.2% retracement, 50-period SMA, psychological level).”
-
11:17
USD/BRL: Break above 5.62/66 to open up further gains – SocGen
USD/BRL has successfully defended the bullish gap near 5.01 recently, resulting in a steady bounce. 5.62/5.66 is expected to be an important resistance, economists at Société Générale report.
Risk of deeper pullback on a dip below 5.01
“The pair is now approaching the July high of 5.51 and more importantly heading towards the descending trend line drawn since 2020 at 5.62/5.66. This is expected to be an important resistance; cross above can result in next leg of uptrend.”
“Only if USD/BRL establishes itself below 5.01, there could be a risk of a deeper pullback.”
-
11:10
USD/CHF retakes 0.9900 mark amid modest pickup in USD demand, ahead of US ISM PMI
- USD/CHF turns positive for the second straight day and draws support from a combination of factors.
- Aggressive Fed rate hike bets continue to underpin the USD and remain supportive of the move up.
- A positive risk tone dents demand for the safe-haven CHF and provide an additional lift to the major.
The USD/CHF pair attracts fresh buying near the 0.9830 region on Monday and turns positive for the second successive day. The intraday move up picks up the pace and lifts spot prices back above the 0.9900 mark, or a three-day high during the first half of the European session.
Following an early dip, the US dollar catches fresh bids on the first day of a new week and allows the USD/CHF pair to capitalize on Friday's strong rally of nearly 150 pips from the 0.9730 area. Apart from this, a modest recovery in the global risk sentiment - as depicted by a positive tone around the US equity futures - undermines the safe-haven Swiss franc and provides an additional lift to the major.
The USD uptick, meanwhile, seems unaffected by a softer tone surrounding the US Treasury bond yields and continues to take cues from expectations that the Fed will stick to its aggressive rate hiking cycle. In fact, the markets have been pricing in another supersized 75 bps Fed rate increase in November. This, in turn, should act as a tailwind for the US bond yields and favours the USD bulls.
Market participants now look forward to the US economic docket, featuring the ISM Manufacturing PMI for a fresh impetus later during the early North American session. The focus, however, will be on Friday's release of the US monthly jobs report, popularly known as NFP. Nevertheless, the USD/CHF pair seems poised to climb further towards the 0.9945-0.9950 supply zone, or a multi-month high set in September.
Technical levels to watch
-
11:06
GBP/USD still seen at 1.04 despite UK policy U-turn – Rabobank
GBP/USD is higher after the UK government is expected to roll back the proposed scrapping of the higher rate of income tax. Still, the pound remains a very vulnerable currency, according to economists at Rabobank.
The pound is far from out of the woods
“The cost to the Exchequer of scrapping of the top tax rate would have been in the region of GBP2 bln, which is modest part of the GBP45 bln package that was announced on September 23.”
“It remains the case that the gilt market is being supported by the BoE’s extraordinary intervention. This is scheduled to end on October 14 and will leave the market exposed to the weight of extra gilt issuance during the coming fiscal year. In addition, the Bank is still planning to go ahead and start QT at the end of this month, though there is widespread speculation that this will not happen.”
“We still retain a three-to six-month target for cable at GBP/USD 1.04.”
-
11:03
USD/THB: Near-term top in place? – UOB
FX Strategist at UOB Group’s Global Economics & Markets Research Quek Ser Leang hints at the likelihood that USD/THB could have peaked in recent sessions.
Key Quotes
“Last Monday (26 Sep, spot at 37.85), we highlighted that USD/THB ‘is likely to rally further’. We added, ‘A break of 38.00 seems likely and will shift the focus to 38.25’. While our expectation of further USD gains was correct, we did not anticipate the volatile price action that saw USD rise to 38.46 before plummeting sharply to take out rising trend-line support last Friday.”
“The breach of the trend-line support suggests that USD/THB has likely peaked for the time being. The current price movement is likely the early stages of a consolidation phase and USD is expected to trade between 37.30 and 38.30 for this week.”
-
10:38
USD/JPY: Poised to test the 150 level – Credit Suisse
Japan’s FX intervention has slowed yen weakness. But economists at Credit Suisse expect USD/JPY to test 150.00 if the Bank of Japan (BoJ) stands pat at its October meeting.
Waiting for BoJ to “do the right thing”
“Japan’s latest strategy of using unilateral FX intervention to defend JPY, despite the BoJ’s monetary policy driving its weakness, marks the first time since the 90s that it has tried this approach. The odds of it delivering lasting success seem low.”
“Governor Kuroda continues to insist on sustainable wage gains before changing tack. But movements in Japanese swap spreads and curve shapes point to a market getting tired of waiting. Kuroda needs to get lucky and somehow see a sustained decline in US yields for pressure on USD/JPY to surge past 150 to ease.”
-
10:26
GBP/JPY pares intraday gains to over one-week high, still well-bid around mid-162.00s
- GBP/JPY gains traction for the fifth straight day and climbs to over a one-week high.
- UK government withdraws plan to scrap higher tax rate and boosts the British pound.
- Dovish BoJ continues to undermine the JPY and supports prospects for further gains.
The GBP/JPY cross builds on last week's strong recovery from its lowest level since February 2021 and scales higher for the fifth successive day on Monday. Spot prices, however, trim a part of the intraday gains to over a one-week high and retreat to mid-162.00s during the first half of the European session.
UK Finance Minister Kwasi Kwarteng confirmed that his government will not go ahead with a plan to scrap a 45% rate of income tax. This helps ease concerns about the UK's ballooning public debt and provides a goodish lift to the British pound. Apart from this, the prevalent selling bias around the Japanese yen acts as a tailwind for the GBP/JPY cross.
Bulls, however, struggle to capitalize on the move or find acceptance above the 100-day SMA. Despite an upward revision of the UK Q2 GDP print, a bleak economic outlook turns out to be a key factor acting as a headwind for sterling. This, in turn, fails to assist the GBP/JPY cross to capitalize on the move up and attracts some sellers near the 163.30 area.
Furthermore, Japan's finance minister Shunichi Suzuki said on Monday that the government stands ready to intervene in currency markets to prevent deeper losses in the domestic currency. This, along with the prevalent cautious market mood, might continue to offer some support to the safe-haven JPY and cap any meaningful gains for the GBP/JPY cross.
That said, a big divergence in the monetary policy stance adopted by the Bank of Japan and other major central banks should keep a lid on the JPY. This, in turn, favours bullish traders and supports prospects for a further appreciating move for the GBP/JPY cross. Hence, any meaningful downfall could still be seen as a buying opportunity and remain limited.
Technical levels to watch
-
10:26
USD/CNH: Consolidation could extend further – UOB
USD/CNH would likely keep the 7.0500-7.2200 range unchanged for the time being, comment FX Strategists at UOB Group Lee Sue Ann and Quek Ser Leang.
Key Quotes
24-hour view: “We expected USD to ‘traded between 7.0800 and 7.1500’ last Friday. USD subsequently dropped to 7.0731 and rebounded to 7.1417 before closing at 7.1407 (+0.59%). The price movement is likely part of a consolidation phase and we expect USD to trade within a range of 7.1050/7.1700 for today.”
Next 1-3 weeks: “There is no change in our view from last Friday (30 Sep, spot at 7.1000). As highlighted, the recent USD rally has topped out for now. The current movement is likely the early stages of a consolidation phase. In view of the recent high volatility, USD could trade within a broad range of 7.0500/7.2200 for a period of time.”
-
10:19
Gold Price Forecast: XAU/USD likely to extend range play around $1,660 – Confluence Detector
- Gold price is turning south once again after facing rejection at higher levels.
- The metal is defending gains amid a broadly weaker US dollar, risk-aversion.
- XAU/USD battle lines are well-defined around $1,660 ahead of key US events.
Gold price is moving back and forth in a familiar range above $1,650, as the investors refrain from placing any directional bets amid rife geopolitical tensions concerning Russia and Ukraine, aggressive Fed rate hike bets and surging oil prices. Meanwhile, the US dollar is trading choppy but slightly on the downside, limiting the downside in the bullion. The UK tax policy U-turn put a sudden bid under GBP/USD, inducing fresh weakness in the dollar while helping the metal defend mild gains. Attention turns towards the US ISM Manufacturing PMI after the euro area and the UK S&P Global final Manufacturing PMIs failed to impress the market. The main event risk this week, however, remains the US Nonfarm Payrolls data due for release this Friday.
Also read: Gold Price Forecast: XAU/USD could see selling resurgence near $1,680
Gold Price: Key levels to watch
The Technical Confluence Detector shows that the gold price is looking to challenge the $1,660 support area, where the previous day’s low, Fibonacci 38.2% one-month and Fibonacci 23.6% one-week coincide.
The SMA10 one-day at $1,657 will be seen as the next stop for sellers. Further down, the confluence of the SMA50 four-hour and Fibonacci 38.2% one-week around $1,654 could be tested.
The pivot point one-day S2 and SMA100 one-hour meeting point at $1,650 will be the line in the sand for buyers.
On the flip side, the Fibonacci 38.2% one-day at $1,665 offers immediate resistance to bulls, above which a run towards the $1,670 level cannot be ruled out. That level is the convergence of the Fibonacci 61.8% one-day and the pivot point one-day R1.
The previous day’s high of $1,675 will be next on the buyers’ radar, followed by the previous year’s low at $1,677.
Here is how it looks on the tool

About Technical Confluences Detector
The TCD (Technical Confluences Detector) is a tool to locate and point out those price levels where there is a congestion of indicators, moving averages, Fibonacci levels, Pivot Points, etc. If you are a short-term trader, you will find entry points for counter-trend strategies and hunt a few points at a time. If you are a medium-to-long-term trader, this tool will allow you to know in advance the price levels where a medium-to-long-term trend may stop and rest, where to unwind positions, or where to increase your position size.
-
10:14
EUR/USD to enjoy additional gains if 0.9850 resistance fails
EUR/USD has gone into a consolidation phase above 0.9800. The pair needs to clear 0.9850 resistance to continue to stretch higher, FXStreet’s Eren Sengezer reports.
Euro needs to clear 0.9850 to extend recovery
“On the upside, the Fibonacci 61.8% retracement of the latest downtrend forms initial resistance at 0.9850 ahead of 0.9875 (100-period SMA). With a four-hour close above the latter, the pair could target 0.9925 (200-period SMA) next.”
“0.9800 (psychological level, Fibonacci 50% retracement) aligns as first support before 0.9750 (Fibonacci 38.2% retracement, 50-period SMA) and 0.9700 (psychological level).”
-
10:12
USD Index treads water around the 112.00 zone
- The index alternates gains with losses at the beginning of the week.
- The risk complex resumes the upside with GBP as outperformer.
- ISM Manufacturing, Fedspeak next on tap in the NA session.
The greenback, in terms of the USD Index (DXY), starts the week on an inconclusive fashion around the 112.00 neighbourhood.
USD Index focuses on data, risk trends
The index lacks of clear direction and puts the 112.00 mark to the test on Monday following the continuation of the improvement in the risk-associated universe.
The downtick in the dollar comes pari passu with receding yields on both sides of the Atlantic, although still navigating within a consolidative mood in the upper end of the recent range.
In the US data space, the ISM Manufacturing will take centre stage seconded by Construction Spending and the final S&P Global Manufacturing PMI.
In addition, Atlanta Fed R.Bostic (2024 voter, hawk), Richmond Fed T.Barkin (2024 voter, centrist) and Kansas City Fed E.George (voter, hawk) are also due to speak later in the session.
What to look for around USD
The index starts the week under some mild pressure near the 112.00 zone.
Propping up the dollar’s underlying positive stance appears the firmer conviction of the Federal Reserve to keep hiking rates until inflation looks well under control regardless of a likely slowdown in the economic activity and some loss of momentum in the labour market.
Looking at the more macro scenario, the greenback also appears bolstered by the Fed’s divergence vs. most of its G10 peers in combination with bouts of geopolitical effervescence and occasional re-emergence of risk aversion.
Key events in the US this week: Final Manufacturing PMI, Construction Spending, ISM Manufacturing (Monday) – Factory Orders (Tuesday) – MBA Mortgage Applications, ADP Employment Change, Balance of Trade, Final Services PMI, ISM Non-Manufacturing (Wednesday) – Initial Jobless Claims (Thursday) – Nonfarm Payrolls, Unemployment Rate, Consumer Credit Change, Wholesale Inventories (Friday).
Eminent issues on the back boiler: Hard/soft/softish? landing of the US economy. Prospects for further rate hikes by the Federal Reserve vs. speculation of a recession in the next months. Geopolitical effervescence vs. Russia and China. US-China persistent trade conflict.
USD Index relevant levels
Now, the index is up 0.01% at 112.18 and a breakout of 114.76 (2022 high September 28) would expose 115.00 (round level) and then 115.32 (May 2002 high). On the downside, the next contention aligns at 109.35 (weekly low September 20) seconded by 107.68 (monthly low September 13) and finally 107.58 (weekly low August 26).
-
10:08
USD/ZAR to trade comfortably within a 17.60-18.60 range – Credit Suisse
USD/ZAR rallied recently to a new year-to-date high. For now, economists at Credit Suisse expect repatriation flows to keep the pair fairly stable in the 17.60-18.60 range.
Rising carry and still elevated commodity prices to mitigate weakness in the rand
“We raise our short-term target range for USD/ZAR to 17.60-18.60 (from 17.00-18.00).”
“For now, the weakness in the rand is likely to be mitigated by factors such as rising carry and still elevated commodity prices. Additionally, we see scope for meaningful repatriation flows following the large rally in USD/ZAR in recent months.”
-
10:00
FX option expiries for Oct 3 NY cut
FX option expiries for Oct 3 NY cut at 10:00 Eastern Time, via DTCC, can be found below.
- EUR/USD: EUR amounts
- 0.9600 250m
- 0.9645-50 510m
- 0.9675-80 400m
- 0.9740 200m
- 0.9760 254m
- USD/JPY: USD amounts
- 142.50 579m
- 145.00 405m
- USD/CHF: USD amounts
- 0.9880 230m
- 0.9900-05 630m
- AUD/USD: AUD amounts
- 0.6570 306m
- 0.6640 358m
- EUR/CHF: EUR amounts
- 0.9650 570m
-
09:49
EUR/HUF to decline towards 395 in the medium-term – Credit Suisse
Forint’s carry appeal has become hard to ignore. Analysts at Credit Suisse now target 395 in EUR/HUF over the medium-term.
EUR/HUF still exposed to the upside in the short-term
“We turned medium-term bullish on the forint in the middle of September on the back of sizeable carry and cheap valuations by historical REER standards. We also see scope for Hungary to unlock the EU funds from the 2021-2027 budget (which are currently frozen) later in Q4.”
“We set an end-quarter target of 395 for EUR/HUF. But in the short-run, the risk that Hungary will see a cut to its EU funds allocation as well as a possible escalation in the Russia/Ukraine conflict, will keep implied volatility abnormally high and EUR/HUF exposed to the upside.”
-
09:43
USD/CAD remains depressed near mid-1.3700s amid rising oil prices, modest USD weakness
- A combination of factors prompts some selling around USD/CAD on Monday.
- Bullish oil prices underpin the loonie and exert pressure amid a softer USD.
- Sliding US bond yields, a positive risk tone seems to weigh on the greenback.
The USD/CAD pair kicks off the new week on a downbeat note and erodes a part of Friday's strong gains to its highest level since May 2020. The pair maintains its offered tone through the early European session and is currently trading around the 1.3755 region, just a few pips above the daily low.
Reports that OPEC+ will consider an output cut of 1.5 million bpd (or more) - the biggest since the COVID-19 pandemic - at its meeting on Wednesday lifts crude oil prices to over a one-week high. This, in turn, underpins the commodity-linked loonie and exerts downward pressure on the USD/CAD pair amid a softer tone surrounding the US Treasury bond yields.
In fact, the USD Index - which measures the greenback's performance against a basket of currencies - languishes near a one-week low touched on Friday and is pressured by a combination of factors. The US Treasury bond yields retreat further from over a multi-year high touched last week, which along with a positive risk tone, weighs on the safe-haven buck.
That said, the Federal Reserve’s commitment to getting inflation under control and expectations for a more aggressive policy tightening should act as a tailwind for the greenback. The markets have been pricing in the possibility of another supersized 75 bps Fed rate hike move at the November meeting. This, in turn, favours the USD bulls.
Furthermore, investors remain worried that a deeper global economic downturn will dent the fuel demand. This could keep a lid on any meaningful upside for crude oil prices. The fundamental backdrop suggests that the path of least resistance for the USD/CAD pair is to the upside and supports prospects for the emergence of fresh buying at lower levels.
Market participants now look to the US economic docket, featuring the release of ISM Manufacturing PMI, due later during the early North American session. This, along with the US bond yields and the broader risk sentiment, will drive the USD demand. Traders will further take cues from oil price dynamics to grab short-term opportunities around the USD/CAD pair.
Technical levels to watch
-
09:33
EUR/USD: Current bounce to stall at 0.9850/9870 – ING
EUR/USD is holding its gains from last week. Analysts at ING expect the 0.9850/9870 area to cap any rally.
EUR/USD poised to retest 0.95 this month
“News that OPEC+ wants to increase oil prices will not be welcomed across the region. Equally weekend reports suggest that what little remains of Russian gas exports to Europe may dwindle as well – e.g. Italy. As in the UK, the focus in the eurozone is also shifting to the size of fiscal support packages and whether local bond markets can easily digest them.”
“One could argue that intervention (both FX from Asian authorities and in the bond market from UK authorities) is delivering this pause in the dollar's bull trend. But the macro factors which are driving it to remain firmly in place and 0.9850/9870 could prove the limit to the current EUR/USD bounce. Favour a retest of 0.95 in October.”
-
09:30
United Kingdom S&P Global/CIPS Manufacturing PMI below forecasts (48.5) in September: Actual (48.4)
-
09:15
EUR/CHF set to move towards 0.9000 – Credit Suisse
Economists at Credit Suisse see upside risks to the current markets’ Swiss National Bank (SNB) policy rate pricing. Thus, EUR/CHF is set to move downward.
Upside risks to the SNB’s policy rate
“We lowered our end of Q4 EUR/CHF target from 0.9400 to 0.9000 and consider this view invalidated above 0.9955 (down from 1.0060 previously). The risks to this view are that the SNB will significantly fall behind the ECB’s rate hiking cycle and a decline in inflation rates abroad.”
“We expect the SNB to continue its rate hiking cycle and see upside risk to the current markets’ policy rate profile. The SNB currently forecasts inflation of 3.0% for 2022, 2.4% for 2023 and 1.7% for 2024. Based on these projections, we believe the real policy rate is not in restrictive territory yet.”
-
09:06
AUD/USD sticks to gains near mid-0.6400s, lacks follow-through ahead of RBA on Tuesday
- AUD/USD regains some positive traction on Monday and snaps a two-day losing streak.
- A combination of factors keeps the USD bulls on the defensive and offers some support.
- Traders look forward to the US ISM PMI for some impetus ahead of the RBA on Tuesday.
The AUD/USD pair attracts some buying near the 0.6400 mark on Monday and maintains its bid tone through the early European session. The pair, for now, seems to have snapped a two-day losing streak and is currently trading around mid-0.6400s, up 0.70% for the day.
A combination of factors exerts some downward pressure on the US dollar, which, in turn, offers some support to the AUD/USD pair. UK Finance Minister Kwasi Kwarteng confirmed that his government will not go ahead with a plan to scrap a 45% rate of income tax and provides a modest lift to the British pound. This, along with declining US Treasury bond yields, keeps the USD bulls on the defensive.
In fact, the benchmark 10-year US Treasury note moves away from a 12-year high touched last Wednesday. Apart from this, signs of stability in the financial markets - as depicted by a positive tone around the US equity markets - further undermine the safe-haven greenback and benefit the risk-sensitive aussie. That said, the lack of follow-through selling warrants caution for aggressive bulls.
Traders now seem reluctant and might prefer to move to the sidelines ahead of the key Reserve Bank of Australia policy decision on Tuesday. In the meantime, growing acceptance that the Federal Reserve will continue to hike interest rates at a faster pace should act as a tailwind for the US bond yields and limit the downside for the USD. This, in turn, could cap the upside for the AUD/USD pair.
Hence, it will be prudent to wait for strong follow-through buying before positioning for any further near-term appreciating move. Market participants now look forward to the US ISM Manufacturing PMI, due later during the early North American session. This, along with the US bond yields and the broader risk sentiment, will influence the USD and provide some impetus to the AUD/USD pair.
Technical levels to watch
-
09:01
Greece S&P Global Manufacturing PMI up to 49.7 in September from previous 48.8
-
09:01
European Monetary Union S&P Global Manufacturing PMI below forecasts (48.5) in September: Actual (48.4)
-
08:55
Germany S&P Global/BME Manufacturing PMI came in at 47.8, below expectations (48.3) in September
-
08:51
France S&P Global Manufacturing PMI below expectations (47.8) in September: Actual (47.7)
-
08:45
Italy S&P Global Manufacturing PMI came in at 48.3, above forecasts (47.5) in September
-
08:45
GBP/USD to see a new trading range of 1.1000-1.1350 – ING
The pound has reversed back to pre 'fiscal event' levels on news of a policy U-turn. Economists at ING expect GBP/USD to settle in a 1.1000-1.1350 range.
EUR/GBP may find support under 0.8700
“Liz Truss's government will formally reverse its planned abolishment of the 45% income tax bracket. We feel this move is rather symbolic, being less about the amount of money it will save (low billions) and more about the poor signal it had delivered of ideological (unfunded) tax cuts.”
“Cable has returned to levels seen just before Chancellor Kwasi Kwarteng delivered the infamous 'fiscal event' and it would now be hard to argue that cable should be trading much higher than that. But this does alleviate the risk of cable trading to parity in that it shows Downing Street will show greater respect to financial markets when considering policy options.”
“Maybe we see a new cable trading range of something like 1.1000-1.1350.”
“EUR/GBP may find support under 0.8700 now.”
-
08:30
Switzerland SVME - Purchasing Managers' Index registered at 57.1 above expectations (54.6) in September
-
08:28
GBP/USD retreats from over one-week high, up a little around 1.1200 mark
- GBP/USD climbs to over one-week high as the UK withdraws plan to scrap higher tax rate.
- The UK’s bleak economic outlook acts as a headwind for the sterling and caps the upside.
- Aggressive Fed rate hike bets continue to underpin the USD and prompt intraday selling.
The GBP/USD pair fades an intraday bullish spike and retreats nearly 100 pips from the 1.1280 area, or over a one-week high touched earlier this Monday.
The British pound gets a lift after UK Finance Minister Kwasi Kwarteng confirmed that his government will not go ahead with a plan to scrap a 45% rate of income tax. This, in turn, helps ease the concerns about the UK's ballooning public debt and allows the GBP/USD pair to build on last week's recovery move from an all-time low.
The positive momentum, however, runs out of steam near the 1.1280 region amid a bleak outlook for the UK economy. This, along with the underlying bullish sentiment surrounding the US dollar, further contributes to capping the GBP/USD pair. This, in turn, warrants some caution before positioning for any further intraday appreciating move.
The markets seem convinced that the Federal Reserve will stick to its aggressive rate hiking cycle to curb inflation and have been pricing in another supersized 75 bps increase in November. This continues to lend some support to the USD, though a combination of factors is holding back traders from placing aggressive bullish bets.
The US Treasury bond yields are prolonging their recent pullback from over a multi-year high touched last week. Apart from this, signs of stability in the financial markets - as depicted by a positive tone around the US equity markets - further contribute to keeping a lid on the safe-haven greenback, at least for the time being.
Hence, it will be prudent to wait for strong follow-through buying before confirming that the GBP/USD pair has formed a near-term bottom. There isn't any major market moving data due for release from the UK, while the US economic docket features the ISM Manufacturing PMI. This, along with the US bond yields and the broader risk sentiment, might influence the USD.
Technical levels to watch
-
08:19
Russia S&P Global Manufacturing PMI up to 52 in September from previous 51.7
-
08:16
Spain S&P Global Manufacturing PMI came in at 49, below expectations (49.3) in September
-
08:12
Austria Unemployment Rate fell from previous 5.9% to 5.7% in September
-
08:12
Austria Unemployment down to 237.4K in September from previous 249K
-
08:11
Netherlands, The Markit Manufacturing PMI down to 49 in September from previous 52.6
-
08:03
France Budget in line with expectations (€0B) in August
-
08:03
Gold Price Forecast: XAU/USD vulnerable so long as it holds below 21 DMA at $1,679
Gold price sees a temporary reprieve at the start of the week. XAU/USD could see selling resurgence near $1,680, FXStreet’s Dhwani Mehta reports.
Risks remain skewed to the downside for gold while below 21-DMA
“After last week’s recovery rally, XAU/USD needs a daily close above the bearish 21-Daily Moving Average (DMA) at $1,679. However, the $1,670 round number and Friday’s high of $1,675 will need clearance first.”
“On the downside, the $1,660 level offers strong support to buyers, which if breached will accentuate the bearish pressures towards the September 29 low of $1,642.”
-
08:01
Turkey Producer Price Index (MoM) up to 4.78% in September from previous 2.41%
-
08:01
Turkey Producer Price Index (YoY) increased to 151.5% in September from previous 143.75%
-
08:01
Turkey Consumer Price Index (MoM) came in at 3.08% below forecasts (3.8%) in September
-
08:01
Turkey Consumer Price Index (YoY) registered at 83.45%, below expectations (84.63%) in September
-
07:50
Forex Today: Eyes on UK politics, global PMIs in another volatile start to the week
Here is what you need to know on Monday, October 3:
Markets stayed relatively quiet during the Asian trading hours on Monday but volatility picked up in the early European morning. Political developments in the UK are watched closely by market participants ahead of S&P Global's final September PMIs for Germany, the euro area, the UK and Canada. The US economic docket will feature the ISM September Manufacturing PMI later in the day. Several FOMC policymakers, including Kansas City Fed President Esther George and New York Fed President John Williams, will also be delivering speeches in the second half of the day.
After having registered modest gains on Friday, the US Dollar Index turned south and broke below 112.00. US Stock index futures are trading mixed in the European session and the benchmark 10-year US Treasury bond yield loses over 1% below 3.8%.
During the Asian trading hours, the data from Japan showed that the Tankan Large Manufacturing Index declined to 8 in Q3, missing the market expectation of 11. On a positive note, the Non-Manufacturing Index edged higher to 14 in the same period from 13. Meanwhile, Japanese Finance Minister Shunichi Suzuki reiterated that they continue to watch FX moves with a strong sense of urgency. USD/JPY showed no reaction to Suzuki's comments or the data releases and it was last seen moving sideways slightly below 115.00.
GBP/USD gathered bullish momentum and jumped to its highest level in over a week near 1.1300. Reports suggesting that the UK government is expected to roll back the proposed scrapping of the higher rate of income tax helped the British pound gather strength. British Finance Minister Kwasi Kwarteng confirmed these reports by announcing that the government will not go ahead with a plan to scrap a 45% rate of income tax. Following the initial bullish reaction, the pair returned to the 1.1200 area, where it was up around 0.3% on the day.
EUR/USD is having a difficult time making a decisive move in either direction and trading in a narrow range near 0.9800.
Gold snapped a two-week losing streak on Friday and edged higher toward $1,670 early Monday. Although XAU/USD returned to the $1,660 area in the European morning, it managed to hold its ground amid retreating US Treasury bond yields.
Bitcoin closed in negative territory on Saturday and Sunday but found support near $19,000. Ethereum fell nearly 4% over the weekend and dropped below $1,300 before staging a rebound early Monday. ETH/USD was last seen rising 1% on the day at $1,290.
-
07:50
USD/CNH set to reach the 7.35 level – Credit Suisse
In China, the deteriorating outlook for exports adds to the outstanding woes of poor local demand. Economists at Credit Suisse expect USD/CNH to hit the 7.35 mark.
CFETS Index should weaken more as exports decline
“We think exports and the CFETS Index will weaken due to low US/Europe demand. As such, we re-entered long USD/CNH with a target of 7.35, and forecast a wider trading range of 7.00-7.45 for Q4.”
“For the 20th Communist Party Congress, we expect the new cabinet to continue avoiding ‘floodstyle’ stimulus. Similarly, lifting covid restrictions will only be done gradually, in 2023 at the earliest.”
“We expect President Xi’s policies of covid restrictions and ‘housing is for living, not for speculating’ to continue. That means consumption and investment activity will likely remain weak in Q4.”
-
07:46
Gold Price Forecast: XAU/USD reverses intraday uptick, flat-lines below $1,665 level
- Gold struggles to preserve its modest gains despite softer US bond yields, the USD.
- Bets for more aggressive Fed rate hikes continue to act as a headwind for the metal.
- The downside seems cushioned as investors await this week’s key US macro releases.
Gold gains positive traction on the first day of a new week and hits a fresh daily high, around the $1,670 area during the early European session. The uptick, however, meets with a fresh supply at higher levels, with spot prices sliding back below the $1,665 level in the last hour.
A combination of factors exerts some downward pressure on the US dollar, which, in turn, offers some support to the dollar-denominated gold. Reports that the UK government is expected to roll back the proposed scrapping of the higher rate of income tax provides a goodish lift to the British pound. This, along with a further decline in the US Treasury bond yields, continues to undermine the greenback.
In fact, the benchmark 10-year US Treasury note moves away from a 12-year high touched last Wednesday. Apart from this, concerns about a deeper global economic downturn and geopolitical risks provide a modest lift to the safe-haven XAU/USD. That said, the prospects for a more aggressive policy tightening by major central banks, including the Fed, should cap the non-yielding yellow metal.
Investors seem convinced that the US central bank will continue to hike interest rates at a faster pace to curb inflation and have been pricing in another supersized 75 bps increase in November. The bets were reaffirmed by the recent hawkish remarks by several FOMC officials and Friday's release of the US Personal Consumption Expenditures (PCE) data. This, in turn, warrants some caution for bulls.
Traders might also refrain from placing fresh directional bets and prefer to move on the sidelines ahead of important US macro data scheduled at the beginning of a new month. A rather busy week kicks off with the release of the US ISM Manufacturing PMI on Monday. This, along with speeches by FOMC members and the US bond yields, will drive the USD demand and provide some impetus to gold.
The focus, however, remains on the closely-watched US monthly employment details on Friday. The popularly known NFP report will play a key role in influencing Fed rate hike expectations and the USD price dynamics. This, in turn, should help investors to determine the next leg of a directional move for gold.
Technical levels to watch
-
07:37
AUD/USD to suffer further losses towards 0.62 – Credit Suisse
AUD/USD touched a new two-year low just under 0.64 on Friday. Economists at Credit Suisse expect the pair to extend its decline towards 0.62.
Aussie unable to benefit from commodities boon
“We remain bearish on AUD, despite the seemingly obvious appeal of a sharp increase in Australian terms of trade. We now target 0.6200 and see AUD/USD trading in a 0.6100-0.6750 range in Q4.”
“Despite Australia’s status as a major energy and metals exporter, AUD is still unlikely to see proportional gains from higher global prices of commodities, as export revenues are increasingly recycled into dividend and interest payments to foreign owners of local mining assets.”
“Reduced trade with China, due to soft local demand and ongoing diplomatic tension between the two countries, adds to the disconnect between commodities prices and AUD.”
-
07:36
UK’s Kwarteng: Will not go ahead with plan to scrap 45% income tax rate
UK Finance Minister Kwasi Kwarteng confirmed earlier reports, noting that his government will not go ahead with a plan to scrap a 45% rate of income tax.
Additional quotes
Our growth plan is a strong package.
The 45p rate was drowning out a strong package of intervention.
Along with PM, I decided best course was not to proceed with abolishing 45p rate.
Asked if he has considered resigning, he said, not at all.
We are focussed on getting away from a high tax route.
It has become clear the abolition of the 45p rate is a distraction from our mission to tackle the challenges facing the country.
We get it, we listened.
This will allow us to focus on delivering the major parts of our growth package.
It was an ambitious plan.
We have made lots of tough decisions.
Our medium term plan is going to come out towards the end of November.
I am very pleased we have decided not to proceed with scrapping the 45p tax rate.
I take responsibility for it.
Market reaction
GBP/USD has given away a part of the latest gains on Kwarteng’s confirmation, currently trading at 1.1200, still up 0.35% on the day.
-
07:33
EUR/NOK and EUR/SEK to target 10.70 and 11.30, respectively – Credit Suisse
Scandinavian FX remain exposed to mixed central bank messages and Russia-related geopolitical risks –analysts at Credit Suisse target EUR/NOK at 10.70 and EUR/SEK at 11.30 by the end of Q4.
Norges Bank has surprised dovish, even compared to the Riksbank and its mixed message
“On 22 Sep, Norges Bank left the terminal rate estimate unchanged at around 3%, right as markets instead pushed yields higher in the rest of G10. This projected monetary policy divergence, especially vs an increasingly hawkish ECB, creates fresh EUR/NOK upside risk. We now target 10.70 and see the pair in a 10.00-10.90 range in Q4.”
“Markets are now expecting the ECB to beat the Riksbank to the punch by tightening at a faster pace, even with the latter expected to reach a higher terminal rate down the line. SEK will underperform further if the message stays mixed. We now target 11.30 in EUR/SEK.”
-
07:31
Sweden Purchasing Managers Index Manufacturing (MoM) fell from previous 50.6 to 49.2 in September
-
07:30
Switzerland Consumer Price Index (YoY) below forecasts (3.5%) in September: Actual (3.3%)
-
07:30
Switzerland Consumer Price Index (MoM) below expectations (0.1%) in September: Actual (-0.2%)
-
07:17
EUR/USD remains in a downtrend with levels as low as 0.9200 possible – Credit Suisse
The euro is trending lower against the US dollar. Economists at Credit Suisse expect the EUR/USD pair to decline towards the 0.92 area.
Selling on rallies to 1.0000
“EUR/USD remains in a downtrend with levels as low as 0.9200 possible if fiscal difficulties pick up or Russia-related energy difficulties worsen. But with near-term short-covering possible, we favour selling on rallies to 1.0000 and above within a 0.9200-1.0200 expected Q4 range, assuming that corrections can extend by at least 4% from each new low based on recent precedents.”
“The market is very conscious of the risks of a deep euro area recession and the possibility of major hits to both consumer spending and industrial production. Fiscal outlays will need to fill many gaps.”
-
07:17
Crude Oil Futures: Further decline in the pipeline
According to CME Group’s flash data for crude oil futures markets, traders added nearly 8K contracts to their open interest positions on Friday after four consecutive daily drops. On the flip side, volume shrank for the second straight day, now by more than 77K contracts.
WTI appears supported near $76.00
Prices of the WTI dropped for the second consecutive session on Friday. The move was amidst increasing open interest and opens the door to the continuation of the corrective downside in the very near term. The strong drop in volume, however, could allow for occasional bouts of strength. So far, the commodity remains supported by the $76.00 region per barrel.
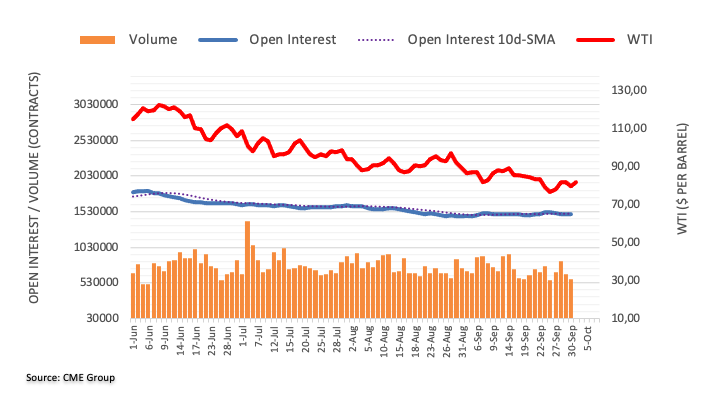
-
07:05
USD/JPY clings to the consolidative theme near term – UOB
According to FX Strategists at UOB Group Lee Sue Ann and Quek Ser Leang, USD/JPY is forecast to keep the 143.50-145.60 range in the next few weeks.
Key Quotes
24-hour view: “We highlighted last Friday that USD “is likely to trade sideways between 144.00 and 145.00”. Our view for sideway-trading was not wrong even though USD traded within a narrower range than expected (144.18/144.82). Further sideway-trading would not be surprising but in view of the slightly firmed underlying tone, USD is likely to trade within a higher range of 144.30/145.20.”
Next 1-3 weeks: “Our latest narrative was from last Tuesday (27 Sep, spot at 144.30) where we highlighted that upward momentum is beginning to build but USD has to close above 145.00 before a sustained advance is likely. USD has been trading sideways the past few days and the build-up in momentum has faded. The current movement is likely part of a consolidation phase and USD is likely to trade between 143.50 and 145.60.”
-
07:03
Gold Price Forecast: XAU/USD could gather bullish momentum if it manages to clear $1,680
Gold price is higher on the day at the start of a new week. XAU/USD eyes $1,700 as next recovery target, FXStreet’s Eren Sengezer reports.
Daily close below $1,650 could be seen as a significant bearish development
“Gold faces immediate resistance at $1,680, where the 20-day SMA is located. In case the yellow metal rises above that level and starts using it as support, it could target $1,690 (Fibonacci 38.2% retracement of the latest downtrend) and $1,700 (psychological level).”
“On the downside, $1,665 (Fibonacci 23.6% retracement) aligns as first support before $1,650 (static level). A daily close below the latter could be seen as a significant bearish development and cause XAU/USD to decline toward the end-point of the downtrend at $1,620.”
-
06:59
USD/JPY retreats from over one-week high, slides back below 145.00 mark
- A combination of factors fails to assist USD/JPY to capitalize on early gains to over a one-week top.
- Fears of intervention by the Japanese government extend support to the JPY and caps the pair.
- A softer tone around the US bond yields undermines the USD and attracts sellers at higher levels.
The USD/JPY pair trims a part of its modest intraday gains to over a one-week high and quickly retreats to sub-145.00 levels during the early European session.
Japan's finance minister Shunichi Suzuki said on Monday that the government stands ready to intervene in currency markets to prevent deeper losses in the domestic currency. This, along with the prevalent cautious market mood, offers some support to the safe-haven Japanese yen and caps the upside for the USD/JPY pair.
Bearish traders further take cues from a softer tone surrounding the US Treasury bond yields, which fails to assist the US dollar to capitalize on its early positive move. This further exerts some pressure on the USD/JPY pair, though a combination of factors should help limit any meaningful slide, at least for the time being.
A big divergence in the monetary policy stance adopted by the Bank of Japan and other major central banks might continue to weigh on the JPY. It is worth mentioning that the BoJ has been lagging behind other major central banks in the process of policy normalisation and remains committed to continuing with its monetary easing.
In contrast, the US central bank is expected to stick to its aggressive policy tightening path to curb high inflation. In fact, the markets have been pricing in the possibility of another supersized 75 bps Fed rate hike move in November. This, in turn, is likely to act as a tailwind for the US bond yields and the greenback.
The fundamental backdrop suggests that the path of least resistance for the USD/JPY pair is to the upside and any meaningful slide might still be seen as a buying opportunity. That said, traders might prefer to wait for the release of key US macro releases scheduled at the beginning of a new month, including the NFP report.
A rather busy week kicks off with the release of the US ISM Manufacturing PMI, due later during the early North American session. This, along with the US bond yields, will influence the USD price dynamics. Apart from this, the broader market risk sentiment should provide some meaningful impetus to the USD/JPY pair.
Technical levels to watch
-
06:54
Breaking: GBP/USD jumps beyond 1.1200 as UK to reverse cut to higher rate tax
BBC News reported on Monday that the UK government is expected to roll back the proposed scrapping of the higher rate of income tax that has sparked a backlash in the ruling Conservative Party.
No further details are provided on the same.
Market reaction
On the above headlines, the pound caught a fresh bid and jumped above 1.1200 against the US dollar. At the time of writing, GBP/USD is adding 0.84% on the day at 1.1252.
-
06:42
Gold Futures: Further consolidation likely
Open interest in gold futures markets dropped for the second session in a row on Friday, this time by around 21.3K contracts, the largest single-day drop since March 10. Volume followed suit and shrank by around 32.8K contracts, adding to the previous daily drop.
Gold: Next on the upside comes $1,688
Friday’s inconclusive price action in gold was on the back of shrinking open interest and volume, exposing further side-lined trading in the very near term. Extra gains, in the meantime, should initially target the weekly high at $1,688 per ounce troy (September 21).
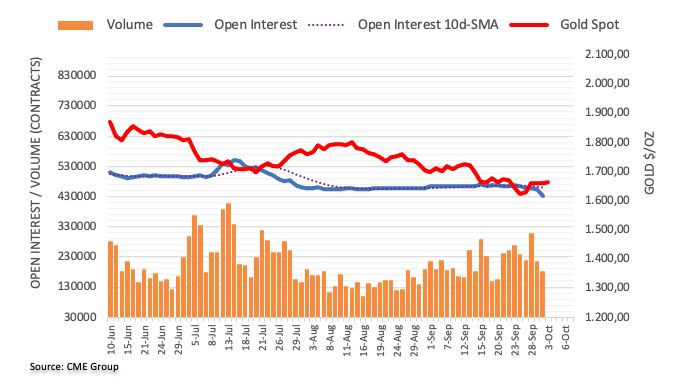
-
06:35
AUD/USD: Sustained decline seen below 0.6360 – UOB
In the opinion of FX Strategists at UOB Group Lee Sue Ann and Quek Ser Leang, further losses in AUD/USD need to break below the 0.6360 level.
Key Quotes
24-hour view: “The sharp drop in AUD to a low of 0.6390 came as a surprise (we were expecting range-trading). The decline appears to be overdone and AUD is unlikely to weaken further. For today, AUD is more likely to trade between 0.6380 and 0.6480.”
Next 1-3 weeks: “After AUD rebounded strongly from 0.6364, we highlighted last Thursday (29 Sep, spot at 0.6490) that downward momentum is beginning to wane and this coupled with the strong bounce suggests the weakness in AUD could stabilize soon. We added, ‘only a break of 0.6555 would indicate AUD is unlikely to weaken further’. While AUD subsequently dropped to 0.6390 on Friday, downward momentum has not improved much. However, the risk for AUD is still on the downside but it has to break below 0.6360 first before further sustained decline is likely. Resistance wise, a breach of 0.6510 (‘strong resistance’ level previously at 0.6555) would indicate that the weakness in AUD that started more than 2 weeks ago has stabilized. Looking ahead, the next support below 0.6360 is at 0.6330.”
-
06:31
EUR/USD corrects lower and breaches 0.9800
- EUR/USD sheds some ground and drops below 0.9800.
- The greenback appears slightly bid at the beginning of the week.
- Eurogroup meeting, final Manufacturing PMIs next on tap in the region.
EUR/USD starts the week on the defensive in the sub-0.9800 region following the tepid bid bias surrounding the greenback.
EUR/USD appears capped around 0.9850, looks to data
EUR/USD adds to Friday’s small downtick and slips back below the 0.9800 support at the end of the Asian trading hours on Monday.
The move lower in the pair comes in tandem with the upbeat sentiment around the dollar, which in turn looks accompanied by a mild downside bias in US yields across the curve. In the same line, the German 10-year bund yields retreat for the third session in a row so far.
In the euro docket, final Manufacturing PMIs are due along with the Eurogroup meeting. Across the pond, the final Manufacturing PMI will precede the key ISM Manufacturing PMI, Construction Spending and speeches by FOMC’s Bostic, Barkin and George.
What to look for around EUR
EUR/USD’s recovery from fresh cycle lows near 0.9350 has so far met a firm resistance area in the mid-0.9800s.
In the meantime, price action around the European currency is expected to closely follow dollar dynamics, geopolitical concerns and the Fed-ECB divergence. The latter has been exacerbated further following the latest rate hike by the Fed and the persevering hawkish message from Powell and the rest of his rate-setters peers.
Furthermore, the increasing speculation of a potential recession in the region - which looks propped up by dwindling sentiment gauges as well as an incipient slowdown in some fundamentals – adds to the sour sentiment around the euro
Key events in the euro area this week: Eurogroup Meeting, Germany, EMU Final Manufacturing PMI (Monday) – ECB Lagarde (Tuesday) – Germany Balance of Trade, EMU, Germany Final Services PMI (Wednesday) – Germany Construction PMI, EMU Retail Sales, ECB Accounts (Thursday) – Germany Retail Sales (Friday).
Eminent issues on the back boiler: Continuation of the ECB hiking cycle. Italian post-elections developments. Fragmentation risks amidst the ECB’s normalization of its monetary conditions. Impact of the war in Ukraine and the persistent energy crunch on the region’s growth prospects and inflation outlook.
EUR/USD levels to watch
So far, the pair is retreating 0.05% at 0.9795 and faces the next support at 0.9535 (2022 low September 28) ahead of 0.9411 (weekly low June 17 2002) and finally 0.9386 (weekly low June 10 2002). On the flip side, the breakout of 0.9853 (weekly high September 30) would target 1.0050 (weekly high September 20) en route to 1.0197 (monthly high September 12).
-
06:10
WTI consolidates gains above $81 amid bets of OPEC+ output cuts, Saudi price hike
Following the $1.50 bullish opening gap, WTI has entered a phase of upside consolidation just above the $81 mark, as investors digest the reports of sharp output cuts by OPEC and its allies when they meet on October 5.
Various media reported cited that the OPEC+ is considering slashing production by more than 1 million barrels a day but the alliance delegates said a final decision on the size of the cuts won’t be made until Wednesday.
Further, Reuters reported that Saudi Arabia is considering raising prices for most crude grades it sells to Asia in November, as the world’s top oil exporter expects demand to recover and Chinese refineries to increase output.
According to the median of the responses of five refining sources surveyed by Reuters, “the November official selling prices (OSP) for flagship Arab Light crude may rise by 25 cents a barrel.”
At the time of writing, the US oil is adding 2.20% on the day to trade at $81.18, having eased from the intraday highs of $81.71. The black gold has kicked off a fresh quarter on the right footing after losing 25% of its value last quarter.
On an hourly timeframe, WTI is defending gains above the flattish 50-Hourly Moving Average (HMA) located at $80.97. A sustained break below the latter will call for a retest of the next support levels around $80.50.
However, the Relative Strength Index (RSI) holds above the midline, suggesting that the further upside appears more compelling.
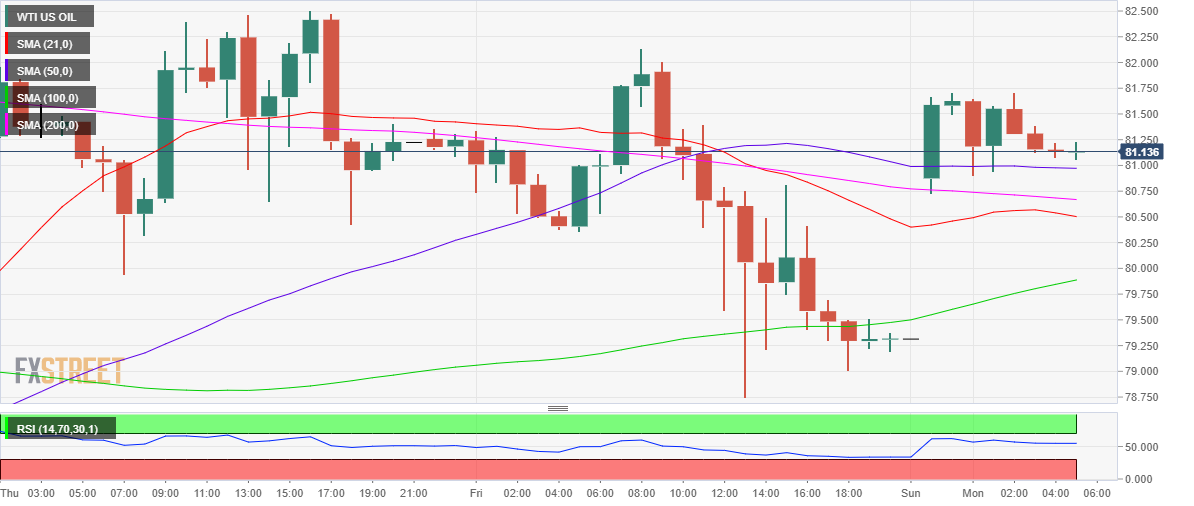
WTI: Hourly chart
-
06:01
GBP/USD: Further weakness appears unlikely – UOB
Further advance in GBP/USD remains on the cards, although a test of 1.1300 seems out of favour for the time being, note FX Strategists at UOB Group Lee Sue Ann and Quek Ser Leang.
Key Quotes
24-hour view: “We highlighted last Friday that GBP ‘could continue to rise but a sustained advance above 1.1300 is unlikely’. However, GBP plummeted from a high of 1.1235 to 1.1025 before rebounding to close at 1.1165 (+0.41%). Upward pressure has subsided and GBP is likely to trade sideways for today, likely between 1.1030 and 1.1230.”
Next 1-3 weeks: “We continue to hold the same view as from last Friday (30 Sep, spot at 1.1150) where the recent weakness in GBP has bottomed for now. While the strong rebound has scope to extend, the resistance at 1.1300 is unlikely to come under pressure. Overall, only a breach of 1.0800 (‘strong support’ level) would indicate that the rapid build-up in short-term momentum has eased.”
-
05:52
EUR/USD faces some near-term consolidation – UOB
EUR/USD is now seen navigating the 0.9630-0.9950 range in the next weeks, suggest FX Strategists at UOB Group Lee Sue Ann and Quek Ser Leang.
Key Quotes
24-hour view: “Last Friday, we held the view that EUR ‘is likely to advance to 0.9880 before a pullback is likely’. Our expectations did not materialize as EUR dropped from 0.9853 to 0.9733 before rebounding to close at 0.9799 (-0.15%). The price actions appear to be part of a consolidation and EUR is likely to trade between 0.9760 and 0.9860 for today.”
Next 1-3 weeks: “We continue to hold the same view as from last Friday (30 Sep, spot at 0.9825). As highlighted, the recent EUR weakness has stabilized and EUR is likely to consolidate and trade between 0.9630 and 0.9950 for now.”
-
05:45
EU to give capitals more say over debt-reduction plans – FT
Citing European Union (EU) officials, the Financial Times (FT) reported on Monday, “Brussels wants to give EU capitals extra time to curb their debts and create space for public investment as part of a major overhaul of the EU’s deficit rules.”
Additional takeaways
“The European Commission will table a proposal at the end of October to reform the Stability and Growth Pact, under which it would work out multiyear, country-specific plans with capitals for getting their debt burdens under control.”
“The idea is for member states to have greater ownership of their debt reduction plans, which they could fine-tune themselves more than they can do today.”
“But once countries agree their plans with both commission and council, they would need to be delivered and would be easier to enforce.”
“So it’s about balancing member state ownership with tighter enforcement.”
Market reaction
Ahead of the Euro Group meeting, EUR/USD is losing ground once again. The spot is trading at 0.9790, down 0.09% on the day.
-
05:41
Indonesia Core Inflation (YoY) below forecasts (3.6%) in September: Actual (3.21%)
-
05:30
Indonesia Inflation (YoY) registered at 5.95%, below expectations (6%) in September
-
05:30
Indonesia Inflation (MoM) came in at 1.17%, below expectations (1.26%) in September
-
05:20
RBA Preview: 50 bps is not a given, it could be just 25 bps – Scotiabank
Analysts at Scotiabank lean towards a 25 bps rate hike announcement from the Reserve Bank of Australia (RBA) on Tuesday, although the depreciation of the Australian dollar against the US dollar could press the RBA to deliver a 50 bps lift-off.
Key quotes
“Minutes to the September 6th meeting ... indicated that there was discussion around both a 25bps hike and the 50bps increase they opted for which fans the impression that there may be rising appetite for slowing the pace of hikes especially given the reference to how “They acknowledged that monetary policy operates with a lag and that interest rates had been increased quite quickly and were getting closer to normal settings.”
“A few days before the release of the minutes but after the meeting itself, Governor Lowe said he hoped that the cash rate would come to rest within a 2.5–3.5% rate with ‘a few’ more rate increases over coming meetings. This suggests that there is considerably more work to be done with the 2.35% current rate below the bottom of the range.”
“The fly in the ointment is that both developments preceded the Federal Reserve’s more aggressive actions on September 21st with much of the emphasis placed upon the more hawkish dot plot.“
“The Australian dollar has been among the casualties in the face of the US dollar’s broadly based strength and has shed another couple of cents since then along a long-term declining trend from about 76 cents in April to roughly 65 cents now. This development might suggest a more pressing need for a bigger 50bps hike given the implications of ongoing currency weakening for import price pressures.”
-
05:06
GBP/USD Price Analysis: Bears move in below counter trendline resistance, eye 1.1020 and 1.0900
- GBP/USD's confluence of resistance is playing into the nads of the bears at the start of the week.
- A break of the trendline support could be a key feature for the opening sessions.
The bears are emerging from a confluence of resistance on the long-term charts that is forcing the price out of last Wednesday's rally that petered out on Friday at around 1.1235. The following illustrates the prospects of a significant sell-off for the start of the week so long as the US dollar index can find support from a recovery in US yields.
DXY and 10-year yield analysis
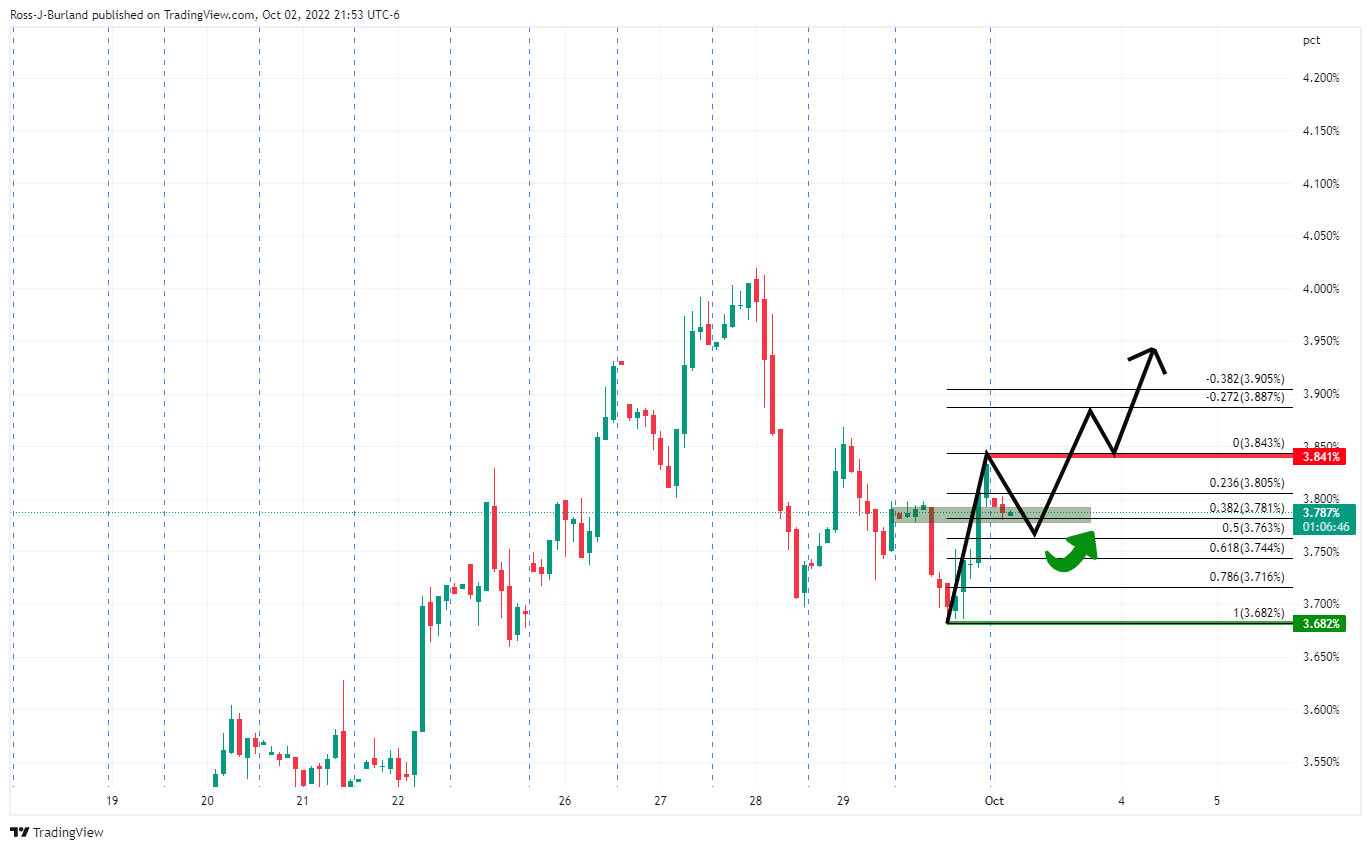
The 10-year yield which has taken a bit of a knock could be on the verge of a move up following the correction that has already started to decelerate into a 38.2% Fibonacci area of the prior bullish hourly leg. If this were to pan-out in the first sessions of the week, then that would bode well for the US dollar and the bearish thesis for GBP/USD.
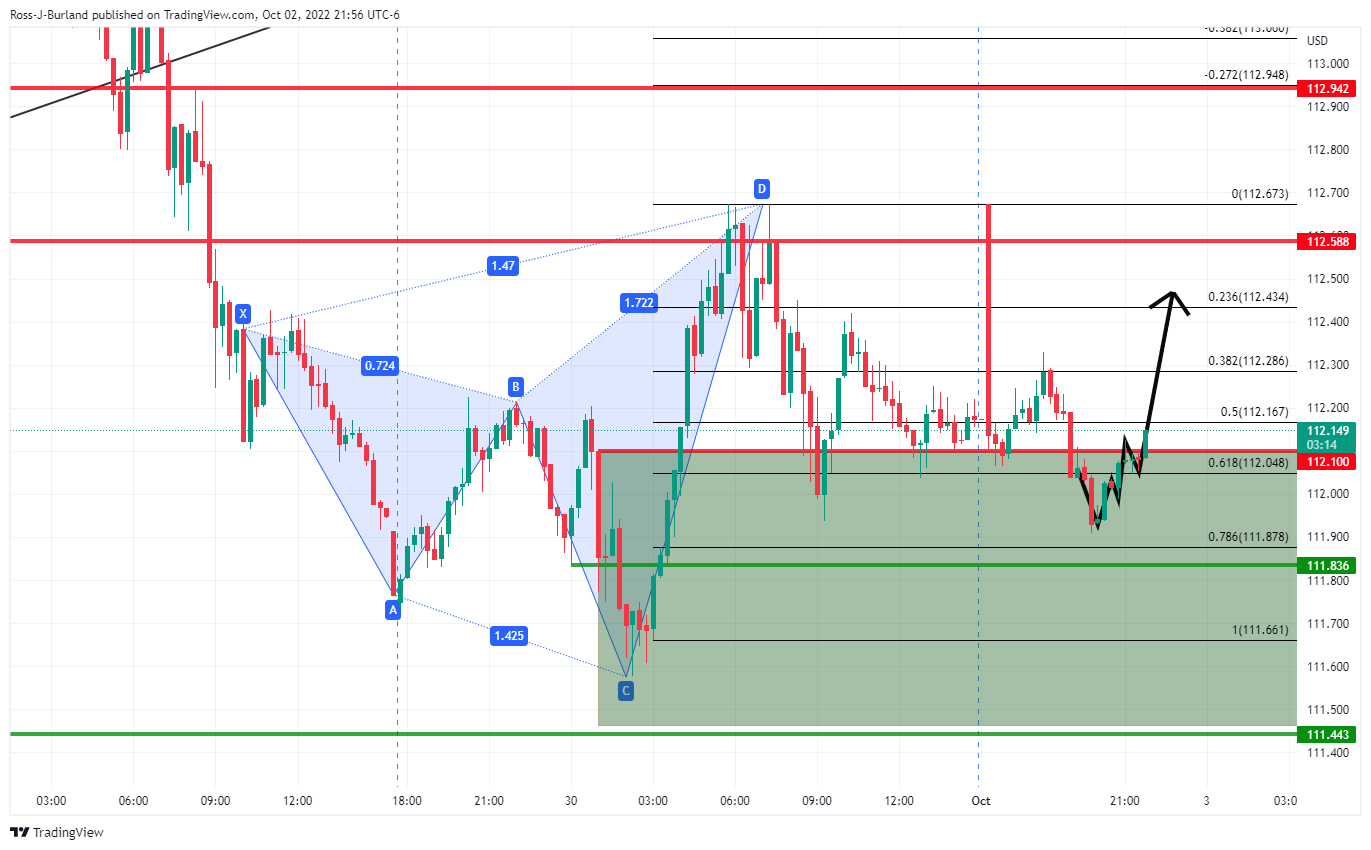
The DXY has formed a 15-min W-pattern and the price retested the neckline that subsequently acted as support, leading to the current bullish impulse that could find some legs into Frankfurt and beyond, solidifying the case for a blow-off to the downside in cable:
GBP/USD H1 chart
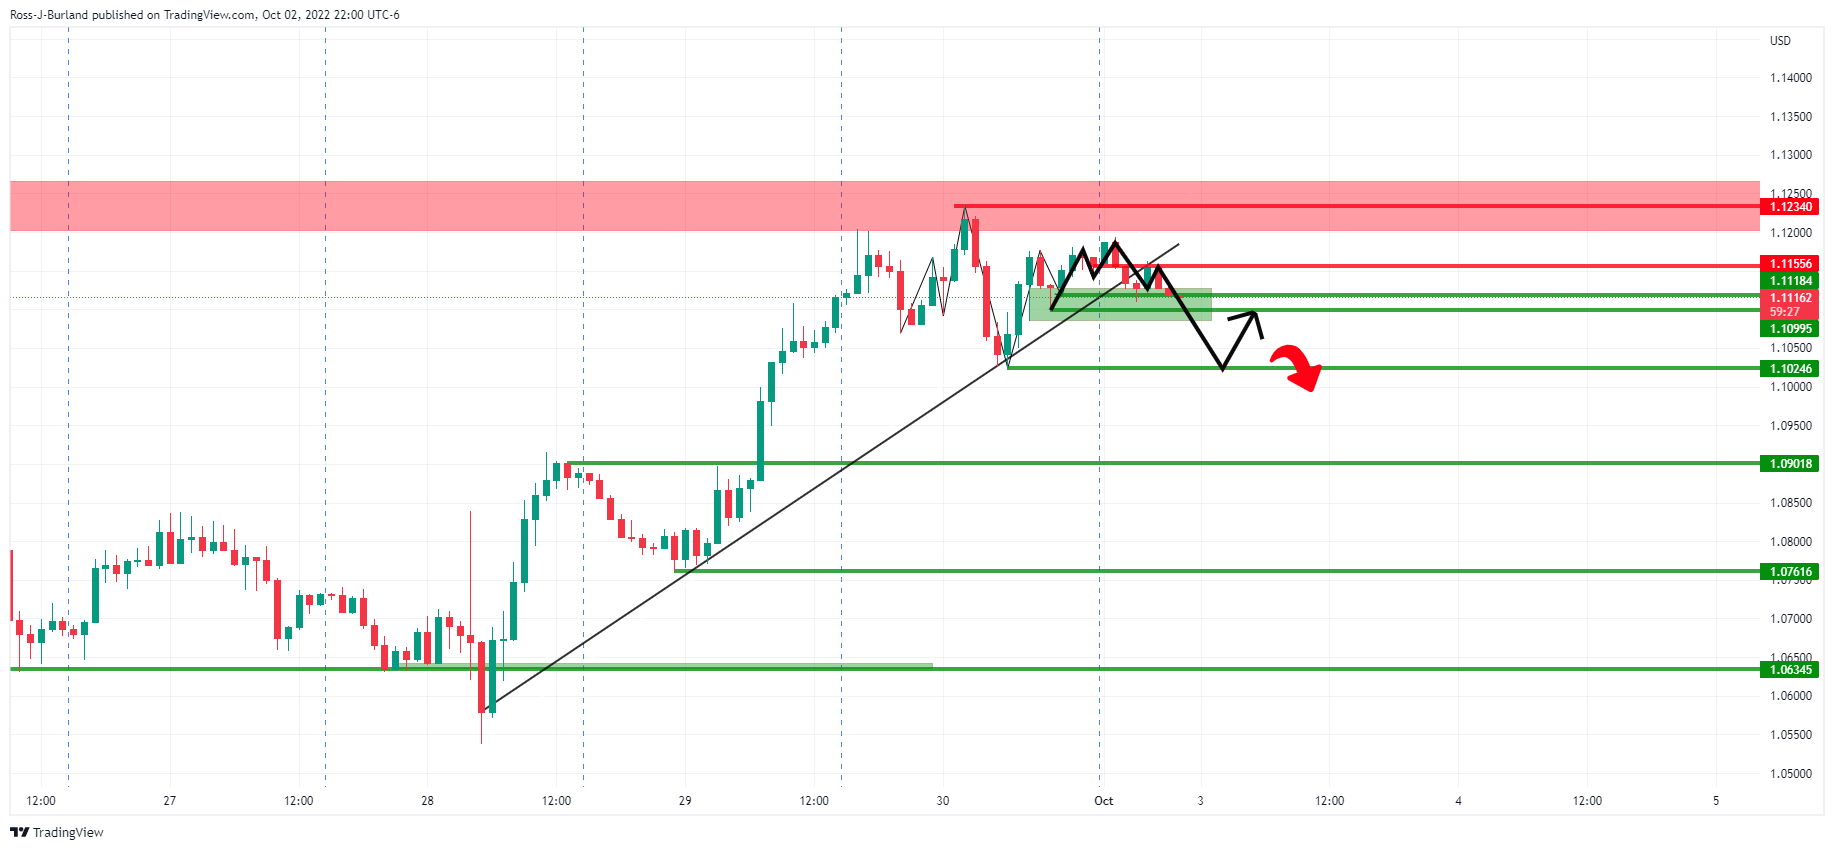
The price rose from Wednesday's lows of the week in three levels of rise across to Friday's high. This could lead to a sharp correction for the start of the week with a 1.0900 target on a break of 1.1020.
There is also a confluence of resistance on the weekly and daily charts as follows:
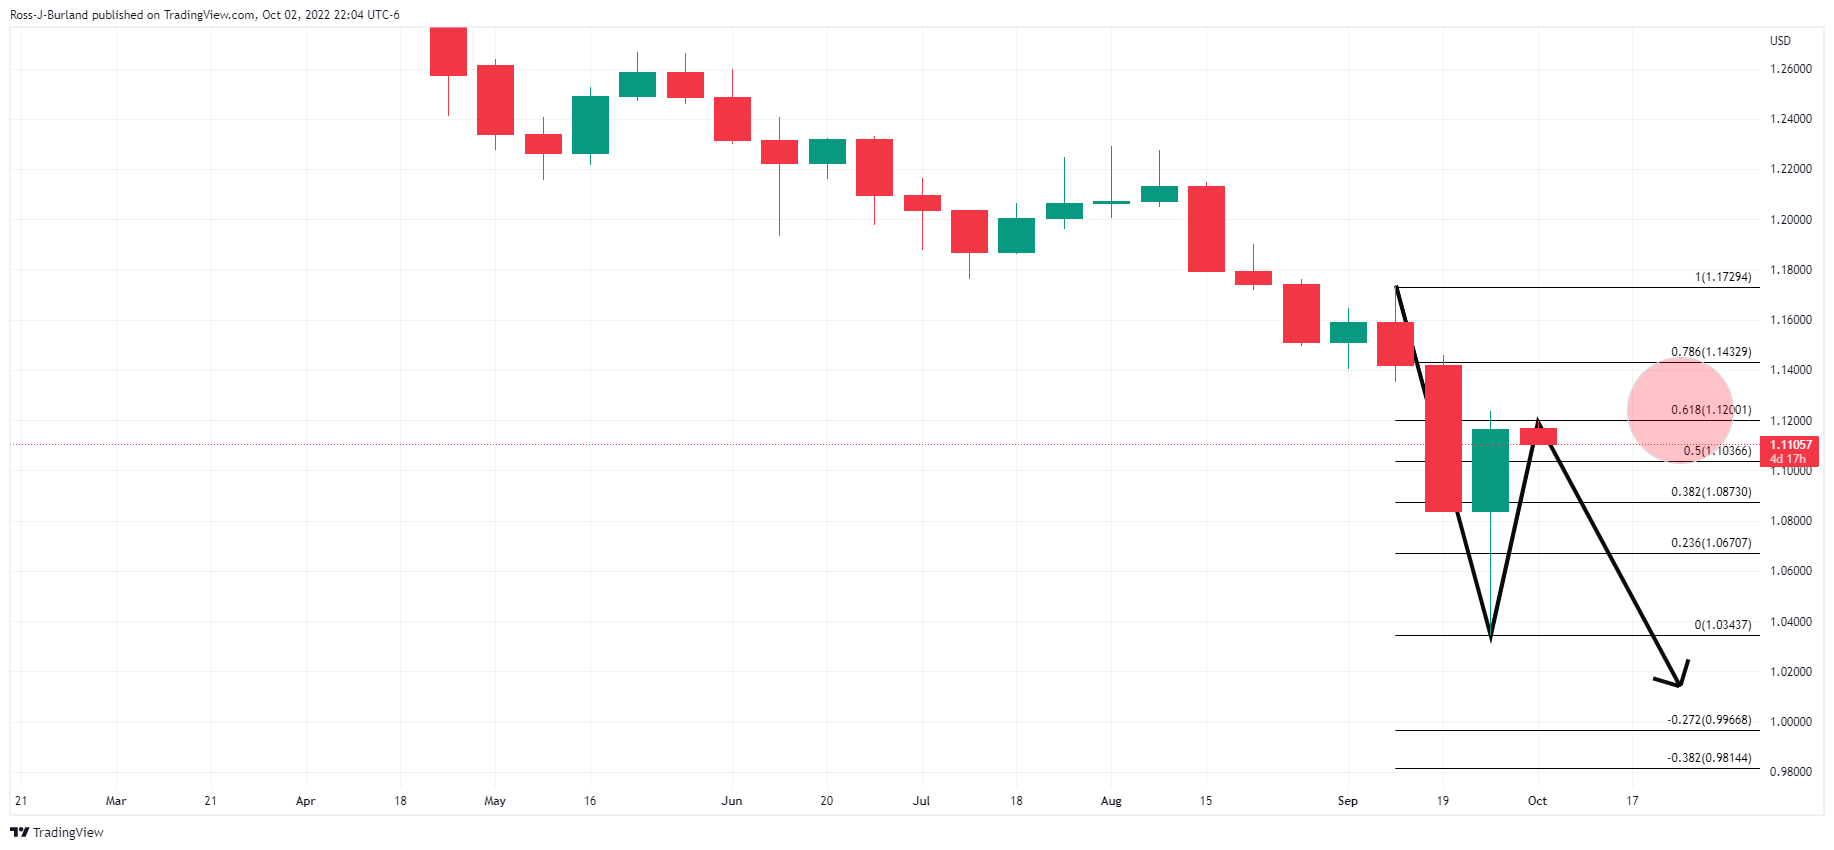
The confluence of the 78.6% and and 61.8% Fibonaccis are aligned at the same spot!
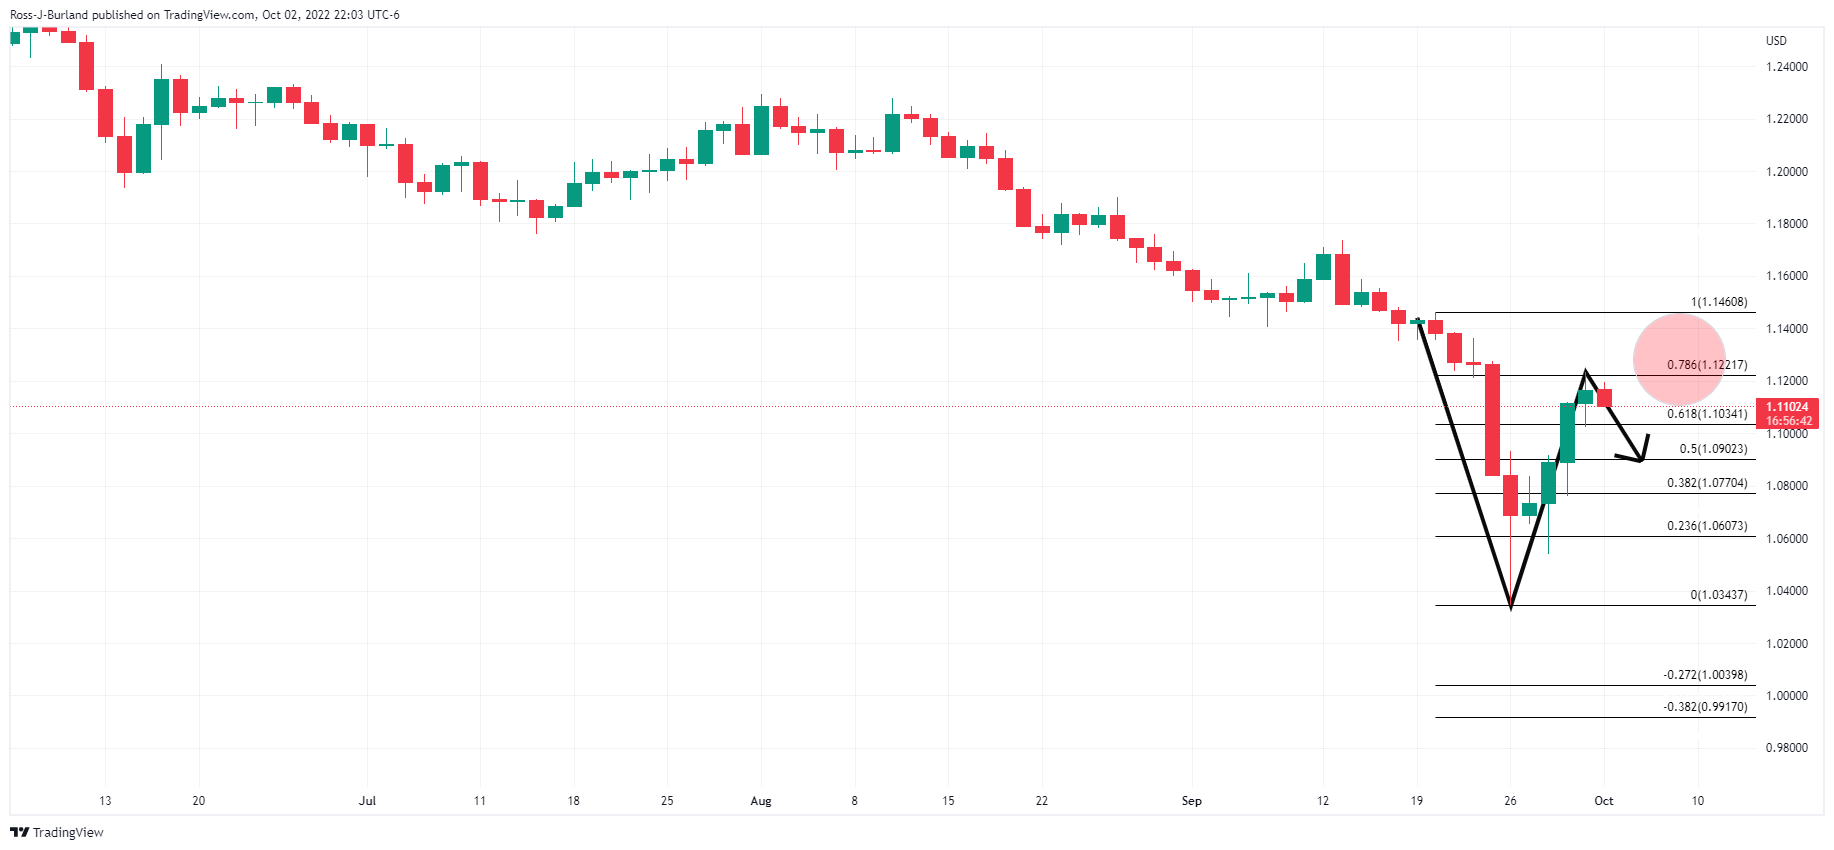
-
04:50
AUD/USD: Bulls face rejection near 0.6450 after pre-RBA bargain hunting
- AUD/USD firms up at the start of the week, with all eyes on Tuesday’s RBA.
- US dollar is finding fresh demand as Asia’s factory activity weakens.
- Further upside appears capped in the aussie amid risk-aversion.
AUD/USD is paring back gains towards 0.6400, having met fresh supply on a rejection near the 0.6450 psychological level. Bears are fighting back control, as the US dollar recovery is ganing traction amid strengthening risk-off flows in the late Asian session.
The aussie is adding 0.50% on the day, at the time of writing, underpinned by a short-covering rally. Investors resort to repositioning ahead of Tuesday’s RBA policy decision. The Australian central bank is widely expected to hike rates by 50 bps but a dovih surprise of 25 bps cannot be ruled out, as recession fears mount.
Despite the renewed upside, bulls have pulled back slightly over the last hours, as Asia’s factory activity weakens due to global slowdown and surging cost pressures, leaving investors on the edge. Further, falling commodities prices also add to the weight on the resource-linked aussie. Markets also remain cautious amid aggressive Fed tightening bets and ahead of the US payrolls data due for release this Friday.
more to come ...
-
04:11
EUR/USD holds recovery gains above 0.9800 amid light trading, ISM eyed
- EUR/USD pauses its rebound amid a renewed USD uptick and cautious mood.
- Treasury yields turn south, limiting the downside in the major.
- 21 DMA appears a tough nut to crack for EUR bulls amid holiday-thinned markets.
EUR/USD is clinging to recovery gains above 0.9800 so far this Monday, reversing the early dip to near 0.9785 region. The bulls lack follow-through upside bias after staging a decent comeback on Friday.
The US dollar is catching a fresh bid amid a souring market mood, as investors remain worried over aggressive Fed rate hikes, in the facing of growing recessionary fears worldwide. Also, markets look forward to the US ISM Manufacturing PMI releases amid holiday-thinned trading conditions, as China, Australia and Germany observe their respective national holidays on Monday.
Meanwhile, looming Russia-Ukraine tensions and the deepening European energy crisis continue to limit the upside attempts in the main currency pair. Last week, US President Joe Biden declared that a massive leak from the Nord Stream gas pipeline system in the Baltic Sea was an intentional act.
Although the downside in the pair remains cushioned by the renewed weakness in the US Treasury yields, as risk-off flows persist. The focus now shifts towards the Eurozone and US Manufacturing PMIs and Fedspeak for fresh trading impetus.
Meanwhile, the European Union (EU) Finance and Economy Ministers are set to meet in Luxembourg. The meeting is chaired by Paschal Donohoe, President of the Eurogroup. The ministers will discuss the macroeconomic situation in the euro area and seek to set priorities for the Recovery and Resilience Plans.
EUR/USD: Technical outlook
Looking at EUR/USD’s daily chart, sellers keep lurking at higher levels so long as the bearish 21-Daily Moving Average (DMA) at 0.9890 is taken out decisively.
Ahead of that, bulls need to seek acceptance above Friday’s high of 0.9853.
The 14-day Relative Strength Index (RSI) is trading flatlined below the 50.00 level, warranting caution for bulls.
EUR/USD: Daily chart
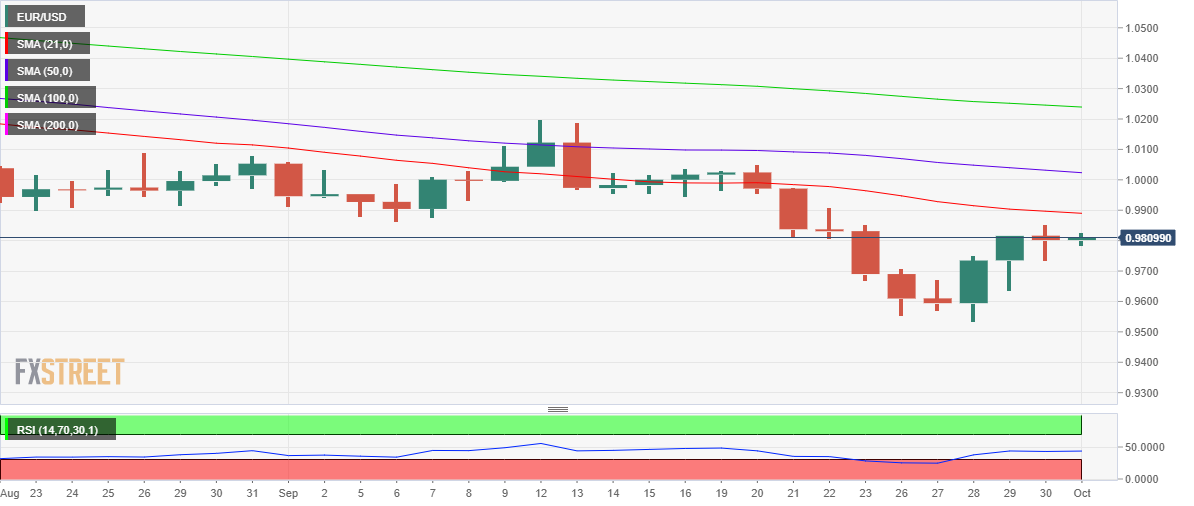
Therefore, failure to sustain the recovery mode will reopen the downside towards the 0.9800 support area.
Further down, Friday’s low of 0.9734 could come into play once again.
EUR/USD: Additional levels to consider
-
04:11
Gold Price Forecast: XAU/USD bears take out a key hourly trendline, risks of a deeper bearish correction
- Gold bears are moving in and taking out a potentially critical short-term trendline support.
- The week ahead will be focussed once again on the Fed in the run-up to the NPFs.
The gold price is 0.3% higher on the day at the start of a new week, month and quarter while the US dollar feels some heat as it breaks to the downside as per the DXY index that measures the greenback vs. a basket of currencies. At the time of writing, gold is trading at $1,665.50 having traveled between a low of $1,660.95 and $1,669.57 so far.
Markets are closed in China and Australia but there is movement in the FX space which is playing through into the greenback-denominated gold that is less expensive for overseas buyers as a result.
Meanwhile, financial markets have been in turmoil and there is little light seen at the end of the tunnel in this regard which would be expected to continue to underpin the US dollar, weighing on the outlook for gold prices. The S&P 500 and the Nasdaq both fell an additional 1.5% on their final trading day of the quarter on Wall Street where the benchmarks fell by around 8-9% in September. However, gold recorded its best week since mid-August due to US Treasury yields falling onto their back foot. The yield on the US 10-year Treasury fell to a low of 3.682% before recovering to a closing high of 3.837%. However, rising geopolitical risks saw some safe-haven buying emerge into the precious metals complex.
Nevertheless, as we move across into the final quarter of the year, the focus on the Federal Reserve will be firmly back on the market's agenda for the start of the week with resolute policymakers advocating rate rises despite risks of a recession. On Friday, Fed Vice Chair Lael Brainard endorsed the same and added to a chorus of hawkish Fed speakers at the end o the month who are hellbent on curbing inflation. Such a stance has played havoc on the yellow metal as it strips its appeal for Rising interest rates dim bullion's appeal due to the cost of holding the non-yielding asset while the US dollar extends its bullish cycle.
''Historically, gold prices tend to display a systematic and significant underperformance in the latter stage of hiking cycles, as rates enter into restrictive territory,'' analysts at TD Securities explained. ''And, considering the increase in inflation's persistence this cycle, a restrictive regime may last longer than historical precedents with the Fed likely to keep rates elevated for some time, even as recession risks rise, which argues for a prolonged period of pronounced weakness in precious metals. Pressure is rising on a small number of family offices and proprietary trading shops to finally capitulate on their massively bloated and complacent length in gold.''
For the week ahead, the main events to watch for will be US Nonfarm Payrolls that are due at the end of the week, while a flood of manufacturing PMI data out later on Monday will also give insight into the global economic outlook.
''Employment likely continued to advance strongly in September but at a less robust pace compared to recent months,'' analysts at TD Securities said with regards to the NFP report. ''We also look for wage growth to moderate to 0.3% m/m. Separately, regional surveys continue to point to loss of momentum in mfg activity. While we look for a decline in the ISM index, we note that it has failed to match prior weakness suggested by other indicators.''
Gold and DXY technical analysis
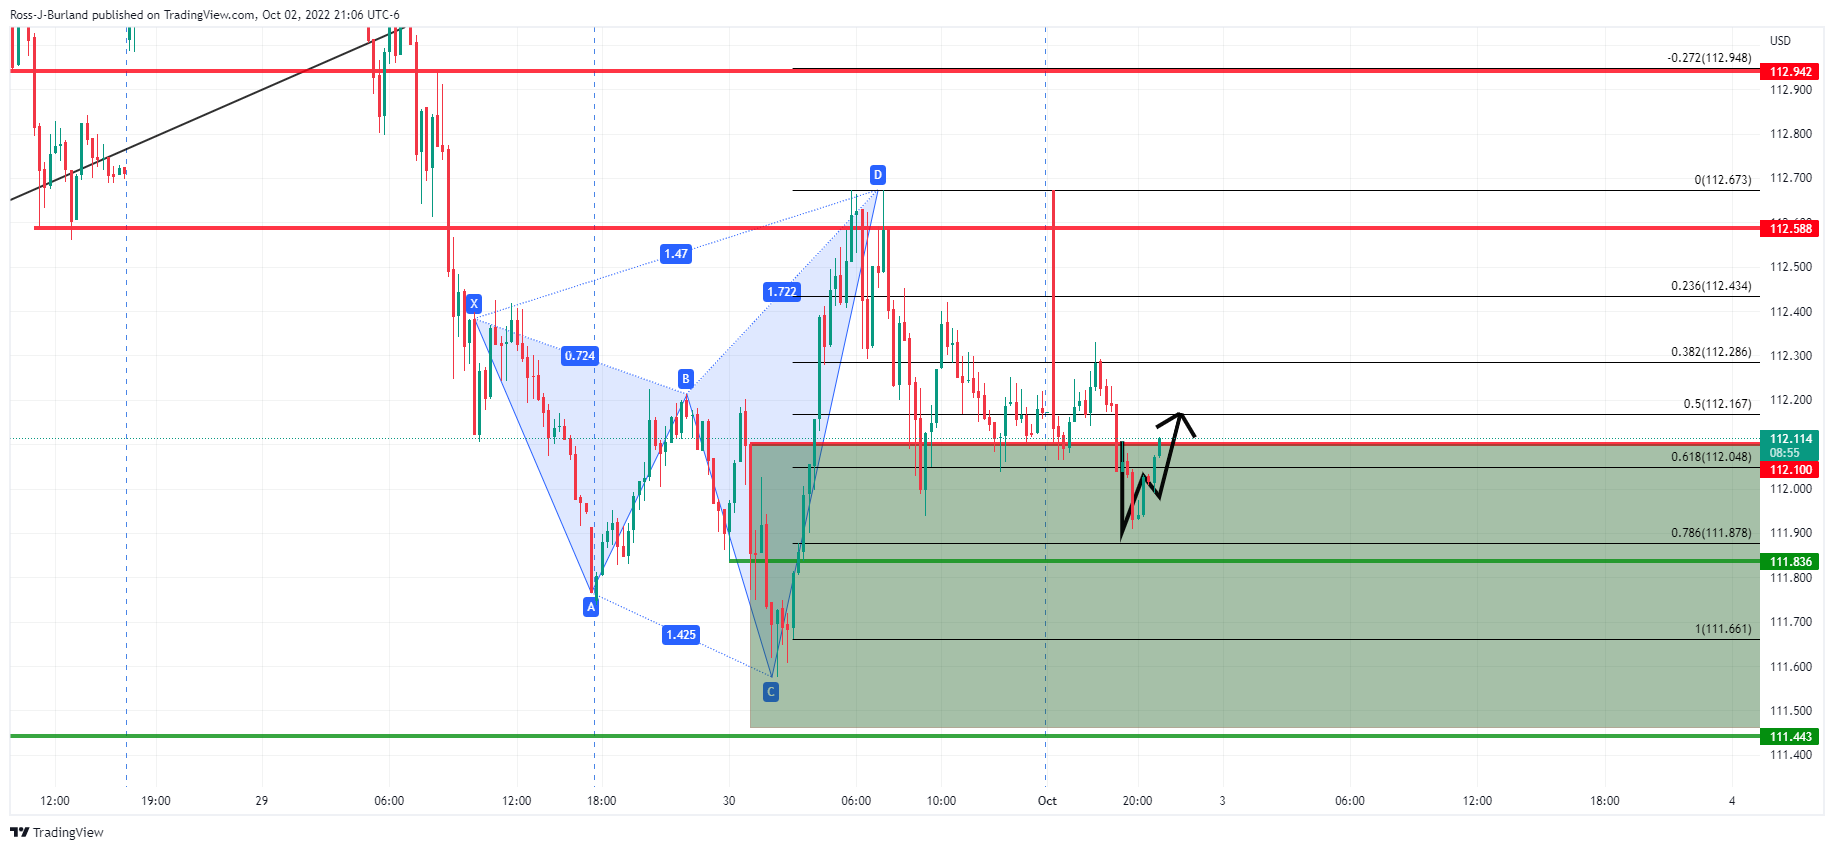
The US dollar is attempting to recover which is weighing on the gold price that is being pressured below a key short tren trendline support as the following illustrates on the hourly and 15-min time frames:
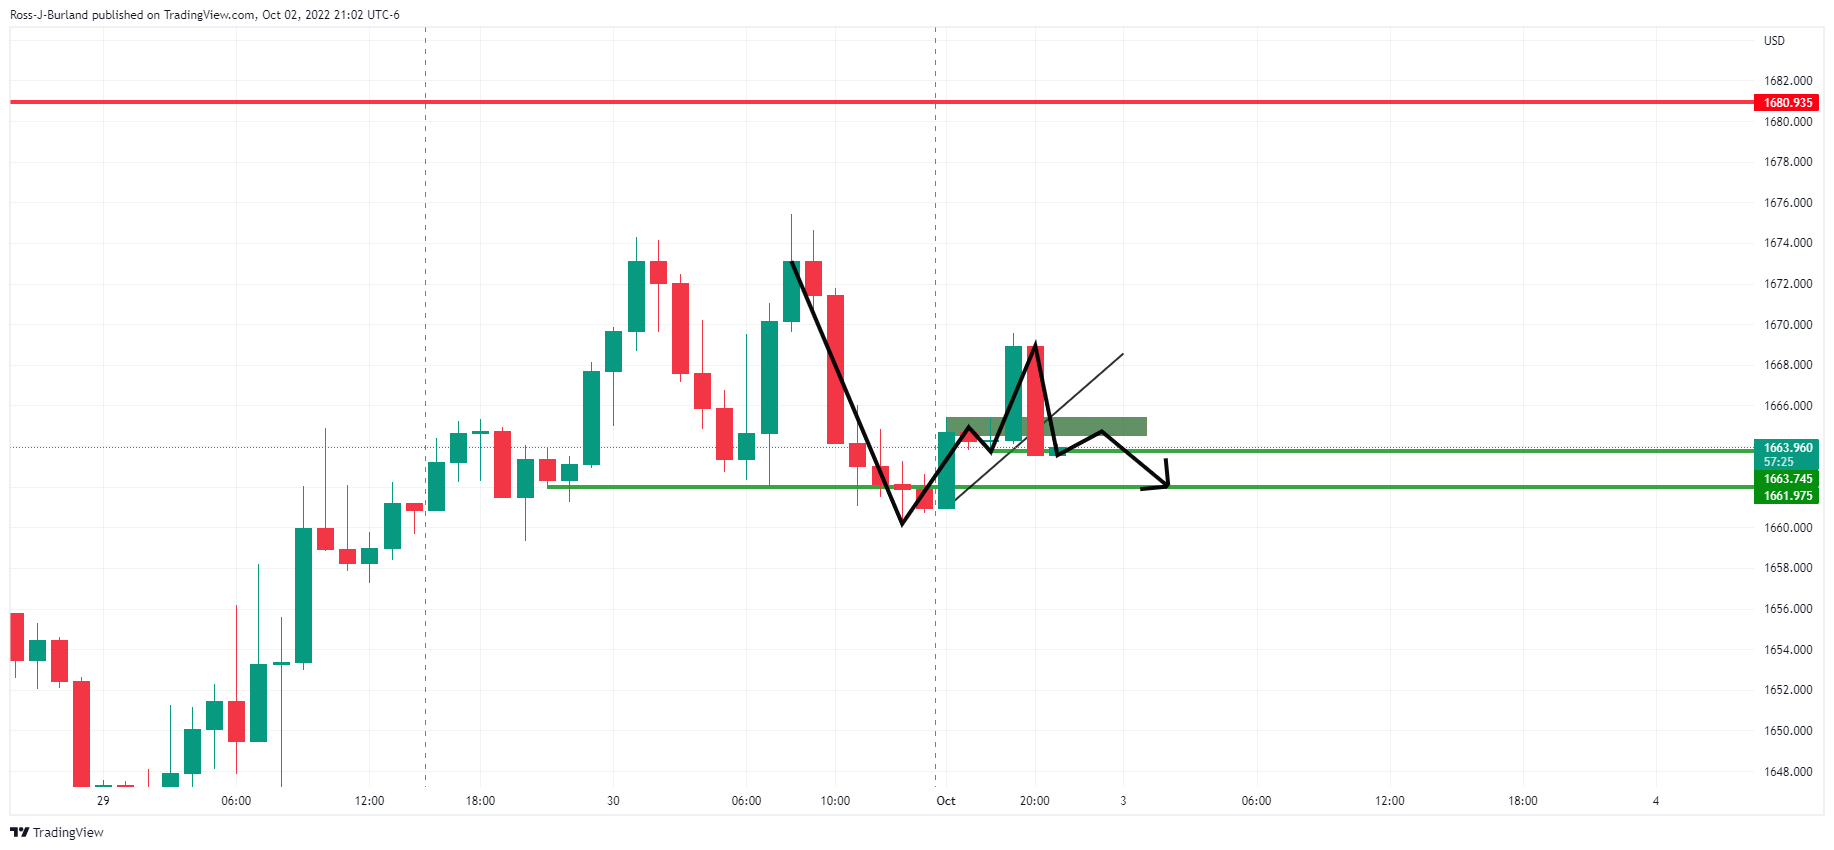
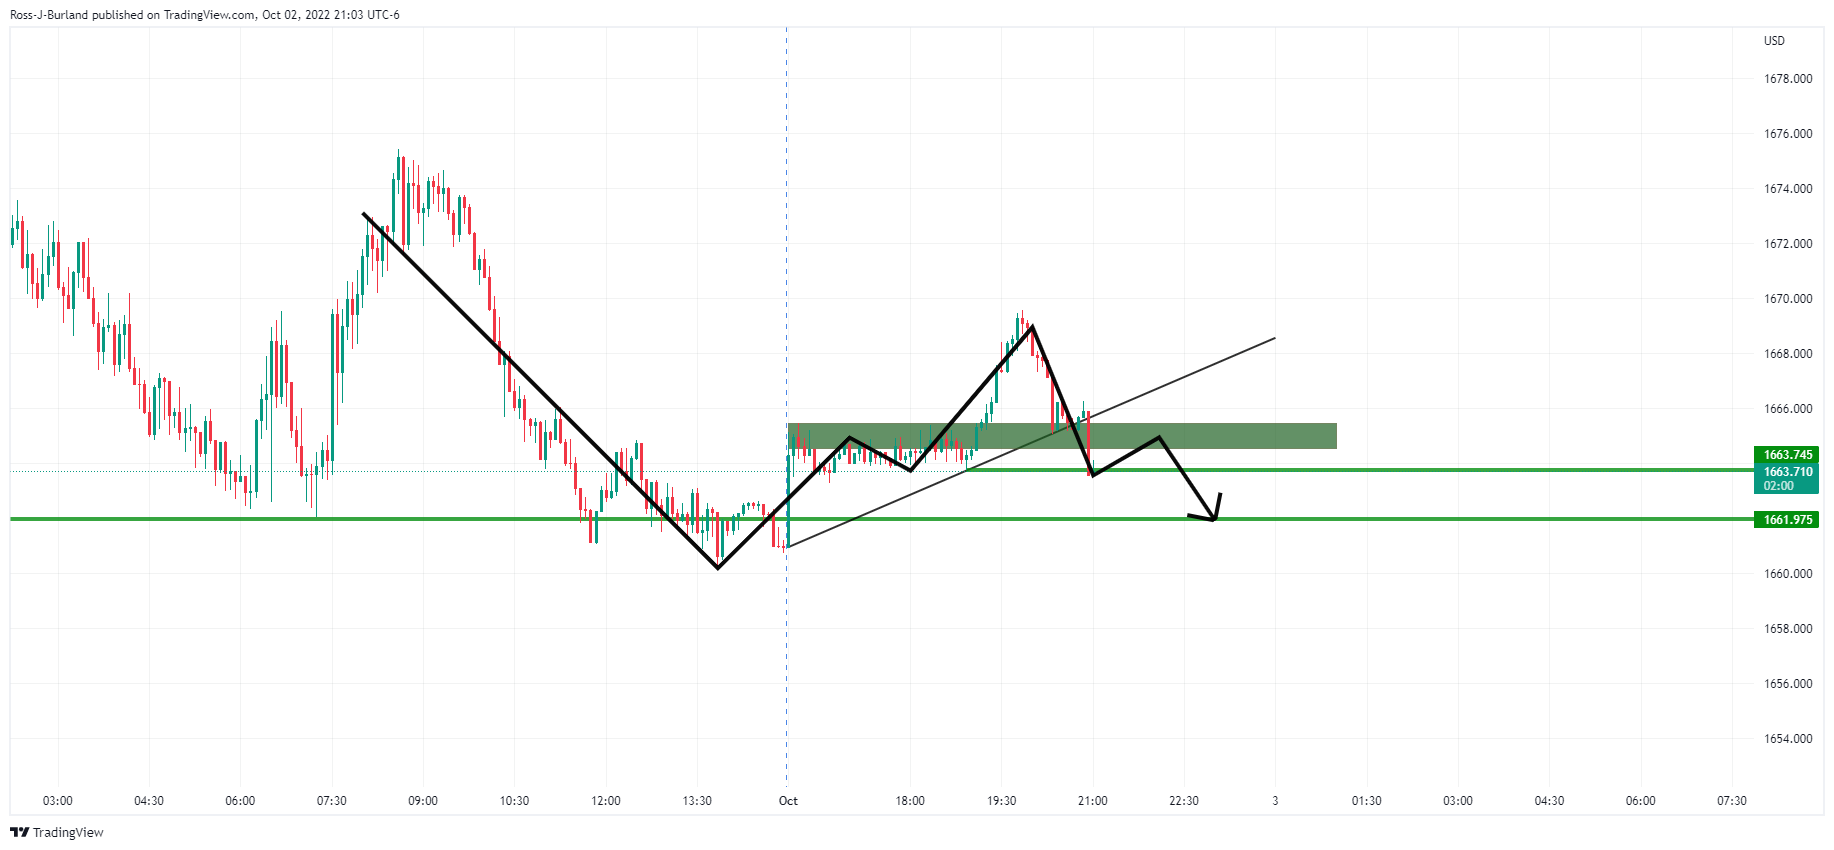
a break of horizontal support opens risk of deeper move to the downside as follows:
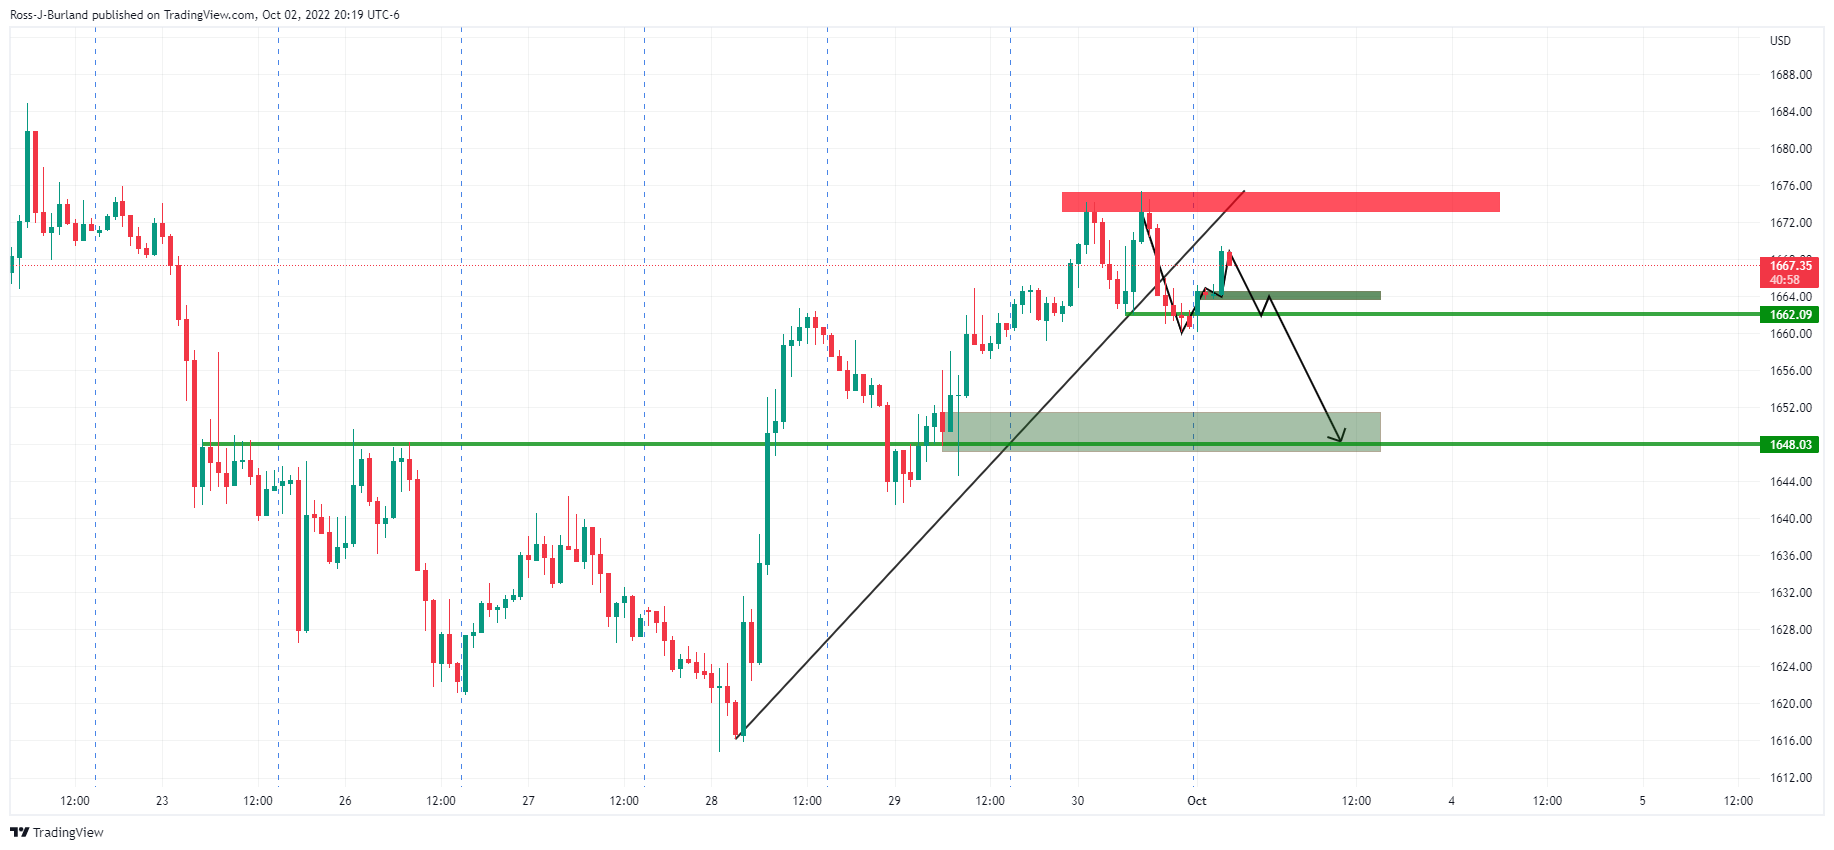
On the daily chart, there are prospects of the price forming the right hand shoulder of what would then complete a bullish inverse head and shoulders pattern:
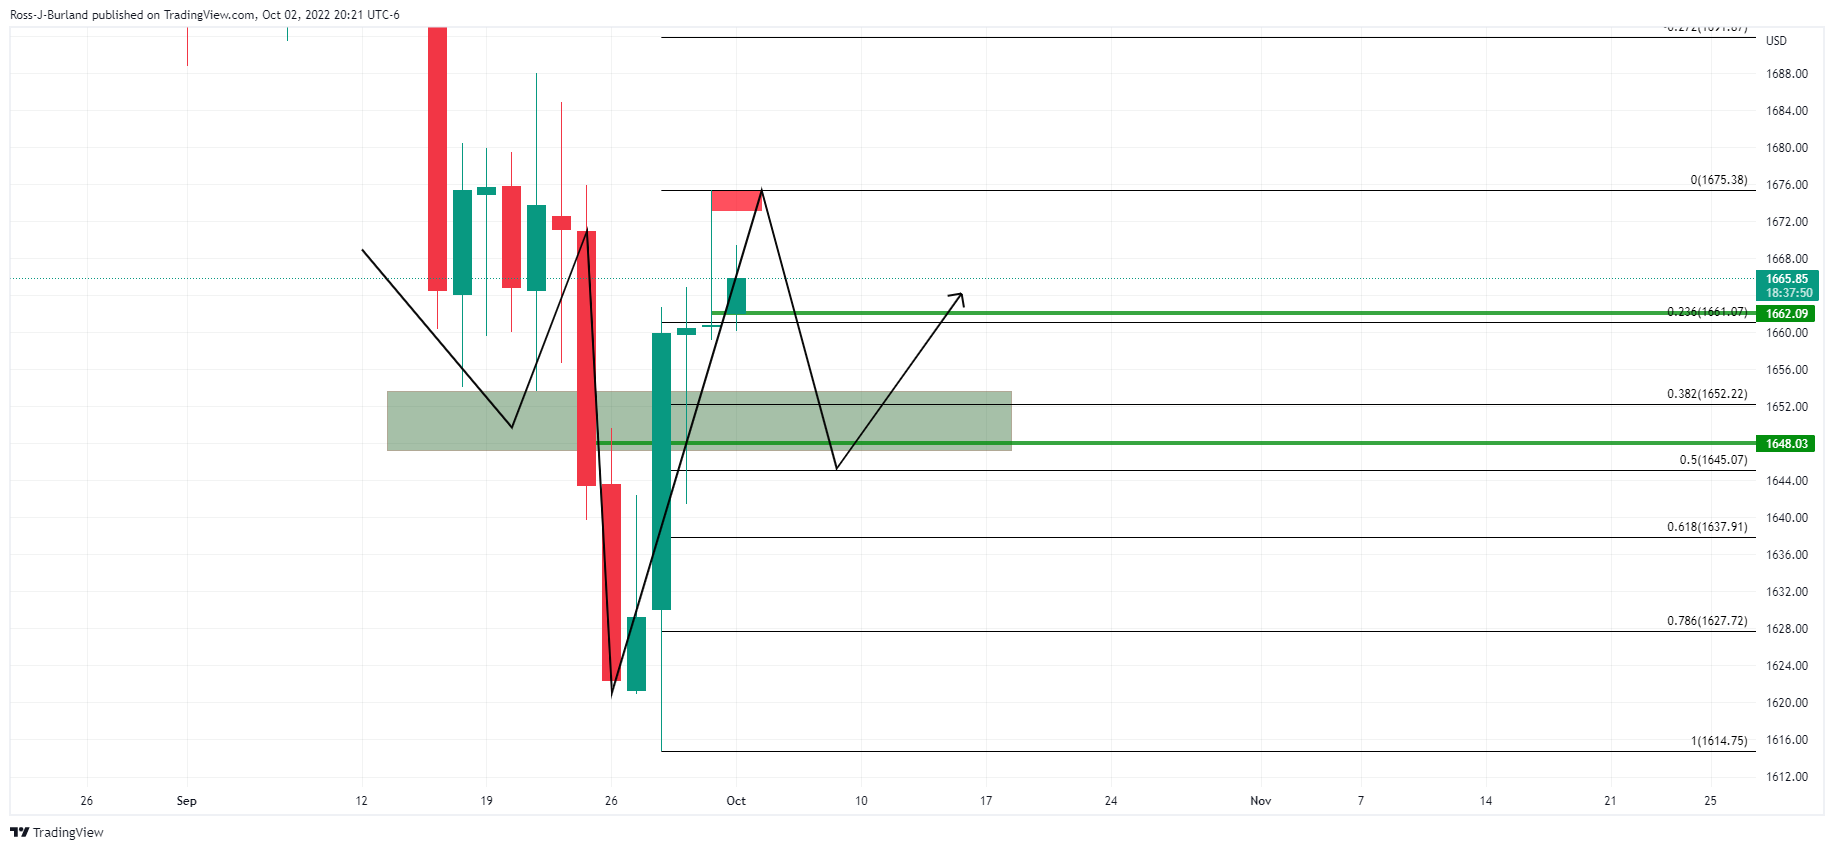
-
03:30
USD/JPY: Rebound remains capped below 145.00, focus shifts to US ISM
- USD/JPY treads water amid a broadly softer US dollar and light trading.
- The BOJ sticks to its easy policy stance in its Summary of Opinions.
- USD/JPY bulls remain hopeful while above 21 DMA and ahead of US ISM.
USD/JPY is consolidating the latest leg up from near 144.50, as the rebound remains capped below the 145.00 level amid a broadly softer US dollar and a mixed market mood.
Chinese, Australian and South Korean markets are closed, which leaves the major gyrating in familiar ranges amid thin liquidity. Investors also trade with caution ahead of the US ISM Manufacturing PMI release later this Monday. Although the main event risk this week remains the September month American jobs report.
In the meantime, the Fed and BOJ monetary policy divergence will continue to play out, with the US central bank highly likely to raise rates by 75 bps at its November meeting. Meanwhile, the BOJ must maintain current monetary easing until inflation stably exceeds 2%, the bank’s September meeting's Summary of Opinions stated.
Further, yen bulls struggle as confidence among Japan’s large manufacturers unexpectedly worsened for three straight quarters following the local currency’s rapid depreciation and deterioration in the global economic outlook.
From a short-term technical perspective, bulls keep their hopes high for a retest of the multi-decade highs of 145.90 so long as they hold above the bullish 21-Daily Moving Average (DMA).
That support is now aligned at 143.57. Ahead of that, buyers need a sustained move above the 145.00 level.
The 14-day Relative Strength Index (RSI) is pointing north above the midline, suggesting that there is more room to the upside.
On the downside, the immediate cushion is seen at the 144.00 mark, below which the 21 DMA could be threatened.
USD/JPY: Daily chart
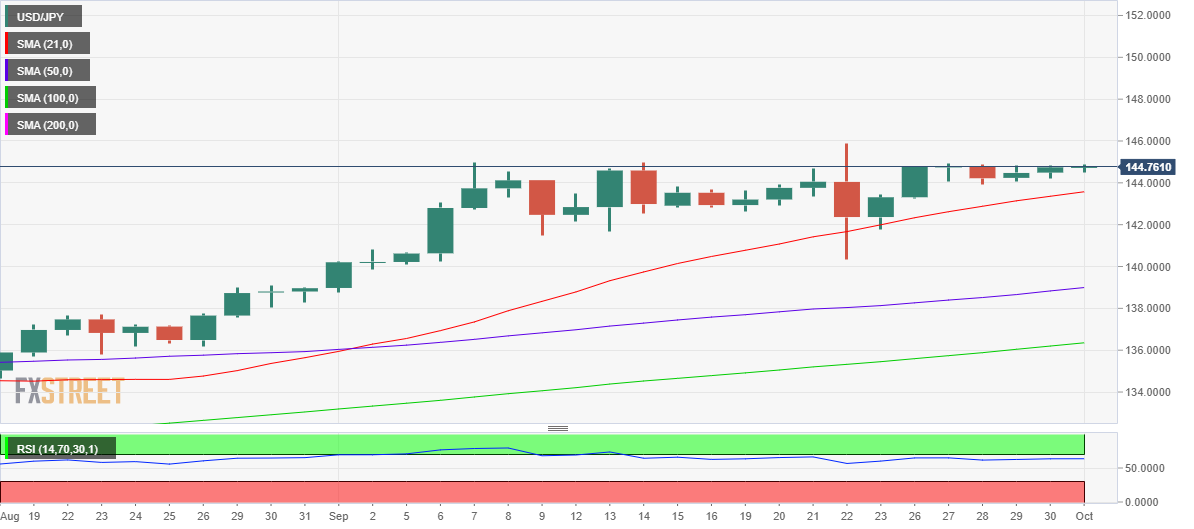
USD/JPY: Additional technical levels
-
03:30
Commodities. Daily history for Friday, September 30, 2022
Raw materials Closed Change, % Silver 19.028 1.03 Gold 1660.85 -0.04 Palladium 2158.39 -1.88 -
02:48
Japan’s Suzuki: Will respond appropriately against sharp FX moves
Japanese Finance Minister Shunichi Suzuki crossed the wires, via Reuters, in the last hour, making usual comments on the FX market moves.
Key quotes
No comment on forex moves.
Closely watching FX moves with a strong sense of urgency.
Will respond appropriately against sharp FX moves.
Important for FX to move stably reflecting econ fundamentals.
Sharp currency moves are undesirable.
Related reads
- BoJ summary of opinions: BoJ must maintain current monetary easing until inflation stably exceeds 2%
- Reversal set for FX pairs after last week’s selloff?
-
02:44
USD/CAD Price Analysis: Bears making their move for 1.3750 key daily support
- USD/CAD bears have pounced from 1.3800 for a move into the 1.3750s.
- 1.3750 is a key area of support given the daily trendline.
USD/CAD is on the move to the downside with 1.3750 on the bear's radar. The price is falling towards trendline support on the daily chart while having already broken the 1.378- structure leaving the bias firmly on the downside for the time being:
USD/CAD monthly chart
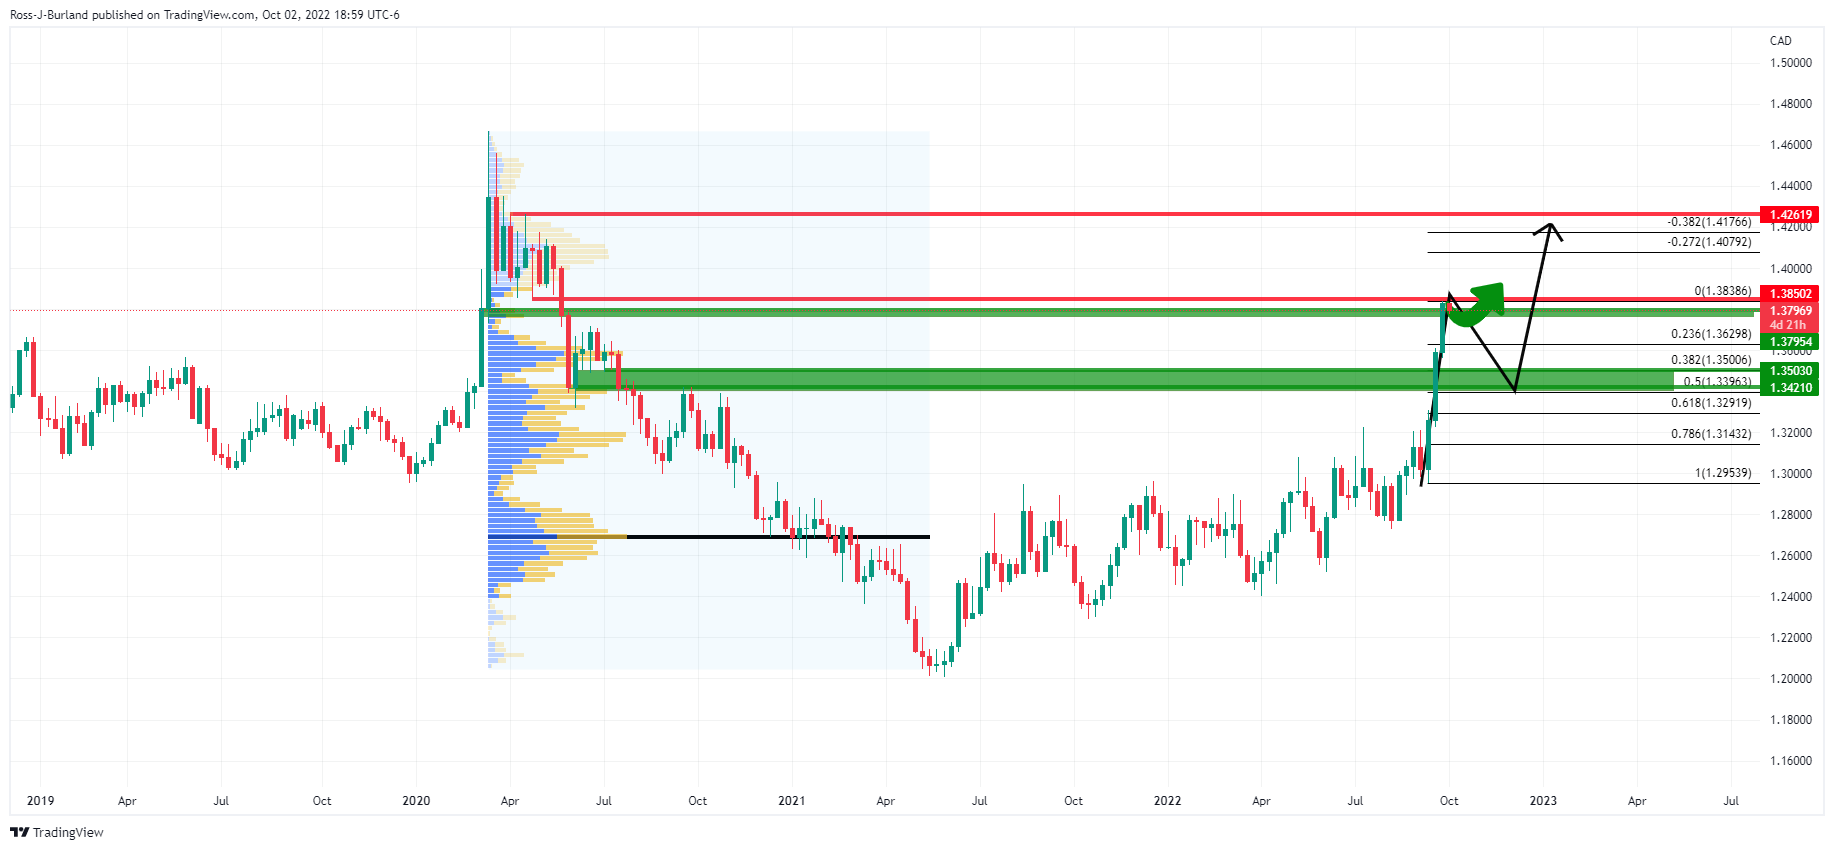
The monthly chart's outlook is bullish although a meanwhile correction is starting to take shape with the key Fibonaccis lining up with the prior structure looking left. That being said, as the daily chart below illustrates, should the trendline support hold on what a[[ears to be an inevitable test, then the upside will remain the favored scenario.
USD/CAD daily chart
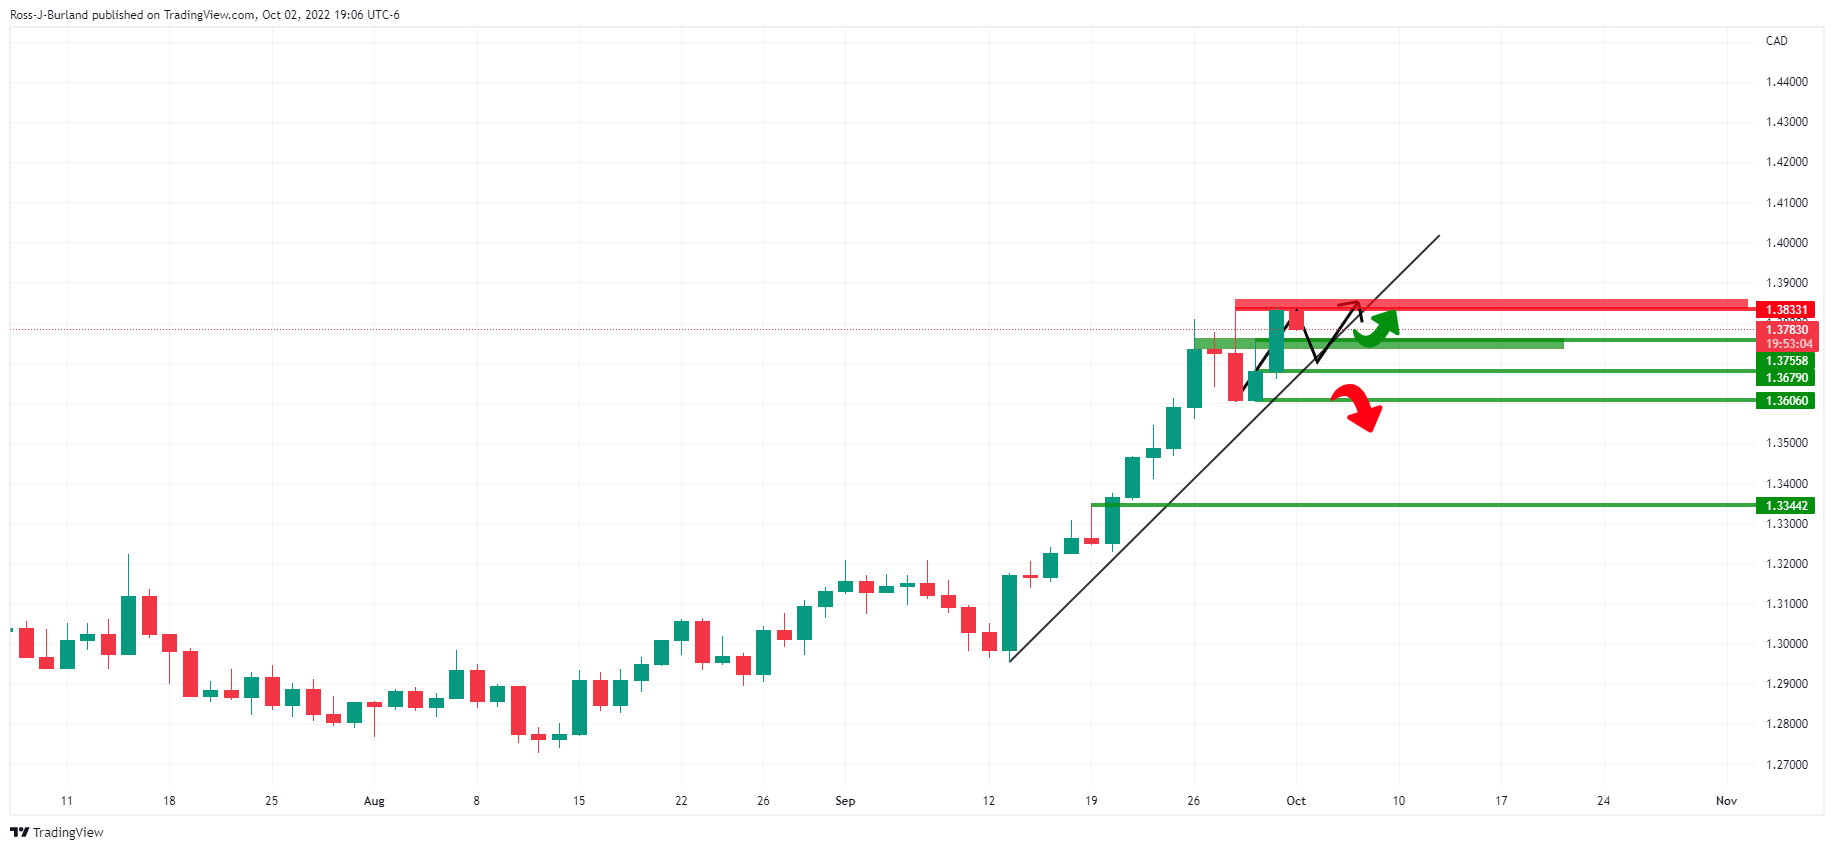
A break of the trendline, on the other hand, and subsequent support structures, then the downside correction will be well on its way.
USD/CAD H1 chart

At this juncture, the price has already bolted:
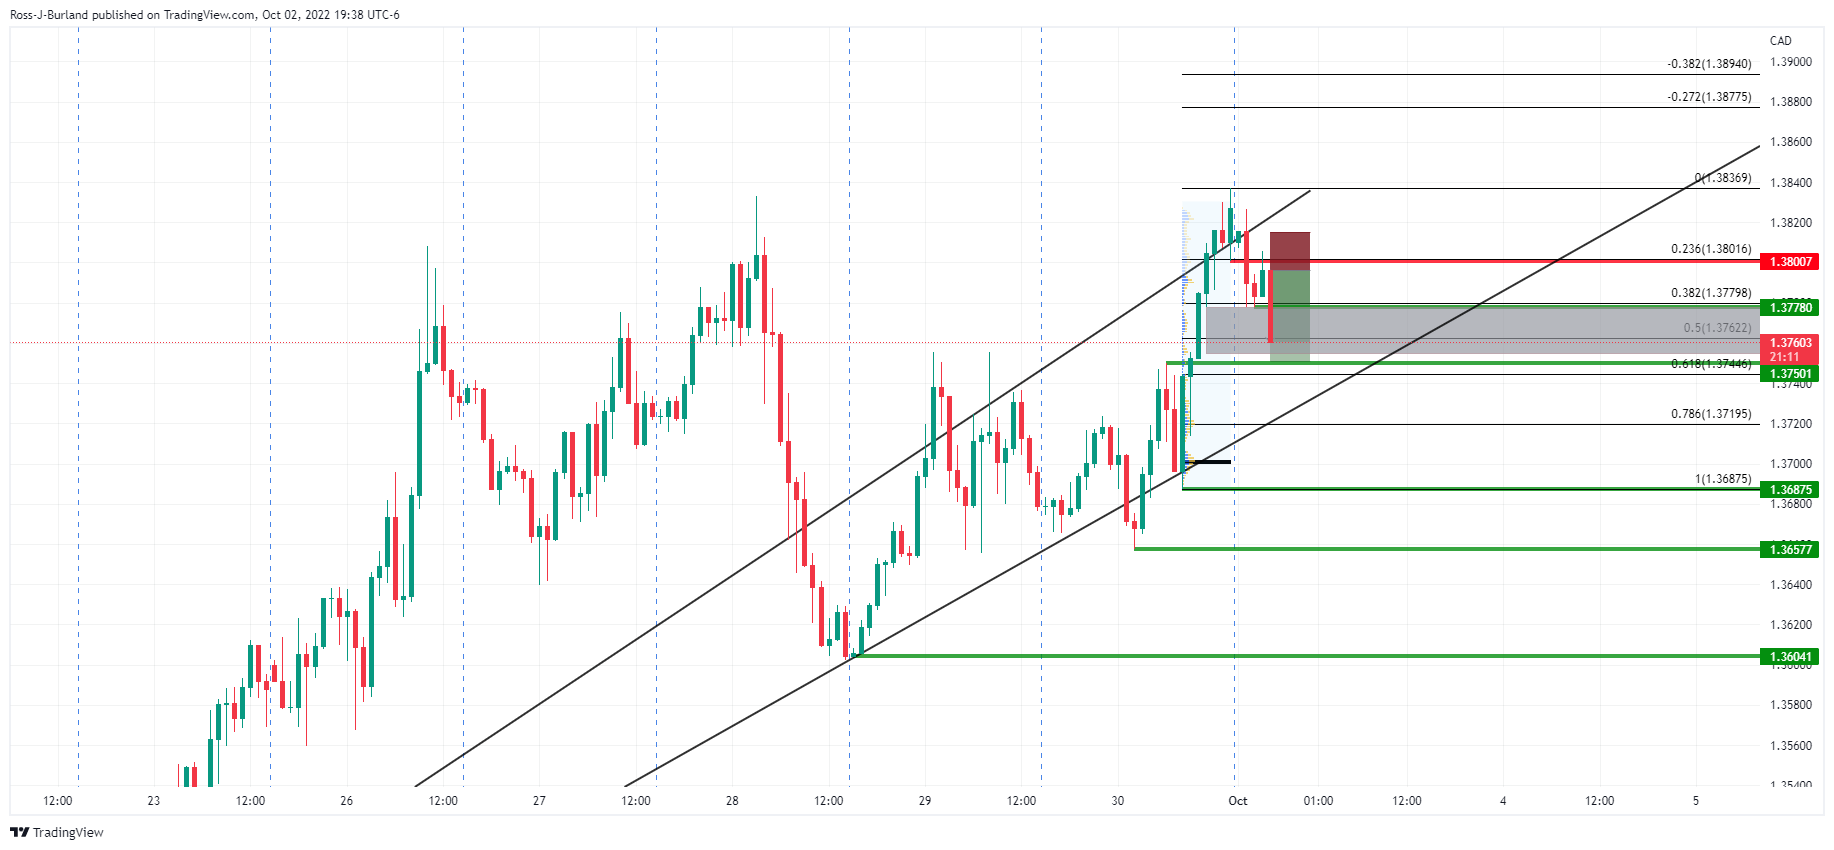
The bears have moved into the kill for the 1.3750s. This is an area of imbalance that is being mitigated at the time of writing with bears pouncing from 1.3800 structure. If this area of support were to give, then 1.3700/20 will be the next reasonable target given the point of control.
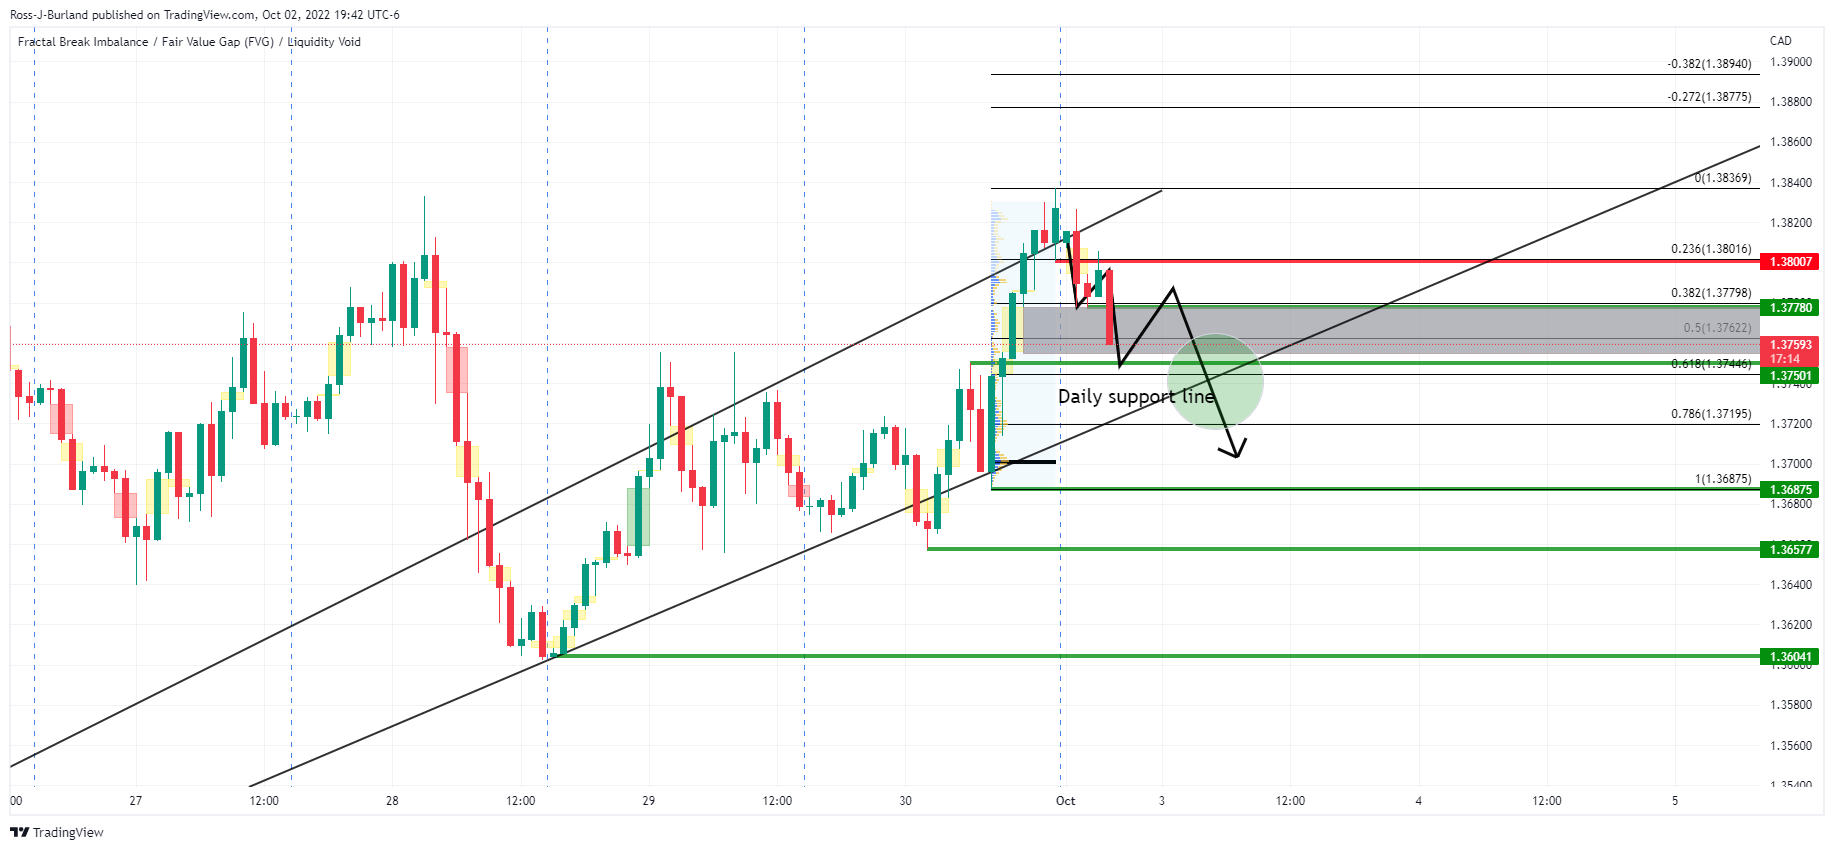
However, the daily trendline support should be noted which reinforces 1.3720/50 as support.
-
01:32
Japan Jibun Bank Manufacturing PMI below forecasts (51.5) in September: Actual (50.8)
-
01:30
BoJ summary of opinions: BoJ must maintain current monetary easing until inflation stably exceeds 2%
The Bank of Japan's September meeting's summary of opinions states that Japan's core consumer inflation is likely to accelerate toward the year-end with a narrow pace of increase thereafter.
Key notes
- Expect wide range of goods to see price rises ahead.
- Challenges remain to achieve boj's 2% inflation target as yet to confirm japan will see sustained wage rises.
- We must be humble, carefully scrutinise without any preset idea risk japan's inflation may sharply overshoot expectations including via fx moves.
- We must scrutinise wage moves, mechanism behind japan's price moves as existing indicators swayed largely by import price moves.
- There is chance japan will see high wage growth given tight labour market.
- Pandemic-relief programme ought to be phased out as japan only half-way in seeing end to pandemic
- BoJ must maintain easy policy as output gap remains negative, even though there is significant risk inflation may overshoot expectations.
- BoJ must maintain current monetary easing until inflation stably exceeds 2%, driven by rise in trend such as services prices.
- No immediate need to change monetary policy guidance now as we are in a phase where close scrutiny needed on whether japan will see positive cycle of wage, prices.
- Some point to interest rate divergence as factors driving yen declines.
- Desirable to maintain current foward guidance with dovish bias as impact of pandemic uncertain, inflation likely to slow next fiscal year and onward
- When right timing comes, important to have appropriate communication with market on exit strategy from easy policy.
USD/JPY under pressure
Meanwhile, financial markets have been in turmoil which has been playing into the hands of the US dollar. With that being said, bears are moving into USD/JPY as follows:
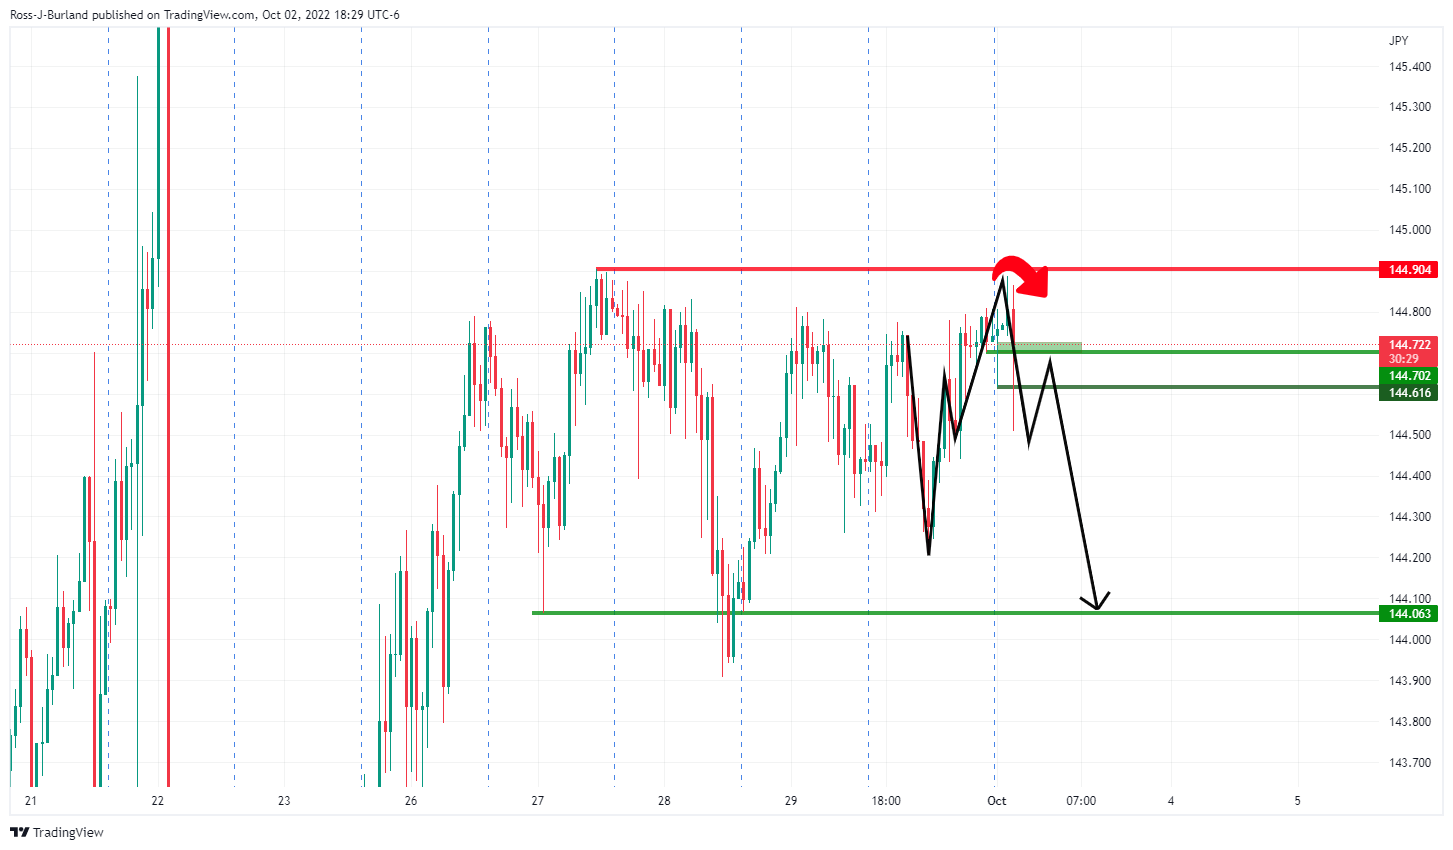
144.60/70 is the support structure and a close below here on an hourly basis could be significant and open the way for a run on liquidity below 144 the figure.
-
01:30
Stocks. Daily history for Friday, September 30, 2022
Index Change, points Closed Change, % NIKKEI 225 -484.84 25937.21 -1.83 Hang Seng 56.96 17222.83 0.33 KOSPI -15.44 2155.49 -0.71 ASX 200 -80.8 6474.2 -1.23 FTSE 100 12.2 6893.8 0.18 DAX 138.81 12114.36 1.16 CAC 40 85.47 5762.34 1.51 Dow Jones -500.1 28725.51 -1.71 S&P 500 -54.85 3585.62 -1.51 NASDAQ Composite -161.89 10575.62 -1.51 -
01:15
Currencies. Daily history for Friday, September 30, 2022
Pare Closed Change, % AUDUSD 0.63929 -1.78 EURJPY 141.868 -0.07 EURUSD 0.97994 -0.34 GBPJPY 161.472 0.1 GBPUSD 1.11541 -0.19 NZDUSD 0.55872 -2.63 USDCAD 1.38357 1.21 USDCHF 0.9872 1.32 USDJPY 144.798 0.29 -
01:12
Ireland Purchasing Manager Index Manufacturing up to 51.5 in September from previous 51.1
-
01:10
Australia TD Securities Inflation (MoM) increased to 0.5% in September from previous -0.5%
-
01:05
AUD/USD Price Analysis: Test of a fresh two-year low at 0.6360 looks imminent
- Aussie bulls to test the two-year low at 0.6360.
- A bear cross, represented by the 20-and 50-EMAs adds to the downside filters.
- The antipodean has failed to capitalize on the recent DXY's correction.
The AUD/USD pair has rebounded sharply in the Tokyo session after dropping below 0.6400. The rebound move is still a pullback after a healthy decline and should not be considered a reversal for now. Last week, the aussie bulls found a cap at around 0.6530, the level is expected to remain a key hurdle if the asset extends its recovery.
On an hourly scale, the aussie bulls are expected to re-test their two-year low placed at 0.6363, recorded on Wednesday. Traders should be aware of the fact that a recent corrective action in the US dollar index (DXY) is not enjoyed by the commodity-linked currencies while the shared continent and pound region have performed extremely better. Therefore, a pullback move in the DXY will result in a plunge in the antipodean.
The 20-and 50-period Exponential Moving Averages (EMAs) have delivered a bear cross around 0.6480, which indicates more weakness ahead.
Meanwhile, the Relative Strength Index (RSI) (14) is oscillating in a bearish range of 20.00-40.00 but is trying to overstep 40.00.
A drop below the two-year low at 0.6363 will drag the asset towards the 16 April 2020 low at 0.6264, followed by the round-level support at 0.6100.
On the flip side, a break above the previous week’s high at 0.6538 will drive the asset towards and September 22 high at 0.6670 and September 18 high at 0.6734.
AUD/USD hourly chart
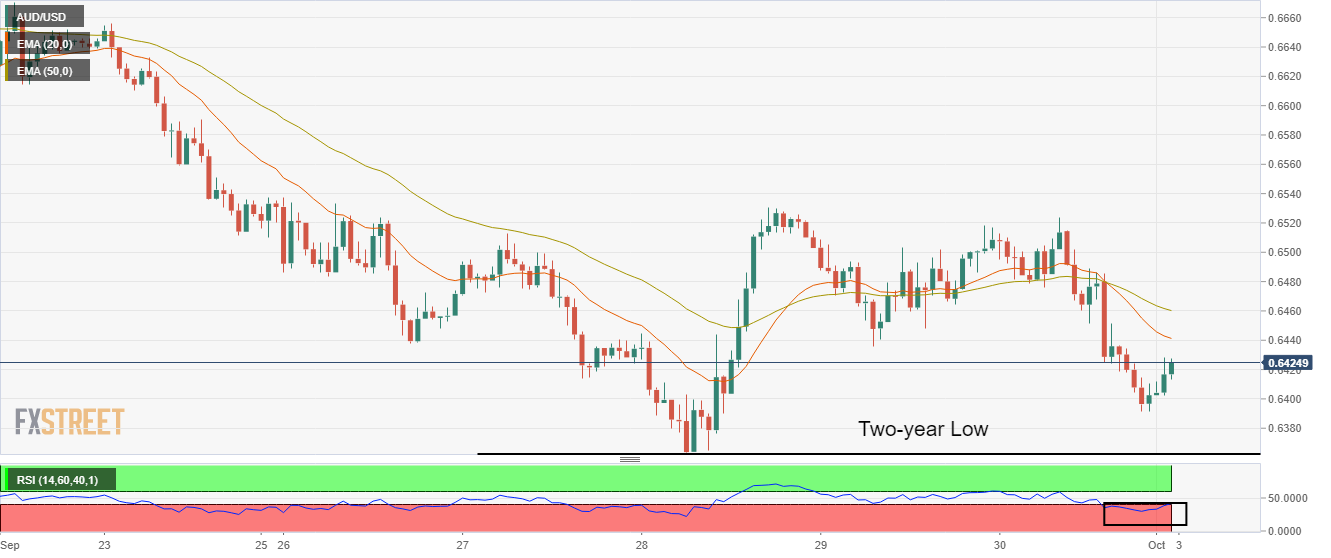
-
00:53
WTI gaps higher in the open ahead of OPEC
- WTI rallies in the open in thin liquidity and bulls eye the 82.50s.
- OPEC is the driver as speculation mounts for a production cut this week.
A price of a barrel of oil has rallied in the open of the week while markets price in OPEC risk against a poor economic backdrop and rising supply side issues.
The OPEC+ alliance is due to meet on 5 October to review its production agreement and there is talk of a 1m barrel cut to output per day. The group has already signaled that it is willing to intervene to support prices. ''This comes as oil prices come under pressure amid concerns of weaker demand,'' analysts at ANZ Bank explained.
''We suspect it will be moved to counteract the excessive bearishness in the market by announcing a cut to production. Anything less than 500kb/d would be shrugged off by the market. Therefore, we see a significant chance of a cut as large as 1mb/d.''
The spike in prices comes despite Friday’s news that China has issued new crude oil import and export quotas as it seeks to revive its economy. The giant consumer has issued at least 2.89 million tonnes of crude oil import quotas to non-state refiners in the third round of allotments for 2022. NASDAQ reported the new allowances bring China's total non-state import quotas to 164.61 million tonnes this year, comparing to 162.25 million tonnes during the same period in 2021.
Most importantly, however as argued by analysts at TD Securities, ''OECD inventories continue to decline at a fast pace, and the end of US SPR releases this November will exacerbate implications for prices. An OPEC+ likely production cut in the range of 500k-1m bpd at next week's Oct 5th meeting could suggest that, barring a very hard landing, the bottom is in for crude prices.''
WTI technical analysis
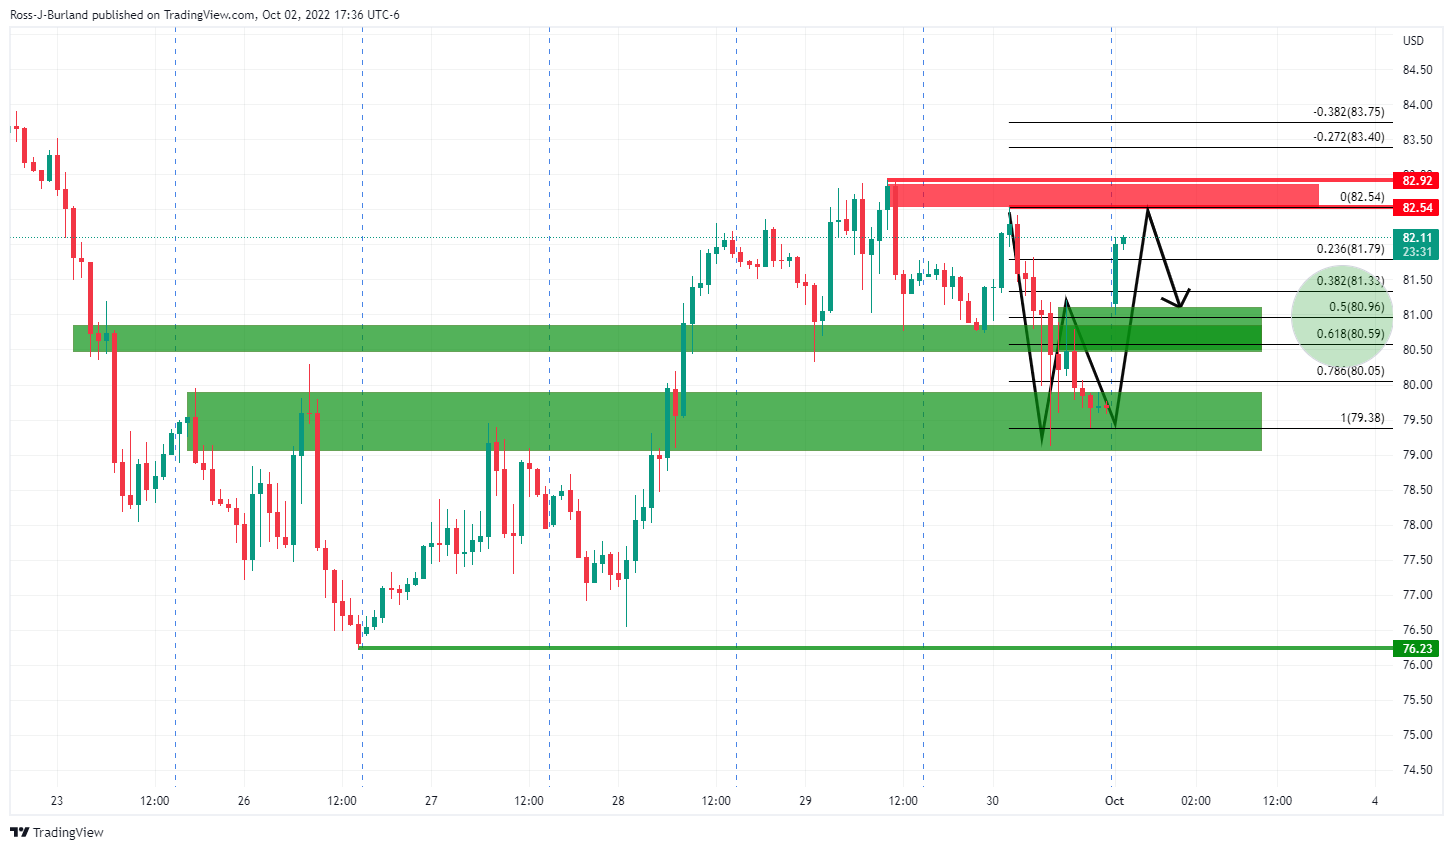
The gap can be considered as a candle that goes to making a W-formation. This is a reversion pattern and speculators may be inclined to look to lower time frames for bearish structure for the day ahead that could be leaned against while seeking a setup to go short while the price remains below resistance:

With that being said, while the support structure remains intact, as per the 1-min chart above, the bias remains to the upside.
-
00:52
Japan Tankan Non - Manufacturing Outlook below expectations (15) in 3Q: Actual (11)
-
00:51
Japan Tankan Large Manufacturing Outlook below forecasts (11) in 3Q: Actual (9)
-
00:51
Japan Tankan Large All Industry Capex came in at 21.5%, above forecasts (18.8%) in 3Q
-
00:51
Japan Tankan Non - Manufacturing Index above expectations (13) in 3Q: Actual (14)
-
00:50
Japan Tankan Large Manufacturing Index came in at 8 below forecasts (11) in 3Q
-
00:34
NZD/USD bounces from 0.5600 as hawkish RBNZ bets soar, US ISM PMI eyed
- NZD/USD has picked bids from around 0.5600 on soaring hawkish RBNZ bets.
- The RBNZ is expected to escalate its OCR 50 bps consecutively for the fifth time.
- The gloomy outlook for US ISM PMI data is weakening the DXY.
The NZD/USD pair has rebounded firmly after picking bids around 0.5600 in the Tokyo session. Last week, the asset witnessed a steep decline after failing to cross the critical hurdle of 0.5750. The kiwi bulls witnessed an intense sell-off despite a decline in the monthly Consumer Price Index (CPI) data. The monthly inflation data declined to 6.8% from the prior release of 7%.
Also, the downbeat Caixin Manufacturing PMI data kept the antipodean on the tenterhooks. The economic data has landed at 48.1, lower than the expectations and the prior release of 49.5. It is worth noting that New Zealand is a leading trading partner of China and a weaker-than-projected Caixin Manufacturing PMI data carries a significant impact on NZ exports.
This week, investors’ focus will be on the interest rate decision by the Reserve Bank of New Zealand (RBNZ). Reuters poll on RBNZ rate hike forecast claims a fifth consecutive rate hike by 50 basis points (bps). A fifth half-a-percent rate hike by the RBNZ Governor Adrian Orr will push the Official Cash Rate (OCR) to 3.5%. It would be worth watching whether an OCR above 3% is sufficient to anchor the galloping inflation.
Meanwhile, the US dollar index (DXY) is expected to drop below the immediate cushion of 112.00. The DXY is likely to witness a sheer decline ahead of US ISM Manufacturing PMI data. The continuation of ‘the hawkish’ stance on interest rates by the Federal Reserve (Fed) has shrunk the extent of manufacturing activities. Firms have postponed their expansion plans due to higher interest rates and bleak demand growth.
As per the projections, the US ISM Manufacturing data will decline to 52.3 vs. the former release of 52.8. Also, the US ISM New Orders Index data, which is an indicator that reflects forward demand is expected to drop significantly to 49.6 against the prior reading of 51.3.
-