Notícias do Mercado
-
23:59
EUR/USD rallies hard as markets bet on tariff pivot
- EUR/USD rose 1.4% on Tuesday, cracking the 1.0600 level.
- Data was of little consequence on Tuesday as markets focus on tariffs.
- ECB rate call in the pipe for Thursday, US NFP jobs data due on Friday.
EUR/USD pinned the gas pedal on Tuesday, surging 1.4% and climbing 140 pips in a single session as markets sell off the US Dollar and bet that US President Donald Trump will find a reason to walk back his own tariff threats. Key data on both the European and US side are due later this week, but trade war rhetoric is ruling the roost for the midweek.
Tariffs, no tariffs
Staying true to form, US President Donald Trump is already seeding a pivot on his own tariff threats. A stiff tariff package of 25% on imported goods from Canada and Mexico went into effect at midnight EST. However, despite a brief spat of risk aversion early in the US session, currency markets quickly recovered their feet and bet big on another tariff policy reversal or delay from the Trump administration. Key personnel in the Trump team, specifically Commerce Secretary Howard Lutnick, admitted to Fox News viewers that a pivot on this week’s tariffs may already be in the works, to be announced by President Trump on Wednesday.
Economic data on the European side is a lean offering during the midweek market session as Fiber traders knuckle down for the one-two punch of the European Central Bank’s (ECB) March rate call on Thursday, as well as the latest iteration of US Nonfarm Payrolls (NFP) jobs figures, slated for Friday. This week’s NFP print will likely draw even more attention than usual as investors start to keep an eye out for any signs of economic weakness as consumers and businesses begin to crack under the weight of continued threats of a global trade war by President Trump.
Wednesday brings US ADP Employment change figures, as well as an ISM Services Purchasing Managers Index (PMI) survey results update. ADP jobs counts are expected to ease slightly to 140K from 183K, while the ISM Services PMI is forecast to tick down slightly to 52.6 from 52.8.
The ECB is broadly expected to trim interest rates by another quarter of a percent on Thursday, bringing the main reference rate down to 2.65% from 2.9%, and the Deposit Facility Rate is forecast to fall by a matching amount to 2.5% from 2.75% as the ECB tries to get out ahead of growing recession risks and tries to bolster the EU’s wide and varied domestic economy.
EUR/USD price forecast
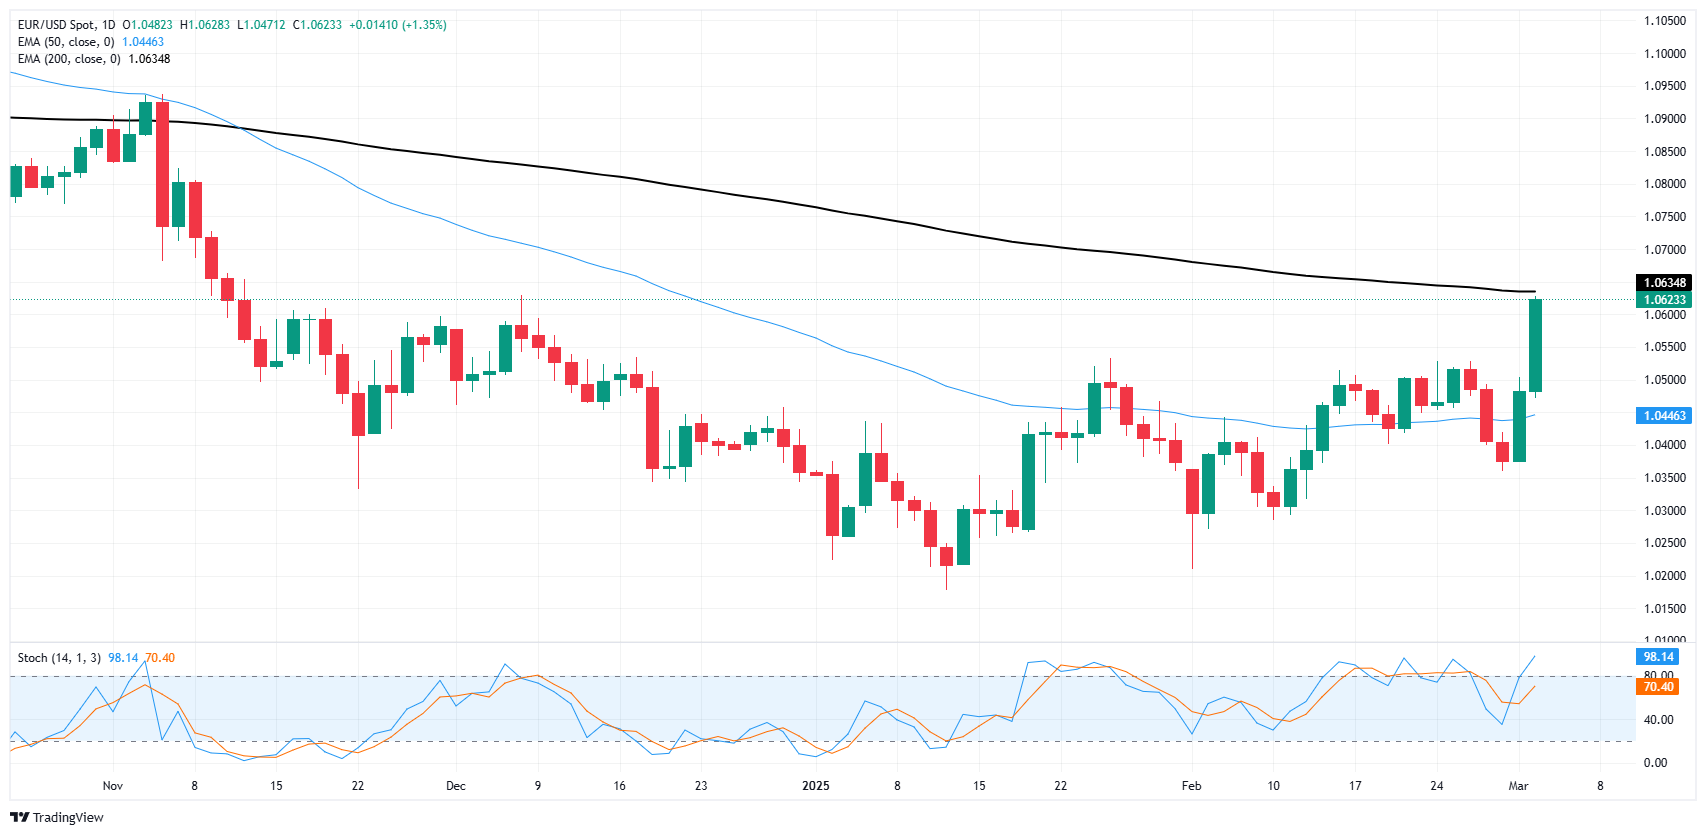
The Euro put in its best single-day performance in over two years on Tuesday, climbing nearly 1.4% and bringing its two-day bull run to an impressive 2.4% bottom-to-top. EUR/USD broke through the 1.0600 handle for the first time since last December, and is on pace to reach new five-month highs as long as Fiber bulls are able to keep hitting the buy button.
However, significant technical resistance is beginning to mount. The 200-day Exponential Moving Average (EMA) lies in wait near 1.0635, and has a habit of making a mess of what would otherwise be smooth trends.
Technical oscillators are also caught in overbought territory, implying buyers could run out of gas quickly and spark a fresh round of bearish bidding.
EUR/USD daily chart
Euro FAQs
The Euro is the currency for the 19 European Union countries that belong to the Eurozone. It is the second most heavily traded currency in the world behind the US Dollar. In 2022, it accounted for 31% of all foreign exchange transactions, with an average daily turnover of over $2.2 trillion a day. EUR/USD is the most heavily traded currency pair in the world, accounting for an estimated 30% off all transactions, followed by EUR/JPY (4%), EUR/GBP (3%) and EUR/AUD (2%).
The European Central Bank (ECB) in Frankfurt, Germany, is the reserve bank for the Eurozone. The ECB sets interest rates and manages monetary policy. The ECB’s primary mandate is to maintain price stability, which means either controlling inflation or stimulating growth. Its primary tool is the raising or lowering of interest rates. Relatively high interest rates – or the expectation of higher rates – will usually benefit the Euro and vice versa. The ECB Governing Council makes monetary policy decisions at meetings held eight times a year. Decisions are made by heads of the Eurozone national banks and six permanent members, including the President of the ECB, Christine Lagarde.
Eurozone inflation data, measured by the Harmonized Index of Consumer Prices (HICP), is an important econometric for the Euro. If inflation rises more than expected, especially if above the ECB’s 2% target, it obliges the ECB to raise interest rates to bring it back under control. Relatively high interest rates compared to its counterparts will usually benefit the Euro, as it makes the region more attractive as a place for global investors to park their money.
Data releases gauge the health of the economy and can impact on the Euro. Indicators such as GDP, Manufacturing and Services PMIs, employment, and consumer sentiment surveys can all influence the direction of the single currency. A strong economy is good for the Euro. Not only does it attract more foreign investment but it may encourage the ECB to put up interest rates, which will directly strengthen the Euro. Otherwise, if economic data is weak, the Euro is likely to fall. Economic data for the four largest economies in the euro area (Germany, France, Italy and Spain) are especially significant, as they account for 75% of the Eurozone’s economy.
Another significant data release for the Euro is the Trade Balance. This indicator measures the difference between what a country earns from its exports and what it spends on imports over a given period. If a country produces highly sought after exports then its currency will gain in value purely from the extra demand created from foreign buyers seeking to purchase these goods. Therefore, a positive net Trade Balance strengthens a currency and vice versa for a negative balance.
-
23:23
USD/CAD tumbles to near 1.4400 amid trade tensions
- USD/CAD attracts some sellers to around 1.4400 in Tuesday’s late American session, down 0.50% on the day.
- Lutnick said Trump may roll back Canada and Mexico tariffs on Wednesday.
- The BoC is expected to cut its interest rate further next week.
The USD/CAD pair extends the decline to near 1.4400 during the late American session on Tuesday. The US Dollar (USD) fell against the Canadian Dollar (CAD) amid concerns about slowing growth and the impact of tariffs on the US economy outweighed any potential boost from new levies on Canada, China and Mexico.
President Donald Trump's 25% tariffs on goods from Canada and Mexico took effect Tuesday, along with a doubling of duties on Chinese goods to 20%. However, US Commerce Secretary Howard Lutnick hinted that Trump may be preparing to pivot on his own tariffs less than 48 hours after imposing them. Investors will closely monitor the developments surrounding further tariff policies, which might trigger the volatility in the major pair.
The rising bets on further interest rate cuts from the Bank of Canada (BoC) might drag the Loonie lower and act as a tailwind for the pair. Investors have priced in roughly 80% odds that the BoC will cut interest rates further next week, according to Reuters. "We now look for the quarter-point pace to continue in each of the next four meetings until July, taking the rate to 2.0 per cent,” said BMO chief economist Douglas Porter.
Meanwhile, a decline in crude oil prices on reports that OPEC+ will proceed with a planned oil output increase in April might weigh on the commodity-linked Loonie. It’s worth noting that Canada is the largest oil exporter to the United States (US), and lower crude oil prices tend to have a negative impact on the CAD value.Canadian Dollar FAQs
The key factors driving the Canadian Dollar (CAD) are the level of interest rates set by the Bank of Canada (BoC), the price of Oil, Canada’s largest export, the health of its economy, inflation and the Trade Balance, which is the difference between the value of Canada’s exports versus its imports. Other factors include market sentiment – whether investors are taking on more risky assets (risk-on) or seeking safe-havens (risk-off) – with risk-on being CAD-positive. As its largest trading partner, the health of the US economy is also a key factor influencing the Canadian Dollar.
The Bank of Canada (BoC) has a significant influence on the Canadian Dollar by setting the level of interest rates that banks can lend to one another. This influences the level of interest rates for everyone. The main goal of the BoC is to maintain inflation at 1-3% by adjusting interest rates up or down. Relatively higher interest rates tend to be positive for the CAD. The Bank of Canada can also use quantitative easing and tightening to influence credit conditions, with the former CAD-negative and the latter CAD-positive.
The price of Oil is a key factor impacting the value of the Canadian Dollar. Petroleum is Canada’s biggest export, so Oil price tends to have an immediate impact on the CAD value. Generally, if Oil price rises CAD also goes up, as aggregate demand for the currency increases. The opposite is the case if the price of Oil falls. Higher Oil prices also tend to result in a greater likelihood of a positive Trade Balance, which is also supportive of the CAD.
While inflation had always traditionally been thought of as a negative factor for a currency since it lowers the value of money, the opposite has actually been the case in modern times with the relaxation of cross-border capital controls. Higher inflation tends to lead central banks to put up interest rates which attracts more capital inflows from global investors seeking a lucrative place to keep their money. This increases demand for the local currency, which in Canada’s case is the Canadian Dollar.
Macroeconomic data releases gauge the health of the economy and can have an impact on the Canadian Dollar. Indicators such as GDP, Manufacturing and Services PMIs, employment, and consumer sentiment surveys can all influence the direction of the CAD. A strong economy is good for the Canadian Dollar. Not only does it attract more foreign investment but it may encourage the Bank of Canada to put up interest rates, leading to a stronger currency. If economic data is weak, however, the CAD is likely to fall.
-
23:06
NZD/JPY Price Forecast: Bounces off 7-month low, but downtrend remains
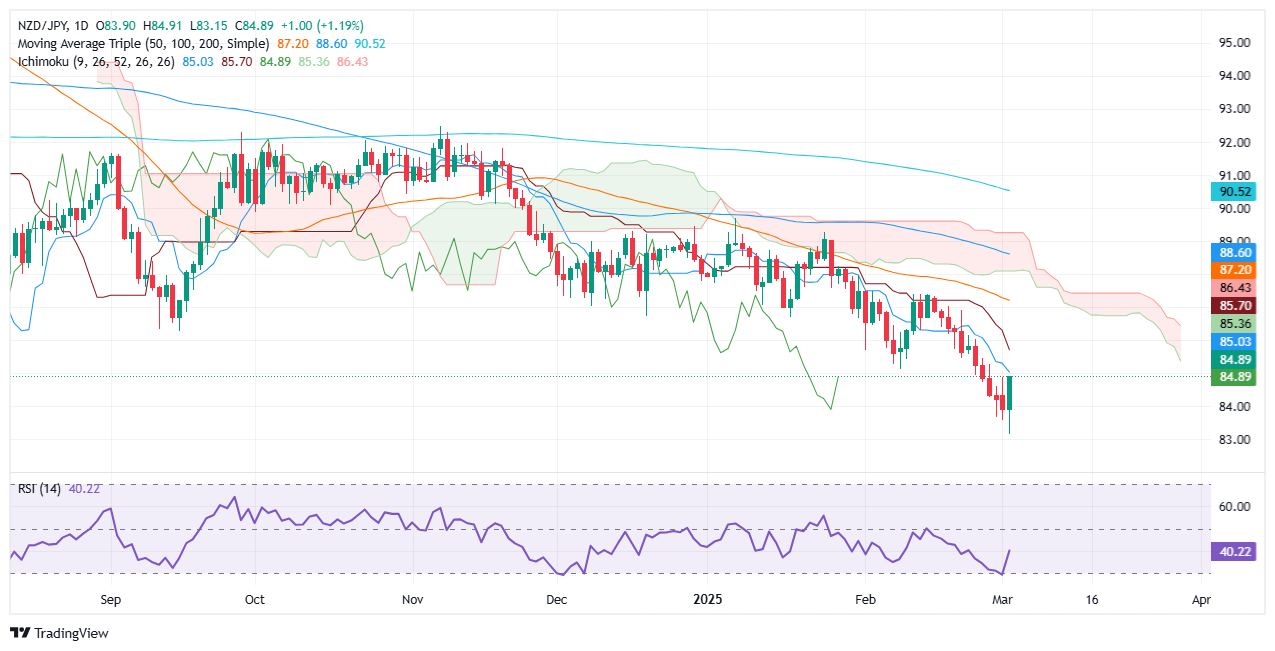
- NZD/JPY must break above 85.03 (Tenkan-Sen) to extend recovery.
- Key resistance levels lie at 85.40 (Senkou Span A) and 85.66 (Kijun-Sen).
- Failure to hold above 84.00 could reopen the path toward YTD low of 83.15.
The NZD/JPY recovered some ground on Tuesday after dropping to a seven-month low of 83.15. The pair finished the session near 84.90 for gains of over 1%. At the time of writing, the cross-pair trades near 85.00, virtually unchanged as the Wednesday Asian session begins.
NZD/JPY Price Forecast: Technical outlook
Despite posting a bullish candle, the NZD/JPY remains biased downward, with the exchange rate hovering near the Tenkan-Sen at 85.03. A breach of the latter will expose the Senkou Span A at 85.4, immediately followed by the Kijun-Sen at 85.66. The next stop would be Senkou Span B at 86.43 on further strength.
Conversely, if NZD/JPY drops below 84.00, the next support would be the year-to-date (YTD) low of 83.15, followed by the August 5 low of 83.05, before diving to 83.00. A breach of the latter will send the cross sliding to a two-year low near April 27, 2023, a low of 81.63.
NZD/JPY Price Chart – Daily
New Zealand Dollar FAQs
The New Zealand Dollar (NZD), also known as the Kiwi, is a well-known traded currency among investors. Its value is broadly determined by the health of the New Zealand economy and the country’s central bank policy. Still, there are some unique particularities that also can make NZD move. The performance of the Chinese economy tends to move the Kiwi because China is New Zealand’s biggest trading partner. Bad news for the Chinese economy likely means less New Zealand exports to the country, hitting the economy and thus its currency. Another factor moving NZD is dairy prices as the dairy industry is New Zealand’s main export. High dairy prices boost export income, contributing positively to the economy and thus to the NZD.
The Reserve Bank of New Zealand (RBNZ) aims to achieve and maintain an inflation rate between 1% and 3% over the medium term, with a focus to keep it near the 2% mid-point. To this end, the bank sets an appropriate level of interest rates. When inflation is too high, the RBNZ will increase interest rates to cool the economy, but the move will also make bond yields higher, increasing investors’ appeal to invest in the country and thus boosting NZD. On the contrary, lower interest rates tend to weaken NZD. The so-called rate differential, or how rates in New Zealand are or are expected to be compared to the ones set by the US Federal Reserve, can also play a key role in moving the NZD/USD pair.
Macroeconomic data releases in New Zealand are key to assess the state of the economy and can impact the New Zealand Dollar’s (NZD) valuation. A strong economy, based on high economic growth, low unemployment and high confidence is good for NZD. High economic growth attracts foreign investment and may encourage the Reserve Bank of New Zealand to increase interest rates, if this economic strength comes together with elevated inflation. Conversely, if economic data is weak, NZD is likely to depreciate.
The New Zealand Dollar (NZD) tends to strengthen during risk-on periods, or when investors perceive that broader market risks are low and are optimistic about growth. This tends to lead to a more favorable outlook for commodities and so-called ‘commodity currencies’ such as the Kiwi. Conversely, NZD tends to weaken at times of market turbulence or economic uncertainty as investors tend to sell higher-risk assets and flee to the more-stable safe havens.
-
23:00
South Korea Gross Domestic Product Growth (YoY) meets forecasts (1.2%) in 4Q
-
23:00
South Korea Gross Domestic Product Growth (QoQ) in line with expectations (0.1%) in 4Q
-
22:46
RBA's Hauser: Measures of global trade uncertainty are at 50-year highs
Reserve Bank of Australia (RBA) Deputy Governor Andrew Hauser said early Tuesday that the measures of global trade uncertainty are at 50-year highs. Hauser added that the ambiguity from US President Donald Trump's tariffs could see companies and households "batten down the hatches" and postpone planning and investment, leading to a hit to the economy.
Key quotes
Measures of global trade uncertainty are at 50-year highs.
Risk for Australia would be if US tariffs triggered a global trade war.
Markets realising that trade uncertainty could see firms and households batten down the hatches.
Such ‘watchful waiting’ could prove economically damaging in aggregate.
Possibility of such an effect played a part in the RBA's February rate cut.
February rate cut reduced the risks of inflation undershooting the 2.5% target.
The board does not currently share market confidence that a sequence of further rate cuts will be required.
Progress on inflation has been good, but it is too soon to declare victory.
Judge that labour market conditions will remain relatively tight over the forecast period.
Recognise risk we have overestimated tightness of labour market.Market reaction
At the time of writing, AUD/USD is holding higher ground near 0.6265, adding 0.27% on the day.
RBA FAQs
The Reserve Bank of Australia (RBA) sets interest rates and manages monetary policy for Australia. Decisions are made by a board of governors at 11 meetings a year and ad hoc emergency meetings as required. The RBA’s primary mandate is to maintain price stability, which means an inflation rate of 2-3%, but also “..to contribute to the stability of the currency, full employment, and the economic prosperity and welfare of the Australian people.” Its main tool for achieving this is by raising or lowering interest rates. Relatively high interest rates will strengthen the Australian Dollar (AUD) and vice versa. Other RBA tools include quantitative easing and tightening.
While inflation had always traditionally been thought of as a negative factor for currencies since it lowers the value of money in general, the opposite has actually been the case in modern times with the relaxation of cross-border capital controls. Moderately higher inflation now tends to lead central banks to put up their interest rates, which in turn has the effect of attracting more capital inflows from global investors seeking a lucrative place to keep their money. This increases demand for the local currency, which in the case of Australia is the Aussie Dollar.
Macroeconomic data gauges the health of an economy and can have an impact on the value of its currency. Investors prefer to invest their capital in economies that are safe and growing rather than precarious and shrinking. Greater capital inflows increase the aggregate demand and value of the domestic currency. Classic indicators, such as GDP, Manufacturing and Services PMIs, employment, and consumer sentiment surveys can influence AUD. A strong economy may encourage the Reserve Bank of Australia to put up interest rates, also supporting AUD.
Quantitative Easing (QE) is a tool used in extreme situations when lowering interest rates is not enough to restore the flow of credit in the economy. QE is the process by which the Reserve Bank of Australia (RBA) prints Australian Dollars (AUD) for the purpose of buying assets – usually government or corporate bonds – from financial institutions, thereby providing them with much-needed liquidity. QE usually results in a weaker AUD.
Quantitative tightening (QT) is the reverse of QE. It is undertaken after QE when an economic recovery is underway and inflation starts rising. Whilst in QE the Reserve Bank of Australia (RBA) purchases government and corporate bonds from financial institutions to provide them with liquidity, in QT the RBA stops buying more assets, and stops reinvesting the principal maturing on the bonds it already holds. It would be positive (or bullish) for the Australian Dollar.
-
22:09
USD/JPY Price Forecast: Rebounds but struggles at 150.00 amid bearish pressure
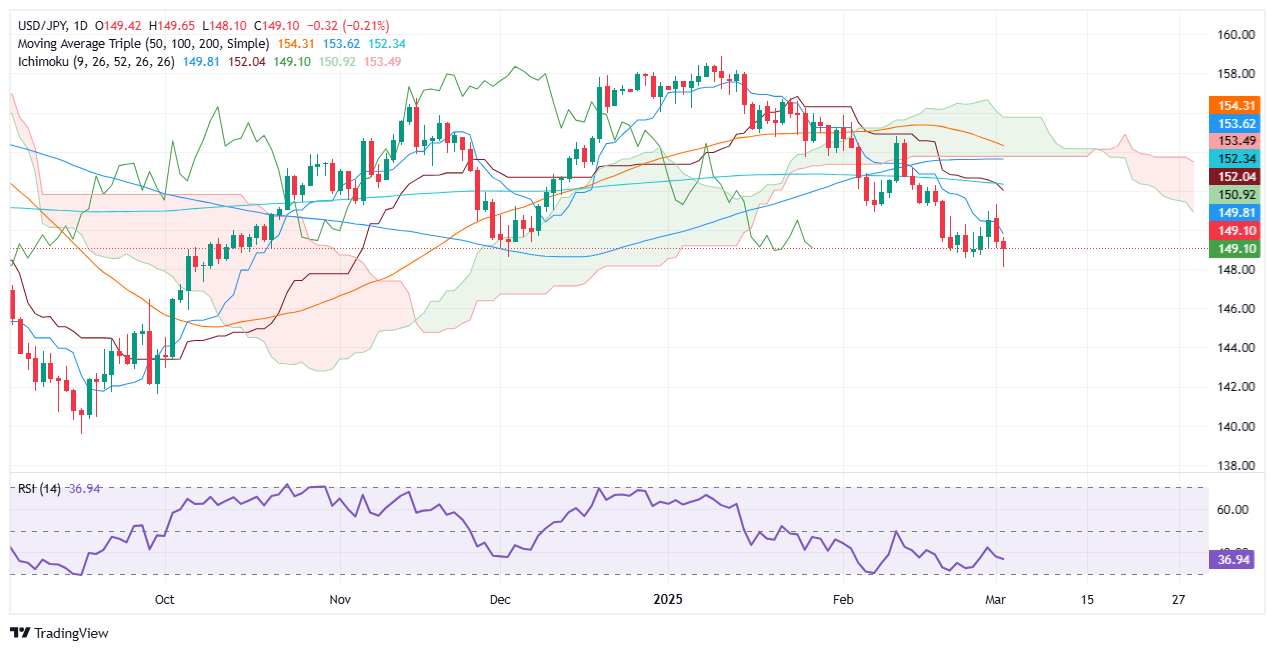
- USD/JPY must clear 149.70 and 150.00 to regain bullish momentum.
- Key resistance lies at 151.99-152.32, confluence of Kijun-Sen and 200-day SMA.
- Failure to hold above 148.57 could open the door for a drop to 141.64.
The USD/JPY advances some 0.17% late during the North American session, yet it remains shy of the 150.00 figure after slumping to a new year-to-date (YTD) low of 148.09. At the time of writing, the pair trades at 149.73.
USD/JPY Price Forecast: Technical outlook
The pair is downwardly biased despite recovering some ground. USD/JPY buyers must clear the Tenkan-Sen at 149.70, which paves the way for further upside. The next resistance is 150.00, and a daily close above the latter could cement the chance to challenge the confluence of the Kijun-Sen and the 200-day Simple Moving Average (SMA) around 151.99-152.32.
Nevertheless, the path of least resistance is for a bearish continuation as depicted by the Relative Strength Index (RSI), but USD/JPY needs to surpass below the February 25 swing low of 148.57, which could drive the pair towards the September 30 through at 141.64.
USD/JPY Price Chart – Daily
Japanese Yen FAQs
The Japanese Yen (JPY) is one of the world’s most traded currencies. Its value is broadly determined by the performance of the Japanese economy, but more specifically by the Bank of Japan’s policy, the differential between Japanese and US bond yields, or risk sentiment among traders, among other factors.
One of the Bank of Japan’s mandates is currency control, so its moves are key for the Yen. The BoJ has directly intervened in currency markets sometimes, generally to lower the value of the Yen, although it refrains from doing it often due to political concerns of its main trading partners. The BoJ ultra-loose monetary policy between 2013 and 2024 caused the Yen to depreciate against its main currency peers due to an increasing policy divergence between the Bank of Japan and other main central banks. More recently, the gradually unwinding of this ultra-loose policy has given some support to the Yen.
Over the last decade, the BoJ’s stance of sticking to ultra-loose monetary policy has led to a widening policy divergence with other central banks, particularly with the US Federal Reserve. This supported a widening of the differential between the 10-year US and Japanese bonds, which favored the US Dollar against the Japanese Yen. The BoJ decision in 2024 to gradually abandon the ultra-loose policy, coupled with interest-rate cuts in other major central banks, is narrowing this differential.
The Japanese Yen is often seen as a safe-haven investment. This means that in times of market stress, investors are more likely to put their money in the Japanese currency due to its supposed reliability and stability. Turbulent times are likely to strengthen the Yen’s value against other currencies seen as more risky to invest in.
-
22:02
Australia Judo Bank Services PMI below expectations (51.4) in February: Actual (50.8)
-
22:02
Australia Judo Bank Composite PMI down to 50.6 in February from previous 51.2
-
21:45
Australia Gross Domestic Product set to show a modest uptick in the last quarter of 2024
- Australian Gross Domestic Product is foreseen at 0.5% in the last quarter of 2024.
- The Reserve Bank of Australia hinted at a cautious approach to interest rate cuts.
- The Australian Dollar could run towards 0.6300 vs the USD on an upbeat GDP report.
The Australian Gross Domestic Product (GDP) will be out early on Wednesday. The fourth quarter (Q4) figures released by the Australian Bureau of Statistics (ABS) are expected to show that the economy made modest progress in the last three months of 2024. The quarter-on-quarter (QoQ) GDP is foreseen at 0.5%, improving from the 0.3% posted in the previous quarter, while the annualised reading is foreseen at 1.2% after posting 0.8% in Q3.
Slow progress in Australia is partially due to the Reserve Bank of Australia (RBA), as the central bank decided to maintain interest rates on hold at multi-decade highs throughout 2024 to fight stubbornly high inflation.
What to expect from the Q4 GDP report
As said, the Australian economy is expected to have posted a modest 1.2% annualised growth in the last quarter of 2024. GDP data tends to impact significantly the local currency, in this case, the Australian Dollar (AUD).
However, financial markets may take the figures with a pinch of salt. Indeed, record interest rates have weighed on economic developments, yet the RBA finally delivered an interest rate cut in its early February meeting. The Official Cash Rate (OCR) now stands at 4.1%, down 25 basis points (bps) from 4.35%, which means the impact of higher interest rates should start to recede. It will be a long process, but at least the Board took a first step, boosting investors’ hopes.
With time, rate reductions should help stabilise growth around long-term trends while keeping inflation within target. It is worth noting that real GDP per capita fell for seven consecutive quarters as of Q3 2024, driven by restricted household spending amid higher rates.
Meanwhile, it is also worth remembering that the RBA has had a cautious approach to interest rate cuts. The recently released Minutes showed the Board “was not yet assured” inflation could be returned to the target range with a lower OCR. “As a result, members expressed caution about the prospect of further policy easing, which could also be seen in the forecast for inflation based on the market path,” the document reads.
Ahead of the announcement, analysts from the Westpac Banking Corporations noted: “We have upgraded our forecast of economic growth following the latest batch of partial activity indicators in the run-up to Q4 GDP, due tomorrow. We now expect the economy grew by 0.7% in Q4, up from our initial estimate of 0.4% in our preview last week. The upside surprise on business inventories was met with a lower-than-anticipated growth in imports, albeit with some of the latter pointing to slightly softer domestic demand.”
At the same time, the National Australian Bank (NAB) expects a GDP print of 0.5% QoQ and 1.2% YoY. “We continue to expect GDP growth to strengthen over 2025 making H2 2024 the low point in growth for the cycle.”
How can the GDP report affect the Australian Dollar?
The GDP report will be released on Wednesday at 00:30 GMT. Ahead of the release, the Australian Dollar (AUD) struggles to advance against its American rival. The US Dollar (USD) is under selling pressure amid fresh fears of a United States (US) economic slowdown following US President Donald Trump’s decision to go on with tariffs on Canada, Mexico and China. At the same time, a risk-averse environment weighs on the Aussie, leaving the AUD/USD pair within familiar levels.
Generally speaking, upbeat figures should boost the AUD, while a slide should be expected if numbers miss expectations.
Valeria Bednarik, Chief Analyst at FXStreet, notes: “The AUD/USD pair trades just above the 0.6200 mark ahead of the announcement, trapped between USD broad weakness and risk aversion. The daily chart suggests bears retain control, albeit slides towards the 0.6200 figure are attracting buyers. The intraday low following Trump’s levies was set at 0.6201. The latter could give up on a discouraging GDP outcome and result in a slide towards the 0.6100-0.6130 region, as the dismal mood will add to the bearish case.”
Bednarik adds: “Stronger-than-anticipated Australian growth could help AUD/USD run past 0.6253, the weekly high, and reach the 0.6300 threshold. Beyond the latter, resistance comes at 0.6330 and 0.6370.”
Economic Indicator
Gross Domestic Product (YoY)
The Gross Domestic Product (GDP), released by the Australian Bureau of Statistics on a quarterly basis, is a measure of the total value of all goods and services produced in Australia during a given period. The GDP is considered as the main measure of Australian economic activity. The YoY reading compares economic activity in the reference quarter compared with the same quarter a year earlier. Generally, a rise in this indicator is bullish for the Australian Dollar (AUD), while a low reading is seen as bearish.
Read more.Next release: Wed Mar 05, 2025 00:30
Frequency: Quarterly
Consensus: 1.2%
Previous: 0.8%
Source: Australian Bureau of Statistics
The Australian Bureau of Statistics (ABS) releases the Gross Domestic Product (GDP) on a quarterly basis. It is published about 65 days after the quarter ends. The indicator is closely watched, as it paints an important picture for the economy. A strong labor market, rising wages and rising private capital expenditure data are critical for the country’s improved economic performance, which in turn impacts the Reserve Bank of Australia’s (RBA) monetary policy decision and the Australian dollar. Actual figures beating estimates is considered AUD bullish, as it could prompt the RBA to tighten its monetary policy.
Tariffs FAQs
Tariffs are customs duties levied on certain merchandise imports or a category of products. Tariffs are designed to help local producers and manufacturers be more competitive in the market by providing a price advantage over similar goods that can be imported. Tariffs are widely used as tools of protectionism, along with trade barriers and import quotas.
Although tariffs and taxes both generate government revenue to fund public goods and services, they have several distinctions. Tariffs are prepaid at the port of entry, while taxes are paid at the time of purchase. Taxes are imposed on individual taxpayers and businesses, while tariffs are paid by importers.
There are two schools of thought among economists regarding the usage of tariffs. While some argue that tariffs are necessary to protect domestic industries and address trade imbalances, others see them as a harmful tool that could potentially drive prices higher over the long term and lead to a damaging trade war by encouraging tit-for-tat tariffs.
During the run-up to the presidential election in November 2024, Donald Trump made it clear that he intends to use tariffs to support the US economy and American producers. In 2024, Mexico, China and Canada accounted for 42% of total US imports. In this period, Mexico stood out as the top exporter with $466.6 billion, according to the US Census Bureau. Hence, Trump wants to focus on these three nations when imposing tariffs. He also plans to use the revenue generated through tariffs to lower personal income taxes.
-
21:41
US Treasury Secretary Lutnick: Trump may roll back Canada and Mexico tariffs tomorrow
US Commerce Secretary Howard Lutnick, during a televised interview on Fox News, hinted that US President Donald Trump may be preparing to pivot on his own tariffs less than 48 hours after imposing them.
Key highlights
If USMCA rules followed, Trump is considering relief.
We will see tariff changes on April 2nd with Canada and Mexico.
The administration will balance the us budget.
Trump is to move with Canada and Mexico, but not all the way.
The tariffs compromise announcement is likely tomorrow.
Trump is considering relief for USMCA-compliant goods.
Trump may roll back Canada and Mexico tariffs tomorrow.
-
21:33
United States API Weekly Crude Oil Stock below expectations (-0.3M) in February 28: Actual (-1.455M)
-
21:00
Canadian Dollar roils on Tuesday as US tariffs begin
- The Canadian Dollar is churning on Tuesday and volatility is increasing.
- US President Trump’s 25% tariffs on Canadian goods kicked off on Tuesday.
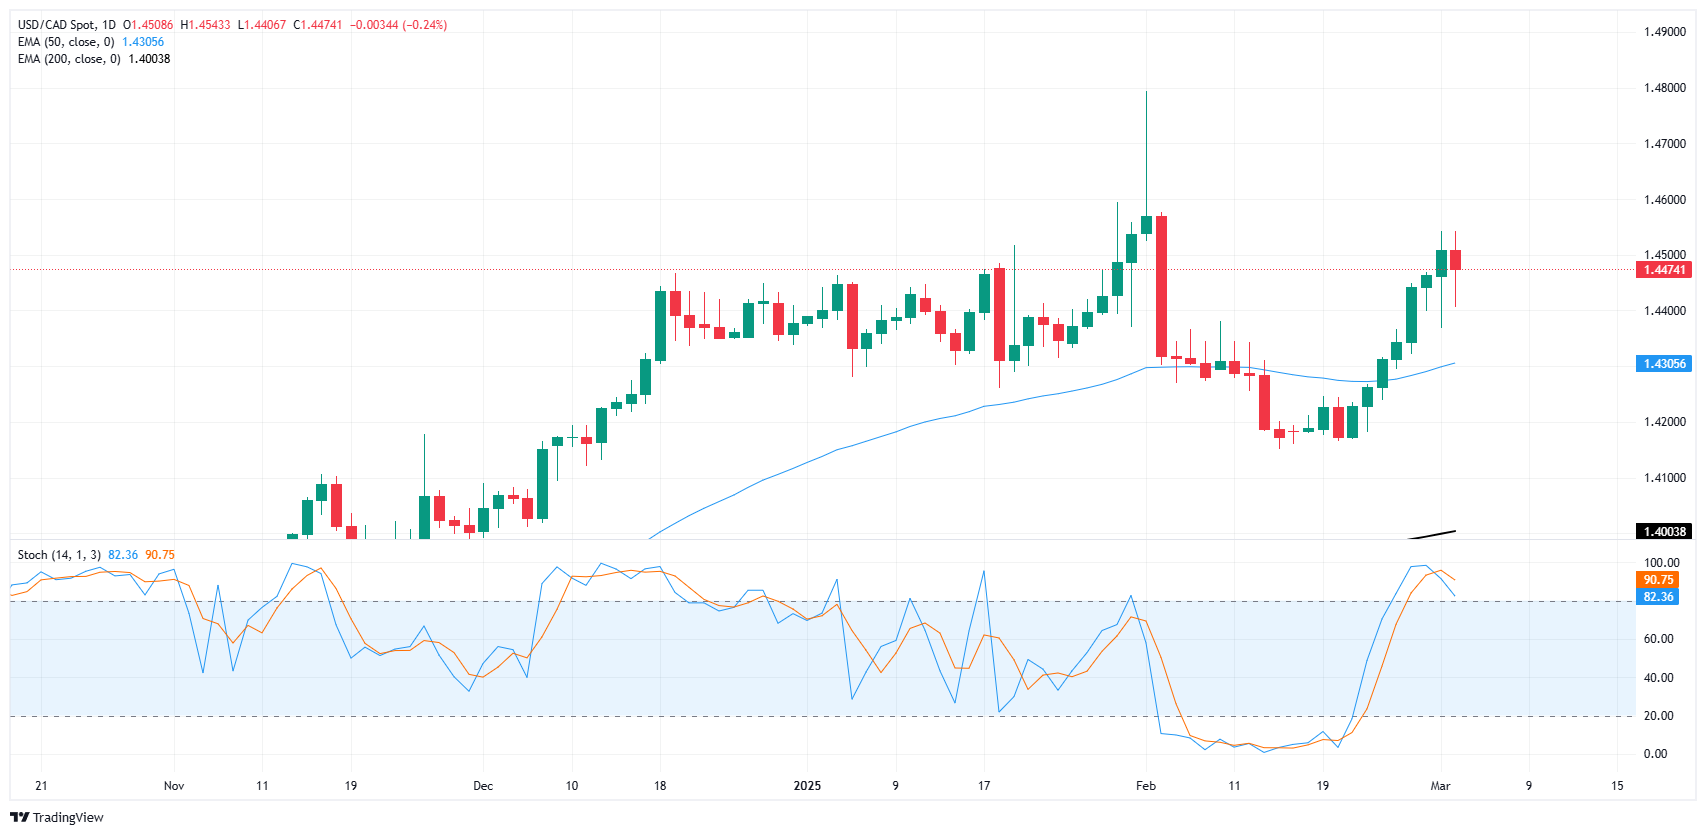
- USD/CAD remains pinned near 1.4500 as another NFP Friday looms ahead.
The Canadian Dollar churn on the charts on Tuesday, roiling inside of its technical cage, but stuck close to the 1.4500 handle against the Greenback. Traders are hunkering down to see potential economic fallout from US President Donald Trump’s 25% tariffs on all US imports of Canadian goods, as well as a reduced 10% tariff on Canadian-sourced energy products.
Canada has already responded with its own targeted tranches of economic penalties on US goods, sparking further ire from President Trump, who has already vowed to increase his planned ‘reciprocal tariffs’ by a commensurate amount.
Daily digest market movers: Trump’s 25% tariffs against Canada come into effect
- A 25% tariff on all Canadian goods and 10% on Canadian energy products has kicked off on Tuesday.
- Markets are bracing for economic fallout as tit-for-tat trade retaliations heats up quickly.
- Canadian Prime Minister Justin Trudeau has green-lit his own 25% retaliatory tariff on US goods bound for Canada, due to take effect in 21 days.
- US President Donald Trump has vowed to increase his planned ‘reciprocal tariffs’ in retaliation to Canada’s retaliatory tariffs.
- Another Nonfarm Payrolls (NFP) print looms ahead this Friday, as well as Canadian employment figures. Key economic data will take on a renewed focus as markets look out for signs of recession caused by tariffs.
Canadian Dollar price forecast
The Canadian Dollar continues to churn within near-term technical levels against the US Dollar, keeping USD/CAD trapped near the 1.4500 handle. Geopolitics has kicked volatility higher, but Loonie traders are apprehensive about pushing USD/CAD into new territory for the time being.
The Canadian Dollar is posted near multi-year lows against the US Dollar, keeping USD/CAD bid into the high end, but momentum remains limited for now as markets jostle for position and await political developments.
USD/CAD daily chart
Canadian Dollar FAQs
The key factors driving the Canadian Dollar (CAD) are the level of interest rates set by the Bank of Canada (BoC), the price of Oil, Canada’s largest export, the health of its economy, inflation and the Trade Balance, which is the difference between the value of Canada’s exports versus its imports. Other factors include market sentiment – whether investors are taking on more risky assets (risk-on) or seeking safe-havens (risk-off) – with risk-on being CAD-positive. As its largest trading partner, the health of the US economy is also a key factor influencing the Canadian Dollar.
The Bank of Canada (BoC) has a significant influence on the Canadian Dollar by setting the level of interest rates that banks can lend to one another. This influences the level of interest rates for everyone. The main goal of the BoC is to maintain inflation at 1-3% by adjusting interest rates up or down. Relatively higher interest rates tend to be positive for the CAD. The Bank of Canada can also use quantitative easing and tightening to influence credit conditions, with the former CAD-negative and the latter CAD-positive.
The price of Oil is a key factor impacting the value of the Canadian Dollar. Petroleum is Canada’s biggest export, so Oil price tends to have an immediate impact on the CAD value. Generally, if Oil price rises CAD also goes up, as aggregate demand for the currency increases. The opposite is the case if the price of Oil falls. Higher Oil prices also tend to result in a greater likelihood of a positive Trade Balance, which is also supportive of the CAD.
While inflation had always traditionally been thought of as a negative factor for a currency since it lowers the value of money, the opposite has actually been the case in modern times with the relaxation of cross-border capital controls. Higher inflation tends to lead central banks to put up interest rates which attracts more capital inflows from global investors seeking a lucrative place to keep their money. This increases demand for the local currency, which in Canada’s case is the Canadian Dollar.
Macroeconomic data releases gauge the health of the economy and can have an impact on the Canadian Dollar. Indicators such as GDP, Manufacturing and Services PMIs, employment, and consumer sentiment surveys can all influence the direction of the CAD. A strong economy is good for the Canadian Dollar. Not only does it attract more foreign investment but it may encourage the Bank of Canada to put up interest rates, leading to a stronger currency. If economic data is weak, however, the CAD is likely to fall.
-
20:59
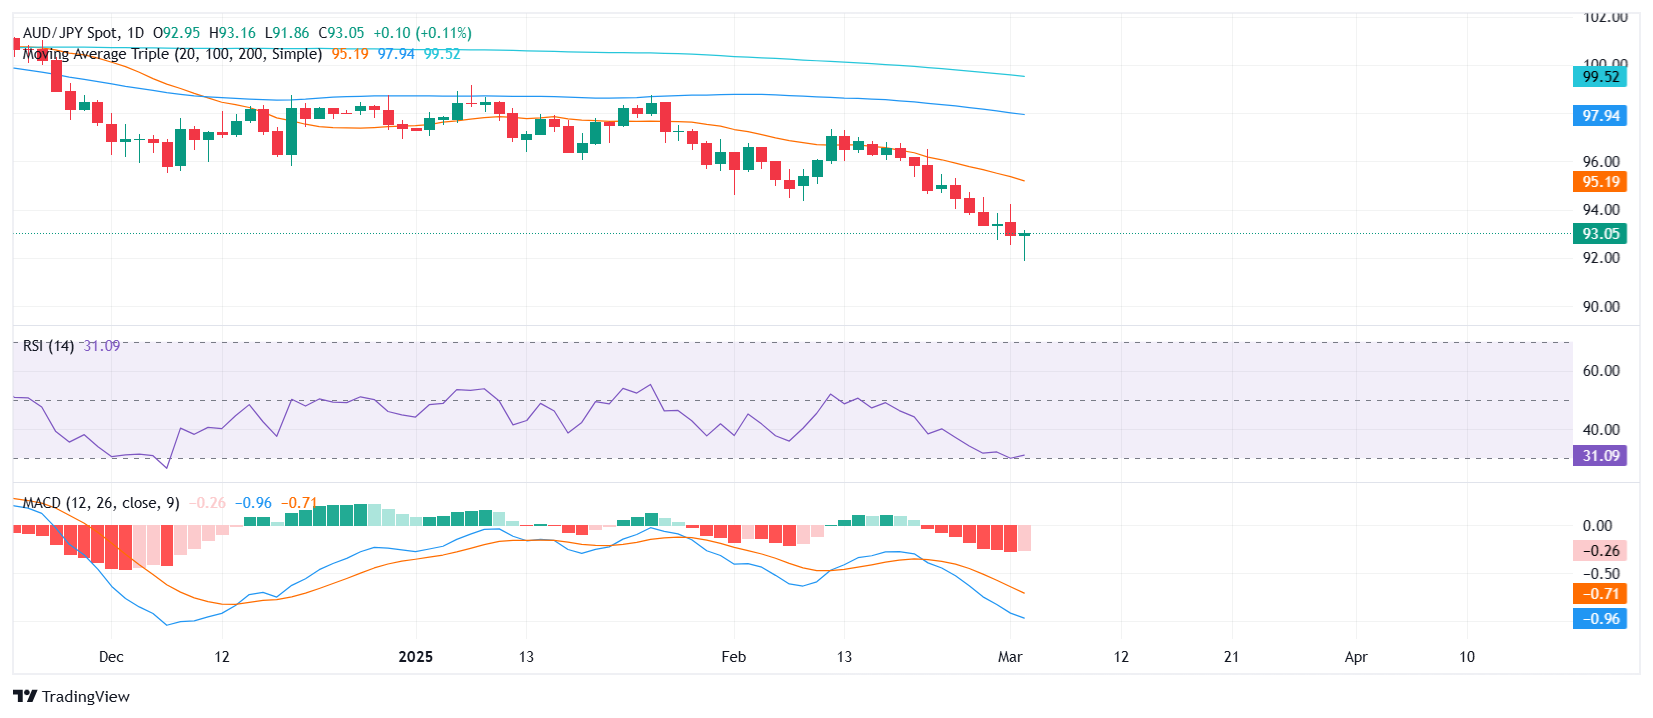
AUD/JPY Price Analysis: Sellers hit a wall after fresh multi-month lows
- AUD/JPY extended its decline ahead of the Asian session, trading near the 92.00 zone after a sharp drop.
- The pair fell to its lowest level since August 2024 but rebounded as sellers struggled to push further.
- Immediate resistance aligns near 92.60, while support remains at the recent low; indicators suggest possible consolidation.
AUD/JPY experienced a sharp drop on Tuesday, reaching its lowest level since August 2024 before bouncing back. The pair came under renewed selling pressure ahead of the Asian session but found strong support near the 92.00 region, leading to a mild recovery. Despite the brief bounce, bearish sentiment persists, with technical indicators still favoring downside risks.
The Relative Strength Index (RSI) continues to decline sharply within oversold territory, suggesting that sellers have dominated recent price action. Meanwhile, the Moving Average Convergence Divergence (MACD) prints decreasing red bars, signaling that selling momentum may be losing intensity. The latest price reaction hints at a possible consolidation phase, as sellers struggle to push lower.
Looking at support and resistance levels, immediate resistance stands near 92.60, followed by the 93.00 zone, which aligns with previous daily highs. On the downside, the recent low near 92.00 remains key support; a decisive break below this level could open the door for further losses. However, if consolidation takes hold, the pair may trade within a narrow range before its next directional move.
AUD/JPY daily chart
-
20:41
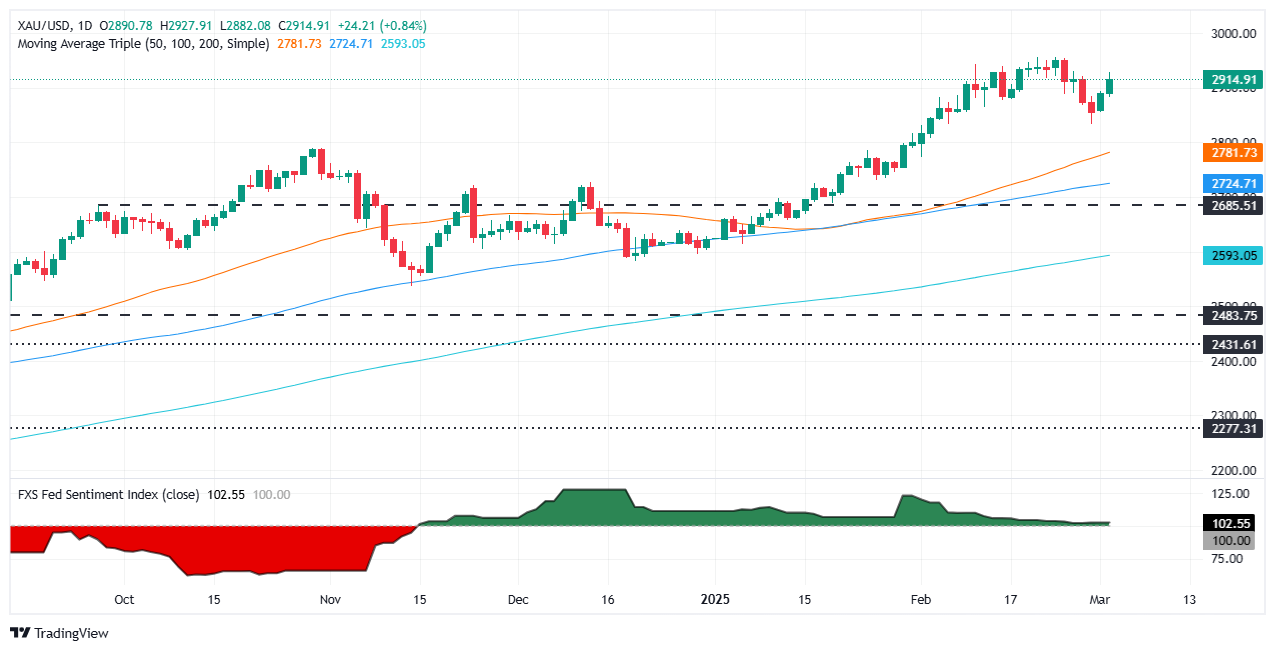
Gold price rises on US tariffs and recession fears, fueling haven demand
- XAU/USD climbs to $2,918 as weak US data weighs on the US Dollar.
- US imposes 25% tariffs on Mexico and Canada, 10% on China, boosting Gold’s appeal.
- Atlanta Fed GDP Now model slashes Q1 2025 forecast to -2.8%, stoking recession fears.
- Traders eye ISM Services PMI, Initial Jobless Claims and Nonfarm Payrolls for further cues.
Gold price climbs amid a soft US Dollar (USD) as the trade war between the United States (US), Canada, Mexico and China escalates with new tariffs taking effect on Tuesday. Therefore, the plunge of the USD underpins the precious metal. The XAU/USD is trading at $2,918, gaining 0.62%.
Market sentiment remains downbeat after 25% tariffs on Canada and Mexico and an additional 10% duties in China took effect around midnight. Consequently, traders seeking safety pushed Bullion prices higher on increased demand, while the Greenback dropped across the board.
Meanwhile, recently revealed US data sparked recessionary fears. The Atlanta Fed GDP Now Model projects the Gross Domestic Product (GDP) for Q1 2025 at -2.8%, down from 1.6% estimated on Monday.
On Monday, the February ISM and S&P Global Manufacturing PMI readings were mixed. The former slowed towards the expansion/contraction 50 thresholds, while the latter expanded solidly. US Treasury bond yields slumped on the data as traders began to price in the Federal Reserve's (Fed) interest rate cuts.
Therefore, traders seeking safety bought Bullion pushing prices on the way towards $2,900.
Gold traders' focus shifts toward the release of the ISM Services PMI, Initial Jobless Claims data and February’s Nonfarm Payrolls.
Daily digest market movers: Gold price surges amid pessimistic US economic outlook
- The US 10-year Treasury note climbs six basis points (bps) to 4.221%.
- US real yields, as measured by the US 10-year Treasury Inflation-Protected Securities (TIPS) yield, are rising six bps up to 1.858%.
- St. Louis Fed President Alberto Musalem said the economic outlook is for continued solid economic growth, but recent data pose some downside risks.
- Data from Prime Market Terminal revealed that money markets had priced in the Federal Reserve (Fed) easing policy by 74 basis points (bps), up from 70 bps last week.
XAU/USD technical outlook: Gold price surges above $2,900
After bottoming out at around $2,830, Gold buyers seem to have regained control and are poised to drive XAU/USD to retest the all-time high of $2,954. Although momentum is bullish, as depicted by the Relative Strength Index (RSI), buyers must reclaim $2,950 first. If the latter and the record high are hurdled, the next resistance would be the $3,000 mark.
On the other hand, Bullion sliding beneath $2,900 could pave the way for further downside. The first support would be the February 14 low of $2,877, followed by the February 12 swing low of $2,864.
Gold FAQs
Gold has played a key role in human’s history as it has been widely used as a store of value and medium of exchange. Currently, apart from its shine and usage for jewelry, the precious metal is widely seen as a safe-haven asset, meaning that it is considered a good investment during turbulent times. Gold is also widely seen as a hedge against inflation and against depreciating currencies as it doesn’t rely on any specific issuer or government.
Central banks are the biggest Gold holders. In their aim to support their currencies in turbulent times, central banks tend to diversify their reserves and buy Gold to improve the perceived strength of the economy and the currency. High Gold reserves can be a source of trust for a country’s solvency. Central banks added 1,136 tonnes of Gold worth around $70 billion to their reserves in 2022, according to data from the World Gold Council. This is the highest yearly purchase since records began. Central banks from emerging economies such as China, India and Turkey are quickly increasing their Gold reserves.
Gold has an inverse correlation with the US Dollar and US Treasuries, which are both major reserve and safe-haven assets. When the Dollar depreciates, Gold tends to rise, enabling investors and central banks to diversify their assets in turbulent times. Gold is also inversely correlated with risk assets. A rally in the stock market tends to weaken Gold price, while sell-offs in riskier markets tend to favor the precious metal.
The price can move due to a wide range of factors. Geopolitical instability or fears of a deep recession can quickly make Gold price escalate due to its safe-haven status. As a yield-less asset, Gold tends to rise with lower interest rates, while higher cost of money usually weighs down on the yellow metal. Still, most moves depend on how the US Dollar (USD) behaves as the asset is priced in dollars (XAU/USD). A strong Dollar tends to keep the price of Gold controlled, whereas a weaker Dollar is likely to push Gold prices up.
-
19:47
Fed's Williams: We're beginning to factor in tariff impact on prices
Federal Reserve (Fed) Bank of New York President John Williams spoke at the Bloomberg Invest Forum in New York on Tuesday, highlighting that although inflation pressures have eased and the US labor market appears strong, the Fed will have to take a close look at the fallout from the US tariff actions.
Key highlights
Details of tariffs are key to understand.
There's still a lot of uncertainty how tariffs will play out.
We will see some impact on inflation from tariffs.
Tariffs can also impact sentiment and weigh on growth.
We're beginning to factor in tariff impact on prices.
I have somewhat higher prices in outlook.
The US economy is in a good place, and the labor market has stabilized.
Infaltion has been gradually easing.
Monetary policy is in good position and we can adjust as needed.
I don't see need to change rate policy right now.
I expect growth to slow from last year's pace.
I'm watching inflation expectations very closely.
Worth watching University of Michigan inflation expectations data.
NY Fed data thus far has shown more stable inflation expectations.
Talk of tariffs impacting how people are thinking about near term inflation.
It's hard to have an economic outlook base case; it's more about scenarios.
It's really hard to know what Fed will do with rates this year.
Fed balance sheet strategy has not changed.
-
19:39
Australian Dollar trades lower above 0.6200 as Trump imposes additional tariffs on China
- The Aussie pair sees mild losses on Tuesday, trading in the 0.6200 zone during the American session.
- Selling pressure looms as President Trump announces an extra 10% tariff on China, compounding February’s similar levy.
- The pair records a fresh losing streak amid a negative outlook despite the US Dollar’s current weakness failing to lift the Aussie.
The AUD/USD pair is down around 0.1% near 0.6220 on Tuesday. This comes even as the US Dollar extends its downside, revisiting multi-week lows near 106.15 on the US Dollar Index (DXY).
President Donald Trump’s newly added 10% tariff on China clouds the Aussie’s prospects despite an anticipated rise in Australian Retail Sales data. Meanwhile, investors’ dovish Federal Reserve (Fed) bets, spurred by a decline in United States Personal Spending, fail to provide the Aussie with a solid footing.
Daily digest market movers: Tariffs weigh on the Aussie as traders eye Fed dovish stance
- President Trump’s decision to impose an additional 10% tariff on China intensifies concerns over global growth, especially as China is Australia’s leading export market. The extra levies follow the 10% duty introduced in February, heightening fear that Beijing may retaliate.
- Trump also threatening North American partners contributes to a cautious risk backdrop. Concerns linger that further US tariffs or retaliation from China could undermine global demand and put pressure on export-driven currencies like the AUD.
- Australian Retail Sales are expected to show a moderate increase, offering some cushion for the Aussie.
- Nonetheless, the Australian Dollar’s upside remains capped by slow growth prospects and uncertainty surrounding the next RBA move.
- Mounting market bets on a June Fed rate cut reflect a softer US Personal Spending figure, which stokes recession worries. The US Dollar, however, has seen renewed downside despite risk aversion, leaving the Aussie unable to capitalize on the Greenback’s overall fragility.
Technical analysis: Pair’s decline stalls, negative outlook stays
The AUD/USD pair declined by about 0.38% to a lower region around 0.6200 during Tuesday’s American session with selling pressure abating only slightly once the US Dollar lost steam. Notably, the pair has suffered a new losing streak, keeping the outlook negative from last week.
The Relative Strength Index (RSI) currently lies in a lower band, declining near the 30s, an indication of ongoing bearish momentum. The Moving Average Convergence Divergence (MACD) prints flat red bars, suggesting sellers remain dominant for now.
Having slipped under its 20-day Simple Moving Average (SMA), the Aussie remains vulnerable unless it reclaims that threshold. Immediate support stands near 0.6150, whereas any rebound would likely face resistance near the recent swing high within 0.6250–0.6270.
Australian Dollar FAQs
One of the most significant factors for the Australian Dollar (AUD) is the level of interest rates set by the Reserve Bank of Australia (RBA). Because Australia is a resource-rich country another key driver is the price of its biggest export, Iron Ore. The health of the Chinese economy, its largest trading partner, is a factor, as well as inflation in Australia, its growth rate and Trade Balance. Market sentiment – whether investors are taking on more risky assets (risk-on) or seeking safe-havens (risk-off) – is also a factor, with risk-on positive for AUD.
The Reserve Bank of Australia (RBA) influences the Australian Dollar (AUD) by setting the level of interest rates that Australian banks can lend to each other. This influences the level of interest rates in the economy as a whole. The main goal of the RBA is to maintain a stable inflation rate of 2-3% by adjusting interest rates up or down. Relatively high interest rates compared to other major central banks support the AUD, and the opposite for relatively low. The RBA can also use quantitative easing and tightening to influence credit conditions, with the former AUD-negative and the latter AUD-positive.
China is Australia’s largest trading partner so the health of the Chinese economy is a major influence on the value of the Australian Dollar (AUD). When the Chinese economy is doing well it purchases more raw materials, goods and services from Australia, lifting demand for the AUD, and pushing up its value. The opposite is the case when the Chinese economy is not growing as fast as expected. Positive or negative surprises in Chinese growth data, therefore, often have a direct impact on the Australian Dollar and its pairs.
Iron Ore is Australia’s largest export, accounting for $118 billion a year according to data from 2021, with China as its primary destination. The price of Iron Ore, therefore, can be a driver of the Australian Dollar. Generally, if the price of Iron Ore rises, AUD also goes up, as aggregate demand for the currency increases. The opposite is the case if the price of Iron Ore falls. Higher Iron Ore prices also tend to result in a greater likelihood of a positive Trade Balance for Australia, which is also positive of the AUD.
The Trade Balance, which is the difference between what a country earns from its exports versus what it pays for its imports, is another factor that can influence the value of the Australian Dollar. If Australia produces highly sought after exports, then its currency will gain in value purely from the surplus demand created from foreign buyers seeking to purchase its exports versus what it spends to purchase imports. Therefore, a positive net Trade Balance strengthens the AUD, with the opposite effect if the Trade Balance is negative.
-
19:15
Forex Today: Investors now look at the US labour market
The US Dollar extended its intense sell-off on Tuesday, retreating to levels last seen in early December as investors remained concerned over the health of the US economy ahead of key data releases in the US labour market.
Here is what you need to know on Wednesday, March 5:
The US Dollar Index (DXY) broke below the 106.00 support to hit new three-month lows in response to rising worries over the US economy, while the extra decline in US also added to the sour sentiment. The ADP Employment Change takes centre stage seconded by the final S&P Global Services PMI, the ISMM Services PMI, Factory Orders, the Fed Beige Book and the EIA’s weekly report on US crude oil stockpiles.
EUR/USD extended its march north, reaching new yearly peaks around 1.0550 on the back of the persistent offered bias in the US Dollar. Next on tap in the region will be the Unemployment Rate in the bloc, followed by the final HCOB Services PMIs in Germany and the euro area, as well as Producer Prices in the euro zone.
GBP/USD added to Monday’s uptick beyond 1.2700 the figure and hit new three-month peaks in the 1.2745-1.2750 band. The final S&P Global Services PMI is due followed by speeches by the BoE’s Bailey and Pill.
USD/JPY plummeted to five-month lows on Tuesday, challenging the key contention zone around 148.00. All the attention will be on Japan’s Unemployment Rate along with Capital Spending figures and the Consumer Confidence print.
AUD/USD failed to maintain its initial bull run to the proximity of 0.6250, although it managed well to keep the trade above the 0.6200 mark and chart humble gains for the day. Markets’ attention will be on the publication of the Ai Group Industry Index, seconded by the final S&P Global Services PMI, and key Q4 GDP Growth Rate.
The combination of geopolitical concerns, the OPEC+ plans to hike production in April and US tariffs sent prices of the barrel of WTI to new yearly lows near the $67.00 mark.
Gold prices added to Monday’s optimism and extended further its surpass of the key $2,900 mark per troy ounce on the back of steady safe haven demand. Silver prices advanced further and flirted with multi-day highs near the 432.00 mark per ounce.
-
18:36
US President Donald Trump vows to increase reciprocal tariffs on Canada
United States (US) President Donald Trump has hit the ground running on his latest tariffs, vowing to impose additional "reciprocal tariffs" on Canada in response to Canada's retaliatory trade actions against Trump's 25% tariff on all Canadian goods crossing the border into the US.
Tit-for-tat trade wars that accomplish little but cost consumers in both countries was a hallmark of President Trump's first term in office, and Donald Trump appears keen to set new records as he risks sparking recessions both at home and abroad barely six weeks into his second term.
Key highlights
Please explain to Governor (sic) Trudeau, of Canada, that when he puts on a Retaliatory Tariff on the US, our Reciprocal Tariff will immediately increase by a like amount!
US reciprocal tariff will increase to retaliatory level.
-
18:25
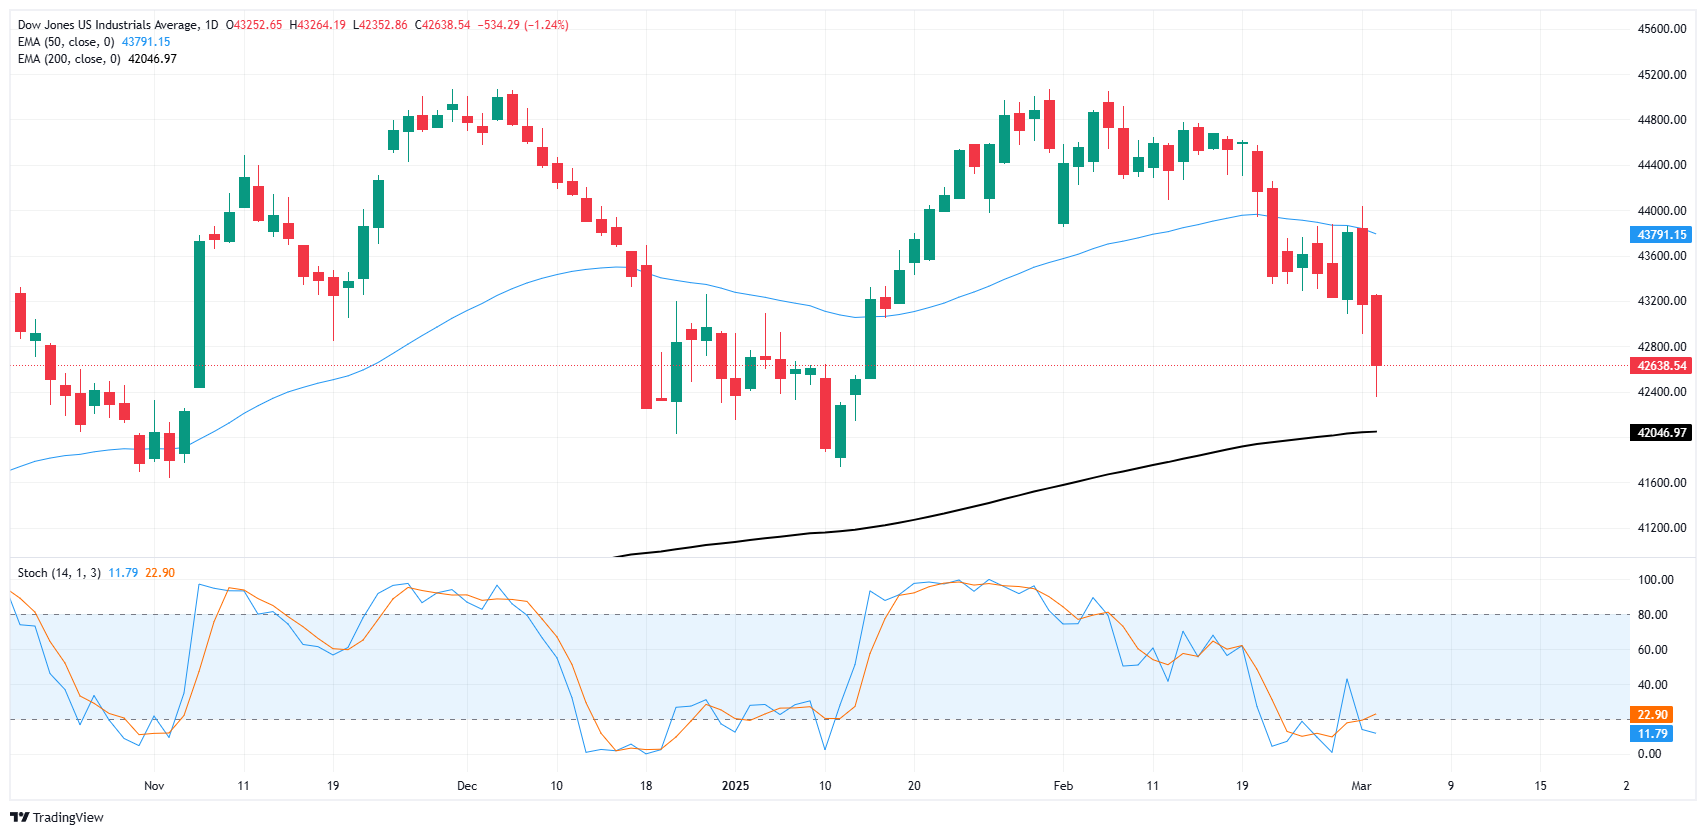
Dow Jones Industrial Average sinks 550 points as tariffs kick off
- The Dow Jones lost 550 points on Tuesday, falling to 42,600.
- Trump’s new and improved trade war kicked off with new tariffs on Canada and Mexico.
- US data remains limited through the midweek as politics and policy headlines dominate.
The Dow Jones Industrial Average (DJIA) tumbled 700 points at its lowest on Tuesday as investor sentiment hits the floorboards. After the initial sticker shock on new import taxes, markets recovered some footing, but the Dow Jones remains down around 550 points.
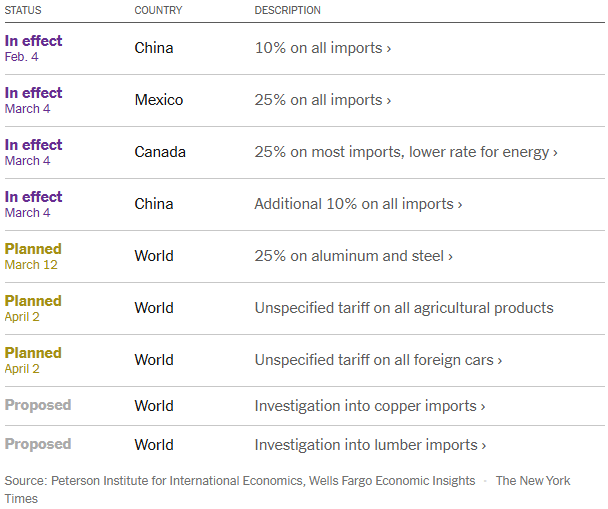
United States (US) President Donald Trump has kicked off his second, bigger global trade war by imposing a stiff 25% tariff on all imported goods from Canada and Mexico, as well as adding on an additional 10% import tax on China, bringing China’s tariff total to 20%. Further tariff packages are still in the oven, with the Trump administration planning to target aluminum, steel, agriculture goods, foreign cars, copper, and lumber.
Rate markets are now pricing in around 100 bps of interest rate cuts through the end of the year, with the first quarter-point rate trim expected in June. ADP Employment Change figures are due on Wednesday and will serve as a preview of this Friday’s upcoming Nonfarm Payrolls (NFP) jobs report. Markets will be watching economic figures with renewed anxiety as investors hunker down for negative impacts from President Trump’s sweeping tariff packages.
Dow Jones news
The overwhelming majority of securities listed on the Dow Jones are in the red on Tuesday, with slim recovery gains in UnitedHealth (UNH) and Nvidia (NVDA), which gained around 1.8% and 1.1%, respectively. UNH is trading back above $475 per share, while Nvidia is grappling with $115.
Boeing (BA) tumbled 5.5% to $160 per share, with American Express (AXP) and 3M (MMM) falling around 4.5% apiece, to $281 and $146 per share, respectively. Entire industry sectors are falling back in their own reactions to tariffs, with key losses concentrated in financials.
Dow Jones price forecast
Tuesday’s backslide puts the Dow Jones Industrial Average on pace to make contact with the 200-day Exponential Moving Average (EMA) near 42,060 for the first time since November of 2023. The Dow Jones has fallen nearly 1,700 points in two days top-to-bottom, shedding 3.8% in the process.
Momentum is fully in the bears’ control in the near-term, but the 42,000 price handle could prove to be a major challenge to further downside unless market fundamentals continue to roil. Technical oscillators remain in oversold territory, and could signal a prime opportunity for a bullish recovery if bidders gather themselves in time.
Dow Jones daily chart
Dow Jones FAQs
The Dow Jones Industrial Average, one of the oldest stock market indices in the world, is compiled of the 30 most traded stocks in the US. The index is price-weighted rather than weighted by capitalization. It is calculated by summing the prices of the constituent stocks and dividing them by a factor, currently 0.152. The index was founded by Charles Dow, who also founded the Wall Street Journal. In later years it has been criticized for not being broadly representative enough because it only tracks 30 conglomerates, unlike broader indices such as the S&P 500.
Many different factors drive the Dow Jones Industrial Average (DJIA). The aggregate performance of the component companies revealed in quarterly company earnings reports is the main one. US and global macroeconomic data also contributes as it impacts on investor sentiment. The level of interest rates, set by the Federal Reserve (Fed), also influences the DJIA as it affects the cost of credit, on which many corporations are heavily reliant. Therefore, inflation can be a major driver as well as other metrics which impact the Fed decisions.
Dow Theory is a method for identifying the primary trend of the stock market developed by Charles Dow. A key step is to compare the direction of the Dow Jones Industrial Average (DJIA) and the Dow Jones Transportation Average (DJTA) and only follow trends where both are moving in the same direction. Volume is a confirmatory criteria. The theory uses elements of peak and trough analysis. Dow’s theory posits three trend phases: accumulation, when smart money starts buying or selling; public participation, when the wider public joins in; and distribution, when the smart money exits.
There are a number of ways to trade the DJIA. One is to use ETFs which allow investors to trade the DJIA as a single security, rather than having to buy shares in all 30 constituent companies. A leading example is the SPDR Dow Jones Industrial Average ETF (DIA). DJIA futures contracts enable traders to speculate on the future value of the index and Options provide the right, but not the obligation, to buy or sell the index at a predetermined price in the future. Mutual funds enable investors to buy a share of a diversified portfolio of DJIA stocks thus providing exposure to the overall index.
-
18:09
President Trump’s Capitol address: The agenda takes shape
US President Donald Trump will address Congress from the US Capitol at around 02:00 GMT Wednesday, marking his first appearance before lawmakers since retaking the White House. He’s expected to outline his vision for a wide range of domestic and foreign policy initiatives.
In his second term, President Trump has wasted no time getting started. He’s signed a series of executive orders in just a few weeks, and he promises even more are on the way. During his inaugural speech, he declared that “the golden age of America” had arrived, identifying immigration, trade, and national security as top priorities.
On the international front, the President recently held a turbulent Oval Office meeting with Ukrainian President Volodymyr Zelensky. Following that meeting, he announced a pause on military aid to Ukraine.
Turning to trade, another round of tariffs went into effect on March 4. Tariffs on Chinese imports have doubled to 20%, while imports from Canada and Mexico now face a 25% tariff (with a lower 10% rate for Canadian energy). President Trump also revealed plans to impose tariffs on “external” agricultural products starting April 2, along with automobile tariffs and country-by-country reciprocal tariffs set to begin the same day.
-
17:47
US Dollar slides further as tariff tensions escalate
- DXY extends Monday’s losses, dropping below 106.00 amid trade tensions.
- Canada and China retaliate against US tariffs, increasing economic uncertainty.
- Technical indicators suggest a bearish crossover is forming, which may push the Greenback lower.
The US Dollar Index (DXY), which measures the Greenback's value against six major currencies, suffers another leg lower on Tuesday, adding to Monday’s losses and losing the key support of 106.00. Investors dumped the US Dollar after the US confirmed new tariffs on Canada, Mexico, and China with no last-minute extensions granted. As Canada and China announced countermeasures, further stoking market volatility.
Daily digest market movers: US Dollar tumbles amid tariff battle
- Canada retaliates with 25% tariffs on US goods worth C$30 billion with more to come in three weeks. In line, China pushes back on US tariffs, adding to global trade tensions.
- US Treasury Secretary Scott Bessent reassures that rates will come down and expects Chinese manufacturers to absorb tariffs.
- Locally, after a set of mixed data, concerns rise over stagflation as slowing growth and persistent inflation threaten the US economy.
- Regarding the Federal Reserve’s next steps, the CME FedWatch Tool indicates an increasing probability of a Fed rate cut later this year with investors growing confident of a cut in June.
- Equities trade mixed with uncertainty over tariffs weighing on market sentiment.
DXY technical outlook: Bearish crossover looms as downside pressure builds
The US Dollar Index continues to decline, slipping below both the 20-day and 100-day Simple Moving Averages (SMA), which are on the verge of forming a bearish crossover near 107.00. This pattern could signal further downside momentum for the US Dollar as Relative Strength Index (RSI) and Moving Average Convergence Divergence (MACD) indicators confirm growing selling pressure.
If the bearish crossover completes, it could open the door for further losses toward the 105.50-105.00 range in the short term. A recovery above 107.00 would be required to shift the near-term outlook back to neutral.
Tariffs FAQs
Tariffs are customs duties levied on certain merchandise imports or a category of products. Tariffs are designed to help local producers and manufacturers be more competitive in the market by providing a price advantage over similar goods that can be imported. Tariffs are widely used as tools of protectionism, along with trade barriers and import quotas.
Although tariffs and taxes both generate government revenue to fund public goods and services, they have several distinctions. Tariffs are prepaid at the port of entry, while taxes are paid at the time of purchase. Taxes are imposed on individual taxpayers and businesses, while tariffs are paid by importers.
There are two schools of thought among economists regarding the usage of tariffs. While some argue that tariffs are necessary to protect domestic industries and address trade imbalances, others see them as a harmful tool that could potentially drive prices higher over the long term and lead to a damaging trade war by encouraging tit-for-tat tariffs.
During the run-up to the presidential election in November 2024, Donald Trump made it clear that he intends to use tariffs to support the US economy and American producers. In 2024, Mexico, China and Canada accounted for 42% of total US imports. In this period, Mexico stood out as the top exporter with $466.6 billion, according to the US Census Bureau. Hence, Trump wants to focus on these three nations when imposing tariffs. He also plans to use the revenue generated through tariffs to lower personal income taxes.
-
17:09
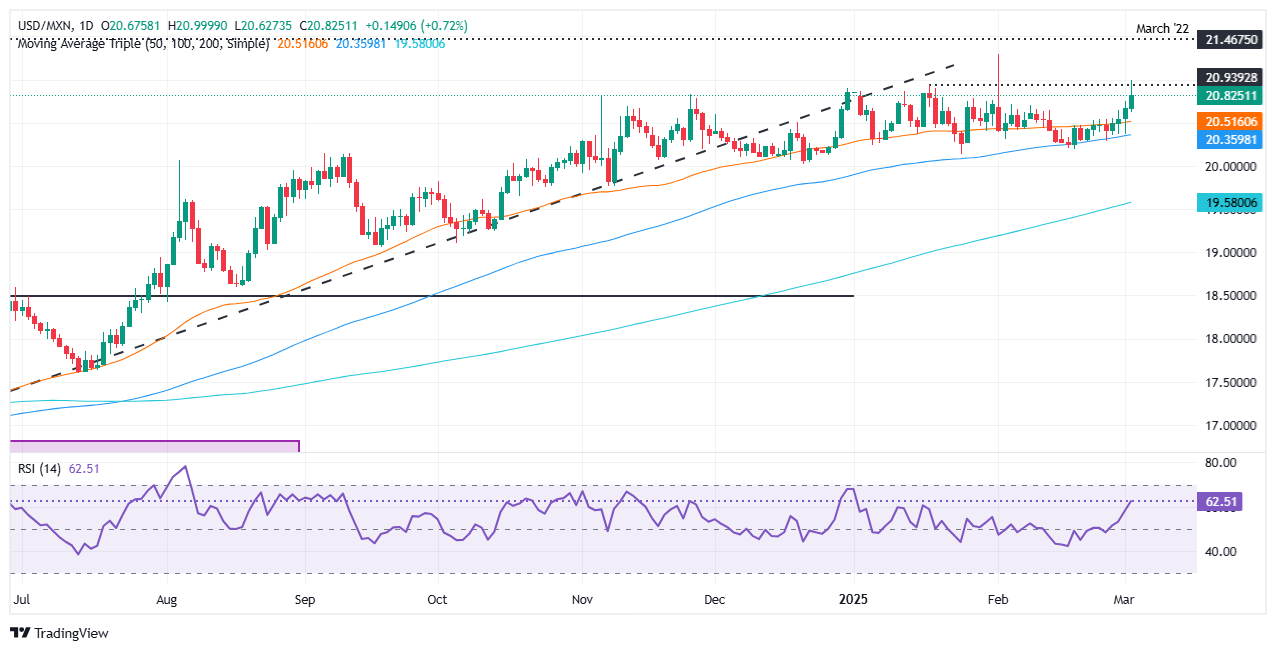
Mexican Peso sinks as Trump’s tariffs send Peso to four-week low
- The Mexican Peso plunges 1.79% as trade tensions escalate, nearing the 21.00 mark
- Trump enacts 25% tariffs on Mexico, citing fentanyl and immigration concerns.
- President Sheinbaum condemns the move and vows retaliatory tariff and non-tariff measures.
- Mexico’s economy slows as S&P Global Manufacturing PMI contracts to 47.6.
The Mexican Peso (MXN) plunged sharply against the US Dollar (USD) on Tuesday as the 25% tariffs imposed on Mexico by the President of the United States (US), Donald Trump, commenced. This sent the Peso sliding into a four-week low of 20.99, a whisker of clearing the 21.00 handle. At the time of writing, the USD/MXN is trading at 20.89, gaining over 1.79%.
According to Trump, Mexico failed to do enough to stop fentanyl traffic and illegal immigration. Meanwhile, his counterpart, President Claudia Sheinbaum, condemned Trump's decision, saying it was unjustified. Sheinbaum promised to respond with tariff and non-tariff measures and added she would reveal details of the response at an event on Sunday.
As tariffs began, the USD/MXN pair soared sharply to 20.70 during the overnight session before rallying sharply to 20.99 early in the North American session.
Mexico’s economic docket remains absent, yet Monday’s data underscored that the economy is slowing sharply as businesses take measures against US tariffs. The S&P Global Manufacturing PMI for the last month contracted from 49.1 to 47.6. Business Confidence revealed by INEGI deteriorated further, yet it remained above the 50 threshold in February.
Daily digest market movers: Mexican Peso heavy as tariffs on Mexico begin
- Banco de México's (Banxico) private economists' survey indicated that economic growth is expected to remain below 1%, while inflation expectations remained unchanged.
- The poll showed that GDP growth for 2025 is now projected at 0.81%, down from 1%. Headline inflation is forecast to end at 3.71%, slightly lower than the previous 3.83%, while core CPI is expected to finish at 3.75%, unchanged from the prior estimate.
- Economists now predict the USD/MXN exchange rate to close in 2025 at 20.85, slightly lower than the 20.90 projection in the previous survey. However, for 2026, they anticipate a sharper depreciation of the Peso, well beyond the 21.30 level expected in January’s poll.
- Business activity in the US remains mixed, as the ISM shows the economy slowed, while the S&P Global Manufacturing PMI jumped. Nevertheless, the Atlanta Fed GDP Now model foresees the Gross Domestic Product (GDP) for Q1 2025 to slow sharply, by -2.8%.
- Hence, money market traders had priced in 81 basis points of easing in 2025, up from last week’s 70 bps via data from the Chicago Board of Trade (CBOT).
- Trade disputes between the US and Mexico remain front and center. If countries could come to an agreement, this could pave the way for a recovery of the Mexican currency. Otherwise, further USD/MXN upside is seen, as US tariffs could trigger a recession in Mexico.
USD/MXN technical outlook: Mexican Peso tanks as USD/MXN hovers near 21.00
The uptrend remains in place, though the USD/MXN pair has retraced the early move shy of 21.00, which if cleared, could’ve exposed the year-to-date (YTD) peak of 21.28. Nevertheless, buyers are in charge, as they surpassed the 20.50 figure, and they are gathering momentum as depicted in the Relative Strength Index (RSI).
With that said, USD/MXN first resistance would be today’s peak at 20.99. On further strength, the YTD high is up next at 21.28, followed by last year’s high of 21.46.
For a bearish continuation, USD/MXN must clear the 20.50 figure, ahead of the 50-day Simple Moving Average (SMA) at 20.48. If cleared, up next is the 100-day SMA at 20.32, followed by the 20.00 figure.
Mexican Peso FAQs
The Mexican Peso (MXN) is the most traded currency among its Latin American peers. Its value is broadly determined by the performance of the Mexican economy, the country’s central bank’s policy, the amount of foreign investment in the country and even the levels of remittances sent by Mexicans who live abroad, particularly in the United States. Geopolitical trends can also move MXN: for example, the process of nearshoring – or the decision by some firms to relocate manufacturing capacity and supply chains closer to their home countries – is also seen as a catalyst for the Mexican currency as the country is considered a key manufacturing hub in the American continent. Another catalyst for MXN is Oil prices as Mexico is a key exporter of the commodity.
The main objective of Mexico’s central bank, also known as Banxico, is to maintain inflation at low and stable levels (at or close to its target of 3%, the midpoint in a tolerance band of between 2% and 4%). To this end, the bank sets an appropriate level of interest rates. When inflation is too high, Banxico will attempt to tame it by raising interest rates, making it more expensive for households and businesses to borrow money, thus cooling demand and the overall economy. Higher interest rates are generally positive for the Mexican Peso (MXN) as they lead to higher yields, making the country a more attractive place for investors. On the contrary, lower interest rates tend to weaken MXN.
Macroeconomic data releases are key to assess the state of the economy and can have an impact on the Mexican Peso (MXN) valuation. A strong Mexican economy, based on high economic growth, low unemployment and high confidence is good for MXN. Not only does it attract more foreign investment but it may encourage the Bank of Mexico (Banxico) to increase interest rates, particularly if this strength comes together with elevated inflation. However, if economic data is weak, MXN is likely to depreciate.
As an emerging-market currency, the Mexican Peso (MXN) tends to strive during risk-on periods, or when investors perceive that broader market risks are low and thus are eager to engage with investments that carry a higher risk. Conversely, MXN tends to weaken at times of market turbulence or economic uncertainty as investors tend to sell higher-risk assets and flee to the more-stable safe havens.
-
16:21
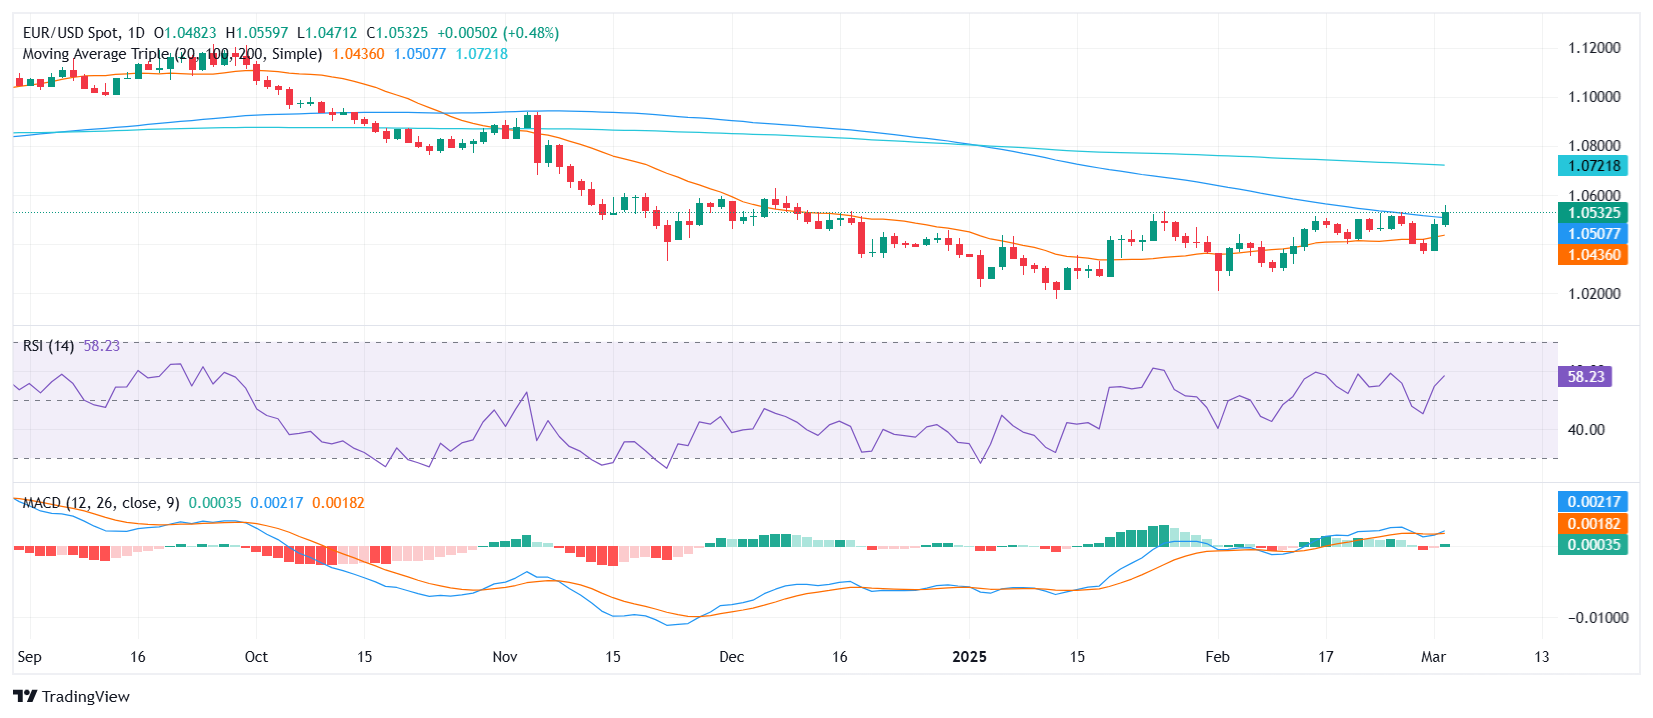
EUR/USD Price Analysis: Bulls extend gains above key resistance levels
- EUR/USD climbed higher after the European session, trading near the 1.0520 zone as bullish momentum strengthened.
- The pair pushed further above the 100-day SMA, adding nearly 1.40% at the start of the week with indicators improving.
- Resistance emerges near 1.0560, while support is seen at 1.0480; a failure to hold above key levels may invite selling pressure.
EUR/USD extended its advance on Tuesday, holding steady above a key resistance area after gaining traction earlier in the session. The pair saw a notable push following the European session, building on its strong start to the week and continuing the bullish momentum. A fresh green bar on the Moving Average Convergence Divergence (MACD) and a mild rise in the Relative Strength Index (RSI), now in positive territory, indicate improving conditions for buyers.
Bulls managed to bring the pair above the 100-day Simple Moving Average (SMA), solidifying gains of nearly 1.40% since the beginning of the week. The RSI remains in positive territory, suggesting that buying interest is still intact, though not yet at overbought levels. Meanwhile, the MACD printing fresh green bars further supports the case for continued upside, though further confirmation is needed.
Looking at technical levels, immediate resistance stands around the 1.0560 area, where sellers could step in to cap further gains. If buyers manage to clear this level, a move toward the 1.0600 psychological handle could be in play. On the downside, the first relevant support lies at 1.0480, with a drop below this threshold possibly triggering a pullback toward the 20-day SMA near 1.0450.
EUR/USD daily chart
-
15:15
Mexico President Sheinbaum: We are responding with tariff, non-tariff measures
Mexican President Claudia Sheinbaum said on Tuesday that they will respond to the US' tariffs with tariff and non-tariff measures, as reported by Reuters.
Key takeaways
"Mexico took measurable steps to fight fentanyl trafficking and crime."
"There is no reason or justification for US tariff decision."
"US government also needs to take responsibility for opioid crisis."
"Cooperation between both countries is necessary to fight opioid crisis, crime."
"Not our plan to start a trade confrontation."
"No one wins with this decision."
"Will announce retaliatory measures on Sunday."
Market reaction
Safe-haven flows dominate the action in financial markets following these comments. At the time of press, the S&P 500 Index was down 1.6% on the day.
Tariffs FAQs
Tariffs are customs duties levied on certain merchandise imports or a category of products. Tariffs are designed to help local producers and manufacturers be more competitive in the market by providing a price advantage over similar goods that can be imported. Tariffs are widely used as tools of protectionism, along with trade barriers and import quotas.
Although tariffs and taxes both generate government revenue to fund public goods and services, they have several distinctions. Tariffs are prepaid at the port of entry, while taxes are paid at the time of purchase. Taxes are imposed on individual taxpayers and businesses, while tariffs are paid by importers.
There are two schools of thought among economists regarding the usage of tariffs. While some argue that tariffs are necessary to protect domestic industries and address trade imbalances, others see them as a harmful tool that could potentially drive prices higher over the long term and lead to a damaging trade war by encouraging tit-for-tat tariffs.
During the run-up to the presidential election in November 2024, Donald Trump made it clear that he intends to use tariffs to support the US economy and American producers. In 2024, Mexico, China and Canada accounted for 42% of total US imports. In this period, Mexico stood out as the top exporter with $466.6 billion, according to the US Census Bureau. Hence, Trump wants to focus on these three nations when imposing tariffs. He also plans to use the revenue generated through tariffs to lower personal income taxes.
-
15:06
United States RealClearMarkets/TIPP Economic Optimism (MoM) registered at 49.8, below expectations (53.1) in March
-
15:06
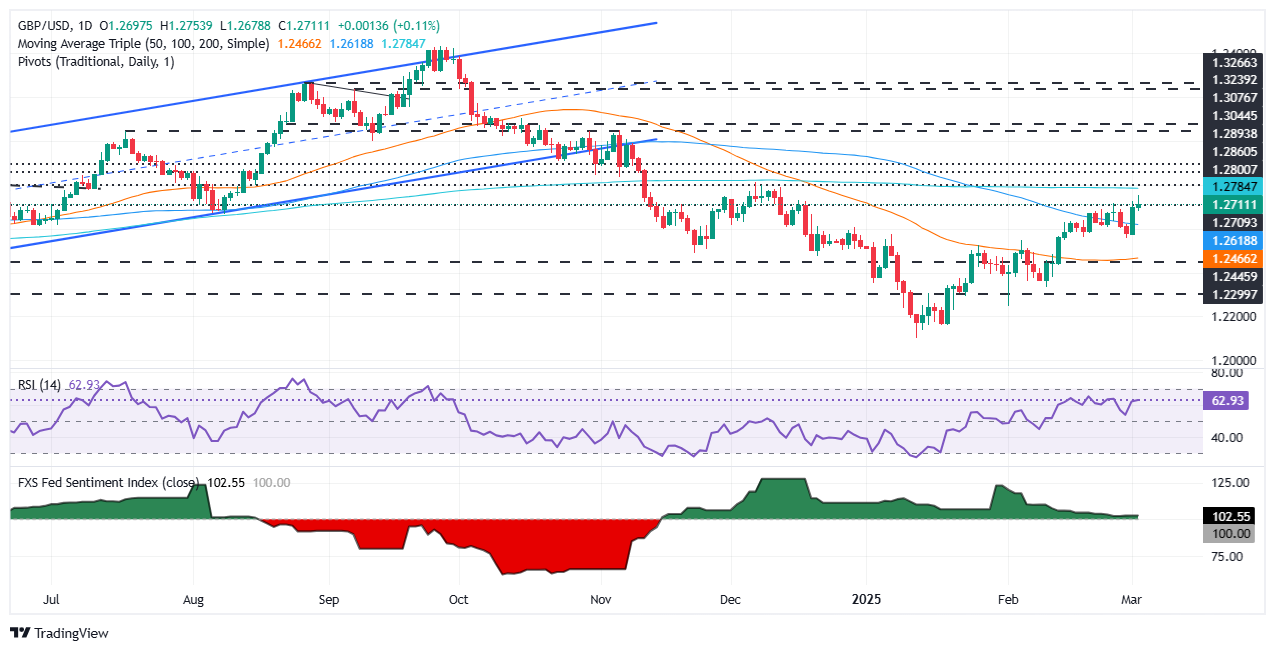
GBP/USD holds gain amid soft US Dollar on tariff fallout
- US tariffs on Mexico, Canada, and China weigh on risk sentiment, dragging USD lower.
- US Dollar Index (DXY) hits three-month low at 105.87 before recovering slightly.
- UK inflation risks rise as minimum wage hike adds pressure ahead of BoE rate cuts.
The Pound Sterling clings to early gains, extending its advance to two days versus the US Dollar as tariffs enacted by US President Donald Trump against Mexico, Canada, and China come into effect. Although the market is risk averse, traders punish the Greenback as the economic outlook darkens. The GBP/USD trades at 1.2708, up 0.08%
Sterling rises to 1.2708 as Greenback struggles on economic concerns
The economic calendar is light in the US, except for speeches by Federal Reserve officials. Tariffs of 25% on imports from Mexico and Canada and an additional 10% on Chinese products shifted investors' moods. Despite these measures being seen as inflation-prone, US Treasury bond yields are edging lower, with the 10-year T-note down seven basis points in the week at 4.132%.
Consequently, the US Dollar Index (DXY), which tracks the buck's behavior against a basket of six currencies, has fallen to a three-month low of 105.87. However, it has pared some of its losses, yet the DXY is down 0.33% at 106.20.
Across the pond, the British Retail Consortium (BRC) shop price index in February dropped -0.7 % YoY overnight. Nevertheless, prices rose 0.4% MoM due to a rise in food prices. BRC Chief Executive Helen Dickinson said that shop prices will likely increase further as retailers face a surge in annual costs this year due to a nearly 7% rise in the minimum wage on April 1.
This measure could put upward pressure on inflation at a time when the Bank of England (BoE) is embarking on an easing cycle. In January, the Consumer Price Index (CPI) rose by 3%, hitting a 10-month high. Ahead in the docket, BoE Governor Andrew Bailey would cross the wires on Wednesday.
In the US, market participants will be watching President Donald Trump address the US Congress at 01:00 GMT.
GBP/USD Price Forecast: Technical outlook
Despite reaching a new year-to-date (YTD) high of 1.2753, the GBP/USD retreated somewhat as market players digested US tariffs. Buyers lacked the strength to test the 200-day Simple Moving Average (SMA) at 1.2785, which could’ve sent the pair towards 1.2800 if cleared. On the other hand, if GBP/USD slumps beneath 1.2700, sellers would be poised to push prices toward the 100-day SMA at 1.2627, ahead of 1.2600.
Pound Sterling FAQs
The Pound Sterling (GBP) is the oldest currency in the world (886 AD) and the official currency of the United Kingdom. It is the fourth most traded unit for foreign exchange (FX) in the world, accounting for 12% of all transactions, averaging $630 billion a day, according to 2022 data. Its key trading pairs are GBP/USD, also known as ‘Cable’, which accounts for 11% of FX, GBP/JPY, or the ‘Dragon’ as it is known by traders (3%), and EUR/GBP (2%). The Pound Sterling is issued by the Bank of England (BoE).
The single most important factor influencing the value of the Pound Sterling is monetary policy decided by the Bank of England. The BoE bases its decisions on whether it has achieved its primary goal of “price stability” – a steady inflation rate of around 2%. Its primary tool for achieving this is the adjustment of interest rates. When inflation is too high, the BoE will try to rein it in by raising interest rates, making it more expensive for people and businesses to access credit. This is generally positive for GBP, as higher interest rates make the UK a more attractive place for global investors to park their money. When inflation falls too low it is a sign economic growth is slowing. In this scenario, the BoE will consider lowering interest rates to cheapen credit so businesses will borrow more to invest in growth-generating projects.
Data releases gauge the health of the economy and can impact the value of the Pound Sterling. Indicators such as GDP, Manufacturing and Services PMIs, and employment can all influence the direction of the GBP. A strong economy is good for Sterling. Not only does it attract more foreign investment but it may encourage the BoE to put up interest rates, which will directly strengthen GBP. Otherwise, if economic data is weak, the Pound Sterling is likely to fall.
Another significant data release for the Pound Sterling is the Trade Balance. This indicator measures the difference between what a country earns from its exports and what it spends on imports over a given period. If a country produces highly sought-after exports, its currency will benefit purely from the extra demand created from foreign buyers seeking to purchase these goods. Therefore, a positive net Trade Balance strengthens a currency and vice versa for a negative balance.
-
14:57
USD/JPY to trade at 145 in the end of the year – Rabobank
US President Trump is clearly far too busy to be an avid BoJ watcher. His comments that Japan and China are putting the US at an unfair disadvantage when they weaken their currencies suggests he may have missed the fact that the rounds of intervention implemented by the MoF since 2022 have been aimed at strengthening the JPY, Rabobank's FX analyst Jane Foley notes.
Downside risk to persist to the end of the year
"That said, Trump has a point because the JPY is undervalued against the USD, and indeed against most other G10 currencies, on many measures. The last few years saw a keen interest in the JPY carry trade as widened interest rate differentials drove speculators into short JPY positions vs the USD. This, however, has been changing. The BoJ is currently the only G10 central bank maintaining a tightening policy bias and, in reflection of this, the JPY is the best performing G10 currency in the year to date."
"Recently, a round of better-than-expected Japanese economic data has spurred the view that BoJ policy makers are preparing the ground for another rate hike, potentially around the middle of the year. This has fuelled interest in the JPY. The problem, however, is that this trade has become crowded. In a sharp reversal from last year’s holdings of net short JPY positions, latest CFTC speculators’ data suggest that the level of net JPY longs has reached the highest level ever."
"In these circumstances, a round of profit-taking wouldn’t be surprising as the market awaits fresh incentive to renew its JPY longs. The JPY rally did stutter in the last few sessions. However, it would appear that Trump’s comments have provided the incentive to renew interest in JPY longs. We maintain a year end forecast of USD/JPY145, with downside risk."
-
14:50
Silver Price Forecast: XAG/USD shows strength near $32 as global trade war escalates
- Silver price jumps to near $32.00 as the global trade war has intensified.
- China, Mexico, and China have announced retaliatory tariffs for the US.
- Fed dovish bets have weighed on the US Dollar and bond yields.
Silver price (XAG/USD) trades 0.5% higher around $32.00 in North American trading hours on Tuesday. The white metal exhibits strength as the trade war between the United States (US) and its North American peers, and China has intensified.
Canada, Mexico, and China have signaled retaliatory tariffs on imports from the US. On Monday, US President Donald Trump confirmed that 25% tariffs on Canada and Mexico, and 10% on China would come into effect from Tuesday.
Earlier in the day, Canadian Prime Minister Justin Trudeau said that Canada will impose “retaliatory tariffs on US imports” from Tuesday “if US tariffs go into effect”. The Chinese economy also announced tariffs on a slew of agricultural imports from the US. In the North American session on Tuesday, Mexican President Claudia Sheinbaum Pardo said that retaliatory tariffs are coming on Sunday as "Trump starts a global trade fight".
The scenario of heightened geopolitical tensions increases the safe-haven appeal of precious metals, such as Silver.
Meanwhile, sliding bond yields and the US Dollar (USD) have also strengthened the Silver price. 10-year US Treasury yields tumble to near 4.14%. The US Dollar Index (DXY), which tracks the Greenback’s value against six major currencies, slumps to near 106.00. US bond yields and the US Dollar have faced selling pressure as traders have raised bets supporting the Federal Reserve (Fed) to cut interest rates in the June policy meeting.
According to the CME FedWatch tool, the probability for the central bank to cut interest rates in June has increased to 87% from 71% recorded a week ago.
Silver technical analysis
Silver price moves higher but struggles to extend its upside above the 20-day Exponential Moving Average (EMA), which trades around $31.80.
The 14-day Relative Strength Index (RSI) falls inside the 40.00-60.00 range, suggesting that the bullish momentum has been faded. However, the bullish bias remains intact.
Looking down, the upward-sloping trendline from the August 8 low of $26.45 will act as key support for the Silver price around $30.00. While, the February 14 high of $33.40 will be the key barrier.
Silver daily chart
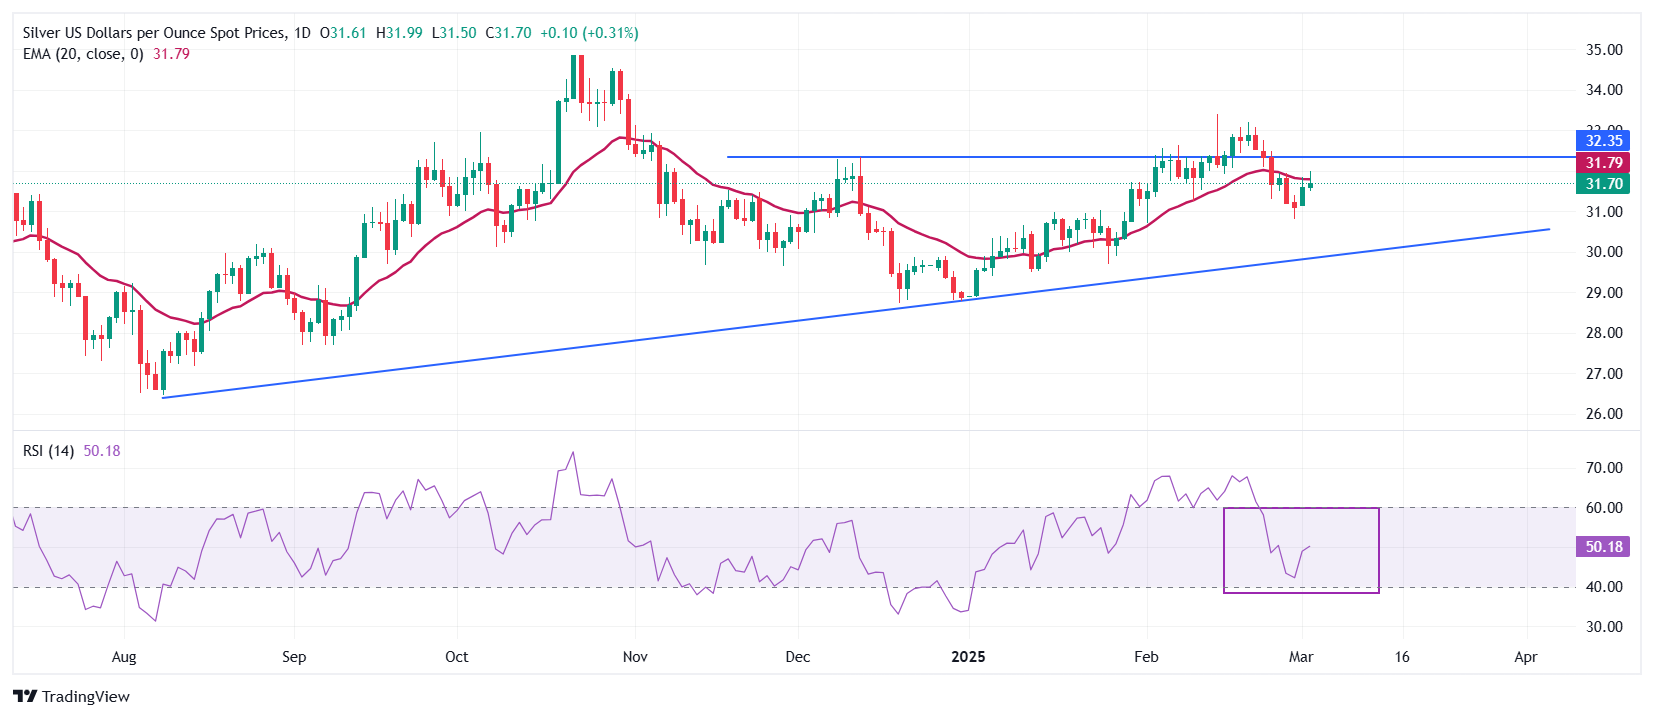
Silver FAQs
Silver is a precious metal highly traded among investors. It has been historically used as a store of value and a medium of exchange. Although less popular than Gold, traders may turn to Silver to diversify their investment portfolio, for its intrinsic value or as a potential hedge during high-inflation periods. Investors can buy physical Silver, in coins or in bars, or trade it through vehicles such as Exchange Traded Funds, which track its price on international markets.
Silver prices can move due to a wide range of factors. Geopolitical instability or fears of a deep recession can make Silver price escalate due to its safe-haven status, although to a lesser extent than Gold's. As a yieldless asset, Silver tends to rise with lower interest rates. Its moves also depend on how the US Dollar (USD) behaves as the asset is priced in dollars (XAG/USD). A strong Dollar tends to keep the price of Silver at bay, whereas a weaker Dollar is likely to propel prices up. Other factors such as investment demand, mining supply – Silver is much more abundant than Gold – and recycling rates can also affect prices.
Silver is widely used in industry, particularly in sectors such as electronics or solar energy, as it has one of the highest electric conductivity of all metals – more than Copper and Gold. A surge in demand can increase prices, while a decline tends to lower them. Dynamics in the US, Chinese and Indian economies can also contribute to price swings: for the US and particularly China, their big industrial sectors use Silver in various processes; in India, consumers’ demand for the precious metal for jewellery also plays a key role in setting prices.
Silver prices tend to follow Gold's moves. When Gold prices rise, Silver typically follows suit, as their status as safe-haven assets is similar. The Gold/Silver ratio, which shows the number of ounces of Silver needed to equal the value of one ounce of Gold, may help to determine the relative valuation between both metals. Some investors may consider a high ratio as an indicator that Silver is undervalued, or Gold is overvalued. On the contrary, a low ratio might suggest that Gold is undervalued relative to Silver.
-
14:32
New Zealand GDT Price Index up to -0.5% from previous -0.6%
-
14:09
USD/JPY refreshes almost five-month low near 148.40 as Fed dovish bets swell
- USD/JPY slumps to near 148.40 as traders have become increasingly confident that the Fed could cut interest rates in the June meeting.
- US President Trump confirmed 25% tariffs on Canada and Mexico and 10% on China.
- The BoJ is expected to raise interest rates further this year.
The USD/JPY pair posts a fresh almost five-month low near 148.40 in North American trading hours on Tuesday. The asset slumps as the US Dollar (USD) weakens amid escalating Federal Reserve (Fed) dovish bets. The US Dollar Index (DXY), which tracks the Greenback’s value against six major currencies, slumps to near 106.00, the lowest level seen in almost three months.
US Dollar PRICE Today
The table below shows the percentage change of US Dollar (USD) against listed major currencies today. US Dollar was the strongest against the Australian Dollar.
USD EUR GBP JPY CAD AUD NZD CHF USD -0.58% -0.21% -0.67% -0.43% -0.10% -0.29% -0.81% EUR 0.58% 0.38% -0.06% 0.16% 0.48% 0.30% -0.26% GBP 0.21% -0.38% -0.43% -0.22% 0.11% -0.07% -0.62% JPY 0.67% 0.06% 0.43% 0.22% 0.55% 0.36% -0.18% CAD 0.43% -0.16% 0.22% -0.22% 0.33% 0.15% -0.41% AUD 0.10% -0.48% -0.11% -0.55% -0.33% -0.17% -0.74% NZD 0.29% -0.30% 0.07% -0.36% -0.15% 0.17% -0.55% CHF 0.81% 0.26% 0.62% 0.18% 0.41% 0.74% 0.55% The heat map shows percentage changes of major currencies against each other. The base currency is picked from the left column, while the quote currency is picked from the top row. For example, if you pick the US Dollar from the left column and move along the horizontal line to the Japanese Yen, the percentage change displayed in the box will represent USD (base)/JPY (quote).
Traders have raised bets supporting the Fed to resume the policy-easing cycle from the June meeting due to an array of weak US economic data. According to the CME FedWatch tool, the probability for the central bank to cut interest rates in June has increased to 86% from 71% recorded a week ago.
Meanwhile, an additional 10% tariffs from US President Donald Trump on China and 25% on Canada and Mexico have failed to improve the safe-haven appeal of the US Dollar. Trump imposed an additional 10% levy on China for pouring drugs into the US economy. In retaliation, China has also announced tariffs on significant agriculture imports. This has resulted in a trade war between the world’s biggest nations, which has weighed on US indices.
On Monday, the S&P 500 slumped over 2% after Trump confirmed tariffs on his North American peers and China. Over weakness in the Wall Street, US Treasury Secretary Scott Bessent said that the focus of the government is majorly on strengthening small businesses. “Wall Street’s done great, Wall Street can continue to do fine, but we have a focus on small business and consumers,” Bessent said on Fox News’s Fox & Friends on Tuesday, Bloomberg reported.
In the Asia-Pacific region, the Japanese Yen (JPY) performs strongly on mounting expectations that the Bank of Japan (BoJ) will raise interest rates again this year.
Net long positions in yen futures among non-commercial traders - such as hedge funds and other speculators - soared to 96K contracts in the week ending February 25. That was up from 61K a week earlier, data from the U.S. Commodity Futures Trading Commission showed on Friday and was a record on data stretching back more than 30 years, Reuters report.
US Dollar FAQs
The US Dollar (USD) is the official currency of the United States of America, and the ‘de facto’ currency of a significant number of other countries where it is found in circulation alongside local notes. It is the most heavily traded currency in the world, accounting for over 88% of all global foreign exchange turnover, or an average of $6.6 trillion in transactions per day, according to data from 2022. Following the second world war, the USD took over from the British Pound as the world’s reserve currency. For most of its history, the US Dollar was backed by Gold, until the Bretton Woods Agreement in 1971 when the Gold Standard went away.
The most important single factor impacting on the value of the US Dollar is monetary policy, which is shaped by the Federal Reserve (Fed). The Fed has two mandates: to achieve price stability (control inflation) and foster full employment. Its primary tool to achieve these two goals is by adjusting interest rates. When prices are rising too quickly and inflation is above the Fed’s 2% target, the Fed will raise rates, which helps the USD value. When inflation falls below 2% or the Unemployment Rate is too high, the Fed may lower interest rates, which weighs on the Greenback.
In extreme situations, the Federal Reserve can also print more Dollars and enact quantitative easing (QE). QE is the process by which the Fed substantially increases the flow of credit in a stuck financial system. It is a non-standard policy measure used when credit has dried up because banks will not lend to each other (out of the fear of counterparty default). It is a last resort when simply lowering interest rates is unlikely to achieve the necessary result. It was the Fed’s weapon of choice to combat the credit crunch that occurred during the Great Financial Crisis in 2008. It involves the Fed printing more Dollars and using them to buy US government bonds predominantly from financial institutions. QE usually leads to a weaker US Dollar.
Quantitative tightening (QT) is the reverse process whereby the Federal Reserve stops buying bonds from financial institutions and does not reinvest the principal from the bonds it holds maturing in new purchases. It is usually positive for the US Dollar.
-
13:56
United States Redbook Index (YoY) rose from previous 6.2% to 6.6% in February 28
-
12:52
GBP tracks broader move against the USD among majors – Scotiabank
Pound Sterling (GBP) is moderately firmer but, in the absence of any major news at home, the pound’s performance reflects broader USD weakness more than anything, Scotiabank's Chief FX Strategist Shaun Osborne notes.
GBP is firmer on the day
"Cable gains have extended through the low 1.27s to reach a new high for the current move up, however, suggesting decent momentum is developing behind the gains."
"GBP gains are extending through the low 1.27s to the highest since early December. Sterling gains since the start of the year have developed solid bullish momentum and look set to push on towards 1.28 (200- day MA at 1.2786). Support is 1.2715 and 1.2675/80."
-
12:51
EUR extends rally through YTD highs – Scotiabank
The EUR is benefitting from the softer overall USD tone and market focus on the likelihood of increased European government (defence) spending to extend its recovery back through low 1.05 area where EUR gains have been capped so far this year, Scotiabank's Chief FX Strategist Shaun Osborne notes.
EUR has room to extend
"Recall that the EUR remains quite significantly below our modeled short-term fair value (1.0845) amid narrowing EZ/US rate differentials and relatively stronger European equity market returns in recent months. There is some runway for the EUR to strengthen."
"Spot gains through 1.0530 this morning are bullish. EUR gains have been capped in the low 1.05 zone since January and this morning’s gains not only break the recent range ceiling but also the 100-day MA (1.0509). Assuming EUR gains hold through the close, the advance points to further EUR gains to the 1.0650/1.0750 range (200-day MA at 1.0722)."
-
12:47
CAD gains modestly after dip on yesterday’s tariff headline – Scotiabank
The Canadian Dollar (CAD) is one of the better-performing currencies on the day so far, reversing the slide that occurred following yesterday’s tariff headlines to trade back to the low 1.44 area where it spent most of Monday, Scotiabank's Chief FX Strategist Shaun Osborne notes.
CAD steadies on the day
"The CAD has certainly priced in some tariff risk in recent weeks but not 25% so price action is a little surprising. A generally softer USD is one factor this morning. Short-term vols have slipped as well, with 1-week implied down around a full vol from yesterday’s peak. Price action suggests perhaps that markets are skeptical that 25% tariffs will remain in place for too long."
"And while markets are pricing in more risk of BoC easing now, US/Canada 2Y spreads have narrowed significantly (some 20bps) over the past month due to the sharp fall in US rates. Narrower spreads are helping cushion the tariff blow on the CAD for now. Upside potential in the CAD remains limited to the 1.4350/1.44 range for the moment, I have to think."
"Spot’s push higher yesterday and subsequent drift off the peak into the close left an indecisive 'spinning top' candle on the daily chart that rather suggests markets are reluctant to push the USD higher. Net losses so far today support that idea. USD support sits at 1.4370, yesterday’s low, and 1.4344— the 40-day MA. Spot losses through the latter would suggest scope for additional losses to the mid-1.42s. USD resistance is 1.4550 and 1.48."
-
12:43
USD slides amid trade wars – Scotiabank
It’s deadline day for President Trump’s border tariffs on Canada, Mexico and China. Despite comments from Commerce Sec. Lutnick that the president could proceed, reduce or postpone tariffs, Trump commented yesterday afternoon that there was no room left for a deal and that tariffs would start today, stating that 'they have [...] to build their car plants in the US' to avoid tariffs, Scotiabank's Chief FX Strategist Shaun Osborne notes.
Markets reflect concerns about tariff impact
"Wasn’t this about fentanyl? Hefty tariffs will hit growth in Canada and Mexico but will also have a significant chilling impact on activity across key US industrial sectors which are deeply integrated across North America, especially autos, and will likely push up prices at a time when there are already signs of slowing growth momentum and sticky inflation. Yesterday’s February Manufacturing ISM reflected slower growth momentum, contracting orders, weakening employment and a jump in prices—an uncomfortable mixture which likely reflects some of the pressures coming from tariff uncertainty."
"Trump also threatened to tariff countries that kept their exchange rates weak, citing the CNY and JPY. Stocks weakened yesterday on the tariff news and remain soft globally this morning. It may be the stock market’s performance moving forward that defines the guardrails for how US trade policy evolves. US Treasurys have weakened but European bonds are broadly higher. In FX, the MXN is weaker but off early lows. The CHF and JPY are leading gains while gold is up again as investors seek havens from the trade turmoil."
"The USD is weaker overall and it remains notable, and not to say somewhat curious, that the DXY continues to track—roughly—the performance of index in Trump’s first term, suggesting more softness ahead and perhaps another lurch lower is coming shortly. There’s nothing of note on the data calendar for North America today—there’s going to be more than enough going on elsewhere anyway."
-
12:40
US Treasury Sec. Bessent: We're set on bringing interest rates down
In an interview with Fox News on Tuesday, US Treasury Secretary Scott Bessent said that they are set on bringing interest rates down, as reported by Reuters.
"China's business model is to export and that is unacceptable," Bessent noted and added that he is highly confident that Chinese manufacturers will "eat the tariffs."
Market reaction
The US Dollar (USD) stays under selling pressure following these comments. At the time of press, the USD Index was down 0.6% on the day at 105.95.
Tariffs FAQs
Tariffs are customs duties levied on certain merchandise imports or a category of products. Tariffs are designed to help local producers and manufacturers be more competitive in the market by providing a price advantage over similar goods that can be imported. Tariffs are widely used as tools of protectionism, along with trade barriers and import quotas.
Although tariffs and taxes both generate government revenue to fund public goods and services, they have several distinctions. Tariffs are prepaid at the port of entry, while taxes are paid at the time of purchase. Taxes are imposed on individual taxpayers and businesses, while tariffs are paid by importers.
There are two schools of thought among economists regarding the usage of tariffs. While some argue that tariffs are necessary to protect domestic industries and address trade imbalances, others see them as a harmful tool that could potentially drive prices higher over the long term and lead to a damaging trade war by encouraging tit-for-tat tariffs.
During the run-up to the presidential election in November 2024, Donald Trump made it clear that he intends to use tariffs to support the US economy and American producers. In 2024, Mexico, China and Canada accounted for 42% of total US imports. In this period, Mexico stood out as the top exporter with $466.6 billion, according to the US Census Bureau. Hence, Trump wants to focus on these three nations when imposing tariffs. He also plans to use the revenue generated through tariffs to lower personal income taxes.
-
12:23
US Dollar ekes out more losses amid tit-for-tat trade war
- The US Dollar edges lower again on Tuesday after an already downbeat day on Monday
- Traders are waking up to the US imposing tariffs and, meanwhile, already facing counterattacks from Canada and China.
- The US Dollar Index (DXY) looks for support and could break even lower on Tuesday.
The US Dollar Index (DXY), which tracks the performance of the US Dollar (USD) against six major currencies, makes another leg lower on Tuesday after United States (US) President Donald Trump confirmed that tariffs on Canada, Mexico and China were not being delayed. Markets were still doubting on Monday if President Trump would still allow an extension just before the deadline. However, it was no surprise that the US imposed the earlier committed tariffs.
Meanwhile, Canada and China have already pushed back on the US unilateral tariffs. Later Monday night, Canada’s Prime Minister Justin Trudeau announced retaliatory tariffs on US goods. “Canada will start with 25% tariffs on US imports worth C$30 billion from Tuesday,” read the statement, while tariffs on other C$125 billion of products will come into effect in 21 days.
On early Tuesday, China announced its own levy on US agricultural goods. China’s Commerce Ministry stated that it would impose additional tariffs of up to 15% on imports of key farm products, including chicken, pork, soy and beef from the US. The Ministry said that the tariffs will take effect on March 10.
Daily digest market movers: Recession or stagflation
- Recent US economic data, while US yields and the US Dollar are rolling off, suggest that the US economy could be heading into a period of slow to negative growth while inflation remains elevated due to tariffs. This is a perfect cocktail for either a recession or stagflation phase in the US economy, Bloomberg reports.
- The TechnoMetrica Institute of Policy and Politics (TIPP) Economic Optimism Index for March is due at 15:00 GMT. Expectations are that sentiment will surge to 53.1, up from 52 in February.
- Near 18:00 GMT, Federal Reserve Bank of Richmond President Thomas Barkin delivers a speech titled "Inflation Then and Now" at the Fredericksburg Regional Alliance in Fredericksburg, United States.
- Around 19:20 GMT, Federal Reserve Bank of New York President John Williams is scheduled to participate in a discussion titled "The Cautious Path for Rate Cuts" at Bloomberg Invest 2025 in New York, United States.
- Equities seem to have already priced in the recent tariff headlines. There are no major losses or gains to report, with a bit of selling pressure in Europe. US equity futures are set for a positive start.
- The CME Fedwatch Tool projects a 14.4% chance that interest rates will remain at the current range of 4.25%-4.50% in June, with the rest showing a possible rate cut.
- The US 10-year yield trades around 4.15%, further down from last week’s high of 4.574% and flirting with a five-month low.
US Dollar Index Technical Analysis: DXY not a fan of tariffs
If there is one thing very clear now, it is that both US yields and the US Dollar Index (DXY) are no fans of tariffs. The risk is now that more tariffs could hit from all sides in retaliation, which could hit the US Dollar even more as a stagflation scenario gets underway. With the yield differential between the US and other countries further narrowing, the strength of the Greenback would erode further, and the DXY could even fall back below 105.00 if sentiment continues to pick up in that direction.
On the upside, the 100-day Simple Moving Average (SMA) is the first resistance to watch for any rejection, currently at 106.87. In case the DXY can break above 107.35, the 108.00 round level is coming back in scope, with the 55-day SMA just below it.
On the downside, the 106.00 round level needs to hold as support. In case that big figure snaps, 105.89 and the 200-day SMA at 105.05 could start to be identified as the next levels on the downside.
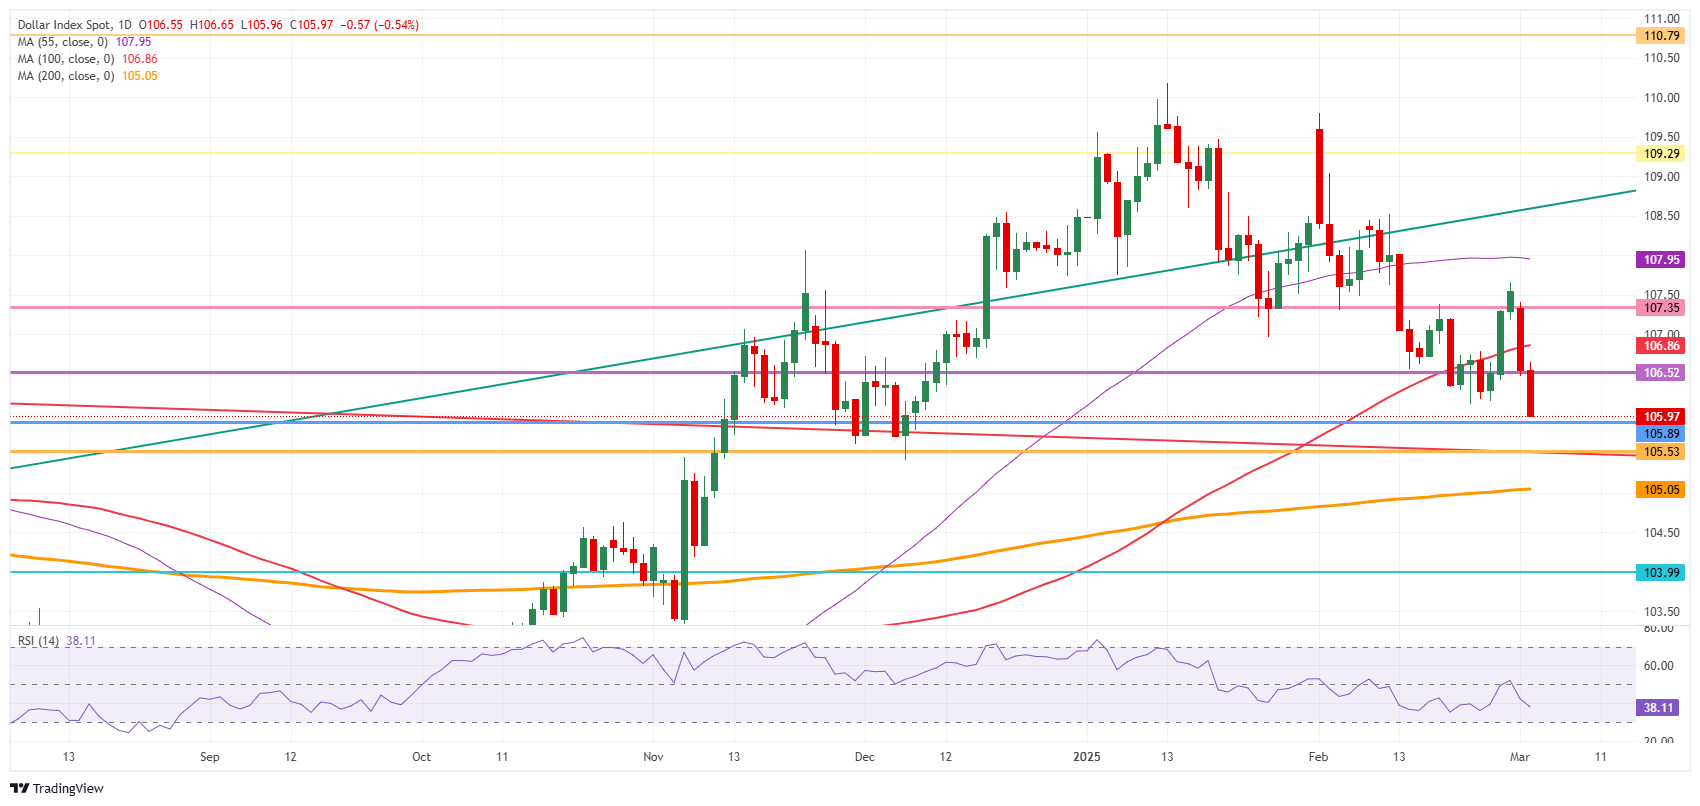
US Dollar Index: Daily Chart
US-China Trade War FAQs
Generally speaking, a trade war is an economic conflict between two or more countries due to extreme protectionism on one end. It implies the creation of trade barriers, such as tariffs, which result in counter-barriers, escalating import costs, and hence the cost of living.
An economic conflict between the United States (US) and China began early in 2018, when President Donald Trump set trade barriers on China, claiming unfair commercial practices and intellectual property theft from the Asian giant. China took retaliatory action, imposing tariffs on multiple US goods, such as automobiles and soybeans. Tensions escalated until the two countries signed the US-China Phase One trade deal in January 2020. The agreement required structural reforms and other changes to China’s economic and trade regime and pretended to restore stability and trust between the two nations. However, the Coronavirus pandemic took the focus out of the conflict. Yet, it is worth mentioning that President Joe Biden, who took office after Trump, kept tariffs in place and even added some additional levies.
The return of Donald Trump to the White House as the 47th US President has sparked a fresh wave of tensions between the two countries. During the 2024 election campaign, Trump pledged to impose 60% tariffs on China once he returned to office, which he did on January 20, 2025. With Trump back, the US-China trade war is meant to resume where it was left, with tit-for-tat policies affecting the global economic landscape amid disruptions in global supply chains, resulting in a reduction in spending, particularly investment, and directly feeding into the Consumer Price Index inflation.
-
11:28
USD/CAD corrects to near 1.4420 as US-Canada enters trade war
- USD/CAD falls sharply to near 1.4420 as Canadian PM Trudeau announced retaliatory tariffs on the US.
- On Monday, US President Trump confirmed 25% tariffs on Canada and Mexico.
- The US Dollar faces sharp selling pressure as Fed dovish bets swell.
The USD/CAD pair corrects sharply to near 1.4420 in European trading hours on Tuesday from the monthly high of 1.4542 posted on Monday. The Loonie pair declines as the Canadian Dollar (CAD) outperforms across the board after Canadian Prime Minister Justin Trudeau announced retaliatory tariffs on the United States (US).
Canadian Dollar PRICE Today
The table below shows the percentage change of Canadian Dollar (CAD) against listed major currencies today. Canadian Dollar was the strongest against the US Dollar.
USD EUR GBP JPY CAD AUD NZD CHF USD -0.34% -0.15% -0.48% -0.54% -0.08% -0.22% -0.59% EUR 0.34% 0.19% -0.13% -0.20% 0.27% 0.12% -0.27% GBP 0.15% -0.19% -0.32% -0.39% 0.08% -0.07% -0.44% JPY 0.48% 0.13% 0.32% -0.06% 0.40% 0.25% -0.12% CAD 0.54% 0.20% 0.39% 0.06% 0.46% 0.33% -0.06% AUD 0.08% -0.27% -0.08% -0.40% -0.46% -0.14% -0.53% NZD 0.22% -0.12% 0.07% -0.25% -0.33% 0.14% -0.38% CHF 0.59% 0.27% 0.44% 0.12% 0.06% 0.53% 0.38% The heat map shows percentage changes of major currencies against each other. The base currency is picked from the left column, while the quote currency is picked from the top row. For example, if you pick the Canadian Dollar from the left column and move along the horizontal line to the US Dollar, the percentage change displayed in the box will represent CAD (base)/USD (quote).
Canadian Justin Trudeau has announced that Canada would immediately impose 25% tariffs on C$30 billion worth of US imports if US tariffs go into effect. Trudeau added that tariffs on the remaining C$125 billion of products will “come into effect in 21 days”. Reuters report.
On Monday, US President Donald Trump confirmed that he would impose 25% tariffs on Canada and Mexico. Trump told reporters, “No room left for Mexico or for Canada.” He added, “The tariffs—you know, they’re all set. They go into effect tomorrow.”
Meanwhile, the US Dollar (USD) underperforms as traders have become increasingly confident that the Federal Reserve (Fed) could cut interest rates in the June meeting. The US Dollar Index (DXY), which tracks the Greenback’s value against six major currencies, declines to near the 11-week low of 106.15.
Fed dovish bets have escalated due to an expected slowdown in the United States (US) core Personal Consumption Expenditure Price Index (PCE) data in January, the first decline in the Personal Spending data for January in two years, and a sharp decline in the Consumer Confidence and weak ISM Manufacturing PMI data for February.
Canadian Dollar FAQs
The key factors driving the Canadian Dollar (CAD) are the level of interest rates set by the Bank of Canada (BoC), the price of Oil, Canada’s largest export, the health of its economy, inflation and the Trade Balance, which is the difference between the value of Canada’s exports versus its imports. Other factors include market sentiment – whether investors are taking on more risky assets (risk-on) or seeking safe-havens (risk-off) – with risk-on being CAD-positive. As its largest trading partner, the health of the US economy is also a key factor influencing the Canadian Dollar.
The Bank of Canada (BoC) has a significant influence on the Canadian Dollar by setting the level of interest rates that banks can lend to one another. This influences the level of interest rates for everyone. The main goal of the BoC is to maintain inflation at 1-3% by adjusting interest rates up or down. Relatively higher interest rates tend to be positive for the CAD. The Bank of Canada can also use quantitative easing and tightening to influence credit conditions, with the former CAD-negative and the latter CAD-positive.
The price of Oil is a key factor impacting the value of the Canadian Dollar. Petroleum is Canada’s biggest export, so Oil price tends to have an immediate impact on the CAD value. Generally, if Oil price rises CAD also goes up, as aggregate demand for the currency increases. The opposite is the case if the price of Oil falls. Higher Oil prices also tend to result in a greater likelihood of a positive Trade Balance, which is also supportive of the CAD.
While inflation had always traditionally been thought of as a negative factor for a currency since it lowers the value of money, the opposite has actually been the case in modern times with the relaxation of cross-border capital controls. Higher inflation tends to lead central banks to put up interest rates which attracts more capital inflows from global investors seeking a lucrative place to keep their money. This increases demand for the local currency, which in Canada’s case is the Canadian Dollar.
Macroeconomic data releases gauge the health of the economy and can have an impact on the Canadian Dollar. Indicators such as GDP, Manufacturing and Services PMIs, employment, and consumer sentiment surveys can all influence the direction of the CAD. A strong economy is good for the Canadian Dollar. Not only does it attract more foreign investment but it may encourage the Bank of Canada to put up interest rates, leading to a stronger currency. If economic data is weak, however, the CAD is likely to fall.
-
10:51
Germany 5-y Note Auction dipped from previous 2.17% to 2.15%
-
10:30
AUD/USD trades lower above 0.6200 as Trump imposes additional tariffs on China
- AUD/USD falls slightly but holds the key support of 0.6200.
- The Aussie Dollar faces pressure as US President Trump imposes additional 10% tariffs on China.
- Escalating Fed dovish bets have weighed on the US Dollar.
The AUD/USD pair is down 0.1% to near 0.6220 in European trading hours on Tuesday. The Aussie pair trades lower even though the US Dollar (USD) extends its downside, suggesting significant weakness in the Australian Dollar (AUD).
The US Dollar Index (DXY), which tracks the Greenback’s value against six major currencies, revisits the 11-week low of 106.15.
The Australian Dollar faces strong selling pressure as United States (US) President Donald Trump has announced additional 10% tariffs on China. Trump also slapped 10% levy on China in early February. Higher tariffs on Chinese products would diminish their competitiveness in the global market. Such a scenario could be unfavorable for the Aussie Dollar as it is the leading trading partner of China.
Australian Dollar PRICE Today
The table below shows the percentage change of Australian Dollar (AUD) against listed major currencies today. Australian Dollar was the strongest against the US Dollar.
USD EUR GBP JPY CAD AUD NZD CHF USD -0.22% -0.08% -0.39% -0.47% 0.00% -0.15% -0.53% EUR 0.22% 0.15% -0.16% -0.24% 0.23% 0.08% -0.32% GBP 0.08% -0.15% -0.30% -0.40% 0.08% -0.08% -0.46% JPY 0.39% 0.16% 0.30% -0.09% 0.39% 0.23% -0.15% CAD 0.47% 0.24% 0.40% 0.09% 0.47% 0.33% -0.07% AUD -0.01% -0.23% -0.08% -0.39% -0.47% -0.15% -0.55% NZD 0.15% -0.08% 0.08% -0.23% -0.33% 0.15% -0.39% CHF 0.53% 0.32% 0.46% 0.15% 0.07% 0.55% 0.39% The heat map shows percentage changes of major currencies against each other. The base currency is picked from the left column, while the quote currency is picked from the top row. For example, if you pick the Australian Dollar from the left column and move along the horizontal line to the US Dollar, the percentage change displayed in the box will represent AUD (base)/USD (quote).
On the domestic front, an expected increase in Australian Retail Sales could offer some cushion to the antipodean. The Retail Sales data, a key measure of consumer spending, rose by 0.3% in January on month after declining by 0.1% in December.
Meanwhile, the US Dollar faces pressure on mounting bets that the Federal Reserve (Fed) could resume the monetary expansion cycle in the June policy meeting. The likelihood for the Fed to reduce interest rates in June has increased to 87% from 69% recorded a week ago, according to the CME FedWatch tool.
US-China Trade War FAQs
Generally speaking, a trade war is an economic conflict between two or more countries due to extreme protectionism on one end. It implies the creation of trade barriers, such as tariffs, which result in counter-barriers, escalating import costs, and hence the cost of living.
An economic conflict between the United States (US) and China began early in 2018, when President Donald Trump set trade barriers on China, claiming unfair commercial practices and intellectual property theft from the Asian giant. China took retaliatory action, imposing tariffs on multiple US goods, such as automobiles and soybeans. Tensions escalated until the two countries signed the US-China Phase One trade deal in January 2020. The agreement required structural reforms and other changes to China’s economic and trade regime and pretended to restore stability and trust between the two nations. However, the Coronavirus pandemic took the focus out of the conflict. Yet, it is worth mentioning that President Joe Biden, who took office after Trump, kept tariffs in place and even added some additional levies.
The return of Donald Trump to the White House as the 47th US President has sparked a fresh wave of tensions between the two countries. During the 2024 election campaign, Trump pledged to impose 60% tariffs on China once he returned to office, which he did on January 20, 2025. With Trump back, the US-China trade war is meant to resume where it was left, with tit-for-tat policies affecting the global economic landscape amid disruptions in global supply chains, resulting in a reduction in spending, particularly investment, and directly feeding into the Consumer Price Index inflation.
-
10:10
United Kingdom 30-y Bond Auction fell from previous 5.198% to 4.375%
-
10:08
Spain 6-Month Letras Auction declined to 2.255% from previous 2.355%
-
10:08
Spain 12-Month Letras Auction: 2.173% vs previous 2.221%
-
10:00
Eurozone Unemployment Rate registered at 6.2%, below expectations (6.3%) in January
-
10:00
Greece Unemployment Rate (MoM) fell from previous 9.4% to 8.7% in January
-
09:56
Pound Sterling holds onto gains against US Dollar on mounting Fed dovish bets
- The Pound Sterling clings to gains near 1.2700 against the US Dollar as traders have raised Fed dovish bets for the June meeting.
- US President Trump has imposed 25% tariffs on Canada and Mexico and an additional 10% on China.
- The BoE is expected to follow a gradual policy-easing cycle as the UK inflation is set to remain higher.
The Pound Sterling (GBP) trades firm near 1.2700 against the US Dollar (USD) in Tuesday’s European session. The GBP/USD pair holds onto Monday’s gains as the US Dollar extends its downside amid escalating dovish Federal Reserve (Fed) bets. The US Dollar Index (DXY), which tracks the Greenback’s value against six major currencies, slides to near 106.30.
Traders have raised bets supporting the Fed to resume the policy-easing cycle in the June meeting, which was paused in January. The likelihood for the central bank to reduce interest rates in June has increased to 86.9% from 69% recorded a week ago, according to the CME FedWatch tool.
An expected slowdown in the United States (US) core Personal Consumption Expenditure Price Index (PCE) data for January, a sharp decline in Consumer Confidence for February – the first decline in the Personal Spending data for January in two years – and weak ISM Manufacturing PMI data for February have contributed to market expectations that the Fed could resume the monetary expansion cycle in June.
Going forward, investors will focus on the US ADP Employment Change, US ISM Services PMI, and the US Nonfarm Payrolls (NFP) data for February. All of them will be released during this week and are likely to influence market expectations for the Fed’s monetary policy outlook.
Daily digest market movers: Pound Sterling to be influenced by further development in Ukraine peace plan
- The Pound Sterling exhibits a mixed performance across the globe, with investors seeking further development in Ukraine’s peace plan. Over the weekend, pan-European leaders, including Ukrainian President Volodymyr Zelenskyy, agreed to structure a draft for ending the three-year-long war in Ukraine in a high-stakes summit in London.
- On a broader note, the outlook of the British currency remains firm as investors expect the Bank of England (BoE) to follow a gradual monetary expansion approach. These expectations have been bolstered by elevated United Kingdom (UK) wage growth, which could keep inflationary pressures persistently higher.
- Additionally, British Retail Consortium (BRC) Chief Executive, Helen Dickinson, has projected that inflation could rise further as retailers face a 7 billion pound ($8.88 billion) rise in annual costs this year due to a nearly 7% rise in the minimum wage, packaging levies and an increase in payroll taxes announced in UK Chancellor of the Exchequer Rachel Reeves’ Autumn budget, Reuters report.
- On the global front, US President Donald Trump’s tariff agenda is expected to keep investors on their toes. 25% tariffs on Canada and Mexico and an additional 10% levies on China have come into effect on Tuesday, signaling that fears of a global trade war have become real now. In retaliation, China has also slapped tariffs on major agricultural imports.
Technical Analysis: Pound Sterling strengthens near 1.2700
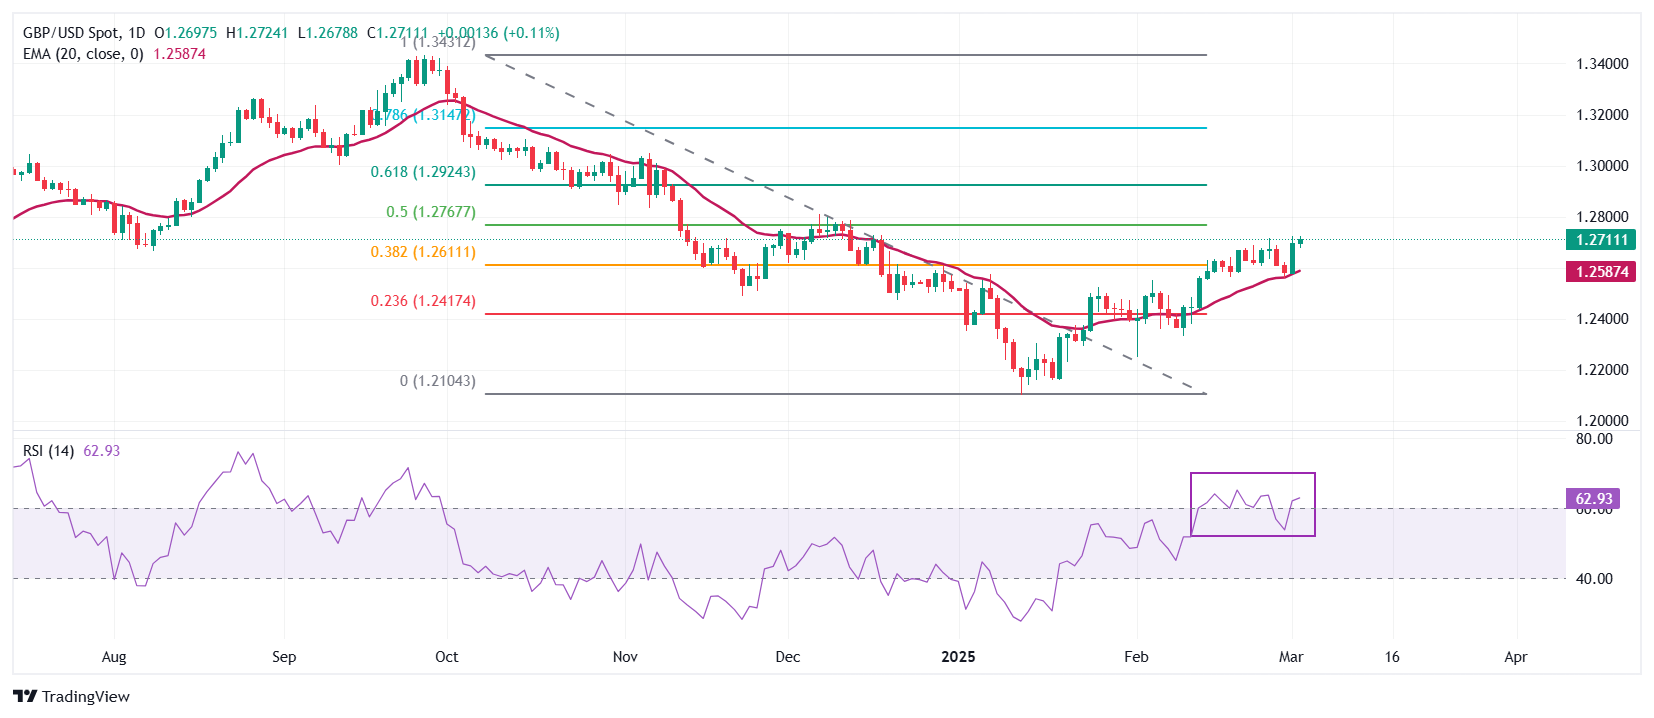
The Pound Sterling demonstrates strength near 1.2700 against the US Dollar on Tuesday. The GBP/USD pair recovered strongly on Monday after a mean-reversion move to the 20-day Exponential Moving Average (EMA) near 1.2580.
The 14-day Relative Strength Index (RSI) climbs above 60.00. A fresh bullish momentum would come into action if the RSI sustains above that level.
Looking down, the February 11 low of 1.2333 will act as a key support zone for the pair. On the upside, the 61% Fibonacci retracement level at 1.2924 will act as a key resistance zone.
Pound Sterling FAQs
The Pound Sterling (GBP) is the oldest currency in the world (886 AD) and the official currency of the United Kingdom. It is the fourth most traded unit for foreign exchange (FX) in the world, accounting for 12% of all transactions, averaging $630 billion a day, according to 2022 data. Its key trading pairs are GBP/USD, also known as ‘Cable’, which accounts for 11% of FX, GBP/JPY, or the ‘Dragon’ as it is known by traders (3%), and EUR/GBP (2%). The Pound Sterling is issued by the Bank of England (BoE).
The single most important factor influencing the value of the Pound Sterling is monetary policy decided by the Bank of England. The BoE bases its decisions on whether it has achieved its primary goal of “price stability” – a steady inflation rate of around 2%. Its primary tool for achieving this is the adjustment of interest rates. When inflation is too high, the BoE will try to rein it in by raising interest rates, making it more expensive for people and businesses to access credit. This is generally positive for GBP, as higher interest rates make the UK a more attractive place for global investors to park their money. When inflation falls too low it is a sign economic growth is slowing. In this scenario, the BoE will consider lowering interest rates to cheapen credit so businesses will borrow more to invest in growth-generating projects.
Data releases gauge the health of the economy and can impact the value of the Pound Sterling. Indicators such as GDP, Manufacturing and Services PMIs, and employment can all influence the direction of the GBP. A strong economy is good for Sterling. Not only does it attract more foreign investment but it may encourage the BoE to put up interest rates, which will directly strengthen GBP. Otherwise, if economic data is weak, the Pound Sterling is likely to fall.
Another significant data release for the Pound Sterling is the Trade Balance. This indicator measures the difference between what a country earns from its exports and what it spends on imports over a given period. If a country produces highly sought-after exports, its currency will benefit purely from the extra demand created from foreign buyers seeking to purchase these goods. Therefore, a positive net Trade Balance strengthens a currency and vice versa for a negative balance.
-
09:39
Gold props up gains after tit-for-tat trade war emerges
- Gold rallied over 1% on Monday after US President Trump said it was too late for China, Mexico and Canada to avoid tariffs hitting this Tuesday.
- Canada will impose 25% retaliatory tariffs from Tuesday, while China is set to slap 15% levies on US agricultural goods from March 10.
- US yields nudge lower again on Tuesday, hitting a near 5-month low at 4.11%.
Gold’s price (XAU/USD) edges higher and trades around $2,910 at the time of writing on Tuesday after surging over 1% the prior day. The recent upsurge came in after United States (US) President Donald Trump confirmed on Monday that tariffs for Canada, Mexico and China were underway. Markets were still doubting on Monday if President Trump would still allow an extension to tariffs implementation based on the efforts the countries were making to meet the demands of the Trump administration. Little too late, it seemed, with President Trump going ahead with imposing the committed tariffs starting on Tuesday.
Meanwhile, Canada and China have already pushed back on imposing unilateral tariffs from the US. A statement released by Canadian prime minister Justin Trudeau’s office confirmed that Canada will impose retaliatory tariffs on US imports from Tuesday if US tariffs go into effect. “Canada will start with 25% tariffs on US imports worth C$30 billion from Tuesday,” read the statement, while tariffs on other C$125 billion of products will come into effect in 21 days.
On the other hand, China’s Commerce Ministry announced early Tuesday that it would slap additional tariffs of up to 15% on imports of key farm products, including chicken, pork, soy and beef from the US. The Ministry said that the tariffs announced will take effect from March 10..
Amidst this tit-for-tat trade war, US yields are rolling off again. The US 10-year benchmark hit 4.11% on the downside in early Asian trading on Tuesday. A nearly five-month low, going back to levels not seen since mid-October.
Daily digest market movers: Safe haven bid
- On the geopolitical front, a senior defense official said the US was pausing all military aid to Ukraine, Bloomberg reports.
- After Monday’s turn of events, the CME Fedwatch tool is seeing the market's cry for a Federal Reserve (Fed) interest rate cut by June getting even bigger. The odds currently stand at 85.6%, with a minor 14.4% chance for rates to remain unchanged.
- A string of recent US data showing resurgent inflation and slowing activity is stoking fears the world’s biggest economy could be heading toward a period of stagflation, Reuters reports.
Technical Analysis: A very long road ahead
Bullion extends its Monday’s gains at the start of the European trading session on Tuesday. Ranges have become tighter for the daily Pivot Point levels, confirming the current indecision among investors after last week’s decline. Watch out for a continuation in any direction. However, uncertainty about a tit-for-tat trade war will see Gold being supported.
The daily Pivot Point at $2,879 and the daily R1 resistance at $2,903 are currently providing support to bounce off from and attempt to push Bullion higher. In case Gold has enough oomph to continue higher, the daily R2 resistance at $2,917 will possibly be the final cap on Tuesday ahead of the all-time high of $2,956 reached on February 24.
On the downside, apart from the abovementioned Pivot Point and the R1 resistance levels, the S1 support at $2,866 converges with Thursday’s low. That will be the vital support for this Tuesday. If Bullion bulls want to avoid another leg lower, that level must hold. Further down, the daily S2 support at $2,842 should be able to catch any additional downside pressure.
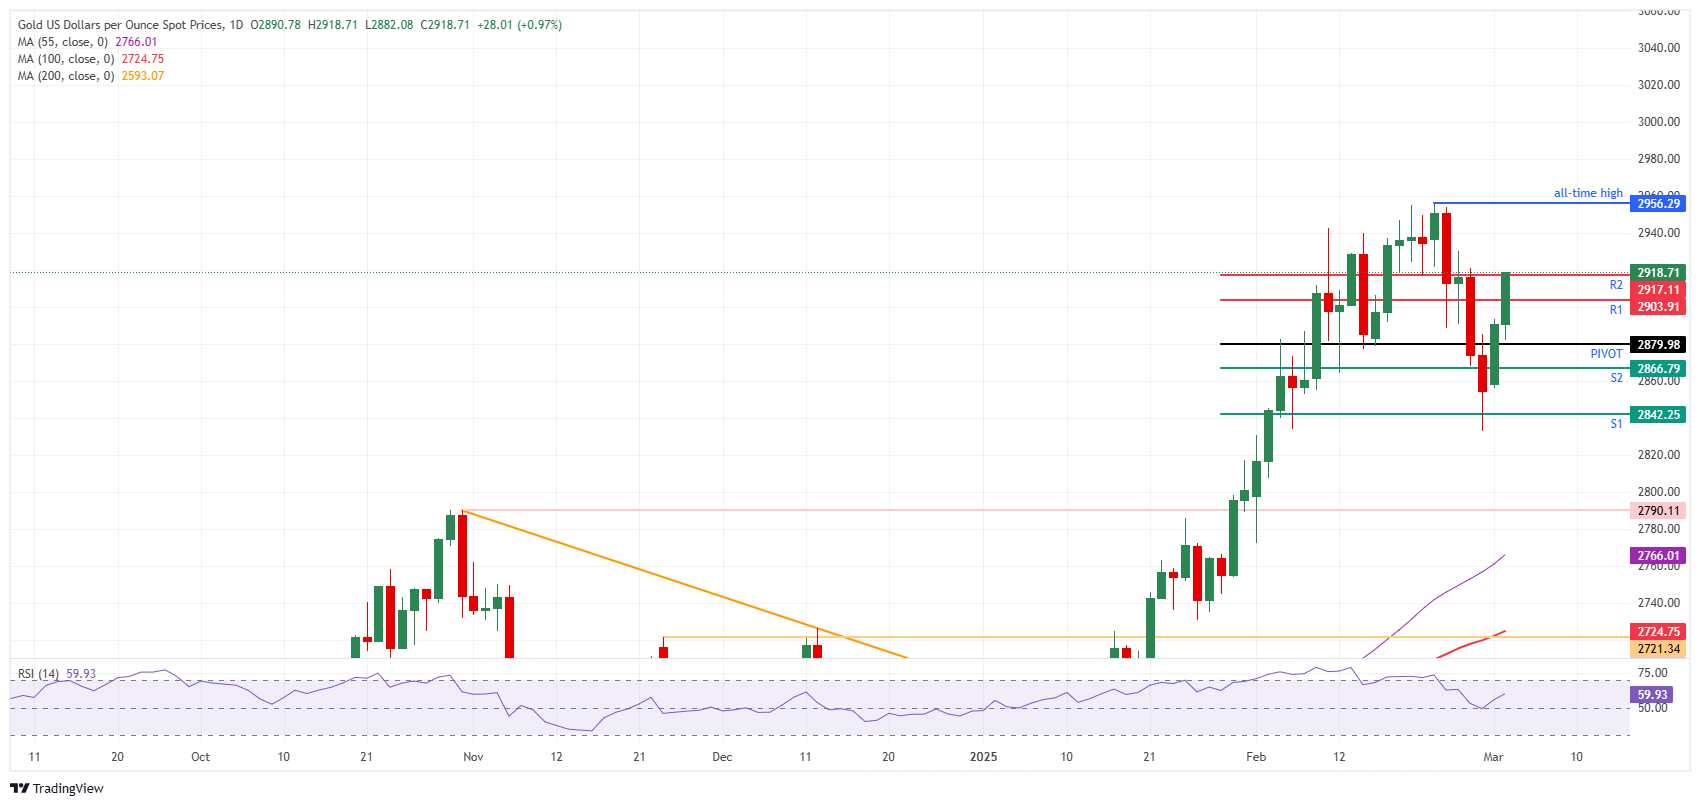
XAU/USD: Daily Chart
Gold FAQs
Gold has played a key role in human’s history as it has been widely used as a store of value and medium of exchange. Currently, apart from its shine and usage for jewelry, the precious metal is widely seen as a safe-haven asset, meaning that it is considered a good investment during turbulent times. Gold is also widely seen as a hedge against inflation and against depreciating currencies as it doesn’t rely on any specific issuer or government.
Central banks are the biggest Gold holders. In their aim to support their currencies in turbulent times, central banks tend to diversify their reserves and buy Gold to improve the perceived strength of the economy and the currency. High Gold reserves can be a source of trust for a country’s solvency. Central banks added 1,136 tonnes of Gold worth around $70 billion to their reserves in 2022, according to data from the World Gold Council. This is the highest yearly purchase since records began. Central banks from emerging economies such as China, India and Turkey are quickly increasing their Gold reserves.
Gold has an inverse correlation with the US Dollar and US Treasuries, which are both major reserve and safe-haven assets. When the Dollar depreciates, Gold tends to rise, enabling investors and central banks to diversify their assets in turbulent times. Gold is also inversely correlated with risk assets. A rally in the stock market tends to weaken Gold price, while sell-offs in riskier markets tend to favor the precious metal.
The price can move due to a wide range of factors. Geopolitical instability or fears of a deep recession can quickly make Gold price escalate due to its safe-haven status. As a yield-less asset, Gold tends to rise with lower interest rates, while higher cost of money usually weighs down on the yellow metal. Still, most moves depend on how the US Dollar (USD) behaves as the asset is priced in dollars (XAU/USD). A strong Dollar tends to keep the price of Gold controlled, whereas a weaker Dollar is likely to push Gold prices up.
-
09:36
USD/CNH: Potential for USD to rise to 7.3250 – UOB Group
US Dollar (USD) is likely to edge higher vs Chinese Yuan (CNH); mild momentum suggests any advance is likely limited to a test of 7.3150. Strong advance indicates there is potential for USD to rise to 7.3250, UOB Group's FX analysts Quek Ser Leang and Peter Chia note.
Any advance is likely limited to a test of 7.3150 for now
24-HOUR VIEW: "We noted yesterday that 'the current price movements are likely part of a range trading phase,' and we expected USD to 'trade between 7.2780 and 7.3010.' USD subsequently dipped to 7.2850 before rising to 7.3078, closing slightly higher by 0.11% at 7.3036. The advance resulted in a slight increase in momentum. Today, USD is likely to edge higher, but any advance is likely limited to a test of 7.3150. The major resistance at 7.3250 is unlikely to come into view. Support is at 7.2940; a breach of 7.2850 would indicate that the mild upward pressure has eased."
1-3 WEEKS VIEW: "Our latest narrative was from last Friday (28 Feb, spot at 7.2950), wherein the strong advance from last Thursday 'indicates there is potential for USD to rise to 7.3250.' We will continue to hold the same view as long as 7.2680 (‘strong support’ level previously at 7.2600) is not breached."
-
09:33
Silver price today: Silver rises, according to FXStreet data
Silver prices (XAG/USD) rose on Tuesday, according to FXStreet data. Silver trades at $31.79 per troy ounce, up 0.57% from the $31.61 it cost on Monday.
Silver prices have increased by 10.01% since the beginning of the year.
Unit measure Silver Price Today in USD Troy Ounce 31.79 1 Gram 1.02
The Gold/Silver ratio, which shows the number of ounces of Silver needed to equal the value of one ounce of Gold, stood at 91.71 on Tuesday, up from 91.46 on Monday.
Silver FAQs
Silver is a precious metal highly traded among investors. It has been historically used as a store of value and a medium of exchange. Although less popular than Gold, traders may turn to Silver to diversify their investment portfolio, for its intrinsic value or as a potential hedge during high-inflation periods. Investors can buy physical Silver, in coins or in bars, or trade it through vehicles such as Exchange Traded Funds, which track its price on international markets.
Silver prices can move due to a wide range of factors. Geopolitical instability or fears of a deep recession can make Silver price escalate due to its safe-haven status, although to a lesser extent than Gold's. As a yieldless asset, Silver tends to rise with lower interest rates. Its moves also depend on how the US Dollar (USD) behaves as the asset is priced in dollars (XAG/USD). A strong Dollar tends to keep the price of Silver at bay, whereas a weaker Dollar is likely to propel prices up. Other factors such as investment demand, mining supply – Silver is much more abundant than Gold – and recycling rates can also affect prices.
Silver is widely used in industry, particularly in sectors such as electronics or solar energy, as it has one of the highest electric conductivity of all metals – more than Copper and Gold. A surge in demand can increase prices, while a decline tends to lower them. Dynamics in the US, Chinese and Indian economies can also contribute to price swings: for the US and particularly China, their big industrial sectors use Silver in various processes; in India, consumers’ demand for the precious metal for jewellery also plays a key role in setting prices.
Silver prices tend to follow Gold's moves. When Gold prices rise, Silver typically follows suit, as their status as safe-haven assets is similar. The Gold/Silver ratio, which shows the number of ounces of Silver needed to equal the value of one ounce of Gold, may help to determine the relative valuation between both metals. Some investors may consider a high ratio as an indicator that Silver is undervalued, or Gold is overvalued. On the contrary, a low ratio might suggest that Gold is undervalued relative to Silver.
(An automation tool was used in creating this post.)
-
09:32
China: CPI inflation likely negative in February – Standard Chartered
Official manufacturing PMI rebounded in February; 2-month average suggests steady production activity. Trade performance likely weakened last month due to both the holiday and tariff impact. CPI may have dropped y/y on a fall in prices of food, fuel and services, as well as a high base effect. Retail sales and FAI growth likely edged up on policy support, while IP growth may have moderated, Standard Chartered's economists report.
A mixed start to the year
"The official manufacturing PMI rebounded to 50.2 in February from 49.1 in January after the Lunar New Year holidays. The average new orders and production PMIs for 2M-2025 were 50.2 and 51.2, respectively, indicating steady manufacturing activity. We therefore expect industrial production (IP) growth to have stayed resilient at 5.0% y/y over the period. Expansion of the equipment upgrade and consumer goods trade-in programmes likely supported fixed asset investment (FAI) and retail sales growth."
"The US has imposed additional tariffs on all of its imports from China since early February to date. We expect 2M-2025 trade activity to have been affected, with export growth slowing and import growth turning negative over the period. CPI inflation likely fell to -0.6% y/y in February due to a high base and a decline in food, services and fuel prices. Meanwhile, PPI deflation may have moderated on higher metal and construction material prices."
"We expect total social financing (TSF) outstanding growth to have edged up 0.4ppt to 8.4% y/y in February. New CNY loan growth likely remained stable at 7.5% y/y. In addition, government bond financing remained sizeable to support project financing."
-
09:30
South Africa Gross Domestic Product (QoQ) increased to 0.6% in 4Q from previous -0.3%
-
09:30
USD/JPY can trade in a range between 148.50 and 150.50 – UOB Group
Outlook is unclear; US Dollar (USD) could trade in a range between 148.50 and 150.50 vs Japanese Yen (JPY). In the longer run, bias for USD is slightly tilted to the downside; unclear for now whether it can break and stay below 148.50, UOB Group's FX analysts Quek Ser Leang and Peter Chia note.
Bias for USD is slightly tilted to the downside
24-HOUR VIEW: " Yesterday, we indicated that 'there is a chance for the overbought USD to test 151.20.' We did not anticipate the volatile price action, as after rising to 151.31, USD plunged to a low of 149.08. The outlook for today is unclear after the choppy price movements. Today, USD could trade in a broad range between 148.50 and 150.50."
1-3 WEEKS VIEW: "After maintaining a negative USD view since the middle of Feb, we highlighted yesterday (03 Mar, spot at 150.80) that 'Not only has downward momentum faded, but upward momentum has increased somewhat.' We were of the view that 'the price movement is part of a rebound that could potentially reach 151.90.' Our view was invalidated quickly, as after rising to 151.31, USD plunged and broke below our ‘strong support’ level at 149.45 (low has been 149.08). Although the sharp drop has resulted in an increase in momentum, it is unclear for now whether USD can break and stay below last week’s low, near 148.50. Overall, the bias for USD appears to be slightly tilted to the downside, as long as 151.00 is not breached."
-
09:30
South Africa Gross Domestic Product (YoY) increased to 0.9% in 4Q from previous 0.3%
-
09:27
Cocoa prices decline on fading supply fears – ING
The cocoa market continues to sell off, with London cocoa pulling back aggressively. The nearly 11% drop yesterday has cocoa trading at its lowest level since November, ING's commodity experts Ewa Manthey and Warren Patterson note.
Global market is likely to record a supply surplus of 142kt
"The International Cocoa Organization, in its first forecast for the 2024/25 season, last week estimated that the global market is likely to record a supply surplus of 142kt. That follows three consecutive seasons of deficit. A production recovery and weaker demand -- due to higher prices -- are expected to push the market back into surplus this season."
"In its latest quarterly crop report, Australia’s Bureau of Agricultural and Resource Economics and Sciences (ABARES) estimates that the winter wheat harvest, completed in January, increased by 31% year on year to 34.1mt for the 2024/25 season. That’s up 7% from the previous estimate and 28% above the 10-year average."
"New South Wales and Western Australia drove the increase with production rebounding by 82% and 64%, respectively. Meanwhile, a bumper wheat harvest in the nation might boost global stockpiles, which have been hovering at lower levels amid smaller harvests in the European Union and Russia."
-
09:24
NZD/USD: Expected to continue to trade between 0.5590 and 0.5640 – UOB Group
New Zealand Dollar (NZD) is expected to continue to trade in a range vs US Dollar (USD), most likely between 0.5590 and 0.5640. In the longer run, room for NZD to continue to weaken; it remains to be seen if 0.5565 is within reach, UOB Group's FX analysts Quek Ser Leang and Peter Chia note.
Room for NZD to continue to weaken
24-HOUR VIEW: "Last Friday, NZD fell to a low of 0.5587. Yesterday, Monday, when it was at 0.5605, we pointed out that 'Conditions remain deeply oversold; this, combined with slowing momentum, suggests that instead of weakening further, NZD is more likely to trade in a 0.5585/0.5630 range.' NZD then traded between 0.5594 and 0.5641, closing at 0.5617 (+0.32%). The price movements did not result in any increase in either downward or upward momentum. Today, we continue to expect range trading, most likely between 0.5590 and 0.5640."
1-3 WEEKS VIEW: "There is not much to add to our update from yesterday (03 Mar, spot at 0.5605). As highlighted, while we continue to see room for NZD to weaken, it remains to be seen if the next support level at 0.5565 is within reach. On the upside, a breach of 0.5670 (no change in ‘strong resistance’ level from yesterday) would indicate that the NZD weakness from late last week has ended."
-
09:21
USD/JPY: Short bias on the day – OCBC
USD/JPY fell below 149-levels this morning amid sharp pullback in UST yields. Pair was last at 148.98, OCBC's FX analysts Frances Cheung and Christopher Wong note.
"Trump’s tariffs on Canada, Mexico and China come into effect today, undermining risk sentiments while softer US data reinforces the view that Fed cut cycle can still continue. On JPY side of the equation, BoJ has room to further pursue policy normalisation given wage growth prospects and broadening services inflation. Put together, growing Fed-BoJ policy divergence should continue to drive USD/JPY to the downside."
Bias to sell rallies in USD/JPY
Daily momentum is flat while RSI fell. Bias remains to sell rallies. Support here at 149.20 (50% fibo), 148.80 before 147 (61.8% fibo). Resistance at 150.50, 151.50 (38.2% fibo retracement of Sep low to Jan high).
"That said, we continue to see a confluence of risk factors, including Trump’s tariff threats (reciprocal tariffs) and dividend seasonality trends that may pose intermittent upside pressure for USDJPY. We maintain bias to sell rallies in USD/JPY should there be a bounce driven by tariff uncertainty or seasonality trends."
-
09:05
Silver Price Forecast: XAG/USD climbs to $31.80-$31.85 zone; upside potential seems limited
- Silver gains some positive traction for the second straight day, though it lacks follow-through.
- The technical setup warrants some caution for bulls and positioning for further appreciation.
- Bears might wait for a convincing break below the 100-day EMA before placing fresh bets.
Silver (XAG/USD) attracts buyers for the second straight day on Tuesday and moves further away from a nearly four-week low, around the $30.85-$30.80 region touched last Friday. The white metal climbs to the $31.80-$31.85 region during the first half of the European session, back closer to the overnight swing high, and seems poised to appreciate further.
From a technical perspective, the XAG/USD showed some resilience below the 100-day Exponential Moving Average (EMA) last Friday. The subsequent move up validates the near-term constructive outlook for the commodity. That said, oscillators on the daily chart are yet to confirm a positive bias and warrant some caution before positioning for any further appreciation.
Hence, any further move up is likely to confront some resistance near the $31.65 region ahead of the $32.00 mark. Some follow-through buying beyond the latter could trigger a short-covering rally and lift the XAG/USD to the $32.40-$32.45 hurdle. Bulls might then aim to surpass the $33.00 round-figure mark and test the February monthly swing high, around the $33.40 area.
On the flip side, the daily trough, around mid-$31.00s, now seems to protect the immediate downside ahead of the $31.20 area and the $31.00 mark. The latter coincides with the 100-day EMA pivotal support, which if broken decisively will be seen as a key trigger for bearish traders and make the XAG/USD vulnerable to accelerate the fall towards the $30.25 support zone.
The downward trajectory could extend further toward the $30.00 psychological mark en route to the $29.55-$29.50 horizontal support. The XAG/USD could eventually drop to the $29.00 round figure and December 2024 swing low, around the $28.80-$28.75 area.
XAG/USD daily chart
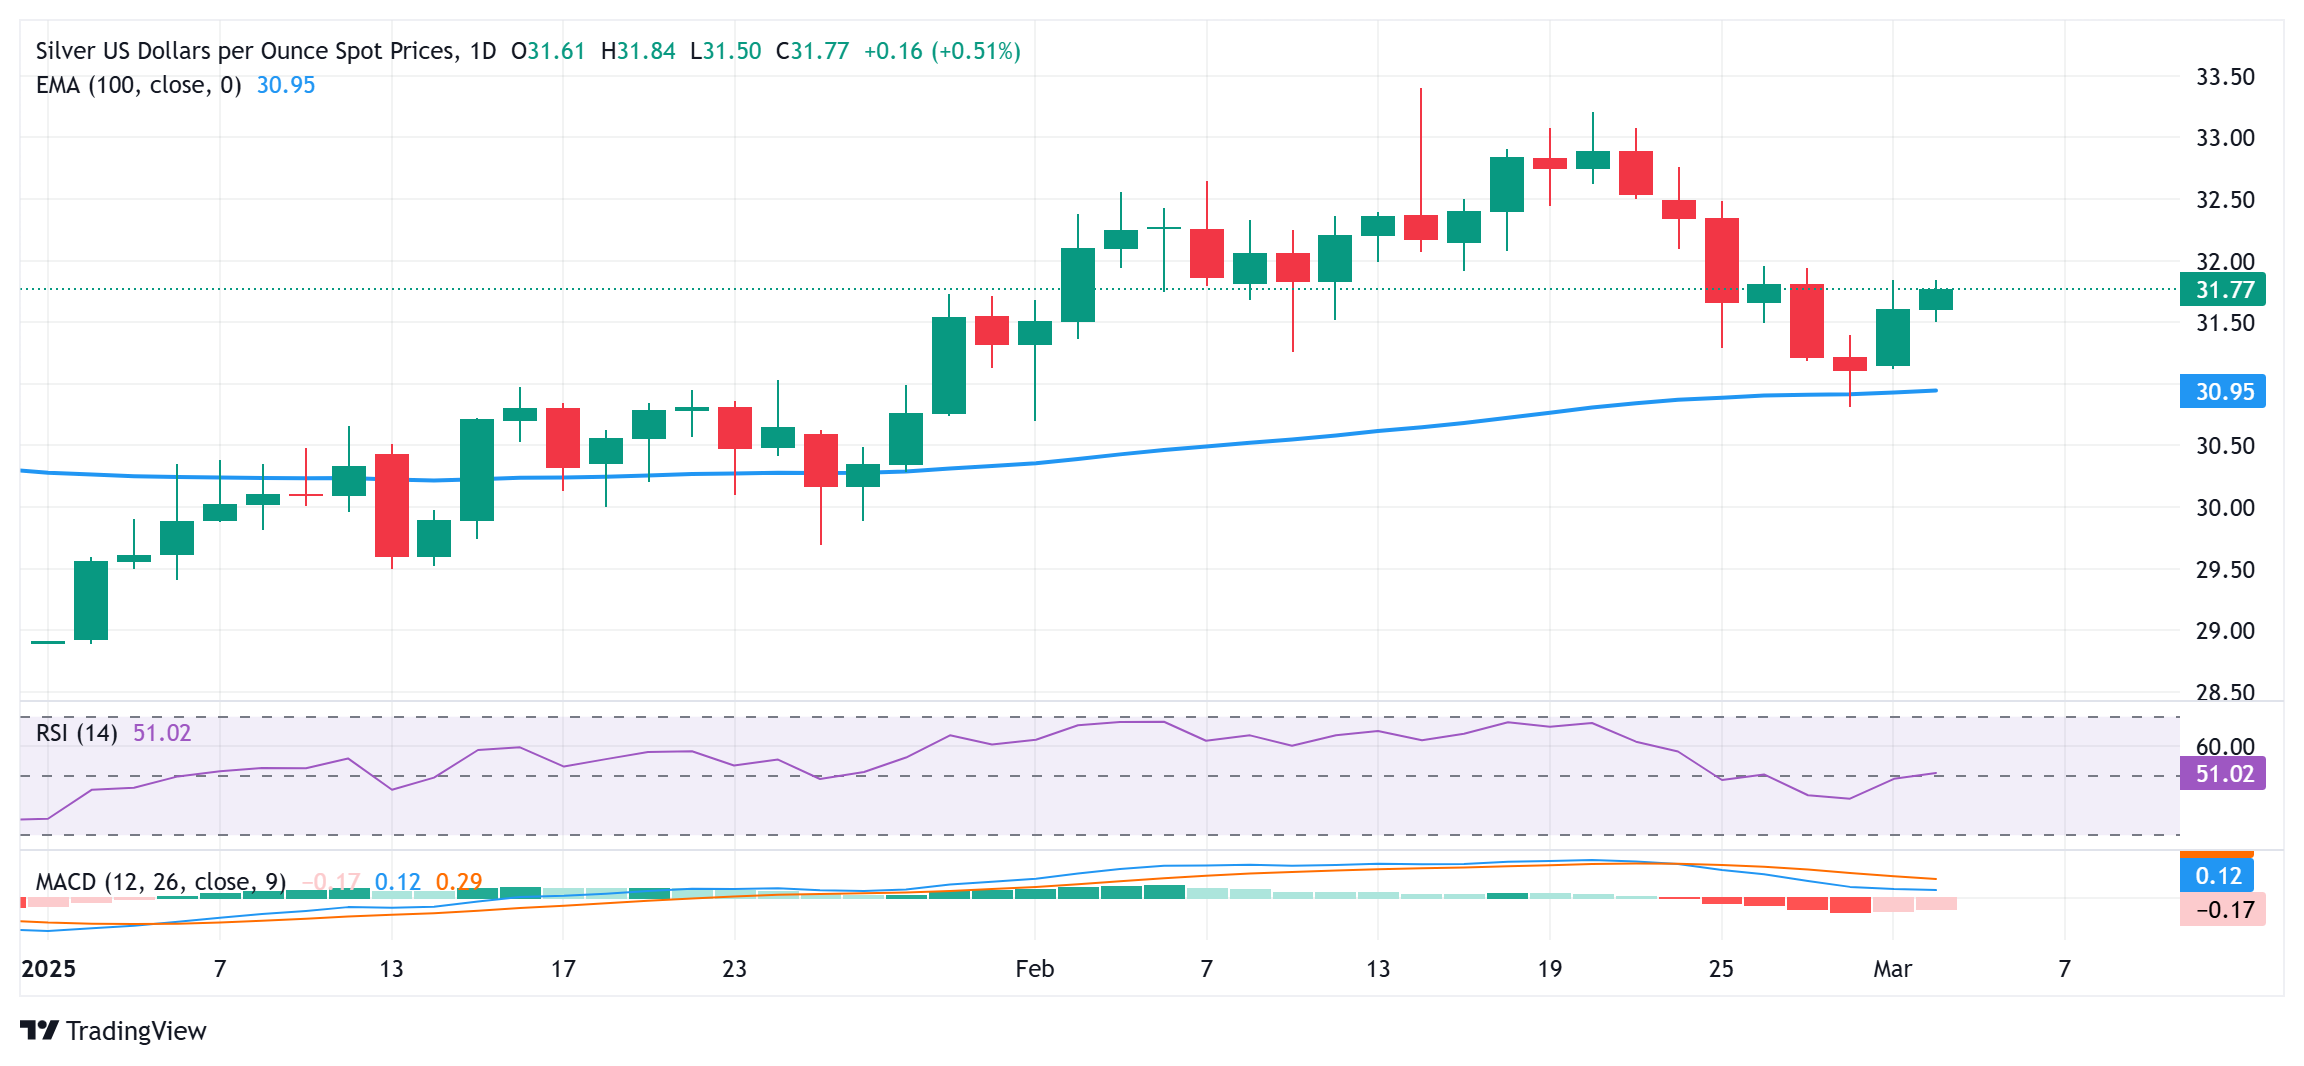
Silver FAQs
Silver is a precious metal highly traded among investors. It has been historically used as a store of value and a medium of exchange. Although less popular than Gold, traders may turn to Silver to diversify their investment portfolio, for its intrinsic value or as a potential hedge during high-inflation periods. Investors can buy physical Silver, in coins or in bars, or trade it through vehicles such as Exchange Traded Funds, which track its price on international markets.
Silver prices can move due to a wide range of factors. Geopolitical instability or fears of a deep recession can make Silver price escalate due to its safe-haven status, although to a lesser extent than Gold's. As a yieldless asset, Silver tends to rise with lower interest rates. Its moves also depend on how the US Dollar (USD) behaves as the asset is priced in dollars (XAG/USD). A strong Dollar tends to keep the price of Silver at bay, whereas a weaker Dollar is likely to propel prices up. Other factors such as investment demand, mining supply – Silver is much more abundant than Gold – and recycling rates can also affect prices.
Silver is widely used in industry, particularly in sectors such as electronics or solar energy, as it has one of the highest electric conductivity of all metals – more than Copper and Gold. A surge in demand can increase prices, while a decline tends to lower them. Dynamics in the US, Chinese and Indian economies can also contribute to price swings: for the US and particularly China, their big industrial sectors use Silver in various processes; in India, consumers’ demand for the precious metal for jewellery also plays a key role in setting prices.
Silver prices tend to follow Gold's moves. When Gold prices rise, Silver typically follows suit, as their status as safe-haven assets is similar. The Gold/Silver ratio, which shows the number of ounces of Silver needed to equal the value of one ounce of Gold, may help to determine the relative valuation between both metals. Some investors may consider a high ratio as an indicator that Silver is undervalued, or Gold is overvalued. On the contrary, a low ratio might suggest that Gold is undervalued relative to Silver.
-
09:02
Iron ore falls below $100/t – ING
Iron ore dipped below $100/t yesterday for the first time since mid-January, ING's commodity experts Ewa Manthey and Warren Patterson note.
Chinese steel mills are reducing production to ease pollution levels
"The move followed reports that Chinese steel mills are reducing production to ease pollution levels ahead of the annual National People’s Congress meeting in Beijing. Steelmakers in the production hub of Tangshan halted work to ensure blue skies."
"There is also speculation that the government will further mandate capacity cuts. The sector is struggling with declining domestic demand and trade tensions affecting the outlook for exports."
-
09:01
Italy Unemployment registered at 6.3% above expectations (6.2%) in January
-
09:00
Greece S&P Global Manufacturing PMI down to 52.6 in February from previous 52.8
-
08:58
SEK: The preferred channel of better European sentiment – ING
The Swedish krona continues to markedly outperform its G10 peers, as SEK appears the preferred way to play market optimism on a Ukraine-Russia peace deal and the boost in EU spending. Crucially, SEK is a high-beta currency for eurozone sentiment, and the rally in European equities is adding fuel to the krona’s rally this week, ING's FX analyst Francesco Pesole notes.
EUR/SEK to stay above 11.00 this summer
"EUR/SEK is now trading close to the key 11.00 support. In the near term, a break lower is more likely than not, especially as we expect the ECB reiterate a dovish stance on Thursday and Sweden’s inflation data (also released on Thursday) are expected to show a pickup in CPIF inflation that should keep Riksbank easing expectations in check."
"Beyond the short term, we are not convinced of lasting SEK strength. We expect US tariffs in April to weigh on European sentiment, and a correction in equities should hit SEK more than the euro. Incidentally, markets may be close to peak optimism on Russia-Ukraine, and a suboptimal truce for Ukraine and the EU would weigh on SEK. We continue to favour EUR/SEK staying above 11.00 this summer."
-
08:55
AUD/USD: Expected to trade between 0.6190 and 0.6250 – UOB Group
Australian Dollar (AUD) is expected to trade between 0.6190 and 0.6250 vs US Dollar (USD). In the longer run, AUD must break and remain below 0.6190 before a move to 0.6155 can be expected, UOB Group's FX analysts Quek Ser Leang and Peter Chia note.
Below 0.6190, a move to 0.6155 can be expected
24-HOUR VIEW: "After AUD fell to a low 0.6192 last Friday and then rebounded, we highlighted yesterday (Monday) that 'the rebound in oversold conditions and slowing momentum indicates that AUD is unlikely to weaken further.' We expected AUD to 'trade in a 0.6195/0.6240 range.' AUD subsequently traded in a higher and wider range than expected (0.6204/0.6255), closing at 0.6225 (+0.27%). The price action still appears to be part of a range trading phase. Today, we expect AUD to trade between 0.6190 and 0.6250."
1-3 WEEKS VIEW: "Our update from yesterday (03 Mar, spot at 0.6215) still stands. As highlighted, “While declines still seem likely, AUD must break and remain below 0.6190 before a move to 0.6155 can be expected.” We will continue to hold the same view provided that AUD remains below 0.6285 (no change in ‘strong resistance’ level from yesterday). Note that below 0.6190, there is another major support at 0.6155."
-
08:55
US Dollar Index breaks below 106.50 despite risk-off sentiment due to global tariff fears
- The US Dollar Index may find support as escalating global tariff tensions drive increased risk aversion.
- The White House confirmed that President Trump signed an order to implement 20% tariffs on Chinese imports.
- The US Dollar faces downward pressure as optimism over a potential Ukraine peace deal dampens demand for safe-haven assets.
The US Dollar Index (DXY), which measures the US Dollar (USD) against six major currencies, extends its losses for the second successive session, trading around 106.30 during the European hours on Tuesday. However, the downside of the DXY may be contained as improved risk aversion, fueled by escalating global tariff tensions, supports the demand for the safe-haven Greenback.
The White House confirmed on Monday that President Trump signed an order increasing tariffs on Chinese imports to 20%, though similar measures for Mexico and Canada remain pending. Trump also reiterated that reciprocal tariffs would take effect on April 2 for nations imposing duties on US goods.
In response, Canada’s Prime Minister’s Office stated that the country would implement 25% retaliatory tariffs on US imports starting Tuesday if US tariffs proceed. Meanwhile, China’s Commerce Ministry announced early Tuesday that it would take “necessary countermeasures” to protect its legitimate rights and interests.
Despite trade tensions, the US Dollar faces downward pressure as optimism surrounding a potential Ukraine peace deal reduces demand for safe-haven assets. European leaders have expressed support for security guarantees for Ukraine, boosting risk sentiment in global markets.
US economic data on Monday provided mixed signals. The ISM Manufacturing PMI declined to 50.3, falling short of the 50.5 forecast and down from January’s 50.9. However, S&P Global’s final Manufacturing PMI for February exceeded expectations at 52.7, improving from its preliminary reading.
Market participants now turn their attention to key US labor data, with the ADP employment report set for release on Wednesday and the Nonfarm Payrolls report on Friday. These figures could offer further insights into the Federal Reserve’s interest rate trajectory.
US Dollar FAQs
The US Dollar (USD) is the official currency of the United States of America, and the ‘de facto’ currency of a significant number of other countries where it is found in circulation alongside local notes. It is the most heavily traded currency in the world, accounting for over 88% of all global foreign exchange turnover, or an average of $6.6 trillion in transactions per day, according to data from 2022. Following the second world war, the USD took over from the British Pound as the world’s reserve currency. For most of its history, the US Dollar was backed by Gold, until the Bretton Woods Agreement in 1971 when the Gold Standard went away.
The most important single factor impacting on the value of the US Dollar is monetary policy, which is shaped by the Federal Reserve (Fed). The Fed has two mandates: to achieve price stability (control inflation) and foster full employment. Its primary tool to achieve these two goals is by adjusting interest rates. When prices are rising too quickly and inflation is above the Fed’s 2% target, the Fed will raise rates, which helps the USD value. When inflation falls below 2% or the Unemployment Rate is too high, the Fed may lower interest rates, which weighs on the Greenback.
In extreme situations, the Federal Reserve can also print more Dollars and enact quantitative easing (QE). QE is the process by which the Fed substantially increases the flow of credit in a stuck financial system. It is a non-standard policy measure used when credit has dried up because banks will not lend to each other (out of the fear of counterparty default). It is a last resort when simply lowering interest rates is unlikely to achieve the necessary result. It was the Fed’s weapon of choice to combat the credit crunch that occurred during the Great Financial Crisis in 2008. It involves the Fed printing more Dollars and using them to buy US government bonds predominantly from financial institutions. QE usually leads to a weaker US Dollar.
Quantitative tightening (QT) is the reverse process whereby the Federal Reserve stops buying bonds from financial institutions and does not reinvest the principal from the bonds it holds maturing in new purchases. It is usually positive for the US Dollar.
-
08:49
DXY: Dragged lower by UST yields – OCBC
USD continued to trade lower, owing to the precipitous fall in UST yields and continued moderation in US exceptionalism. DXY was last at 106.27 levels. US data - ISM mfg, new orders and employment - continued to surprise to the downside overnight, OCBC's FX analysts Frances Cheung and Christopher Wong note.
Consolidation likely with risks skewed to the downside
"Today, Trump’s 25% tariff on Canada and Mexico alongside 10% additional tariff on Chinese imports come into effect, with no room for negotiations. China’s state-backed media Global Times reported that China is preparing countermeasures that include both tariffs and a series of non-tariff measures, and US agricultural and food products will most likely be listed (timing uncertain)."
"Canada and Mexico have also pledged retaliatory tariffs in response. A tit-for-tat can undermine sentiments and lead to demand for safe haven proxy, including USTs and JPY. High-beta risk proxy FX including AUD, NZD stayed under pressure but selected AxJ FX, including THB and IDR found a breather thanks to softer UST yields."
Daily momentum turned flat while RSI fell. Consolidation likely with risks skewed to the downside. Support at 106.35 (38.2% fibo retracement of Oct low to Jan high), 106.10 before 105.00/20 levels (50% fibo, 200 DMA). Resistance here at 107.30 (21 DMA), 107.80/108 levels (23.6% fibo, 50 DMA) before 108.50.
-
08:43
JPY: One of the few beneficiaries – ING
The shift to defensive FX positioning is helping the Japanese yen, ING's FX analyst Chris Turner notes.
A decisive break under 148.50/65 may require an equity sell-off
"Equally, the threat of a global trade war and what it means for growth prospects can see global interest rates edge closer towards the low rates in Japan - also a yen positive. Looking for the yen to outperform on the crosses now will be a popular view. Pairs like EUR/JPY, AUD/JPY and CAD/JPY will be expected to trade lower as activity currencies are priced lower."
"USD/JPY is a little more difficult. A decisive break under 148.50/65 may require an equity sell-off or a big downside miss to Friday's US job reports - which would see President Trump likely take more interest in a lower Fed policy rate."
-
08:41
GBP/USD: Can test the major resistance at 1.2730 – UOB Group
Pound Sterling (GBP) could test the major resistance at 1.2730 vs US Dollar (USD); a break of this level is not ruled out, but 1.2770 is unlikely to come into view. In the longer run, risk for GBP is on the upside; to rise in a sustained manner, GBP must break and remain above 1.2730, UOB Group's FX analysts Quek Ser Leang and Peter Chia note.
Risk for GBP is on the upside
24-HOUR VIEW: "We did not expect GBP to soar yesterday (we were expecting range trading). The sharp and rapid rally appears to be running ahead of itself. However, provided that 1.2645 (minor support is at 1.2670) is not breached, GBP could test the major resistance at 1.2730. A break of this level is not ruled out, but given the overbought conditions, the next major resistance at 1.2770 is unlikely to come into view."
1-3 WEEKS VIEW: "Last Friday (28 Feb, spot at 1.2600), we revised our GBP view from positive to neutral, indicating that 'the current price movements are likely part of a range trading phase, and for the time being, we expect GBP to trade between 1.2520 and 1.2670.' Yesterday, GBP took off and surged, reaching a high of 1.2724. The increase in momentum indicates further upside risk, but to rise in a sustained manner, GBP must break and remain above 1.2730. The probability of GBP breaking clearly above 1.2730 will increase in the next few days as long as the ‘strong support’ level, currently at 1.2610, is not breached. In the near term, there is another support level at 1.2645."
-
08:37
USD: Tariffs are dollar positive, an equity correction is not – ING
During President Trump's first term in office, we felt the sequencing of tax cuts (late 2017) and then tariffs (March 2018-August 2019) were key reasons for a strengthening dollar. In other words, the US economy had some fiscal support before tariff wars were waged. What seems to be the case today is that Washington is engaging in protectionism very early in its new administration without the domestic back-up, ING's FX analyst Chris Turner notes.
Tariff story can keep DXY support at 106.15/35 intact
"Where the USD trades near term may be a function of what happens to US equity markets. 25% tariffs on major trading partners may come as something of a shock and historically trade wars have been bad news for equities. It would be no surprise now for investors to adopt more defensive positioning, which would see the Japanese yen and Swiss franc continue to outperform on the crosses. Should US equities take a turn for the worse, we could then also see USD/JPY and USD/CHF turning lower in outright terms too."
"The implementation of tariffs today also serves as a reminder that Washington requires tariff revenue for its fiscal agenda. That may suggest today's tariffs are slow to reverse and may well be broadened into universal tariffs in April. Expect President Trump to outline such an agenda today when he delivers a speech to a joint session of Congress at 21ET. With tariffs so central to his agenda of bringing higher-paid manufacturing jobs back to the US, this will remain a very difficult environment for currencies backed by commodity exports or with very open economies."
"Ultimately, we still think the dollar will broadly strengthen in the first half of the year, but it's going to be a bumpy ride. DXY is heavily weighted to European FX, which is being buffeted by both tariff news and plans for aggressive defense spending in Europe. It's a tough call, but the tariff story could well keep DXY support at 106.15/35 intact – unless US equities tank."
-
08:32
European gas prices strengthen – ING
European natural gas prices strengthened yesterday, with TTF settling just over 2% higher on the day, ING's commodity experts Ewa Manthey and Warren Patterson note.
European gas prices to remain well supported
"The increase reflects diminishing hopes for a Russia-Ukraine peace deal. Meanwhile, storage levels in the EU stand just under 38% full, compared to 62% last year and a 5-year average of 49%."
"Given the larger task of refilling storage this year, we expect European gas prices to remain well supported. The risk to this view would be a relaxation in storage targets or a peace deal that leads to the resumption of some Russian pipeline gas flows to Europe."
-
08:30
Turkey Exports declined to $20.8B in February from previous $21.2B
-
08:29
EUR/USD: There is scope for EUR to rally further – UOB Group
Strong momentum indicates there is scope for Euro (EUR) to rally further vs US Dollar (USD); the significant resistance at 1.0530 could be just out of reach. In the longer run, increase in momentum is not enough to suggest a sustained rise; EUR must first break and remain above 1.0530 before a move to 1.0570 can be expected, UOB Group's FX analysts Quek Ser Leang and Peter Chia note.
Increase in momentum is not enough to suggest a sustained rise
24-HOUR VIEW: "Our view for EUR to 'trade in a range between 1.0375 and 1.0435' yesterday was incorrect. Instead of trading in a range, EUR surged, closing at 1.0486, sharply higher by 1.07%. While deeply overbought, strong momentum indicates there is scope for EUR to rally further. However, the significant resistance level at 1.0530 could be just out of reach. Note that there is another resistance at 1.0510. To sustain the overbought momentum, EUR must not break below 1.0440 (minor support is at 1.0465)."
1-3 WEEKS VIEW: "Our most recent narrative was from last Friday (28 Feb, spot at 1.0395), wherein EUR 'could continue to decline, but it is currently unclear whether the significant support at 1.0330 is within reach.' Yesterday (Monday), we pointed out that 'Our view remains unchanged, but the ‘strong resistance’ level has moved lower to 1.0455 from 1.0470.' EUR not only broke above our ‘strong resistance’ level but also soared to a high of 1.0503. Upward momentum has increased, though not enough to suggest a sustained rise. EUR must break and remain above the significant resistance at 1.0530 before a move to 1.0570 can be expected. The odds of EUR breaking clearly above 1.0530 will remain intact as long as 1.0415 (‘strong support’ level) is not breached."
-
08:25
NZD/USD Price Forecast: Remains subdued near 0.5600 support amid prevailing bearish bias
- NZD/USD could test key support at the lower boundary of the descending channel near 0.5560.
- The 14-day Relative Strength Index remains below 50, reinforcing the bearish outlook.
- The pair may target initial resistance at the nine-day Exponential Moving Average of 0.5654.
The NZD/USD pair loses ground following the previous session’s gains, trading around 0.5610 during European trading hours on Tuesday. Technical analysis of the daily chart indicates a bearish bias, with the pair trending lower within a descending channel.
The 14-day Relative Strength Index (RSI) remains below the 50 mark, reinforcing the negative outlook. Additionally, NZD/USD continues to trade beneath the nine-day Exponential Moving Average (EMA), signaling weak short-term momentum.
On the downside, a decisive break below the psychological support level of 0.5600 could push the pair toward the key support at 0.5560, the lower boundary of the descending channel. A further decline below this level may intensify selling pressure, potentially dragging NZD/USD to 0.5516—its lowest level since October 2022, recorded on February 3.
Conversely, a recovery could see the pair targeting initial resistance at the nine-day EMA of 0.5654, followed by the descending channel’s upper boundary at 0.5680 and the 50-day EMA at 0.5691. A breakout above the channel would weaken the bearish sentiment and open the door for further gains toward the three-month high of 0.5794, reached on January 24.
NZD/USD: Daily Chart
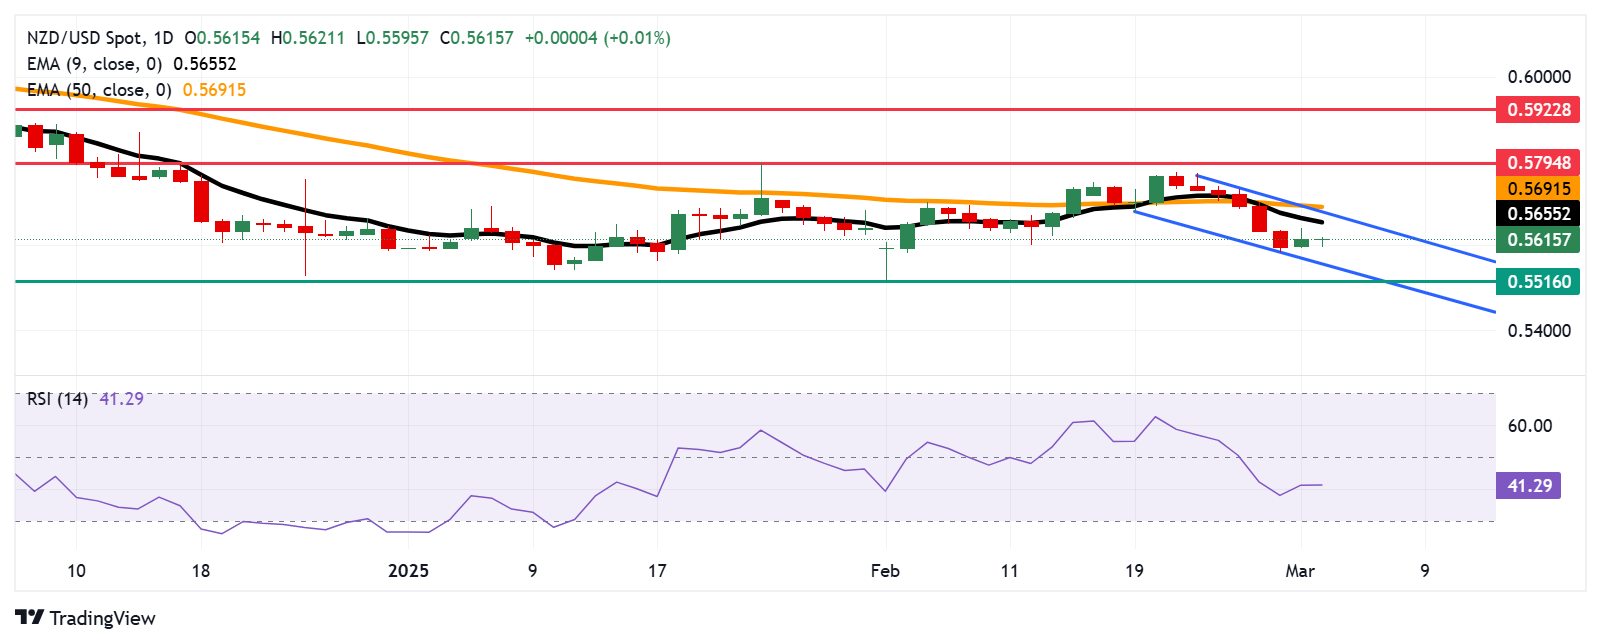
New Zealand Dollar PRICE Today
The table below shows the percentage change of New Zealand Dollar (NZD) against listed major currencies today. New Zealand Dollar was the weakest against the Swiss Franc.
USD EUR GBP JPY CAD AUD NZD CHF USD -0.23% -0.13% -0.19% -0.19% 0.25% 0.01% -0.35% EUR 0.23% 0.11% 0.06% 0.05% 0.48% 0.25% -0.13% GBP 0.13% -0.11% -0.04% -0.07% 0.37% 0.14% -0.23% JPY 0.19% -0.06% 0.04% -0.00% 0.44% 0.20% -0.16% CAD 0.19% -0.05% 0.07% 0.00% 0.44% 0.21% -0.16% AUD -0.25% -0.48% -0.37% -0.44% -0.44% -0.22% -0.59% NZD -0.01% -0.25% -0.14% -0.20% -0.21% 0.22% -0.37% CHF 0.35% 0.13% 0.23% 0.16% 0.16% 0.59% 0.37% The heat map shows percentage changes of major currencies against each other. The base currency is picked from the left column, while the quote currency is picked from the top row. For example, if you pick the New Zealand Dollar from the left column and move along the horizontal line to the US Dollar, the percentage change displayed in the box will represent NZD (base)/USD (quote).
-
08:22
OPEC+ set to increase supply – ING
Oil prices are under pressure with ICE Brent settling more than 1.6% lower yesterday. This follows news that OPEC+ is sticking with plans to gradually increase supply from April by 138k b/d in the month, ING's commodity experts Ewa Manthey and Warren Patterson note.
OPEC+ is sticking with plans to gradually increase supply
"The market had been pricing in the possibility that the group might delay an increase in supply. This development hasn’t changed our view on the market, as we already thought supply would return. The increase is likely to make President Trump happy, given the pressure he’s been putting on OPEC to boost supply."
"According to a Bloomberg survey, OPEC oil production increased by 320k b/d month on month in February to 27.35m b/d. The bulk of the increase was driven by Iraq, with output growing by 150k b/d to 4.16m b/d, leaving production above its target level of 4m b/d. Fairly sizable increases were also seen in Libya, Venezuela and the UAE."
"Along with supply dynamics, there are growing concerns about demand levels amid uncertainty about tariffs. The Atlanta Fed’s GDPNow model suggests first quarter GDP will contract by 2.8%. Just 4 weeks ago, the model was forecasting growth of 3.9%. Trump increased tariffs on China to 20% from 10%, while also allowing 25% levies to go ahead for Canada and Mexico starting today. For Canadian energy, the tariff is set lower at 10%. Given the lack of alternative export capacity for Canadian oil, discounts for Canadian crude will increase thanks to these tariffs."
-
08:18
EUR/USD: 2-way trades likely unless 100-DMA breaks – OCBC
Euro (EUR) continued to drift higher vs US Dollar (USD) as European leaders were seen coming together to offer Ukraine support, fuelling expectations for a higher defence spending. Pair was last at 1.0495 levels, OCBC's FX analysts Frances Cheung and Christopher Wong note.
Daily momentum is flat
"On data front, the higher-than-expected CPI and core CPI print for Feb also pared back some of the markets’ dovish expectations on ECB. That said, the looming risk of US tariffs on Europe and the upcoming ECB meeting (Thu) are some 2-way risks to watch for the EUR. Markets are likely to scrutinise ECB meeting for signs of any slowdown in easing cycle of if an end in the easing cycle is in sight. Any hint on the above should add to EUR recovery."
"On tariffs, Trump has indicated tariff of 25% on European auto and other products but did not mention further details or an effective date. Confirmation of tariff on EU may see EUR dip, but it remains to be seen if the pullback can be sustained, considering the emergence of new positives: potential Ukraine peace deal, expectations of defence spending, chance that ECB easing may slow, etc."
"Daily momentum is flat while rise in RSI slowed. 2-way trades likely. Key resistance at 1.0510 (100 DMA). Decisive break out puts next resistance at 1.0575 (38.2% fibo retracement of Sep high to Jan low), 1.07 levels (50% fibo). Support at 1.0420 (21DMA, 23.6% fibo), 1.0360/90 (50 DMA) and 1.0280 levels."
-
08:13
EUR: European defence spending narrative looks overblown – ING
EUR/USD had a decent rally yesterday as investors focused on the explosive rally in European defence stocks. That Europe needs to spend a lot more on defence now is not in doubt. The question is what does it mean for FX? Can European defence spending move the needle on European growth and curtail some of the ECB easing cycle? This are the questions, ING's FX analyst Chris Turner asks.
Spike through resistance at 1.0535/50 isn't sustainable
"Our eurozone economic team doubts defence spending will have a significant impact on European growth prospects. After all, Germany has only spent around a quarter of its EUR100bn Special Defence Fund established in 2022 after the Russian invasion of Ukraine. We certainly don't want to stand in the way of the rally of European defence stocks nor the steepening in European government bond curves, but we do have our doubts about the merits of buying the euro on this narrative."
"Instead, it has largely been the softening of US data and the repricing of Fed expectations that have driven EUR/USD higher. Here the Atlantic two-year spread has narrowed a staggering 35bps in less than a month, entirely driven by the re-pricing of the Fed. Whether this narrows any further may be a function of how US equities react to the tariff news."
"EUR/USD is a tough call at the moment, but looming tariffs are a real threat to an open economy such as the eurozone. And if EUR/USD were to spike through resistance at 1.0535/50 for some reason, we doubt such a rally would be sustainable."
-
08:11
Crude oil price today: WTI price bearish at European opening
West Texas Intermediate (WTI) Oil price falls on Tuesday, early in the European session. WTI trades at $67.67 per barrel, down from Monday’s close at $68.11. Brent Oil Exchange Rate (Brent crude) is also shedding ground, trading at $70.82 after its previous daily close at $71.28.
WTI Oil FAQs
WTI Oil is a type of Crude Oil sold on international markets. The WTI stands for West Texas Intermediate, one of three major types including Brent and Dubai Crude. WTI is also referred to as “light” and “sweet” because of its relatively low gravity and sulfur content respectively. It is considered a high quality Oil that is easily refined. It is sourced in the United States and distributed via the Cushing hub, which is considered “The Pipeline Crossroads of the World”. It is a benchmark for the Oil market and WTI price is frequently quoted in the media.
Like all assets, supply and demand are the key drivers of WTI Oil price. As such, global growth can be a driver of increased demand and vice versa for weak global growth. Political instability, wars, and sanctions can disrupt supply and impact prices. The decisions of OPEC, a group of major Oil-producing countries, is another key driver of price. The value of the US Dollar influences the price of WTI Crude Oil, since Oil is predominantly traded in US Dollars, thus a weaker US Dollar can make Oil more affordable and vice versa.
The weekly Oil inventory reports published by the American Petroleum Institute (API) and the Energy Information Agency (EIA) impact the price of WTI Oil. Changes in inventories reflect fluctuating supply and demand. If the data shows a drop in inventories it can indicate increased demand, pushing up Oil price. Higher inventories can reflect increased supply, pushing down prices. API’s report is published every Tuesday and EIA’s the day after. Their results are usually similar, falling within 1% of each other 75% of the time. The EIA data is considered more reliable, since it is a government agency.
OPEC (Organization of the Petroleum Exporting Countries) is a group of 12 Oil-producing nations who collectively decide production quotas for member countries at twice-yearly meetings. Their decisions often impact WTI Oil prices. When OPEC decides to lower quotas, it can tighten supply, pushing up Oil prices. When OPEC increases production, it has the opposite effect. OPEC+ refers to an expanded group that includes ten extra non-OPEC members, the most notable of which is Russia.
Disclaimer: West Texas Intermediate (WTI) and Brent oil prices mentioned above are based on FXStreet data feed for Contracts for Differences (CFDs).
(An automation tool was used in creating this post.)
-
08:02
Spain Unemployment Change registered at -5.994K, below expectations (45.2K) in February
-
08:00
Spain Unemployment Change below forecasts (45.2K) in February: Actual (-6K)
-
07:51
EUR/USD steadies on Ukraine peace plan, ECB policy in focus
- EUR/USD demonstrates strength around 1.0500 as a positive development towards ending the war in Ukraine has improved the Euro’s appeal.
- The ECB is expected to cut interest rates by 25 bps on Thursday.
- US President Trump imposed 25% tariffs on Canada and Mexico and an additional 10% on China.
EUR/USD holds onto gains near the key level of 1.0500 in Tuesday’s European session. The major currency pair remains firm as European leaders, including Ukrainian President Volodymyr Zelenskyy, agreed to structure a peace plan to end the three-year-long war in Ukraine. Europe’s readiness to stop the massacre in Ukraine has improved the Euro’s (EUR) appeal, assuming that a truce between Russia and Kyiv would restore the fractured supply chain of the Eurozone.
This week, the major trigger for the Euro is the European Central Bank’s (ECB) monetary policy decision, which is scheduled for Thursday.
According to the February 19-27 Reuters poll, the ECB will cut its Deposit Facility Rate by 25 basis points (bps) to 2.5%. This would be the fifth interest rate cut by the ECB in a row, the sixth since the central bank started its easing cycle in June 2024. Dovish votes for the ECB’s interest rate decision were prompted by fears that United States (US) President Donald Trump’s tariff agenda will damage the Eurozone economic growth.
Additionally, ECB officials have remained confident that inflationary pressures will sustainably return to the desired rate of 2% this year.
Investors will pay close attention to the monetary policy statement and ECB President Christine Lagarde’s press conference after the policy decision. Market participants want to know when the ECB will return to a neutral stance and how Trump’s tariff agenda will impact the inflation outlook.
Daily digest market movers: EUR/USD remains firm as US Dollar is on backfoot
- EUR/USD steadies around 1.0500 as the US Dollar (USD) trades cautiously near Monday’s low even though fresh tariffs by US President Trump on Canada and Mexico, and additional levies on China, come into effect on Tuesday. The US Dollar Index (DXY), which tracks the Greenback’s value against six major currencies, appears vulnerable around 106.50.
- President Trump has imposed 25% tariffs on his North American partners and an additional 10% on China for pouring fentanyl into the US. Trump said to reporters on Monday, “No room left for Mexico or for Canada.” He added, “The tariffs, you know, they’re all set. They go into effect tomorrow.”
- In retaliation, China has also slapped tariffs on various agricultural imports from the US, which will take effect on March 10. The imposition of tariffs by the US on China and its neighbours has confirmed a global trade war. This scenario is unfavorable for the global economic outlook.
- Meanwhile, investors expect Trump’s tariff agenda will be inflationary for the US economy, assuming that the impact of higher levies will be borne by US importers, who would be forced to pass on higher input costs to consumers.
- On the economic data front, investors await a slew of US labor market-related data and the ISM Services PMI release this week. Investors will pay close attention to the US economic data as it will influence market speculation about the Federal Reserve’s (Fed) monetary policy outlook.
Technical Analysis: EUR/USD holds onto gains around 1.0500
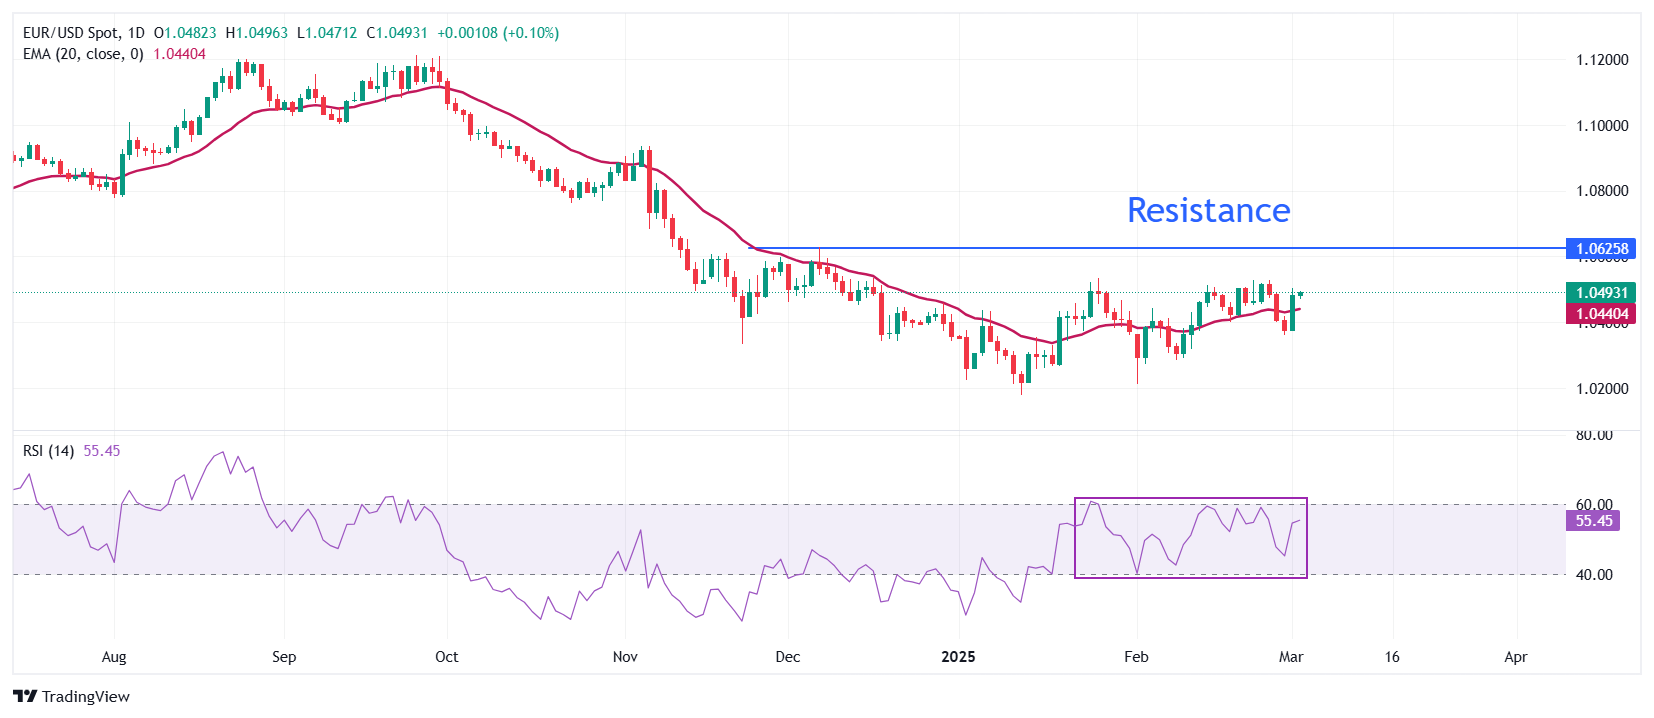
EUR/USD trades firm near 1.0500 in European trading hours on Tuesday. The major currency pair trades above the 20-day Exponential Moving Average (EMA), which is around 1.0440, suggesting that the near-term trend is bullish.
The 14-day Relative Strength Index (RSI) oscillates inside the 40.00-60.00 range, which indicates a sideways trend.
Looking down, the February 10 low of 1.0285 will act as the major support zone for the pair. Conversely, the December 6 high of 1.0630 will be the key barrier for the Euro bulls.
Euro FAQs
The Euro is the currency for the 19 European Union countries that belong to the Eurozone. It is the second most heavily traded currency in the world behind the US Dollar. In 2022, it accounted for 31% of all foreign exchange transactions, with an average daily turnover of over $2.2 trillion a day. EUR/USD is the most heavily traded currency pair in the world, accounting for an estimated 30% off all transactions, followed by EUR/JPY (4%), EUR/GBP (3%) and EUR/AUD (2%).
The European Central Bank (ECB) in Frankfurt, Germany, is the reserve bank for the Eurozone. The ECB sets interest rates and manages monetary policy. The ECB’s primary mandate is to maintain price stability, which means either controlling inflation or stimulating growth. Its primary tool is the raising or lowering of interest rates. Relatively high interest rates – or the expectation of higher rates – will usually benefit the Euro and vice versa. The ECB Governing Council makes monetary policy decisions at meetings held eight times a year. Decisions are made by heads of the Eurozone national banks and six permanent members, including the President of the ECB, Christine Lagarde.
Eurozone inflation data, measured by the Harmonized Index of Consumer Prices (HICP), is an important econometric for the Euro. If inflation rises more than expected, especially if above the ECB’s 2% target, it obliges the ECB to raise interest rates to bring it back under control. Relatively high interest rates compared to its counterparts will usually benefit the Euro, as it makes the region more attractive as a place for global investors to park their money.
Data releases gauge the health of the economy and can impact on the Euro. Indicators such as GDP, Manufacturing and Services PMIs, employment, and consumer sentiment surveys can all influence the direction of the single currency. A strong economy is good for the Euro. Not only does it attract more foreign investment but it may encourage the ECB to put up interest rates, which will directly strengthen the Euro. Otherwise, if economic data is weak, the Euro is likely to fall. Economic data for the four largest economies in the euro area (Germany, France, Italy and Spain) are especially significant, as they account for 75% of the Eurozone’s economy.
Another significant data release for the Euro is the Trade Balance. This indicator measures the difference between what a country earns from its exports and what it spends on imports over a given period. If a country produces highly sought after exports then its currency will gain in value purely from the extra demand created from foreign buyers seeking to purchase these goods. Therefore, a positive net Trade Balance strengthens a currency and vice versa for a negative balance.
-
07:47
AUD/JPY trades near 93.00, downside risks appear amid tariff concerns
- AUD/JPY weakens amid growing concerns about a global tariff war.
- RBA’s February Meeting Minutes highlighted downside risks to the economy.
- Japan’s Unemployment Rate unexpectedly rose to 2.5% in January, from 2.4% prior.
AUD/JPY continues its decline, hovering around 92.80 during early European trading on Tuesday. The Australian Dollar (AUD) remains under pressure after the White House confirmed that US President Donald Trump signed an order raising tariffs on Chinese imports to 20%. Given China’s crucial role as Australia’s largest trading partner, any economic shifts in China could significantly impact the AUD. However, similar measures for Mexico and Canada have yet to be finalized.
Further weighing on the Aussie Dollar, the Reserve Bank of Australia’s (RBA) February Meeting Minutes highlighted downside risks to the economy. While the Board acknowledged labor market strength as a key reason to maintain interest rates, it noted that the current tightness was inconsistent with the central bank’s 2.5% inflation target. As a result, policymakers saw a stronger case for potential rate cuts.
On the economic data front, Australia’s Retail Sales rose 0.3% month-over-month in January, recovering from a 0.1% decline in December. However, the ANZ-Roy Morgan Australian Consumer Confidence Index fell to 87.7 from the previous week's 89.8, when it had reached its highest level since May 2022.
Despite AUD weakness, downside pressure on the AUD/JPY cross could be limited as the Japanese Yen (JPY) struggles after Japan’s Unemployment Rate unexpectedly rose from 2.4% to 2.5% in January, while corporate spending on plants and equipment declined by 0.2% in Q4.
Meanwhile, Japan’s Finance Minister, Katsunobu Kato, reaffirmed that the country is not actively seeking to devalue its currency, emphasizing Japan’s "basic stance on currency policy." Additionally, Economy Minister Ryosei Akazawa stated that government intervention in the currency market only occurs in response to "speculative" movements.
Tariffs FAQs
Tariffs are customs duties levied on certain merchandise imports or a category of products. Tariffs are designed to help local producers and manufacturers be more competitive in the market by providing a price advantage over similar goods that can be imported. Tariffs are widely used as tools of protectionism, along with trade barriers and import quotas.
Although tariffs and taxes both generate government revenue to fund public goods and services, they have several distinctions. Tariffs are prepaid at the port of entry, while taxes are paid at the time of purchase. Taxes are imposed on individual taxpayers and businesses, while tariffs are paid by importers.
There are two schools of thought among economists regarding the usage of tariffs. While some argue that tariffs are necessary to protect domestic industries and address trade imbalances, others see them as a harmful tool that could potentially drive prices higher over the long term and lead to a damaging trade war by encouraging tit-for-tat tariffs.
During the run-up to the presidential election in November 2024, Donald Trump made it clear that he intends to use tariffs to support the US economy and American producers. In 2024, Mexico, China and Canada accounted for 42% of total US imports. In this period, Mexico stood out as the top exporter with $466.6 billion, according to the US Census Bureau. Hence, Trump wants to focus on these three nations when imposing tariffs. He also plans to use the revenue generated through tariffs to lower personal income taxes.
-
07:46
France Budget Balance rose from previous €-156.3B to €-17.3B in January
-
07:42
Forex Today: Markets remain on edge as Trump tariffs take effect
Here is what you need to know on Tuesday, March 4:
Following Monday's volatile action, investors cling to a cautious stance early Tuesday, while assessing the latest developments surrounding the US tariff policy and retaliatory measures against it. The economic calendar will not offer any high-impact data releases. Later in the day, several Federal Reserve (Fed) policymakers will be delivering speeches.
US Dollar PRICE This week
The table below shows the percentage change of US Dollar (USD) against listed major currencies this week. US Dollar was the weakest against the Euro.
USD EUR GBP JPY CAD AUD NZD CHF USD -1.07% -0.94% -0.66% 0.22% -0.01% -0.23% -0.76% EUR 1.07% 0.01% 0.19% 1.11% 0.97% 0.66% 0.12% GBP 0.94% -0.01% 0.28% 1.11% 0.95% 0.64% 0.11% JPY 0.66% -0.19% -0.28% 1.13% 0.71% 0.50% -0.10% CAD -0.22% -1.11% -1.11% -1.13% -0.09% -0.46% -0.99% AUD 0.01% -0.97% -0.95% -0.71% 0.09% -0.30% -0.83% NZD 0.23% -0.66% -0.64% -0.50% 0.46% 0.30% -0.53% CHF 0.76% -0.12% -0.11% 0.10% 0.99% 0.83% 0.53% The heat map shows percentage changes of major currencies against each other. The base currency is picked from the left column, while the quote currency is picked from the top row. For example, if you pick the US Dollar from the left column and move along the horizontal line to the Japanese Yen, the percentage change displayed in the box will represent USD (base)/JPY (quote).
US President Donald Trump's 25% tariffs on Canadian and Mexican imports, as well as the additional 10% on Chinese goods, took effect early Tuesday. In response, Canada said that they will start imposing reciprocal 25% tariffs on US imports worth about 30 billion Canadian Dollar and noted that they are in active and ongoing discussions with provinces and territories to pursue several non-tariff measures. Meanwhile, China’s Commerce Ministry announced on Tuesday that it would slap additional tariffs of up to 15% on US imports of key farm products, including chicken, pork, soy and beef. Mexican President Claudia Sheinbaum is expected to announce her response in a news conference in Mexico City later in the day.
After ending the previous week on a bullish note, the US Dollar (USD) Index turned south in the second half of the day on Monday and closed the day deep in negative territory. Early Tuesday, the index fluctuates in a tight channel at around 106.50. In the meantime, the benchmark 10-year US Treasury bond yield stays below 4.2% following Monday's decline and US stock index futures trade marginally higher on the day.
EUR/USD benefitted from the selling pressure surrounding the USD and rose more than 1% on Monday, erasing a majority of last week's losses in the process. Early Tuesday, the pair fluctuates near 1.0500.
GBP/USD gathered bullish momentum and advanced to the 1.2700 area on Monday. The pair stays in a consolidation phase in the European morning on Tuesday.
During the Asian trading hours, the data from Australia showed that Retail Sales increased by 0.3% on a monthly basis in January, as expected. The minutes of the Reserve Bank of Australia's (RBA) February monetary policy meeting showed that policymakers did not commit to additional rate cuts but placed more weight on the downside risks to the economy. AUD/USD stays under modest bearish pressure early Tuesday and trades at around 0.6200.
Despite the broad USD weakness, USD/CAD closed marginally higher on Monday. The pair holds its ground early Tuesday and trades near 1.4500. After rising nearly 0.7% on Monday, USD/MXN continues to push higher and was last seen trading at its strongest level in a month at 20.8480, rising about 0.8% on the day.
Gold capitalized on the risk-averse market atmosphere and rose more than 1% on Monday. XAU/USD trades within a touching distance of $2,900 in the European morning on Tuesday.
Tariffs FAQs
Tariffs are customs duties levied on certain merchandise imports or a category of products. Tariffs are designed to help local producers and manufacturers be more competitive in the market by providing a price advantage over similar goods that can be imported. Tariffs are widely used as tools of protectionism, along with trade barriers and import quotas.
Although tariffs and taxes both generate government revenue to fund public goods and services, they have several distinctions. Tariffs are prepaid at the port of entry, while taxes are paid at the time of purchase. Taxes are imposed on individual taxpayers and businesses, while tariffs are paid by importers.
There are two schools of thought among economists regarding the usage of tariffs. While some argue that tariffs are necessary to protect domestic industries and address trade imbalances, others see them as a harmful tool that could potentially drive prices higher over the long term and lead to a damaging trade war by encouraging tit-for-tat tariffs.
During the run-up to the presidential election in November 2024, Donald Trump made it clear that he intends to use tariffs to support the US economy and American producers. In 2024, Mexico, China and Canada accounted for 42% of total US imports. In this period, Mexico stood out as the top exporter with $466.6 billion, according to the US Census Bureau. Hence, Trump wants to focus on these three nations when imposing tariffs. He also plans to use the revenue generated through tariffs to lower personal income taxes.
-
07:00
EUR/GBP holds positive ground above 0.8250 on Ukraine peace plan
- EUR/GBP trades on a stronger note near 0.8255 in Tuesday’s early European session.
- Ukraine peace plan and hotter-than-expected Eurozone HICP inflation data lift the Euro.
- The BoE is anticapted to follow a careful and gradual policy-easing approach.
The EUR/GBP cross trades in positive territory for the second consecutive days around 0.8255 during the early European session on Tuesday. The Euro (EUR) strengthens against the Pound Sterling (GBP) after the report that France and the United Kingdom (UK) have proposed a one-month truce in Ukraine.
French President Emmanuel Macron and his foreign minister said that France is proposing a partial one-month truce between Russia and Ukraine, suggesting European efforts to bolster support for Kyiv accelerate in the face of uncertain US backing.
Additionally, the hotter-than-expected February flash Harmonized Index of Consumer Prices (HICP) data from the Eurozone provides some support to the shared currency. The Eurozone HICP rose 2.4% YoY in February, compared to 2.5% in January. This figure came in above the consensus of 2.3%.
On the GBP’s front, the rising bets that the Bank of England (BoE) will follow a moderate policy-easing cycle might boost the GBP and create a headwind for EUR/GBP. BoE Deputy Governor Dave Ramsden said that the UK central bank should keep a “careful and gradual” approach to the monetary policy amid uncertainty over the labor market and global trade.Euro FAQs
The Euro is the currency for the 19 European Union countries that belong to the Eurozone. It is the second most heavily traded currency in the world behind the US Dollar. In 2022, it accounted for 31% of all foreign exchange transactions, with an average daily turnover of over $2.2 trillion a day. EUR/USD is the most heavily traded currency pair in the world, accounting for an estimated 30% off all transactions, followed by EUR/JPY (4%), EUR/GBP (3%) and EUR/AUD (2%).
The European Central Bank (ECB) in Frankfurt, Germany, is the reserve bank for the Eurozone. The ECB sets interest rates and manages monetary policy. The ECB’s primary mandate is to maintain price stability, which means either controlling inflation or stimulating growth. Its primary tool is the raising or lowering of interest rates. Relatively high interest rates – or the expectation of higher rates – will usually benefit the Euro and vice versa. The ECB Governing Council makes monetary policy decisions at meetings held eight times a year. Decisions are made by heads of the Eurozone national banks and six permanent members, including the President of the ECB, Christine Lagarde.
Eurozone inflation data, measured by the Harmonized Index of Consumer Prices (HICP), is an important econometric for the Euro. If inflation rises more than expected, especially if above the ECB’s 2% target, it obliges the ECB to raise interest rates to bring it back under control. Relatively high interest rates compared to its counterparts will usually benefit the Euro, as it makes the region more attractive as a place for global investors to park their money.
Data releases gauge the health of the economy and can impact on the Euro. Indicators such as GDP, Manufacturing and Services PMIs, employment, and consumer sentiment surveys can all influence the direction of the single currency. A strong economy is good for the Euro. Not only does it attract more foreign investment but it may encourage the ECB to put up interest rates, which will directly strengthen the Euro. Otherwise, if economic data is weak, the Euro is likely to fall. Economic data for the four largest economies in the euro area (Germany, France, Italy and Spain) are especially significant, as they account for 75% of the Eurozone’s economy.
Another significant data release for the Euro is the Trade Balance. This indicator measures the difference between what a country earns from its exports and what it spends on imports over a given period. If a country produces highly sought after exports then its currency will gain in value purely from the extra demand created from foreign buyers seeking to purchase these goods. Therefore, a positive net Trade Balance strengthens a currency and vice versa for a negative balance.
-
06:26
China announces extra tariffs of up to 15% on imports of major US farm exports
China’s Commerce Ministry announced on Tuesday that it will slap additional tariffs of upto 15% on imports of key farm products, including chicken, pork, soy and beef from the United States (US).
developing story ....
US-China Trade War FAQs
Generally speaking, a trade war is an economic conflict between two or more countries due to extreme protectionism on one end. It implies the creation of trade barriers, such as tariffs, which result in counter-barriers, escalating import costs, and hence the cost of living.
An economic conflict between the United States (US) and China began early in 2018, when President Donald Trump set trade barriers on China, claiming unfair commercial practices and intellectual property theft from the Asian giant. China took retaliatory action, imposing tariffs on multiple US goods, such as automobiles and soybeans. Tensions escalated until the two countries signed the US-China Phase One trade deal in January 2020. The agreement required structural reforms and other changes to China’s economic and trade regime and pretended to restore stability and trust between the two nations. However, the Coronavirus pandemic took the focus out of the conflict. Yet, it is worth mentioning that President Joe Biden, who took office after Trump, kept tariffs in place and even added some additional levies.
The return of Donald Trump to the White House as the 47th US President has sparked a fresh wave of tensions between the two countries. During the 2024 election campaign, Trump pledged to impose 60% tariffs on China once he returned to office, which he did on January 20, 2025. With Trump back, the US-China trade war is meant to resume where it was left, with tit-for-tat policies affecting the global economic landscape amid disruptions in global supply chains, resulting in a reduction in spending, particularly investment, and directly feeding into the Consumer Price Index inflation.
-
06:15
FX option expiries for Mar 4 NY cut
FX option expiries for Mar 4 NY cut at 10:00 Eastern Time via DTCC can be found below.
EUR/USD: EUR amounts
- 1.0300 1.1b
- 1.0375 1b
- 1.0400 1.2b
- 1.0480 1b
- 1.0525 1b
- 1.0550 845m
USD/JPY: USD amounts
- 148.30 686m
USD/CHF: USD amounts
- 0.8990 609m
AUD/USD: AUD amounts
- 0.6335 1.2b
USD/CAD: USD amounts
- 1.4400 1.2b
- 1.4410 773m
- 1.4580 1.2b
-
06:06
WTI attracts some sellers below $68.00 as OPEC+ plans to increase production
- WTI remains under selling pressure around $67.70 in Tuesday’s early European session.
- OPEC+ said it will proceed with a plan to increase oil production from April.
- US tariff threats and peace talks on Russia-Ukraine also weigh on the WTI price.
West Texas Intermediate (WTI), the US crude oil benchmark, is trading around $67.70 during the early European session on Tuesday. The WTI price edges lower to near a 12-week low on reports that OPEC+ will proceed with a planned oil output increase in April.
The Organization of the Petroleum Exporting Countries and allies (OPEC+) said it will proceed with a plan to increase oil production from April. This increase follows a series of output cuts made by OPEC+ to stabilize the market.
Additionally, the possible peace talks on the Russia-Ukraine and US tariff threats might contribute to the WTI’s downside. Trump confirmed on Monday that tariffs on Canada and Mexico would go into effect on Tuesday. The measures of Trump had previously reaffirmed the new March date after having initially set it for April.
"Crude oil is under siege on multiple fronts and is vulnerable to the latest bearish headline or economic data," said Bob Yawger, director of energy futures at Mizuho.
On the other hand, the weaker-than-expected US economic data might drag the Greenback lower and help limit the USD-denominated commodity’s losses. The US ISM Manufacturing Purchasing Managers' Index (PMI) came in below the market consensus, falling to 50.3 in February from 50.9 in January.WTI Oil FAQs
WTI Oil is a type of Crude Oil sold on international markets. The WTI stands for West Texas Intermediate, one of three major types including Brent and Dubai Crude. WTI is also referred to as “light” and “sweet” because of its relatively low gravity and sulfur content respectively. It is considered a high quality Oil that is easily refined. It is sourced in the United States and distributed via the Cushing hub, which is considered “The Pipeline Crossroads of the World”. It is a benchmark for the Oil market and WTI price is frequently quoted in the media.
Like all assets, supply and demand are the key drivers of WTI Oil price. As such, global growth can be a driver of increased demand and vice versa for weak global growth. Political instability, wars, and sanctions can disrupt supply and impact prices. The decisions of OPEC, a group of major Oil-producing countries, is another key driver of price. The value of the US Dollar influences the price of WTI Crude Oil, since Oil is predominantly traded in US Dollars, thus a weaker US Dollar can make Oil more affordable and vice versa.
The weekly Oil inventory reports published by the American Petroleum Institute (API) and the Energy Information Agency (EIA) impact the price of WTI Oil. Changes in inventories reflect fluctuating supply and demand. If the data shows a drop in inventories it can indicate increased demand, pushing up Oil price. Higher inventories can reflect increased supply, pushing down prices. API’s report is published every Tuesday and EIA’s the day after. Their results are usually similar, falling within 1% of each other 75% of the time. The EIA data is considered more reliable, since it is a government agency.
OPEC (Organization of the Petroleum Exporting Countries) is a group of 12 Oil-producing nations who collectively decide production quotas for member countries at twice-yearly meetings. Their decisions often impact WTI Oil prices. When OPEC decides to lower quotas, it can tighten supply, pushing up Oil prices. When OPEC increases production, it has the opposite effect. OPEC+ refers to an expanded group that includes ten extra non-OPEC members, the most notable of which is Russia.
-
05:18
USD/CHF remains under pressure near 0.8950 as Swiss Franc strengthens on safe-haven demand
- USD/CHF loses ground as the Swiss Franc appreciates due to safe-haven demand amid rising tariff war fears.
- Canada’s Prime Minister’s Office announced plans to impose retaliatory 25% tariffs on US imports if US tariffs take effect.
- The US Dollar faced challenges due to optimism surrounding a potential Ukraine peace deal.
USD/CHF remains under pressure for the second consecutive day, hovering around 0.8960 during Tuesday’s Asian session. The pair may decline further as the safe-haven Swiss Franc (CHF) strengthens amid escalating risk-off sentiment driven by growing concerns over a global tariff war.
On Monday, the White House confirmed that President Trump signed an order raising tariffs on Chinese imports to 20%, while similar measures for Mexico and Canada are still pending. Trump also reiterated that reciprocal tariffs will take effect on April 2 for countries imposing duties on US goods.
In response, Canada’s Prime Minister’s Office stated that Canada will implement 25% retaliatory tariffs on US imports starting Tuesday if US tariffs proceed. Meanwhile, China’s Commerce Ministry announced early Tuesday that it would take "necessary countermeasures" to protect its legitimate rights and interests.
The US Dollar Index (DXY), which tracks the USD against six major currencies, has climbed to near 106.60. However, the Greenback faces downward pressure as optimism surrounding a potential Ukraine peace deal reduces demand for safe-haven assets. European leaders have voiced support for security guarantees for Ukraine, further boosting global risk sentiment.
US ISM Manufacturing PMI dipped to 50.3, falling short of expectations (50.5) and declining from January’s 50.9. Conversely, S&P Global’s final Manufacturing PMI for February exceeded forecasts at 52.7, improving from its preliminary estimate.
Investors now shift their focus to upcoming US labor market data, with the ADP employment report due on Wednesday and the Nonfarm Payrolls report on Friday, which could provide further insights into the Federal Reserve’s (Fed) interest rate outlook.
Swiss Franc FAQs
The Swiss Franc (CHF) is Switzerland’s official currency. It is among the top ten most traded currencies globally, reaching volumes that well exceed the size of the Swiss economy. Its value is determined by the broad market sentiment, the country’s economic health or action taken by the Swiss National Bank (SNB), among other factors. Between 2011 and 2015, the Swiss Franc was pegged to the Euro (EUR). The peg was abruptly removed, resulting in a more than 20% increase in the Franc’s value, causing a turmoil in markets. Even though the peg isn’t in force anymore, CHF fortunes tend to be highly correlated with the Euro ones due to the high dependency of the Swiss economy on the neighboring Eurozone.
The Swiss Franc (CHF) is considered a safe-haven asset, or a currency that investors tend to buy in times of market stress. This is due to the perceived status of Switzerland in the world: a stable economy, a strong export sector, big central bank reserves or a longstanding political stance towards neutrality in global conflicts make the country’s currency a good choice for investors fleeing from risks. Turbulent times are likely to strengthen CHF value against other currencies that are seen as more risky to invest in.
The Swiss National Bank (SNB) meets four times a year – once every quarter, less than other major central banks – to decide on monetary policy. The bank aims for an annual inflation rate of less than 2%. When inflation is above target or forecasted to be above target in the foreseeable future, the bank will attempt to tame price growth by raising its policy rate. Higher interest rates are generally positive for the Swiss Franc (CHF) as they lead to higher yields, making the country a more attractive place for investors. On the contrary, lower interest rates tend to weaken CHF.
Macroeconomic data releases in Switzerland are key to assessing the state of the economy and can impact the Swiss Franc’s (CHF) valuation. The Swiss economy is broadly stable, but any sudden change in economic growth, inflation, current account or the central bank’s currency reserves have the potential to trigger moves in CHF. Generally, high economic growth, low unemployment and high confidence are good for CHF. Conversely, if economic data points to weakening momentum, CHF is likely to depreciate.
As a small and open economy, Switzerland is heavily dependent on the health of the neighboring Eurozone economies. The broader European Union is Switzerland’s main economic partner and a key political ally, so macroeconomic and monetary policy stability in the Eurozone is essential for Switzerland and, thus, for the Swiss Franc (CHF). With such dependency, some models suggest that the correlation between the fortunes of the Euro (EUR) and the CHF is more than 90%, or close to perfect.
-
05:15
USD/CAD Price Forecast: Seems poised to surpass 61.8% Fibo. hurdle near mid-1.4500s
- USD/CAD enters a bullish consolidation phase near one-month high set on Monday.
- Bearish Oil prices undermine the Loonie amid worries about a US-Canada trade war.
- A modest USD uptick lends additional support to the major and favors bullish traders.
The USD/CAD pair holds steady around the 1.4500 psychological mark during the Asian session on Tuesday and remains close to a one-month top touched the previous day. The US Dollar (USD) ticks higher amid worries that US President Donald Trump's tariffs could reignite inflation and force the Federal Reserve (Fed) to keep interest rates higher for longer. Moreover, bearish Crude Oil prices undermine the commodity-linked Loonie amid concerns about the US-Canada trade war and act as a tailwind for the currency pair.
From a technical perspective, the overnight goodish bounce from the vicinity of the 50-day Simple Moving Average (SMA) and a subsequent move beyond the 50% Fibonacci retracement level of the downfall from a multi-year peak touched in February favor bullish traders. Moreover, oscillators on the daily chart are holding comfortably in positive territory and are still away from being in the overbought zone. This suggests that the path of least resistance for the USD/CAD pair remains to the upside and supports prospects for further gains.
Hence, some follow-through strength back towards retesting the 1.4545 area, or the one-month peak, which coincides with the 61.8% Fibo. level, looks like a distinct possibility. Some follow-through buying would set the stage for an extension of a nearly two-week-old uptrend and allow the USD/CAD pair to reclaim the 1.4600 round figure. The momentum could extend further towards the 1.4665-1.4670 intermediate hurdle en route to the 1.4700 neighborhood, or the highest level since April 2003 touched on February 3.
On the flip side, weakness below the 50% Fibo. level, around the 1.4470 area, might continue to attract some dip-buyers near the 1.4400 mark or 38.2% Fibo. level. This should help limit the downside near the 1.4360-1.4350 region or the 50-day SMA. That said, some follow-through selling could shift the bias in favor of bearish traders and drag the USD/CAD pair to the 1.4300 mark (23.6% Fibo. level) en route to the next relevant support near the 1.4240-1.4235 zone. Spot prices could slide further towards the 1.4200 mark before eventually dropping to the mid-1.4100s, or the year-to-date low touched last month.
USD/CAD daily chart
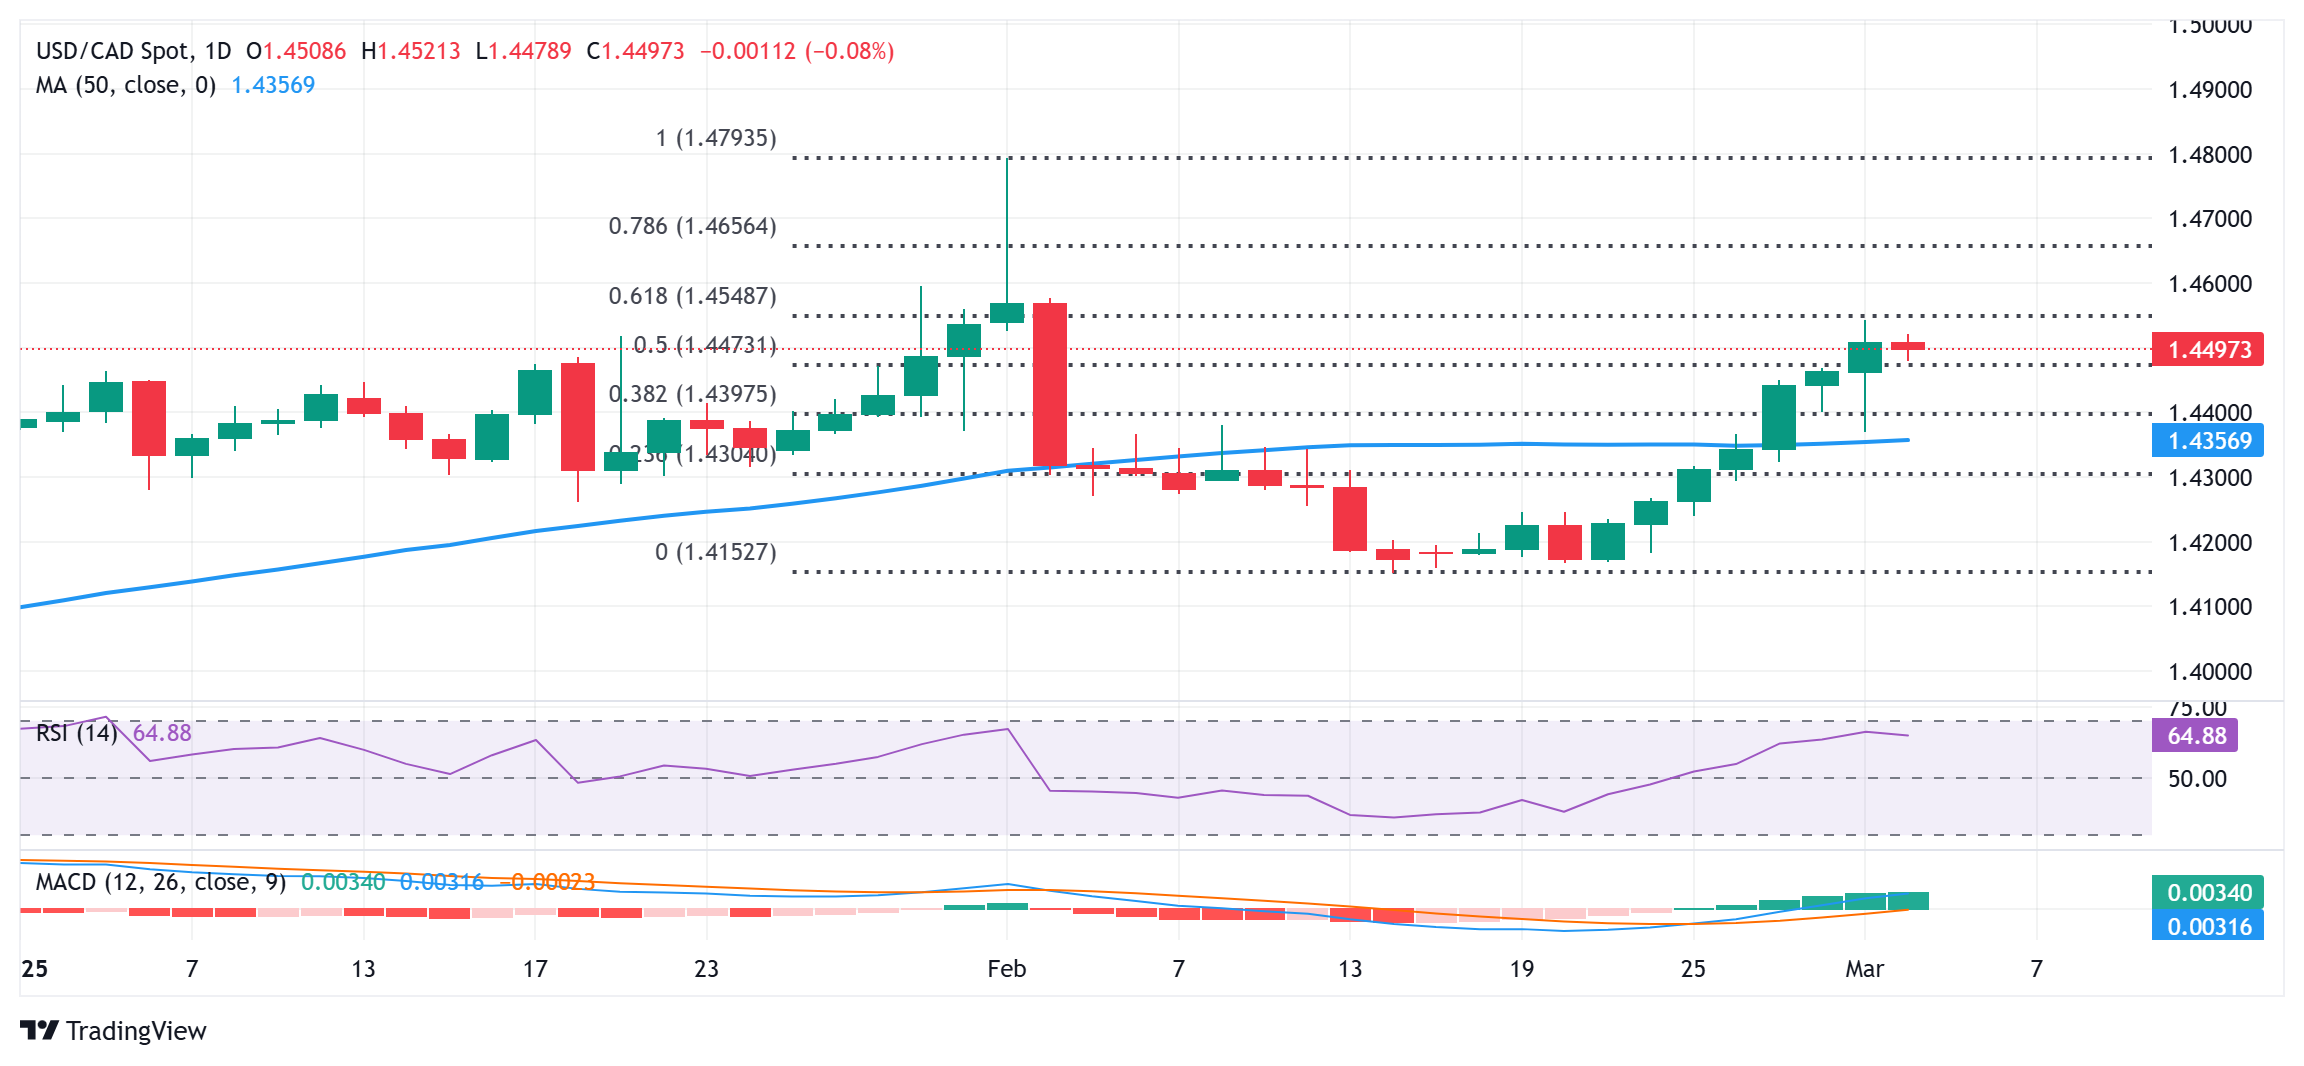
Canadian Dollar FAQs
The key factors driving the Canadian Dollar (CAD) are the level of interest rates set by the Bank of Canada (BoC), the price of Oil, Canada’s largest export, the health of its economy, inflation and the Trade Balance, which is the difference between the value of Canada’s exports versus its imports. Other factors include market sentiment – whether investors are taking on more risky assets (risk-on) or seeking safe-havens (risk-off) – with risk-on being CAD-positive. As its largest trading partner, the health of the US economy is also a key factor influencing the Canadian Dollar.
The Bank of Canada (BoC) has a significant influence on the Canadian Dollar by setting the level of interest rates that banks can lend to one another. This influences the level of interest rates for everyone. The main goal of the BoC is to maintain inflation at 1-3% by adjusting interest rates up or down. Relatively higher interest rates tend to be positive for the CAD. The Bank of Canada can also use quantitative easing and tightening to influence credit conditions, with the former CAD-negative and the latter CAD-positive.
The price of Oil is a key factor impacting the value of the Canadian Dollar. Petroleum is Canada’s biggest export, so Oil price tends to have an immediate impact on the CAD value. Generally, if Oil price rises CAD also goes up, as aggregate demand for the currency increases. The opposite is the case if the price of Oil falls. Higher Oil prices also tend to result in a greater likelihood of a positive Trade Balance, which is also supportive of the CAD.
While inflation had always traditionally been thought of as a negative factor for a currency since it lowers the value of money, the opposite has actually been the case in modern times with the relaxation of cross-border capital controls. Higher inflation tends to lead central banks to put up interest rates which attracts more capital inflows from global investors seeking a lucrative place to keep their money. This increases demand for the local currency, which in Canada’s case is the Canadian Dollar.
Macroeconomic data releases gauge the health of the economy and can have an impact on the Canadian Dollar. Indicators such as GDP, Manufacturing and Services PMIs, employment, and consumer sentiment surveys can all influence the direction of the CAD. A strong economy is good for the Canadian Dollar. Not only does it attract more foreign investment but it may encourage the Bank of Canada to put up interest rates, leading to a stronger currency. If economic data is weak, however, the CAD is likely to fall.
-
05:02
EUR/JPY tumbles below 156.50 amid safe-haven demand
- EUR/JPY loses traction to around 156.25 in Thursday’s Asian session, down 0.24% on the day.
- Trump’s tariff threat boosts the safe-haven flows, supporting the Japanese Yen.
- The Eurozone inflation eases, triggering the ECB rate cut bets.
The EUR/JPY cross falls to near 156.25 during the Europeam session on Tuesday. The Japanese Yen (JYP) edges higher due to the risk-off mood and fresh fear of trade tension from US President Donald Trump. Investors will keep an eye on the Fedspeak later on Tuesday.
Demand for safe-haven assets surges amid growing concerns over tariff risks. Japan's Finance Minister Katsunobu Kato said early Tuesday that the country is not pursuing a policy of devaluing the Japanese Yen. Additionally, concerns about the potential economic slowdown in the US increased expectations of further interest rate cuts by the Federal Reserve (Fed). This, in turn, could weigh on the Greenback and benefit the JPY's relative safe-haven status.
The rising speculation that the Bank of Japan (BoJ) will raise the interest rate sooner than later might continue to underpin the JPY. The BoJ is widely anticipated to continue hiking this year, supported by improving economic conditions, rising prices, and stronger wage growth, which align with the Japanese central bank’s policy normalization efforts.
On the Euro’s front, the European Central Bank (ECB) is expected to cut its Deposit Facility Rate by 25 basis points (bps) to 2.5%, weighing in the Euro (EUR). Consumer price inflation in the Eurozone slowed to 2.4% in February from the previous reading of 2.5% and moving a step closer to the ECB's 2% target.ECB FAQs
The European Central Bank (ECB) in Frankfurt, Germany, is the reserve bank for the Eurozone. The ECB sets interest rates and manages monetary policy for the region. The ECB primary mandate is to maintain price stability, which means keeping inflation at around 2%. Its primary tool for achieving this is by raising or lowering interest rates. Relatively high interest rates will usually result in a stronger Euro and vice versa. The ECB Governing Council makes monetary policy decisions at meetings held eight times a year. Decisions are made by heads of the Eurozone national banks and six permanent members, including the President of the ECB, Christine Lagarde.
In extreme situations, the European Central Bank can enact a policy tool called Quantitative Easing. QE is the process by which the ECB prints Euros and uses them to buy assets – usually government or corporate bonds – from banks and other financial institutions. QE usually results in a weaker Euro. QE is a last resort when simply lowering interest rates is unlikely to achieve the objective of price stability. The ECB used it during the Great Financial Crisis in 2009-11, in 2015 when inflation remained stubbornly low, as well as during the covid pandemic.
Quantitative tightening (QT) is the reverse of QE. It is undertaken after QE when an economic recovery is underway and inflation starts rising. Whilst in QE the European Central Bank (ECB) purchases government and corporate bonds from financial institutions to provide them with liquidity, in QT the ECB stops buying more bonds, and stops reinvesting the principal maturing on the bonds it already holds. It is usually positive (or bullish) for the Euro.
-
05:00
Japan Consumer Confidence Index registered at 35, below expectations (35.7) in February
-
04:51
China’s NPC: Willing to solve concerns with the US through consultation and dialogue
A spokesperson of China’s National People's Congress (NPC) commented on the additional 10% tariffs imposed by the United States (US) on Chinese imports on Tuesday.
Key quotes
China, US both committed to making lives of their people better.
Trade between both is mutually beneficial in nature.
Trade between countries should follow World Trade Organization (WTO) rules.
Trade disputes should be solved within WTO framework.
Hope that the US, China will move in same direction through equal consulation.
Hope both can find solution on equal footing,
China ready to work more closely with other countries to safeguard the hard-earned multilateral trading system.
Willing to solve concerns with the US through consultation and dialogue but will not accept threats and oppression.
We will firmly defend our sovereignty, security, development interests.
Hope we will go back to right track of solving problems.
Natural for there to be some disagreements, but important that respect each other's core interest and major concerns.
Australian Dollar FAQs
One of the most significant factors for the Australian Dollar (AUD) is the level of interest rates set by the Reserve Bank of Australia (RBA). Because Australia is a resource-rich country another key driver is the price of its biggest export, Iron Ore. The health of the Chinese economy, its largest trading partner, is a factor, as well as inflation in Australia, its growth rate and Trade Balance. Market sentiment – whether investors are taking on more risky assets (risk-on) or seeking safe-havens (risk-off) – is also a factor, with risk-on positive for AUD.
The Reserve Bank of Australia (RBA) influences the Australian Dollar (AUD) by setting the level of interest rates that Australian banks can lend to each other. This influences the level of interest rates in the economy as a whole. The main goal of the RBA is to maintain a stable inflation rate of 2-3% by adjusting interest rates up or down. Relatively high interest rates compared to other major central banks support the AUD, and the opposite for relatively low. The RBA can also use quantitative easing and tightening to influence credit conditions, with the former AUD-negative and the latter AUD-positive.
China is Australia’s largest trading partner so the health of the Chinese economy is a major influence on the value of the Australian Dollar (AUD). When the Chinese economy is doing well it purchases more raw materials, goods and services from Australia, lifting demand for the AUD, and pushing up its value. The opposite is the case when the Chinese economy is not growing as fast as expected. Positive or negative surprises in Chinese growth data, therefore, often have a direct impact on the Australian Dollar and its pairs.
Iron Ore is Australia’s largest export, accounting for $118 billion a year according to data from 2021, with China as its primary destination. The price of Iron Ore, therefore, can be a driver of the Australian Dollar. Generally, if the price of Iron Ore rises, AUD also goes up, as aggregate demand for the currency increases. The opposite is the case if the price of Iron Ore falls. Higher Iron Ore prices also tend to result in a greater likelihood of a positive Trade Balance for Australia, which is also positive of the AUD.
The Trade Balance, which is the difference between what a country earns from its exports versus what it pays for its imports, is another factor that can influence the value of the Australian Dollar. If Australia produces highly sought after exports, then its currency will gain in value purely from the surplus demand created from foreign buyers seeking to purchase its exports versus what it spends to purchase imports. Therefore, a positive net Trade Balance strengthens the AUD, with the opposite effect if the Trade Balance is negative.
-
04:38
Gold price trades with negative bias below $2,900 amid some USD dip-buying
- Gold price drifts lower on Tuesday amid bets that the Fed could keep rates higher for longer.
- The emergence of some USD buying contributes to driving flows away from the XAU/USD pair.
- Tariffs jitters and global trade war fears could lend support to the safe-haven precious metal.
Gold price (XAU/USD) struggles to capitalize on the previous day's positive move closer to the $2,900 mark and attracts some sellers during the Asian session on Tuesday, stalling its recovery from a three-week trough touched last Friday. Expectations that US President Donald Trump's trade tariffs would reignite inflation and force the Federal Reserve (Fed) to keep rates higher for longer undermine the non-yielding yellow metal. Apart from this, the emergence of some US Dollar (USD) buying turns out to be another factor weighing on the bullion.
Meanwhile, worries about the potential economic fallout from Trump's protectionist policies, which might trigger a global trade war, temper investors' appetite for riskier assets. This is evident from a generally weaker tone around the equity markets and could offer some support to the safe-haven Gold price. Apart from this, geopolitical risks might contribute to limiting any further losses for the bullion. Traders might also refrain from placing aggressive bets and opt to wait for the release of the US Nonfarm Payrolls (NFP) report on Friday.
Daily Digest Market Movers: Gold price struggles to lure buyers despite supporting factors
- Investors remain worried that US President Donald Trump's trade tariffs would increase price pressures and allow the Federal Reserve to stick to its hawkish stance, prompting some selling around the Gold price on Tuesday.
- Trump's tariffs on Mexico and Canada are taking effect this Tuesday, along with a new 10% levy on Chinese goods. Trump also said that reciprocal tariffs would take effect on April 2 on countries that impose duties on US products.
- The Canadian prime minister's office confirmed that Canada will impose retaliatory tariffs on US imports. China’s Commerce Ministry vowed to take necessary countermeasures to safeguard legitimate rights and interests.
- This raises the risk of a global trade war and weighs on investors' sentiment, which should act as a tailwind for the safe-haven precious metal and help limit any deeper losses amid a bearish tone surrounding the US Dollar.
- The Institute for Supply Management's (ISM) Manufacturing PMI slipped to 50.3 in February from 50.9 in the previous month, while the Prices Paid Index jumped to a nearly three-year high amid worries about duties on imports.
- This comes on top of worries that Trump's trade tariffs would undermine consumer spending and fuel concerns about the outlook for the world’s largest economy. This could further lend support to the XAU/USD pair.
- Ukrainian President Volodymyr Zelenskiy's meeting with Trump ended in disaster on Friday. Furthermore, a White House official confirmed that the US has paused military aid to Ukraine, adding to the uncertainty in markets.
- The market focus will remain glued to the release of the US monthly employment details – popularly known as the Nonfarm Payrolls (NFP) report on Friday. The crucial data would influence the USD and the yellow metal.
Gold price needs to find acceptance above the $2,900 mark for bulls to regain control
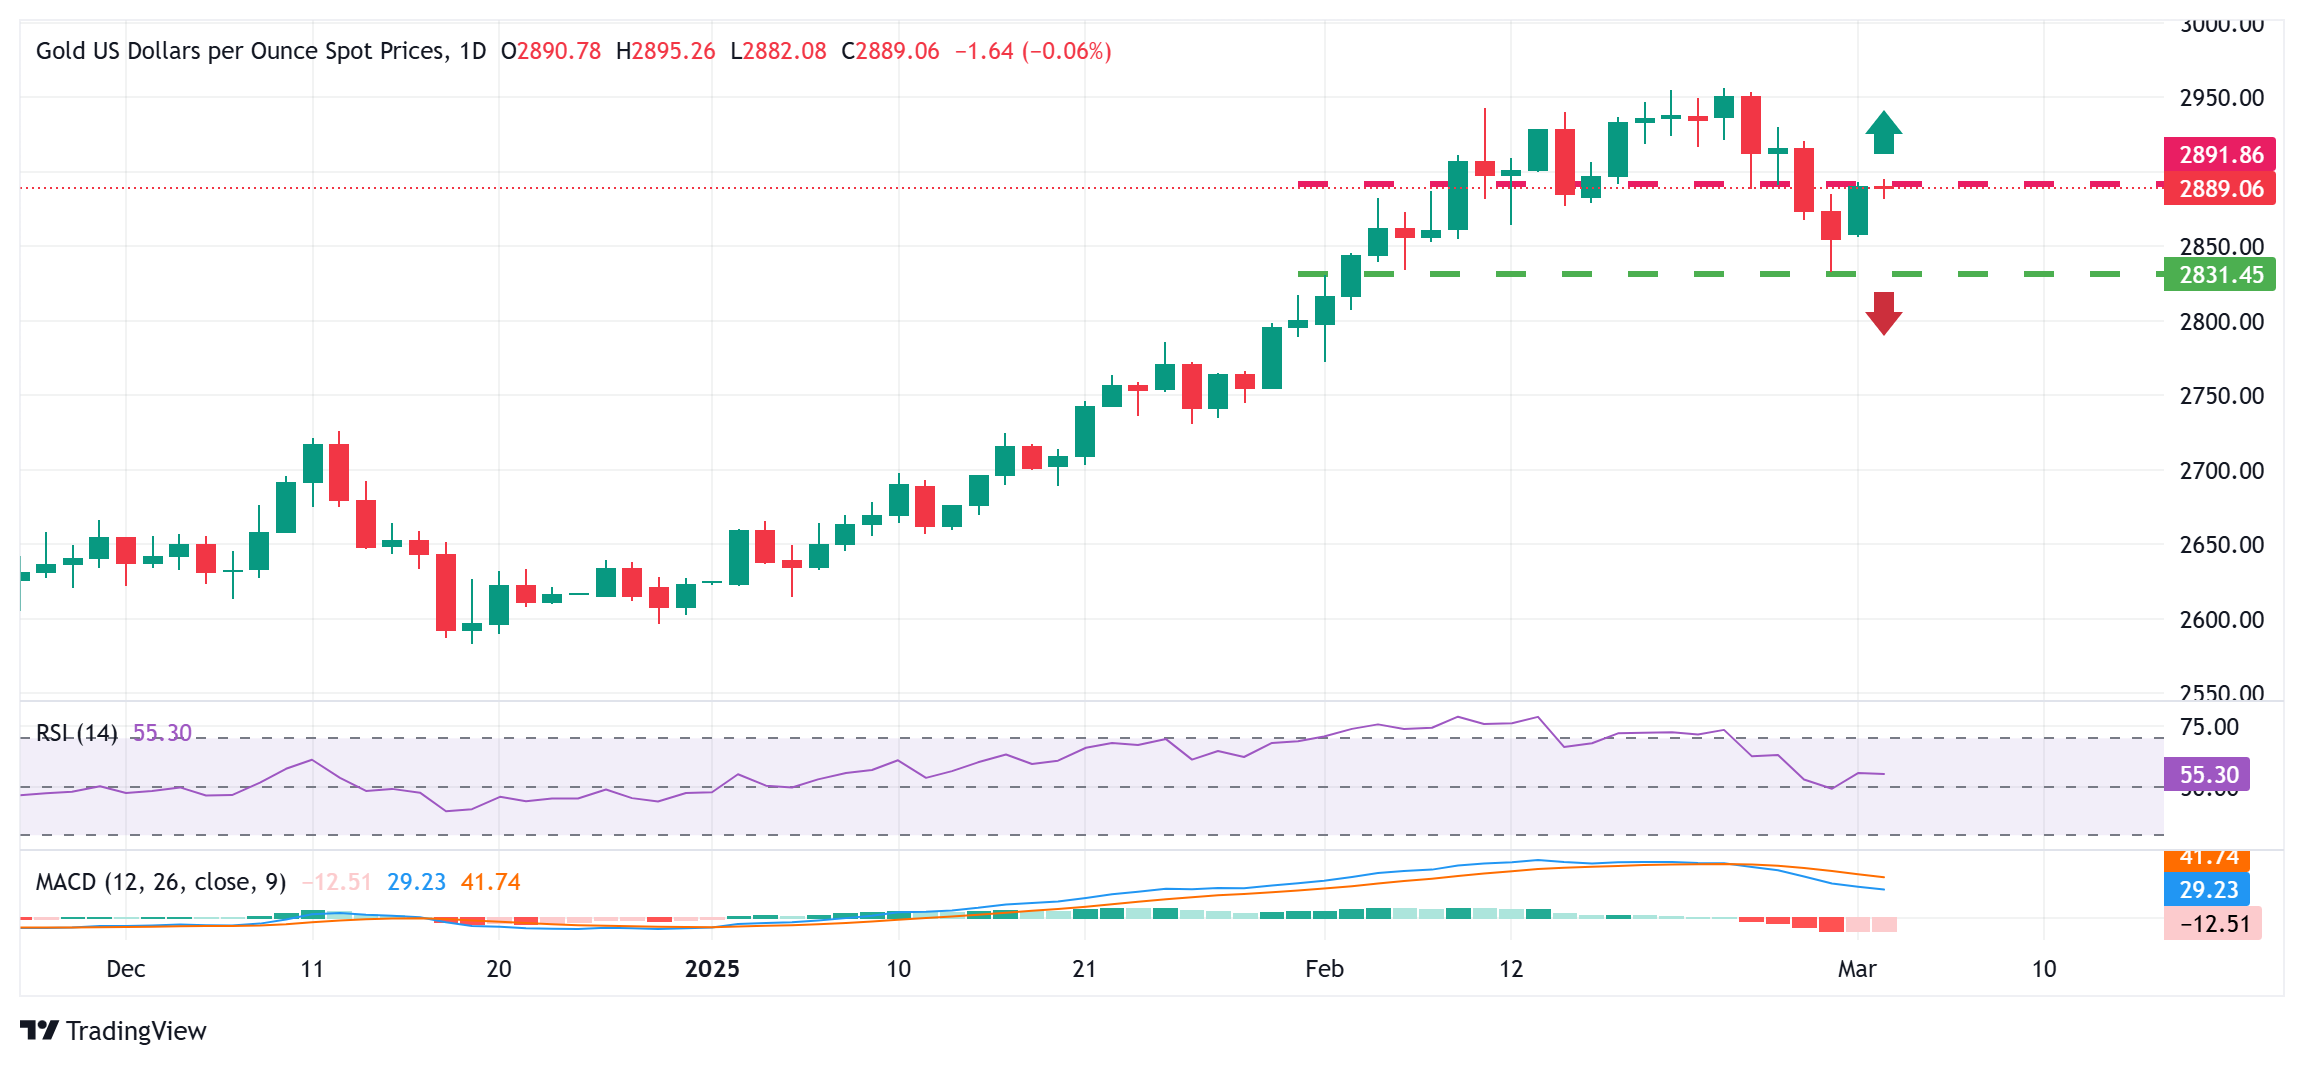
From a technical perspective, failure ahead of the $2,900 mark warrants some caution for bullish traders. That said, oscillators on the daily chart – though they have been losing traction – are holding in positive territory and support prospects for the emergence of some dip-buyers near the $2,860 immediate support. This is followed by the multi-week low, around the $2,833-2,832 region touched last Friday, below which the Gold price could accelerate the fall further towards the $2,800 round figure.
On the flip side, bulls might wait for sustained strength and acceptance back above the $2,900 mark before placing fresh bets. The subsequent move up could lift the Gold price to the $2,934 intermediate hurdle en route to the record high, around the $2,956 region touched last Monday.
Gold FAQs
Gold has played a key role in human’s history as it has been widely used as a store of value and medium of exchange. Currently, apart from its shine and usage for jewelry, the precious metal is widely seen as a safe-haven asset, meaning that it is considered a good investment during turbulent times. Gold is also widely seen as a hedge against inflation and against depreciating currencies as it doesn’t rely on any specific issuer or government.
Central banks are the biggest Gold holders. In their aim to support their currencies in turbulent times, central banks tend to diversify their reserves and buy Gold to improve the perceived strength of the economy and the currency. High Gold reserves can be a source of trust for a country’s solvency. Central banks added 1,136 tonnes of Gold worth around $70 billion to their reserves in 2022, according to data from the World Gold Council. This is the highest yearly purchase since records began. Central banks from emerging economies such as China, India and Turkey are quickly increasing their Gold reserves.
Gold has an inverse correlation with the US Dollar and US Treasuries, which are both major reserve and safe-haven assets. When the Dollar depreciates, Gold tends to rise, enabling investors and central banks to diversify their assets in turbulent times. Gold is also inversely correlated with risk assets. A rally in the stock market tends to weaken Gold price, while sell-offs in riskier markets tend to favor the precious metal.
The price can move due to a wide range of factors. Geopolitical instability or fears of a deep recession can quickly make Gold price escalate due to its safe-haven status. As a yield-less asset, Gold tends to rise with lower interest rates, while higher cost of money usually weighs down on the yellow metal. Still, most moves depend on how the US Dollar (USD) behaves as the asset is priced in dollars (XAU/USD). A strong Dollar tends to keep the price of Gold controlled, whereas a weaker Dollar is likely to push Gold prices up.
-
04:36
India Gold price today: Gold steadies, according to FXStreet data
Gold prices remained broadly unchanged in India on Tuesday, according to data compiled by FXStreet.
The price for Gold stood at 8,115.50 Indian Rupees (INR) per gram, broadly stable compared with the INR 8,120.98 it cost on Monday.
The price for Gold was broadly steady at INR 94,656.60 per tola from INR 94,721.48 per tola a day earlier.
Unit measure Gold Price in INR 1 Gram 8,115.50 10 Grams 81,154.15 Tola 94,656.60 Troy Ounce 252,417.80 Daily digest market movers: Gold price surges amid pessimistic US economic outlook
-
US real yields, as measured by the yield in the US 10-year Treasury Inflation-Protected Securities (TIPS), tumble almost three bps to 1.808%.
-
The US ISM Manufacturing PMI for February held steady at 50.3, slightly down from 50.9 and below the 50.5 forecast, indicating a mild slowdown in business activity.
-
S&P Global Manufacturing PMI showed improvement, rising to 52.7 from 51.2, surpassing expectations of 51.6, signaling continued expansion in the sector.
-
Money markets had priced in that the Federal Reserve (Fed) would ease policy by 71 basis points (bps), up from 58 bps last week, revealed data from Prime Market Terminal.
FXStreet calculates Gold prices in India by adapting international prices (USD/INR) to the local currency and measurement units. Prices are updated daily based on the market rates taken at the time of publication. Prices are just for reference and local rates could diverge slightly.
Gold FAQs
Gold has played a key role in human’s history as it has been widely used as a store of value and medium of exchange. Currently, apart from its shine and usage for jewelry, the precious metal is widely seen as a safe-haven asset, meaning that it is considered a good investment during turbulent times. Gold is also widely seen as a hedge against inflation and against depreciating currencies as it doesn’t rely on any specific issuer or government.
Central banks are the biggest Gold holders. In their aim to support their currencies in turbulent times, central banks tend to diversify their reserves and buy Gold to improve the perceived strength of the economy and the currency. High Gold reserves can be a source of trust for a country’s solvency. Central banks added 1,136 tonnes of Gold worth around $70 billion to their reserves in 2022, according to data from the World Gold Council. This is the highest yearly purchase since records began. Central banks from emerging economies such as China, India and Turkey are quickly increasing their Gold reserves.
Gold has an inverse correlation with the US Dollar and US Treasuries, which are both major reserve and safe-haven assets. When the Dollar depreciates, Gold tends to rise, enabling investors and central banks to diversify their assets in turbulent times. Gold is also inversely correlated with risk assets. A rally in the stock market tends to weaken Gold price, while sell-offs in riskier markets tend to favor the precious metal.
The price can move due to a wide range of factors. Geopolitical instability or fears of a deep recession can quickly make Gold price escalate due to its safe-haven status. As a yield-less asset, Gold tends to rise with lower interest rates, while higher cost of money usually weighs down on the yellow metal. Still, most moves depend on how the US Dollar (USD) behaves as the asset is priced in dollars (XAU/USD). A strong Dollar tends to keep the price of Gold controlled, whereas a weaker Dollar is likely to push Gold prices up.
(An automation tool was used in creating this post.)
-
-
04:08
GBP/USD Price Forecast: Hovers below 1.2700 barrier near three-month highs
- GBP/USD could target the immediate barier at the three-month high of 1.2724.
- The 14-day RSI stays above 50, signaling sustained bullish momentum.
- The primary support appears at the nine-day EMA of 1.2639.
The GBP/USD pair edges lower after registering gains in the previous session, hovering around 1.2680 during Tuesday’s Asian hours. Technical analysis of the daily chart suggests a continued bullish bias, with the pair maintaining its position within an ascending channel pattern.
The 14-day Relative Strength Index (RSI) remains above 50, indicating strengthened bullish momentum. Moreover, the GBP/USD pair continues to trade above the nine- and 14-day Exponential Moving Averages (EMAs), reinforcing strong short-term price dynamics and confirming the ongoing upward trend.
The GBP/USD pair may challenge immediate resistance at the three-month high of 1.2724, reached on March 3, followed by the ascending channel’s upper boundary near 1.2780. A decisive breakout above this level could reinforce the bullish outlook, potentially driving the pair toward the psychological resistance at 1.2800.
On the downside, the GBP/USD pair is likely to find initial support at the nine-day EMA of 1.2639, followed by the 14-day EMA at 1.2613. A break below these levels could weaken short-term price momentum, potentially driving the pair toward the ascending channel’s lower boundary near 1.2560.
A decisive break below the channel could weaken the bullish bias, potentially exposing the pair to the three-month low of 1.2249, last seen on February 3.
GBP/USD: Daily Chart
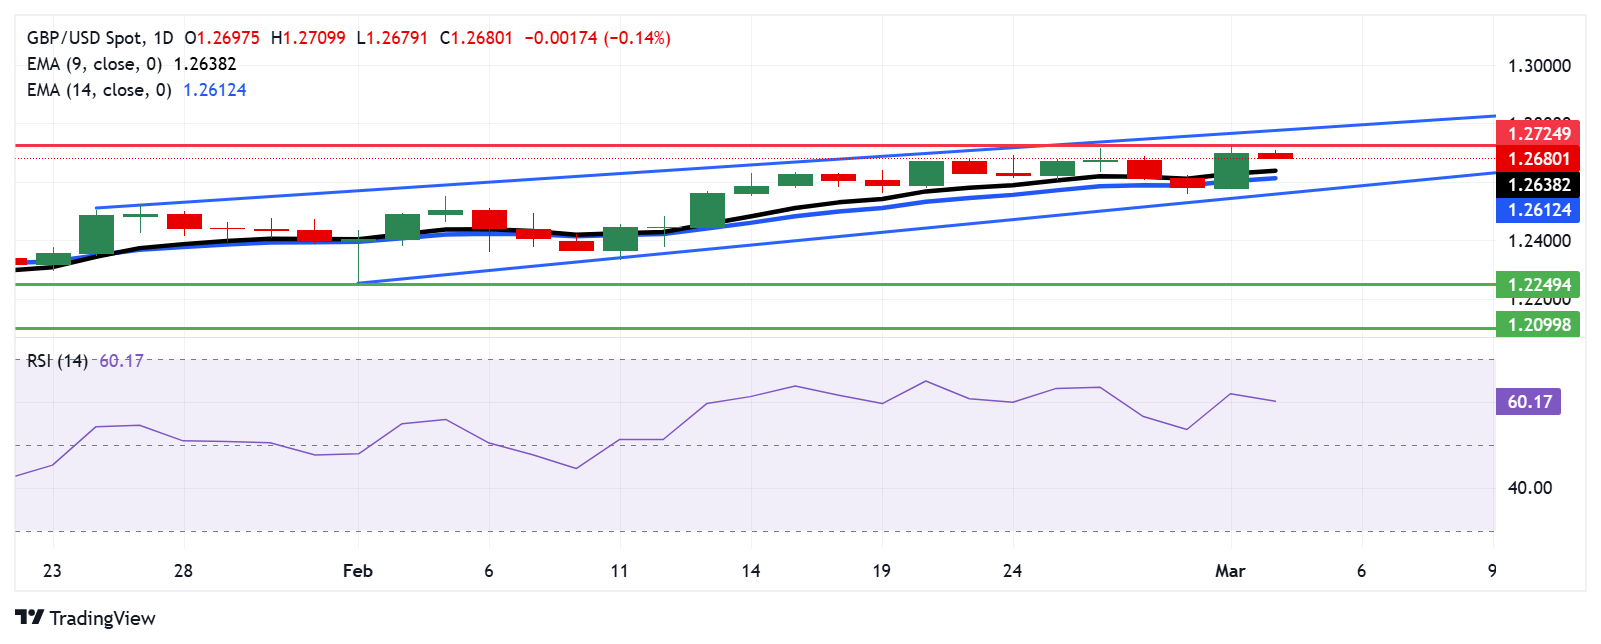
British Pound PRICE Today
The table below shows the percentage change of British Pound (GBP) against listed major currencies today. British Pound was the weakest against the Japanese Yen.
USD EUR GBP JPY CAD AUD NZD CHF USD 0.09% 0.13% -0.25% -0.00% 0.39% 0.26% 0.02% EUR -0.09% 0.04% -0.33% -0.09% 0.30% 0.17% -0.08% GBP -0.13% -0.04% -0.38% -0.14% 0.26% 0.13% -0.11% JPY 0.25% 0.33% 0.38% 0.24% 0.64% 0.50% 0.27% CAD 0.00% 0.09% 0.14% -0.24% 0.39% 0.27% 0.02% AUD -0.39% -0.30% -0.26% -0.64% -0.39% -0.13% -0.37% NZD -0.26% -0.17% -0.13% -0.50% -0.27% 0.13% -0.24% CHF -0.02% 0.08% 0.11% -0.27% -0.02% 0.37% 0.24% The heat map shows percentage changes of major currencies against each other. The base currency is picked from the left column, while the quote currency is picked from the top row. For example, if you pick the British Pound from the left column and move along the horizontal line to the US Dollar, the percentage change displayed in the box will represent GBP (base)/USD (quote).
-
03:45
PM Ishiba: Japan is not pursuing so-called currency devaluation policy
Japanese Prime Minister (PM) Shigeru Ishiba said on Tuesday that “Japan is not pursuing so-called currency devaluation policy.”
Ishiba further noted that they “have had no phone call from US President Trump regarding forex policy.”
Market reaction
The Japanese Yen (JPY) is recovering some ground against the US Dollar (USD) following these comments. At the press time, USD/JPY is down 0.25% on the day at 149.11.
-
03:31
Silver Price Forecast: XAG/USD maintains position above $31.50 due to risk-off mood
- Silver price finds support from safe-haven demand as concerns over a global tariff war escalate.
- The White House confirmed that President Trump has signed an order raising tariffs on Chinese imports to 20%.
- Canada’s Prime Minister’s Office announced plans to impose retaliatory 25% tariffs on US imports if Washington's tariffs take effect.
Silver price (XAG/USD) extends its gains for the second consecutive session, trading near $31.70 per troy ounce during Asian hours on Tuesday. Silver gains traction as investors seek safe-haven assets amid rising risk aversion, while market participants assess the economic outlook as US President Donald Trump advances plans to impose tariffs on key trade partners.
On Monday, the White House confirmed that President Trump signed an order raising tariffs on Chinese imports to 20%. However, similar measures for Mexico and Canada remain pending. Trump also reiterated that reciprocal tariffs will take effect on April 2 for countries that impose duties on US goods.
In response, Canada’s Prime Minister's Office announced that retaliatory tariffs on US imports would be imposed starting Tuesday, provided US tariffs go into effect. Initially, Canada will implement a 25% tariff on US imports worth C$30 billion.
Meanwhile, China’s Commerce Ministry stated early Tuesday that it would take "necessary countermeasures" to defend its economic interests. The ministry reaffirmed its strong opposition to the US decision to introduce an additional 10% tariff on Chinese imports starting Tuesday.
Recent US factory data provided mixed signals. The ISM Manufacturing PMI fell to 50.3, slightly below expectations of 50.5 and down from January’s 50.9. Conversely, S&P Global’s final Manufacturing PMI for February exceeded forecasts at 52.7, improving from its preliminary estimate.
Investors now turn their attention to the ADP employment report on Wednesday and the Nonfarm Payrolls report on Friday for further insights into the Federal Reserve’s (Fed) interest rate outlook.
Silver FAQs
Silver is a precious metal highly traded among investors. It has been historically used as a store of value and a medium of exchange. Although less popular than Gold, traders may turn to Silver to diversify their investment portfolio, for its intrinsic value or as a potential hedge during high-inflation periods. Investors can buy physical Silver, in coins or in bars, or trade it through vehicles such as Exchange Traded Funds, which track its price on international markets.
Silver prices can move due to a wide range of factors. Geopolitical instability or fears of a deep recession can make Silver price escalate due to its safe-haven status, although to a lesser extent than Gold's. As a yieldless asset, Silver tends to rise with lower interest rates. Its moves also depend on how the US Dollar (USD) behaves as the asset is priced in dollars (XAG/USD). A strong Dollar tends to keep the price of Silver at bay, whereas a weaker Dollar is likely to propel prices up. Other factors such as investment demand, mining supply – Silver is much more abundant than Gold – and recycling rates can also affect prices.
Silver is widely used in industry, particularly in sectors such as electronics or solar energy, as it has one of the highest electric conductivity of all metals – more than Copper and Gold. A surge in demand can increase prices, while a decline tends to lower them. Dynamics in the US, Chinese and Indian economies can also contribute to price swings: for the US and particularly China, their big industrial sectors use Silver in various processes; in India, consumers’ demand for the precious metal for jewellery also plays a key role in setting prices.
Silver prices tend to follow Gold's moves. When Gold prices rise, Silver typically follows suit, as their status as safe-haven assets is similar. The Gold/Silver ratio, which shows the number of ounces of Silver needed to equal the value of one ounce of Gold, may help to determine the relative valuation between both metals. Some investors may consider a high ratio as an indicator that Silver is undervalued, or Gold is overvalued. On the contrary, a low ratio might suggest that Gold is undervalued relative to Silver.
-
02:42
USD/INR strengthens on Trump’s tariff plans
- The Indian Rupee weakens in Tuesday’s early Asian session.
- Ongoing equity outflows and US trade policy worries weigh on the INR.
- Investors await the Fedspeak later on Tuesday for a fresh impetus.
The Indian Rupee (INR) softens on Tuesday after reaching a three-week high in the previous session. Persistent capital outflows and renewed concerns about tariff threats from US President Donald Trump exert some selling pressure on the local currency.
On the other hand, the foreign exchange intervention from the Reserve Bank of India (RBI) could prevent the INR from significant depreciation. Additionally, the decline in crude oil prices on reports that OPEC+ will proceed with a planned oil output increase in April might help limit the Indian Rupee’s losses as India is the world's third-largest oil consumer.
The Federal Reserve’s (Fed) officials are scheduled to speak later on Tuesday, including Thomas Barkin and John Williams. On Wednesday, the Indian HSBC Composite Purchasing Managers' Index (PMI) and Services PMI will be in the spotlight.Indian Rupee remains weak due to Trump’s latest tariff threats
- India’s Manufacturing PMI eased to a 14-month low of 56.3 in February, data released by S&P Global on Monday showed. This figure came in lower than the previous reading and the estimation of 57.1.
- "Although output growth slowed to the weakest level since December 2023, overall momentum in India's manufacturing sector remained broadly positive in February," said Pranjul Bhandari, Chief India Economist at HSBC.
- The RBI's net short dollar position in forwards and futures hit a record high of $77.5 billion in January 2025, as per data released after market hours on Friday.
- China’s Commerce Ministry vowed to take “necessary countermeasures” to safeguard China’s legitimate rights and interests. The ministry reiterated its firm opposition to the US move to impose another 10% tariff on Chinese imports starting on Tuesday.
- The US Manufacturing PMI declined to 50.3 in February versus 50.9 prior, according to the Institute for Supply Management (ISM) on Monday. This figure came in below the market consensus of 50.5.
USD/INR holds a bullish undertone
The Indian Rupee trades softer on the day. The USD/INR pair maintains a constructive outlook as the price remains well-supported above the key 100-day Exponential Moving Average (EMA) on the daily chart. Furthermore, the 14-day Relative Strength Index (RSI) is located above the midline near 61.00, suggesting buyers are maintaining some control.
If bullish momentum holds, USD/INR might retest 87.53, the high of February 28. A sustained break above this area could pave the way for a move toward an all-time high near 88.00, en route to 88.50.
If more red candlesticks appear and selling momentum increases, the pair could see a drop to the 87.05-87.00 zone, representing the low of February 27 and the round mark. The next bearish target to watch is 86.48, the low of February 21, followed by 86.14, the low of January 27.Indian Rupee FAQs
The Indian Rupee (INR) is one of the most sensitive currencies to external factors. The price of Crude Oil (the country is highly dependent on imported Oil), the value of the US Dollar – most trade is conducted in USD – and the level of foreign investment, are all influential. Direct intervention by the Reserve Bank of India (RBI) in FX markets to keep the exchange rate stable, as well as the level of interest rates set by the RBI, are further major influencing factors on the Rupee.
The Reserve Bank of India (RBI) actively intervenes in forex markets to maintain a stable exchange rate, to help facilitate trade. In addition, the RBI tries to maintain the inflation rate at its 4% target by adjusting interest rates. Higher interest rates usually strengthen the Rupee. This is due to the role of the ‘carry trade’ in which investors borrow in countries with lower interest rates so as to place their money in countries’ offering relatively higher interest rates and profit from the difference.
Macroeconomic factors that influence the value of the Rupee include inflation, interest rates, the economic growth rate (GDP), the balance of trade, and inflows from foreign investment. A higher growth rate can lead to more overseas investment, pushing up demand for the Rupee. A less negative balance of trade will eventually lead to a stronger Rupee. Higher interest rates, especially real rates (interest rates less inflation) are also positive for the Rupee. A risk-on environment can lead to greater inflows of Foreign Direct and Indirect Investment (FDI and FII), which also benefit the Rupee.
Higher inflation, particularly, if it is comparatively higher than India’s peers, is generally negative for the currency as it reflects devaluation through oversupply. Inflation also increases the cost of exports, leading to more Rupees being sold to purchase foreign imports, which is Rupee-negative. At the same time, higher inflation usually leads to the Reserve Bank of India (RBI) raising interest rates and this can be positive for the Rupee, due to increased demand from international investors. The opposite effect is true of lower inflation.
-
02:33
Japanese Yen strengthens further; USD/JPY seems vulnerable near 149.00
- The Japanese Yen climbs back closer to a multi-month high against the USD on Tuesday.
- BoJ rate hike bets and the risk-off mood provide a goodish boost to the safe-haven JPY.
- Expectations for more Fed rate cuts undermine the USD and further weigh on USD/JPY.
The Japanese Yen (JPY) attracts some follow-through buying for the second straight day on Tuesday and moves back closer to a multi-month peak touched against its American counterpart last week. The hawkish sentiment surrounding the Bank of Japan's (BoJ) policy outlook continues to underpin the JPY. Moreover, concerns about the potential economic fallout from US President Donald Trump's tariff policies temper investors' appetite for riskier assets and further benefit the safe-haven JPY.
Adding to this, Trump's threat to Japan over currency depreciation, along with subdued US Dollar (USD) price action, turn out to be other factors exerting some downward pressure on the USD/JPY pair. The JPY bulls, meanwhile, seem rather unaffected by weaker macro data from Japan, which showed an unexpected uptick in the Unemployment Rate and a fall in corporate capital expenditure for the first time in three years. This, in turn, suggests that the path of least resistance for the JPY remains to the upside.
Japanese Yen is underpinned by hawkish BoJ expectations and the global flight to safety
- Growing speculation that the Bank of Japan will hike interest rates sooner rather than later keeps the yield on the benchmark 10-year Japanese government bond close to its highest level since 2009 and continues to underpin the Japanese Yen.
- Ukrainian President Volodymyr Zelenskiy's meeting with US President Donald Trump ended in disaster on Friday. A White House official confirmed that the US has paused military aid to Ukraine, which adds to the uncertainty in markets.
- Trump’s tariffs on Mexican and Canadian goods will take effect this Tuesday, along with a new 10% levy on Chinese goods. China’s Commerce Ministry vowed to take necessary countermeasures to safeguard legitimate rights and interests.
- Trump said on Monday that he has warned the leaders of China and Japan against devaluing their currencies against the US Dollar, arguing that such actions put American industries at a disadvantage.
- Japan's Finance Minister, Katsunobu Kato, said on Tuesday that the country is not pursuing a policy of devaluing the domestic currency and Japan has confirmed its "basic stance on currency policy" with US Treasury Secretary Scott Bessent.
- Speaking at a separate news conference, Japan's Economy Minister Ryosei Akazawa said that the government intervenes in the currency market only when the movement is "speculative".
- Data released earlier this Tuesday showed that the Unemployment Rate in Japan unexpectedly edged up from 2.4% to 2.5% in January and Japanese companies reduced spending on plants and equipment in October-December by 0.2%.
- The Institute for Supply Management's (ISM) Manufacturing PMI slipped to 50.3 in February from 50.9 in the previous month, while the Prices Paid Index jumped to 62.4, or nearly a three-year high amid worries about duties on imports.
- Moreover, investors remain concerned that Trump's policies would increase price pressures and slow down activity in vital industrial sectors. This might force the Federal Reserve to cut rates further and weigh on the US Dollar.
USD/JPY seems vulnerable to slide further towards the next relevant support near 148.00
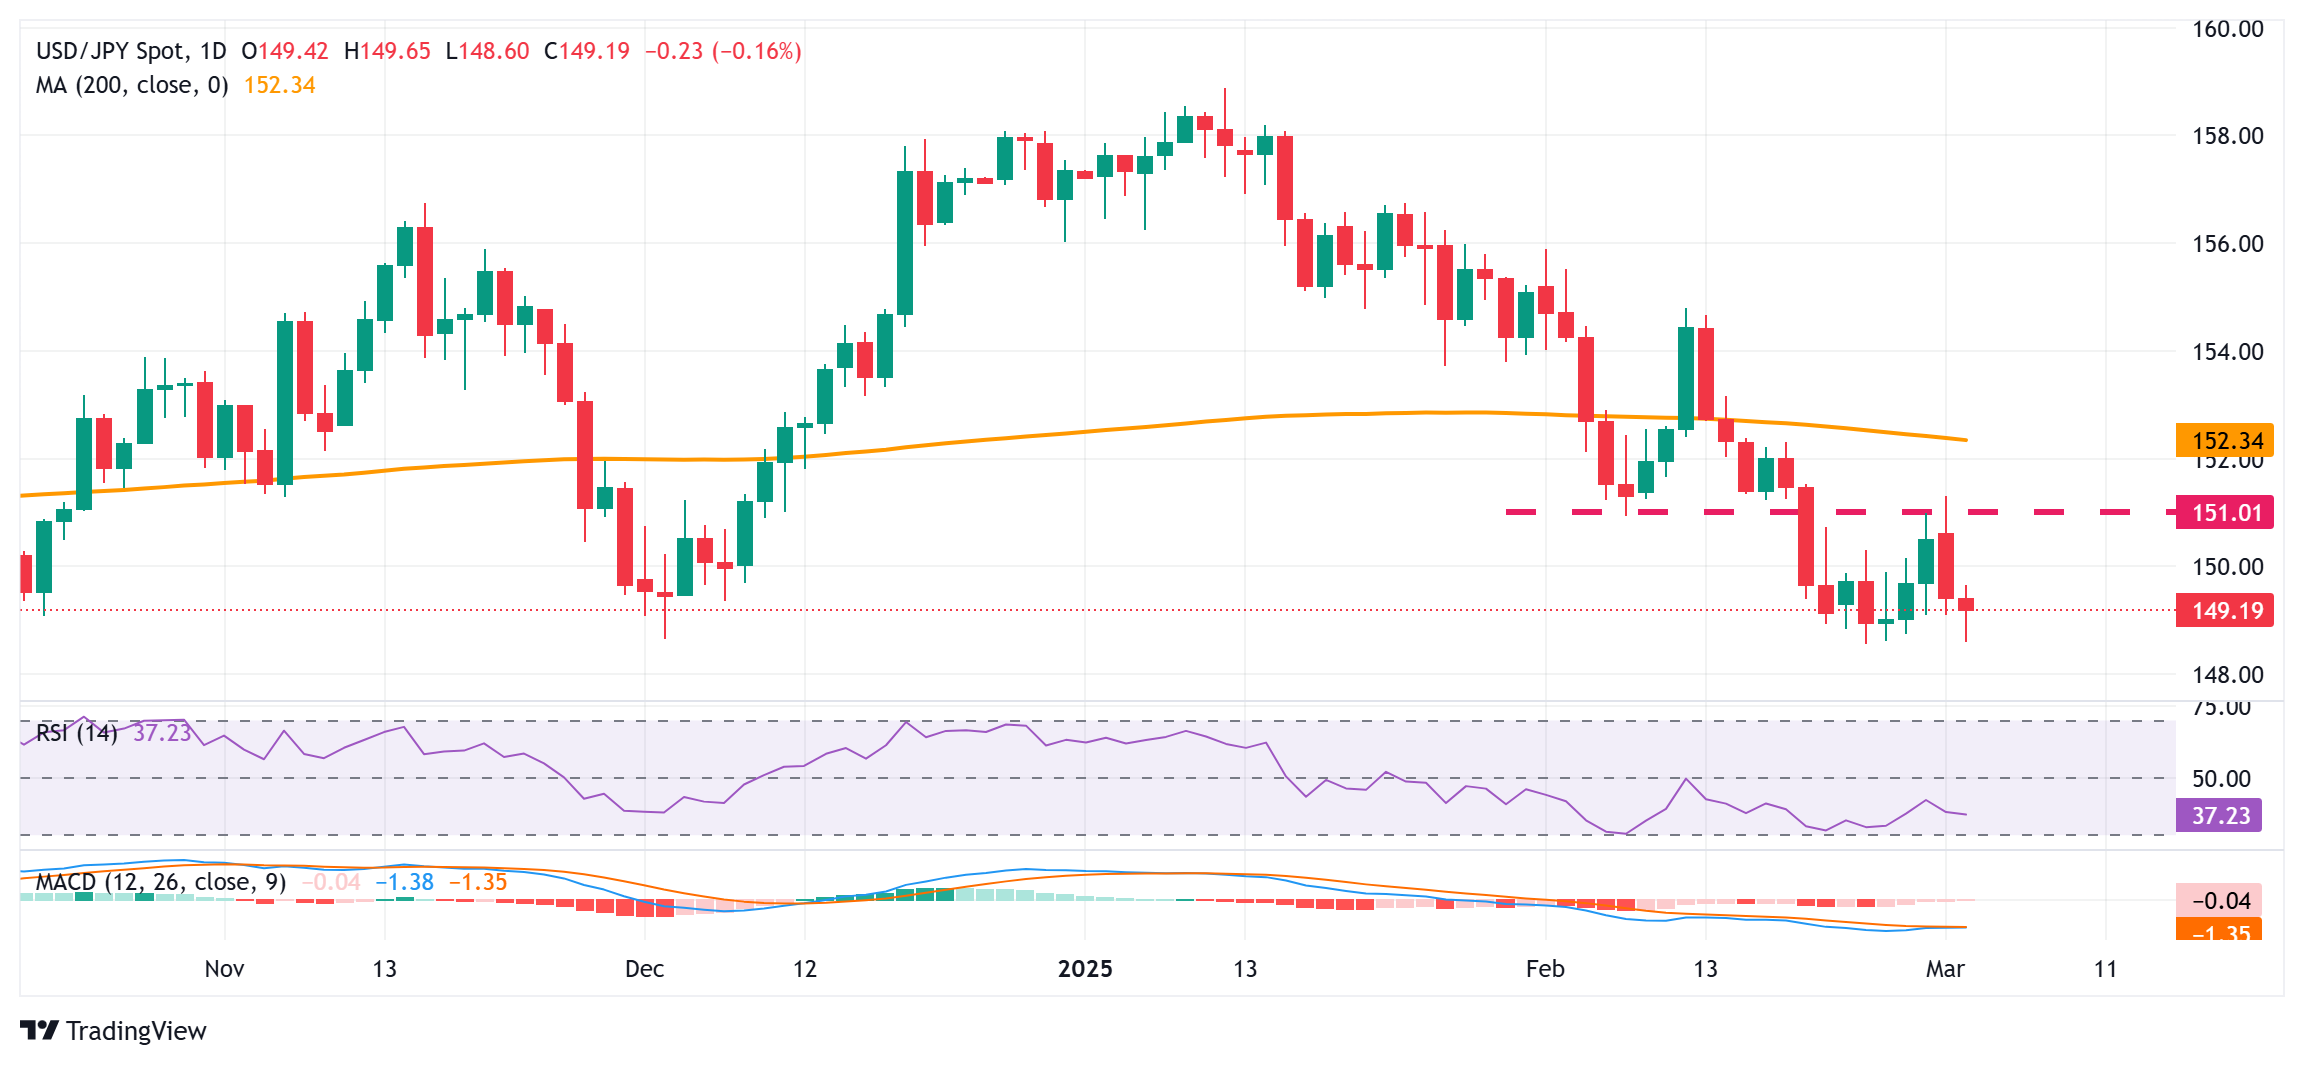
From a technical perspective, the overnight failure near the 151.00 support breakpoint, now turned resistance, validates the near-term bearish outlook for the USD/JPY pair. Moreover, oscillators on the daily chart are holding deep in negative territory and are still away from being in the oversold zone. This, in turn, supports prospects for an extension of the pair's recent well-established downtrend witnessed over the past two months or so. Hence, some follow-through weakness below mid-148.00s, towards the next relevant support near the 148.00 round figure, looks like a distinct possibility. The downward trajectory could extend further towards the 147.35-147.30 region en route to the 147.00 mark.
On the flip side, the 149.65-149.70 area now seems to act as an immediate hurdle ahead of the 150.00 psychological mark. Any further move up might still be seen as a selling opportunity near the 150.60 region, which, in turn, should cap the USD/JPY pair near the 150.90-151.00 key hurdle. The latter should act as a pivotal point, which if cleared decisively might prompt a short-covering rally towards the 151.40-151.45 intermediate hurdle en route to the 152.00 round figure and the 152.35 region, or the very important 200-day Simple Moving Average (SMA).
Japanese Yen FAQs
The Japanese Yen (JPY) is one of the world’s most traded currencies. Its value is broadly determined by the performance of the Japanese economy, but more specifically by the Bank of Japan’s policy, the differential between Japanese and US bond yields, or risk sentiment among traders, among other factors.
One of the Bank of Japan’s mandates is currency control, so its moves are key for the Yen. The BoJ has directly intervened in currency markets sometimes, generally to lower the value of the Yen, although it refrains from doing it often due to political concerns of its main trading partners. The BoJ ultra-loose monetary policy between 2013 and 2024 caused the Yen to depreciate against its main currency peers due to an increasing policy divergence between the Bank of Japan and other main central banks. More recently, the gradually unwinding of this ultra-loose policy has given some support to the Yen.
Over the last decade, the BoJ’s stance of sticking to ultra-loose monetary policy has led to a widening policy divergence with other central banks, particularly with the US Federal Reserve. This supported a widening of the differential between the 10-year US and Japanese bonds, which favored the US Dollar against the Japanese Yen. The BoJ decision in 2024 to gradually abandon the ultra-loose policy, coupled with interest-rate cuts in other major central banks, is narrowing this differential.
The Japanese Yen is often seen as a safe-haven investment. This means that in times of market stress, investors are more likely to put their money in the Japanese currency due to its supposed reliability and stability. Turbulent times are likely to strengthen the Yen’s value against other currencies seen as more risky to invest in.
-
02:30
Commodities. Daily history for Monday, March 3, 2025
Raw materials Closed Change, % Silver 31.671 1.52 Gold 2892.93 0.69 Palladium 937.67 1.27 -
02:14
Canada confirms 25% reciprocal tariffs on US imports from Tuesday if Trump tariffs kick in
A statement released by the Canadian prime minister's office confirmed that Canada will impose retaliatory tariffs on US imports from Tuesday if US tariffs go into effect.
Key takeaways
Canada will start with 25% tariffs on US imports worth C$30 billion from Tuesday.
Should US tariffs not cease, we are in active and ongoing discussions with provinces and territories to pursue several non-tariff measures.
Market reaction
USD/CAD is trading 0.09% higher on the day following these headlines, flirting with 1.4500 at the press time.
-
02:06
EUR/USD rises to near 1.0500 amid improved risk sentiment
- EUR/USD extends its gains as market sentiment improves on hopes for a potential Ukraine peace deal.
- European leaders have agreed to draft a structured peace plan to present to the US, boosting risk appetite.
- The US has paused all military aid to Ukraine under orders from President Trump.
EUR/USD continues its upward momentum for the second consecutive session, trading around 1.0490 during Asian hours on Tuesday. The Euro (EUR) is benefiting from improved market sentiment as hopes for a potential Ukraine peace deal reduce demand for safe-haven assets. European leaders, alongside Ukrainian President Volodymyr Zelenskyy and UK Prime Minister Keir Starmer, have agreed to draft a structured peace plan to be presented to the United States (US), bolstering risk appetite.
According to Bloomberg, citing a defense official on Monday, the United States has halted all ongoing military aid to Ukraine. The decision reportedly comes under orders from President Trump, with Defense Secretary Pete Hegseth directed to implement the pause. As a result, all US military equipment that has not yet reached Ukraine—including weapons in transit via aircraft and ships, as well as those waiting in transit zones in Poland—will be halted.
However, the Euro’s upside may be limited ahead of the European Central Bank (ECB) meeting on Thursday, where policymakers are widely expected to cut the Deposit Facility Rate by 25 basis points (bps) to 2.5%. If confirmed, this would mark the ECB’s fifth consecutive rate cut, potentially weighing on the EUR.
Meanwhile, mixed US economic data has added to market uncertainty. The ISM Manufacturing PMI fell slightly to 50.3, missing expectations of 50.5 and down from January’s 50.9. However, S&P Global’s final Manufacturing PMI for February beat forecasts at 52.7, an improvement from its preliminary reading, signaling resilience in the US manufacturing sector.
Euro FAQs
The Euro is the currency for the 19 European Union countries that belong to the Eurozone. It is the second most heavily traded currency in the world behind the US Dollar. In 2022, it accounted for 31% of all foreign exchange transactions, with an average daily turnover of over $2.2 trillion a day. EUR/USD is the most heavily traded currency pair in the world, accounting for an estimated 30% off all transactions, followed by EUR/JPY (4%), EUR/GBP (3%) and EUR/AUD (2%).
The European Central Bank (ECB) in Frankfurt, Germany, is the reserve bank for the Eurozone. The ECB sets interest rates and manages monetary policy. The ECB’s primary mandate is to maintain price stability, which means either controlling inflation or stimulating growth. Its primary tool is the raising or lowering of interest rates. Relatively high interest rates – or the expectation of higher rates – will usually benefit the Euro and vice versa. The ECB Governing Council makes monetary policy decisions at meetings held eight times a year. Decisions are made by heads of the Eurozone national banks and six permanent members, including the President of the ECB, Christine Lagarde.
Eurozone inflation data, measured by the Harmonized Index of Consumer Prices (HICP), is an important econometric for the Euro. If inflation rises more than expected, especially if above the ECB’s 2% target, it obliges the ECB to raise interest rates to bring it back under control. Relatively high interest rates compared to its counterparts will usually benefit the Euro, as it makes the region more attractive as a place for global investors to park their money.
Data releases gauge the health of the economy and can impact on the Euro. Indicators such as GDP, Manufacturing and Services PMIs, employment, and consumer sentiment surveys can all influence the direction of the single currency. A strong economy is good for the Euro. Not only does it attract more foreign investment but it may encourage the ECB to put up interest rates, which will directly strengthen the Euro. Otherwise, if economic data is weak, the Euro is likely to fall. Economic data for the four largest economies in the euro area (Germany, France, Italy and Spain) are especially significant, as they account for 75% of the Eurozone’s economy.
Another significant data release for the Euro is the Trade Balance. This indicator measures the difference between what a country earns from its exports and what it spends on imports over a given period. If a country produces highly sought after exports then its currency will gain in value purely from the extra demand created from foreign buyers seeking to purchase these goods. Therefore, a positive net Trade Balance strengthens a currency and vice versa for a negative balance.
-
01:32
NZD/USD softens to near 0.5600 on Trump tariff threat
- NZD/USD edges lower to near 0.5600 in Tuesday’s early Asian session.
- China is preparing countermeasures against fresh US import tariffs set to take effect on Tuesday.
- US ISM Manufacturing PMI came in weaker than the expectation, falling to 50.3 in February vs. 50.9 prior.
The NZD/USD pair remains on the defensive around 0.5610 during the early Asian session on Tuesday. The New Zealand Dollar (NZD) weakens against the US Dollar (USD) amid concerns about an escalating trade war between the United States (US) and China, the world's top two economies.
China's state-backed Global Times reported early Tuesday that China’s Commerce Ministry vowed to take “necessary countermeasures” to safeguard China’s legitimate rights and interests. The ministry reiterated its firm opposition to the US move to impose another 10% tariff on Chinese imports starting on Tuesday. The escalating trade tensions exert some selling pressure on the China-proxy Kiwi as China is a major trading partner to New Zealand.
On the USD’s front, soft US economic data for the manufacturing sectors released Monday could undermine the Greenback and cap the downside for the pair. The US ISM Manufacturing Purchasing Managers' Index (PMI) declined to 50.3 in February versus 50.9 prior. This figure came in below the market consensus of 50.5.
Later on Tuesday, traders will take more cues from the Fedspeak. The Federal Reserve’s (Fed) Thomas Barkin and John William are set to speak. The attention will shift to Australia’s Gross Domestic Product (GDP) for the fourth quarter (Q4), which will be released on Wednesday.New Zealand Dollar FAQs
The New Zealand Dollar (NZD), also known as the Kiwi, is a well-known traded currency among investors. Its value is broadly determined by the health of the New Zealand economy and the country’s central bank policy. Still, there are some unique particularities that also can make NZD move. The performance of the Chinese economy tends to move the Kiwi because China is New Zealand’s biggest trading partner. Bad news for the Chinese economy likely means less New Zealand exports to the country, hitting the economy and thus its currency. Another factor moving NZD is dairy prices as the dairy industry is New Zealand’s main export. High dairy prices boost export income, contributing positively to the economy and thus to the NZD.
The Reserve Bank of New Zealand (RBNZ) aims to achieve and maintain an inflation rate between 1% and 3% over the medium term, with a focus to keep it near the 2% mid-point. To this end, the bank sets an appropriate level of interest rates. When inflation is too high, the RBNZ will increase interest rates to cool the economy, but the move will also make bond yields higher, increasing investors’ appeal to invest in the country and thus boosting NZD. On the contrary, lower interest rates tend to weaken NZD. The so-called rate differential, or how rates in New Zealand are or are expected to be compared to the ones set by the US Federal Reserve, can also play a key role in moving the NZD/USD pair.
Macroeconomic data releases in New Zealand are key to assess the state of the economy and can impact the New Zealand Dollar’s (NZD) valuation. A strong economy, based on high economic growth, low unemployment and high confidence is good for NZD. High economic growth attracts foreign investment and may encourage the Reserve Bank of New Zealand to increase interest rates, if this economic strength comes together with elevated inflation. Conversely, if economic data is weak, NZD is likely to depreciate.
The New Zealand Dollar (NZD) tends to strengthen during risk-on periods, or when investors perceive that broader market risks are low and are optimistic about growth. This tends to lead to a more favorable outlook for commodities and so-called ‘commodity currencies’ such as the Kiwi. Conversely, NZD tends to weaken at times of market turbulence or economic uncertainty as investors tend to sell higher-risk assets and flee to the more-stable safe havens.
-
01:26
Australian Dollar remains subdued following RBA Meeting Minutes, Retail Sales data
- The Australian Dollar remains under pressure as the RBA’s February Meeting Minutes highlight downside risks to the economy.
- Australia’s Retail Sales rose by 0.3% MoM in January, recovering from a 0.1% decline in December.
- The US Dollar weakened after European leaders voiced support for security guarantees for Ukraine, improving risk sentiment across global markets.
The Australian Dollar (AUD) retreats against the US Dollar (USD) on Tuesday, giving up recent gains. The AUD/USD pair remains under pressure following the release of the Reserve Bank of Australia (RBA) Meeting Minutes and Retail Sales data.
The RBA’s February Meeting Minutes highlighted downside risks to the economy. While the Board acknowledged the labor market's strength as a key reason to maintain rates, it noted that the current tightness was inconsistent with a 2.5% inflation target. Ultimately, the Board saw a stronger case for cutting rates.
Australia’s Retail Sales, a key indicator of consumer spending, increased by 0.3% month-over-month in January, rebounding from a 0.1% decline in December. However, the ANZ-Roy Morgan Australian Consumer Confidence Index dropped to 87.7 from 89.8 the previous week, when it had reached its highest level since May 2022.
The AUD also faces downward pressure after the White House confirmed that US President Donald Trump signed an order raising tariffs on Chinese imports to 20%. Notably, Trump has yet to finalize similar orders for Mexico and Canada. Given China’s role as a major trading partner for Australia, any economic shifts in China could significantly impact the Australian Dollar.
The Australian Financial Review Business Summit 2025 kicks off on Tuesday, featuring industry leaders. David Solomon, Chairman and CEO of The Goldman Sachs Group, is scheduled to speak on Tuesday, while Andrew Hauser, Deputy Governor of the Reserve Bank of Australia, will address attendees on Wednesday.
Australian Dollar weakened after Trump signed order raising 20% tariffs on Chinese imports
- The US Dollar Index (DXY), which measures the USD against six major currencies, remains subdued around 106.50 at the time of writing. The Greenback faces downward pressure as optimism over a potential Ukraine peace deal dampens demand for safe-haven assets. European leaders have expressed support for security guarantees for Ukraine, boosting risk sentiment across global markets.
- United States (US) economic data on Monday presented mixed signals. The ISM Manufacturing PMI came in at 50.3, slightly below the 50.5 forecast and down from January’s 50.9. In contrast, S&P Global’s final Manufacturing PMI for February surpassed expectations at 52.7, improving from its preliminary reading.
- The US PCE inflation report met expectations, with the monthly headline PCE holding steady at 0.3%. Core PCE rose slightly to 0.3% from December’s 0.2%, while the annual headline PCE stood at 2.6%, slightly exceeding projections but unchanged from December’s figure. Core PCE eased to 2.6%, down from a revised 2.9% in December.
- According to Bloomberg, citing a defense official, the US has "paused" all current military aid to Ukraine. The official stated that all US military equipment not yet in Ukraine would be halted, including weapons in transit via aircraft and ships, as well as those waiting in transit areas in Poland. The pause was reportedly ordered by President Trump, with Defense Secretary Pete Hegseth directed to implement the decision.
- Tensions escalated between US President Donald Trump and Ukrainian leader Volodymyr Zelenskyy during peace deal negotiations on Friday. Zelenskyy was expected to sign an agreement granting the US greater access to Ukraine's rare earth minerals and participate in a joint press conference, but the plan was abandoned after a heated exchange between the leaders in front of the media. Following the confrontation, in which Trump openly expressed his disdain, top advisers asked Zelenskyy to leave the White House.
- The S&P Global Australia Manufacturing Purchasing Managers Index (PMI) was revised down to 50.4 in February from an initial estimate of 50.6 but remained above January's 50.2. This marked the second consecutive month of improvement in manufacturing conditions and the strongest growth since February 2023.
- Australia’s TD-MI Inflation Gauge fell by 0.2% month-over-month in February, reversing a 0.1% rise in January. This marked the first decline since last August and followed the Reserve Bank of Australia's (RBA) decision to cut its cash rate by 25 basis points to 4.1% during its first monetary policy meeting of the year, reflecting a continued slowdown in underlying inflation. However, on an annual basis, the gauge rose by 2.2%, slightly below the previous 2.3% increase.
- China's Caixin Manufacturing Purchasing Managers' Index (PMI) rose to 50.8 in February from January’s 50.1, exceeding market expectations of 50.3. NBS Manufacturing PMI improved to 50.2 in February versus 49.1 prior. This figure came in stronger than the 49.9 expected. Meanwhile, the NBS Non-Manufacturing PMI climbed to 50.4 in February from 50.2 in January, beating the estimation of 50.3.
Australian Dollar maintains position above 0.6200 support despite ongoing bearish pressure
AUD/USD is trading near 0.6210 on Tuesday, remaining under pressure as it hovers below the nine-day Exponential Moving Average (EMA). This positioning signals weakening short-term momentum. Additionally, the 14-day Relative Strength Index (RSI) remains below 50, reinforcing the bearish outlook.
Despite the downward pressure, the pair is holding above key support at the psychological level of 0.6200. A break below this level could push the price toward 0.6087, its lowest level since April 2020, recorded on February 3.
On the upside, initial resistance is at the nine-day EMA of 0.6266, followed by the 50-day EMA at 0.6304. A decisive break above the latter could strengthen short-term momentum, potentially leading to a retest of the three-month high of 0.6408, reached on February 21.
AUD/USD: Daily Chart
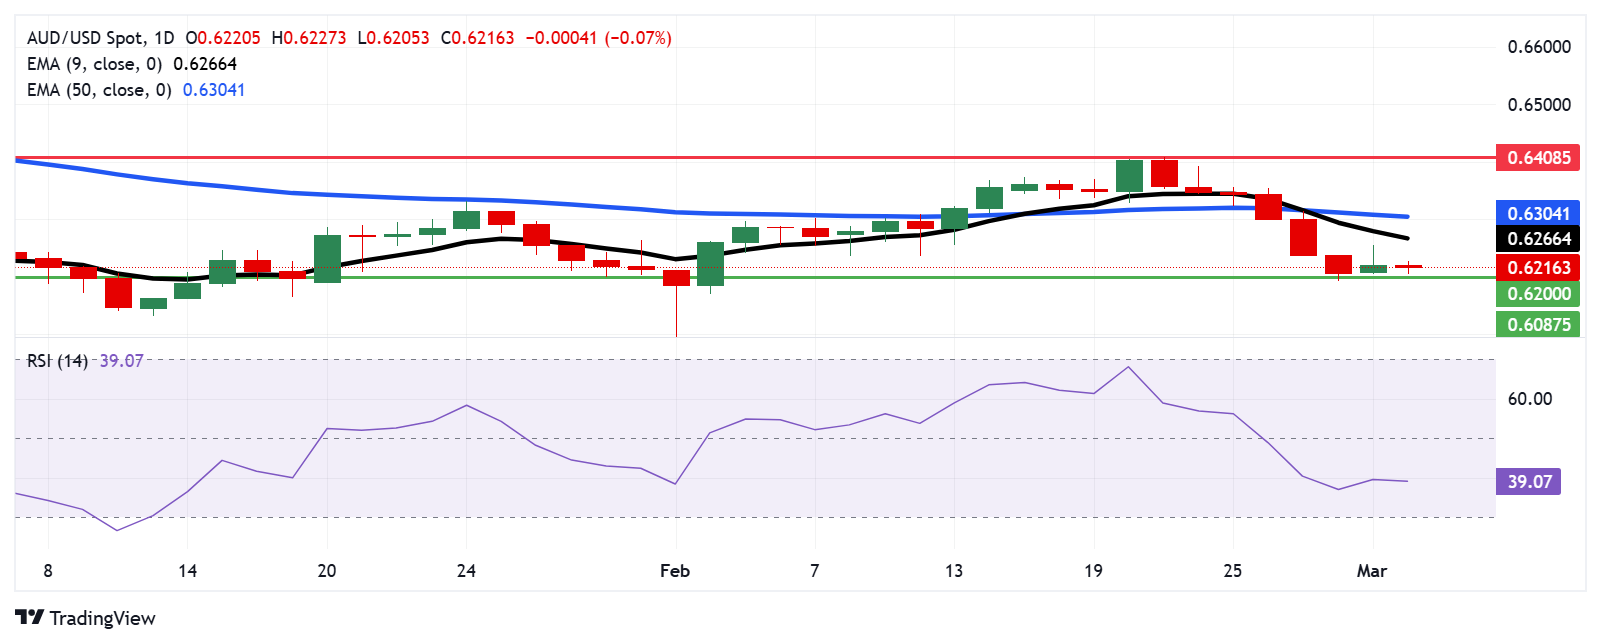
Australian Dollar PRICE Today
The table below shows the percentage change of Australian Dollar (AUD) against listed major currencies today. Australian Dollar was the weakest against the Japanese Yen.
USD EUR GBP JPY CAD AUD NZD CHF USD -0.08% -0.05% -0.39% -0.15% 0.05% -0.02% -0.15% EUR 0.08% 0.04% -0.30% -0.06% 0.14% 0.07% -0.08% GBP 0.05% -0.04% -0.34% -0.10% 0.10% 0.03% -0.10% JPY 0.39% 0.30% 0.34% 0.26% 0.46% 0.38% 0.25% CAD 0.15% 0.06% 0.10% -0.26% 0.20% 0.14% -0.01% AUD -0.05% -0.14% -0.10% -0.46% -0.20% -0.07% -0.21% NZD 0.02% -0.07% -0.03% -0.38% -0.14% 0.07% -0.14% CHF 0.15% 0.08% 0.10% -0.25% 0.00% 0.21% 0.14% The heat map shows percentage changes of major currencies against each other. The base currency is picked from the left column, while the quote currency is picked from the top row. For example, if you pick the Australian Dollar from the left column and move along the horizontal line to the US Dollar, the percentage change displayed in the box will represent AUD (base)/USD (quote).
Economic Indicator
RBA Meeting Minutes
The minutes of the Reserve Bank of Australia meetings are published two weeks after the interest rate decision. The minutes give a full account of the policy discussion, including differences of view. They also record the votes of the individual members of the Committee. Generally speaking, if the RBA is hawkish about the inflationary outlook for the economy, then the markets see a higher possibility of a rate increase, and that is positive for the AUD.
Read more.Last release: Tue Mar 04, 2025 00:30
Frequency: Weekly
Actual: -
Consensus: -
Previous: -
Source: Reserve Bank of Australia
The Reserve Bank of Australia (RBA) publishes the minutes of its monetary policy meeting two weeks after the interest rate decision is announced. It provides a detailed record of the discussions held between the RBA’s board members on monetary policy and economic conditions that influenced their decision on adjusting interest rates and/or bond buys, significantly impacting the AUD. The minutes also reveal considerations on international economic developments and the exchange rate value.
-
01:16
China’s Commerce Ministry will take necessary countermeasures on Donald Trump's higher tariffs
China’s Commerce Ministry said early Tuesday that the country vowed to take “necessary countermeasures” to safeguard China’s legitimate rights and interests. The ministry reiterated its firm opposition to the US move to impose another 10% tariff on Chinese imports starting on Tuesday.
The Commerce Ministry spokesperson said that the US disregarded facts, international trade rules, and the voices of various parties, and such a move is a typical example of unilateralism and bullying.Market reaction
At the time of writing, the AUD/USD pair is down 0.12% on the day at 0.6212.
Tariffs FAQs
Tariffs are customs duties levied on certain merchandise imports or a category of products. Tariffs are designed to help local producers and manufacturers be more competitive in the market by providing a price advantage over similar goods that can be imported. Tariffs are widely used as tools of protectionism, along with trade barriers and import quotas.
Although tariffs and taxes both generate government revenue to fund public goods and services, they have several distinctions. Tariffs are prepaid at the port of entry, while taxes are paid at the time of purchase. Taxes are imposed on individual taxpayers and businesses, while tariffs are paid by importers.
There are two schools of thought among economists regarding the usage of tariffs. While some argue that tariffs are necessary to protect domestic industries and address trade imbalances, others see them as a harmful tool that could potentially drive prices higher over the long term and lead to a damaging trade war by encouraging tit-for-tat tariffs.
During the run-up to the presidential election in November 2024, Donald Trump made it clear that he intends to use tariffs to support the US economy and American producers. In 2024, Mexico, China and Canada accounted for 42% of total US imports. In this period, Mexico stood out as the top exporter with $466.6 billion, according to the US Census Bureau. Hence, Trump wants to focus on these three nations when imposing tariffs. He also plans to use the revenue generated through tariffs to lower personal income taxes.
-
01:15
PBOC sets USD/CNY reference rate at 7.1739 vs. 7.1745 previous
The People’s Bank of China (PBOC) set the USD/CNY central rate for the trading session ahead on Tuesday at 7.1739 as compared to the previous day's fix of 7.1745 and 7.2727 Reuters estimates.
PBOC FAQs
The primary monetary policy objectives of the People's Bank of China (PBoC) are to safeguard price stability, including exchange rate stability, and promote economic growth. China’s central bank also aims to implement financial reforms, such as opening and developing the financial market.
The PBoC is owned by the state of the People's Republic of China (PRC), so it is not considered an autonomous institution. The Chinese Communist Party (CCP) Committee Secretary, nominated by the Chairman of the State Council, has a key influence on the PBoC’s management and direction, not the governor. However, Mr. Pan Gongsheng currently holds both of these posts.
Unlike the Western economies, the PBoC uses a broader set of monetary policy instruments to achieve its objectives. The primary tools include a seven-day Reverse Repo Rate (RRR), Medium-term Lending Facility (MLF), foreign exchange interventions and Reserve Requirement Ratio (RRR). However, The Loan Prime Rate (LPR) is China’s benchmark interest rate. Changes to the LPR directly influence the rates that need to be paid in the market for loans and mortgages and the interest paid on savings. By changing the LPR, China’s central bank can also influence the exchange rates of the Chinese Renminbi.
Yes, China has 19 private banks – a small fraction of the financial system. The largest private banks are digital lenders WeBank and MYbank, which are backed by tech giants Tencent and Ant Group, per The Straits Times. In 2014, China allowed domestic lenders fully capitalized by private funds to operate in the state-dominated financial sector.
-
00:55
US President Donald Trump pauses military aid to Ukraine
US President Donald Trump ordered a pause to all military aid to Ukraine, putting further pressure on Volodymyr Zelenskiy just days after an Oval Office dispute with the Ukrainian president cast doubt on his country's most important partner.
The official said all US military equipment not currently in Ukraine would be paused, including weapons in transit on aircraft and ships or waiting in transit areas in Poland.Market reaction
At the time of writing, the gold price (XAU/USD) is trading 0.02% higher on the day to trade at $2,891.
Risk sentiment FAQs
In the world of financial jargon the two widely used terms “risk-on” and “risk off'' refer to the level of risk that investors are willing to stomach during the period referenced. In a “risk-on” market, investors are optimistic about the future and more willing to buy risky assets. In a “risk-off” market investors start to ‘play it safe’ because they are worried about the future, and therefore buy less risky assets that are more certain of bringing a return, even if it is relatively modest.
Typically, during periods of “risk-on”, stock markets will rise, most commodities – except Gold – will also gain in value, since they benefit from a positive growth outlook. The currencies of nations that are heavy commodity exporters strengthen because of increased demand, and Cryptocurrencies rise. In a “risk-off” market, Bonds go up – especially major government Bonds – Gold shines, and safe-haven currencies such as the Japanese Yen, Swiss Franc and US Dollar all benefit.
The Australian Dollar (AUD), the Canadian Dollar (CAD), the New Zealand Dollar (NZD) and minor FX like the Ruble (RUB) and the South African Rand (ZAR), all tend to rise in markets that are “risk-on”. This is because the economies of these currencies are heavily reliant on commodity exports for growth, and commodities tend to rise in price during risk-on periods. This is because investors foresee greater demand for raw materials in the future due to heightened economic activity.
The major currencies that tend to rise during periods of “risk-off” are the US Dollar (USD), the Japanese Yen (JPY) and the Swiss Franc (CHF). The US Dollar, because it is the world’s reserve currency, and because in times of crisis investors buy US government debt, which is seen as safe because the largest economy in the world is unlikely to default. The Yen, from increased demand for Japanese government bonds, because a high proportion are held by domestic investors who are unlikely to dump them – even in a crisis. The Swiss Franc, because strict Swiss banking laws offer investors enhanced capital protection.
-
00:42
RBA Minutes: Members emphasize more weight on downside risks to the economy
The Reserve Bank of Australia (RBA) published the Minutes of its February monetary policy meeting on Tuesday, highlighting that the board judged case to cut rates was the stronger one. Members placed more weight on the downside risks to the economy.
Key quotes
Board judged case to cut rates was, on balance, the stronger one.
Members placed more weight on the downside risks to the economy.
Particularly mindful of risk of keeping policy too tight for too long.
Board agreed decision did not commit them to further cuts in the cash rate.
Members expressed caution about the prospect of further easing
If inflation proved persistent, rates might stay at 4.1% for an extended period or be raised.
Strongest argument for cutting rates was the slowdown in inflation and wages.
Considered whether there was more spare capacity in labour market than thought.
Risk employment in non-market sector would slow, recovery in household consumption not assured.
Board considered three main reasons for keeping rates unchanged
Strength in labour market strongest reason for holding steady, tightness not consistent with 2.5% inflation.
Possible policy was not as restrictive as thought, or that the economy could pick up quicker than expected.
US trade policy could have material adverse effect on business investment, household consumption.
Market reaction to the RBA Meeting Minutes
At the time of writing, AUD/USD is trading 0.09% lower on the day to trade at 0.6215.
-
00:35
Australia’s Retail Sales rise 0.3 % MoM in January vs. 0.3% expected
Australia’s Retail Sales, a measure of the country’s consumer spending, rose 0.3% MoM in January, compared to a decline of 0.1% in December, the official data published by the Australian Bureau of Statistics (ABS) showed on Tuesday.
The reading came in line with the market expectations of a rise of 0.3%.Market reaction to Australia’s Retail Sales data
At the time of writing, the AUD/USD pair is down 0.10% on the day at 0.6212.
Australian Dollar FAQs
One of the most significant factors for the Australian Dollar (AUD) is the level of interest rates set by the Reserve Bank of Australia (RBA). Because Australia is a resource-rich country another key driver is the price of its biggest export, Iron Ore. The health of the Chinese economy, its largest trading partner, is a factor, as well as inflation in Australia, its growth rate and Trade Balance. Market sentiment – whether investors are taking on more risky assets (risk-on) or seeking safe-havens (risk-off) – is also a factor, with risk-on positive for AUD.
The Reserve Bank of Australia (RBA) influences the Australian Dollar (AUD) by setting the level of interest rates that Australian banks can lend to each other. This influences the level of interest rates in the economy as a whole. The main goal of the RBA is to maintain a stable inflation rate of 2-3% by adjusting interest rates up or down. Relatively high interest rates compared to other major central banks support the AUD, and the opposite for relatively low. The RBA can also use quantitative easing and tightening to influence credit conditions, with the former AUD-negative and the latter AUD-positive.
China is Australia’s largest trading partner so the health of the Chinese economy is a major influence on the value of the Australian Dollar (AUD). When the Chinese economy is doing well it purchases more raw materials, goods and services from Australia, lifting demand for the AUD, and pushing up its value. The opposite is the case when the Chinese economy is not growing as fast as expected. Positive or negative surprises in Chinese growth data, therefore, often have a direct impact on the Australian Dollar and its pairs.
Iron Ore is Australia’s largest export, accounting for $118 billion a year according to data from 2021, with China as its primary destination. The price of Iron Ore, therefore, can be a driver of the Australian Dollar. Generally, if the price of Iron Ore rises, AUD also goes up, as aggregate demand for the currency increases. The opposite is the case if the price of Iron Ore falls. Higher Iron Ore prices also tend to result in a greater likelihood of a positive Trade Balance for Australia, which is also positive of the AUD.
The Trade Balance, which is the difference between what a country earns from its exports versus what it pays for its imports, is another factor that can influence the value of the Australian Dollar. If Australia produces highly sought after exports, then its currency will gain in value purely from the surplus demand created from foreign buyers seeking to purchase its exports versus what it spends to purchase imports. Therefore, a positive net Trade Balance strengthens the AUD, with the opposite effect if the Trade Balance is negative.
-
00:30
South Korea S&P Global Manufacturing PMI down to 49.9 in February from previous 50.3
-
00:30
South Korea S&P Global Manufacturing PMI down to 49.9 in February from previous 50.3
-
00:30
Australia Retail Sales s.a. (MoM) meets forecasts (0.3%) in January
-
00:30
Australia Current Account Balance came in at -12.5B below forecasts (-11.9B) in 4Q
-
00:30
Australia Retail Sales s.a. (MoM) meets forecasts (0.3%) in January
-
00:30
Australia Current Account Balance came in at -12.5B below forecasts (-11.9B) in 4Q
-
00:30
Stocks. Daily history for Monday, March 3, 2025
Index Change, points Closed Change, % NIKKEI 225 629.97 37785.47 1.7 Hang Seng 64.95 23006.27 0.28 ASX 200 73.3 8245.7 0.9 DAX 595.59 23147.02 2.64 CAC 40 88.08 8199.71 1.09 Dow Jones -649.67 43191.24 -1.48 S&P 500 -104.78 5849.72 -1.76 NASDAQ Composite -497.09 18350.19 -2.64 -
00:15
Currencies. Daily history for Monday, March 3, 2025
Pare Closed Change, % AUDUSD 0.62222 0.13 EURJPY 156.748 0 EURUSD 1.04853 0.79 GBPJPY 189.842 0.14 GBPUSD 1.2699 0.94 NZDUSD 0.56149 0.56 USDCAD 1.44876 0.29 USDCHF 0.89672 -0.54 USDJPY 149.486 -0.78 -
00:02
United Kingdom BRC Shop Price Index (YoY) unchanged at -0.7% in February
-