Notícias do Mercado
-
23:30
Schedule for today, Thursday, January 17, 2019
Time Country Event Period Previous value Forecast 00:00 Australia Consumer Inflation Expectation January 4% 00:30 Australia Home Loans November 2.2% -1.5% 03:20 Japan BOJ Governor Haruhiko Kuroda Speaks 10:00 Eurozone Construction Output, y/y November 1.8% 10:00 Eurozone Harmonized CPI December -0.2% 0% 10:00 Eurozone Harmonized CPI ex EFAT, Y/Y December 1% 1% 10:00 Eurozone Harmonized CPI, Y/Y December 1.9% 1.6% 11:00 Eurozone ECB's Lautenschläger Speech 13:30 U.S. Continuing Jobless Claims January 1722 1735 13:30 U.S. Philadelphia Fed Manufacturing Survey January 9.4 10 13:30 U.S. Initial Jobless Claims January 216 220 15:45 U.S. FOMC Member Quarles Speaks 21:30 New Zealand Business NZ PMI December 53.5 23:30 Japan National CPI Ex-Fresh Food, y/y December 0.9% 0.8% 23:30 Japan National Consumer Price Index, y/y December 0.8% 0.3% -
21:14
Major US stock indexes ended in positive territory
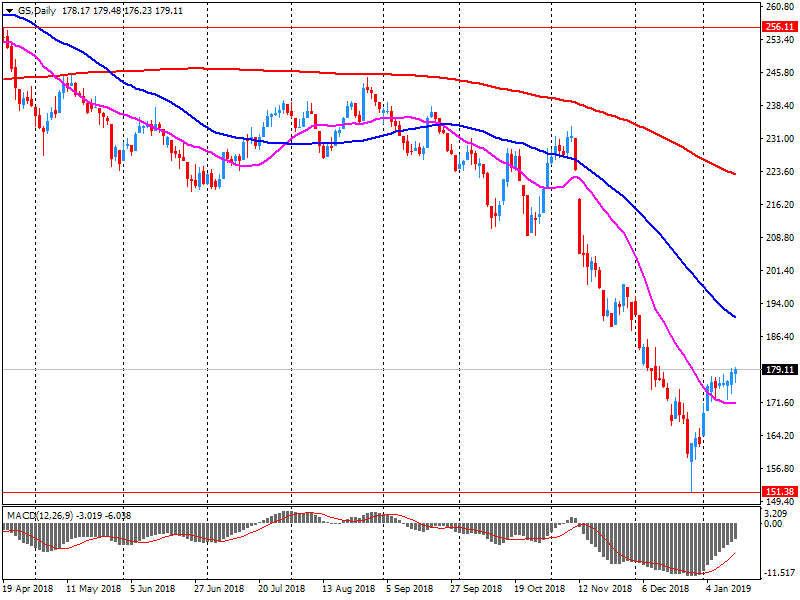
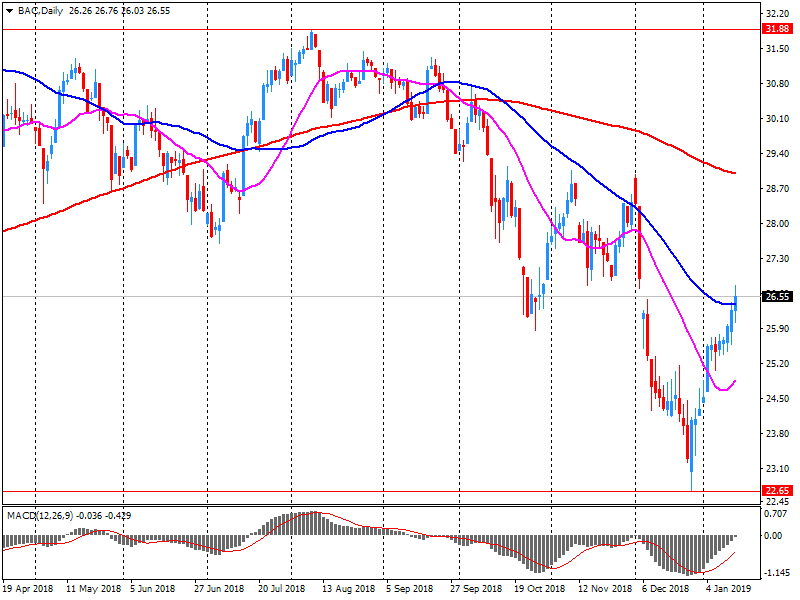
Major US stock indices rose moderately on Wednesday due to a rise in prices for bank shares after strong reports by Bank of America and Goldman Sachs.
Bank of America reported a quarterly profit of $ 0.70 per share, which was $ 0.07 above the analysts' average forecast. Quarterly revenue of the bank also exceeded the average market forecast. It is worth noting that his profit has more than tripled from a year earlier. Goldman Sachs reported quarterly earnings of $ 6.04 per share, which was well above the analysts' average forecast of $ 4.78. The company's revenue also exceeded the forecast, showing an increase of 12% y / y and reaching the highest level since 2010.
Some attention was also attracted data on the US housing market. The housing market index from the National Association of Home Builders (NAHB) rose in January by 2 points, to 58 points. This happened after two months of sharp fall in sentiment, to its lowest level in the last two years. Recall that in January 2018 the index was 72 points. The value of the indicator above the level of 50 points indicates favorable prospects.
Most of the components of DOW finished trading in positive territory (17 of 30). The growth leader was The Goldman Sachs Group, Inc. (GS, + 9.92%). The outsider was Verizon Communications Inc. (VZ, -1.76%).
Most sectors of the S & P recorded an increase. The largest growth was shown by the financial sector (+ 1.5%). Consumer goods sector decreased more than the rest (-0.2%).
At the time of closing:
Dow 24,207.16 +141.57 +0.59%
S & P 500 2,616.10 +5.80 +0.22%
Nasdaq 100 7,034.69 +10.86 +0.15%
-
20:50
Schedule for tomorrow, Thursday, January 17, 2019
Time Country Event Period Previous value Forecast 00:00 Australia Consumer Inflation Expectation January 4% 00:30 Australia Home Loans November 2.2% -1.5% 03:20 Japan BOJ Governor Haruhiko Kuroda Speaks 10:00 Eurozone Construction Output, y/y November 1.8% 10:00 Eurozone Harmonized CPI December -0.2% 0% 10:00 Eurozone Harmonized CPI ex EFAT, Y/Y December 1% 1% 10:00 Eurozone Harmonized CPI, Y/Y December 1.9% 1.6% 11:00 Eurozone ECB's Lautenschläger Speech 13:30 U.S. Continuing Jobless Claims January 1722 1735 13:30 U.S. Philadelphia Fed Manufacturing Survey January 9.4 10 13:30 U.S. Initial Jobless Claims January 216 220 15:45 U.S. FOMC Member Quarles Speaks 21:30 New Zealand Business NZ PMI December 53.5 23:30 Japan National CPI Ex-Fresh Food, y/y December 0.9% 0.8% 23:30 Japan National Consumer Price Index, y/y December 0.8% 0.3% -
20:01
DJIA +0.75% 24,246.95 +181.36 Nasdaq +0.33% 7,047.05 +23.21 S&P +0.42% 2,621.24 +10.94
-
17:00
European stocks closed: FTSE 100 -32.34 6862.68 -0.47% DAX +39.45 10931.24 +0.36% CAC 40 +24.57 4810.74 +0.51%
-
15:43
U.S. commercial crude oil inventories decreased by 2.7 million barrels from the previous week
U.S. commercial crude oil inventories (excluding those in the Strategic Petroleum Reserve) decreased by 2.7 million barrels from the previous week. At 437.1 million barrels, U.S. crude oil inventories are about 8% above the five year average for this time of year.
Total motor gasoline inventories increased by 7.5 million barrels last week and are about 6% above the five year average for this time of year. Finished gasoline and blending components inventories both increased last week.
Distillate fuel inventories increased by 3.0 million barrels last week and are about 3% below the five year average for this time of year. Propane/propylene inventories decreased by 1.2 million barrels last week and are about 1% above the five year average for this time of year. Total commercial petroleum inventories increased last week by 5.0 million barrels last week.
-
15:30
U.S.: Crude Oil Inventories, January -2.683 (forecast -1.5)
-
15:00
U.S.: NAHB Housing Market Index, January 58 (forecast 56)
-
14:33
U.S. Stocks open: Dow +0.35%, Nasdaq +0.23%, S&P +0.21%
-
14:20
Before the bell: S&P futures +0.28%, NASDAQ futures +0.14%
U.S. stock-index futures rose slightly on Wednesday, helped by strong quarterly results from major banks like Goldman Sachs (GS) and Bank of America (BAC).
Global Stocks:
Index/commodity
Last
Today's Change, points
Today's Change, %
Nikkei
20,442.75
-112.54
-0.55%
Hang Seng
26,902.10
+71.81
+0.27%
Shanghai
2,570.42
+0.0772
0.00%
S&P/ASX
5,835.20
+20.60
+0.35%
FTSE
6,861.48
-33.54
-0.49%
CAC
4,798.25
+12.08
+0.25%
DAX
10,908.65
+16.86
+0.15%
Crude
$51.60
-0.98%
Gold
$1,290.50
+0.16%
-
14:01
Wall Street. Stocks before the bell
(company / ticker / price / change ($/%) / volume)
ALCOA INC.
AA
28.99
0.09(0.31%)
1675
Amazon.com Inc., NASDAQ
AMZN
1,683.16
8.60(0.51%)
76928
Apple Inc.
AAPL
153
-0.07(-0.05%)
202778
AT&T Inc
T
30.58
-0.02(-0.07%)
61701
Cisco Systems Inc
CSCO
44.12
0.10(0.23%)
41475
Citigroup Inc., NYSE
C
62.18
0.80(1.30%)
138725
Facebook, Inc.
FB
148.67
-0.28(-0.19%)
174899
Freeport-McMoRan Copper & Gold Inc., NYSE
FCX
11.87
0.30(2.59%)
235706
General Electric Co
GE
8.69
-0.04(-0.46%)
417054
Goldman Sachs
GS
186.17
6.26(3.48%)
399263
JPMorgan Chase and Co
JPM
101.52
-0.16(-0.16%)
142677
Microsoft Corp
MSFT
105.15
0.14(0.13%)
102322
Tesla Motors, Inc., NASDAQ
TSLA
345.78
1.35(0.39%)
8115
Yandex N.V., NASDAQ
YNDX
29.75
0.21(0.71%)
10073
-
13:46
Downgrades before the market open
Citigroup (C) downgraded to Hold from Buy at Standpoint Research
-
13:32
Company News: Goldman Sachs (GS) quarterly results beat analysts’ forecasts
Goldman Sachs (GS) reported Q4 FY 2018 earnings of $6.04 per share (versus $5.68 in Q4 FY 2017), beating analysts’ consensus estimate of $4.78.
The company’s quarterly revenues amounted to $8.080 bln (-0.5% y/y), beating analysts’ consensus estimate of $7.482 bln.
GS rose to $184.39 (+2.49%) in pre-market trading.
-
13:32
Prices for U.S. imports decreased 1.0 percent in December
Prices for U.S. imports decreased 1.0 percent in December, the U.S. Bureau of Labor Statistics reported today, after a 1.9-percent fall the previous month. Lower fuel prices drove the decline in December, and nonfuel prices recorded no change. U.S. export prices fell 0.6 percent in December following a 0.8-percent drop in November.
U.S. export prices fell 0.6 percent in December following a 0.8-percent decrease in November. Nonagricultural prices declined in December, more than offsetting higher prices for agricultural goods.
Despite the December downturn, U.S. export prices increased 1.1 percent in 2018. The price index for U.S. exports has not recorded a calendar-year decrease since falling 6.6 percent in 2015. -
13:30
U.S.: Import Price Index, December -1% (forecast -1.3%)
-
13:19
Company News: Bank of America (BAC) quarterly results beat analysts’ estimates
Bank of America (BAC) reported Q4 FY 2018 earnings of $0.70 per share (versus $0.47 in Q4 FY 2017), beating analysts’ consensus estimate of $0.63.
The company’s quarterly revenues amounted to $22.891 bln (+100.7% y/y), beating analysts’ consensus estimate of $22.373 bln.
BAC rose to $27.74 (+4.48%) in pre-market trading.
-
12:54
-
11:54
-
10:28
BOE's Carney: Direct UK Exposure to Chinese Economy Is 'Modest'
Market View Of Brexit Vote Most Clearly Expressed In FX Market - Tsy Select Committee Hearing
Chinese Growth to 'Head Toward Low Sixes' This Year
China Is a Factor in Global Economic Slowdown
Markets Have Anticipated China Slowdown
-
10:25
UK producer price inflation was 2.5% on the year to December 2018, down from 3.0% in November
The headline rate of output inflation for goods leaving the factory gate was 2.5% on the year to December 2018, down from 3.0% in November 2018.
The growth rate of prices for materials and fuels used in the manufacturing process slowed to 3.7% on the year to December 2018, down from 5.3% in November 2018.
Petroleum products and crude oil provided the largest contribution to the change in the annual rate of output and input inflation respectively.
Crude oil increased 0.4% on the year to December 2018, down from 13.1% in November 2018.
-
10:24
UK house prices grew by 2.8% in the year to November 2018, up slightly from 2.7% in the year to October
On a non-seasonally adjusted basis, average house prices in the UK fell by 0.1% between October 2018 and November 2018, compared with a decrease of 0.3% in average prices during the same period a year earlier (October 2017 and November 2017).
The strongest annual growth in house prices was in the West Midlands, increasing by 4.6% in the year to November 2018. House prices in London fell by 0.7% in the year to November 2018. London house prices have been falling over the year each month since July 2018.
-
10:24
UK CPI rose 0.2% in December, as expected
The Consumer Prices Index including owner occupiers’ housing costs (CPIH) 12-month inflation rate was 2.0% in December 2018, down from 2.2% in November 2018.
The largest downward contributions to change in the 12-month rate came from falls in petrol prices and from air fares, where ticket prices rose between November and December 2018, but by less than a year ago.
These downward effects were offset by upward contributions from a variety of categories including accommodation services and, to a lesser extent, mobile phone charges, games, toys and hobbies, and food.
The Consumer Prices Index (CPI) 12-month rate was 2.1% in December 2018, down from 2.3% in November 2018.
-
09:30
United Kingdom: HICP, m/m, December 0.2% (forecast 0.2%)
-
09:30
United Kingdom: Retail Price Index, m/m, December 0.4% (forecast 0.5%)
-
09:30
United Kingdom: HICP, Y/Y, December 2.1% (forecast 2.1%)
-
09:30
United Kingdom: Producer Price Index - Input (MoM), December -1% (forecast -1.6%)
-
09:30
United Kingdom: Retail prices, Y/Y, December 2.7% (forecast 2.9%)
-
09:30
United Kingdom: Producer Price Index - Input (YoY) , December 3.7% (forecast 3.5%)
-
09:30
United Kingdom: Producer Price Index - Output (YoY) , December 2.5% (forecast 2.9%)
-
09:30
United Kingdom: HICP ex EFAT, Y/Y, December 1.9% (forecast 1.8%)
-
09:30
United Kingdom: Producer Price Index - Output (MoM), December -0.3% (forecast 0.1%)
-
08:22
-
08:22
-
08:07
Options levels on wednesday, January 16, 2019
EUR/USD
Resistance levels (open interest**, contracts)
$1.1540 (1947)
$1.1518 (464)
$1.1502 (385)
Price at time of writing this review: $1.1393
Support levels (open interest**, contracts):
$1.1371 (2772)
$1.1342 (4081)
$1.1308 (4765)
Comments:
- Overall open interest on the CALL options and PUT options with the expiration date February, 8 is 69751 contracts (according to data from January, 15) with the maximum number of contracts with strike price $1,1600 (5440);
GBP/USD
Resistance levels (open interest**, contracts)
$1.3014 (1255)
$1.2993 (447)
$1.2959 (210)
Price at time of writing this review: $1.2886
Support levels (open interest**, contracts):
$1.2752 (547)
$1.2732 (206)
$1.2710 (479)
Comments:
- Overall open interest on the CALL options with the expiration date February, 8 is 22876 contracts, with the maximum number of contracts with strike price $1,3200 (1912);
- Overall open interest on the PUT options with the expiration date February, 8 is 26137 contracts, with the maximum number of contracts with strike price $1,200 (1930);
- The ratio of PUT/CALL was 1.14 versus 1.10 from the previous trading day according to data from January, 15
* - The Chicago Mercantile Exchange bulletin (CME) is used for the calculation.
** - Open interest takes into account the total number of option contracts that are open at the moment.
-
07:55
-
07:15
ECB's Mario Draghi: Recent Economic Developments Have Been Weaker Than Expected
Uncertainties, Notably Related to Global Factors, Remain Prominent
There Is No Room for Complacency
Significant Amount of Monetary Policy Stimulus Is Still Needed
-
07:14
The Austraian Index of Consumer Sentiment fell 4.7% to 99.6 in January from 104.4 in December
The ‘cautiously optimistic’ consumer mood that prevailed through 2018 has evaporated with sentiment beginning the new year with a slightly pessimistic view. At 99.6, the Index is below the 100 level, indicating that pessimists outnumber optimists, although only by a slim margin. This is the first time sub-100 reading from the survey since November 2017.
-
07:08
Consumer prices in Germany rose by 1.9% on an annual average in 2018 compared with 2017
The Federal Statistical Office (Destatis) also reports that the year-on-year rate of price increase in 2018 thus was slightly higher than in the previous year (2017: +1.8%). In December 2018, the inflation rate as measured by the consumer price index decreased markedly on the previous months, reaching 1.7%.
The increase in the year-on-year rate of price increase in 2018 was mainly due to energy prices. Energy product prices in 2018 were up 4.9% on 2017, the increase being larger than a year earlier (2017: +3.1% on 2016). The largest price increases in 2018 were recorded for heating oil (+21.7%) and motor fuel prices were markedly up, too (+7.8%). In contrast to these sharp price rises for mineral oil products, moderate price developments were observed for other energy products. Excluding energy prices, the year-on-year rate of price increase in 2018 would have been +1.6%.
-
07:02
EU's Moscovici: No-One Wants A No-Deal Brexit But We Are Getting Close To This @LiveSquawk
Eu Member States Will Have A United Position Regarding Brexit Talks
Britain Could Reverse Its Brexit Decision If It Wanted To
-
07:01
The U.K. Parliament voted against Prime Minister Theresa May's Brexit deal on Tuesday, leaving Britain with further uncertainty. 432 members of Parliament voted against it, while 202 voted in favor - MarketWatch
May's government now has three days to present an alternative plan in Parliament. That said, the opposition Labor Party leader Jeremy Corbyn will bring a vote of no-confidence in the government, which will be debated in Parliament on Wednesday.
-
07:00
Germany: CPI, m/m, December 0.1% (forecast 0.1%)
-
07:00
Germany: CPI, y/y , December 1.7% (forecast 1.7%)
-
04:32
Japan: Tertiary Industry Index , November -0.3% (forecast -0.5%)
-
02:30
Commodities. Daily history for Tuesday, January 15, 2019
Raw materials Closed Change, % Brent 60.58 1.99 WTI 52.19 2.35 Silver 15.55 -0.51 Gold 1288.942 -0.19 Palladium 1318.24 -0.14 -
00:30
Stocks. Daily history for Tuesday, January 15, 2019
Index Change, points Closed Change, % NIKKEI 225 195.59 20555.29 0.96 Hang Seng 531.96 26830.29 2.02 KOSPI 32.66 2097.18 1.58 ASX 200 41.2 5814.6 0.71 FTSE 100 40 6895.02 0.58 DAX 35.88 10891.79 0.33 Dow Jones 155.75 24065.59 0.65 S&P 500 27.69 2610.3 1.07 NASDAQ Composite 117.91 7023.83 1.71 -
00:15
Currencies. Daily history for Tuesday, January 15, 2019
Pare Closed Change, % AUDUSD 0.72018 0.09 EURJPY 124.04 0.01 EURUSD 1.14116 -0.49 GBPJPY 139.769 0.45 GBPUSD 1.28587 -0.04 NZDUSD 0.68154 -0.06 USDCAD 1.32653 -0.11 USDCHF 0.98754 0.69 USDJPY 108.69 0.5 -