Notícias do Mercado
-
23:53
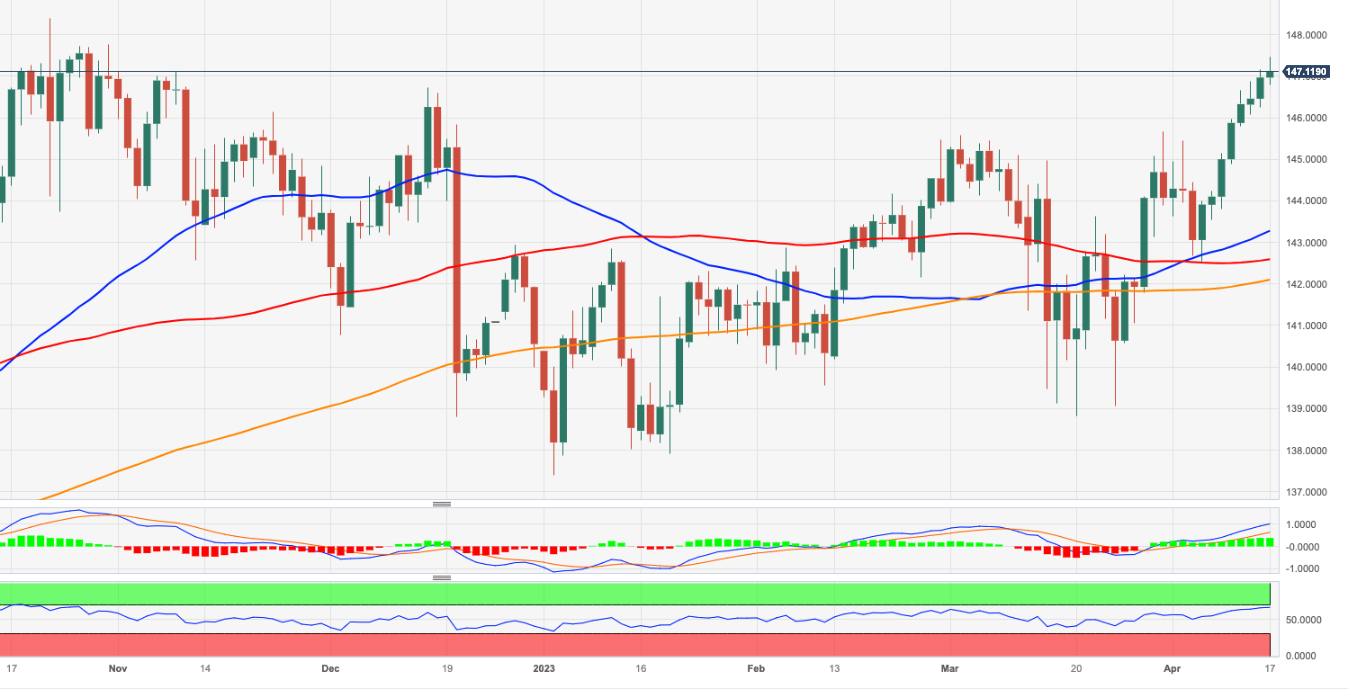
EUR/JPY Price Analysis: Prints YTD high, retreats as evening star pattern emerges
- EUR/JPY is still upward biased, but failure at 147.00 exacerbated a pullback towards 146.80s.
- Downside risks for the EUR/JPY remain at 146.60 as sellers will eye the 20-DMA.
- A bullish resumption will occur if EUR/JPY reclaims 147.00.
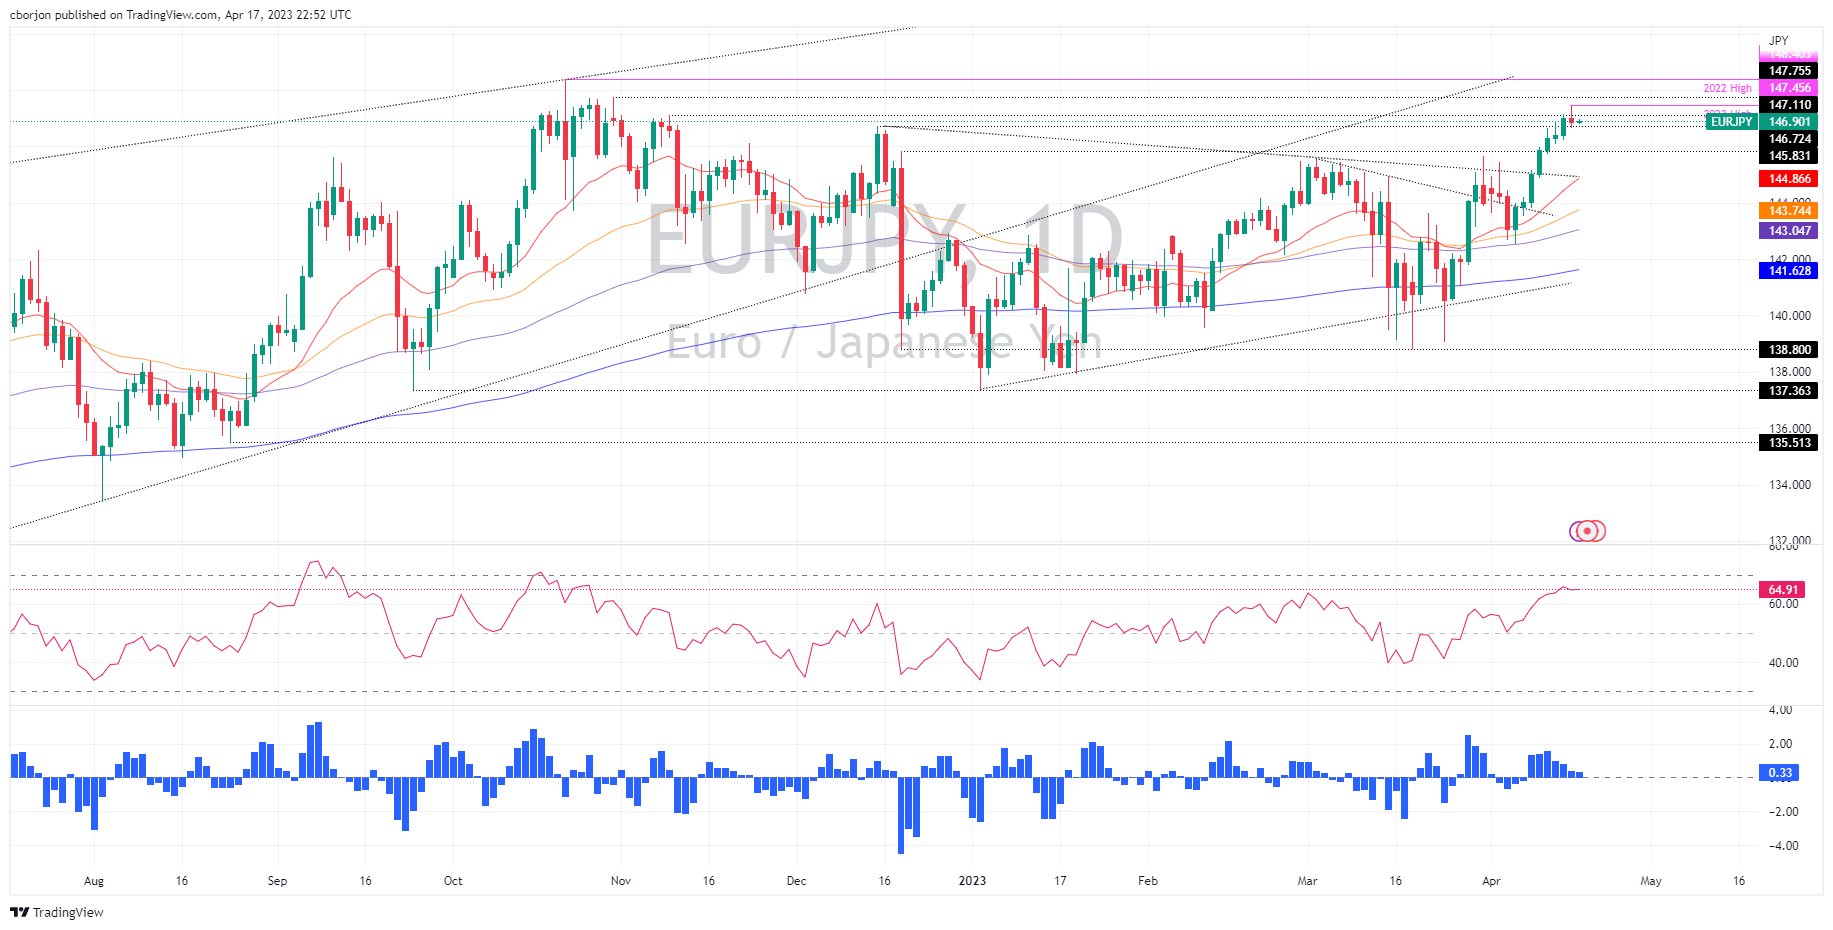
The EUR/JPY hit a YTD high at 147.45 but retreated and lost 0.11% in Monday’s trading session. However, as the Asian session begins, the EUR/JPY starts to trend higher, exchanging hands at 146.93, above 0.06%.
EUR/JPY Price Action
Monday’s price action formed an inverted hammer that could be a prelude of an evening star, a three-candlestick bearish pattern that could pave the way for further downside. Nevertheless, to confirm its validity, the EUR/JPY must break below the April 17 daily low of 146.66, followed by 146.50, before testing the April 14 low at 146.24.
The Relative Strength Index (RSI) shifted flat but remained bullish. Contrarily, the Rate of Change (RoC), shows that buying pressure is waning as it heads to neutral territory.
For a bearish continuation, if EUR/JPY cracks 146.24, it needs to break below 146.00. Once done, the pair might dive toward the December 20 daily high at 145.83 before retreating toward the 20-day Exponential Moving Average (EMA) at 144.87.
On the flip side, for a bullish continuation, the EUR/JPY must reclaim 147.00, which would open the door to test the YTD high at 147.45, followed by the 148.00 figure.
EUR/JPY Daily Chart
EUR/JPY Technical Levels
-
23:48
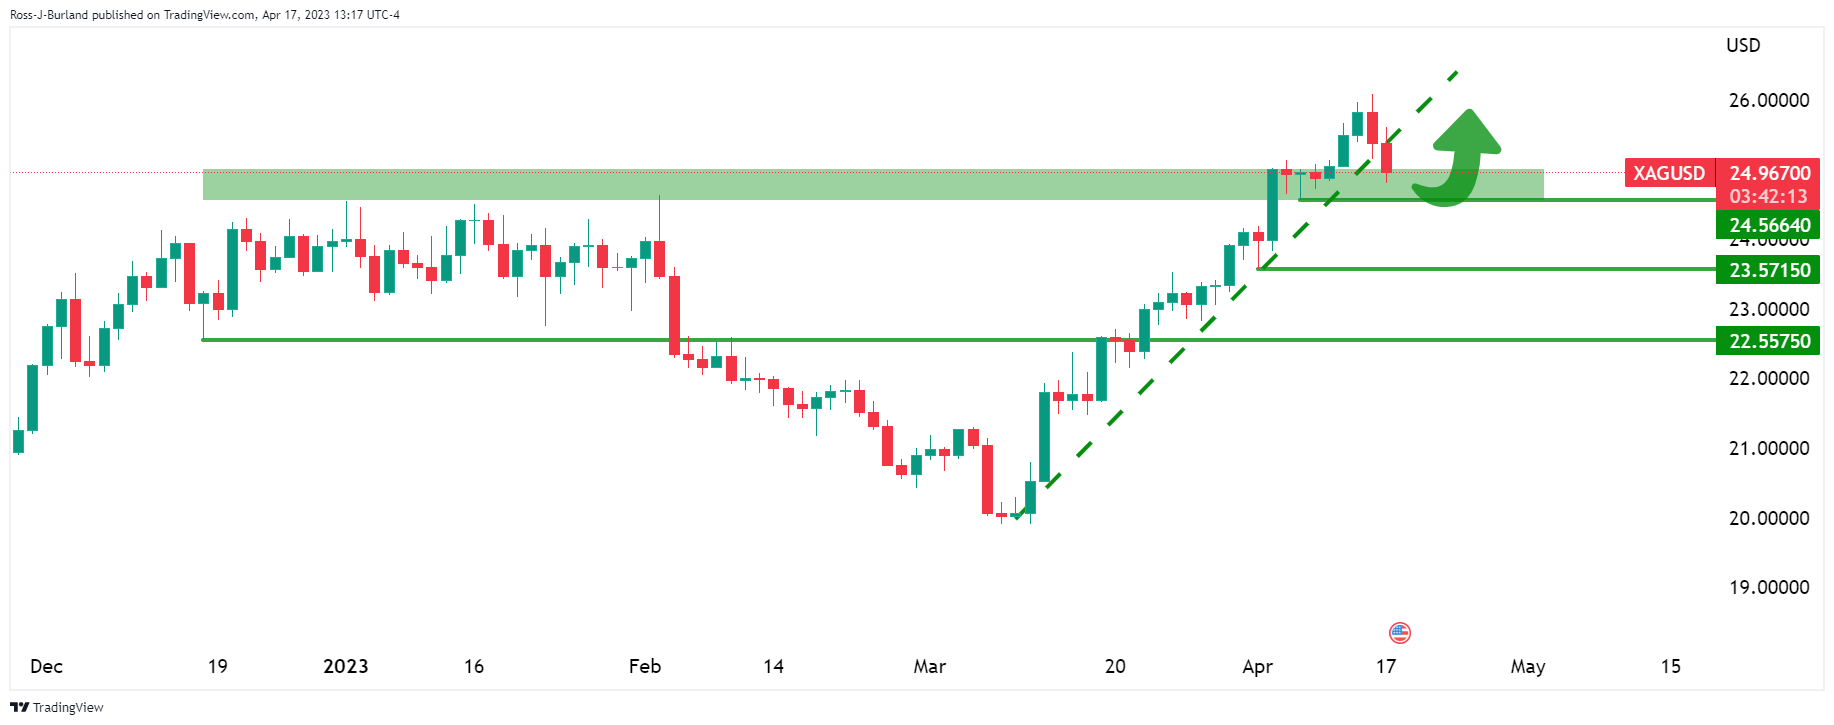
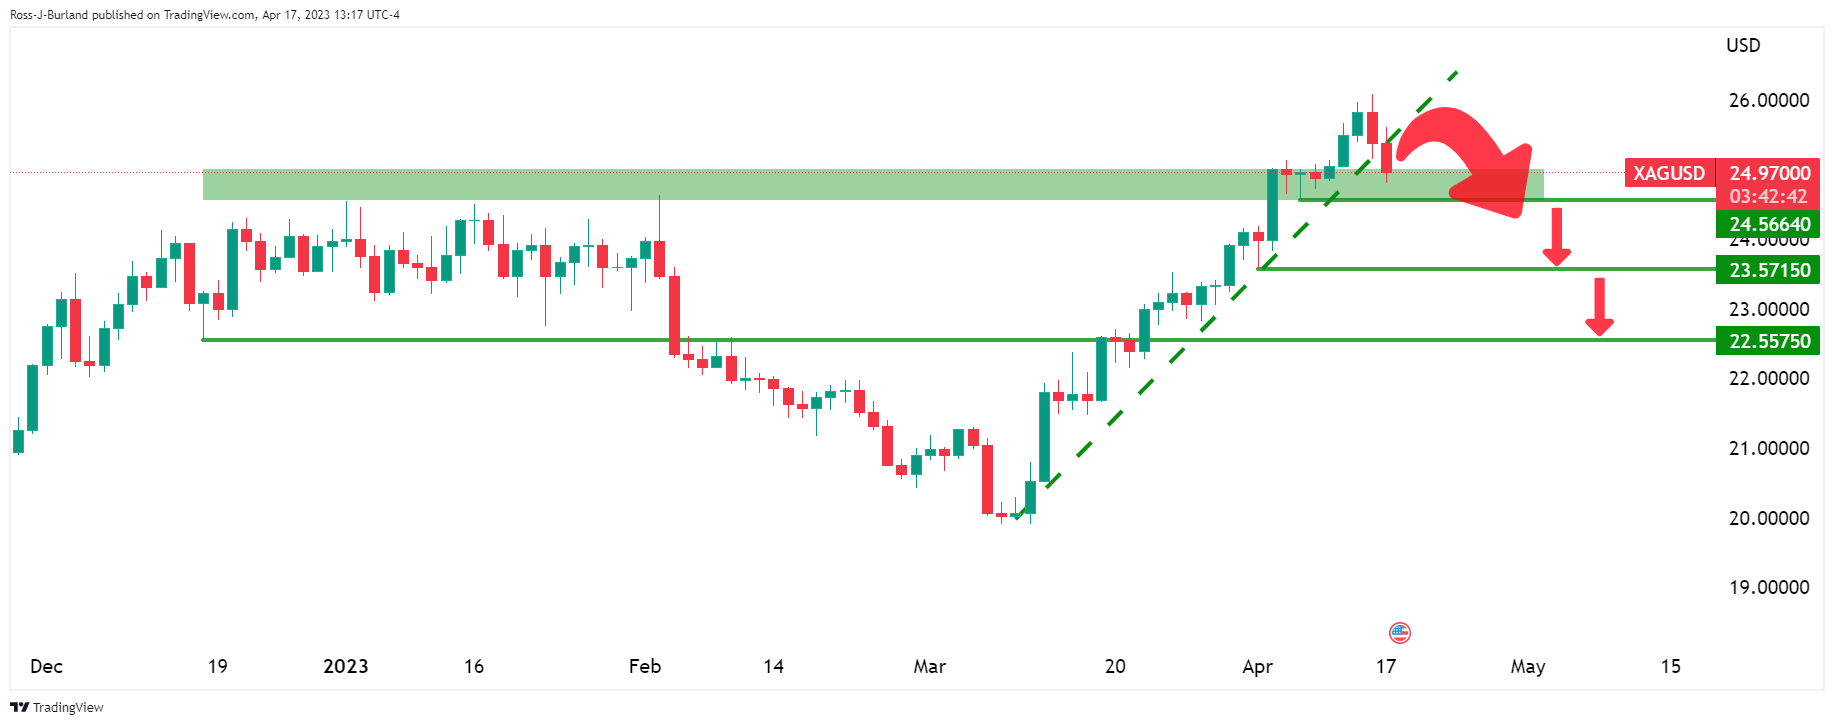
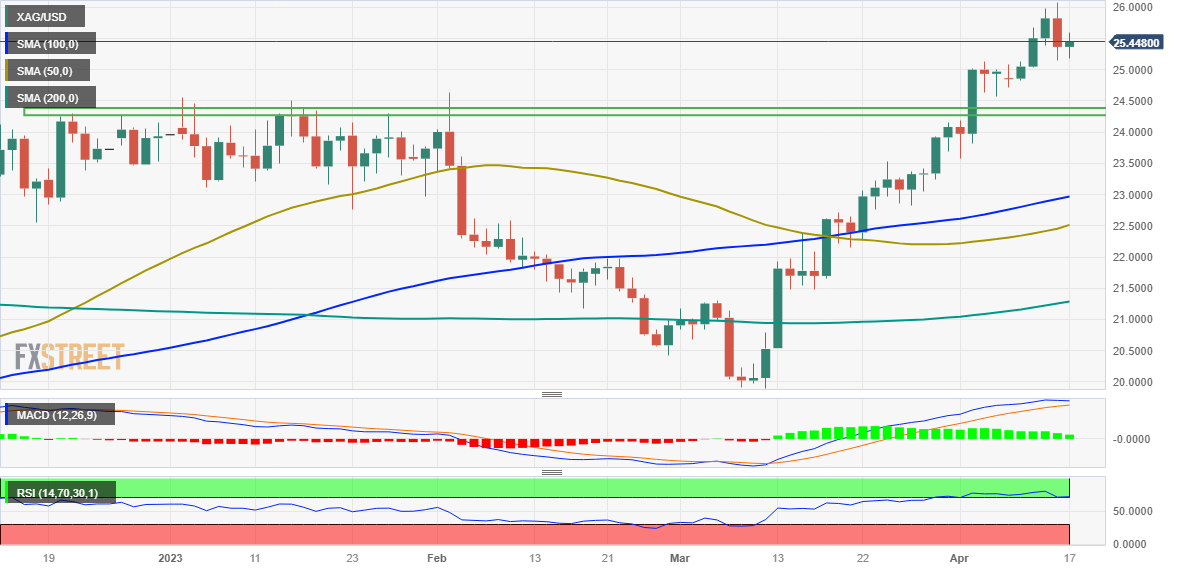
Silver Price Analysis: Further XAG/USD downside hinges on $24.85 break
- Silver price remains pressured after breaking one-month-old support line, down for the third consecutive day.
- Looming bear cross on MACD adds strength to downside bias.
- Previous resistance line from early January challenges XAG/USD sellers before the 21-DMA support.
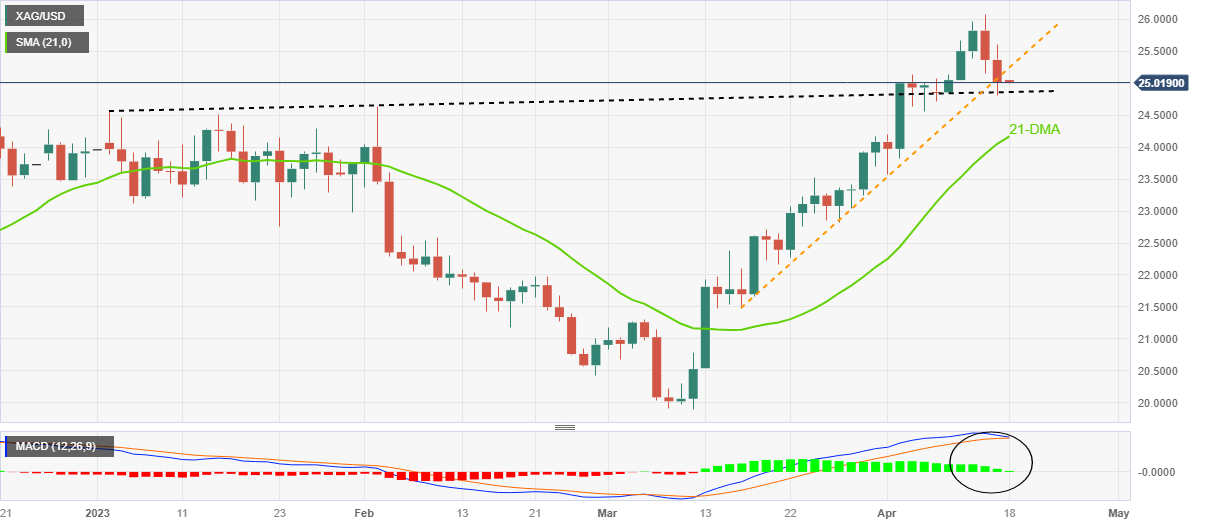
Silver price (XAG/USD) remains pressured at the $25.00 threshold, down for the third consecutive day during early Tuesday in Asia.
In doing so, the bright metal justifies the previous day’s downside break of a one-month-old ascending support line, now immediate resistance, while extending the pullback from a one-year high marked in the last week.
Apart from the trend line breakdown, an impending bear cross on the MACD indicator also keeps the XAG/USD sellers hopeful.
However, a resistance-turned-support line from early January, close to $24.85 by the press time, challenges the Silver bears at the latest.
Following that, tops marked in February and January, around $24.65 and $24.55 respectively, could challenge the XAG/USD bears before directing them to the 21-DMA support of around $24.15.
In a case where the Silver price remains bearish past $24.15, the odds of witnessing a slump toward March’s high of nearly $23.50 can’t be ruled out.
On the flip side, Silver price recovery needs validation from the previous support line from mid-March, close to $25.25 at the latest.
Should the commodity manages to remain firmer past $25.25, the late 2021 high near $25.40 and the latest peak of near $26.10 can act as extra checks for the XAG/USD bulls to cross before eyeing the April 2022 high of $26.22 and the last years high of $26.95.
Silver Price: Four-hour chart
Trend: Further downside expected
-
23:38
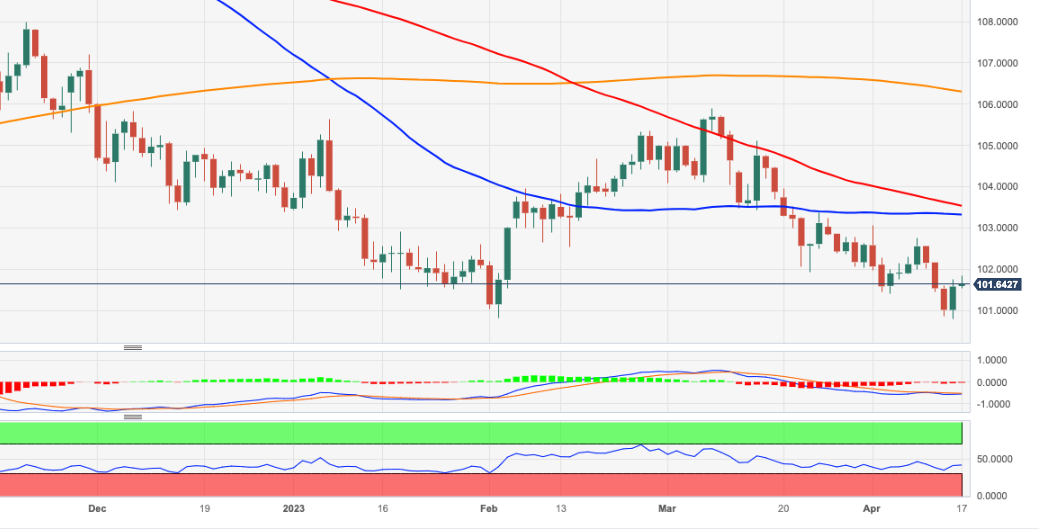
EUR/USD sees more downside to near 1.0900 as ECB to slow down policy-tightening pace
- EUR/USD is expected to witness more downside to near 1.0900 as the Fed to remain hawkish in May.
- Eurozone is prone to a credit crunch after the collapse of several US regional banks and takeover of Credit Suisse.
- The ECB is highly expected to raise rates by 25bps in its May policy meeting.
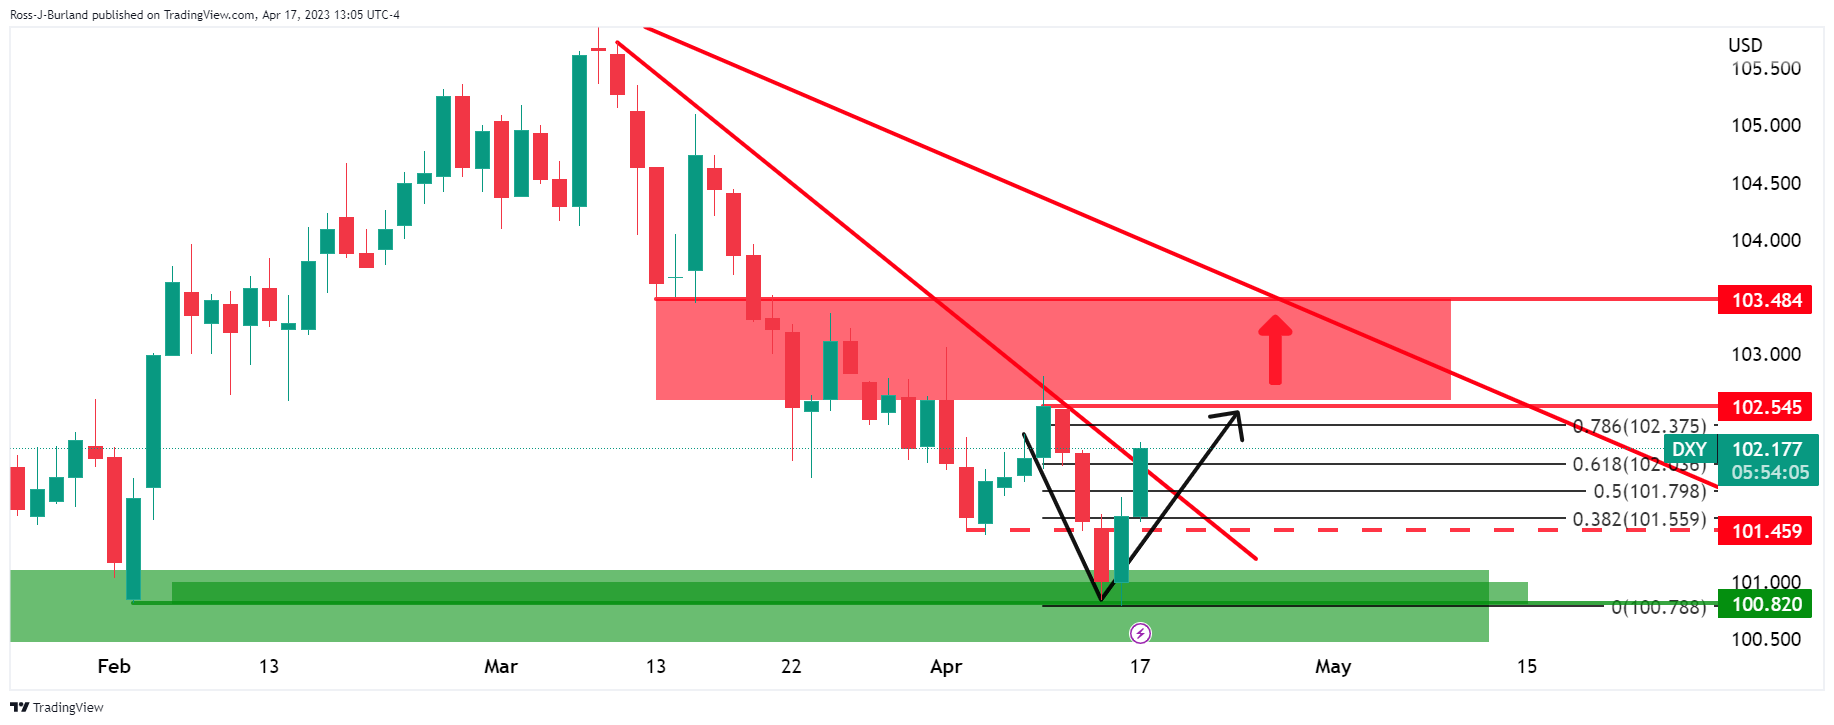
The EUR/USD pair is continuously declining for the past two trading sessions after failing to sustain above the critical resistance of 1.1050. The major currency pair is expected to extend its downside to near 1.0900 as investors are supporting the US Dollar Index (DXY) on expectations of one more rate hike announcement from the Federal Reserve (Fed).
The USD Index has shown a minor correction after printing a fresh three-day high of 102.22 as Fedfunds market is conveying that one more rate hike cannot be ruled out despite easing labor market conditions and softening United States inflation. President and CEO of the Federal Reserve Bank of Richmond Thomas Barkin said that he wants to see more evidence of inflation settling back to target.
Meanwhile, S&P500 futures have turned subdued in the Asian session after settling Monday’s session on a positive note. Market sentiment is still positive but a stock-specific action is highly observed amid the quarterly result season.
The Euro witnessed extreme selling pressure as investors are divided about the pace of hiking interest rates by the European Central Bank (ECB). Also, ECB policymaker Martins Kazaks said on Monday, the central bank has the option of 25 basis points (bps) or 50 bps move in May.
However, Bloomberg looks confident after a survey from economists, showing that a majority of them expect the European Central Bank (ECB) to hike rates by 25 basis points (bps) at its May, June, and July policy meetings before pausing its tightening cycle. “That would take the deposit rate to 3.75%, where it would stay through the rest of the year.”
Another report from Bloomberg showed that the Eurozone economy is facing the danger of a lending squeeze following the recent banking turmoil, according to the continent’s largest pension services provider.
Thijs Knaap, a chief economist at Netherlands-based APG Asset Management, said, “The risk of a credit crunch is there and it certainly increased” after the collapse of several US regional banks and the emergency takeover of Credit Suisse Group AG, reported Bloomberg.
The comments are markedly less optimistic than statements from some European Central Bank officials, who are hopeful that the 20-nation eurozone can emerge from the financial sector turbulence with little damage and continue raising interest rates.
-
23:25
USD/CAD rebounds prods 1.3400 amid firmer USD, downbeat Oil price, Canada inflation, BoC’s Macklem eyed
- USD/CAD grinds higher after two-day rebound from the lowest levels since mid-February.
- US Dollar cheers hawkish Fed bets, upbeat yields to extend previous week’s recovery.
- Firmer greenback, fears of economic recovery and anxiety ahead of key China data weigh the Oil price.
- Canada CPI, BoC Governor Macklem’s speech eyed for clear directions.
USD/CAD bulls take a breather around the 1.3400 round figure as they await the key Canada inflation data and a speech from Bank of Canada (BoC) Governor Tiff Macklem. That said, the Loonie pair rose in the last two consecutive days while bouncing off the lowest levels since mid-February.
While tracing the clues, the US Dollar’s broad recovery on the back of firmer US Treasury bond yield and hawkish Fed bets joins the fall in the WTI crude Oil price, Canada’s main export item, could be lined as the key catalysts.
On Monday, the NY Empire State Manufacturing Index jumped to 10.8 for April while snapping the four-month downtrend, as well marking the highest level since July last year. Further, the US National Association of Home Builders (NAHB) housing market index also rose for the fourth consecutive month in April to 45, versus 44 expected and prior reading.
Further, Richmond Fed President Thomas Barkin said on Monday that he wants to see more evidence of inflation settling back to target. The policymaker also added that he feels reassured by what he is seeing in the banking sector.
US Dollar Index (DXY) stretched Friday’s rebound from a one-year low as upbeat US data and hawkish Fed talks joined the increasing odds of another Fed rate hike in May, as well as a reduction in the market’s bets suggesting a rate cut in later 2023. The same could be true for the US Treasury bond yields as the US 10-year and two-year bod coupons printed three-day uptrend to 3.60% and 4.20% respectively.
On the other hand, WTI Crude Oil dropped around 2.0% to the lowest levels in a week, pressured near $80.85 by the press time, as hawkish Fed bets and a firmer US Dollar challenges energy demand. Also exerting downside pressure on the black gold could be the latest doubt on China’s economic recovery.
Also read: WTI falls over 2% on fears of Fed’s tightening plan, broad US Dollar strength
Looking forward, Canada’s Consumer Price Index (CPI) for March and BoC CPI for the said month will be important to watch for clear directions as BoC Governor Tiff Macklem showed readiness to renew rate hike trajectory if needed. That said, BoC Governor Macklem is also up for a speech later in the day and will be eyed closely for fresh impetus. Additionally, the US Housing Starts and Building Permits for March will also be important to watch.
Technical analysis
200-DMA and a one-month-old descending resistance line, respectively near 1.3405 and 1.3415, restricts short-term USD/CAD upside. However, recently firmer oscillators favor the Loonie pair bulls.
-
23:03
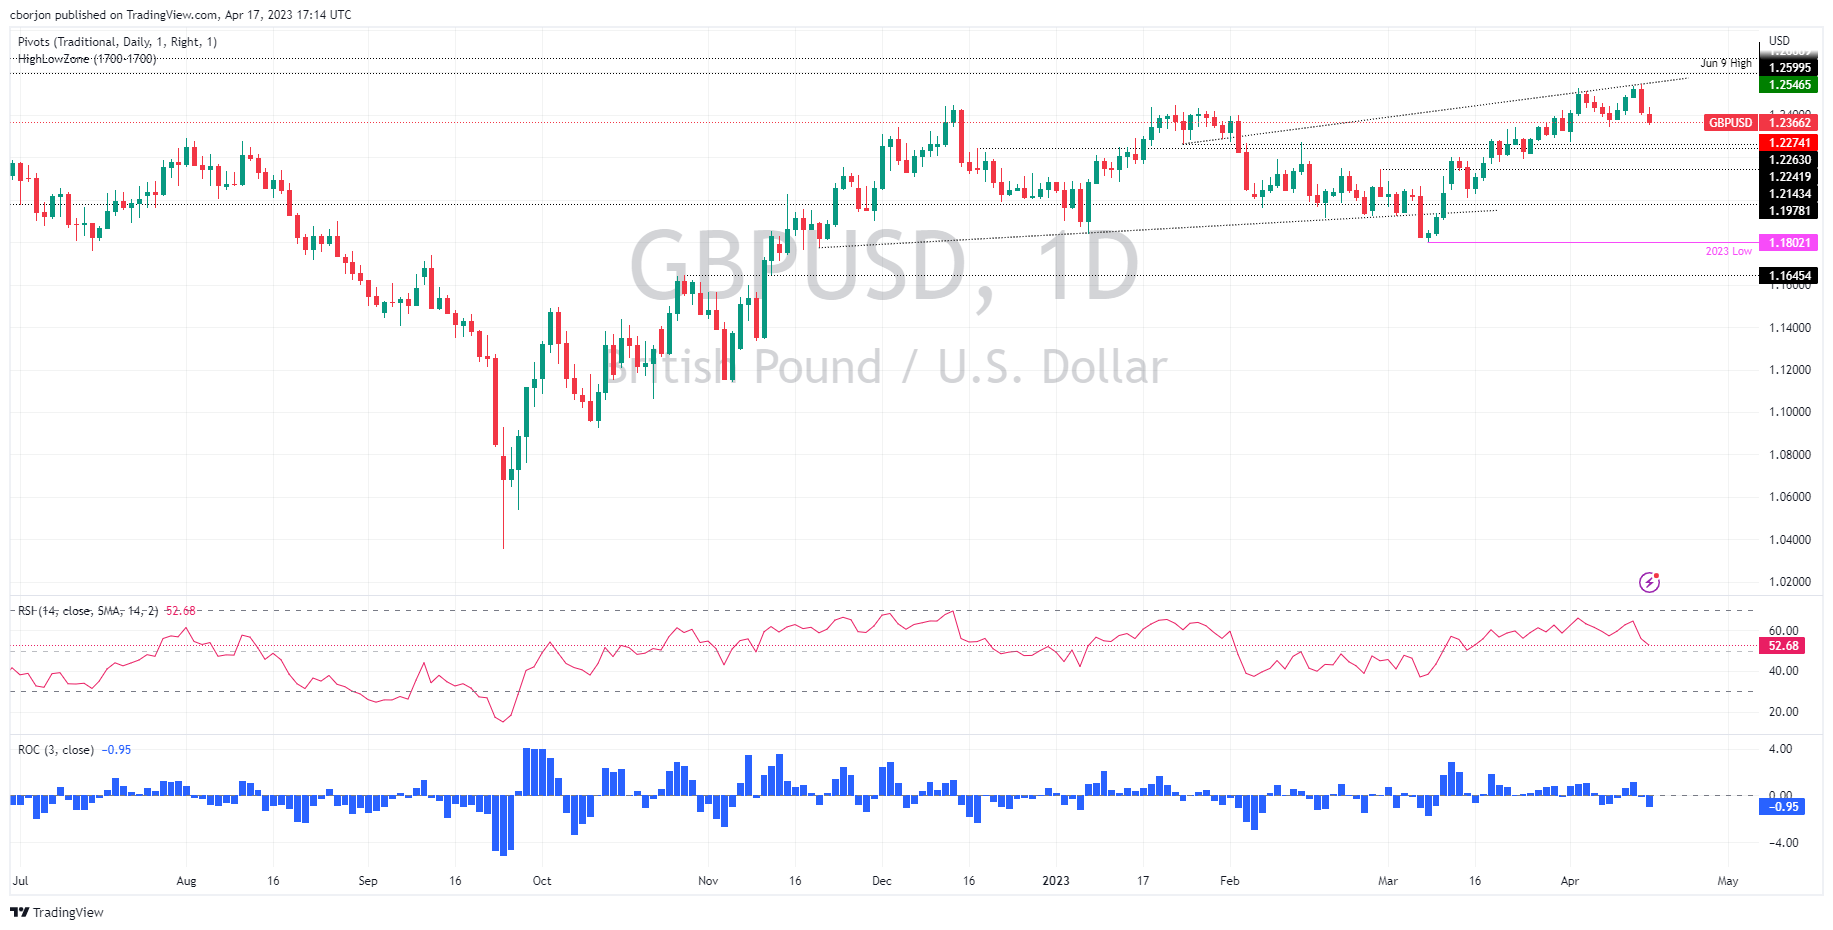
GBP/USD Price Analysis: Bears attack 21-DMA below 1.2400 as UK Employment data looms
- GBP/USD remains pressured around one-week low after declining in the last two consecutive days.
- Clear break of three-week-old ascending support line bearish MACD signals favor Cable sellers.
- Likely increase in UK Claimant Count Change for April may also weigh on GBP/USD price.
- Buyers need validation from 1.2435; convergence of 100, 50 DMA appears a tough nut to crack for bears.
GBP/USD holds lower grounds near 1.2375 as bears flirt with seven-day bottom ahead of the key UK employment report on Tuesday. That said, the Cable pair dropped in the last two consecutive days.
Also read: GBP/USD falls on US Dollar strength amid Fed rate hike speculations
It should be noted that the quote’s clear downside break of an upward-sloping support line from March 24, now immediate resistance near 1.2435, joins bearish MACD signals to lure the GBP/USD bears ahead of the key UK statistics. However, the 21-DMA challenges the pair sellers around 1.2375 of late.
With this, the Cable pair is likely to break the immediate DMA support and can drop further toward the 1.2300 round figure. Though, a convergence of the 100-DMA and the 50-DMA, close to 1.2190 can challenge the pair sellers afterward.
It’s worth observing that February’s high of around 1.2270 can act as an intermediate halt between the 21-DMA and the aforementioned DMA convergence.
On the flip side, the GBP/USD pair’s clear recovery beyond 1.2435 support-turned-resistance will need validation from January’s high of around 1.2450.
Even so, a three-month-old upward-sloping resistance line, near 1.2545 can restrict the quote’s further upside.
GBP/USD: Daily chart

Trend: Further downside expected
-
23:02
AUD/USD remains sideways around 0.6700 ahead of RBA minutes and China’s GDP
- AUD/USD has continued its sideways performance around 0.6700 as investors await RBA minutes.
- The demand for US government bonds dented significantly as investors are eyeing one more rate hike from the Fed.
- The RBA could sound hawkish in coming sessions as Australian job market data remained resilient in March.
The AUD/USD pair has continued its sideways auction in the early Asian session around 0.6700. The Aussie asset remained lackluster on Monday despite a decent upside in the US Dollar Index (DXY). A back-and-forth action might continue in the Aussie asset ahead of the release of the Reserve Bank of Australia (RBA) minutes and Chinese Gross Domestic Product (GDP) data.
S&P500 ended Monday’s session on a positive note led by a recovery in banking stocks. A stock-specific action has been witnessed in US equities amid the quarterly result season. The US Dollar Index (DXY) extended its upside journey to near 102.20 in hopes of more rate hikes from the Federal Reserve (Fed) despite the sheer softening of United States inflation.
The demand for US government bonds dented significantly as chances of one more rate hike are above 86%, according to the CME Fedwatch tool. Therefore, the yields offered on 10-year US Treasury bonds rose firmly above 3.60%.
A power-pack action is expected from the Australian Dollar amid the release of the RBA minutes, which will provide a detailed explanation behind keeping interest rates unchanged.
RBA Governor Philip Lowe could sound hawkish in coming sessions as Australian Employment (March) data showed higher than anticipated additions of fresh talent last week. Also, the Unemployment Rate dropped to 3.5%. This could force the RBA to reconsider its unchanged policy stance.
On Tuesday, investors will also focus on China’s Gross Domestic Product (GDP) (Q1) data. According to the estimates, the Chinese economy has expanded by 2.2% vs. a stagnant performance shown in the last quarter of CY2022. On an annual basis, the economy is expanded by 4.0% against a 2.9% growth rate recorded earlier. It is worth noting that Australia is the leading trading partner of China and higher Chinese GDP data would support the Australian Dollar.
-
22:56
WTI falls over 2% on fears of Fed’s tightening plan, broad US Dollar strength
- Waller’s comments on monetary policy tightening send shockwaves through T-bond, Dollar, Gold, and WTI markets.
- China’s Q1 GDP, Industrial Production, and Retail Sales release to test the reality of the global economic outlook.
- WTI Price Analysis: Remains in consolidation mode, with traders watching for potential breakouts above $82.09 or below $80.00.
Western Texas Intermediate (WTI) slid almost $2.00 on Monday as traders brace for additional tightening by the US Federal Reserve (Fed). Therefore, the greenback advanced against most commodities, and in the FX space, against most G10 currencies. At the time of writing, WTI is trading at $80.92 a barrel, down more than 2%.
Fed official’s comments boost the US Dollar as oil traders wait for China’s data
Sentiment shifted sour on expectations that the Fed will hike rates at the May 3 decision. Hence, the greenback advanced, as shown by the US Dollar Index, up 0.51% at 102.101. After reaching a YTD high of $83.46, WTI lost 3% after the Organization of Petroleum Exporting Countries (OPEC) announced the cuts of crude oil output.
The prospects for additional interest rate increases of the Fed had arisen and hurt WTI’s price. During the week, Federal Reserve officials in the names of New York Fed President John Williams, Governors Michelle Bowman, Lisa Cook, and Christopher Waller would be the latest policymakers to cross newswires before Fed officials enter the blackout period.
Waller’s comments last Friday spurred a jump in US T-bond yields, the US Dollar, and tumbled Gold and WTI prices. Waller commented that we “haven’t made much progress,” adding, “Monetary policy needs to be tightened further.”
Meanwhile, although the global economic outlook looks bright regarding China’s reopening, it would have a test of reality with the release of China’s Q1 Gross Domestic Product (GDP), March’s Industrial Production, and Retail Sales.
WTI Technical Analysis
After gapping up six dollars during the last week, WTI remains trading sideways, though it encountered solid support at $80.00 per barrel. However, downside risks remain below the latter, with the 200-day Exponential Moving Average (EMA) lying above the current price at $82.09 PB, a zone protected by sellers. But a break below $80.00 could expose the confluence of several EMAs, at the $78.20-90 area, before dropping towards the 50-day EMA At 76.93.
-
22:51
NZD/USD Price Analysis: Bulls and bears engaged at critical dialy support
- NZD/USD bears are in the market testing key support.
- A break lower will open the risk of a sell-off towards 0.6150.
NZD/USD has been in the hands of the bears this week as the US Dollar firms on hawkish Federal Reserve sentiment. The bulls will be in the clear, at least momentarily, if they can get back above 0.6220, but the pressure is on as follows:
NZD/USD daily chart

NZD/USD is rested at a key support area with a break of 0.6180 eyed for the day ahead as the following four-hour chart illustrates:
NZD/USD H4 chart
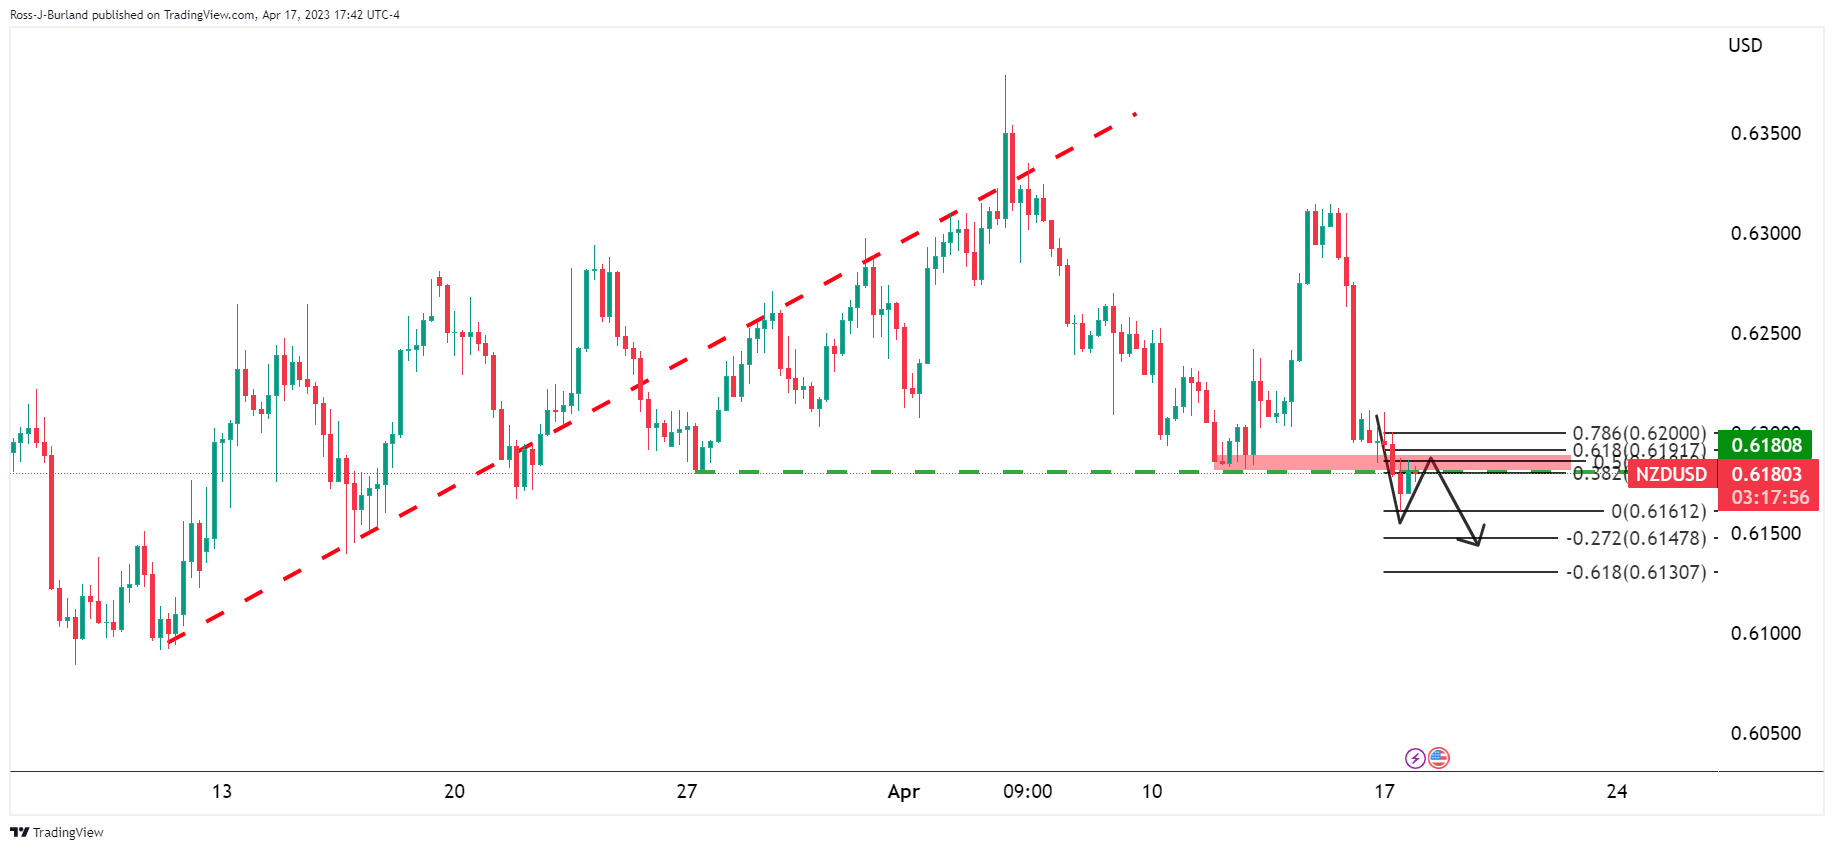
The bears are in the market and eye a break to the downside given the broken structure with 0.6150 eyed.
-
22:20
Gold Price Forecast: XAU/USD bulls are guarding a key daily support area
- Gold price is testing critical support near $1,980.
- The US Dollar is bouncing back and pressuring the yellow metal.
Gold price has fallen from a high of $2,015.07 to a low of $1,981.19 on the day amid the rebound in the US Dollar as the hawks move back in over the sentiment surrounding the Federal Reserve again.
Federal Reserve´s Governor Christopher Waller said that despite a year of aggressive rate increases, the Fed "hasn't made much progress" in returning inflation to their 2% target and argued that rates still need to go up. We also had consumer spending for the past quarter, and the April survey of business activity in New York state rising for the first time in five months, the US Dollar gained 0.6%. This is making greenback-bullion less attractive for overseas buyers, while benchmark Treasury yields climbed to a more than two-week high.
On Monday, President and CEO of the Federal Reserve Bank of Richmond Thomas Barkin explained that he wants to see more evidence of inflation settling back to target. Barkin also said he feels reassured by what he is seeing in the banking sector. Meanwhile, Fed funds futures are showing that the expectations that the Fed will start cutting rates later this year have been pushed back to November from September, with a smaller cut now expected also.
Gold positioning analysis
´´While the gold price previously held the most competitive risk-return characteristics on our screen, we now see elevated risks of a tactical retreat.,´´ analysts at TD Securities explained. ´´After all,´´ they say, ´´the substantial inflows tied to notable CTA long acquisitions and discretionary short covering are now grinding to a halt. CTA positioning has nearly effectively reached 'max long', and our estimates of discretionary flows still suggest that this cohort has yet to buy into the rally, suggesting that one of the main engines of the recent rally is now sputtering.´´
The analysts went on to talk of China´s holdings and developments there:
´´Evidence of notable accumulation of gold in Shanghai is reassuring for the bulls, but Shanghai positioning is now nearing local highs. That leaves physical markets in control once more, where lackluster demand in India and only modest improvements in wholesale demand in China suggest the risk of a tactical retreat in precious metals continues to grow. Still, CTA outflows are only expected below the $1960/oz range, suggesting that a catalyst may be required before more substantial outflows ensue.´´
Gold technical analysis
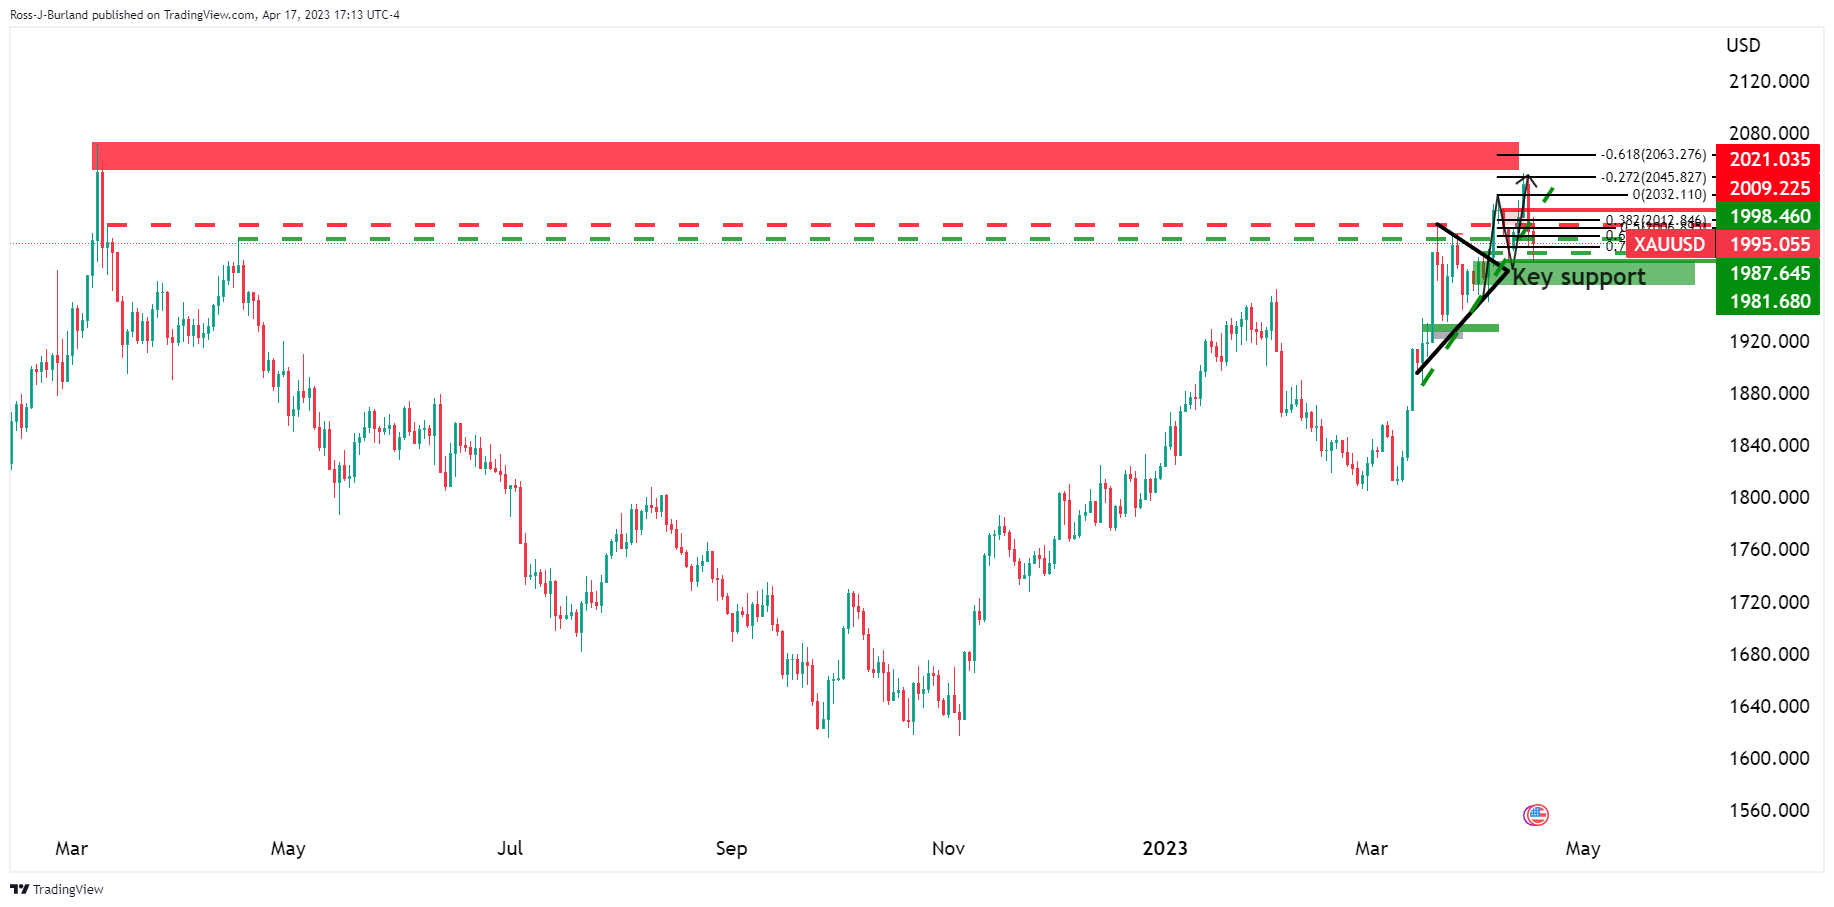
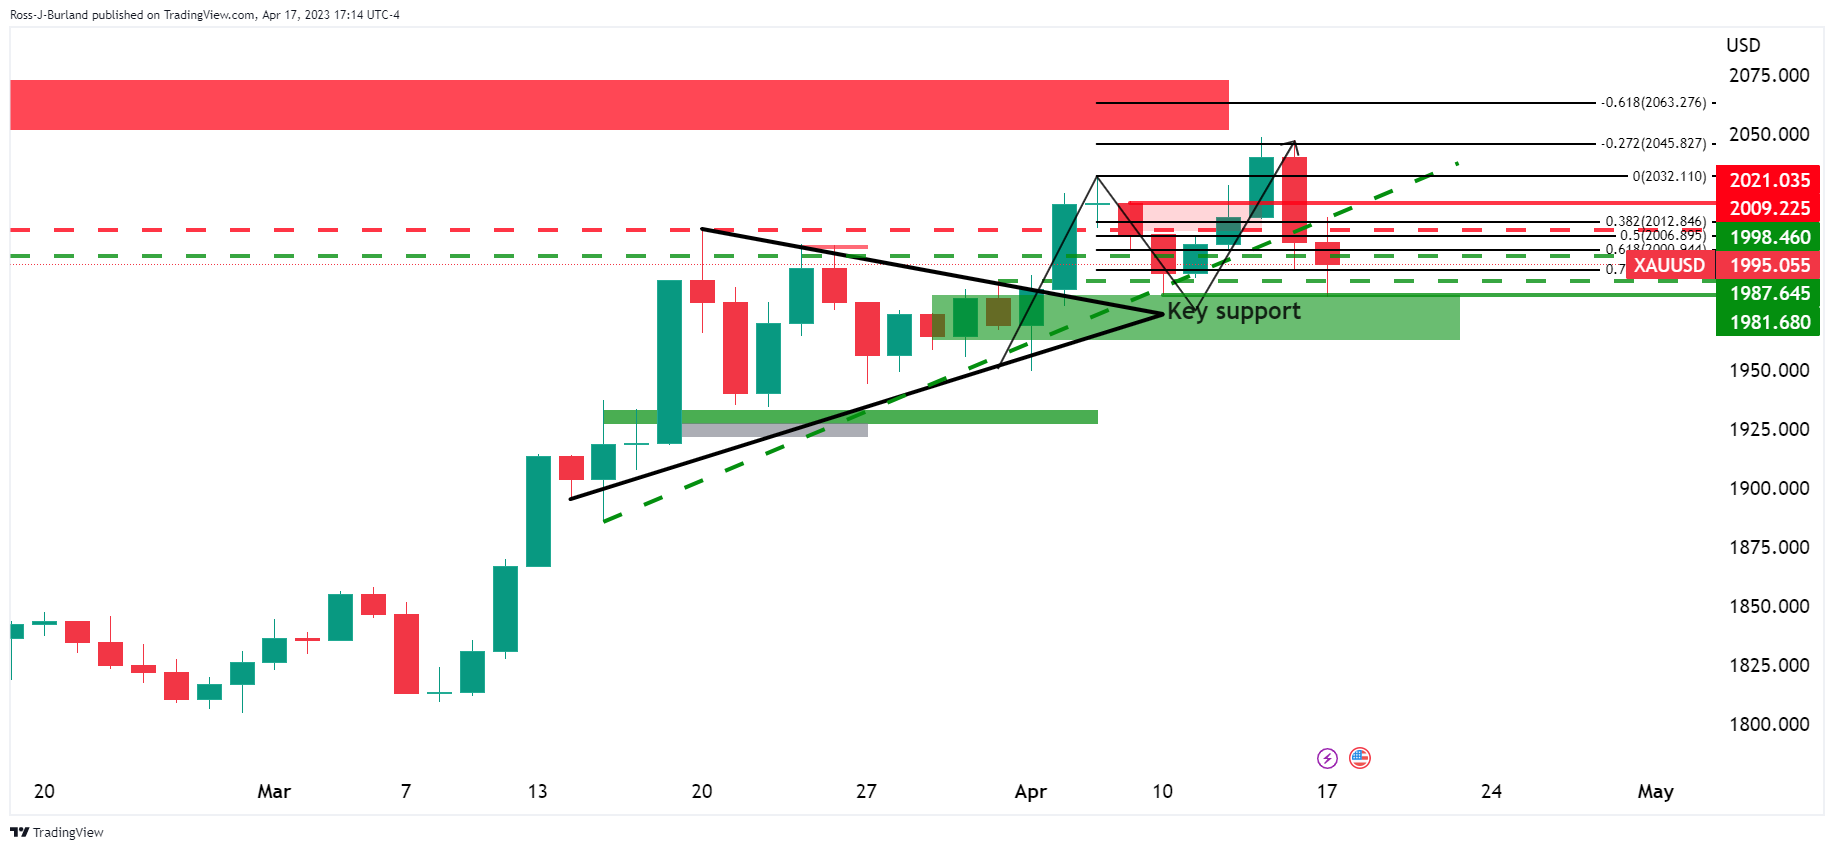
Gold price is back into the barroom brawl and the bulls are defending the key support area near $1,980.
-
21:44
Forex Today: US Dollar strengthens further, RBA minutes and China’s GDP next
Tuesday will be a busy day in terms of economic data in an overall light week. Early, the Reserve Bank of Australia will release the minutes of its latest meeting and then China will report Q1 growth numbers. Will the US Dollar extend its recovery?
Here is what you need to know on Tuesday, April 18:
The US Dollar Index rose for the second day in a row on Monday amid increasing odds of another rate hike from the Federal Reserve (Fed) at the May meeting and as bets for rate cuts later in 2023 diminished. Data from the US surpassed expectations, with the Empire Manufacturing Index at 10.8 in April, showing a significant improvement. On Tuesday, the US reports Housing Starts and Building Permits.
A late rally in Wall Street pushed equity indexes to positive ground. The Dow Jones gained a hundred points or 0.30%, the Nasdaq rose by 0.28% and the S&P 500 rose 0.33%. US yields jumped, posting the highest close in weeks across the curve and boosting USD/JPY, which rose to 134.50, the highest in over a month.
EUR/USD dropped for the second straight day but stayed above 1.0900. The Euro lagged on Monday, with EUR/GBP ending a four-day positive streak. The German ZEW Survey is due on Tuesday.
GBP/USD broke below 1.2400, reaching weekly lows, and settled around the 20-day Simple Moving Average (SMA) at 1.2375. On Tuesday, the UK will release employment numbers.
USD/CAD peaked at 1.3420, surpassing the 200-day SMA momentarily and then pulled back to 1.3390. In Canada, critical March Consumer Price Index (CPI) data is due on Tuesday, with a decline expected in the annualized rate from 5.2% to 4.3%.
NZD/USD found support at the 200-day SMA at 0.6156 and bounced modestly to the upside. The pair is moving with a bearish bias, but losses seem limited while above 0.6150.
AUD/USD slid further, reaching levels under 0.6700 and is back into a familiar range. The Reserve Bank of Australia (RBA) will release the minutes of its latest meeting when it decided to pause its tightening cycle.
Gold tumbled on Monday amid higher US yields and a stronger US Dollar and bottomed at $1,980, reaching a weekly low. Silver lost 1.50%, falling below $25.00. Crude oil prices shed around 2%, with WTI falling to six-day lows near $80.00.
Bitcoin suffered the worst decline in a week, falling to $29,150, the lowest level in six days. Ethereum lost 1.75% and it was trading at $2,085.
Like this article? Help us with some feedback by answering this survey:
Rate this content -
21:34
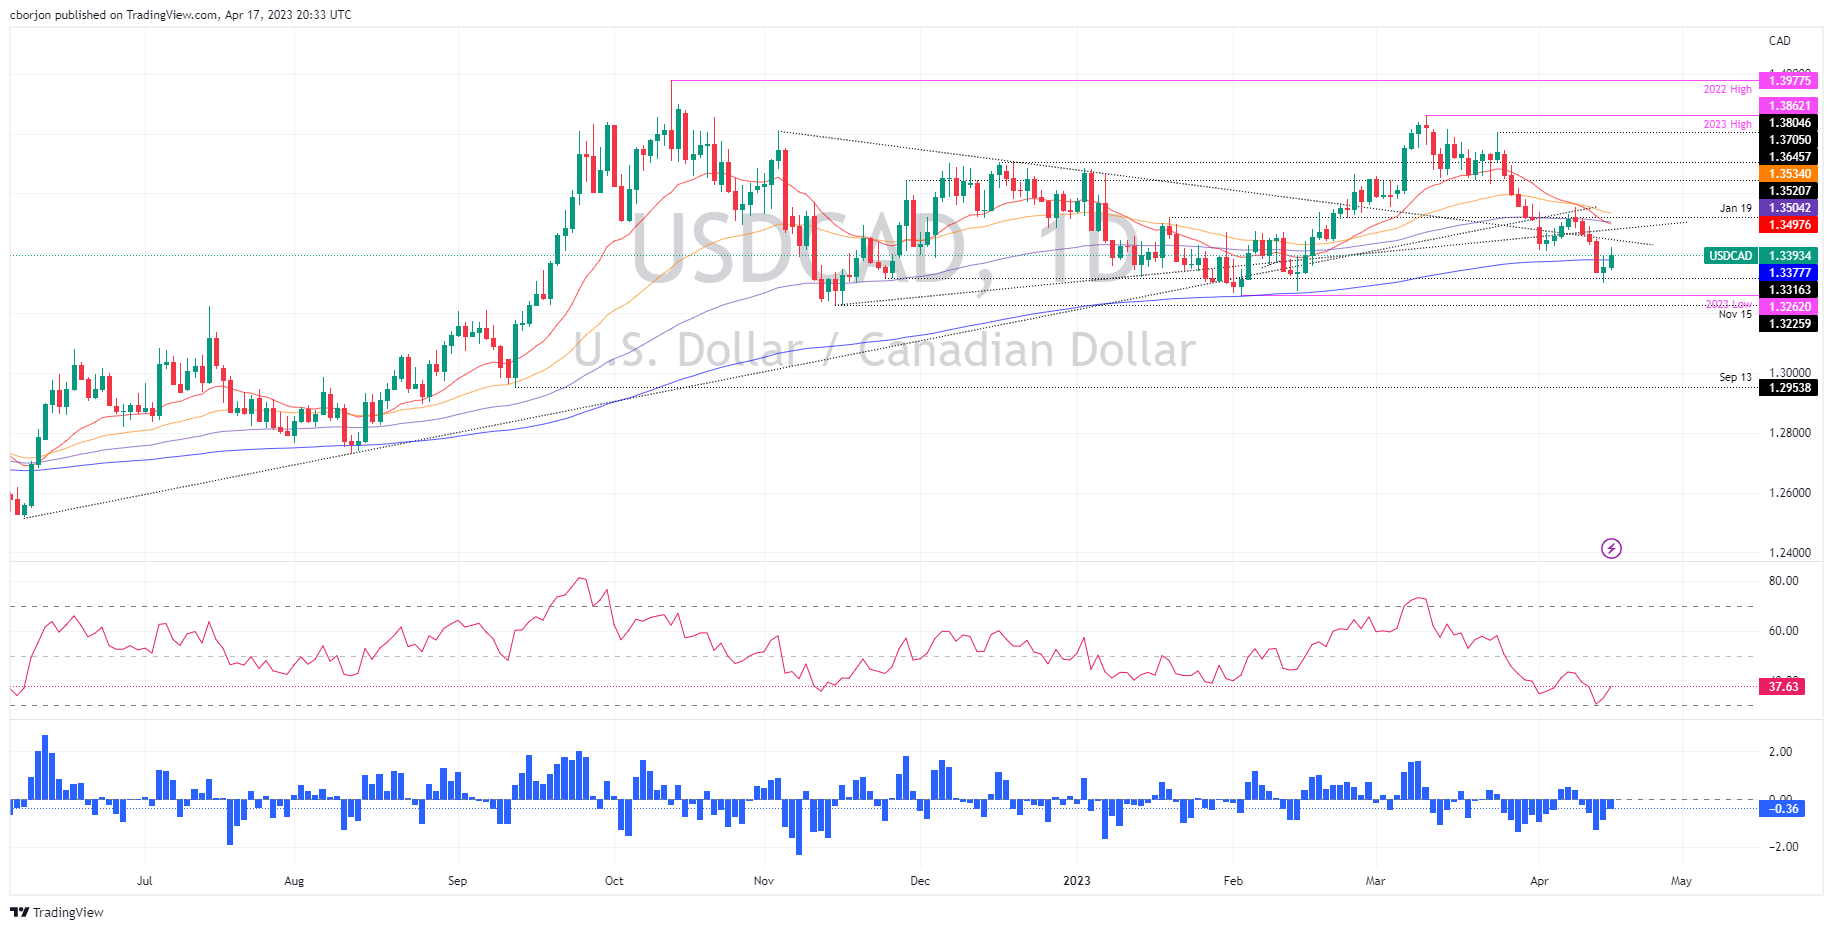
USD/CAD Price Analysis: Shows signs of recovery, trades above the 200-DMA
- USD/CAD rises above the 200-day EMA but struggles to crack 1.3400.
- Upside risks for the USD/CAD lie above 1.3400, which can trigger a rally toward 1.3500.
- USD/CAD failure to crack 1.3400 could pave the way for further losses.
The USD/CAD advances after bottoming last Friday at around 1.3300; the pair bounces off and hovers nearby the 1.3400 figure after reaching a high of 1.3420. At the time of writing, the USD/CAD is trading at 1.3395 and is gaining 0.31%.
The USD/CAD dove to new 8-week lows at 1.3300, spurring an increase in the greenback’s demand, even though the Bank of Canada (BoC), in its latest monetary policy, announced the BoC Governing Council discussed raising rates. Nevertheless, current expectations for additional Fed tightening bolstered the US Dollar.
USD/CAD Price Action
Given the backdrop, the USD/CAD is still neutral to downward biased, but it’s testing the upper boundaries of the 200-day Exponential Moving Average (EMA) at 1.3377. In addition, a daily close of the USD/CAD pair above the latter could exacerbate another leg-up in the pair, initially towards a downslope resistance trendline drawn from November 2022 highs that pass around the 1.3430-50 area. But firstly, the USD/CAD buyers need to reclaim 1.3400.
If USD/CAD cracks the 1.3400 figure, the next resistance would be the trendline mentioned above at 1.3430-50. Once cleared, the USD/CAD could threaten the confluence of the 20 and 100-day EMAs, around 1.3497-1.3504, before rallying towards the 50-day EMA At 1.3534.
Conversely, if USD/CAD stays below 1.3400, that could open the door for further downside. That said, the first support would be the 200-day EMA at 1.3377, followed by the April 17 low at 1.3342, before aiming toward the 1.3300 figure.
USD/CAD Daily Chart
USD/CAD Technical Levels
-
21:00
United States Total Net TIC Flows below forecasts ($197.6B) in February: Actual ($28B)
-
21:00
United States Net Long-Term TIC Flows below expectations ($101.9B) in February: Actual ($71B)
-
20:46
USD/CHF Price Analysis: Bears prowl below trendline resistance
- USD/CHF bulls and bears battle it out below trendline resistance.
- From a 4-hour perspective, 0.9020, 0.9060 and 0.9120 are key milestones.
As per the prior analysis, USD/CHF Price Analysis: Bullish correction eyed, but bears to commit below 0.9150, the bears moved into the market following the correction and the following will illustrate that a downside bias still remains.
USD/CHF prior analysis
Meanwhile, the daily chart showed that the bears had broken structure as follows:
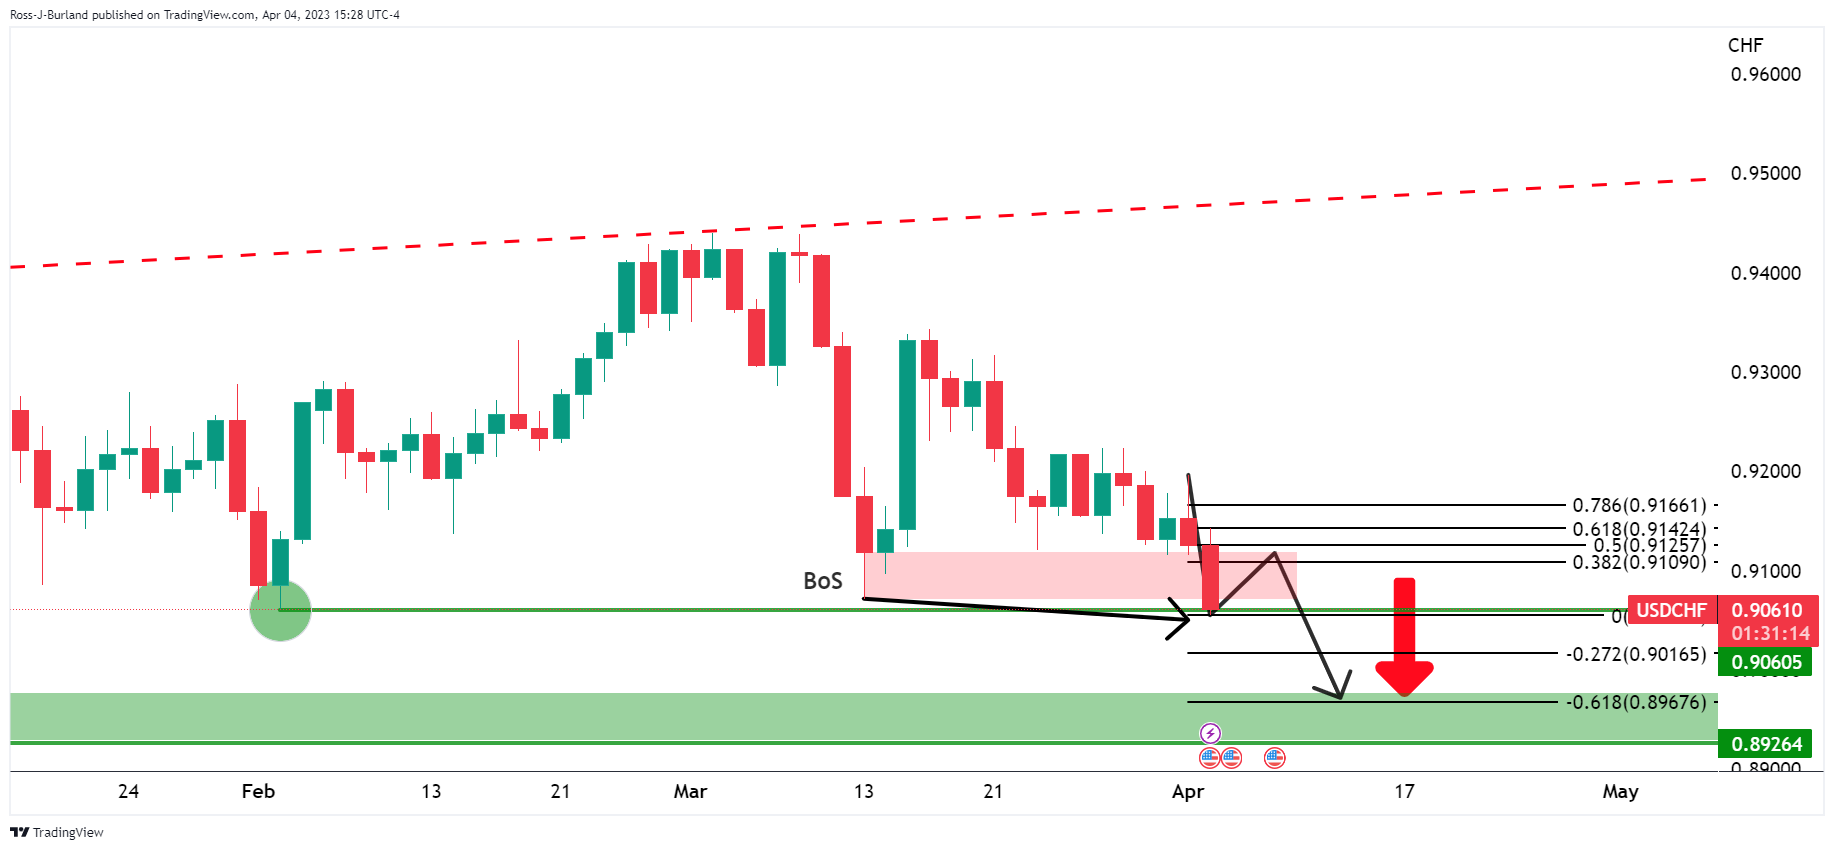
The bears were meeting prior support of 0.9060 and had pierced the level to 0.9055. It was argued that a correction could be due but explained that once the bears committed below 0.9150, the likelihood would be for a downside continuation as per the weekly support area.
USD/CHF update
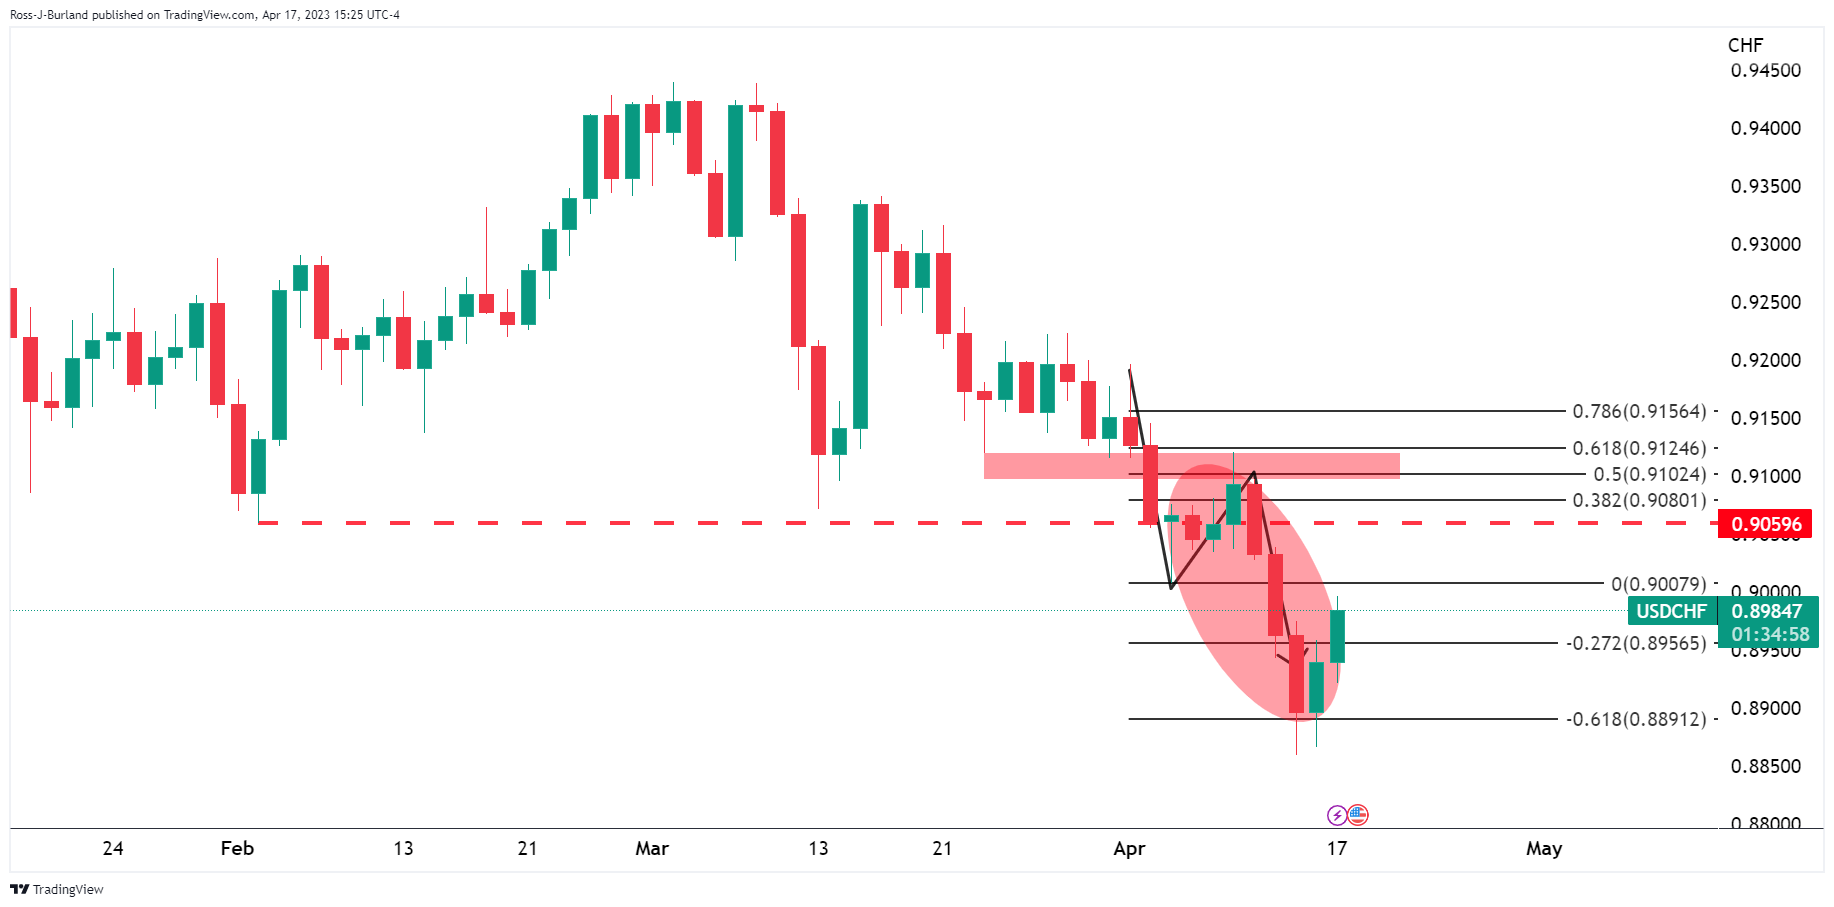
As illustrated, the price has continued lower as forecasted, and given that it remains on the front side of the downtrend, the bais stays bearish for the foreseeable future:
USD/CHF live daily chart

With that being said, there is still room for the upside into the trendline resistance.
USD/CHF H4 chart
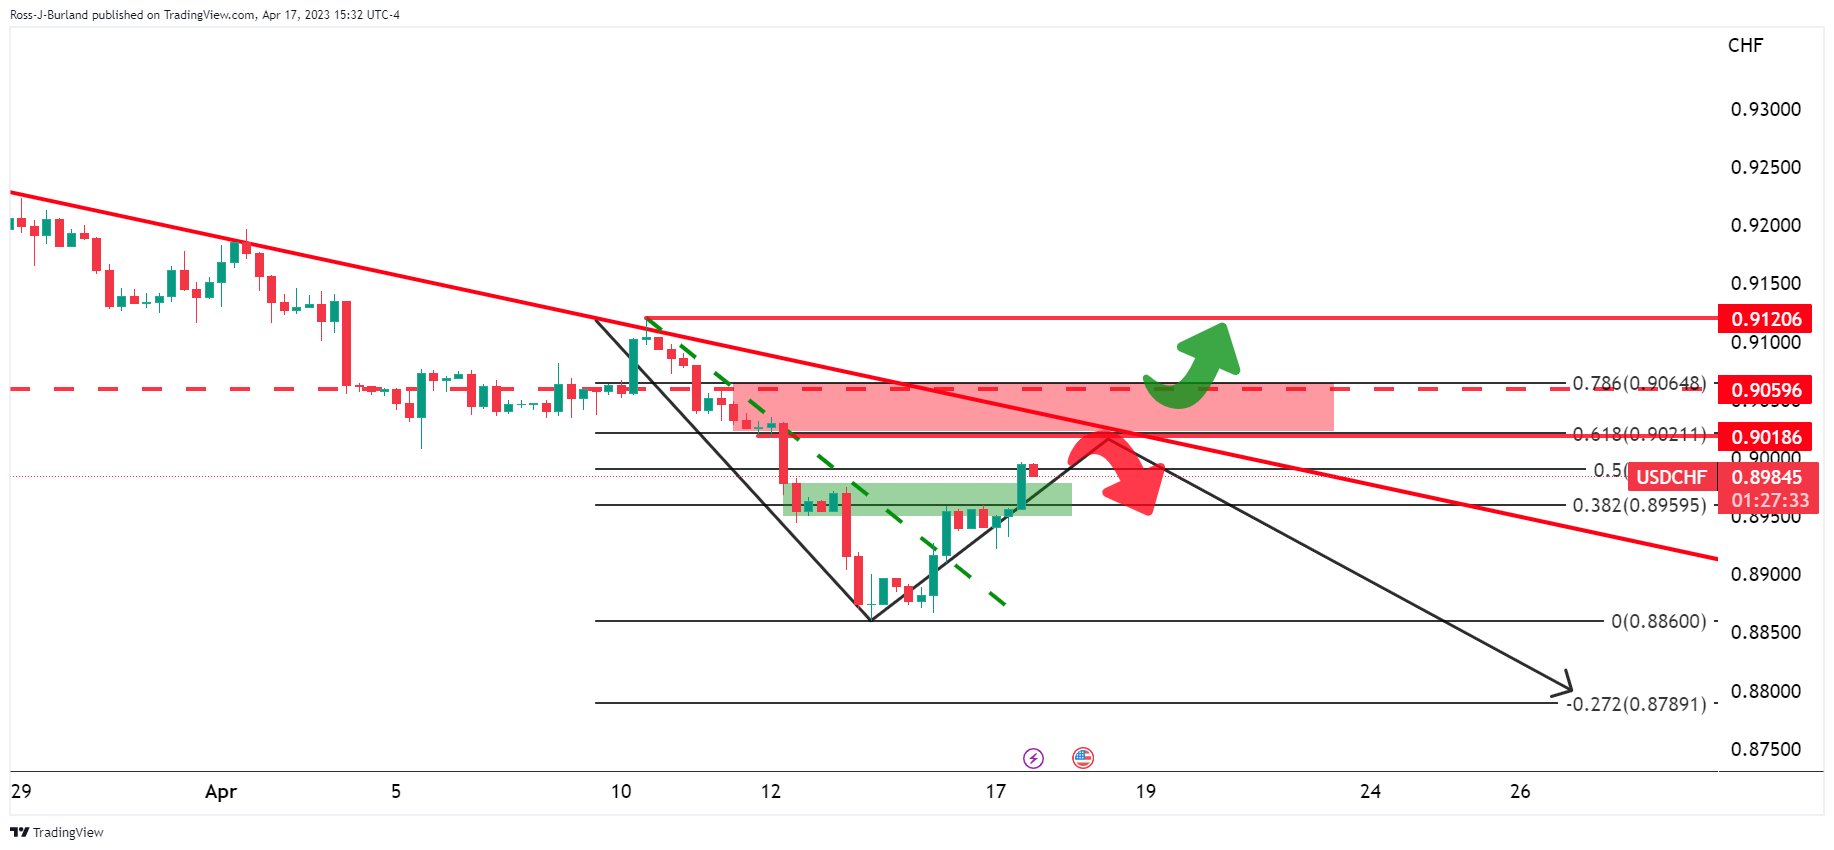
From a 4-hour perspective, 0.9020, 0.9060 and 0.9120 are key milestones.
-
19:49
USD/MXN soars above 18.0000 as Fed hints more hikes; rate cut expectations pushed back
- Risk-off impulse triggered outflows from the emerging market Mexican Peso, boosting the US Dollar.
- The NY Fed Manufacturing Index climbed as business conditions improved.
- USD/MXN Price Analysis: Downward biased, but it could aim towards 18.7000 if it clears 18.2000.
The USD/MXN advances as the Mexican Peso (MXN) weakens, courtesy of hawkish commentary by Federal Reserve (Fed) officials. Increasing woes that the Fed would keep tightening monetary conditions, alongside investors pushing back the first rate cut to November 2023, augmented US Dollar demand. At the time of writing, the USD/MXN is trading at 18.0755 after hitting a low of 17.9142.
Investors favor US Dollar with a potential Fed rate hike and Banxico’s easing
Investors’ sentiment deteriorated as the US Dollar (USD) advanced. Traders seeking safety bought the US Dollar, as shown by its US Dollar Index (DXY). The DXY, which tracks the American Dollar value against a basket of six currencies, extends its gains, up 0.56%, at 102.140.
Expectations for the upcoming May meeting of the US Federal Reserve, the CME FedWatch Tool, foresees an 88.7% chance for a 25 bps rate hike to the 5.00% - 5.25% range.
Earlier, a report by the New York Fed revealed that manufacturing activity in the region unexpectedly expanded in April due to a jump in new orders and shipments. The Empire State Manufacturing Index advanced 10.8, above estimates for a -18 plunge. The poll highlighted that factories were more optimistic about general business conditions.
On the Mexican front, a light economic calendar keeps traders leaning on the latest monetary policy decision by the Bank of Mexico (Banxico), which raised rates by “only” 25 bps to 11.25% after a series of 50 and 75 bps rate hikes to the TIIE. Banxico’s moderated the pace of interest-rate increases as the institution is near to end of its tightening cycle.
The latest inflation data in Mexico witnessed a deceleration from 7.62% in February to 6.85% in March. However, the core reading remained above 8%, at 8.09%, from the prior’s month 8.29%, proving to be stickier than foreseen.
What to watch?
The Mexican economic docket is empty. On the other hand, the US calendar would feature housing data alongside additional Fed speakers crossing newswires.
USD/MXN Technical Analysis

From a technical analysis perspective, the USD/MXN is still downward biased. However, the recent leg-up could put up a test to the 20-day Exponential Moving Average (EMA) at 18.1929, which, once cleared, could exacerbate a rally, initially to the 50-day EMA at 18.4035. A breach of the latter and the USD/MXN pair will continue higher towards the 100-day EMA at 18.7272. On the contrary, a fall below 18.0000 can open the door for a re-test of the YTD low at 17.8968.
-
19:22
Silver bulls are lining up as the US Dollar hits a 61.8% Fibo area
- Silver is holding up in support but within a firmer US Dollar environment.
- Bulls are lurking in support as US Dollar takes on a 61.8% Fibo.
Spot silver XAG/USD fell to $24.8090 per ounce on Monday but has since recovered some ground to $24.9816 currently but remains well below the highs of the day of $25.6080. The drop comes amid a revival of the US Dollar bulls and hawkish sentiment surrounding the Federal Reserve again.
While investors looked for cues on whether the market will see a 'one and done' rate hike by the U.S. Federal Reserve in May, on Friday, to the contrary, Federal Reserve´s Governor Christopher Waller said that despite a year of aggressive rate increases, the Fed "hasn't made much progress" in returning inflation to their 2% target and argued that rates still need to go up. With a combination of firm consumer spending for the past quarter, and the April survey of business activity in New York state rising for the first time in five months, the US Dollar gained 0.6%. This is making greenback-priced precious metals less attractive for overseas buyers, while benchmark Treasury yields climbed to a more than two-week high.
Moreover, Fed funds futures are showing that the expectations that the Fed will start cutting rates later this year have been pushed back to November from September, with a smaller cut now anticipated also.
With a relatively light calendar for the rest of the week, investors will focus on US flash PMIs for April and any further comments from Fed officials before they enter into a blackout period from April 22 ahead of the Fed's May 2-3 meeting. In this regard, analysts at TD Securities said the S&P PMIs for early April will offer a first comprehensive look at the state of the US economy post-banking turmoil. ´´Note that the March data was not clearly impacted by banking jitters, but perhaps it was too soon to be reflected: both the mfg and services PMIs registered their third consecutive increase then, with the latter advancing further into expansion territory.´´
As for Fed speakers, we have heard from President and CEO of the Federal Reserve Bank of Richmond Thomas Barkin so far who has stated that he wants to see more evidence of inflation settling back to target. Barkin also said he feels reassured by what he is seeing in the banking sector.
Silver technical analysis
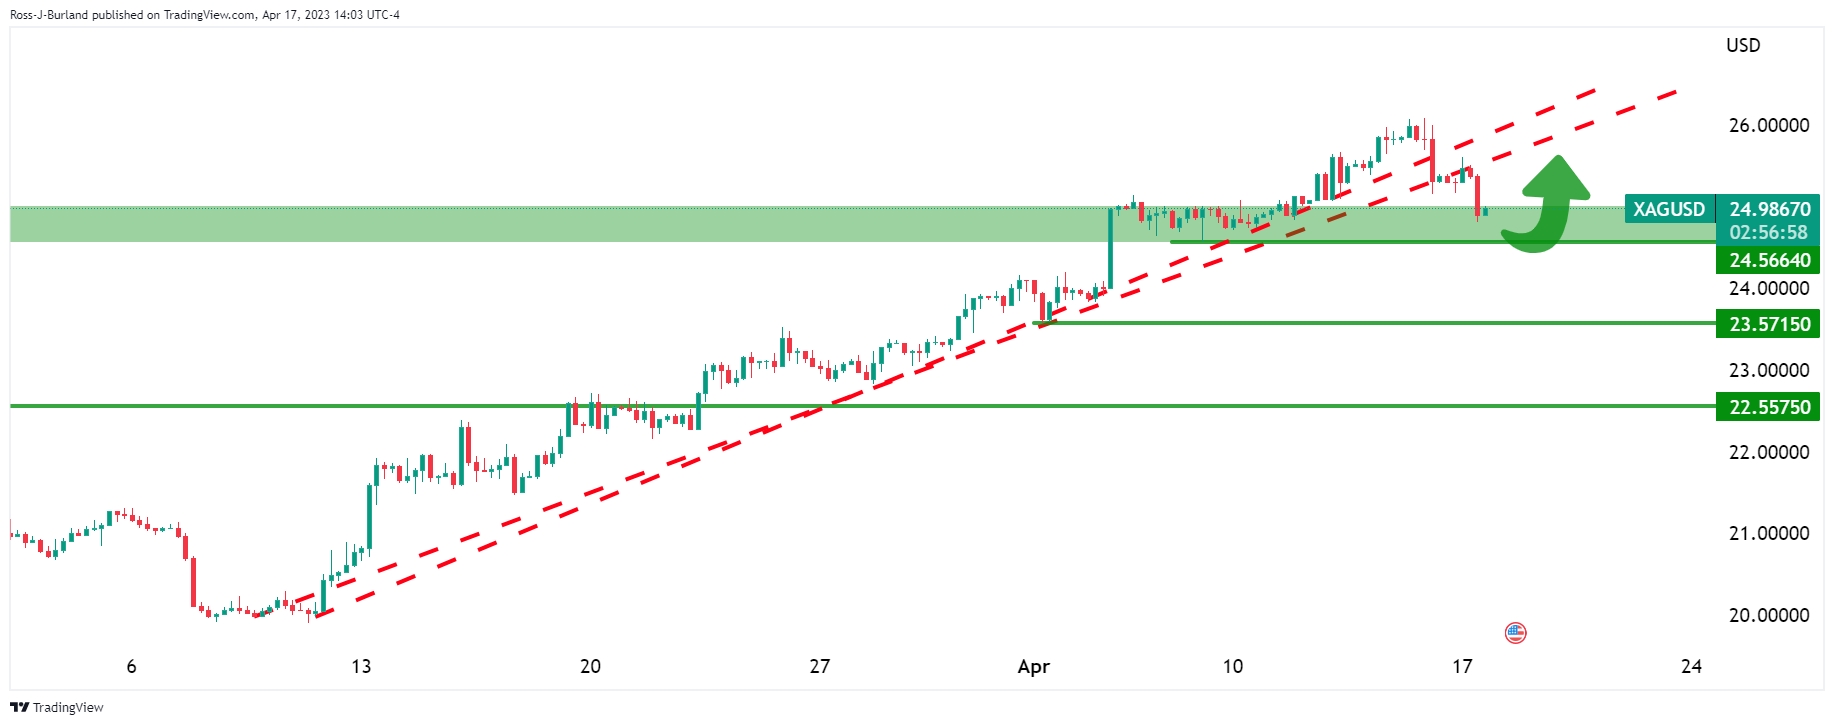
Silver has broken below the trendline support and could close on a daily candle in the support area. $24.5664 is the first import structure level that may otherwise give way to sell-off as illustrated below. However, there could be some consolidation and price discovery to follow over the coming days in and around the recent highs and lows.
US Dollar takes on a 61.8% Fibo:
If the DXY stalls, Silver bulls will be in play.
-
18:52
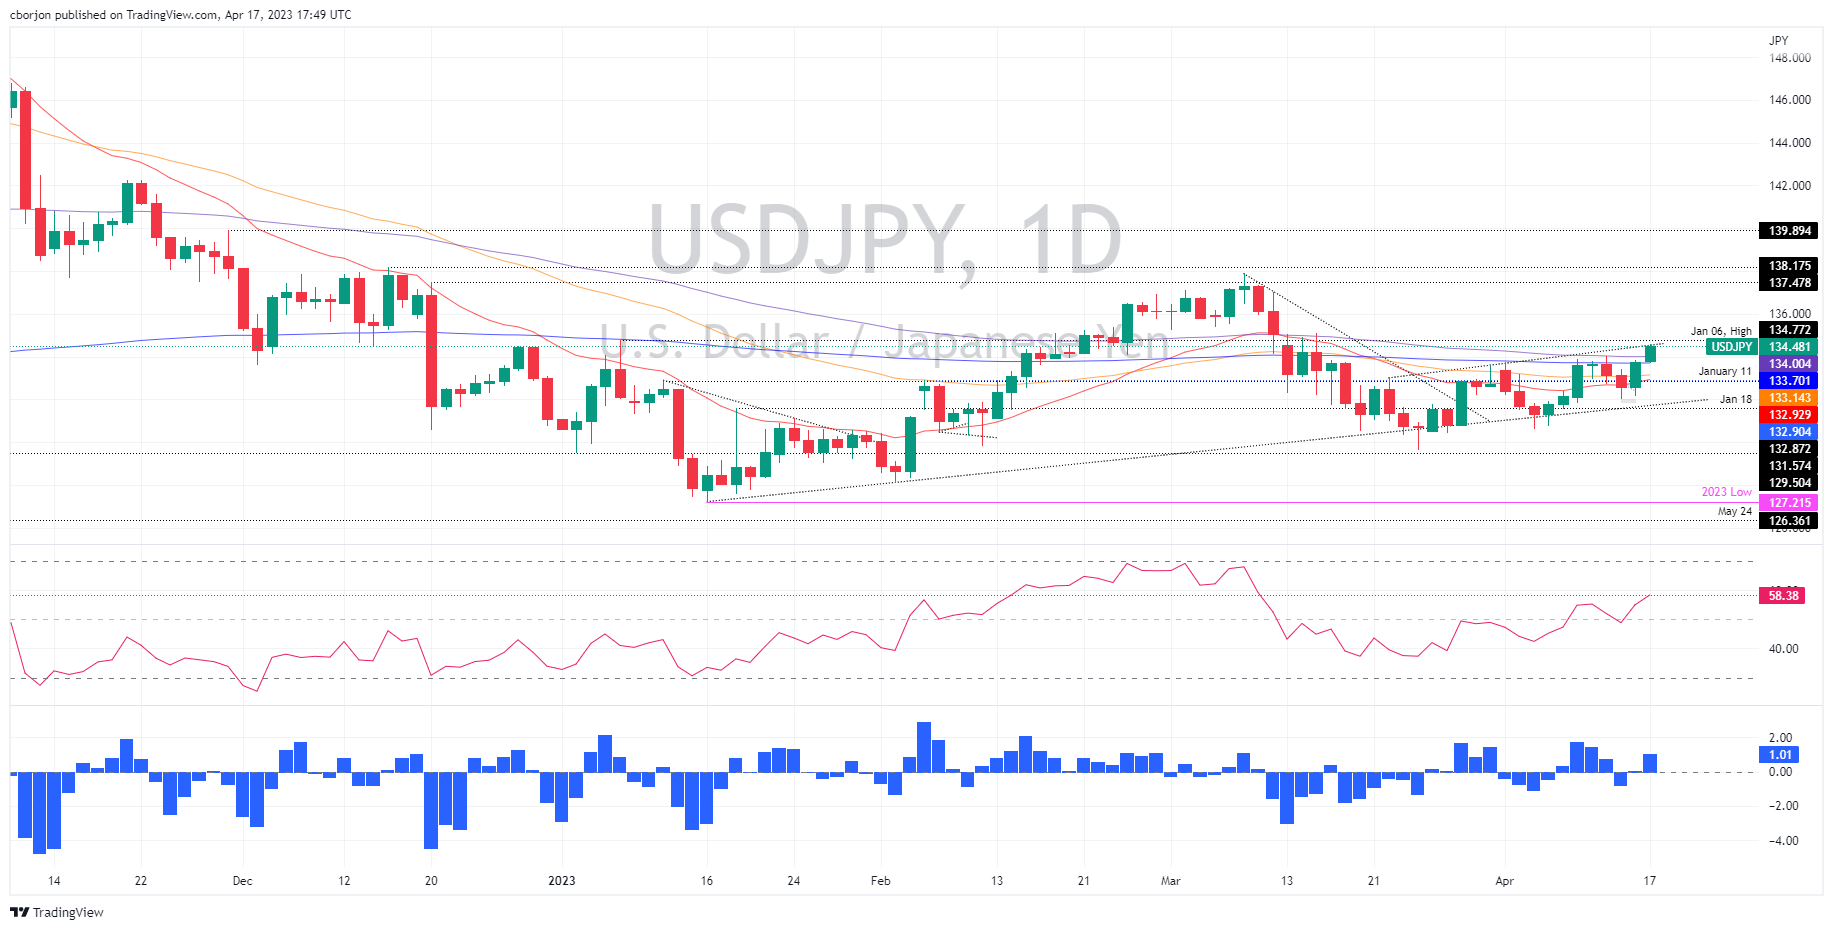
USD/JPY Price Analysis: Gains momentum on rising US Treasury bond yields
- USD/JPY reached fresh five-week highs at 134.57, with bulls eyeing 135.00.
- Oscillators at bullish areas favor further upside in the USD/JPY.
- Downside risks lie below 134.00, which could drive the USD/JPY towards 133.00.
The USD/JPY moved higher as US Treasury bond yields resumed their uptrend, following the last week’s hawkish commentary by Federal Reserve (Fed) officials. Fed Board Governor Christopher Waller’s comments that more tightening is needed, triggered the latest jump in the 10-year US T-bond yield. Therefore, the USD/JPY rallied and is trading at 134.47, up 0.52%.
USD/JPY Price Action
The USD/JPY extended its gains past the last week’s high of 134.04, and it’s aiming to challenge a break above January 6 high at 134.77. On its way up, the USD/JPY climbed above several solid resistance areas, like the 200-day Exponential Moving Average (EMA) EMA at 133.70, followed by the 100-day Exponential Moving Average (EMA) at 134.00. Once the pair cleared those levels, a challenge to 135.00 is on the cards.
The Relative Strength Index (RSI) cements the upward case in bullish territory, while the Rate of Change (RoC) indicates that buying pressure is increasing.
If USD/JPY rallies above 135.00, the next resistance would be 136.00, followed by the psychological 137.00 level before testing the YTD high at 137.91. Conversely, if the USD/JPY retraces, the first support would be 100-day EMA at 134.00. A breach of the latter will immediately expose the 200-day EMA at 133.70, followed by the 50-day EMA At 133.14, before sliding to 133.00.
USD/JPY Daily Chart
USD/JPY Technical Levels
-
18:13
GBP/USD falls on US Dollar strength amid Fed rate hike speculations
- Greenback stages a comeback, boosted by higher US Treasury bond Yields
- Empire State Index surprises with 10.8 point jump in March’s report.
- GBP/USD Price Analysis: Double top emerges, but the pair must fall below 1.2344 to confirm the pattern.
GBP/USD dropped after forming a double top in recent price action during the last nine days and falls amidst speculations that the US Federal Reserve (Fed) would raise rates in May. That, alongside Fed Fund’s swaps, pushing the first rate cut by November of 2023, increased appetite for the greenback. Therefore, the GBP/USD is trading at 1.2355 after hitting a high of 1.2438.
Bets for May’s rate hike by the Fed underpins the US Dollar
US equities have turned read, while the greenback, as shown by the US Dollar Index (DXY), stages a comeback. The DXY sits at 102.214, gains 0.62%, and is one of the reasons for the GBP/USD pullback. Underpinned by traders bracing for additional tightening by the Fed, US Treasury bond yields are heading north, consequently bolstering the USD.
According to the CME FedWatch Tool, the probability of a 25 bps rate hike by the Fed stands at 84.7%, indicating an increase from last Friday’s 78%.
Earlier, a report by the New York Fed revealed that manufacturing activity in the region jumped, as shown by the Empire State Index, for March, advanced 10.8, above estimates of a -18 plunge. A rise in orders and shipments underpinned the data.
Given the backdrop, the GBP/USD retreated from daily highs at 1.2438 and extended its losses towards the S1 daily pivot at 1.2359, shy of last week’s low of 1.2344.
On the United Kingdom (UK) docket, Bank of England (BoE) Deputy Governor Jon Cunliffe crossed newswires. Cunliffe focused on digital currencies and said, “Systemic stablecoins will need to be backed with high quality and liquid assets,” and added that it would not be possible to protect stablecoin deposits in the case of failure.;
What to watch?
The UK calendar will feature the important jobs report, with Employment Change, expected at 50K and the Unemployment Rate unchanged at 3.7%. On the US front, the docket will feature Building Permits, Housing Starts, and Federal Reserve Governor Michell Bowman speaking.
GBP/USD Technical Analysis
A double-top chart pattern is beginning to emerge in the GBP/USD daily chart. Nevertheless, a break below April’s 10 cycle low at 1.2344 is needed to validate the pattern. An initial price target would be 1.2144, but the GBP/USD must hurdle some demand areas toward the latter. First, the April 3 daily low at 1.2274, followed by the 1.2200 figure, ahead of February’s 28 high, turned support at 1.2144.
-
18:09
Fed´s Barkin: Wants to see more evidence inflation settling back to target
President and CEO of the Federal Reserve Bank of Richmond Thomas Barkin has crossed the wires and said that he wants to see more evidence of inflation settling back to target.
Barkin said he feels reassured by what he is seeing in the banking sector.
US Dollar update
The US Dollar, as per the DXY index, is making its way up into resistance as per the micro trendline as illustrated on the daily charts above and in a 61.8% Fibonacci correction. DXY has traveled from a low of 101.531 to a high of 102.231 so far.
-
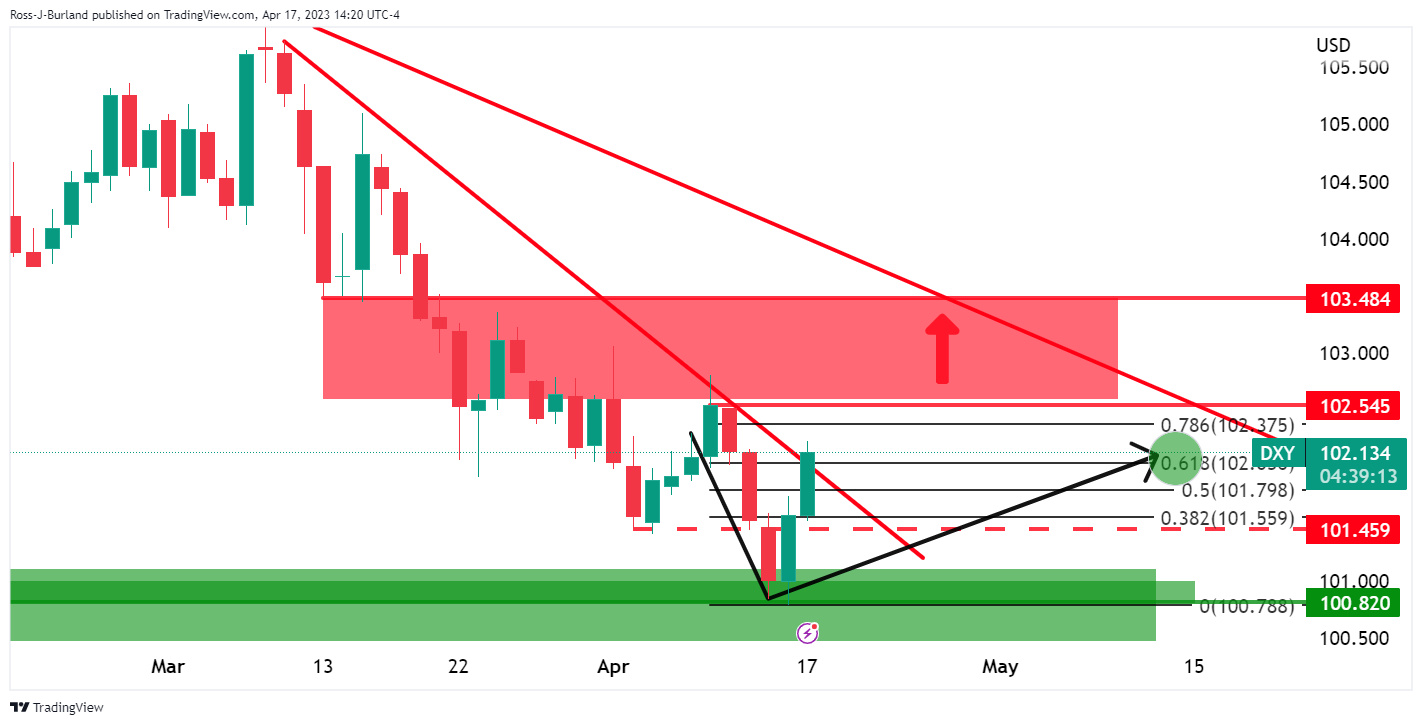
17:05
Gold Price Forecast: XAU/USD extends slide to $1,980 amid dollar strength
- Gold price resumed downside on Monday, fall to the $1,980$ area.
- Us Dollar rises across the board, boosted by higher US yields.
Gold price resumed the downside on Monday, breaking under $1,990. XAU/USD bottomed at $1,980 reaching the lowest level in a week.
As of writing it is hovering near $1,980 almost $60 from last week’s top. The reversal in gold gained momentum amid a rally of the US Dollar and higher US yields.
Expectations that the Federal Reserve will raise interest rates again in May pushed yields to the upside. The US 10-year yield rose to 3.60%, the highest level since late March. The US Dollar Index is advancing for the second day in a row, and is above 102.20.
Data released on Monday in the US showed a sharp rebound in the Empire Manufacturing Index in April to 10.8 from -24.60, surpassing expectations of -18.0. The numbers contribute to the expectations of one more rate hike from the Fed.
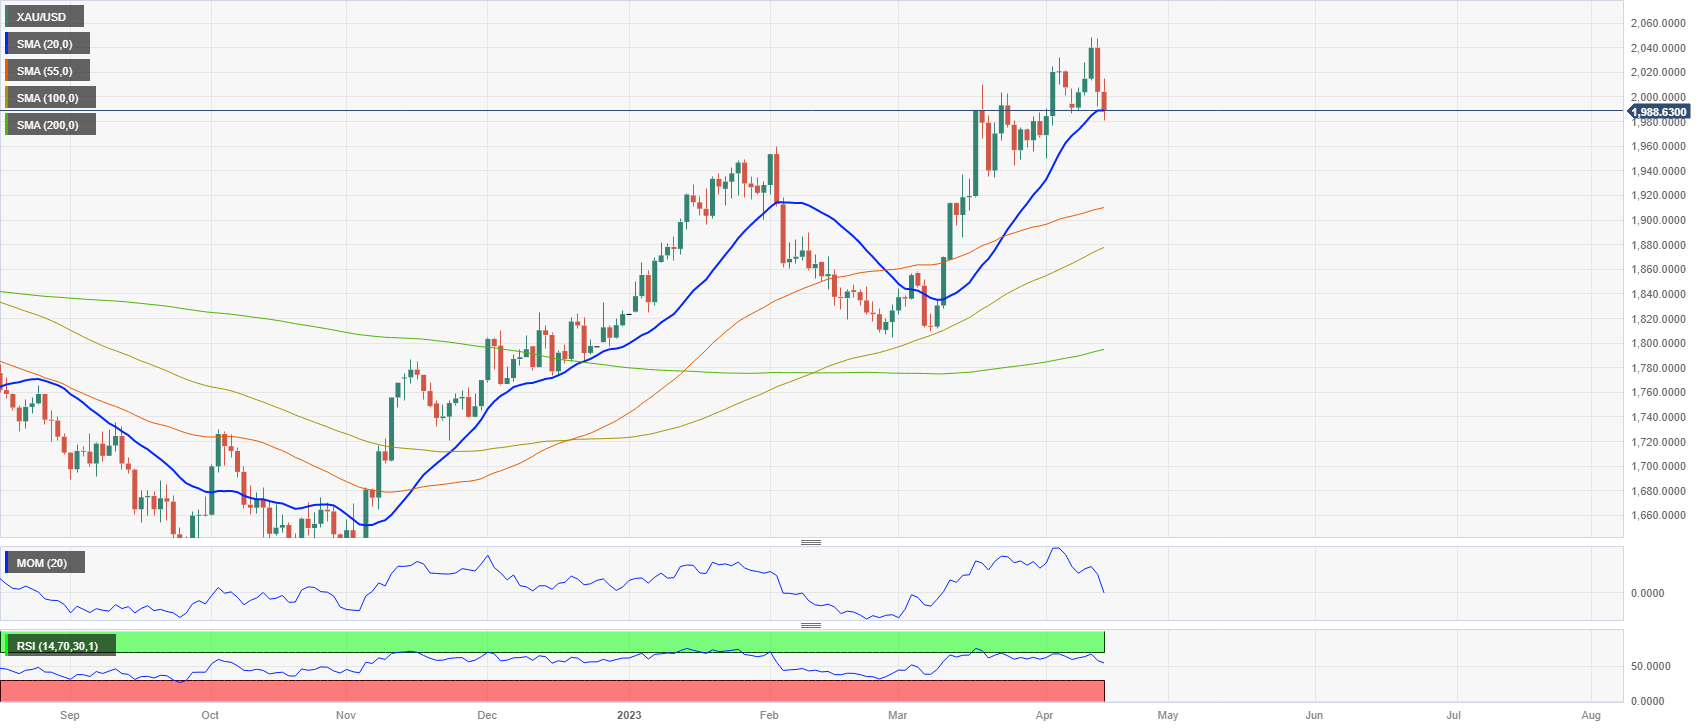
On the daily chart, XAU/USD is trading around the 20-period Simple Moving Average at the $1,990 area. If the yellow metal consolidates clearly below, the outlook would point to an extension of the correction. On the contrary, if gold manages to remain above and retakes $2,005 bulls may return. The next resistance is seen around $2,025.
XAU/USD daily chart
-
16:42
EUR/USD stumbles on Fed rate hike speculations, slides below 1.1000
- EUR/USD falls for the second straight day, as sellers are eyeing 1.0800.
- US New York Empire State Manufacturing Index climbed for the first time in five months.
- EUR/USD Price Analysis: Could register a pullback in the near term before resuming upwards.
EUR/USD losses traction on technical reasons and on a stronger US Dollar (USD, as speculations that the US Federal Reserve (Fed) would hike rates in May, gains adepts. US Treasury bond yields rose; consequently, bonds dropped, a tailwind for the buck. At the time of writing, the EUR/USD is trading at 1.0911 after hitting a YTD high at 1.1075.
Growing adepts for a US central bank 25 bps rate hike boosted the USD
Wall Street trades with a risk-off-tilted mood. The economic docket in the United States (US) and the Eurozone (EU) is light, with the main driver of EUR/USD’s price action being the US 2-year Treasury bond yield. The US 2-year bond yield is gaining almost 10 bps, sitting at 4.194%, while the CME FedWatch Tool shows odds for a 25 bps rate hike by the Fed, at 84.7%, higher than last Friday’s 78%.
The US Dollar Index (DXY) continues to advance and tests the 20-day EMA around 102.321. A break above it could expose the 103.000 mark.
Data-wise, the New York Factory Empire State Manufacturing Index unexpectedly jumped in April, from -24.5 to 10.8, exceeding forecasts for a -18 plunge. Orders and shipments rising were the reasons behind the expansion, while a measure of prices paid fell 9 points.
On the Eurozone front, inflation in Italy rose by 7.6%, beneath the consensus and below February’s 9.1%. In the meantime, the European Central Bank (ECB) President, Christine Lagarde, is crossing newswires, but she’s not commenting about monetary policy.
What to watch?
Ahead of the week, the EU will reveal the Zew Economic Sentiment Index for the bloc and Germany, alongside the EU’s Balance of Trade. On the US front, Housing data, and Fed Bowman, will cross newswires.
EUR/USD Technical Analysis
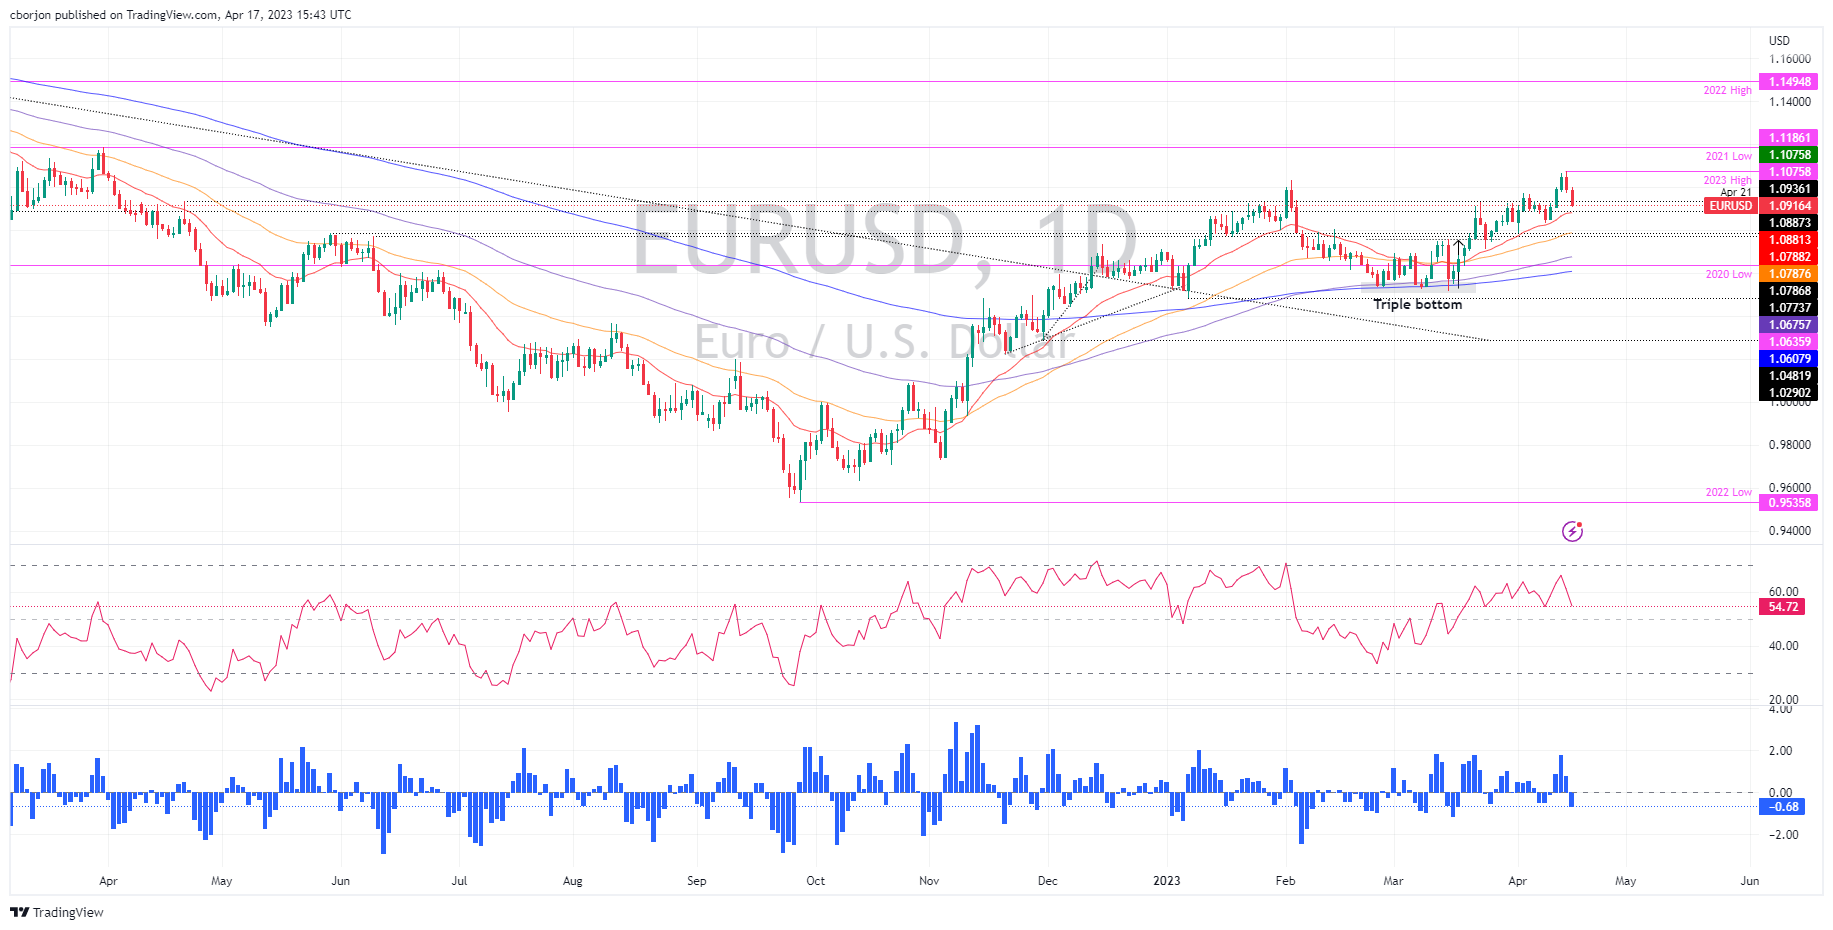
The EUR/USD is still upward biased, though after hitting a new YTD high at 1.1075, it has retreated below 1.1000. Additionally, oscillators like the Relative Strength Index (RSI) aiming downward, the same as the Rate of Change (RoC), suggest that buyers are losing momentum. Therefore, the EUR/USD path of least resistance is downwards in the near term.
The EUR/USD first support would be 1.0900, followed by the 20-day Exponential Moving Average (EMA) at 1.0881. A decisive break would tumble the pair towards the 50-day EMA At 1.0800.
-
15:03
NZD/USD drops further below 0.6200, to four-week lows
- US Dollar remains strong, DXY gains 0.45%.
- US Empire Manufacturing jumps in March.
- NZD/USD breaks previous lows, looks at the 200-day SMA.
The NZD/USD is falling for the second day in a row and printed fresh lows after the release of US data, hitting at 0.6175, the lowest in four weeks. The US Dollar gained momentum across the board and resumed the upside.
Dollar adds to gains after US data
Data released on Monday showed an unexpected rebound from -24.60 to 10.8, against expectations of -18.0. The numbers boosted further the US Dollar while the Kiwi is lagging again.
Earlier on Monday, data from New Zealand showed a 0.8% increase in the Food Price Index during March and a modest decline in the Business NZ PSI in March to 54.4 from 55.8. The key report this week in New Zealand will be Q1 inflation early on Thursday.
NZD/USD is trading at 0.6175, at the lowest level since March 22. The pair is holding below previous April lows, looking vulnerable, near the 200-day Simple Moving Average that stands at 0.6160.
Technical levels
-
15:00
United States NAHB Housing Market Index came in at 45, above expectations (44) in April
-
14:50
Week Ahead: Canada Macro Market Movers – TDS
Strategists at TD Securities (TDS) offer a brief preview of a rather busy week in terms of important Canadian macro data, starting with the release of the latest consumer inflation figures on Tuesday.
Key quotes:
“We will receive CPI on Tuesday where we expect a sharp deceleration in the y/y measure to 4.3% (prior: 5.2% y/y) reflecting base effects. Housing Starts (out Wednesday) are expected to edge lower from 244k to 235k with declines in both single-family and multi-unit starts. Lastly, we will receive Retail Sales on Friday where we look for a 0.5% contraction (flash estimate: -0.6%).”
-
14:41
USD Index trades remains bid and flirts with 102.00
- The index adds to Friday’s rebound and retargets 102.00.
- US yields keep the march north and bolster the dollar.
- The NY Empire State index surprised to the upside in April.
The USD Index (DXY), which tracks the greenback vs. a bundle of its main competitors, extends Friday’s bounce to the boundaries of 102.00 the figure at the beginning of the week.
USD Index supported by yields, rates hike bets
The index now trades on a firmer foot and pokes with the key barrier at the 102.00 region on the back of the continuation of the selling bias in the risk-associated universe, while further upside in US yields across the curve also collaborates with the daily uptick.
In the meantime, bets on a 25 bps rate hike by the Federal Reserve at the May 3 event remain on the rise and look propped up by hawkish Fedspeak, while the still elevated inflation also seems to maintain the prudent stance among investors.
In the US docket, the NY Empire State Manufacturing Index improved to 10.8 for the current month. Later in the session, the NAHB Housing Market Index and TIC Flows are both due.
What to look for around USD
The dollar’s corrective upside remains en route to challenge the key barrier at 102.00 on Monday.
In the meantime, the marked retracement in the buck since March has been underpinned by the pick-up in the perception that the Federal Reserve could make a pause in its current tightening cycle just after the May meeting.
In favour of a pivot in the Fed’s normalization process, however, still emerges the persevering disinflation, nascent weakness in some key fundamentals and somewhat persistent concerns surrounding the banking sector.
Key events in the US this week: NAHB Housing Market Index, TIC Flows (Monday) – Building Permits, Housing Starts (Tuesday) – MBA Mortgage Applications, Fed’s Beige Book (Wednesday) – Initial Claims, Philly Fed Index, CB Leading Index, Existing Home Sales (Thursday) - Flash Manufacturing/Services PMIs (Friday).
Eminent issues on the back boiler: Persistent debate over a soft/hard landing of the US economy. Terminal Interest rate near the peak vs. speculation of rate cuts in 2024. Fed’s pivot. Geopolitical effervescence vs. Russia and China. US-China trade conflict.
USD Index relevant levels
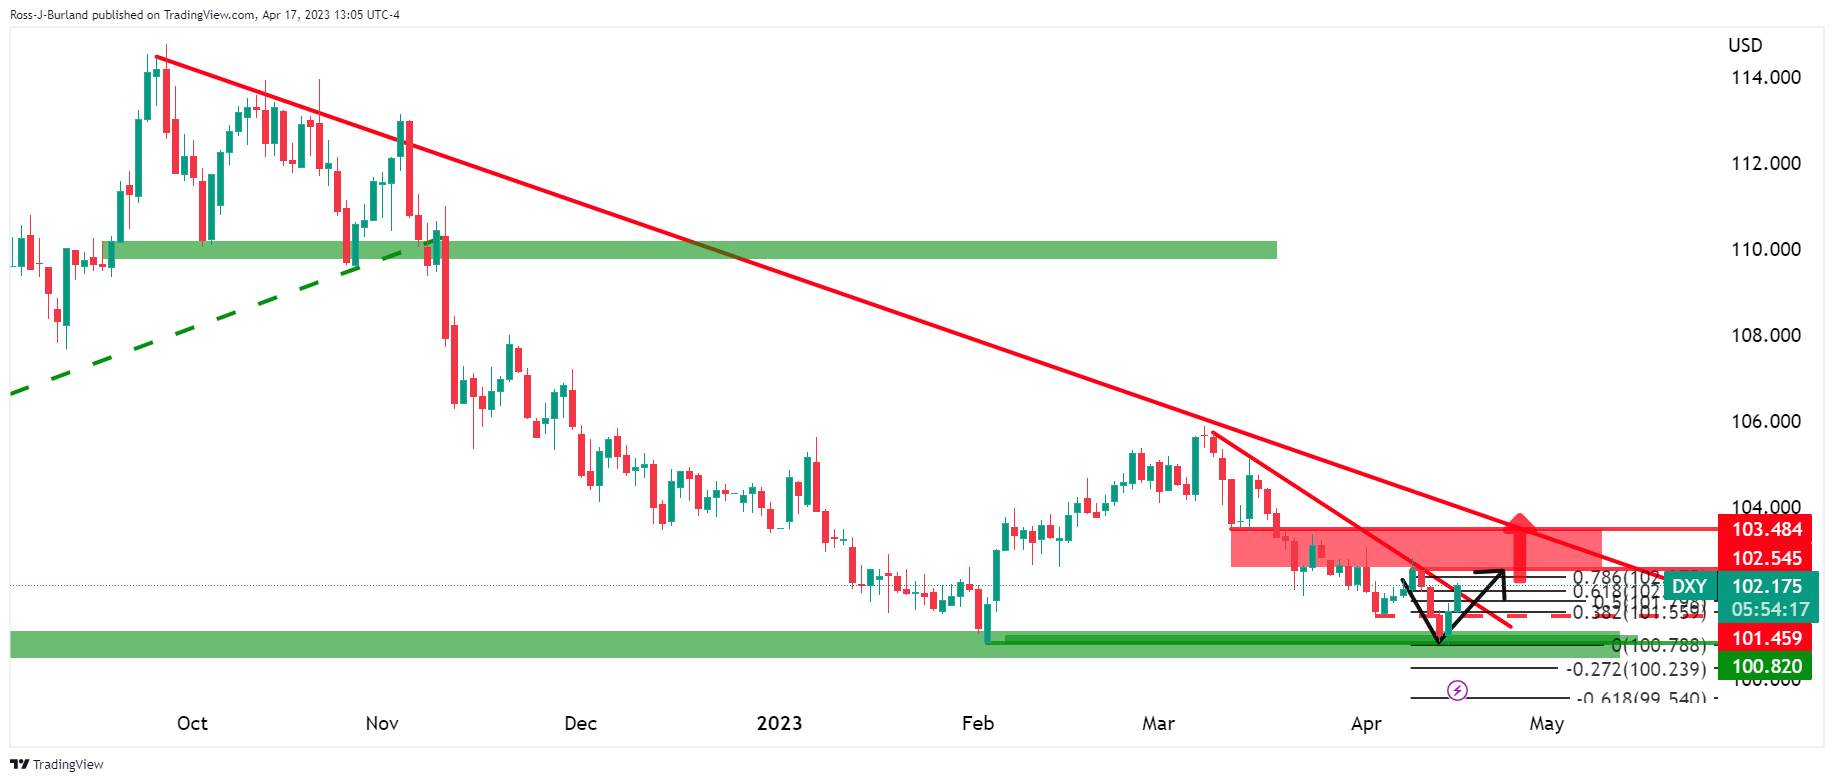
Now, the index is advancing 0.31% at 101.89 and the next resistance level emerges at 103.05 (monthly high April 3) seconded by 103.53 (100-day SMA) and then 105.11 (weekly high March 15). On the flip side, the breach of 100.78 (2023 low April 14) would open the door to 100.00 (psychological level) and finally 99.81 (weekly low April 21 2022).
-
14:27
Singapore: MAS ends its hiking cycle – UOB
UOB Group’s Senior Economist Alvin Liew and Senior FX Strategist Peter Chia review the latest MAS decision on its monetary policy conditions.
Key Takeaways
“MAS Apr 2023 MPS – The Monetary Authority of Singapore (MAS), in its scheduled monetary policy statement (MPS) release on Fri (14 Apr), announced it was maintaining the prevailing rate of appreciation of the S$NEER policy band, with no change to the width of the policy band and the level at which the policy mid-point is centred. This is the first time MAS has kept policy unchanged after five preceding rounds of policy tightening since Oct 2021.”
“MAS Inflation & Growth Assessment – The MAS provided a downbeat assessment for growth as it noted “Singapore’s GDP growth is projected to moderate significantly this year, in line with the global goods and investment cycle downturn.” The MAS projects Singapore’s GDP to ease below trend growth to 0.5%-2.5% (from 3.6% in 2022) and the output gap to turn slightly negative in 2023 with risks to global and Singapore’s growth tilted to the downside. The MAS kept its inflation forecasts (that were first made in the 14 Oct 2022 MPS) unchanged in today’s Apr statement. The two notable differences this time is that the MAS explicitly stated “MAS Core Inflation is projected to reach around 2.5% y-o-y by the end of 2023” and it sees both upside and downside risks to inflation.”
“MAS Outlook – Tightening Cycle Is Over, Status Quo For Oct: Overall, the MAS took the prudent approach and kept policy unchanged in Apr. We now expect the current tightening cycle to have ended and the MAS to maintain this pause in the next Oct meeting. If there is another off-cycle announcement before Oct, we think it will likely be due to a sudden worsening in external conditions leading to a sharp downgrade in growth outlook, so the MAS will likely shift to a more accommodative policy rather than further tightening in its next move, but that is not our base case to expect an off-cycle policy announcement for now.”
-
14:24
USD/CAD challenges 200-day SMA, around 1.3400 mark amid softer Oil prices/USD strength
- USD/CAD scales higher for the second straight day and draws support from a combination of factors.
- A modest downtick in Oil prices undermines the Loonie and acts as a tailwind amid a stronger USD.
- Bets for an imminent Fed rate-hike pause might hold back bulls from placing fresh bets and cap gains.
The USD/CAD pair attracts fresh buying following an intraday dip to the 1.3340 area and turns positive for the second straight day on Monday. Spot prices climb back closer to the 1.3400 mark during the early North American session, with bulls now awaiting a move beyond the 200-day Simple Moving Average (SMA) before positioning for an extension of Friday's bounce from a two-month low.
Crude Oil prices kick off the new week on a weaker note amid worries that a deeper global economic downturn will dent fuel demand, which, in turn, undermines the commodity-linked Loonie. The US Dollar (USD), on the other hand, recovers further from a one-year low touched on Friday amid speculations that the Federal Reserve (Fed) might continue raising interest rates. This is seen as another factor that acts as a tailwind for the USD/CAD pair and remains supportive of the intraday positive move.
In fact, the markets are currently pricing in a greater chance of another 25 bps lift-off at the next FOMC meeting in May. The bets were lifted by the University of Michigan's preliminary report, which showed a rise in short-term inflation expectations during April. Furthermore, Fed Governor Christopher Waller on Friday called for further rate hikes and said that the job was still not done as inflation remains far too high. This continues to push the US Treasury bond yields higher and lifts the USD for the second straight day.
Investors, however, still seem convinced that the US central bank will pause its rate-hiking cycle, sooner rather than later, amid signs of easing inflationary pressures. In fact, the US CPI and the PPI report released last week indicated that disinflation is progressing smoothly. This, along with a positive risk tone, might cap the safe-haven USD and any meaningful upside for the USD/CAD pair.
Technical levels to watch
-
14:13
EUR/USD Price Analysis: A deeper drop could retest 1.0830
- EUR/USD adds to Friday’s corrective decline well below 1.1000.
- The weekly low near 1.0830 emerges as the next support of note.
EUR/USD retreats to 3-day lows in the mid-1.0900s following a failed attempt to retake the key barrier at 1.1000 the figure on Monday.
Further weakness appears on the cards in the very near term for the pair. Against that, there is an initial support at the weekly low at 1.0831 (April 10) prior to April low at 1.0788 (April 3).
Looking at the longer run, the constructive view remains unchanged while above the 200-day SMA, today at 1.0373.
EUR/USD daily chart
-
13:51
USD/IDR faces extra side-lined trading – UOB
According to Markets Strategist Quek Ser Leang at UOB Group, USD/IDR is seen navigating within the 14,610-14,960 range in the short term.
Key Quotes
“We highlighted last Monday (10 Apr, spot at 14,905) that ‘weakness in USD/IDR has yet to stabilize’ and held the view that USD/IDR ‘could weaken further but February’s low of 14,830 is likely out of reach’. The anticipated weakness exceeded our expectations as USD/IDR plummeted to 14,640 on Friday.”
“Severely oversold conditions suggest that USD/IDR is unlikely to weaken much further. This week, USD/IDR is more likely to trade in a range, expected to be in a range of 14,610/14,960.”
-
13:47
The US Dollar is finally getting some traction – BBH
Economists at BBH said in their latest note that the recent relentless US Dollar (USD) selling was interrupted by a strong rebound on Friday that followed the release of the retail sales data and hawkish Fed comments.
Additional quotes:
“DXY is up for the second straight day and trading near 101.714. A break above 102.036 Is needed to set up a test of the April 10 high near 102.807.”
“Fed tightening expectations have picked up a bit. WIRP suggests nearly 90% odds of a 25 bp hike at the May 2-3 meeting, up from 70% at the start of last week and 50% at the start of the week before that. Small odds of another 25 bp hike in June has crept back into the market. After that, only one cut is priced in by year-end vs. two at the start of last week. In that regard, Powell has said that Fed officials “just don’t see” any rate cuts this year. If a second hike gets more priced in while a rate cut gets more priced out, this should help the dollar get more traction.”
-
13:38
EUR/SEK: Scope for a move to 10.80 on a 6-month view – Rabobank
The EUR/SEK pair is falling on Monday for the fifth consecutive day, trading at 11.30, the lowest level in a week. Analysts at Rabobank, see the Swedish Krona as vulnerable in the short term but they see it improve over the medium term. They forecast EUR/SEK at 10.80 on a six-month perspective.
Key quotes:
“Reflecting the weakness of the economy, the SEK was the weakest performing G10 currency in 2022. Sweden’s proximity to Russia was also likely a factor weighing on the SEK in early 2022. In the year to date, it has pulled back a little ground vs the EUR but has remained on the back foot vs. the EUR, reflecting the hawkishness of the ECB.”
“The weakness of the SEK has recently sparked market talk regarding FX intervention risks, though we view this as unlikely at this stage.”
“EUR/SEK has recently tested its 2020 high in the 11.42 region. The 2009 high stands around EUR/SEK11.79. In the near-term the SEK remain vulnerable. However, expectations that growth will be supported in 2024 by a still robust labour market and a recovery in the housing market suggests an improved outlook for the SEK into year end. We see scope for a move to EUR/SEK10.80 on a 6-month view.”
-
13:30
United States NY Empire State Manufacturing Index above forecasts (-18) in April: Actual (10.8)
-
13:30
Canada Wholesale Sales (MoM) came in at -1.7% below forecasts (-1.6%) in February
-
13:30
Canada Foreign Portfolio Investment in Canadian Securities climbed from previous $4.21B to $4.62B in February
-
13:30
Canada Canadian Portfolio Investment in Foreign Securities rose from previous $-16.18B to $-1.61B in February
-
13:25
Silver Price Analysis: XAG/USD sticks to gains around $25.40 area, bullish potential intact
- Silver regains positive traction and reverses a part of Friday’s retracement slide from the YTD peak.
- The technical setup still favours bullish traders and supports prospects for further near-term gains.
- A convincing break below the $25.00 mark should pave the way for a meaningful corrective decline.
Silver attracts fresh buying on the first day of a new week and reverses a part of Friday's retracement slide from levels just above the $26.00 mark, or a fresh one-year high. The white metal sticks to its modest intraday gains around the $25.45 region heading into the North American session and seem poised to prolong its recent appreciating move witnessed over the past month or so.
The recent breakout through the $24.30-$24.40 strong horizontal barrier and a subsequent move beyond the $25.00 psychological mark add credence to the near-term positive outlook for the XAG/USD. That said, the slightly overbought Relative Strength Index (RSI) on the daily chart might hold back traders from placing aggressive bets and keep a lid on any meaningful upside, at least for the time being.
In the meantime, any intraday slide might continue to attract fresh buyers and remain limited near the $25.00 mark. The latter should act as a pivotal point, which if broken decisively might prompt some technical selling and drag the XAG/USD towards the $24.30-$24.40 resistance-turned-support en route to the $24.00 mark. A convincing break below the latter might shift the bias in favour of bearish traders.
On the flip side, bulls might now wait for some follow-through buying beyond the YTD peak, around the $26.10 area touched on Friday, before placing fresh bets and positioning for a further appreciating move. The XAG/USD might then climb towards the next relevant hurdle near the $26.40-$26.50 zone before eventually aiming to test the 2022 peak, just ahead of the $27.00 round-figure mark.
Silver daily chart
Key levels to watch
-
13:14
USD Index Price Analysis: The loss of 100.80 exposes a drop to 100.00
- DXY adds to Friday’s recovery and approaches the 102.00 barrier.
- There are still chances of a breakdown of the 2023 peak near 100.80.
DXY extends further Friday’s optimism and looks to retake the 102.00 neighbourhood at the beginning of the week.
Despite the ongoing rebound, the index is expected to remain under pressure for the time being. Against that, the loss of the 2023 low at 100.78 (April 14) should open the door to a deeper decline to, initially, the psychological 100.00 mark.
South from here aligns the late-March 2022 lows near 97.70.
Looking at the broader picture, while below the 200-day SMA, today at 106.33, the outlook for the index is expected to remain negative.
DXY daily chart
-
13:07
USD/MYR: Upside should meet a tough resistance at 4.4450 – UOB
The continuation of the upside momentum in USD/MYR is expected to face a solid barrier around 4.4450, notes Markets Strategist Quek Ser Leang at UOB Group.
Key Quotes
“We noted last week that ‘further range trading appears likely’ and expected USD/MYR to trade in a range between 4.3930 and 4.4350. Our view of range-trading was not wrong even though USD/MYR traded in a narrower range than expected (4.3790/4.4200). Despite the relatively quiet price actions, upward momentum appears to be building, albeit tentatively.”
“This week, we expect USD/MYR to edge higher but any advance is expected to face solid resistance at 4.4450. Support is at 4.4050; a break below 4.3950 would indicate that the current mild upward pressure has eased.”
-
12:53
Net USD long positions moved lower last week – Rabobank
Analysts at Rabobank assess the latest CFTC Commitment of Traders Report:
"Net USD long positions moved lower last week. That said, there has been little net change in USD longs since late March. While the recovery in sentiment after the recent bank jitters has weighed on the safe-haven USD, the greenback is again finding support from expectations about further policy tightening from the Fed."
"Net EUR long positions surged last week to their highest levels since mid-February as the market reacted to hawkish commentary from ECB officials."
"Net short GBP speculators’ positions dropped to their lowest level since March 2022 reflecting an improvement in sentiment linked to a slew of less bad UK economic data. The May BoE policy meeting is in view. The market is fully priced for another 25-bps rate hike and sees risk of additional tightening in the coming months."
"JPY net short positions saw little change having increased the previous week. They remain well above the levels held earlier in the year as speculators have lost faith in the view that the BoJ may soon announce a less accommodative monetary policy.
"CHF net shorts remain choppy, dropping back last week. Last month the issues surrounding Credit Suisse and the treatment of AT1 paper complicated the CHF’s safe-haven status."
"Speculators’ net short CAD positions edged a little lower having increased notably in late March, oil prices and the signalled pause in policy from the BoC are in view. Net AUD short positions moved higher again last week. That said, talk of another RBA rate hike could see a reversal of this direction in the next set of data."
-
12:49
AUD/USD trades with modest gains around 0.6700, upside seems capped amid stronger USD
- AUD/USD catches some bids on the first day of a new week, though lacks follow-through.
- Bets for another 25 bps Fed rate hike underpin the USD and act as a headwind for the pair.
- A positive risk tone caps the safe-haven buck and lends support to the risk-sensitive Aussie.
The AUD/USD pair attracts some buying on the first day of a new week and stalls Friday's rejection slide from the 0.6800 mark, or the 100-day Simple Moving Average (SMA). Spot prices stick to a mildly positive tone through the mid-European session, albeit seem to struggle to capitalize on the move and lack bullish conviction.
The US Dollar(USD) gains some positive traction for the second successive day and moves further away from a one-year low touched on Friday, which, in turn, acts as a headwind for the AUD/USD pair. Federal Reserve (Fed) Governor Christopher Waller on Friday called for further rate hikes and said that the job was still not done as inflation remains far too high. Adding to this, the University of Michigan's preliminary report showed that one-year inflation expectations rose to 4.6% from 3.6% in March and lifted bets for another 25 bps lift-off at the next FOMC policy meeting in May. This remains supportive of elevated US Treasury bond yields and continues to underpin the Greenback.
Market participants, however, still seem convinced that the Fed will pause its rate-hiking cycle, sooner rather than later. This, along with a generally positive tone around the equity markets, holds back traders from placing aggressive bullish bets around the safe-haven buck and lends support to the risk-sensitive Aussie. The mixed fundamental backdrop makes it prudent to wait for strong follow-through movement in either direction before positioning for a firm intraday direction. Investors also seem reluctant ahead of the release of the minutes of the latest Reserve Bank of Australia (RBA) meeting and Chinese data dump on Tuesday amid signs that the recovery in the world's second-largest economy is losing steam.
In the meantime, the US economic docket, featuring the release of the Empire State Manufacturing Index, will be looked upon for short-term trading impetus around the AUD/USD pair. Apart from this, the US bond yields, along with the broader market risk sentiment, might influence the USD price dynamics and contribute to producing short-term opportunities.
Technical levels to watch
-
12:48
RBA likely to keep its policy rate unchanged again in May – TDS
Analysts at TD Securities say that they don't expect the minutes of the Reserve Bank of Australia's (RBA) April policy meeting to offer any surprises.
RBA likely keep its policy rate unchanged again in May
"In their recent speeches, Governor Lowe and Deputy Governor Bullock made it clear that the RBA wanted to pause to assess the impact of the rapid rate hikes and the economic outlook. Thus, we expect the Apr Minutes to follow closely to the content of their speeches and don't expect any surprises. Again, the Minutes will emphasise the "long and variable lags" of monetary policy and the uncertainty from the upcoming mortgage roll off."
"We doubt the Board will place much focus on the Q1 CPI print in their discussion but rather steer their discussion on the importance of the aggregate data flow. We still think the Bank is likely to keep its policy rate unchanged again in May as a single month is unlikely enough time for the RBA's assessment. A hike after pausing potentially adds more confusion to the RBA's message."
-
12:24
EUR/JPY Price Analysis: Strong momentum could target the 2022 peak
- EUR/JPY extends the strong rally past the 147.00 region.
- Further up aligns the 2022 high north of the 148.00 barrier.
EUR/JPY extends the needle-like uptrend and surpasses the key 147.00 hurdle fort het first time since late October 2022.
Considering the ongoing price action, further gains in the cross remain in store for the time being. That said, the continuation of the upside momentum could extend further and challenge the 2022 peak at 148.40 (October 21) sooner rather than later.
So far, further upside looks favoured while the cross trades above the 200-day SMA, today at 142.07.
EUR/JPY daily chart
-
12:19
USD/THB: Room for extra upside near term – UOB
Markets Strategist Quek Ser Leang at UOB Group suggests further strength in USD/THB remains on the cards for the time being.
Key Quotes
“We expected USD/THB to edge higher last week but we were of the view that ‘a sustained rise above 34.55 appears unlikely’. Our expectations did not materialize and USD/THB traded in a relatively quiet manner between 3.97 and 34.41 before settling slightly higher for the week (Friday’s close of 34.27, +0.20%).”
Upward momentums has improved somewhat and this week USD/THB is likely to trade with an upward bias. However, USD/THB is still unlikely to rise above 34.75 in a sustained manner (the next resistance level is at 34.75). Support is at 34.20, followed by 34.05.”
-
11:43
Gold Price Forecast: XAU/USD sticks to modest gains above $2,000, lacks follow-through
- Gold price regains positive traction on Monday, though the uptick lacks bullish conviction.
- Looming recession fears turn out to be a key factor benefitting the safe-haven commodity.
- A modest US Dollar strength holds back bulls from placing fresh bets and caps the upside.
Gold price attracts fresh buying near the $1,995 area on the first day of a new week and maintains its bid tone through the first half of the European session. The XAU/USD is currently placed around the $2,010-$2,011 region, up over 0.40% for the day, and for now, seems to have stalled Friday's retracement slide from the vicinity of over a one-year peak.
Looming recession fears benefit the safe-haven Gold price
Growing worries about a deeper global economic downturn turns out to be a key factor lending some support to the safe-haven Gold price amid expectations for an imminent pause in the rate-hiking cycle by the Federal Reserve (Fed). That said, impressive bank earnings seem to have eased fears about a banking crisis that unfolded in March. Adding to this, the Retail Sales report released from the United States (US) on Friday suggested that the economy is not so bad and remained supportive of a generally positive tone around the equity markets. This, along with a modest US Dollar (USD) strength, is holding back bulls traders from placing aggressive bets around the XAU/USD and capping the upside, at least for the time being.
Modest US Dollar strength keeps a lid on Gold price
Despite the softer US consumer inflation and the Producer Price Index released last week, Fed Governor Christopher Waller on Friday called for further rate hikes and said that the job was still not done as inflation remains far too high. The markets were quick to react and are now pricing in a greater chance of another 25 basis point (bps) lift-off at the next Federal Open Market Committee (FOMC) policy meeting in May. This remains supportive of elevated US Treasury bond yields, which, in turn, assists the USD to build on Friday's goodish rebound from a one-year low and gain follow-through traction for the second successive day. A stronger Greenback tends to undermine demand for the US Dollar-denominated Gold price.
Traders now look to US macro data for short-term impetus
The aforementioned mixed fundamental backdrop warrants some caution before positioning for any further appreciating move for the XAU/USD. Nevertheless, Gold price manages to hold above the $2,000 psychological mark as traders now look to the US economic docket, featuring the release of the Empire State Manufacturing Index for a fresh impetus later during the early North American session. Apart from this, the US bond yields will influence the USD price dynamics, which, along with the broader risk sentiment, should contribute to producing short-term opportunities around the XAU/USD.
Gold price technical outlook
From a technical perspective, the emergence of fresh buying on Monday favours bullish traders and support prospects for an extension of the recent strong upward trajectory witnessed over the past month or so. That said, sustained weakness below the $1,995-$1,990 region, will negate the positive outlook and prompt some technical selling. The Gold price might then accelerate the corrective decline towards the $1,965-$1,960 intermediate support en route to the $1,950 horizontal zone.
On the flip side, bulls might now wait for some follow-through buying beyond the $2,020 area before placing fresh bets. The Gold price might then climb to the YTD peak, around the $2,047-$2,049 region touched last Thursday. The subsequent move up has the potential to lift the XAU/USD back towards retesting the all-time high, around the $2,070-$2,075 region touched in August 2020.
Key levels to watch
-
11:00
US Dollar recovers as markets expect Fed rate hike in May
- US Dollar gathers strength to start the week following Friday’s decisive rebound.
- Markets expect the Federal Reserve to raise its policy rate again in May.
- EUR/USD needs to hold above 1.0900 to keep buyers interested.
The US Dollar (USD) started the new week on a bullish note after having registered strong gains against its major rivals ahead of the weekend. The latest macroeconomic data releases from the United States (US) and hawkish comments from Federal Reserve (Fed) officials help the USD keep its footing.
The US Dollar Index, which tracks the USD performance against a basket of six major currencies, extends its recovery toward 102.00 following a more-than-0.5% increase seen on Friday.
Daily digest market movers: US Dollar rises on hawkish Fed bets
- The data published by the US Census Bureau revealed on Friday that Retail Sales declined by 1% on a monthly basis in March. On a positive note, March’s reading of -0.4% got revised higher to -0.2%.
- The University of Michigan’s (UoM) Consumer Confidence Index improved modestly to 63.5 in April’s flash estimate from 62 in March.
- The one-year consumer inflation expectation component of the UoM’s survey climbed to 4.6% from 3.6% in March, providing a boost to the USD.
- "Monetary policy will need to remain tight for a substantial period and longer than markets anticipate,” Federal Reserve Governor Christopher Waller said on Friday. Waller further argued that the recent data show that the Fed hasn't made much progress on its inflation goal.
- In an interview with Reuters, Atlanta Fed President Raphael Bostic noted that recent developments in the US economy were consistent with one more rate hike.
- According to the CME Group’s FedWatch Tool, markets are currently pricing in a more-than-80% probability of a 25 basis points (bps) Fed rate hike in May.
- On Wednesday, the Fed will release the Beige Book. Existing Home Sales and Initial Jobless Claims data will be featured in the US economic docket on Thursday ahead of S&P Global’s Manufacturing and Services PMI surveys on Friday.
- Previewing the Fed’s publication, “since the March 21-22 meeting, the data suggest that activity is slowing, the labor market is softening, and price pressures are easing,” said analysts at BBH. “Notably, supply chains continue to improve. We believe the Beige Book will highlight these trends that support a pause after what is widely expected to be another 25 bp hike whilst leaving the door open for further tightening if needed.”
Technical analysis: US Dollar could stay resilient against Euro
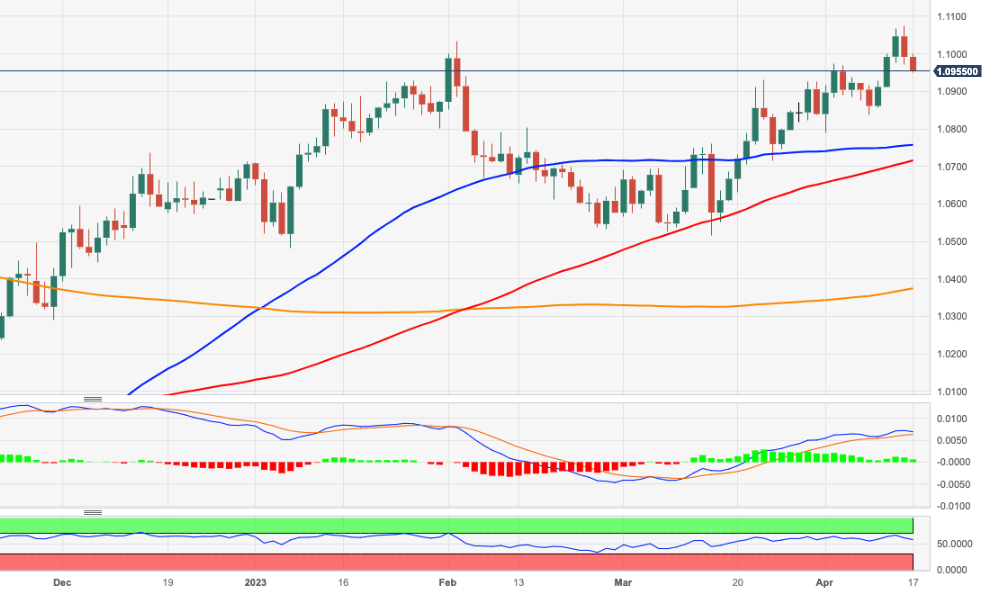
On the daily chart the Relative Strength Index (RSI) indicator declined toward 60 early Monday, suggesting that the pair is staging a technical correction. On the downside, 1.0900 (20-day Simple Moving Average (SMA) aligns as first technical support ahead of 1.0760 (50-day SMA) and 1.0700 (100-day SMA).
In case EUR/USD manages to stabilize above 1.1000 (psychological level, static level), sellers could be discouraged. In that scenario, 1.1100 (psychological level, static level) could be seen as the bullish target before 1.1160 (static level from April 2022) and 1.1200 (psychological level).
How does Fed’s policy impact US Dollar?
The US Federal Reserve (Fed) has two mandates: maximum employment and price stability. The Fed uses interest rates as the primary tool to reach its goals but has to find the right balance. If the Fed is concerned about inflation, it tightens its policy by raising the interest rate to increase the cost of borrowing and encourage saving. In that scenario, the US Dollar (USD) is likely to gain value due to decreasing money supply. On the other hand, the Fed could decide to loosen its policy via rate cuts if it’s concerned about a rising unemployment rate due to a slowdown in economic activity. Lower interest rates are likely to lead to a growth in investment and allow companies to hire more people. In that case, the USD is expected to lose value.
The Fed also uses quantitative tightening (QT) or quantitative easing (QE) to adjust the size of its balance sheet and steer the economy in the desired direction. QE refers to the Fed buying assets, such as government bonds, in the open market to spur growth and QT is exactly the opposite. QE is widely seen as a USD-negative central bank policy action and vice versa.
-
10:35
USD/CNH clings to the consolidative theme so far – UOB
In the view of Economist Lee Sue Ann and Markets Strategist Quek Ser Leang at UOB Group, USD/CNH is expected to stick to the current range bound theme between 6.8500 and 6.9200 for the time being.
Key Quotes
24-hour view: “We expected USD to trade with a downward bias last Friday but we held the view that ‘a clear break below 6.8500 is unlikely’. We did not expect the volatile price actions as USD plunged to 6.8303 and snapped back up to end the day little changed at 6.8696 (-0.01%). USD traded on a firm note in early Asian trade and upward momentum is building. That said, any advance is expected to face solid resistance at 6.9000. Support is at 6.8700, followed by 6.8600.”
Next 1-3 weeks: “Last Friday (14 Apr, spot at 6.8700), we noted that ‘downward momentum is showing tentative signs of building’. However, we indicated that USD ‘has to break clearly below 6.8500 before a sustained decline is likely’. While USD took out 6.8500 and plunged to 6.8303, the decline was short-lived as it soared to a high of 6.8760 in NY trade before extending its gains in Asian trade. The price actions suggest there is no clear USD direction and for the time being, it could trade in a relatively broad range of 6.8500/6.9250.”
-
10:32
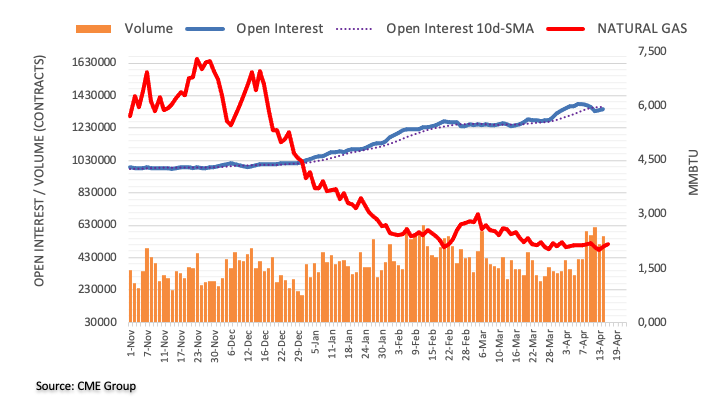
Natural Gas Futures: Scope for a near-term bounce
Considering advanced figures from CME Group for natural gas futures markets, open interest went up for the second session in a row on Friday, now by around 4.7K contracts. In the same line, volume partially reversed the previous decline and rose by around 48.7K contracts.
Natural Gas faces an interim hurdle at the 55-day SMA
Friday’s uptick in prices of the natural gas was amidst increasing open interest and volume. That said, the continuation of the upward bias appears likely in the very near term and could face a temporary hurdle at the 55-day SMA, today at $2.387 per MMBtu.
-
10:26
USD/JPY: Next on the upside comes 134.80 – UOB
Further upside could prompt USD/JPY to revisit the 134.80 region in the next weeks, note Economist Lee Sue Ann and Markets Strategist Quek Ser Leang at UOB Group.
Key Quotes
24-hour view: “Last Friday, we held the view that USD ‘has scope to test 132.00 again before a sustained recovery is likely’. USD dropped to 132.15 in Asian trade and then bounced strongly to 133.84 in NY session. Upward momentum is strong and USD is likely to strengthen further. In view of the overbought conditions, the major resistance level at 134.80 could be out of reach today. On the downside, a break of 133.25 (minor support is at 133.50) would indicate that USD is not strengthening further.”
Next 1-3 weeks: “We highlighted last Friday (14 Apr, spot at 132.60) that USD ‘appears to have moved into a consolidation phase and is likely to trade between 131.20 and 133.70 for now’. We did not expect the sharp and rapid bounce as USD soared to 133.84 in NY trade. While it is too early to expect the start of a sustained advance in USD, it is likely to trade with an upward bias to 134.80. Looking ahead, it has to break clearly above this level before further gains can be expected. Overall, only a breach of 132.70 (‘strong support’ level) would suggest that USD is not advancing to 134.80.”
-
10:26
BoJ to consider CPI projection for FY2025 between 1.6%-1.9% – Jiji
Citing sources familiar with the Bank of Japan’s (BoJ) thinking, the Japanese media agency – Jiji, reported on Monday that the central bank is looking to consider the Consumer Price Index (CPI) projection for FY2025 between 1.6%-1.9%.
The BoJ meets next week for its monetary policy review and it will be the first one under the new Governor Kazuo Ueda. Ueda’s comments last week emphasized that accommodative monetary policy in Japan is here to stay.
At the time of writing, USD/JPY is trading at 134.05, up 0.20% on the day. The pair is underpinned by increased Fed rate hike expectations.
-
10:26
USD/CAD holds steady around 1.3365-70 area amid modest USD strength, remains below 200 DMA
- USD/CAD attracts some dip-buying on the first day of a new week, though lacks follow-through.
- Softer Crude Oil prices undermine the Loonie and lend some support amid a modest USD uptick.
- Expectations for an imminent Fed rate hike pause act as a headwind for the USD and cap gains.
The USD/CAD pair reverses an intraday dip to the 1.3340 area on Monday and climbs to the top end of its daily trading range during the first half of the European session. The pair, however, remains confined well within Friday's broader trading range, below a technically significant 200-day Simple Moving Average (SMA) and is currently placed around the 1.3365-1.3370 region.
The US Dollar (USD) edges higher for the second successive day and moves away from a one-year low touched on Friday. Apart from this, a modest downtick in Crude Oil prices is seen undermining the commodity-linked Loonie and acting as a tailwind for the USD/CAD pair. The University of Michigan's preliminary report showed that one-year inflation expectations rose to 4.6% in April from 3.6% previous and fueled speculations that the Federal Reserve (Fed) might continue raising interest rates.
Adding to this, hawkish comments by Fed officials reaffirmed market expectations for another 25 bps lift-off at the next FOMC meeting in May. This, in turn, remains supportive of elevated US Treasury bond yields and continues to lend some support to the Greenback. That said, growing acceptance that the Fed will pause its rate-hiking cycle, sooner rather than later, amid signs of easing inflationary pressures, holds back the USD bulls from placing aggressive bets and seems to cap the USD/CAD pair.
The US CPI and the PPI report released last week indicated that disinflation is progressing smoothly. Moreover, the mostly downbeat US Retail Sales figures on Friday reaffirmed the view that the Fed's year-long interest rate hiking campaign is cooling domestic demand. This makes it prudent to wait for strong follow-through buying before confirming that the USD/CAD pair has formed a near-term bottom near the 1.3300 mark, or a two-month low set on Friday, and positioning for further gains.
Market participants now look to the US economic docket, featuring the release of the Empire State Manufacturing Index later during the early North American session. Apart from this, the US bond yields, along with the broader risk sentiment, will drive the USD demand and provide some impetus to the USD/CAD pair. Traders will further take cues from Oil price dynamics to grab short-term opportunities.
Technical levels to watch
-
10:20
Crude Oil Futures: Further upside in the pipeline
CME Group’s flash data for crude oil futures markets noted traders increased their open interest positions by around 14.6K contracts on Friday, reversing the previous daily drop. Volume followed suit and rose by around 142.5K contracts, resuming the uptrend after the previous pullback.
WTI: Extra gains need to clear the 200-day SMA
Friday’s small advance in prices of the WTI was accompanied by rising open interest and volume and is indicative that further upside lies ahead in the very near term. The surpass of the key 200-day SMA at $83.04 could motivate the commodity to embark on a potential move to the November 2022 high at $93.73 (November 7).
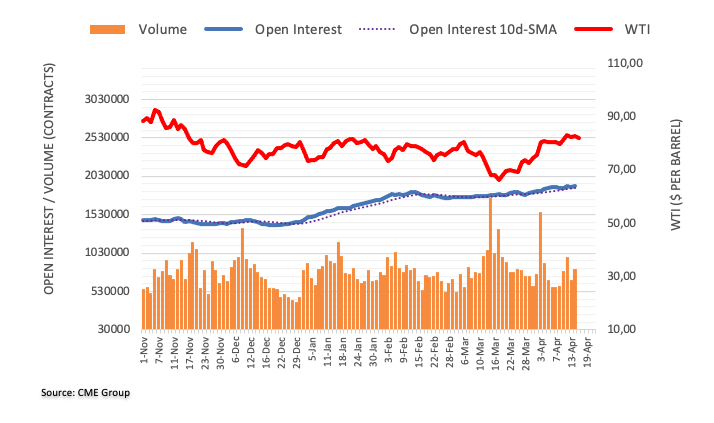
-
10:05
US: Drivers for the week ahead – BBH
Analysts at BBH offer a sneak peek at what will be the key market-moving events from the US that will be closely eyed in the week ahead.
Key quotes
“The Fed Beige Book for the May 2-3 FOMC meeting will be released Wednesday. Since the March 21-22 meeting, the data suggest that activity is slowing, the labor market is softening, and price pressures are easing. Notably, supply chains continue to improve. We believe the Beige Book will highlight these trends that support a pause after what is widely expected to be another 25 bp hike whilst leaving the door open for further tightening if needed.”
“Fed tightening expectations have picked up bit. WIRP suggests over 80% odds of 25 bp hike at the May 2-3 meeting, up from 70% at the start of last week and 50% at the start of the week before that. After that, it’s all about the cuts. However, only one cut is priced in by year-end vs. two at the start of last week. In that regard, Powell has said that Fed officials “just don’t see” any rate cuts this year.“
“S&P Global preliminary April PMI readings Friday will be a data highlight. Manufacturing is expected at 49.0 vs. 49.2 in March, services is expected at 51.5 vs. 52.6 in March, and the composite is expected at 51.2 vs. 52.3 in March. If so, this would suggest that the U.S. economy is still expanding as Q2 gets under way but at a slower pace than what was seen at the end of Q1. Of note, the Atlanta Fed’s GDPNow model is currently tracking Q1 growth at 2.5% SAAR, up from 2.2% previously. Next model update will come Tuesday.”
“Housing data are expected to show continued weakness. April NAHB housing market index will be reported Monday and is expected at 45 vs. 44 in March. March building permits and housing starts will be reported Tuesday and are expected at -6.5% m/m and -3.5% m/m, respectively. March existing home sales will be reported Thursday and are expected at -1.8% m/m vs. 14.5% in February.”
-
09:59
US: Inflation high and sticky; bank tensions ease – ANZ
Analysts at Australia and New Zealand (ANZ) banking group offer a snippet on the state of the US economy in their latest client note.
Key quotes
“Tensions in the US banking sector continue to ease. There has been incrementally less use of the Fed’s emergency lending facilities, while bank lending rose for the first time in three weeks and deposits increased.”
“The minutes to the 2-3 March FOMC meeting showed that all Fed officials agreed to raise the target policy range by 25bp as they weighed up the risks of persistently high inflation and a tightening in credit conditions following a string of bank failures.”
“Core CPI inflation eased in March (0.4% m/m) relative to February (0.5%) as rents came in softer than expected. Even though there was some softening in inflation, it remains well above levels consistent with 2%.”
-
09:33
GBP/USD remains on the defensive around 1.2400 mark amid modest USD strength
- GBP/USD struggles to gain any meaningful traction on Monday and oscillates in a range.
- Bets for another 25 Fed rate hike in May underpin the USD and cap gains for the major.
- The prospects for an imminent Fed rate-hike pause keep a lid on any further USD gains.
The GBP/USD pair kicks off the new week on a subdued note and seesaws between tepid gains/minor losses through the early part of the European session. The pair is currently placed around the 1.2400 mark, nearly unchanged for the day, and for now, seems to have stalled its retracement slide from the highest level since June 2022 touched on Friday.
The US Dollar (USD) edges higher for the second successive day and looks to build on the previous day's recovery move from a one-year low, which, in turn, is seen acting as a headwind for the GBP/USD pair. The University of Michigan's preliminary report showed that one-year inflation expectations rose to 4.6% from 3.6% in March and fueled speculations that the Federal Reserve (Fed) might continue raising interest rates. In fact, the markets are pricing in a greater chance of another 25 bps lift-off at the next FOMC meeting in May. This remains supportive of elevated US Treasury bond yields and continues to underpin the Greenback.
Investors, however, seem convinced that the US central bank will pause its rate-hiking cycle, sooner rather than later, amid signs of easing inflationary pressures. The expectations were boosted by the US CPI and the PPI report released last week, which indicated that disinflation is progressing smoothly. Moreover, the mostly downbeat US Retail Sales figures on Friday reaffirmed the view that the Fed's year-long interest rate hiking campaign is cooling domestic demand. This, in turn, is holding back the USD bulls from placing aggressive bets and acting as a tailwind for the GBP/USD pair, warranting some caution for aggressive bearish traders.
In the absence of any relevant market-moving macro data from the UK, trades now look to the US economic docket, featuring the release of the Empire State Manufacturing Index later during the early North American session. Apart from this, the US bond yields, along with the broader risk sentiment, will drive the USD demand and produce short-term trading opportunities around the GBP/USD pair. The focus will then shift to the monthly UK employment details on Tuesday, which should provide some meaningful impetus.
Technical levels to watch
-
09:04
USD Index trades without direction below 102.00
- The index climbs to the 101.80 during early trade on Monday.
- The Fed is likely to hike rates by 25 bps at the May 3 gathering.
- NAHB Index, TIC Flows, NY Empire State index next on tap.
The greenback gives away gains to the 101.80 region recorded earlier in the Asian trading hours and returns to the 101.60 zone when gauged by the USD Index (DXY) on Monday.
USD Index looks at 102.00
The index struggles to regain upside traction amidst the broad-based absence of a clear direction in the global markets following the opening bell in the old continent on Monday.
Indeed, the dollar surrenders the initial uptick to the 101.80/85 band against the backdrop of a generalized consolidative mood in the market and the tepid attempt to extend the march north in US yields.
In the meantime, bets on a 25 bps rate hike by the Federal Reserve at the May 3 event remain on the rise and mainly propped up by hawkish Fedspeak, while the still elevated inflation also seems to maintain the prudent stance among investors.
Later in the NA session, the NAHB Housing Market Index is due seconded by the NY Empire State Index and TIC Flows.
What to look for around USD
The dollar’s upside appears to have met a tough barrier around 101.80 so far at the beginning of the week.
In the meantime, the marked retracement in the buck since March has been underpinned by the pick-up in the perception that the Federal Reserve could make a pause in its current tightening cycle just after the May meeting.
In favour of a pivot in the Fed’s normalization process, however, still emerges the persevering disinflation, nascent weakness in some key fundamentals and somewhat persistent concerns surrounding the banking sector.
Key events in the US this week: NAHB Housing Market Index, TIC Flows (Monday) – Building Permits, Housing Starts (Tuesday) – MBA Mortgage Applications, Fed’s Beige Book (Wednesday) – Initial Claims, Philly Fed Index, CB Leading Index, Existing Home Sales (Thursday) - Flash Manufacturing/Services PMIs (Friday).
Eminent issues on the back boiler: Persistent debate over a soft/hard landing of the US economy. Terminal Interest rate near the peak vs. speculation of rate cuts in 2024. Fed’s pivot. Geopolitical effervescence vs. Russia and China. US-China trade conflict.
USD Index relevant levels
Now, the index is advancing 0.03% at 101.60 and the next resistance level emerges at 103.05 (monthly high April 3) seconded by 103.52 (100-day SMA) and then 105.11 (weekly high March 15). On the flip side, the breach of 100.78 (2023 low April 14) would open the door to 100.00 (psychological level) and finally 99.81 (weekly low April 21 2022).
-
09:02
Turkey Budget Balance climbed from previous -170.56B to -47.22B in March
-
09:01
Italy Consumer Price Index (EU Norm) (YoY) below expectations (8.2%) in March: Actual (8.1%)
-
09:01
Italy Consumer Price Index (YoY) below expectations (7.7%) in March: Actual (7.6%)
-
09:01
Italy Consumer Price Index (MoM) below forecasts (-0.3%) in March: Actual (-0.4%)
-
09:01
Italy Consumer Price Index (EU Norm) (MoM) in line with forecasts (0.8%) in March
-
08:45
Gold Futures: A sustained decline appears unlikely
Open interest in gold futures markets shrank by around 9.5K contracts after three consecutive daily builds on Friday according to preliminary readings from CME Group. Volume, instead, extended the upside for the fourth consecutive session, this time by more than 35K contracts.
Gold retargets the 2023 high near $2050
Friday’s sharp pullback in gold prices was on the back of declining open interest, which is suggestive that a deeper retracement seems out of favour for the time being. Against that, the resumption of the uptrend should retarget the YTD top at $2048 per ounce troy (April 13).
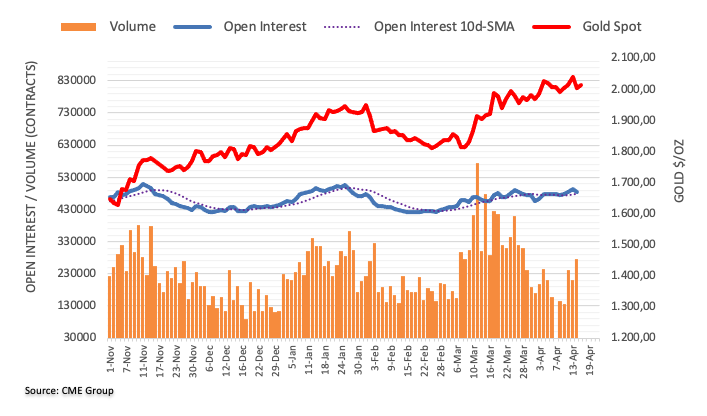
-
08:43
AUD/USD faces further consolidation near term – UOB
In the opinion of Economist Lee Sue Ann and Markets Strategist Quek Ser Leang at UOB Group, AUD/USD is still seen navigating the 0.6620-0.6785 range in the near term.
Key Quotes
24-hour view: “Last Friday, we highlighted that AUD could continue to advance. We added, ‘severely overbought conditions suggest that AUD might not be able to break clearly above 0.6820 today’. While AUD rose to a high of 0.6808, it plunged to a low of 0.6595 in NY trade. The outsized decline appears to be overdone but there is scope for the weakness in AUD to extend to 0.6675 before stabilization is likely. The major support level at 0.6620 is not expected to come under threat. Resistance is at 0.6730, followed by 0.6755.”
Next 1-3 weeks: “After AUD surged last Thursday, we highlighted on Friday (14 Apr, spot at 0.6785) that AUD ‘is likely to advance further’. Our view was proven incorrect as AUD plunged in NY trade and took out our ‘strong support’ level of 0.6700 (low has been 0.6695). The sharp but short-lived swings have resulted in a mixed outlook. For the time being, there is no clear direction and AUD could trade in a relatively broad range of 0.6620/0.6785.”
-
08:35
GBP/USD faces a major support at 1.2275 – UOB
Further downside in GBP/USD is likely to face a tough contention around 1.2275 according to Economist Lee Sue Ann and Markets Strategist Quek Ser Leang at UOB Group.
Key Quotes
24-hour view: “The sharp drop of -0.87% (1.2414) in GBP last Friday came as a surprise. While severely oversold, the decline could extend but a break of 1.2345 is unlikely (next support is at 1.2275). On the upside, a break of 1.2465 (minor resistance is at 1.2435) would indicate that the weakness in GBP has stabilized”.
Next 1-3 weeks: “Our view from last Friday (14 Apr, spot at 1.2525) wherein GBP ‘is likely to advance further to 1.2600’ was proven incorrect quickly as it plummeted below our ‘strong support’ level of 1.2440 before closing sharply lower by 0.87% (NY close of 1.2414). The 0.87% drop is the largest 10day drop in about five weeks. Despite the sharp drop, it is too early to expect a sustained decline in GBP. However, there is room for GBP to edge lower but any decline is unlikely to break clearly below the major support at 1.2275. The downside risk is intact as long as GBP stays below 1.2510 in the next few days”.
-
08:31
USD/JPY eases from over one-month peak, trades with modest gains just below 134.00
- USD/JPY edges higher for the second successive day, albeit lacks any follow-through buying.
- Expectations for an imminent Fed rate-hike pause act as a headwind for the USD and the pair.
- A combination of factors weighs on the JPY and continues to lend some support to the major.
The USD/JPY pair trims a part of its modest intraday gains to over a one-month high touched earlier this Monday and retreats below the 134.00 mark during the early European session.
Expectations that the Federal Reserve (Fed) will pause its rate-hiking cycle, sooner rather than later, fail to assist the US Dollar (USD) to capitalize on its recovery move from a one-year low, which, in turn, acts as a headwind for the USD/JPY pair. The bets were lifted after the US CPI and the PPI report released last week indicated that disinflation is progressing smoothly. That said, speculations that the US central bank might continue raising rates in the wake of a rise in short-term inflation expectations should help limit any meaningful downfall for the Greenback and the major, at least for now.
In fact, the University of Michigan's preliminary report showed that one-year inflation expectations rose to 4.6% from 3.6% in March and Consumer Sentiment Index inched up from 62.0 to 63.5 in April. Adding to this, impressive bank earnings eased concerns about a banking crisis that unfolded in March. Apart from this, resilience in US core retail sales suggested that the US economy is not so bad. This reaffirms expectations for another 25 bps lift-off at the next FOMC policy meeting in May, which remains supportive of elevated US Treasury bond yields and lends some support to the USD.
The two-year US Government bond, which typically moves in step with interest rate expectations, and the benchmark 10-year Treasury note, hold steady near a two-week top. The resultant widening of the US-Japan rate differential, along with the Bank of Japan's (BoJ) dovish near-term outlook, might continue to undermine the Japanese Yen (JPY) and further contribute to limiting the downside for the USD/JPY pair. Even from a technical perspective, a sustained strength beyond the 50-day and the 100-day Simple Moving Averages (SMAs) supports prospects for some near-term appreciating move.
Market participants now look forward to the US economic docket, featuring the release of the Empire State Manufacturing Index later during the early North American session. This, along with the US bond yields, should influence the USD price dynamics and provide some impetus to the USD/JPY pair. Traders will further take cues from the broader risk sentiment, which tends to drive demand for the safe-haven JPY, to grab short-term opportunities.
Technical levels to watch
-
08:25
ECB’s Kazaks: ECB has the option of a 25bps or 50bps move in May
European Central Bank (ECB) policymaker Martins Kazaks said on Monday, the central bank has the option of 25 basis points (bps) or 50 bps move in May.
Over the weekend, President Christine Lagarde said that she has “huge confidence” the US will not allow the country to default on its own debt.
Market reaction
EUR/USD was last seen trading at 1.0991, down 0.07% on the day.
-
07:59
EUR/GBP Price Analysis: Reverses from 10-week-old resistance line, snaps four-day uptrend near 0.8850
- EUR/GBP takes offers to renew intraday low during the first loss-making day in five.
- Upbeat oscillators challenge the quote’s U-turn from 2.5-month-old resistance line.
- Bears need validation from four-month-old ascending support line.
EUR/GBP bears are back in the race during early Monday as the quote drops to 0.8845 amid the initial hours of the European session, after being absent in the last four days.
In doing so, the cross-currency pair retreats from a three-week high while snapping a four-day winning streak.
That said, a downward-sloping resistance line from early February, around 0.8860 by the press time, triggers the latest pullback in the EUR/GBP prices. However, the pair’s downside appears limited as the 50-DMA level of 0.8823 puts a short-term floor under the price.
Following that, a fortnight-long ascending support line near 0.8790 can check the EUR/GBP bears before directing them to the key trend line support stretched from December 19, 2022, around 0.8730 at the latest.
It’s worth noting that the bullish MACD signals and the rising RSI (14) line, not overbought, keep the pair buyers hopeful.
Meanwhile, a clear upside break of the aforementioned resistance line from early February, close to 0.8860 can quickly propel the prices toward the 0.8900 round figure.
In a case where the EUR/GBP bulls keep the reins past 0.8900, the previous monthly high of around 0.8925 holds the key to the pair’s further advances towards the yearly high marked in February near 0.8980.
Should the quote remains firmer past 0.8980, the 0.9000 round figure acts as an extra filter towards the north.
EUR/GBP: Daily chart
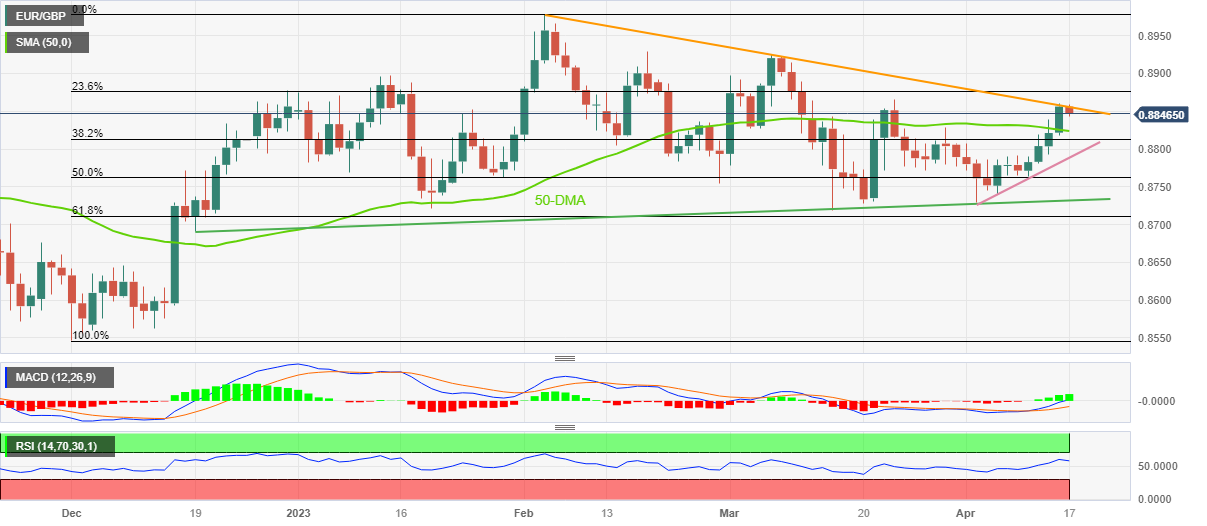
Trend: Limited downside expected
-
07:55
Forex Today: US Dollar clings to Friday's recovery gains to start the week
Here is what you need to know on Monday, April 17:
Following the sharp selloff seen for the majority of the previous week, the US Dollar (USD) managed to erase some of the losses it suffered against its rivals ahead of the weekend. The US Dollar Index keeps its footing at the beginning of the new week as investors await the next catalyst. Federal Reserve Bank of New York's Empire State Manufacturing Survey will be the only data featured in the US economic docket and market participants will pay close attention to comments from central bankers.
On Friday, the US Census Bureau reported that Retail Sales in the United States declined 1% on a monthly basis in March to $691.7 billion. This reading followed February's contraction of 0.2% and came in worse than the market expectation for a decrease of 0.4%. Nevertheless, hawkish comments from Fed policymakers helped the US Dollar gather strength during the American trading hours. Additionally, the one-year inflation expectation component of the University of Michigan's Consumer Sentiment Survey jumped to 4.6% in April from 3.6% in March, providing an additional boost to the USD.
Early Monday, the benchmark 10-year US Treasury bond yield holds steady at around 3.5%, supporting the USD. Meanwhile, US stock index futures trade modestly higher on the day and the US Dollar Index clings to small daily gains above 101.50.
Following Friday's sharp pullback, AUD/USD has managed to stabilize above 0.6700. In the early trading hours of the Asian session on Tuesday, the Reserve Bank of Australia will release the minutes of its last policy meeting and the Chinese economic docket will feature first-quarter Gross Domestic Product (GDP) figures.
EUR/USD suffered large losses on Friday but ended up closing the seventh straight week in positive territory. Early Monday, the pair fluctuates in a tight channel below 1.1000. Later in the day, European Central Bank (ECB) President Christine Lagarde will be delivering a speech.
GBP/USD has managed to recover above 1.2400 in the European morning on Monday following Friday's drop. Sir Jon Cunliffe, Deputy Governor for Financial Stability of the Bank of England, is scheduled to speak at 1300 GMT.
Gold erased nearly all of its weekly gains on Friday but closed the week slight above $2,000. XAU/USD edged higher early Monday and was last seen trading in positive territory slightly above $2,010.
USD/JPY trades in positive territory at around 134.00 to start the new week on the back of Friday's impressive rally.
Bitcoin failed to find direction over the weekend but came under renewed bearish pressure early Monday. BTC/USD was last seen losing more than 1% slightly below $30,000. Ethereum extended its rally and touched its highest level since May at $2,142 on Sunday. ETH/USD seems to have gone into a consolidation phase early Monday at around $2,100.
-
07:40
WTI crude oil bulls retreat towards $82.00 amid economic fears, China Q1 GDP, US PMIs eyed
- WTI crude oil fails to cheer US Dollar retreat as it drops towards intraday low.
- Concerns that higher Oil price, challenges to economic growth can recall WTI bears.
- China Q1 GDP, preliminary readings for April’s US PMIs will be in focus.
WTI crude oil approaches intraday low, down 0.33% on a day around $82.30 by the press time, as energy buyers run out of steam after a four-week uptrend.
The black gold’s latest weakness ignores the US Dollar’s retreat amid fears of easing energy demand due to the challenges to the economic outlook. Also allowing the commodity price to pare recent gains is the cautious mood ahead of this week’s key data/events for the quote, namely the first readings of the US S&P Global Manufacturing and Non-Manufacturing PMI for April and China’s first quarter (Q1) Gross Domestic Product (GDP).
Statements from the International Energy Agency’s (IEA) monthly oil market report exert downside pressure on WTI crude oil. “Output cuts announced by OPEC+ producers risk exacerbating an oil supply deficit expected in the second half of the year and could hurt consumers and global economic recovery.”
On the same line could be doubts about the economic recovery in China, one of the world’s biggest Oil consumers. That said, the latest PMIs from the Dragon Nation haven’t been convincing enough to market expectations of a strong recovery of Beijing. Furthermore, the looming geopolitical crisis between the US and China also exerts downside pressure on black gold.
It should be noted that the recently firmer US consumer-centric figures and hawkish comments from the Fed officials pushed back the dovish bias from the US central bank and allowed the US Dollar to rebound from a one-year low, which in turn prods the Oil buyers.
Moving on, WTI crude oil buyers need to remain cautious ahead of China's Q1 GDP and the US PMI. That said, the Oil bulls seem to run out of steam and hence any softer economics from any of the critical Oil consumers, namely the US and China, may recall the commodity sellers.
Technical analysis
A daily closing below a one-month-old ascending support line, around $82.30 by the press time, becomes necessary for the WTI crude oil sellers to retake control.
-
07:36
India WPI Inflation registered at 1.34%, below expectations (1.87%) in March
-
07:12
GBP/JPY Price Analysis: Rising wedge challenges recovery around mid-166.00s
- GBP/JPY prints mild gains within bearish chart formation.
- Downbeat MACD signals, clear break of three-week-old previous support line keeps sellers hopeful.
- 100, 200 SMAs can prod bears before directing them to theoretical target of 162.30.
- Bulls need to cross the 167.00 hurdle to retake control.
GBP/JPY remains mildly bid near 166.40 heading into Monday’s London open. In doing so, the cross-currency pair struggles to defend the four-day uptrend inside a short-term rising wedge bearish chart formation.
That said, the bearish MACD signals and the quote’s downside break of an upward-sloping support line from late March, now immediate resistance around 166.80, adds strength to the downside bias.
However, a clear break of the stated wedge’s lower line, close to 165.80 at the latest, becomes necessary for the GBP/JPY bear’s conviction.
Even so, the 100-SMA and the 200-SMA, respectively near 164.00 and 163.00, can challenge the cross-currency pair’s likely fall past 166.80 towards the theoretical target of around 162.30.
It’s worth noting that the monthly low of around 162.80 also acts as an extra filter towards the south.
Meanwhile, GBP/JPY recovery needs to cross the previous support line, close to 166.80, to convince intraday buyers.
Following that, the stated wedge’s top line and the recent high, close to 167.00, may test the upside before defying the bearish chart formation.
In that case, a run-up towards the late 2022 peak of around 169.30 and then towards the 170.00 round figure can’t be ruled out.
Overall, GBP/JPY buyers appear to run out of steam ahead of the key data week for the UK.
GBP/JPY: Four-hour chart
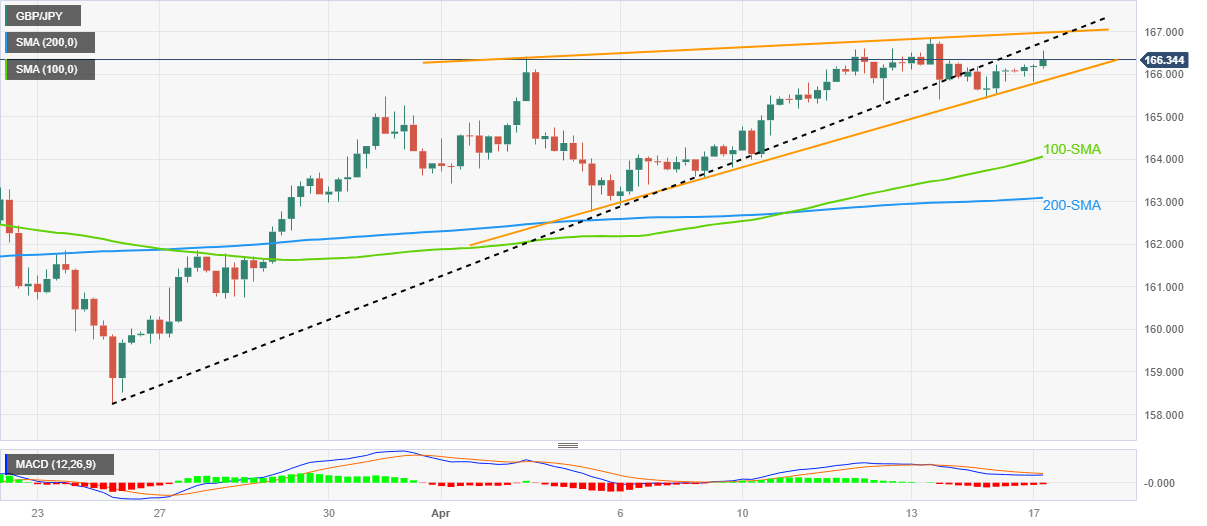
Trend: Pullback expected
-
07:10
FX option expiries for Apr 17 NY cut
FX option expiries for Apr 17 NY cut at 10:00 Eastern Time, via DTCC, can be found below.
- EUR/USD: EUR amounts
- 1.0920 528m
- 1.0935 931m
- 1.0950-55 637m
- 1.1050 2.0b
- USD/JPY: USD amounts
- 132.50 1.0b
- 133.00-11 1.1b
- AUD/USD: AUD amounts
- 0.6700 2.3b
-
07:09
USD/CAD drops below 1.3350 as USD Index loses bullish momentum, Canada Inflation eyed
- USD/CAD has dropped below 1.3350 amid exhaustion in the upside momentum of the USD Index.
- Federal Reserve to hike rates despite softening of US Retail Sales as the core inflation is extremely stubborn.
- Bank of Canada might continue its neutral stance on interest rates if inflation continues to decline ahead.
- USD/CAD is declining towards potential supports placed at 1.3267 and 1.3226 respectively.
The USD/CAD pair has slipped lower after displaying a back-and-forth action round 1.3360 in the early European session. The Loonie asset has sensed selling pressure as the US Dollar Index (DXY) has witnessed exhaustion in the bullish momentum after meeting the critical resistance of 101.80. Also, oil prices are rangebound, which has paused the Canadian Dollar. The USD Index has corrected to near 101.64 and is not showing any sign of recovery, at the time of writing.
It is worth noting that Canada is the leading exporter of oil to the United States and a change in oil price critically impacts the Canadian Dollar.
S&P500 futures generated some gains in early Asia and are managing to hold themselves, portraying a recovery in the risk appetite theme. US equities were mildly bearish on Friday as chances for consecutive 25 basis points (bps) rate hikes from the Federal Reserve (Fed) remained solid despite the release of the downside United States Retail Sales data. Also, American stocks are showing stock-specific action amid the quarterly result season.
The demand for US government bonds seems subdued as investors are divided on whether to turn bullish on the economy on expectations that the Federal Reserve will pause the rate-hiking spell sooner or to remain cautious about one more 25 bps rate hike from the Federal Reserve. Yields offered on 10-year US Treasury bonds are hovering around 3.52%.
Federal Reserve to hike rates despite softening of US Retail Sales
There is no denying the fact that loosening the United States labor market conditions, softening Consumer Price Index (CPI) and Producer Price Index (PPI) reports, and easing retail demand are conveying that the Federal Reserve has to pause its policy-tightening spell sooner.
On Friday, monthly US Retail Sales (Mar) contracted dramatically by 1.0% while the street anticipated a contraction of 0.4%. Squeezing retail demand was the outcome of higher rates from the Federal Reserve and tight credit conditions from US commercial banks. The households have postponed demand for costly goods to avoid the higher cost of financing.
However, the core inflation is extremely stubborn, which indicates that the fight against stick inflation has a lot more to come.
Fed Governor Christopher Waller said on Friday that despite a year of aggressive rate increases, U.S. central bankers "haven't made much progress" in returning inflation to their 2% target and need to move rates higher still. He further added “The job on inflation was still “not done,” as inflation remains “far too high.”
Canadian Inflation would keep Canadian Dollar volatile
Investors are eyeing the release of Tuesday’s Canada’s inflation data (Mar), which will provide guidance on monetary policy action by the Bank of Canada (BoC). As per the expectations, the headline inflation will decelerate to 4.3% from the prior release of 5.2%. However, the monthly headline figure is seen expanding by 0.6% against an expansion of 0.4%, reported earlier.
Core CPI that excludes oil and food prices would soften to 4.2% vs. the former release of 4.7%. This may allow the Bank of Canada to continue its unchanged policy stance. Canada’s inflation is softening continuously, which has been supporting Bank of Canada Governor Tiff Macklem to remain neutral on interest rates.
USD/CAD technical outlook
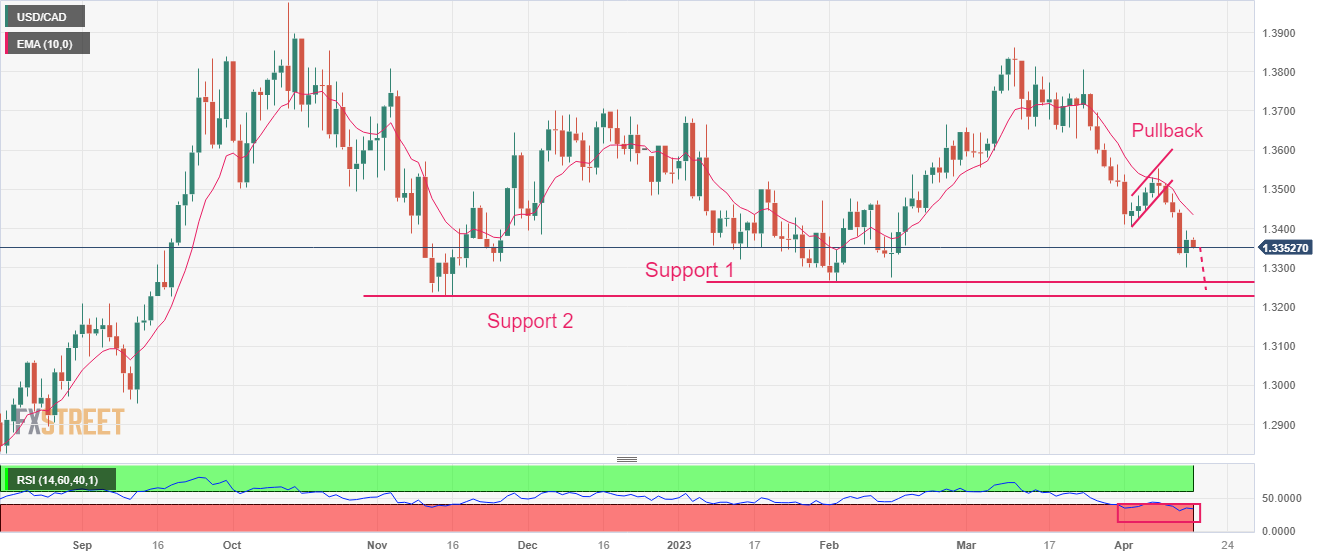
USD/CAD resumed its downside journey after a pullback move to near 10-period Exponential Moving Average (EMA) around 1.3533 on a daily scale. Investors capitalized on the pullback move as a fresh selling opportunity. Potential supports are placed from February 01 and 15 November 2022 low at 1.3267 and 1.3226 respectively.
The Relative Strength Index (RSI) (14) has slipped again into the bearish range of 20.00-40.00 after a failed attempt for a range shift, which indicates that the upside is capped.
-
07:01
Norway Trade Balance below forecasts (90.7B) in March: Actual (71.1B)
-
06:55
EUR/USD fades the initial drop to 1.0960 ahead of Lagarde
- EUR/USD drops and bounces off 1.0960 region.
- The dollar extends Friday’s optimism into the new week.
- Chair Lagarde speaks later in the European afternoon.
EUR/USD starts the week slightly on the defensive and manages to rebound from earlier lows near 1.0960.
EUR/USD focuses on ECB, data
EUR/USD retargets the key 1.1000 barrier on the back of the continuation of the recovery in the dollar, while the price action in the risk complex appears subdued ahead of the opening bell in the old continent on Monday.
In the meantime, German 10-year yields navigate the upper end of the range and remain underpinned by the persistent hawkish narrative among ECB’s rate setters, which opened the door to a 50 bps rate hike at the May meeting.
Still around the ECB, a recent survey by news agency Bloomberg sees the bank’s policy rate peaking around 3.75% in July.
In the domestic calendar, ECB Chair C. Lagarde speaks in New York, while Board members McCaul and Tuominen are also due to speak later in the session.
Across the pond, the NY Empire State Index, the NAHB Index and TIC Flows are all scheduled on Monday.
What to look for around EUR
EUR/USD keeps receding from recent tops in the proximity of 1.1100 during last week on the back of some corrective upside in the dollar.
In the meantime, price action around the single currency should continue to closely follow dollar dynamics, as well as the incipient Fed-ECB divergence when it comes to the banks’ intentions regarding the potential next moves in interest rates.
Moving forward, hawkish ECB-speak continue to favour further rate hikes, although this view appears in contrast to some loss of momentum in economic fundamentals in the region.
Key events in the euro area this week: Italy Final Inflation Rate, ECB Lagarde (Monday) – Germany, EMU ZEW Economic Sentiment (Tuesday) - EMU Final Inflation Rate (Wednesday) – ECB Accounts, EMU Flash Consumer Confidence (Thursday) – Advanced Manufacturing/Services PMIs (Friday).
Eminent issues on the back boiler: Continuation (or not) of the ECB hiking cycle. Impact of the Russia-Ukraine war on the growth prospects and inflation outlook in the region. Risks of inflation becoming entrenched.
EUR/USD levels to watch
So far, the pair is gaining 0.01% at 1.0994 and a break above 1.1075 (2023 high April 14) would target 1.1100 (round level) en route to 1.1184 (weekly high March 21 2022). On the flip side, the next support comes at 1.0788 (monthly low April 3) followed by 1.0756 (55-day SMA) and finally 1.0712 (low March 24).
-
06:42
AUD/USD sticks to mild gains above 0.6700 as US dollar fades recovery amid mixed sentiment
- AUD/USD consolidates the biggest daily loss since early March with mild gains, grinds near intraday high of late.
- US Dollar seeks fresh clues to extend previous day’s rebound from one-year low.
- China-linked headlines, light calendar allow Aussie pair buyers to reverses the pullback from multi-day top.
- RBA Minutes, China Q1 GDP and US PMIs are in the spotlight for fresh impulse.
AUD/USD treads water around 0.6710, licking its wounds after the biggest daily slump in six weeks, as market players seek fresh clues to extend the previous day’s moves heading into Monday’s European session. In doing so, the Aussie pair also takes clues from China, as well as the US Dollar’s retreat, to print mild gains of late.
That said, the weekend data suggesting a heavy jump in China’s New Home Prices for March, the highest in 21 months, seem to underpin the AUD/USD pair’s recovery. Adding strength to the corrective bounce is the US Dollar’s retreat amid a reassessment of the previously hawkish Fed concerns.
US Dollar Index (DXY) eases to 101.60 as it fades the previous day’s rebound from the lowest levels in one year. It should be noted that the previous day’s mostly positive US consumer-centric data and hawkish Fed talks allowed the Fed bets to push back the odds of the Federal Reserve’s (Fed) longer pause to rate cuts after they stop the rate hike trajectory. Also, the US central bank is almost certain to announce a 0.25% rate lift in May.
It’s worth observing that an absence of a meaningful jump in the market’s hawkish Fed concerns joins the recent challenges to the US Dollar’s reserve currency status to also allow the AUD/USD rebound. Furthermore, hopes that the US will be able to overcome the debt default also underpin the cautious optimism in the market and allow the risk barometer pair to grind higher.
Alternatively, the Reserve Bank of Australia’s (RBA) pause to rate hike trajectory and the likely escalation in the US-China tension, due to Beijing’s ties with Russia, seem to keep a tab on the AUD/USD prices.
While portraying the mood, the S&P 500 Futures print 0.20% intraday gains as it reverses the previous day’s pullback from the highest levels since early February around 4,172. Further, the US 10-year and two-year Treasury bond yields pare the previous week’s 3.0% gains with minor losses around 3.52%% and 4.11% respectively.
Moving on, a light calendar restricts immediate AUD/USD moves ahead of Tuesday’s RBA Meeting Minutes and China's Q1 GDP.
Technical analysis
Despite the latest corrective bounce, the AUD/USD buyers remain off the table unless witnessing a clear upside break of the 0.6800 hurdle comprising a convergence of the 100-DMA and six-week-old ascending resistance line.
-
06:41
ECB deposit rate to peak at 3.75% in July – Bloomberg survey
According to the economists surveyed by Bloomberg, a majority of them expect the European Central Bank (ECB) to hike rates by 25 basis points (bps) at its May, June and July policy meetings before pausing its tightening cycle.
Key takeaways
“That would take the deposit rate to 3.75%, where it would stay through the rest of the year.”
“The survey shows economist expectations are broadly in line with those of investors, who’ve pared back bets on the peak of this cycle of hikes following the banking collapses in the US and Switzerland.”
“Underlying inflation might have peaked in regard to quarterly averages, but will still be at 5.5% this quarter and is set to surpass the headline number in the second half of this year.”
Related reads
- US Dollar: Coming to a fork in the road – Goldman Sachs
- EUR/USD Outlook: Corrective pullback might still be seen as a buying opportunity
-
06:24
EUR/USD: Upside momentum alleviated below 1.0940 – UOB
Economist Lee Sue Ann and Markets Strategist Quek Ser Leang at UOB Group suggest further gains in EUR/USD remain on the cards above 1.0940 in the near term.
Key Quotes
24-hour view: “We expected EUR to ‘advance further’ last Friday but we were of the view that ‘the next significant resistance at 1.1120 is likely out of reach for today’. We noted, there was a minor resistance at 1.1080. However, EUR only eked out a fresh high of 1.1075 and then tumbled to end the day lower by -0.40% (1.1000). While there is scope for EUR to drop further, any weakness is viewed as part of a 1.0940/1.1045 range. To put it another way, a clear break below 1.0940 is unlikely.”
Next 1-3 weeks: “Last Friday (14 Apr, spot at 1.1040), we highlighted that EUR ‘is likely to continue to head higher’ and ‘the next level to aim for is 1.1120, followed by 1.1160’. We did not expect the sharp pullback to 1.0971. While upward momentum is beginning to fade, only a breach 1.0940 (no change in ‘strong support’ level) would indicate that EUR is not strengthening further.”
-
06:13
Asian Stock Market: Shanghai soars as PBoC promises prudent policy, oil remains under pressure
- Asian stocks are showing country-specific action despite a less volatile S&P500.
- Chinese stocks are skyrocketing as the PBoC has promised a prudent monetary policy to trigger domestic demand.
- A recovery in the US Dollar has weighed pressure on the oil price.
Markets in the Asian domain are showing country-specific action. Volatility in Asian stocks seems higher despite S&P500 remaining less volatile on Friday. US equities remained choppy but settled Friday’s session with some losses. Investors remained cautious about S&P500 as the Federal Reserve (Fed) is expected to continue its policy-tightening spell to its May monetary policy, citing that United States core inflation is extremely persistent.
The US Dollar Index (DXY) is showing signs of loss in the upside momentum after printing a high of 101.80. The upside in the USD Index seems capped due to the release of the weak US retail demand data. Retail Sales data contracted by 1.0% against expectations of 0.4% reported earlier as households postponed demand for goods with high price tags to avoid the higher cost of financing.
At the press time, Japan’s Nikkei225 remains flat, ChinaA50 soars 1.10%, Hang Seng gained 0.62%, and Nifty50 tumbled 1.10%.
Chinese stocks are skyrocketing as the People’s Bank of China (PBoC) has promised a prudent monetary policy to trigger domestic demand. Chinese inflation has been softening over the past few months despite the reopening of the economy after the rollback of pandemic controls. The PBoC is focusing on expanding retail demand as it will increase the confidence of consumers in the economy.
Meanwhile, economist at UOB Group Ho Woei Chen reviewed the latest trade balance figures in China. He stated, “Exports unexpectedly surged in Mar while imports were less robust but still came in above consensus expectation. China’s shipments improved amid the normalization of domestic production and stronger demand from the Asian and European markets.”
Japanese markets have turned choppy after a rally of a few trading sessions. The expectations of the continuation of expansionary policy from the Bank of Japan (BoJ) strengthened equities.
On the oil front, a recovery in the US Dollar has weighed pressure on the oil price. The black gold is hovering around $82.70.
-
06:11
USD/MXN Price Analysis: Mexican Peso appears well-set for fresh 2023 high past 18.00
- USD/MXN holds lower grounds after breaking five-week-old key support line.
- Bearish MACD signals, absence of oversold RSI conditions keep Mexican Peso buyers hopeful of targeting 17.80.
- July 2017 low becomes crucial support for USD/MXN bears to watch.
- Buyers remain off the table below 200-SMA hurdle, support-turned-resistance line from March guards immediate upside.
USD/MXN bears attack 18.00 threshold after breaking a short-term key support line early Monday. That said, the Mexican Peso pair remains pressured towards the yearly low marked in early March, around 17.98 by the press time.
Given the absence of an oversold RSI (14), the USD/MXN price is likely to decline further and hence a fresh 2023 bottom, currently around 17.89 can’t be ruled out.
In that case, multiple lows marked in June 2017 around 17.80 gain the market’s attention. However, the year 2017 bottom surrounding 17.44 could challenge the USD/MXN bears afterward.
If not, then the quote’s south run towards the 17.00 round figure can’t be ruled out.
On the flip side, recovery moves need to stay beyond the immediate support-turned-resistance line, around the 18.00 threshold.
Following that, a three-week-old resistance line near 18.05 could challenge the USD/MXN rebound.
However, the Mexican Peso buyers keep the reins unless the quote stays comfortably beyond the 200-SMA hurdle surrounding 18.32.
Overall, USD/MXN is well set for fresh 2023 bottom but the downside room appears limited.
USD/MXN: Four-hour chart
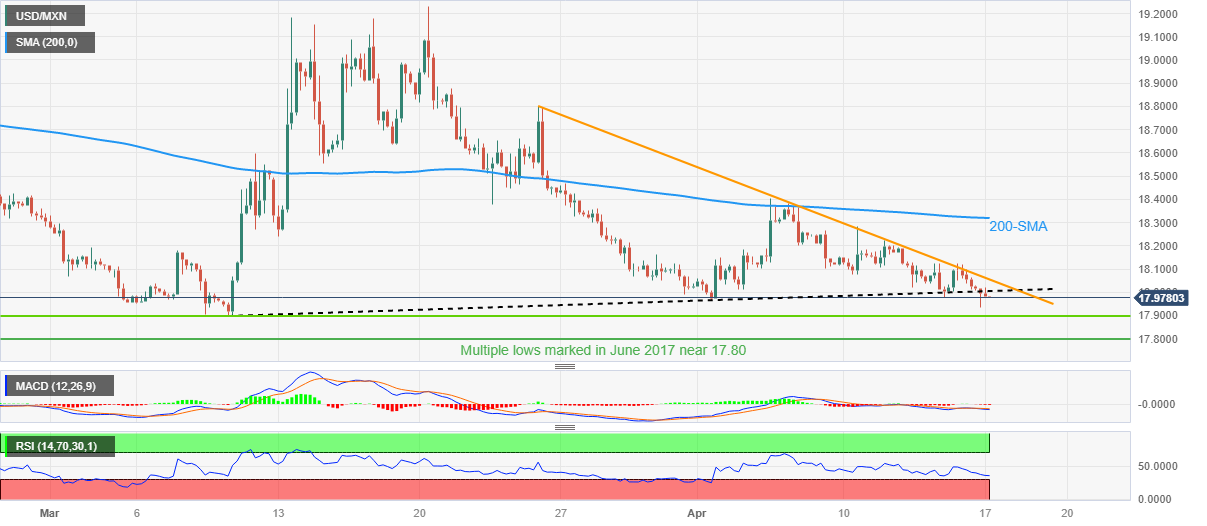
Trend: Further downside expected
-
05:39
Gold Price Forecast: XAU/USD hesitates below $2,010 despite USD retreat, hawkish Fed concerns linger
- Gold price remains indecisive after luring bears the previous day.
- US Dollar tracks Treasury bond yields amid mixed concerns about recession, US debt ceiling talks.
- China-linked headlines, light calendar adds strength to the XAU/USD inaction.
- US PMIs, central bank talks will be important to watch for clear directions.
Gold price (XAU/USD) seesaws around $2,005 as it struggles for clear directions amid sluggish trading early Monday morning in Europe.
The bright metal marked the first daily loss in four the previous day, as well as posted the biggest daily loss in three weeks, as the US Dollar posted a corrective bounce off a one-year low. Adding strength to the XAU/USD inaction could be the mixed catalyst surrounding the US Federal Reserve (Fed) and the geopolitical fears amid a light calendar for the day, as well as for the week.
That said, a wider-than-expected fall in US Retail Sales failed to supersede upbeat figures from the US Industrial Production and University of Michigan's (UoM) Consumer Confidence Index and allowed the US Dollar to rebound. Not only the data but hawkish comments from the Fed policymakers also enabled the greenback to pare the previous losses. Amid these plays, the CME’s FedWatch tool suggests an almost certain case of the US central bank’s 0.25% rate hike in May. That said, the interest rate futures also tame the odds of the rate cuts in late 2023, as well as support the longer halt to the rate hike trajectory after the upcoming rate lift.
On the contrary, fears surrounding China’s ties with Russia and the resulting geopolitical tension, as well as the recent retreat in the US Treasury bond yields weigh on the Gold price.
Amid these plays, the S&P 500 Futures print 0.20% intraday gains as it reverses the previous day’s pullback from the highest levels since early February around 4,172. That said, the US 10-year and two-year Treasury bond yields pare the previous week’s 3.0% gains with minor losses around 3.52%% and 4.11% respectively.
Looking forward, the Gold price may remain sluggish ahead of Tuesday’s China GDP, which in turn can allow the XAU/USD to witness a pullback in case of downbeat growth numbers from the world’s biggest Gold consumers. Following that, Friday’s preliminary readings of US PMIs for April will be important for clear directions.
Gold price technical analysis
Gold price consolidates the previous day’s downside break of a two-week-old support line, now resistance around $2,020, as it bounces off the 50% Fibonacci retracement level of the XAU/USD up-moves from March 22 to April 13, close to $1,991.
Adding strength to the recovery moves is the RSI (14) rebound from the oversold territory and the looming bull cross on the MACD indicator.
However, the 200-bar Exponential Moving Average (EMA), around $2,010 by the press time, guards the immediate upside of the Gold price ahead of the aforementioned support-turned-resistance near $2,020.
Following that, the early-month swing high around $2,033 and the monthly peak surrounding $2,049 can lure the XAU/USD bulls.
Meanwhile, a downside break of the 50% Fibonacci retracement level of $1,991 will need validation from the 61.8% Fibonacci retracement and a three-week-long ascending support line, respectively near $1,978 and $1,967, to convince the Gold bears.
Overall, Gold price struggles for clear directions but the buyers seem running out of fuel of late.
Gold price: Hourly chart

Trend: Pullback expected
-
05:38
GBP/USD rises back above 1.2400 as USD Index corrects, UK Employment eyed
- GBP/USD has shown some recovery as USD Index fails to extend recovery.
- Decelerating the UK labor cost index will provide some relief to BoE policymakers.
- US Retail Sales report showed that demand for costly items, which involves the cost of financing remained weak, remained weak.
The GBP/USD pair has witnessed some buying interest after dropping below the round-level support of 1.2400 in the Asian session. The Cable is showing some recovery, however, a wait-and-watch approach looks more feasible as the upside structure in US Dollar Index (DXY) has not been dented yet.
The Pound Sterling is expected to remain in action ahead of the release of the United Kingdom Employment data (Mar). Three-month Unemployment Rate is likely to remain steady at 3.7%. The Claimant Count Change is expected to decline by 11.8k, higher than the former release of 11.2K. Continuous addition of job seekers into the labor force indicates tight labor market conditions.
Apart from that, Average Earnings excluding bonuses are expected to soften to 6.2% vs. 6.5%. Investors should be aware of the fact that factors that have been fueling inflationary pressures in the UK regions are food inflation and higher employment bills due to severe labor shortage and decelerating labor cost index will provide some relief to the Bank of England (BoE) policymakers.
Meanwhile, S&P500 futures have registered some gains in the Asian session, portraying a recovery in the risk-on mood. The US Dollar Index (DXY) is facing hurdles in extending its recovery above 101.80. Also, demand for US government bonds has shown some recovery as investors are starting to digest one more rate hike expectation from the Federal Reserve (Fed). The 10-year US Treasury yields have eased to near 3.51%.
Contracting US Retail Sales released on Friday failed to ease chances of more rate hikes from the Fed. Scrutiny of the Retail Sales report showed that demand for costly items, which involves cost of financing remained weak, remained weak.
-
05:27
USD/IDR Price News: Rupiah drops to 14,800 on downbeat Indonesia trade numbers, BI Interest Rate decision eyed
- USD/IDR fades bounce off eight-month low amid upbeat Indonesia trade numbers for February.
- Indonesia Exports, Imports drop, trade surplus also deteriorates in March.
- US Dollar’s retreat mixed Fed concerns prod Indonesia Rupiah pair buyers.
- Bank Indonesia Interest Rate Decision, US PMIs will be in focus.
USD/IDR prints mild gains around 14,815 as it defends the previous day’s corrective bounce off the lowest levels since August 2022 during early Monday.
In doing so, the Indonesia Rupiah (IDR) pair cheers downbeat prints of the Asian nation’s foreign trade numbers for March. That said, Indonesia Exports dropped to -11.33% versus 4.51% prior and -15.00% expected figures. Further, Imports also declined by 6.26% versus -14.45% expected and -4.32% prior. Above all the Trade Balance eased to $2.91B compared to $5.48B prior and $3.99B market forecasts.
It’s worth noting, however, that the mixed sentiment in Asia, as well as the US Dollar’s corrective bounce off a multi-day low, also challenges the USD/IDR pair buyers. That said, a jump in China’s housing market data seemed to have favored the market’s latest consolidation. That said, China's New Home Prices for March jumped at their fastest pace in 21 months while marking a three-month uptrend. On the contrary, the geopolitical challenges emanating from China, due to its eagerness to collaborate with Russia on global and regional security, as well as tussles with the US over Taiwan, prod the market sentiment.
On the other hand, doubts about the Federal Reserve’s (Fed) ability to hold the higher rates, after pausing the rate hike trajectory in May, join the recently firmer US data and hawkish Fed bets to challenge the USD/IDR pair traders.
A wider-than-expected fall in US Retail Sales failed to supersede upbeat figures from the US Industrial Production and University of Michigan's (UoM) Consumer Confidence Index and allowed the US Dollar to rebound. Not only the data but hawkish comments from the Fed policymakers also enabled the greenback to pare the previous losses. Amid these plays, the CME’s FedWatch tool suggests an almost certain case of the US central bank’s 0.25% rate hike in May. It should be observed that the interest rate futures also tame the odds of the rate cuts in late 2023, as well as support the longer halt to the rate hike trajectory after the upcoming rate lift.
Moving on, risk catalysts may entertain USD/IDR pair traders ahead of Tuesday’s Bank Indonesia (BI) Interest Rate decision. That said, the BI is expected to keep the rates unchanged at 5.75% and may allow the pair buyers to extend the latest rebound. Following that, preliminary readings of PMIs for April will be important for fresh impulse.
Technical analysis
Although double bottom around 14,640 challenges USD/IDR buyers, a daily closing beyond a one-month-old descending resistance line, around 14,845 at the latest, becomes necessary for the pair to reject the bearish bias.
-
05:22
Indonesia Trade Balance below forecasts ($3.99B) in March: Actual ($2.91B)
-
05:22
Indonesia Imports above forecasts (-14.45%) in March: Actual (-6.26%)
-
05:22
Indonesia Imports above expectations (-14.45%) in March: Actual (6.26%)
-
05:08
Indonesia Exports above forecasts (-15%) in March: Actual (-11.33%)
-
04:59
US Dollar: Coming to a fork in the road – Goldman Sachs
Economists at Goldman Sachs said in their latest note that they believe that the US Dollar is reaching a critical juncture amid US Federal Reserve (Fed) rate cut expectations, looming recession risks and less dovish Fed commentary.
Key quotes
"The USD has continued to weaken on softer activity data, cooler inflation and some relaxation of banking sector stresses. It is clear from the March FOMC minutes that Fed officials were concerned that the bank failures could lead to a fairly sizable economic hit via tighter lending standards and a hit to sentiment."
"All of those look fairly manageable so far, and the question is increasingly how the March episode will weigh on markets and policymakers in coming months."
"Markets appear to be pricing a non-negligible risk of a steep downturn that would require deep Fed cuts, but a modal case that, if the Fed delivers just one more hike and is generally more convinced that policy is in restrictive territory already, tightening will come via a currency-negative pullback in credit availability, and a slow rebalancing is underway."
"While that modal outcome seems reasonable, we still think that is a narrow path to walk with inflation still elevated and more severe economic risks apparently receding somewhat. And it is worth noting that, while Fed officials were understandably concerned in March, most of the commentary since then has at least noted that the tightening in lending conditions appears mild so far and they continue to view the bank failures as relatively idiosyncratic."
"So, while the recent USD depreciation is understandable given the recent run of data, we continue to think the amount of divergence being priced in FX markets looks vulnerable. The market is pricing a fairly narrow path of a small slowdown but more accommodative policy, and we think that is likely to come to a fork in the road before too long."
-
04:58
USD/INR Price News: Eyes above 82.00 as US Dollar recovers after Fed policymakers favor more rate hikes
- USD/INR is looking to extend its recovery above 82.00 amid a recovery in the USD Index.
- A consecutive 25bp rate hike is highly anticipated as US core inflation has shown evidence of extreme stubbornness.
- India's FX reserves jumped to a 9-month high of $584.76 bln for the week ended April 7.
The USD/INR pair is aiming to extend its recovery above the critical resistance of 82.00 in the Asian session. The major has been supported by strength in the US Dollar on expectations that the Federal Reserve (Fed) will continue its rate-hiking spell further in May’s monetary policy meeting.
A consecutive 25 basis point (bp) rate hike is highly anticipated by the market participants as the United States' core inflation has shown evidence of extreme stubbornness. Meanwhile, households' demand contracted dramatically in March but looks insufficient to impact hawkish Fed bets.
Fed Governor Christopher Waller said on Friday that despite a year of aggressive rate increases, U.S. central bankers "haven't made much progress" in returning inflation to their 2% target and need to move rates higher still. He further added “The job on inflation was still “not done,” as inflation remains “far too high.”
Meanwhile, S&P500 have generated some gains in the Asian session after easing on Friday, indicating a minor recovery in the risk appetite of the market participants. The US Dollar Index (DXY) has shown a minor correction after failing to extend recovery above 101.80.
On the Indian Rupee front, India's FX reserves jumped to a 9-month high of $584.76 bln for the week ended April 7. Meanwhile, buying spree by Foreign Institutional Investors (FIIs) in Indian equities amid the annual result season could provide some strength to the Indian rupee.
Meanwhile, the recovery in US Dollar has weighed pressure on oil prices. It is worth noting that India is one of the leading importers of oil and some correction in the oil price will support the US Dollar.
-
04:19
USD/JPY Price Analysis: Likely flex muscles above 134.00 as Fed to hike rates further
- USD/JPY is at a make or a break level around 134.00 amid the Ascending Triangle formation.
- Multiple economic indicators are conveying that Fed would pause its policy-tightening spell sooner.
- The USD Index has sensed selling pressure while extending its upside above the immediate resistance of 101.8.
The USD/JPY pair is juggling in a narrow range around 134.00 in the Asian session. The major is gathering strength to shift its business above the aforementioned resistance as investors are backing US Dollar on expectations of the continuation of the policy-tightening process by the Federal Reserve (Fed).
There is no denying the fact that loosening the United States labor market conditions, softening Consumer Price Index (CPI) and Producer Price Index (PPI) reports, and easing retail demand are conveying that the Fed has to pause its policy-tightening spell sooner. However, the core inflation has turned extremely stubborn and the fight against stick inflation has a lot more to come.
The US Dollar Index (DXY) has sensed selling pressure while extending its upside above the immediate resistance of 101.8, however, the upside bias is still solid.
On a two-hour scale, the asset is hovering near the horizontal resistance of the Ascending Triangle chart pattern plotted from March 16 high at 133.83. Upward-sloping trendline of the aforementioned chart pattern is placed from March 24 low at 129.64.
The major is confidently auctioning above the 20-period Exponential Moving Average (EMA) at 133.38, which indicates that the short-term trend is bullish.
Adding to that, the Relative Strength Index (RSI) (14) has shifted into the bullish range of 60.00-80.00, which indicates that the upside momentum is extremely bullish.
Going forward, a decisive break above the intraday high at 134.10 will drive the major toward March 06 low at 135.37 followed by March 10 high at 137.00.
On the contrary, a break below April 05 low at 130.63 would drag the asset toward the round-level support of 130.00. A break below the 130.00 support would expose the asset to March 24 low at 129.64.
USD/JPY two-hour chart
-638172982965691932.png)
-
03:58
EUR/USD rebound approaches 1.1000 as US Dollar fades recovery, ECB’s Lagarde, PMIs in focus
- EUR/USD picks up bids from intraday low amid two-day pullback from the highest level in a year.
- Doubts about US debt default, hawkish ECB talks and economic recovery hopes underpin Euro pair’s corrective bounce.
- Mostly upbeat US data, Fed comments push back odds of Fed policy pivot, rate cuts and defend EUR/USD bears.
- Speech from ECB’s Lagarde can entertain intraday traders, preliminary PMIs are the key.
EUR/USD consolidates intraday losses around 1.0980 as pair traders seek more clues to extend the previous day’s fall amid a sluggish Monday morning in Europe. In doing so, the Euro pair cheers the US Dollar’s failure to defend the corrective bounce from the one-year low amid doubts about the US economic recovery amid the deadlock over the government debt ceiling extension. Adding strength to the Euro pair’s rebound could be the recently hawkish comments from the European Central Bank (ECB) officials.
While the US Democrats and Republicans are head-to-head over whether to extend the debt ceiling, currently around the record high, or not, ECB President Christine Lagarde showed “huge confidence” the US will not allow the country to default on its debt.
On the other hand, the market’s pricing of the ECB’s 0.25% rate hike and the policymakers’ resistance to utter policy pivot or rate cut, except Governing Council member Mario Centeno, also keeps the EUR/USD buyers hopeful. Adding strength to the Euro pair’s recovery moves are hopes that the bloc will be able to avoid the recession.
Even so, the recently firmer US data and hawkish Fed talks challenge the EUR/USD bulls amid a sluggish start to the key week comprising the preliminary readings of PMIs for April.
On Friday, a wider-than-expected fall in US Retail Sales failed to supersede upbeat figures from the US Industrial Production and University of Michigan's (UoM) Consumer Confidence Index and allowed the US Dollar to rebound. Not only the data but hawkish comments from the Fed policymakers also enabled the greenback to pare the previous losses. Amid these plays, the CME’s FedWatch tool suggests an almost certain case of the US central bank’s 0.25% rate hike in May. That said, the interest rate futures also tame the odds of the rate cuts in late 2023, as well as support the longer halt to the rate hike trajectory after the upcoming rate lift.
Against this backdrop, the S&P 500 Futures print 0.20% intraday gains as it reverses the previous day’s pullback from the highest levels since early February around 4,172. That said, the US 10-year and two-year Treasury bond yields pare the previous week’s 3.0% gains with minor losses around 3.52%% and 4.10% respectively.
Moving on, ECB President Lagarde is scheduled to speak one more time in the day and can entertain EUR/USD traders. However, major attention will be given to this week’s PMIs to reconfirm the economic recovery hopes, as well as prod the hawkish Fed bets and the latest falling prices.
Technical analysis
EUR/USD pair’s latest rebound takes place from a two-week-old previous resistance surrounding 1.0970, backed by upbeat oscillators on the shorter timeframes. However, the quote’s previous decline below the horizontal area comprising multiple levels marked since early February, as well as a one-week-old ascending trend line, near 1.1030-40, keeps bears hopeful.
-
03:37
South Korea Trade Balance above forecasts ($-4.621B) in March: Actual ($4.63B)
-
03:30
Commodities. Daily history for Friday, April 14, 2023
Raw materials Closed Change, % Silver 25.384 -1.71 Gold 2004.57 -1.75 Palladium 1499.52 -0.73 -
03:27
USD/CHF Price Analysis: Bulls run out of steam but stay hopeful beyond 0.8905 previous resistance
- USD/CHF retreats from intraday high, fades the previous week’s rebound from early 2021 levels.
- Three-day-old resistance line, 100-EMA restrict immediate upside amid nearly overbought RSI.
- Receding bullish bias of MACD signals also extend downside pressure on Swiss Franc pair.
- Resistance-turned-support from April 10 puts a floor under the prices for intraday.
USD/CHF drops to 0.8945 as it pares the intraday gains during Monday morning in Asia.
With this, the Swiss Franc (CHF) pair takes a U-turn from the 100-bar Exponential Moving Average (EMA), as well as a three-day-old resistance line, to reverse the previous week’s U-turn from the lowest levels since January 2021.
Not only the aforementioned immediate upside hurdles but the receding bullish bias of the MACD signals and the RSI (14) line’s retreat from the overbought territory also suggest a pullback in the USD/CHF prices.
However, the previous resistance line stretched from April 10, now immediate support around 0.8905, quickly followed by the 0.8900 round figure, can lure the USD/CHF bears.
In a case where the quote remains bearish past 0.8900, the recently flashed multi-month low of around 0.8860, marked in the last week, will gain the market’s attention.
Alternatively, recovery moves clear to cross the downward-sloping resistance line from the last Wednesday, as well as the 100-EMA, respectively near 0.8955 and 0.8960, to recall the USD/CHF buyers.
Following that the 200-EMA hurdle surrounding the 0.9000 psychological magnet will be in focus.
Should the USD/CHF buyers keep the reins past 0.9000, the odds of witnessing a gradual run-up towards challenging the monthly of near 0.9200 can’t be ruled out.
USD/CHF: Hourly chart
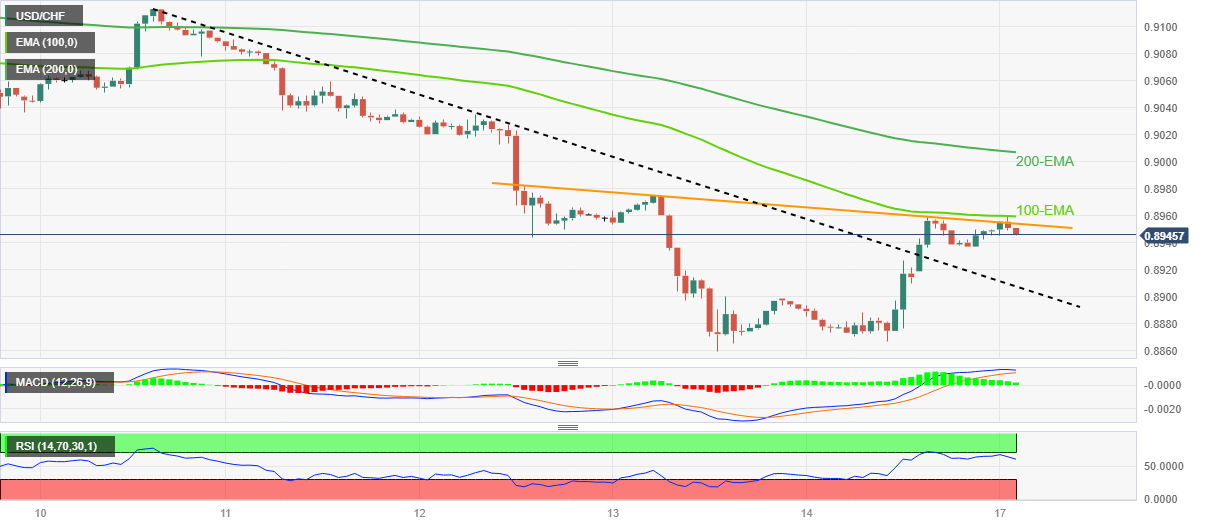
Trend: Limited downside expected
-
03:11
S&P 500 Futures print mild gains, yields retreat as more clues eyed to reconfirm hawkish Fed bets
- Market sentiment appears mildly positive as traders reassess odds of Fed’s hawkish moves.
- Recession woes remain on the table even as Fed policymakers, US data tame economic slowdown fears.
- S&P 500 Futures pick up bids to reverse the previous day’s pullback from 10-week high, yields fade two-day uptrend.
- US PMIs, central bank comments are in focus, geopolitical issues also regain importance.
Risk profile remains slightly upbeat during early Monday as traders recheck the previously hawkish central bank bias amid a light calendar. Also favoring the corrective moves are the fears of recession and geopolitical tension, which in turn can keep the central banks off the rate hike trajectory.
While portraying the mood, the S&P 500 Futures print 0.20% intraday gains as it reverses the previous day’s pullback from the highest levels since early February around 4,172. That said, the US 10-year and two-year Treasury bond yields pare the previous week’s 3.0% gains with minor losses around 3.52%% and 4.10% respectively.
Mostly upbeat US data, mainly surrounding consumer sentiment and inflation, joined hawkish Fed talks to push back concerns surrounding the US central bank’s policy pivot, as well as the rate cuts, in the current year. The same allowed the US Dollar Index (DXY) to rebound from a one-year low, mildly bid around 101.75 by the press time.
Apart from that, a jump in China’s housing market data seemed to have also favored the market’s latest consolidation. That said, China's New Home Prices for March jumped at their fastest pace in 21 months while marking a three-month uptrend.
Further, the looming fears of economic slowdown, mainly in the West, as per the latest analysis from the International Monetary Fund (IMF) and the World Bank (WB), keep the central bankers wary of hawkish moves. The same allow US Treasury bond yields to retreat, which in turn favors the Gold price to print mild gains around $2005, after snapping a four-day uptrend the previous day. It’s worth noting, however, that the Oil price retreats amid fears of demand depletion due to higher prices, as well as economic slowdown fears.
Elsewhere, the geopolitical challenges emanating from China, due to its eagerness to collaborate with Russia on global and regional security, as well as tussles with the US over Taiwan, prod the market sentiment.
Above all, a light calendar and lack of macros allow traders to pare the previous day’s heavy moves ahead of this week’s preliminary readings of PMIs for April.
-
02:49
AUD/USD Price Analysis: Bears testing 0.6700 that guards 0.6650
- AUD/USD bears are in the market and eye a downside extension.
- The US Dollar is bouncing back to life and weighing on the pair.
AUD/USD has been offered with the US Dollar´s strength coming into play with 0.6650/20 eyed as a key target as the following analysis will illustrate:
AUD/USD daily charts
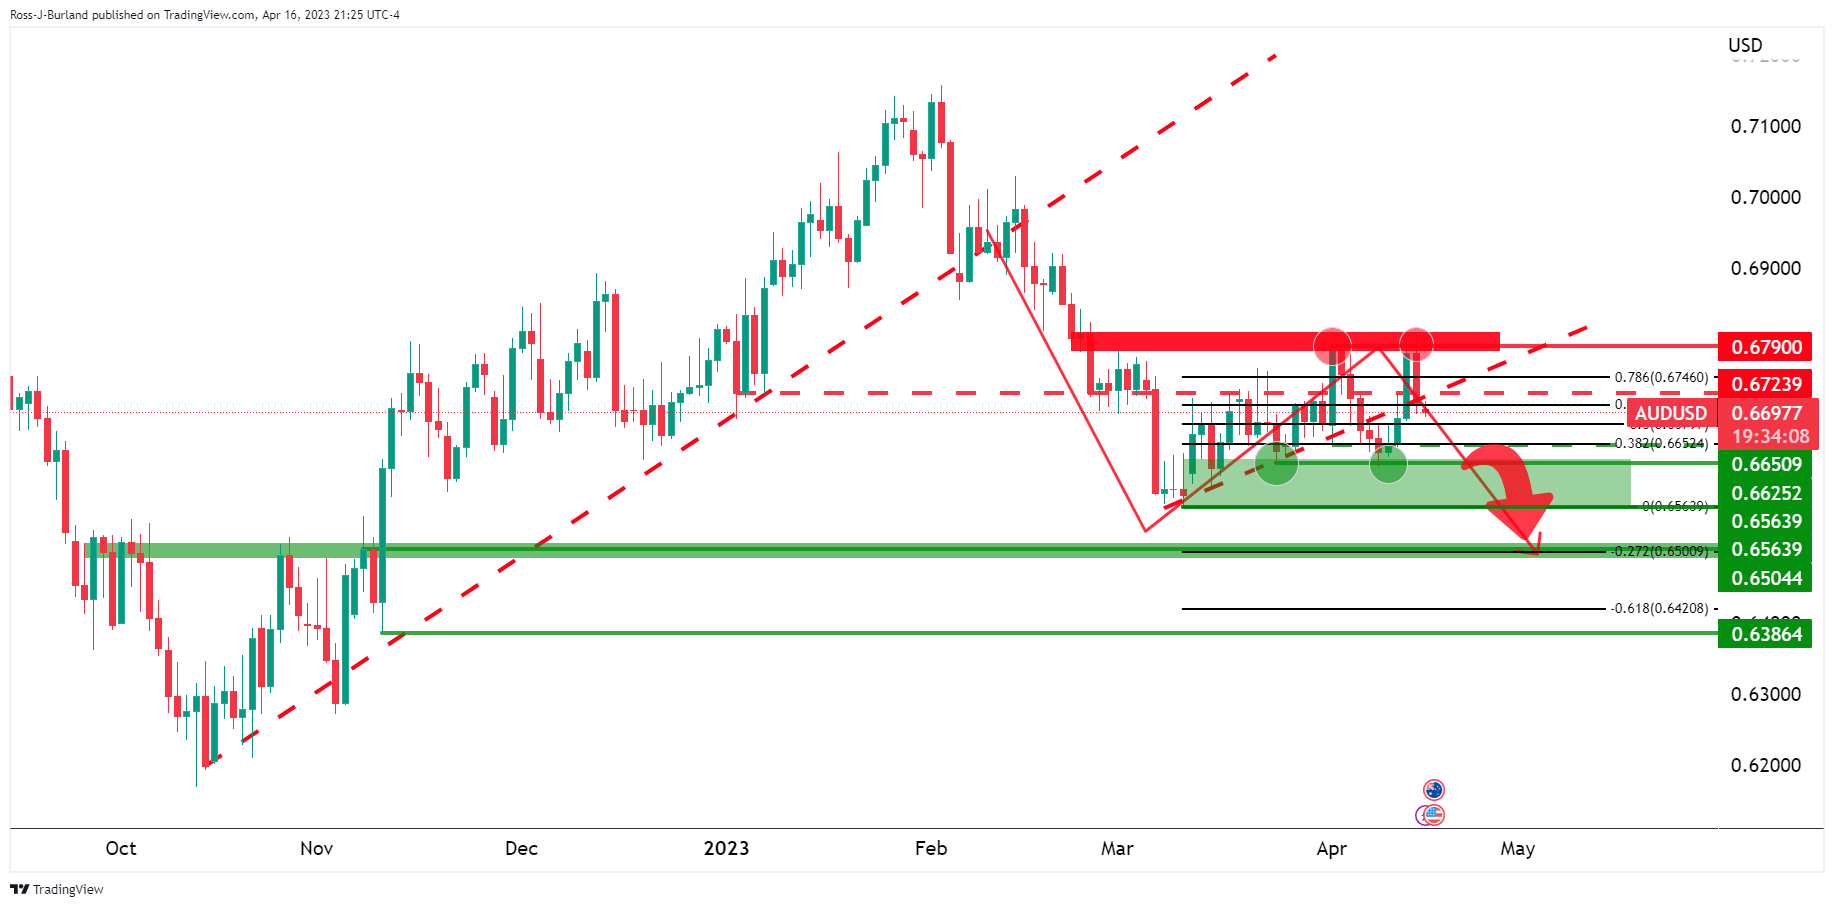
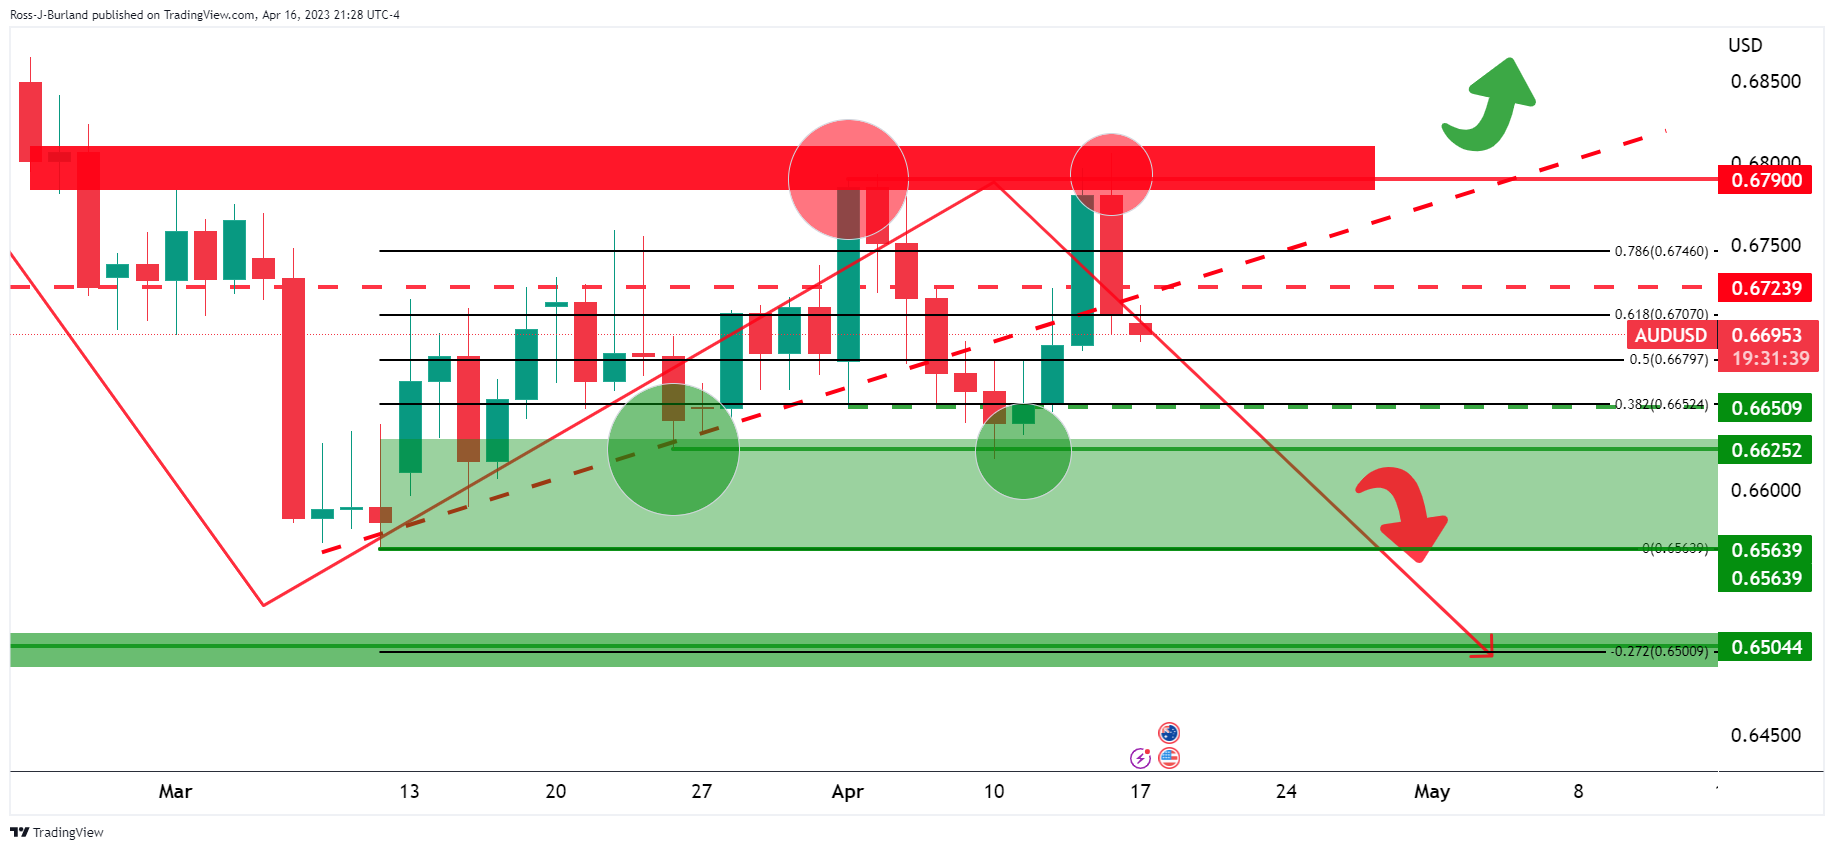
As illustrated, AUD/USD is in the hands of the bears on the daily chart within support and resistance between 0.6625 and 0.6790, although the bias is to the downside as the price tests below 0.6700.
AUD/USD H4 chart
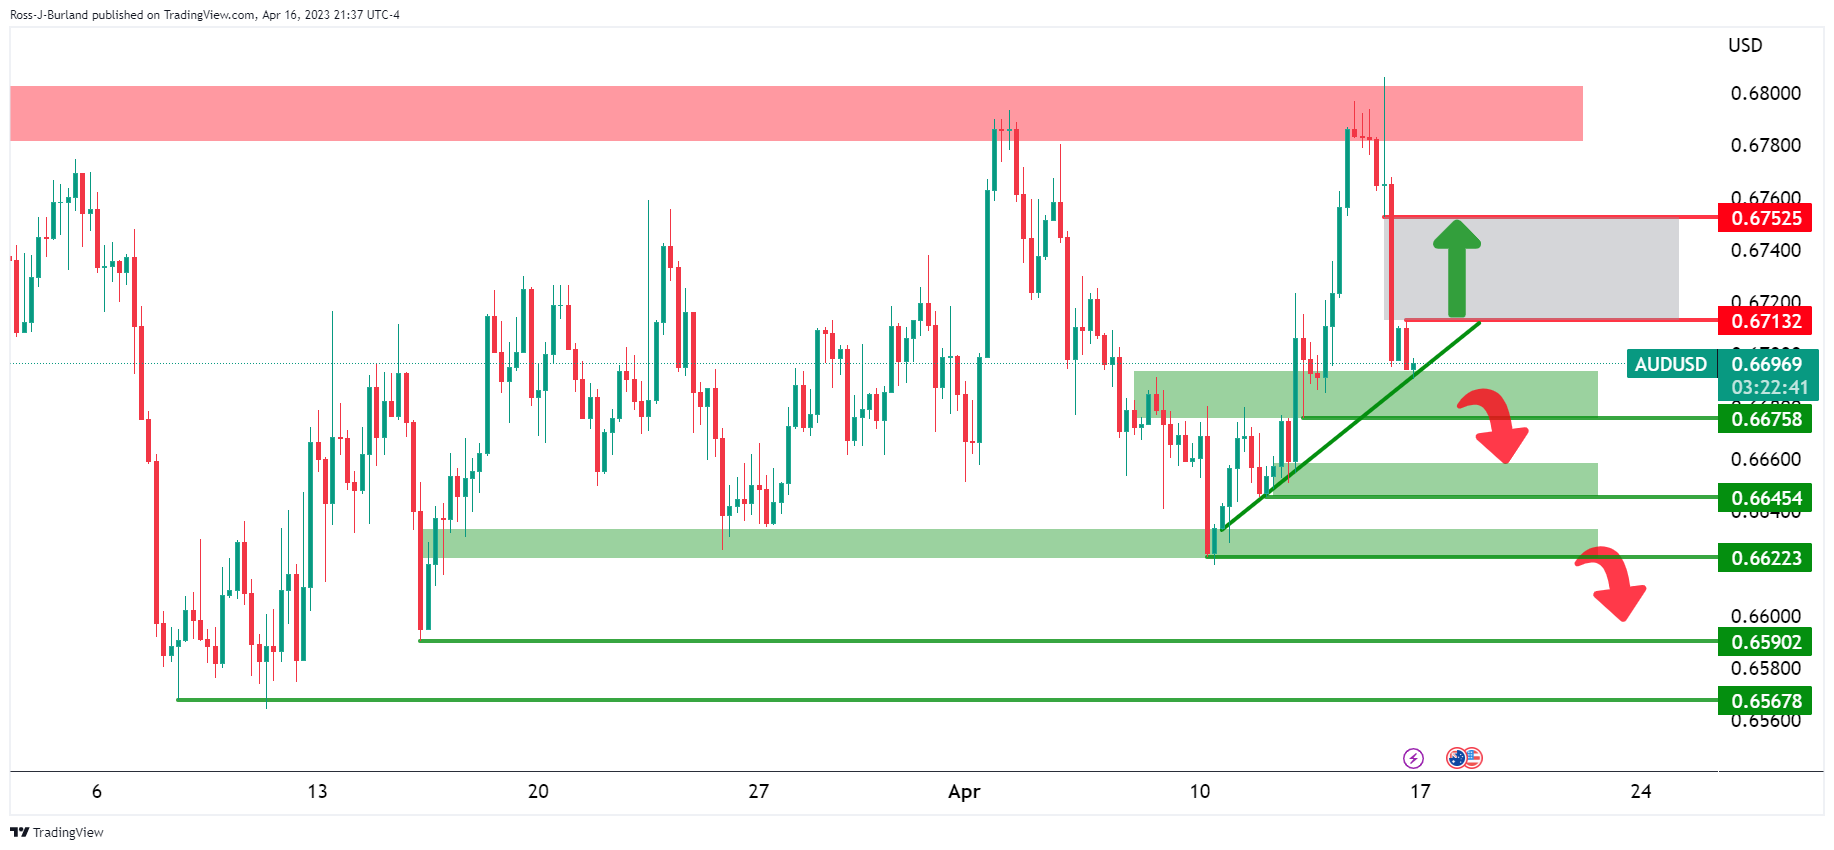
AUD/USD bears have come in to test the bull´s commitments at the micro trendline support around 0.6700 and with further horizontal support near 0.6675 eyed. However, there is a compelling area of imbalance on the 4-hour chart between 0.6713 and the 0.6750s that could well be mitigated if the bulls commit at the aforementioned support area.
-
02:43
Natural Gas Price Analysis: XNG/USD retreats towards $2.24 within immediate bearish channel
- Natural Gas price fades bounce off the lowest levels since August 2020.
- Three-week-old bearish channel, 200-SMA prods XNG/USD’s corrective bounce.
- Bullish MACD signals, short-term SMA confluence puts a floor under the Natural Gas price.
Natural Gas (XNG/USD) price pares intraday gains around $2.33 during early Monday. In doing so, the energy asset eases from an upper line of the three-week-old bearish channel.
However, the bullish MACD signals, as well as a convergence of the 21-SMA and 50-SMA, around $2.24, restrict the immediate downside of the XNG/USD.
In a case where the Natural Gas price drops below $2.24, the stated channel’s support around $2.11, will be crucial to watch as it becomes the fresh low since August 2020 from which the XNG/USD previously bounced.
Should the quote remains bearish past $2.11, the odds of witnessing a slump toward the $2.00 round figure can’t be ruled out. However, the July 2020 high surrounding $1.95 could challenge the Natural Gas bears afterward.
On the flip side, a clear break of the stated channel’s top line, close to $2.35, isn’t an open invitation to the XNG/USD bulls as the 200-SMA hurdle of near $2.44 can act as the final defense of the Natural Gas bears.
Even if the commodity price remains firmer past $2.44, the mid-March swing low around $2.48 and the $2.50 round figure can act as additional upside filters before giving control to the Natural Gas buyers.
Natural Gas Price: Four-hour chart
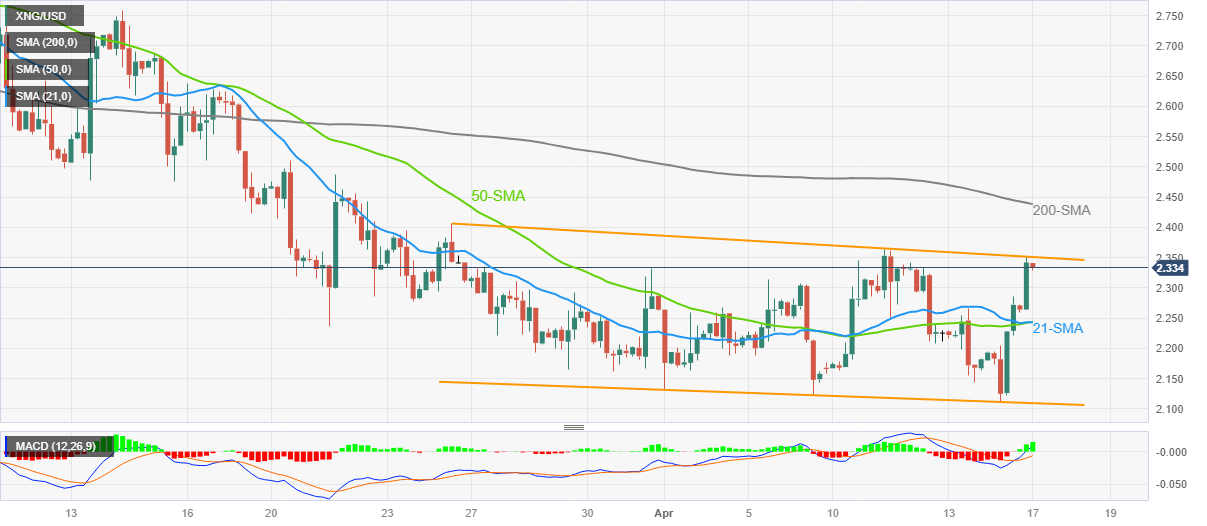
Trend: Limited downside expected
-
02:39
EUR/GBP finds resistance around 0.8860 ahead of UK Employment
- EUR/GBP has sensed barricades while attempting a break above the 0.8860 resistance.
- UK Hunt is confident that their economy will outperform this year.
- ECB Lagarde cited that Eurozone inflation would soften gradually ahead.
The EUR/GBP pair has sensed resistance while trespassing the 0.8860 hurdle with weak buying interest. The cross is correcting gradually and is expected to remain extremely volatile ahead of the release of the United Kingdom Employment data, which is scheduled for Tuesday.
The strength in the Pound Sterling is coming from the confidence of UK Finance Minister Jeremy Hunt that their economy will be resilient and outperform this year.
Contrary to views from International Monetary Fund (IMF) managing director Kristalina Georgieva that the UK will be the weakest of all the major industrialized economies, with its Gross Domestic Product (GDP) contracting by 0.3% this year, as reported by SkyNews. US FM Hunt said he will "prove the Fund wrong” and that Britain's economy will outperform.
He further added that “We have so far avoided recession this year.” So the economy has shown resilience, but we want to be growing faster.
Going forward, the UK Employment data (Mar) will remain in the spotlight. The Claimant Count Change is expected to decline by 11.8k, higher than the former release of 11.2K. Continuous addition of job seekers into the labor force indicates tight labor market conditions. Three-month Unemployment Rate is likely to remain steady at 3.7%. Average Earnings excluding bonuses are expected to soften to 6.2% from the former recording of 6.5%. This might delight the Bank of England (BoE) as higher households' earnings have been a major catalyst for double-digit inflation.
On the Eurozone front, European Central Bank (ECB) President Christine Lagarde remained confident that inflation will gradually decline ahead. She cited that "Historically high wage growth, related to tight labor markets and compensation for high inflation, will support core inflation over the projection horizon, as it gradually returns to rates around our target,"
-
02:19
GBP/USD drops towards 1.2370 as BoE eyes urgent action ahead of UK inflation, US PMI
- GBP/USD takes offers to renew intraday low, extends the previous day’s pullback from 10-month high.
- Talks of BoE’s likely changes to deposit guarantee scheme, UK Chancellor Hunt’s fears from US subsidies weigh on Cable pair.
- Upbeat US data, Fed talks push back bets on rate cuts, policy pivot and underpin US Dollar’s corrective bounce.
- Slew of UK data, US PMIs to entertain GBP/USD traders during the week.
GBP/USD stands on slippery grounds as it extends the previous day’s pullback from a 10-month high to refresh an intraday low near 1.2390 during early Monday. In doing so, the Cable pair justifies the recent fears emanating from the UK, as well as the optimism surrounding the Federal Reserve (Fed), to tease bears after snapping a four-week uptrend.
“The Bank of England is considering a major overhaul of its deposit guarantee scheme, including boosting the amount covered for businesses and forcing banks to pre-fund the system to a greater extent to ensure faster access to cash when a lender collapses,” per the Financial Times (FT). The news refreshes banking fears surrounding the UK and weighs on the Cable pair.
Also exerting downside pressure on the GBP/USD price could be UK Chancellor Jeremy Hunt’s worries about the US subsidies as British companies rush to avail benefits while planning to leave the UK. “Chancellor Jeremy Hunt told Sky News that Britain should be wary of any new subsidies, warning that they could undermine the economy and might even trigger a protectionist trade war,” per the news.
On the other hand, a wider-than-expected fall in US Retail Sales failed to supersede upbeat figures from the US Industrial Production and University of Michigan's (UoM) Consumer Confidence Index on the previous day and allowed the US Dollar to rebound. That said, US Retail Sales dropped by 1.0% for March versus -0.4% expected and -0.2% prior. On the contrary, Industrial Production grew by 0.4% during the stated month compared to 0.2% market forecasts and prior reading. Additionally positive was the preliminary reading of the University of Michigan's (UoM) Consumer Confidence Index for April which improved to 63.5 versus 62.0 analysts’ expectations and previous readings. Furthermore, Year-ahead inflation expectations rose from 3.6% in March to 4.6% in April while its Five-year counterpart reprinted 2.9% for the said month.
It should be noted that the Fed policymakers appeared more hawkish than their BoE counterparts in the last week and exert additional pressure on the GBP/USD prices of late.
Against this backdrop, S&P 500 Futures print mild gains after Wall Street’s downbeat closing whereas the bond yields remain sidelined after posting weekly gains.
Moving on, the current week becomes crucial for the GBP/USD traders as it offers multiple top-tier data surrounding inflation, employment and PMIs from the UK, which in turn can help justify the receding hawkish bias of the BoE officials and may keep the bears on the table. However, the US PMIs and Fed talks shouldn’t be missed for clear directions.
Technical analysis
A clear downside break of a three-week-old previous support line, now immediate resistance near 1.2420, directs GBP/USD sellers toward the 21-DMA support of around 1.2370.
-
02:16
USD/CNY fix: 6.8606 and the prior close of 6.8690
In recent trade today, the People’s Bank of China (PBOC) set the yuan at 6.8679 following the previous fix of 6.8606 and the prior close of 6.8690.
About the fix
China maintains strict control of the yuan’s rate on the mainland.
The onshore yuan (CNY) differs from the offshore one (CNH) in trading restrictions, this last one is not as tightly controlled.
Each morning, the People’s Bank of China (PBOC) sets a so-called daily midpoint fix, based on the yuan’s previous day's closing level and quotations taken from the inter-bank dealer.
-
02:07
Gold Price Forecast: XAU/USD struggles above $2,000 as more rate hikes from Fed seem inevitable
- Gold price looks vulnerable above $2,000.00 as Fed to raise rates further.
- US equities are expected to remain stock-specific amid quarterly results season.
- Gold price is expected to decline further towards the upward-sloping trendline plotted from $1,934.34.
Gold price (XAU/USD) is looking vulnerable above the psychological resistance of $2,000.00 in the Asian session. The precious metal has shown a recovery move after printing a four-day low of $1,992.50. However, the recovery move looks fragile as the upside is capped due to bullish bets for the US Dollar Index (DXY).
The USD Index is looking to extend its recovery above the immediate resistance of 101.75 as the likelihood of a consecutive 25 basis point (bp) rate hike from the Federal Reserve (Fed) is extremely solid. The result from the CME Fedwatch tool conveys that the chances of a rate hike are almost 80%.
Meanwhile, S&P500 futures have added significant gains on early Monday after a mild sell-off on Friday. US equities are expected to remain stock-specific amid quarterly results season. Manufacturing and oil dependent companies could show some decent recovery in earnings as gasoline prices were extremely lower in March.
The demand for US government bonds has dropped significantly amid soaring bets for further policy restrictions by the Fed. Atlanta Fed President Raphael Bostic, said one more quarter-percentage-point interest rate hike can allow the Fed to end its tightening cycle with some confidence that inflation will steadily return to its 2% target.
Gold technical analysis
Gold price witnessed a steep fall after failing to test the critical resistance of $2,050.00 on Thursday. The yellow metal corrected sharply and dropped below the upward-sloping trendline plotted from April 03 low at $1,950.52. The Gold price is expected to decline further towards the advancing trendline placed from March 22 low at $1,934.34.
The precious metal has dropped below the 50-period Exponential Moving Average (EMA) at $2,016.83, which indicates that the short-term trend has turned bearish.
Meanwhile, the Relative Strength Index (RSI) (14) has slipped into the bearish range of 20.00-40.00, indicating more weakness ahead.
Gold two-hour chart

-
01:53
USD/CAD Price Analysis: All eyes on the US Dollar as price corrects in bear trend
- USD/CAD bears are lurking but bulls are moving in.
- The US Dollar has perked up but resistances are eyed.
As per the prior analysis, USD/CAD Price Analysis: Bears in control and eye lower to 1.3320, USD/CAD has remained in the hands of the bears although we are starting to see some US Dollar strength come in which is holding up the downside as the following will illustrate.
US dollar technical analysis
102.50 comes as a critical resistance that guards 103.50 to the upside meeting the aforementioned major trend line resistance.
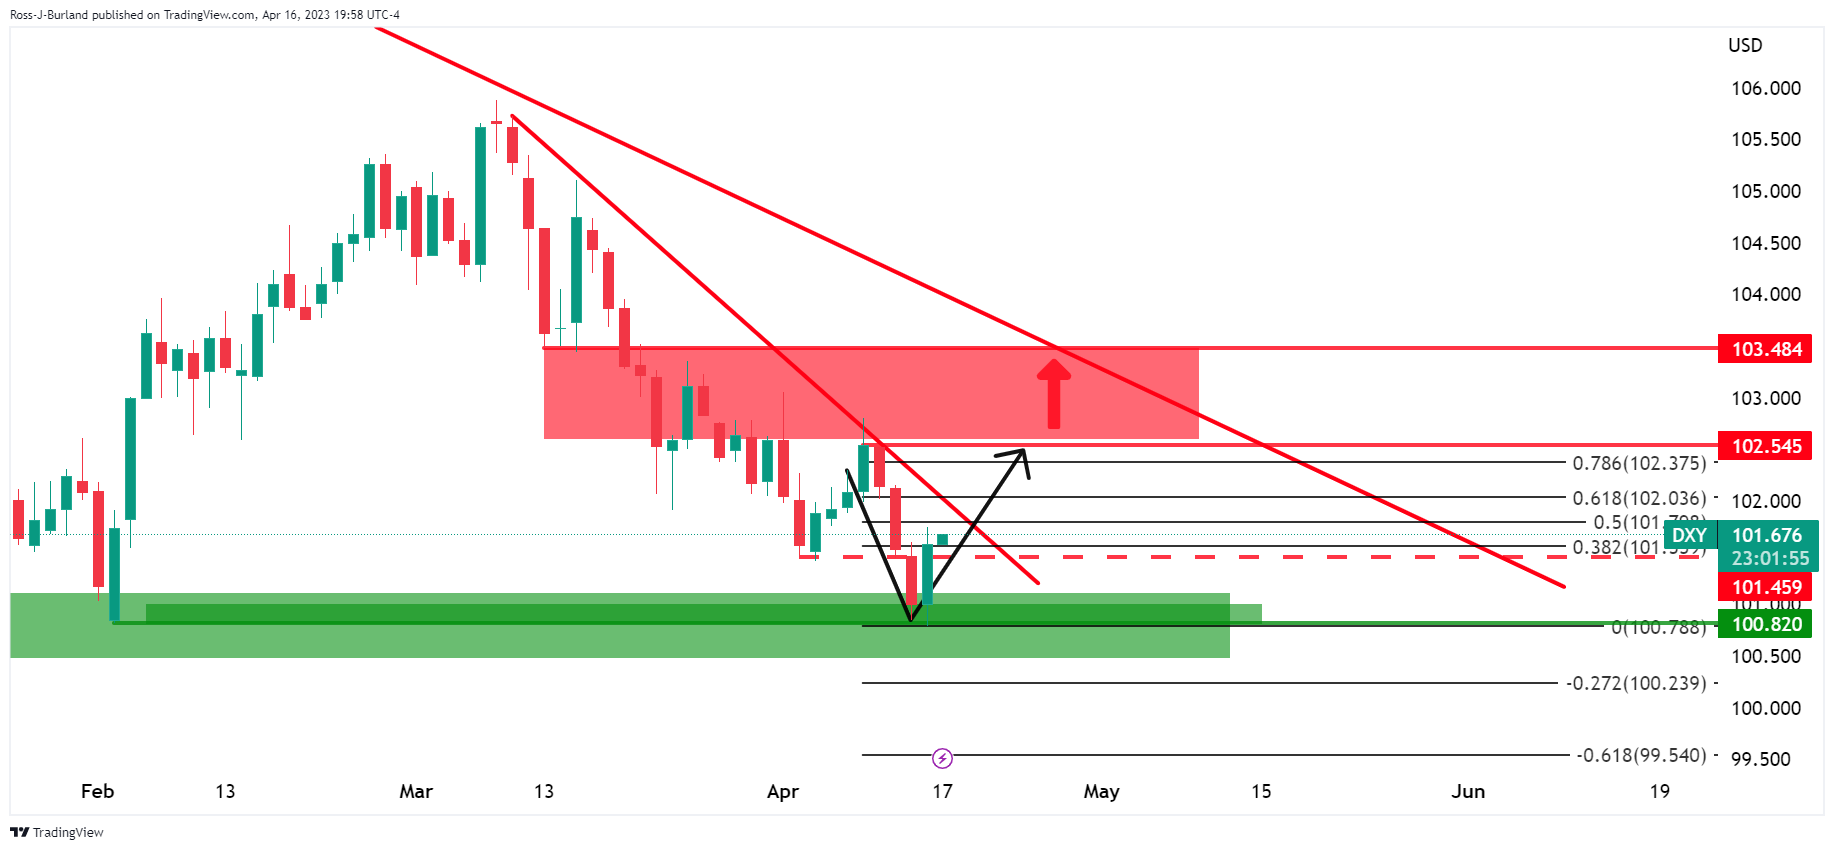
However, should the bears commit at the micro trendline resistance and somewhere within the Fibonacci scale, then the downside bias for USD/CAD will remain in place.
USD/CAD daily chart update
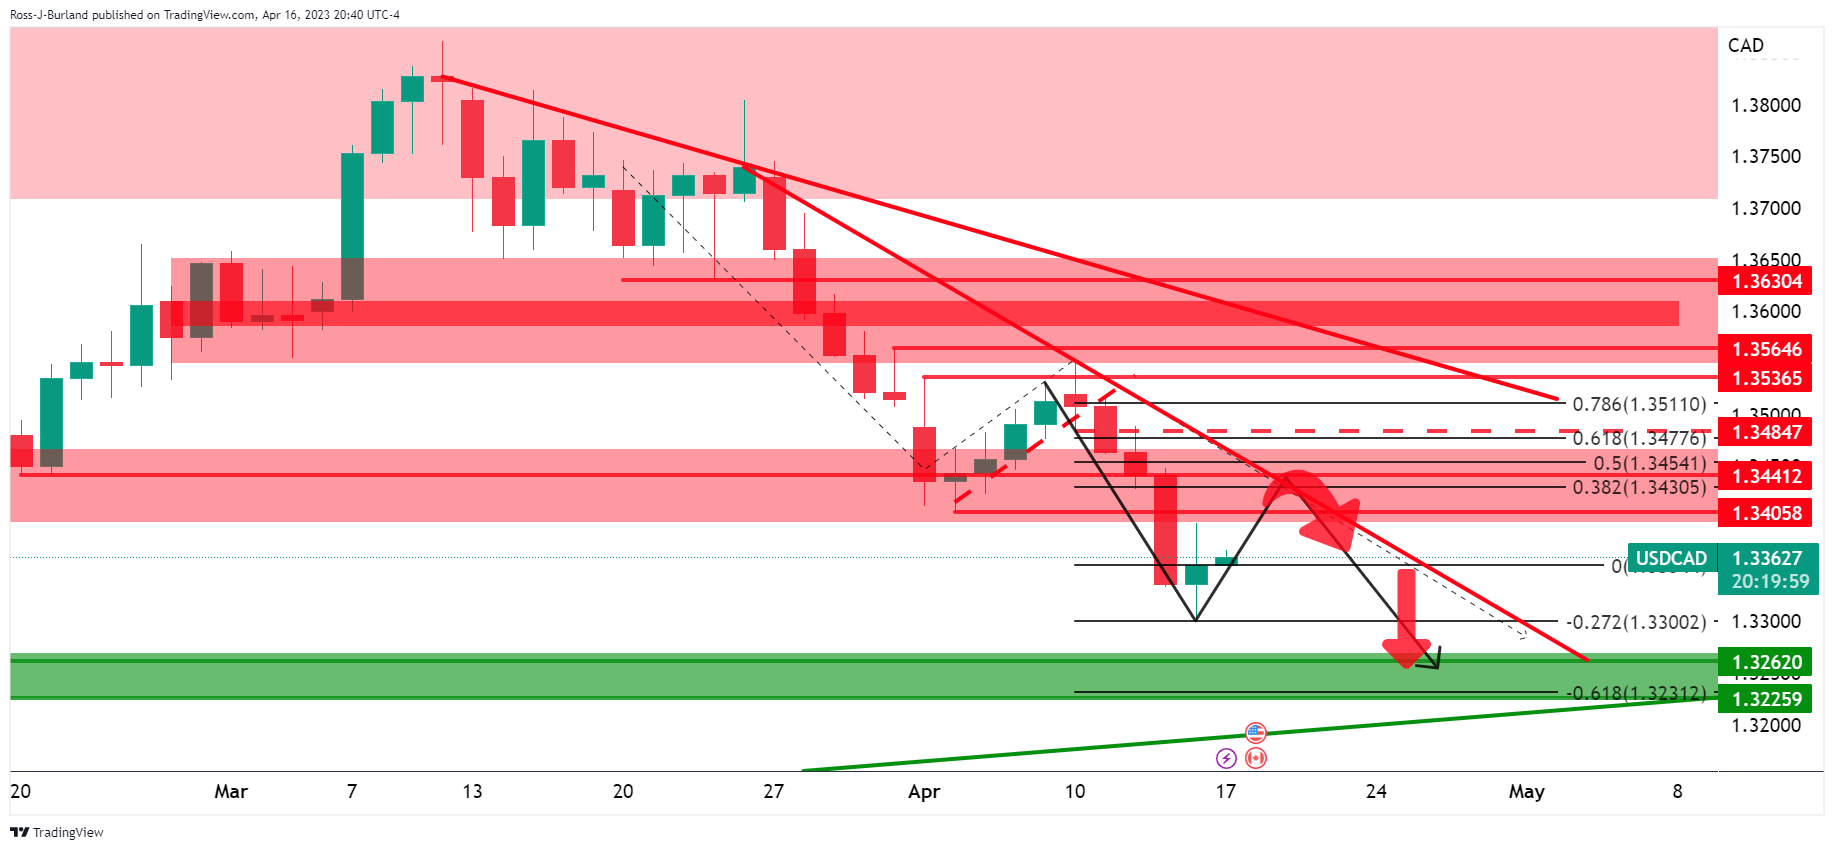
USD/CAD is correcting with the prior support in focus near 1.3406 meeting the micro trendline resistance and coming in close to the 38.2% Fibonacci retracement area near 1.3430. Should this area of potential resistance hold, then the low 1.32s will be a target that meets the broader trendline support and horizontal supporting area:
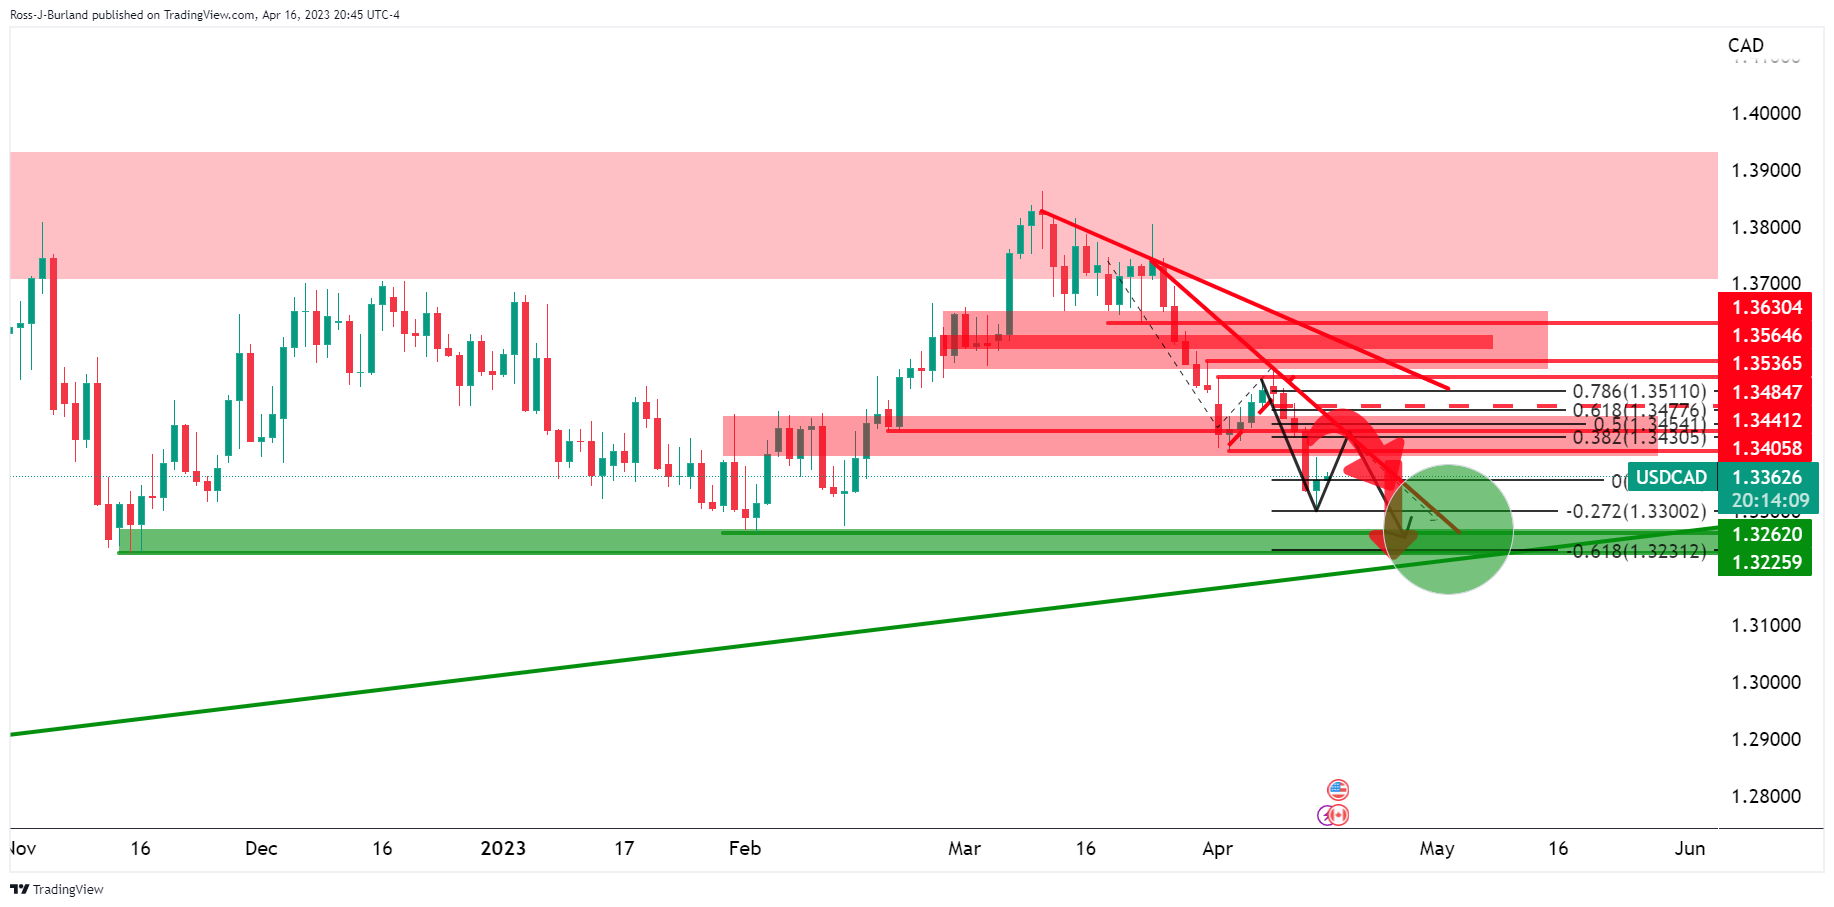
-
01:53
USD/JPY traces on sluggish yields below 134.00 even as BoJ vs. Fed divergence regains attention
USD/JPY struggles to extend the previous day’s run-up, retreats from intraday high of late.
Yields grind higher as mostly firmer US data, Fed talks push back dovish bias about Fed.
BoJ’s Ueda defends easy money policy and allows Yen buyers to keep the reins.
US PMIs, Japan inflation eyed for fresh impulse.
USD/JPY retreats from intraday high while treading water around 133.80 as Tokyo opens on Monday. In doing so, the Yen pair fails to extend the previous day’s run-up amid sluggish markets ahead of this week’s top-tier data/events. Not only a lack of major data/events but mixed catalysts and sluggish yields also challenge the USD/JPY pair traders of late.
USD/JPY rose the most in a week the previous day as mostly upbeat US data pushed back hopes of the Federal Reserve’s (Fed) policy pivot, as well as the rate cuts, in 2023. That said, US Retail Sales dropped by 1.0% for March versus -0.4% expected and -0.2% prior. On the contrary, Industrial Production grew by 0.4% during the stated month compared to 0.2% market forecasts and prior reading. Additionally positive was the preliminary reading of the University of Michigan's (UoM) Consumer Confidence Index for April which improved to 63.5 versus 62.0 analysts’ expectations and previous readings. Furthermore, Year-ahead inflation expectations rose from 3.6% in March to 4.6% in April while its Five-year counterpart reprinted 2.9% for the said month.
Hawkish Fed talks also contributed to the USD/JPY pair’s previous run-up. “The recent developments are consistent with one more rate hike,” said Atlanta Federal Reserve (Fed) President, Raphael Bostic in an interview with Reuters this Friday. On the same, Fed Governor Christopher Waller mentioned that the recent data show that the Fed hasn't made much progress on its inflation goal and added that rates need to rise further, per Reuters. However, Federal Reserve Bank of Chicago President Austan Goolsbee said in an interview with CNBC on Friday that he still wants to see the data. The policymaker also added, “But let's be mindful we've raised a lot; some of the lag is coming through possibly in today's retail sales number."
On the other hand, Bank of Japan’s (BoJ) new Governor Kazuo Ueda defends the Japanese central bank’s easy-money policy and allowed the USD/JPY pair to remain firmer.
Recently, the geopolitical challenges emanating from China, due to its eagerness to collaborate with Russia on global and regional security, as well as tussles with the US over Taiwan, prod the market sentiment and weigh on the USD/JPY pair.
Amid these plays, S&P 500 Futures struggle for clear directions after Wall Street’s downbeat closing whereas the bond yields remain sidelined after posting weekly gains.
Looking forward, the preliminary readings of the US PMIs for April and Japan’s National Consumer Price Index (CPI) for March will be important to watch for clear directions. Also important are the aforementioned risk catalysts and central bankers’ comments.
Technical analysis
USD/JPY grinds higher between a two-week-old ascending resistance line and the 21-DMA support, respectively near 134.15 and 132.25 in that order.
-
01:30
Stocks. Daily history for Friday, April 14, 2023
Index Change, points Closed Change, % NIKKEI 225 336.5 28493.47 1.2 Hang Seng 94.33 20438.81 0.46 KOSPI 9.83 2571.49 0.38 ASX 200 37.5 7361.6 0.51 FTSE 100 28.5 7871.9 0.36 DAX 78.04 15807.5 0.5 CAC 40 38.78 7519.61 0.52 Dow Jones -143.22 33886.47 -0.42 S&P 500 -8.58 4137.64 -0.21 NASDAQ Composite -42.8 12123.47 -0.35 -
01:22
China Defense Minister Li Shangfu: Eager to collaborate with Russia on global and regional security
China Defense Minister Li Shangfu has crossed the wires and China is eager to collaborate with Russia to make new contributions to the maintenance of global and regional security and stability.
This comes as Shangfu starts a four-day visit to Russia, his first foreign trip in his new position. The Global Times reports that experts are saying the trip will deepen bilateral military ties and contribute to peace and stability of major international and regional hotspot issues amid a complex security environment.
´´At the invitation of Russian Defense Minister Sergei Shoigu, Li will pay an official visit to Russia from Sunday to Wednesday, during which he will hold talks with Russian military leaders and visit Russian military academies, Senior Colonel Tan Kefei, a spokesperson at China's Ministry of National Defense, said in a press release on Friday.´´ -
01:16
EUR/USD Price Analysis: Extends pullback from one-year high to 1.0970 horizontal support
- EUR/USD holds lower grounds after reversing from the highest levels in one year.
- Resistance-turned-support from early April challenges intraday sellers amid steady RSI.
- Bearish MACD signals join downside break of previously key horizontal support, one-week-old ascending trend line to favor Euro sellers.
EUR/USD remains pressured around 1.0980 as bears approach a two-week-old previous resistance while extending Friday’s U-turn from a one-year high during Monday’s Asian session.
Adding strength to the downside bias is the previous day’s EUR/USD decline below the horizontal area comprising multiple levels marked since early February, as well as a one-week-old ascending trend line.
Furthermore, bearish MACD signals and the quote’s U-turn from 1.1075 also keep Euro sellers hopeful of testing the aforementioned horizontal support area surrounding 1.0970.
However, an upward-sloping support line from mid-March and the 100-SMA, respectively near 1.0910 and 1.0895, can challenge the EUR/USD bears before offering them a free hand to prod the monthly low of 1.0788.
It’s worth noting that the late March high of around 1.0930 also acts as short-term key support to watch for the EUR/USD pair sellers.
Meanwhile, the Euro pair’s recovery remains elusive below the aforementioned short-term support-turned-resistance line and a multi-day-old horizontal area, close to 1.1030-40 by the press time.
Even if the EUR/USD buyers manage to cross the 1.1040 hurdle, the latest peak of 1.1075 appears a tough nut to crack for them ahead of challenging the late March 2022 high of near 1.1185.
EUR/USD: Four-hour chart

Trend: Further downside expected
-
01:16
AUD/JPY looks set to reclaim 90.00 ahead of RBA minutes
- AUD/JPY is looking to reclaim the 90.00 resistance as the focus shifts to RBA minutes.
- RBA paused the policy-tightening spell due to the quick deceleration in Australian inflation.
- An upbeat performance is expected from China’s GDP report in the first quarter.
The AUD/JPY pair is making efforts in reclaiming the critical resistance of 90.00 in the Asian session. The risk barometer has rebounded from 89.60 after a corrective move as investors are supporting the Australian Dollar ahead of the monetary policy meeting minutes from the Reserve Bank of Australia (RBA).
In April’s policy meeting, RBA Governor Philip Lowe halted the policy-tightening spell and kept interest rates unchanged at 3.6%. The rationale behind pausing the policy-tightening spell was the quick deceleration in Australian inflation in the past two months. Australian inflation has softened sharply to 6.8% from its peak of 8.4% in the past two months. Also, RBA policymakers are confident about further softening of inflation due to rising expectations of a slowdown ahead.
In April’s monetary policy speech, RBA Lowe remained doors open for further rate hikes if inflation continues to remain persistent. Going forward, the minutes from the RBA policy would provide detailed interest rate guidance.
The RBA could sound hawkish in coming sessions as Australian labor market conditions are getting tightened further. Australian Employment (March) data showed that additions of fresh talent were higher than anticipated and the Unemployment Rate dropped to 3.5%. This could force the RBA to reconsider its unchanged policy stance.
On Tuesday, investors will also focus on China’s Gross Domestic Product (GDP) (Q1) data. As per the consensus, the Chinese economy has expanded by 2.2% vs. a stagnant performance. On an annual basis, the economy is expanded by 4.0% against the 2.9% growth rate recorded earlier. It is worth noting that Australia is the leading trading partner of China and higher Chinese GDP data would support the Australian Dollar.
On the Tokyo front, the Bank of Japan’s (BoJ) reiterating support for expansionary monetary policy is weighing on the Japanese Yen. The BoJ is required to continue the decade-long ultra-loose monetary policy to keep inflation steadily above 2%.
-
01:15
US Dollar bulls look to trendline resistances from key support
- The US Dollar is meeting a critical area of support as per DXY.
- All eyes will be back on key US data and Federal Reserve sentiment ahead of the May meeting.
The US Dollar index, DXY, is flat at the start of the week but it gained 0.57% on Friday to 101.53, after falling to 100.78, the lowest since last April.
The US Dollar index firmed off a one-year low on Friday as the Federal Reserve sentiment swung back in favor of the hawks following a combination of Federal Reserve speech and data that were not as weak as some economists had expected.
Core Retail Sales, which correspond most closely with the consumer spending component of Gross Domestic Product, fell 0.3% on the month although the quarter was strong with respect to consumer spending. The greenback also got a boost from Federal Reserve´s Governor Christopher Waller who said on Friday that despite a year of aggressive rate increases, the Fed "hasn't made much progress" in returning inflation to their 2% target and argued rates still need to go up. Meanwhile, Fed funds futures traders are pricing in an 81% probability that the Fed will hike by an additional 25 basis points next month.
Meanwhile, data this week will be eyed and a sure driver for the Greenback, Analysts at TD Securities explained that the S&P PMIs for early April will offer a first comprehensive look at the state of the US economy post-banking turmoil. ´´Note that the March data was not clearly impacted by banking jitters, but perhaps it was too soon to be reflected: both the mfg and services PMIs registered their third consecutive increase then, with the latter advancing further into expansion territory,´´ the analysts said.
US Dollar technical analysis
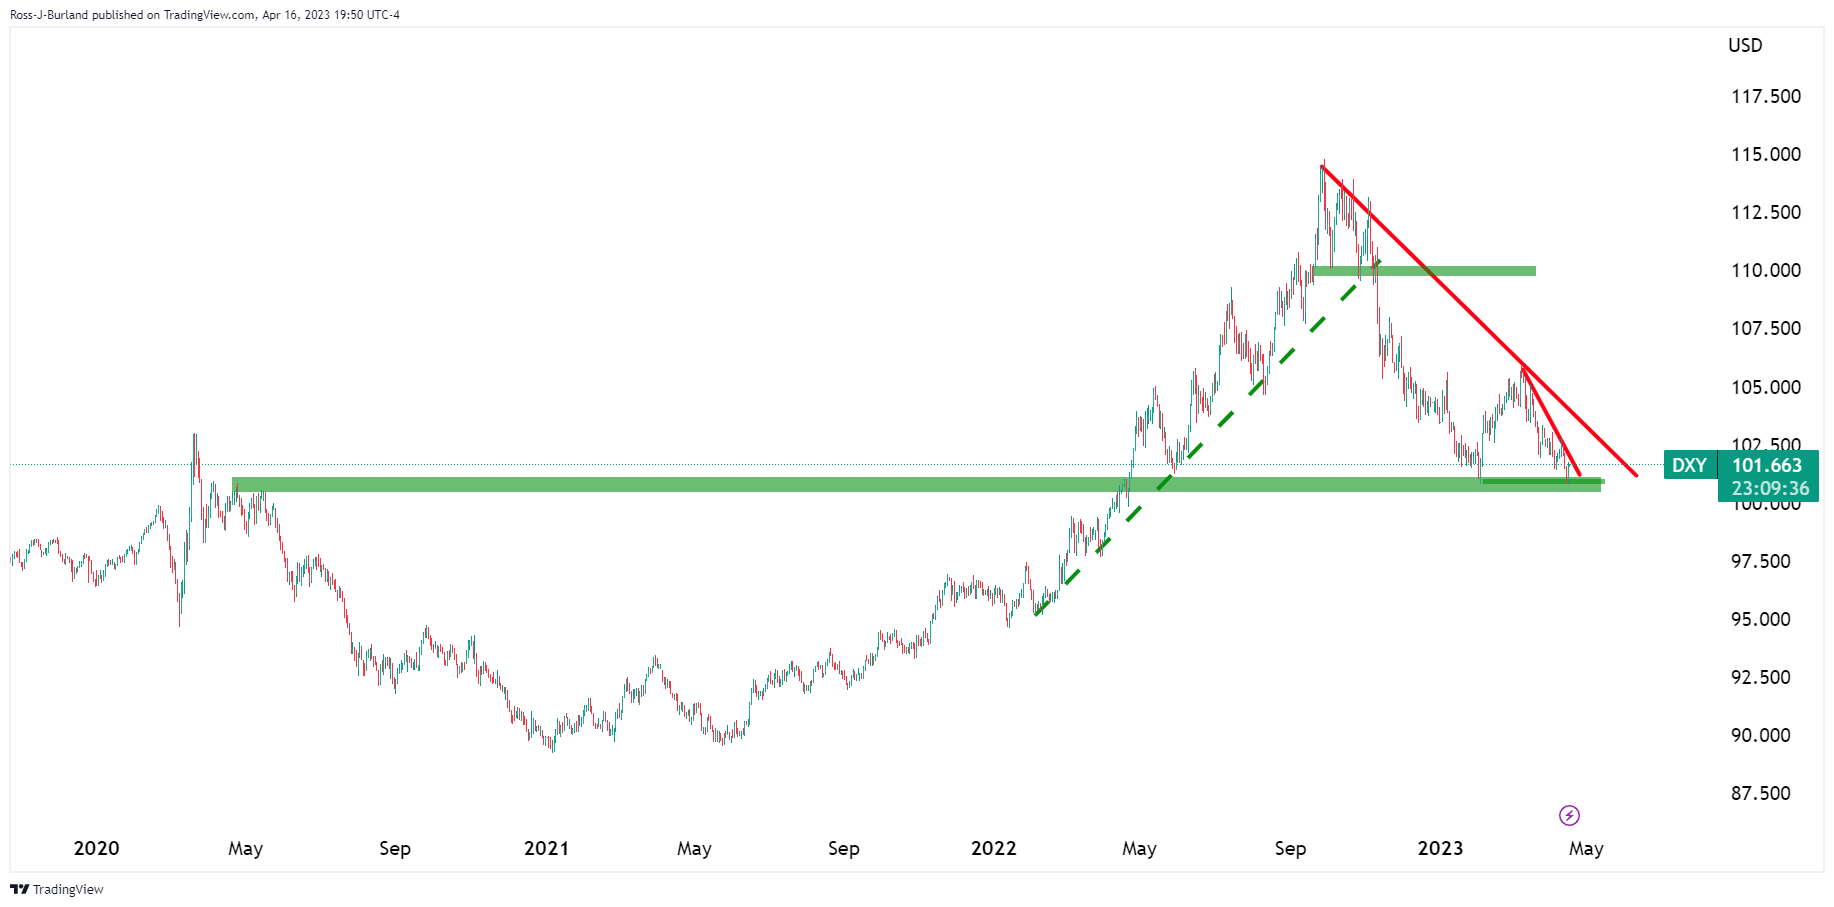
The US Dollar has fallen into what could be potentially a strong area of support, albeit on the front side of the bearish trend and therefore, the bias remains bearish.
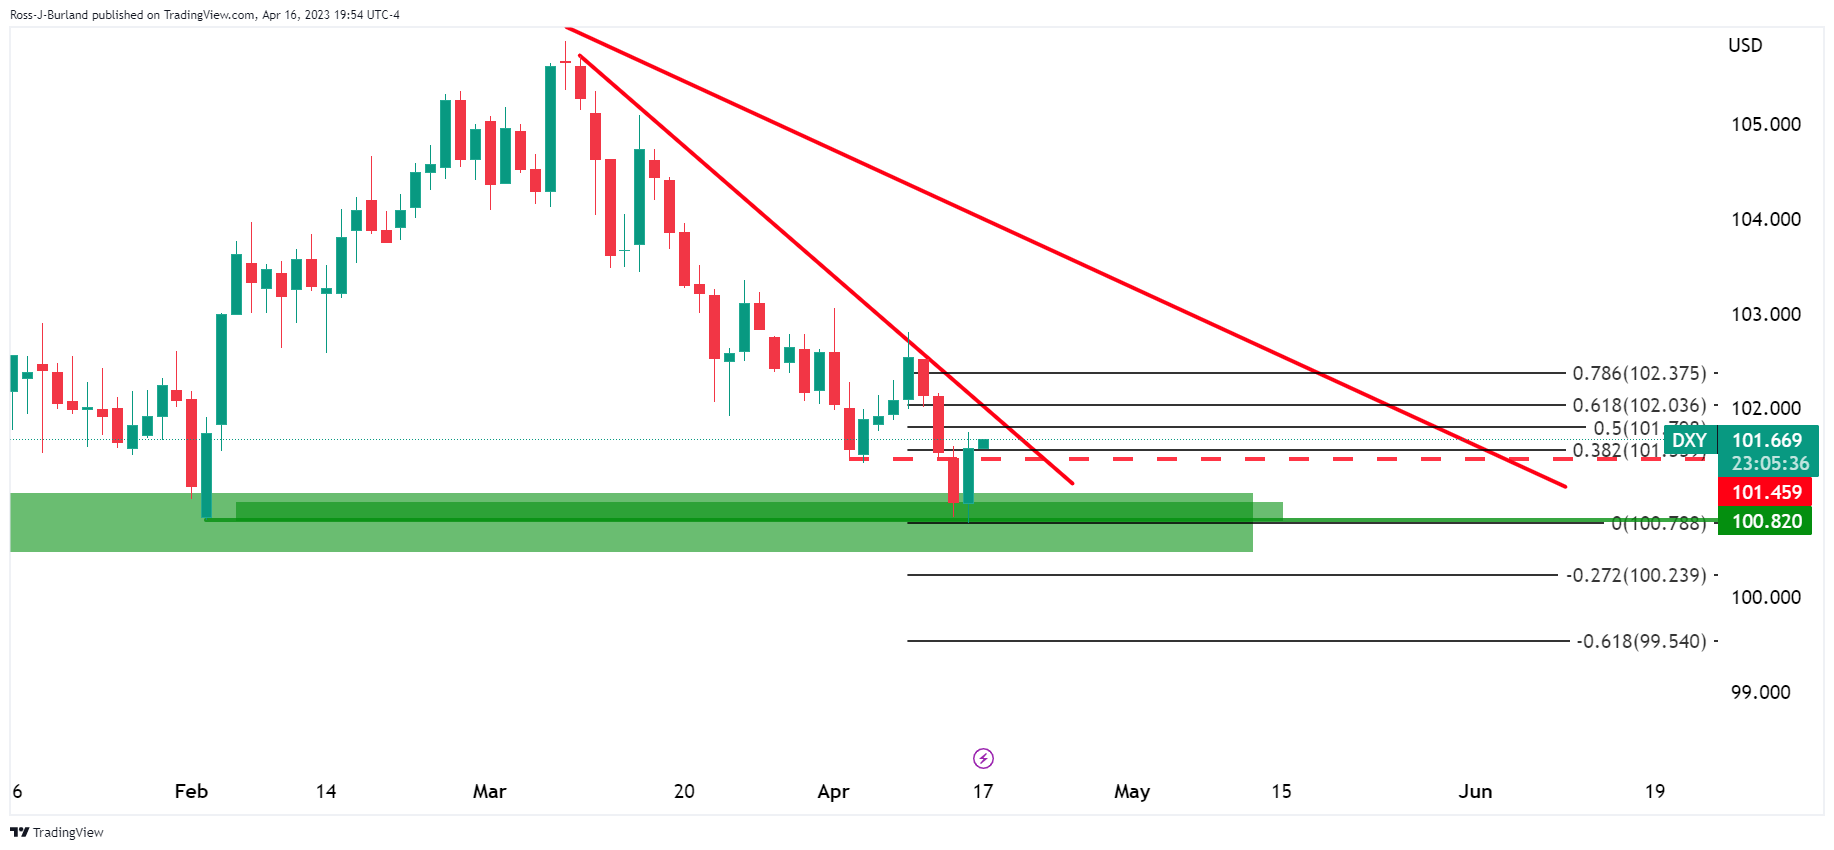
However, the US Dollar is making its way towards a 50% mean reversion near 101.80 and the micro trendline resistance. However, should the bulls commit, then the major trendline resistance will be in play for the foreseeable future as follows:
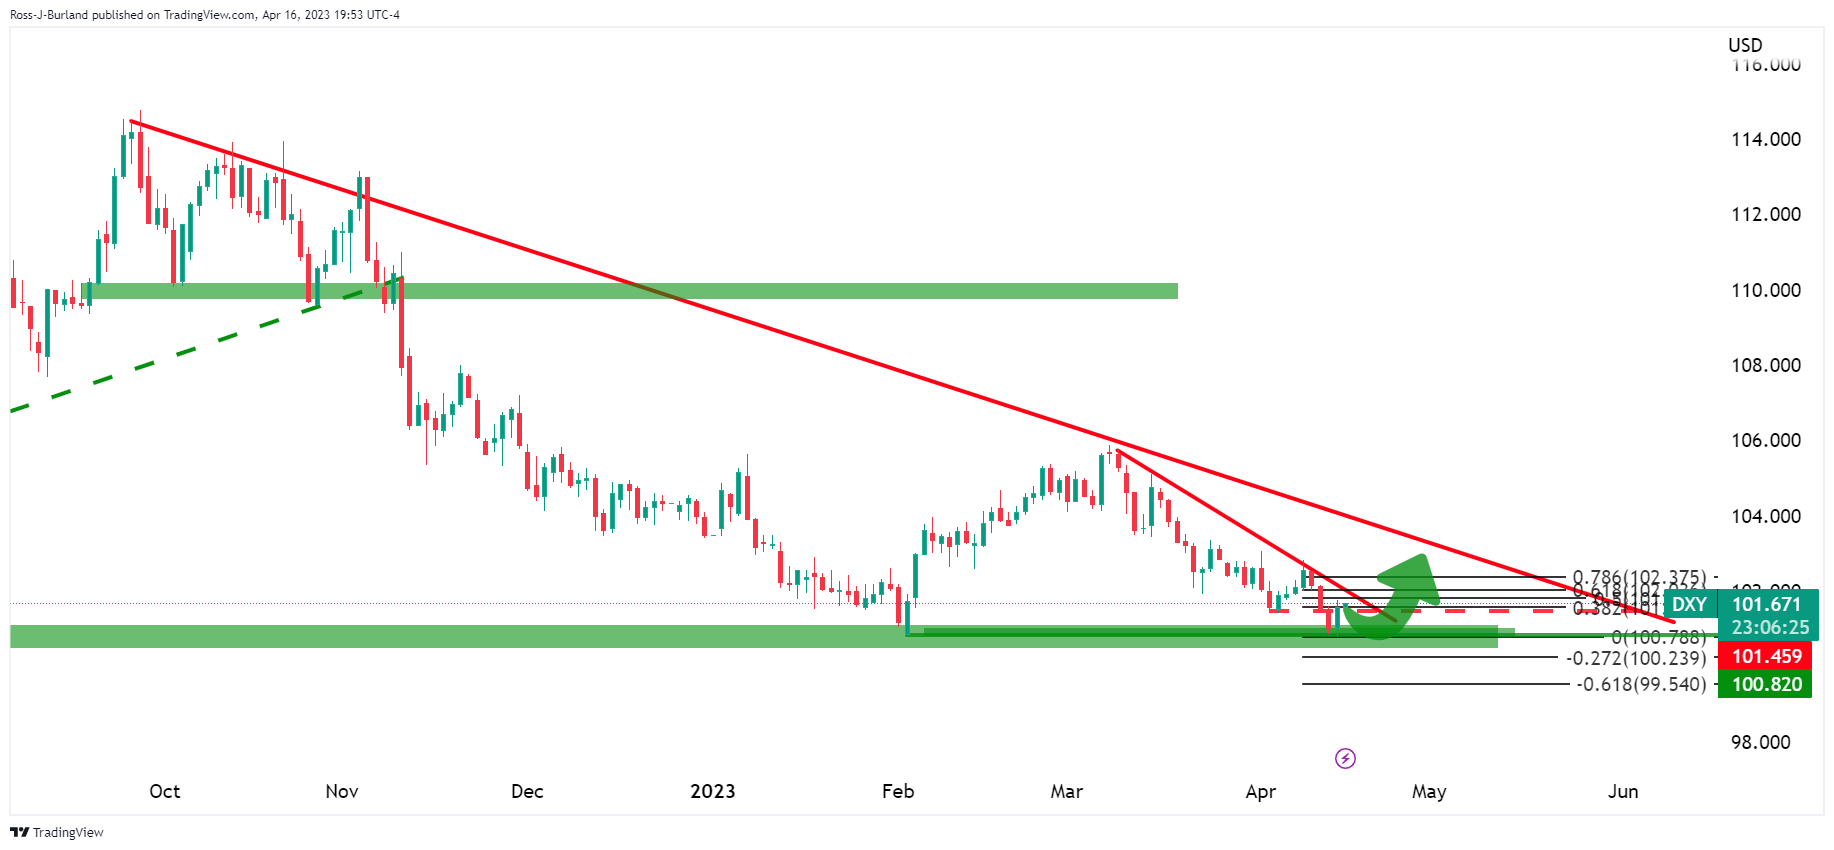
102.50 comes as a critical resistance in this regard that guards 103.50 to the upside meeting the aforementioned major trend line resistance.
-
01:15
Currencies. Daily history for Friday, April 14, 2023
Pare Closed Change, % AUDUSD 0.67103 -1.11 EURJPY 147.044 0.4 EURUSD 1.09948 -0.48 GBPJPY 166.028 -0.02 GBPUSD 1.24144 -0.89 NZDUSD 0.62094 -1.4 USDCAD 1.3358 0.14 USDCHF 0.89391 0.51 USDJPY 133.738 0.88 -
00:58
US inflation expectations join the forces to support US Dollar Index rebound
US inflation expectations, as per the 10-year and 5-year breakeven inflation rates from the St. Louis Federal Reserve (FRED) data, justify the market’s latest reassessment of the Federal Reserve (Fed) concerns by grinding higher in the last few days. In doing so, the inflation precursors favor the easing talks of the Fed policy pivot, as well as the rate cut, during 2023.
Also read: US Dollar Index: Could a double bottom at the weekly chart drive the DXY to 111.000?
That said, the Five-year and 10-year breakeven inflation rates from the St. Louis Federal Reserve (FRED) gradually improve to 2.31% and 2.30% figures by the end of Friday’s North American session.
The latest recovery in inflation precursors joins the University of Michigan's (UoM) one year ahead of Consumer Inflation expectations, which rose from 3.6% in March to 4.6% in April.
With this, the US Dollar Index (DXY) defends the late Friday’s recovery from a one-year low to around 101.60 as traders await this week’s preliminary readings of April’s Purchasing Managers Indexes (PMIs).
-
00:51
NZD/USD Price Analysis: Further downside towards 0.6160 appears imminent on mixed NZ data
- NZD/USD struggles for clear directions after welcoming bears the previous day.
- Business NZ PSI eased, Food Price Index improved in March.
- Sustained U-turn from 100-DMA, clear break of six-month-old ascending support keeps Kiwi sellers hopeful.
- Buyers need validation from 0.6390 to retake control.
NZD/USD stays sluggish around the 0.6200 round figure amid early Monday, after posting the biggest daily loss in 10 weeks the previous day. Even so, the Kiwi pair remains on the bear’s radar after New Zealand’s (NZ) clues for this week’s key inflation data flashed mixed signals.
That said, Business NZ PSI dropped to 54.4 for March versus 55.8 prior while the Food Price Index rose past marked forecasts of 0.4% to 0.8%, compared to 1.5% previous readings.
It’s worth noting that the NZD/USD pair’s clear U-turn from the 100-DMA, as well as a downside break of an ascending trend line from early October 2022, add strength to the bearish bias about the Kiwi pair, especially amid steady RSI (14) line.
With this, the quote appears all set to revisit the 200-DMA support of near 0.6160 before challenging the previous monthly low, as well as the yearly bottom, surrounding 0.6080. During the anticipated fall, the 0.6100 round figure may act as an intermediate halt.
Meanwhile, recovery moves need validation from the multi-day-old previous support line, now immediate resistance around 0.6230.
Following that, the 100-DMA and a nine-week-long horizontal resistance area, respectively near 0.6300 and 0.6390, quickly followed by the 0.6400 round figure, could challenge the NZD/USD bulls before giving them control.
NZD/USD: Daily chart
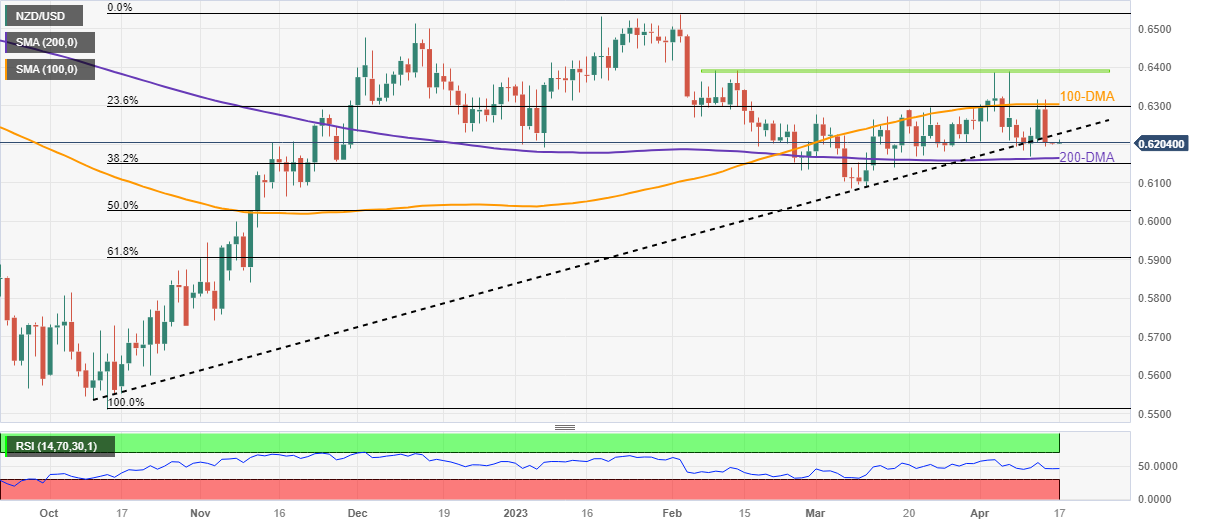
Trend: Further downside expected
-
00:43
WTI Price Analysis: Range shift above $82.00 advocates more upside ahead
- The upside in the oil price looks restricted amid a recovery in the US Dollar.
- An absence of follow-up selling after a loss in the upside momentum indicates that oil is preparing for a recovery.
- Advancing 50-period EMA at $82.00 is providing a cushion to the oil bulls.
West Texas Intermediate (WTI), futures on NYMEX, defended the critical support of $82.00 on Friday. The oil price has rebounded from $82.00, however, the absence of strength in recovery has pushed the black gold inside the woods. The black gold is struggling to gather strength as investors are divided that they should remain cautionary on deepening expectations of more rate hikes from the Federal Reserve (Fed) or cheer the fact that the Fed would reach to terminal rate, as widely expected.
The sideways performance in the oil price is also the outcome of recovery in the US Dollar Index (DXY). The USD Index has recovered to near 101.75 after printing an annual low of 100.78, which has restricted the upside for the oil price.
The oil price has shifted its auction into the $81.80-83.40 range from the prior auction of $79.00-81.80, which indicates that the upside bias is still solid. Also, advancing 50-period Exponential Moving Average (EMA) at $82.00 is providing a cushion to the oil bulls.
On a two-hour scale, exhaustion in the upside momentum can be recognized as the Relative Strength Index (RSI) (14) has formed a lower high while the asset is still making higher highs. An absence of follow-up selling after a loss in the upside momentum indicates that the asset is preparing for a recovery.
For a fresh buy, a move above April 13 high at $83.00 will press a buying opportunity. This would drive the asset towards November 16 high at $87.47 followed by the round-level resistance at $90.00.
On the flip side, a downside move below April 03 low would force oil to fill the gap inspired by the surprise announcement of production cuts by OPEC+. This will drag the asset towards March 31 high at $75.78 and March 28 low at $72.26.
WTI two-hour chart
-638172853499708310.png)
-
00:29
AUD/USD: Bearish pounce ahead of RBA Minutes, US PMIs around 0.6700
- AUD/USD treads water after snapping three-day winning streak.
- Market sentiment remains indecisive as recent data, Fed talks push back Fed rate cut concerns.
- Dovish RBA move, US Dollar rebound challenge Aussie pair buyers.
- RBA Minutes, China GDP and US PMIs will be in focus amid a likely sluggish week.
AUD/USD holds lower grounds near 0.6700 as it begins the key week on a sluggish note after positing the first daily loss in four the previous day. The Aussie pair marked the biggest daily loss in six weeks the previous day as the US Dollar cheered mostly upbeat US data and the Fed policymakers’ hesitance in welcoming doves. However, traders remain cautious ahead of this week’s Reserve Bank of Australia (RBA) Monetary Policy Meeting Minutes, Gross Domestic Product (GDP) for China and the US PMIs for April.
A wider than expected fall in the US Retail Sales failed to supercede upbeat figures from the US Industrial Production and University of Michigan's (UoM) Consumer Confidence Index on the previous day and allowed the US Dollar to reboud. That said, US Retail Sales dropped by 1.0% for March versus -0.4% expected and -0.2% prior. On the contrary, Industrial Production grew by 0.4% during the stated month compared to 0.2% market forecasts and prior reading. Additionally positive was the preliminary reading of the University of Michigan's (UoM) Consumer Confidence Index for April which improved to 63.5 versus 62.0 analysts’ expectations and previous readings. Furthermore, Year-ahead inflation expectations rose from 3.6% in March to 4.6% in April while its Five-year counterpart reprinted 2.9% for the said month.
Not only the data but hawkish comments from the Fed policymakers also enabled the greenback to pare the previous losses. “The recent developments are consistent with one more rate hike,” said Atlanta Federal Reserve (Fed) President, Raphael Bostic in an interview with Reuters this Friday. On the same, Fed Governor Christopher Waller mentioned that the recent data show that the Fed hasn't made much progress on its inflation goal and added that rates need to rise further, per Reuters. However, Federal Reserve Bank of Chicago President Austan Goolsbee said in an interview with CNBC on Friday that he still wants to see the data. The policymaker also added, “But let's be mindful we've raised a lot; some of the lag is coming through possibly in today's retail sales number."
Amid these plays, US Dollar Index (DXY) snapped a three-day south run and bounced off the lowest level in a year while Wall Street closed with minor losses and the bond yields managed to recover.
Technical analysis
AUD/USD pair’s U-turn from a convergence of the 100-DMA and six-week-old ascending resistance line, close to 0.6800, joins recently downbeat oscillators to direct sellers toward an ascending support line from March 10, around 0.6630 by the press time.
-
00:05
USD/CHF eyes 0.9000 amid strength in US Dollar infuses by hawkish Fed bets
- USD/CHF is aiming to recapture the critical resistance of 0.9000 as Fed policymakers are convinced of more rate hikes.
- S&P500 futures have recovered the majority of losses reported on Friday, portraying a recovery in investors’ risk appetite.
- Swiss inflation is expected to get arrested sooner by the SNB as banks have tightened their credit conditions after the collapse of Credit Suisse.
The USD/CHF pair has resumed its upside journey after a minor correction to near 0.8940 in the early Asian session. The Swiss Franc asset has rebounded and has resumed its upside journey towards the round-level resistance of 0.9000. The major is following the footprints of the US Dollar Index (DXY). The latter has regained traction after a minor downside as the Federal Reserve (Fed) is ignoring the risk of a recession in the United States economy and is confident on track to hiking rates further.
S&P500 futures have recovered the majority of losses reported on Friday, portraying a recovery in the risk appetite of the market participants. The 500-stock basket futures have rebounded as investors are anticipating a decent quarterly result season as the impact of higher rates from the Fed would have been offset by lower gasoline prices.
The USD Index is aiming to recapture Friday’s high of 101.75 as Fed policymakers are convinced that one more rate hike is on the table. Atlanta Fed President Raphael Bostic, meanwhile, said one more quarter-percentage-point interest rate hike can allow the Fed to end its tightening cycle with some confidence that inflation will steadily return to its 2% target.
Also, Fed Governor Christopher Waller said on Friday that despite a year of aggressive rate increases, U.S. central bankers "haven't made much progress" in returning inflation to their 2% target and need to move rates higher still.
On the Swiss Franc front, Swiss inflation is expected to get arrested sooner by the Swiss National Bank (SNB) as commercial banks have tightened their credit disbursing conditions after the collapse of Credit Suisse.
-