Notícias do Mercado
-
21:58
WTI turns positive, hovering around $85.00 a barrel as the US Dollar tumbles
- Western Texas Intermediate (WTI) s set to finish the week with losses of 0.55%.
- China’s demand and a soft US Dollar underpinned oil prices.
- WTI buyers unable to crack the 50-day EMA keeps the commodity downward biased.
WTI is about to finish Friday’s trading session almost flat, as Wall Street ended the day with hefty gains amidst hopes of a Fed pivot, as wires mentioned Fed officials debating to slow the pace of rate increases following November’s meeting. At the time of writing, WTI is trading at $85.17 a barrel, up by a minimal 0.19%.
WTI trimmed earlier losses courtesy of a soft US Dollar and China’s demand
Given that the Fed would diminish its aggression, the greenback fell, a tailwind for the US Dollar denominated commodity. US Treasury yields retraced their earlier gains, undermining the buck, which, as shown by its US Dollar Index, fell 0.88%, down at 111.865, after hitting a YTD high of 113.942.
Aside from this, oil prices increased in choppy trading on the likelihood of China’s more robust demand. News that the country might ease quarantine restrictions for visitors abroad from 10 to 7 days spurred a jump in oil prices.
The Organization of Petroleum Exporters Countries (OPEC) and its allies decided to cut oil production amidst the weakened global economic outlook, threatening to tip the largest economies into a recession. OPEC+ drew 2 million barrels daily, in a widely criticized decision by the White House, which reacted negatively to the decision.
WTI Price Forecast
Western Texas Intermediate (WTI) recovered some ground during the day and is clinging to the 20-day Exponential Moving Average (EMA) at $85.13 PB as volume dry. In the week, the US crude oil benchmark could not trade above its 50-day EMA at $86.80, meaning that risks remain skewed to the downside.
Therefore, WTI’s first support would be the October 18 daily low at $82.10, followed by the September 30 swing low at $79,16, and then a re-test of the YTD low at $76.28.
-
21:02
Silver Price Analysis: XAG/USD strengthens and rallies past $19.00
- Silver prices extend recovery to reach levels beyond $19.00.
- The US dollar dives on Fed easing speculation.
- XAG/USD is now at a key resistance area of $19.30.
Silver prices have extended Thursday’s rebound from $18.30 lows on Friday, breaking beyond $19.00 and reaching one-week highs at $19.30 so far. The precious metal appreciates more than 3% on the day, retracing half of the ground lost on the previous week’s sell-off.
Precious metals appreciate against a softer USD
A news report by the Wall Street Journal has suggested Federal Reserve officials are open to debate on how to signal a smaller rate hike in December. This has offset the positive impact of the bank’s representative’s hawkish rhetoric and sent the US dollar tumbling across the board.
Furthermore, an alleged intervention by the Bank of Japan and the Japanese Finance Ministry has sent the yen surging across the board. The USD/JPY plunged more than 2.5%, as a consequence, and weighed the US dollar across the board.
XAG/USD pushing against key resistance at $19.30
From a technical perspective, the pair is now testing the resistance area at $19.30 (Oct. 13 high and the 38.7% Fib. Retracement of the October 4-10 decline). Above here, the next potential targets are $19.65 (50% retracement and Oct. 11 high) and the $20.00 level.
On the downside, below the $19.00 previous resistance area, the next potential targets could be the 20-period SMA in the 4-hour chart, now at $18.60, and October 14 low at $18.08.
XAG/USD 4-hour chart
Technical levels to watch
-
21:00
European Monetary Union CFTC EUR NC Net Positions increased to €48.1K from previous €37.5K
-
21:00
United Kingdom CFTC GBP NC Net Positions: £-51.2K vs previous £-39.2K
-
21:00
United States CFTC Gold NC Net Positions: $77K vs previous $94.4K
-
21:00
Australia CFTC AUD NC Net Positions declined to $-35.4K from previous $-31.3K
-
21:00
United States CFTC S&P 500 NC Net Positions down to $-223.2K from previous $-164.1K
-
21:00
United States CFTC Oil NC Net Positions declined to 251.5K from previous 259.2K
-
21:00
Japan CFTC JPY NC Net Positions: ¥-94.3K vs previous ¥-77.4K
-
20:18
NZD/USD rushes up to the 0.5750 area as the US dollar loses ground
- The kiwi bounces up at 0.5610 and rallies to 0.5755.
- The US dollar drops amid Fed easing speculation.
- NZD/USD is unlikely to consolidate above 0.5750 – UOB.
The New Zealand dollar bounced up strongly at 0.5610 on Friday’s early US session to hit fresh two-week highs at 0.5765, favored by a broad-based US dollar weakness.
Fed easing speculation hits the US dollar
A news report by the Wall Street Journal published earlier on Friday has suggested that Fed officials would be open to debating the size of future hikes, pointing out to a step back on the tightening cycle in December has hammered the US Dollar.
The WSJ report offsets the positive impact of recent hawkish comments by Fed officials. Only on Thursday, Patrick Harker, The Philadelphia Fed President affirmed that the bank will "keep raising rates for a while."
Furthermore, a suspected intervention by the Japanese authorities has sent the yen surging across the board. The USD/JPY, as a result, has plunged more than 2.5% in a matter of minutes, which has reverberated on all USD crosses.
NZD/USD: More consolidation ahead– UOB
Analysts at UOB expect the pair to remain trading sideways over the next weeks, with upside attempts capped below 0.5755: “We highlighted yesterday that NZD ‘could rise above 0.5725 but a sustained advance above this level still appears unlikely’(…) “Our update from two days ago (18 Oct, spot at 0.5675) still stands. As highlighted, NZD appears to have moved into a consolidation phase and is likely to trade between 0.5570 and 0.5755 for the time being.”
Technical levels to watch
-
19:33
USD/CHF Price Analysis: Seesawed in a 200-pip range, hovers around parity amid a soft US Dollar
- USD/CHF is set to finish the week with losses of 0.45%.
- Failure to reclaim 1.0027 would confirm the USD/CHF rising wedge break, which would target the 200-day EMA at 0.9567.
USD/CHF retraces from daily highs reached in the North American session around 1.0147 but trimmed its gains, plunging below 1.0000 towards its daily low at 0.9961, as the Japanese government and the Bank of Japan (BoJ) recognized intervening in the FX markets, propelling the yen a headwind for the USD/CHF. At the time of writing, the USD/CHF is trading at 1.0003, clinging to parity.
USD/CHF Price Forecast
The USD/CHF daily chart illustrates the pair broke above the top-trendline of a bearish rising wedge, though retraced within, on the BoJ intervention. As the BoJ hit the greenback, the USD/CHF tumbled below the bottom-trendline of the rising wedge, opening the door for further losses. Albeit the USD/CHF trimmed some of its losses, the major remains below the previously-mentioned trendline. So further downward action is warranted.
Therefore, the USD/CHF first support would be the parity. Break below will immediately expose the October 21 daily low at 0.9961, followed by the 20-day Exponential Moving Average (EMA) at 0.9928, ahead of 0.9900.
On the other hand, if the USD/CHF reclaims 1.0027, it would exacerbate a re-test of 1.0100, as buyers target the YTD high at 1.0147.
USD/CHF Key Technical Levels
-
19:33
AUD/USD’s rally from 0.6210 stalls below 0.6380
- The aussie bounces up from 0.6210 and erases the previous two days' losses.
- Fed speculation and BoJ intervention hit the USD.
- AUD/USD is expected to remain capped below 0.6390.
The Australian dollar has featured a strong recovery on Friday’s US trading session. The pair bounced up from session lows at 0.6210, rallying all the way to levels right below 0.6380 and retracing the last two day’s decline.
The USD dives on Fed speculation and BoJ intervention
A news report by the Wall Street Journal suggested earlier on Friday that Federal Reserve officials are open to discussing how to signal a smaller rate hike in December which has hurt demand on the USD across the board.
The report has offset the impact of the hawkish rhetoric of Fed members. Just on Thursday, the Philadelphia Fed President Patrick Harker assured that the bank will "keep raising rates for a while."
Furthermore, an alleged intervention by the Bank of Japan and the Japanese Finance Ministry has pushed the yen higher across the board. The USD has tumbled more than 2.5% in a matter of minutes, which has hit all US dollar crosses.
AUD/USD unlikely to appreciate past 0.6390 in the near term – UOB
From a longer-term perspective, FX analysts at UOB remain skeptical about the possibility of a sustained uptrend: “Our latest narrative from Tuesday (18 Oct, spot at 0.6295) still stands. As highlighted, AUD is likely to consolidate and trade between 0.6190 and 0.6390 for the time being.”
Technical levels to watch
-
19:04
GBP/USD's reversal from 1.1300 finds support at 1.1200
- The pound remains steady above1.1220.
- Weak UK data and political uncertainty are weighing on the GBP.
- GBP/USD, approaching the tip of a triangle pattern.
The pound failed on its assault to 1.1300 earlier on Friday, although the ensuing reversal has found support at 1.1220 and the pair picked up again to the 1.1250 area. The GBP/USD remains moderately positive on the day in track to regain the previous two day’s losses.
UK's weak economic prospects are hurting the pound
Retail consumption contracted by 1.4% in September, well above market expectations of a 0.5% decline, and was 6.9% lower from the same month last year, according to data reported by National Statistics released earlier on Friday.
The impact of these figures, which have confirmed fears of an upcoming recession in the UK and have been coupled with political uncertainty, as the Tory party hustles to find a replacement for Liz Truss, which has increased negative pressure on the pair.
GBP/USD approaching the tip of a triangle formation
From a technical point of view, the daily chart shows the pair approaching the tip of a symmetrical triangle pattern with trendline resistance at 1.1325, and the next potential resistance levels at 1.1430 (50-day SMA) ahead of October 4 and 5 highs at 1.1510.
On the downside, the base of the triangle lies now at 1.1080. Below here, bears might increase confidence and send the pair to 1.0920 (October 12 low) and then probably to 1.0540 (September 28 low)
GBP/USD daily chart
Technical levels to watch
-
18:59
United States Baker Hughes US Oil Rig Count climbed from previous 610 to 612
-
18:42
AUDJPY Price Analysis: Plunges from monthly highs, struggles to reclaim the 100-DMA
- AUD/JPY retraces from weekly highs, set to end the week with minimal losses of 0.07%.
- Japanese authorities intervened in the FX market to bolster the Japanese yen.
- AUD/JPY Price Forecast: From the daily, the pair is neutral-to-upwards, but short term, is range-bound, so caution is warranted.
The AUD/JPY seesawed in a wide range following Japanese authorities’ intervention in the FX markets. The risk-perceived cross pair hit a daily high at around 95.73 before plunging toward its daily low at 93.08. At the time of writing, the AUD/JPY is trading at 93.80, below its opening price by 0.49%.
AUD/JPY Price Forecast
Friday’s session was volatile, and the AUD/JPY shifted its bias from neutral upwards to neutral, as flashed by the daily chart. When the pair fell from daily highs, it hurdled the 50 and 100-day Exponential Moving Averages (EMAs), each at 94.57 and 94.20, exposing the 20-day EMA. Worth noting that the AUD/JPY pierced the latter around 93.22 but rebounded towards current exchange rates, keeping the pair range-bound.
Due to market participants bracing for the weekend, the lack of catalyst might keep the AUD/JPSD trading within the boundaries imposed by the daily EMAs. Therefore, key resistance lies at the 100 and 50-EMAs at 94.20 and 94.57, ahead of the 95.00 figure. On the flip side, the AUD/JPY first support would be the 20-day EMA at 93.22, ahead of the weekly low at 93.08.

AUD/JPY Daily Chart
Short term, the AUD/JPY hourly chart, lacks direction, so traders better be on the sidelines until the dust settles. For the restless ones, the AUD/JPY first resistance is the daily pivot point at 94.27, followed by the 95.00 figure, ahead of the R2 pivot level at 95.16. On the flip side, the AUD/JPY key support levels would be the 94.00 figure, followed by the S1 daily pivot at 93.86, ahead of the 200-EMA at 93.18.
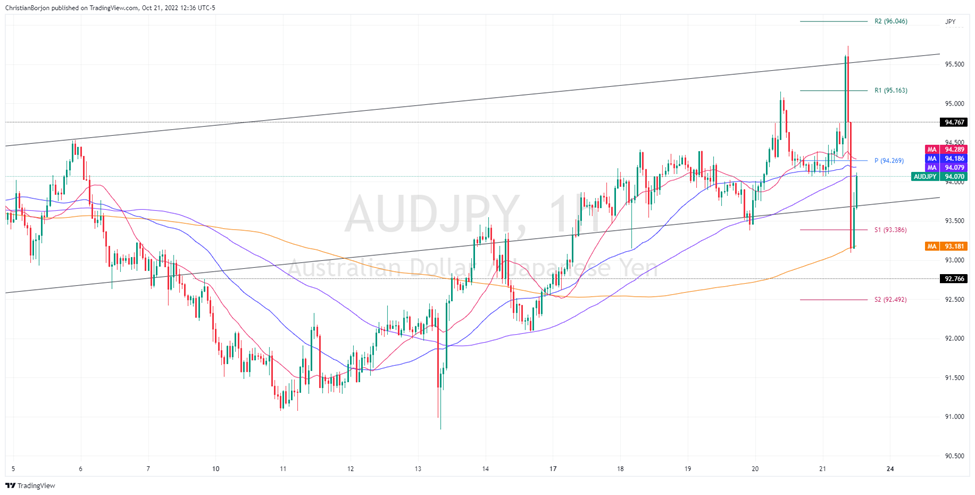
AUD/JPY Hourly Chart
AUD/JPY Key Technical Levels
-
18:11
USD/CAD tumbles below 1.3700 as the US Dollar gets battered
- USD/CAD drops as Japanese authorities confirmed an intervention, selling US Dollars.
- San Francisco Fed Mary Daly said further tightening is needed while laying the ground for lower rate hikes.
- Canada’s Retail Sales in August exceeded estimates, contrarily for September, with expectations at -0.5%.
The USD/CAD tumbled from around daily highs of 1.3850 towards the 1.3660s area as US Treasury bond yields dropped on news that Fed officials are looking to slow the pace of interest-rate increases at December’s meeting. Additionally, speculation of Japanese authorities intervening mounted as the USD/JPY tumbled from 151.60 to its daily low of 147.16. At the time of writing, the USD/CAD is trading at 1.3662.
US equities are trading in the green as a Fed pivot lurks. An article in the WSJ commented that Fed officials are assessing the size of December’s rate hike, as a 75 bps in November is most likely. Echoing those comments, San Francisco Fed President Mary Daly said that more tightening is needed while adding that “we (Fed) don’t just keep going up at 75 bps increments” on Friday. She noted that slowing rates should be considered “at this point.”
On Thursday, Philadelphia Fed President Patrick Harker and Fed’s newest board member Lisa Cook said the Fed would need to keep hiking interest rates. He added that he is “disappointed with the lack of progress curtailing inflation” and expects rates to be above 4% in 2023.
The absence of Us economic data left traders adrift in Thursday’s releases. US economic data, namely, unemployment claims, rose less than estimates, flashing the tightness of the labor market. Additionally, the Philadelphie Fed Manufacturing Index improved in October but was below estimates, hovering below zero for 5 consecutive months.
On the Canadian side, the calendar featured Retail Sales, which increased by 0.7% in August, above 0.2% estimates, while estimates for September are down 0.5%. Also underpinning the Canadian dollar was oil prices, with WTI up 0.09% at $85.25 a barrel, on higher demand by China and OPEC and its allies cuts.
USD/CAD Key Technical Levels
-
18:03
GBP/JPY plunges from 169.50 area to session lows below 165.00
- The pound retreats to levels below 165.00 on an alleged BoJ intervention.
- The Japanese authorities have declined any comment.
- FX analysts are skeptical about the effectiveness of monetary interventions.
The British pound has depreciated more than 2.5% in a few minutes during Friday's US trading session in what seems like an intervention by the Japanese authorities to protect the yen.
The GBP/JPY was trading at 169.50, at a short distance to a six-year high of 170.25 before plummeting to session lows at 164.70. The pound’s bearish reversal has lacked any fundamental catalyst, and all signs point out to an alleged action by the Bank of Japan and the Ministry of Finance.
The Japanese Ministry of Finance has declined to comment on the issue.
Earlier during the week, however, BoJ officials and Japanese authorities reiterated their commitment to step in to curb yen volatility. On Friday, Finance minister Suzuki affirmed that Japanese authorities were dealing with currency speculators “strictly”.
On Thursday, Masato Kanda, Japan’s vice minister of finance for international affairs assured that the Japanese Government is ready to take action “as excessive volatility becomes increasingly unacceptable.”
Currency analysts are doubtful about the effectiveness of such actions while the fundamental reasons are adverse. The monetary policy differential between a hawkish Federal Reserve and the ultra-accommodative Bank of Japan is clearly favorable to the US dollar.
Technical levels to watch
-
17:32
ECB: We have significantly increased our rate expectations through 2023Q1 – Rabobank
A key event next week is the European Central Bank meeting. According to analysts from Rabobank, a 75 basis points interest rate hike is a done deal. They see the deposit rate reaching 3% by March next year.
Key Quotes:
“The inflation outlook continues to deteriorate, with a strong acceleration in underlying price pressures. This cements a 75bp hike this month. Moreover, it is difficult to see how core inflation could come in below 3% in 2024.”
“President Lagarde will have to acknowledge additional inflationary risks, but we expect her to stick to the narrative that the ECB is merely ‘frontloading’ normalisation.”
“A 75bp rate hike in October seems like a done deal. We have also upgraded our expectations for the next few meetings, and now see the deposit rate reach 3% by March.”
“With a 75bp increase next week and the prospect of another jumbo hike in December, it is debatable whether the ECB’s tightening cycle can still be considered as ‘frontloading’, or whether this catchphrase will suffer the same fate as ‘transitory’ did earlier this year. We would argue the latter, but with the ECB sticking to its meeting-by-meeting approach, we don’t expect President Lagarde to discontinue ‘frontloading’ as descriptor of next week’s hike.”
-
17:28
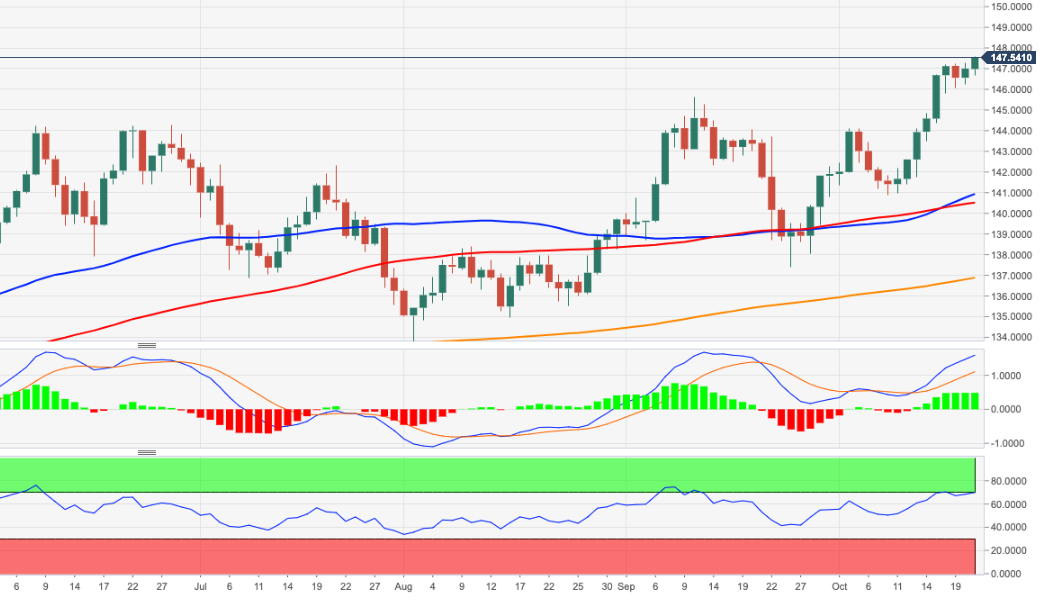
EUR/JPY plunges below 145.00 on an alleged BoJ intervention
- The euro plunges from a seven-year high of 148.25 to 144.75.
- All signs point out to a BoJ intervention.
- Volatility levels soar in all yen crosses.
The euro plummeted about 2.5% in a matter of minutes during Friday’s North American trading session on suspected intervention by the Japanese economic authorities. The pair retreated from seven-year highs at 148.25 to 144.75 area at the time of writing
In the absence of any relevant fundamental element to justify the move, all signs point out to a market intervention By the Bank of Japan and the Ministry of Finance to protect the Japanese currency.
Different officials of the Bank of Japan had been reiterating the Japanese authorities’ commitment to step in as the yen declined to fresh multi-year lows against its main peers. On Thursday Masato Kanda, a top currency diplomat assured that the Japanese Government is ready to take action “as excessive volatility becomes increasingly unacceptable.”
Currency analysts, however, remain skeptical about the effectiveness of currency interventions while the fundamental reasons keep underpinning dollar demand, especially with the monetary policy differential between the Federal Reserve and the Bank of Japan.
Technical levels to watch
-
16:50
US: Economy likely rebounded in Q3, still seen a mild recession next year – Wells Fargo
Next week, on Thursday the first estimate of US Q3 GDP growth data will be released. Analysts at Wells Fargo forecast the economy expected at an annualized rate of 2.8%, after two negative quarters. They still see a recession next year.
Key Quotes:
“After two consecutive quarters of negative growth, we forecast the U.S. economy expanded at an annualized rate of 2.8% in the third quarter.”
“We anticipate underlying demand measures remained solid, and we have bumped up our forecast for real personal consumption expenditures (PCE) on the recent retail sales data for September. We now look for real PCE to rise at a 0.8% annualized pace in Q3 (+0.6% previously). Higher consumption suggests modestly more import growth as well, though net exports still look to provide a considerable boost of over three percentage points to the headline GDP figure as import growth still broadly reversed during the quarter.”
“We still anticipate a mild recession to take place next year. But as we detail in our latest monthly report, recent momentum makes the start of recession by the beginning of the year less likely. We now see a downturn happening a bit later, beginning in the second quarter rather than the first.”
-
16:43
EUR/USD's recovery extends beyond 0.9800 as the US dollar loses momentum
- The euro picks up and returns to levels above 0.9800.
- Speculation about a shorter Fed hike in December has hit the USD.
- EUR/USD seen declining to 0.9300 in Q1 2023 – Nordea.
The euro has shrugged off the previous sessions' weakness during Friday’s US trading. The pair has regained lost ground after bouncing at 0.9705 lows earlier today and is struggling to consolidate above 0.9800 at the moment of writing.
The US dollar dives with all eyes on the Fed
A news report by the Wall Street Journal pointed out on Friday that Federal Reserve officials are likely to open a debate on how to signal a smaller rate hike in December. The US dollar has reacted with a sharp reversal from session highs.
The US Dollar index, which measures the value of the US dollar against a basket of the world’s most traded currencies, has plummeted more than 1%, from three-week highs near 114.00, to the mid-range of 112.00.
WSJ’s report has offset the positive impact on the US dollar generated by the hawkish tone of the Fed officials' recent comments. Philadelphia Fed President Patrick Harker reiterated on Thursday that the bank will "keep raising rates for a while."
Beyond that, initial jobless claims increased below expectations last week, according to data released on Thursday, confirming the tight labor market conditions and paving the path for the Fed to maintain its aggressive tightening cycle.
EUR/USD, seen bottoming at 0.9300 during Q1 2023 – Nordea
Currency analysts at Nordea expect the euro to continue depreciating to hit 0.9300 in 2023: “We believe the USD will continue to do well in the months to come due to the hawkish Fed conducting the fastest rate hikes in decades, a resilient US economy, and USD’s safe haven in these troubling times. This will bring EUR/USD to 0.93 during Q1.”
Technical levels to watch
-
16:36
Canada: Retail sales above forecasts in August, but trend is still failrly sluggish – CIBC
Data released on Friday showed a higher-than-expected increase in August retail sales. Analysts at CIBC, point out that while headline figures came in above consensus expectations, there were hints within the detail suggesting that while Canadian consumers are surviving, they are no longer thriving.
Key Quotes:
“Retail sales posted a rebound of 0.7% (consensus +0.2%) after declining by 2.2% in the prior month. In volume terms, sales were up by an even healthier 1.1%, although that reversed only about half of the decline seen in the previous month. The big driver of higher sales in August was food & beverage stores, which could signal that consumers are once again eating at home more often than eating out.”
“Released alongside the retail sales figures today, the advance estimate for wholesale sales in September suggested a modest decline of 0.2%.”
“Retail sales were somewhat stronger than expected in August, although the trend is still fairly sluggish. The higher than expected print, combined with an upside surprise for August wholesale sales released last week, puts some upward pressure on forecasts for monthly GDP next week (flash estimate was 0.0%) and by extension Q3 as a whole.”
-
16:15
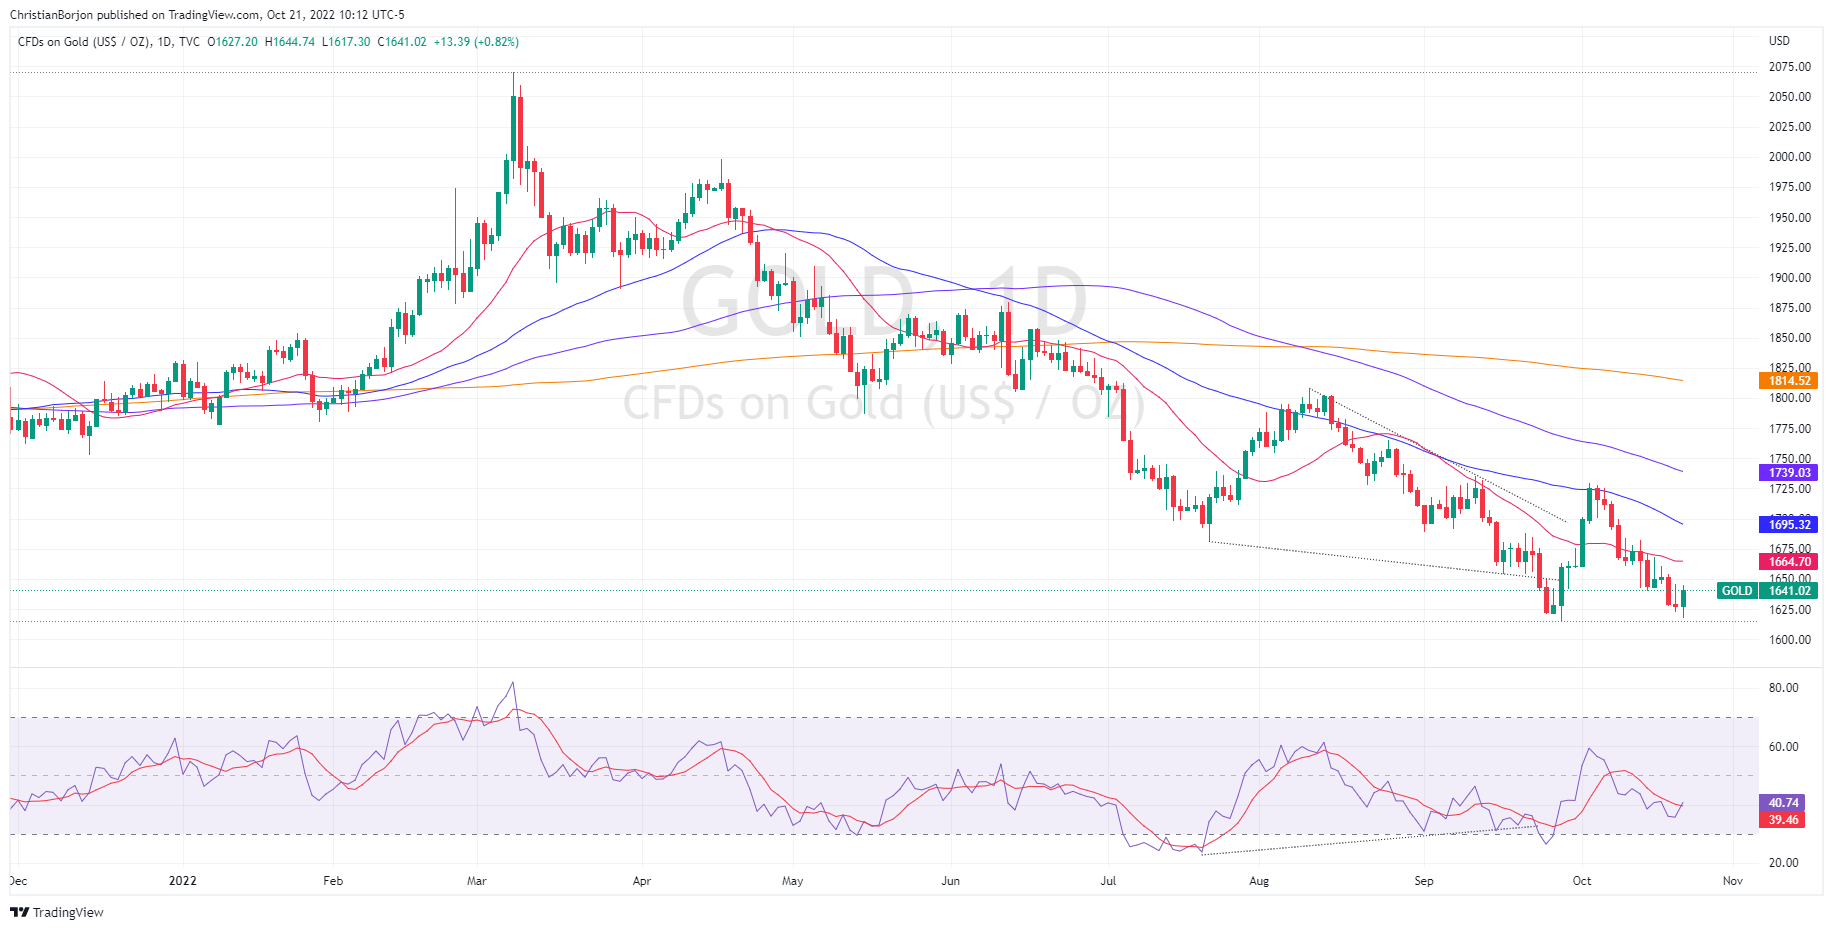
Gold Price Forecast: XAU/USD rises on speculation a Fed pivot lurks, US bond yields fall
- Gold price advances almost 1% as the market speculates on a Fed pivot, spurred by a WSJ article.
- US T-bond yields dropped, underpinning the gold price, which bounced off the month’s lows.
- Gold Price Forecast: The downtrend remains intact, though a break above $1650 would send gold to $1665.
Gold price rebounds from monthly lows around $1617, advancing steadily towards the $1640s region as US Treasury yields drop on an article published by the Wall Street Journal (WSJ), which mentioned that Fed officials are split about December’s rate hike, as November increase to the Fed funds rate (FFR) 75 bps, is utmost certain.
Gold advances as Fed officials debate December’s rate hike
Additionally, the WSJ article noted that policymakers are weighing whether to hike rates at a slower pace in December, namely 50 bps, though fears of being perceived as a “Fed pivot” could trigger a rally in equities, which according to the article, is not the case. Instead, Fed officials are adjusting the pace of rate increases as they try to cool down inflation. Once the article was published, US equities rallied, and US bond yields retraced, a tailwind for the gold price, as it printed a fresh monthly low early in the session.
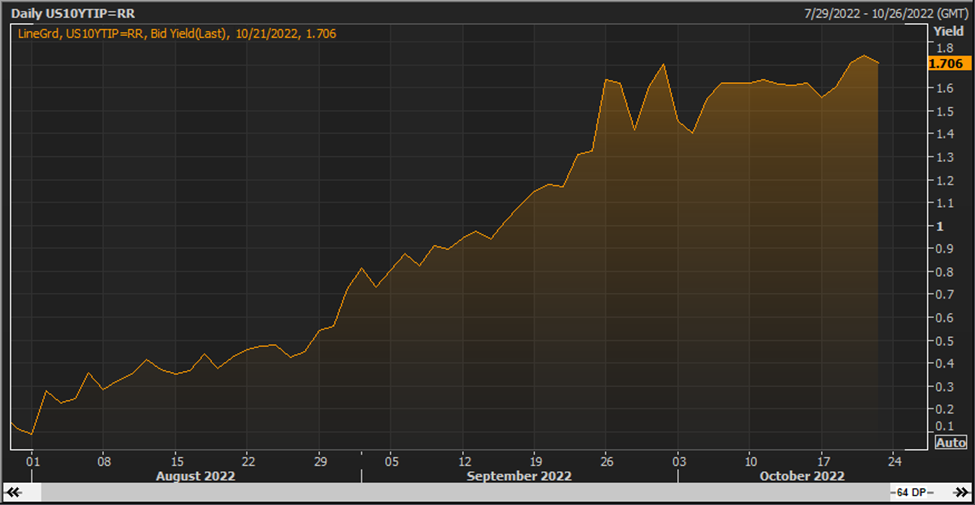
The US 10-year T-bond yield is gaining two bps, up at 4.250%, well below the YTD high of 4.338%, a level last seen before the global financial crisis in 2007. Also, US real yields retreated from 1.838% to 1.706% as measured by the US 10-year Treasury Inflation-Protected Securities (TIPS) bond yield, giving a respite to the yellow metal holders.
Fed officials reiterated the need to further action, as inflation remains high
Friday’s absence of US economic data to be reported left market participants leaning to further Fed commentary. On Thursday, a slew of Fed speakers, namely, the Philadelphia Fed President Patrick Harker and Fed board member Lisa Cook commented that the Fed would need to keep increasing rates. Harker commented that he is “disappointed of the lack of progress curtailing inflation,” while he added that he expects rates to be above 4% in 2023.
The US Dollar Index is dropping like a stone, from around 113.94 to 112.90, as speculations of an intervention in the USD/JPY increase, due to the broad trading range depicted by the hourly chart.
Gold Price Forecast
The daily chart shows that the XAU/USD is still downward biased, though it remains close to the YTD lows of $1614.92. The daily Exponential Moving Averages (EMAs) keep their bearish slope, trading well above the spot price, while the Relative Strength Index (RSI) at 39.86, although it’s aiming higher, remains in bearish territory. Hence, sellers remain in charge, though getting a respite, as the yellow metal prepares to prolong its losses for back-to-back weeks. If XAU/USD breaks $1650, a test of the 20-day EMA is on the cards; otherwise, it will remain exposed to re-test the YTD lows.
-
15:58
USD/JPY collapses below 150.00, intervention?
- Japanese yen soars suddenly across the board on potential intervention.
- Volatility at extreme levels in JPY crosses.
- USD/JPY falls 300 pips from the top, find support so far around 149.00.
The USD/JPY lost three hundred pips during the last minutes rising suspicion of an intervention from Japanese authorities. The pair rose to as high as 151.92 earlier on Friday, the highest level since August 1990 and it has recently dropped below 149.50.
The Bank of Japan and the Finance Minister could be behind the dramatic decline. The pair is now negative for the day and it could post the first decline in more than two weeks.
Analysts doubt about how successful could be an intervention while fundamental conditions remain the same with and ultra-accommodative Bank of Japan and the Federal Reserve rising aggressively interest rates.
Volatility at current times is at extreme level in USD/JPY, with the pair moving more than 30 pips by the minute.
USD/JPY technical levels
-
15:49
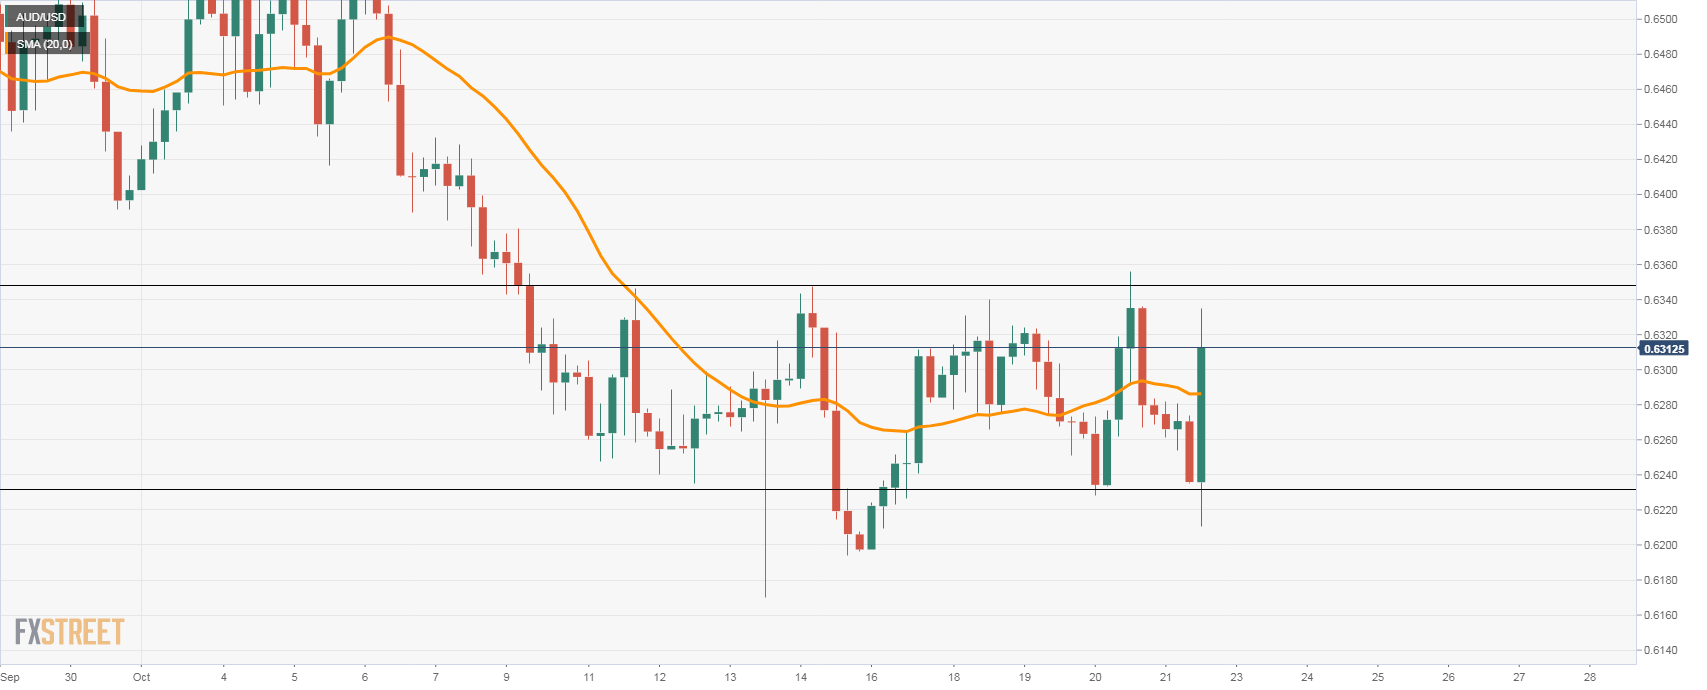
AUD/USD rebounds above 0.6300 as USD slides
- Dollar loses momentum late on Friday after WSJ report.
- AUD/USD rises from multi-day lows to 0.6330.
The AUD/USD turned positive for the day after rebounding more than a hundred pips from four-day lows. The pair rose from near 0.6200 to 0.6333, hitting a fresh daily high on the back of a weaker dollar.
The greenback pulled back across the board following a report from WSJ mentioning a debate at the upcoming FOMC meeting on how to continue rising interest rates. The DXY moved off highs and trimmed daily gains. The report also boosted equity prices in Wall Street, also helping commodity prices.
Despite the sharp moves in AUD/USD, it continues to move in ranges between 0.6340 and 0.6200. A firm break above 0.6350 should open the doors to more gains in the very short term.
AUD/USD 4-hour chart
-
15:34
United States Monthly Budget Statement fell from previous $-220B to $-430B in September
-
15:05
FX intervention could lead to an even strong dollar down the road – Nordea
Is global intervention on the cards to weaken the US Dollar? Economists at Nordea do not think so and see an even stronger USD ahead.
Uncoordinated FX intervention will not stop the USD rally
“The FX intervention whereby countries are actively intervening to prop up their currencies against the USD may dampen the strengthening of the USD in the short to medium-term. But countries do not have an endless amount of USD at disposal to sell, meaning that the FX intervention will fail when their USD coffers run dry.”
“FX intervention involves selling of US Treasuries, which adds upwards pressure on US rates and leads to a stronger USD in isolation. This FX intervention USD doom-loop could lead to dollar overshooting – especially when several central banks are enforcing the loop.”
-
15:01
European Monetary Union Consumer Confidence registered at -27.6 above expectations (-30) in October
-
14:46
USD/JPY retreats after hitting fresh 32-year peak. Still well bid around mid-151.00s
- USD/JPY builds on the breakout rally beyond 150.00 and surges to a new 32-year high.
- The Fed-BoJ policy divergence, widening US-Japan rate differential weighs on the JPY.
- Hawkish Fed expectations, elevated US bond yields lift the USD and remain supportive.
The USD/JPY pair adds to its strong intraday gains and continues scaling higher through the early North American session. The momentum, however, stalls ahead of the 152.00 round-figure mark and spot prices quickly retreat to mid-151.00s in the last hour.
The Japanese yen has been the worst-performing G10 currency and has depreciated over 30% against the US dollar since the beginning of this year. A big divergence in the monetary policy stance adopted by the Bank of Japan and the Federal Reserve turns out to be a key factor behind the USD/JPY pair's bullish move.
In fact, the BoJ remains committed to continuing with its monetary easing and so far, has shown no inclination to hike interest rates from ultra-low levels. Furthermore, the Japanese central bank announced emergency bond-buying worth $667 million to keep the yields on the Japanese Government Bonds below 0.25%.
In contrast, the yield on the benchmark 10-year US Treasury note hits its highest level since the 2008 financial crisis amid expectations for a more aggressive policy tightening by the Fed. This results in the widening of the US-Japan rate differential, which, along with resurgent US dollar demand, boosts the USD/JPY pair.
Apart from this, Friday's strong rally could also be attributed to some technical buying following the overnight breakout through the 150.00 psychological mark. That said, reports that the Fed could debate on whether and how to signal plans to approve a smaller increase in December prompts some USD selling and caps the USD/JPY pair.
Moreover, extremely overstretched technical indicators on short-term charts warrant some caution and might hold back bullish traders from placing fresh bets. Nevertheless, the USD/JPY pair remains on track to register its 10th straight weekly advance as the focus now shifts to the BoJ monetary policy meeting on October 28.
Technical levels to watch
-
14:41
GBP/USD gearing towards a retest of last week’s low at 1.0925 – Scotiabank
GBP/USD has declined to weekly lows. In the view of economists, the pair is set to retest last week’s low at 1.0925.
Closing above 1.11 will be positive
“GBP/USD has been flirting with minor trend support (1.1260, now resistance) over the past couple of sessions and weakness below that trend now is yielding some significant declines in the short-term chart.”
“Holding above 1.11 on the close will be positive – but, after a couple of failures in the upper 1.14s, the main risk for the pound appears to a gearing towards a retest of last week’s low at 1.0925.”
-
14:24
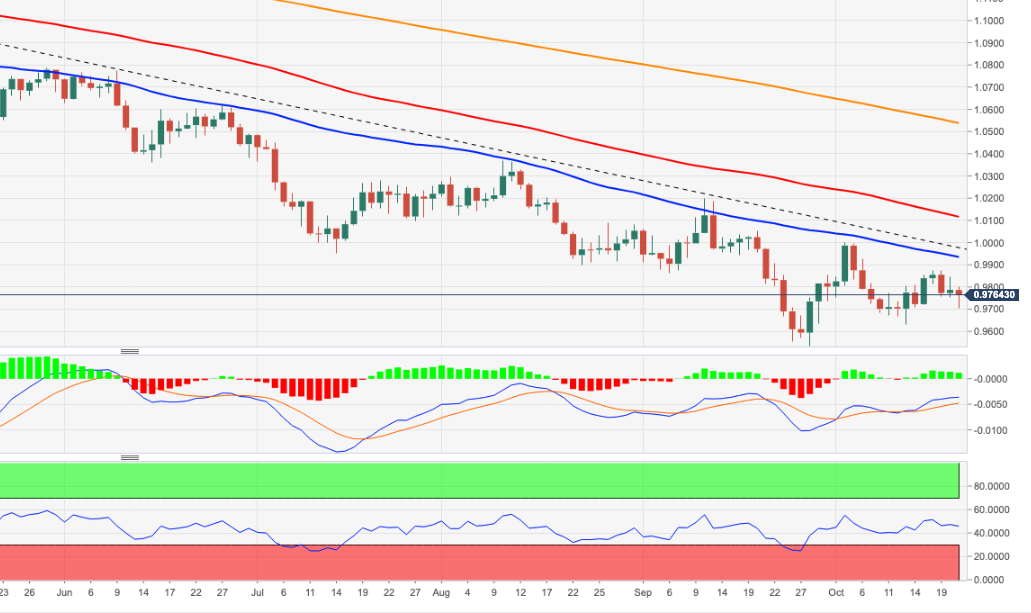
EUR/USD eyes next support at 0.9720 amid renewed weakness – Scotiabank
The euro cannot resist the dollar’s advance. Economists at Scotiabank highlight the key technical levels to watch.
Technical pattern of trade has been consistent in the past few months
“Since the middle of the year, EUR rebounds have been limited to the 40-Day Moving Average – or levels close to that – ahead of renewed weakness and new cycle lows. So far this week, that pattern is holding, with the EUR capped in the upper 0.98s (40-DMA at 0.9878 today) and turning soft subsequently. New cycle lows remain some way off, however (below 0.95).
“In the short-run, we see support at 0.9720 and 0.9675/80 below there.”
“Resistance intraday is 0.9800/10.”
-
14:17
EUR/USD Price Analysis: Another visit to the October low appears likely
- EUR/USD comes under pressure and puts 0.9700 to the test.
- Further south emerges the October low near 0.9630.
EUR/USD accelerates losses and flirts with the key 0.9700 neighbourhood at the end of the week.
In case losses accelerate and the pair breaches 0.9700, then the next significant support is expected to appear at the October low at 0.9631 (October 13). Once cleared, there are no contention levels of note until the 2022 low at 0.9535 (September 28).
In the longer run, the pair’s bearish view should remain unaltered while below the 200-day SMA at 1.0536.
EUR/USD daily chart
-
14:16
Fed to debate on whether and how to signal plans for a smaller increase in December - WSJ
Federal Reserve officials are barreling toward another interest-rate rise of 75 bps at their meeting in November and are likely to debate then whether and how to signal plans to approve a smaller increase in December, writes Nick Timiraos - chief economics correspondent at The Wall Street Journal.
Timiraos highlights a divide in the Fed, with few officials signalling greater unease with big rate rises to fight inflation. Some Policymakers also want to stop raising rates early next year to see how their moves this year are slowing the economy and to reduce the risk of causing an unnecessarily sharp slowdown.
The markets react positively to the article, which is evident from a goodish recovery in the equity markets, forcing the safe-haven US dollar to trim a part of its intraday gains.
-
13:41
GBP/USD dives to fresh weekly low, eyes 1.0500 amid broad-based USD strength
- A combination of factors prompts aggressive selling around GBP/USD on the last day of the week.
- The dismal UK macro data weigh on sterling and exert pressure amid resurgent USD demand.
- Aggressive Fed rate hike bets continue to push the US bond yields higher and underpin the buck.
- Diminishing odds for a full 100 bps BoE rate hike in November support prospects for further losses.
The GBP/USD pair continues losing ground through the early North American session and dives to a fresh weekly low, around the 1.1060-1.1065 region in the last hour.
The sentiment surrounding the British pound remains bearish amid growing worries about a deeper economic downturn and the cost-of-living crisis. The fears were further fueled by Friday’s disappointing release of the UK Retail Sales figures, which suggests that consumers are feeling the pinch of high inflation.
Apart from this, the relentless US dollar buying exerts additional downward pressure on the GBP/USD pair and contributes to the ongoing depreciating move. In fact, the USD Index, which measures the greenback's performance against a basket of currencies, rallies back closer to the monthly high and is supported by a combination of factors.
The continuous rise in the US Treasury bond yields, bolstered by hawkish Fed expectations, turns out to be a key factor pushing the greenback higher. The overnight hawkish remarks by Philadelphia Fed President Patrick Harker reaffirmed bets for another supersized rate hike in November. This, in turn, lifts the yield on the benchmark 10-year US government bond to its highest level since the 2008 financial crisis.
This, along with a weaker risk tone, underpins the safe-haven buck. This, in turn, suggests that the path of least resistance for the GBP/USD pair is to the downside amid diminishing odds for a full 100 bps rate increase by the Bank of England in November. Hence, a subsequent decline, back towards the 1.1000 psychological mark, remains a distinct possibility.
Technical levels to watch
-
13:41
USD Index Price Analysis: The dollar wants more and targets the 2022 high
- DXY resumes the upside and approaches the 114.00 zone.
- The 2022 high near 114.80 now emerges on the horizon.
DXY quickly leaves behind Thursday’s small drop and advances to the proximity of the 114.00 yardstick on Friday, or 3-week peaks.
If the index breaks below the 114.00 region, then it could dispute the YTD high at 114.78 (September 28) prior to the round level at 115.00.
The prospects for extra gains in the dollar should remain unchanged as long as the index trades above the 8-month support line near 108.20. The proximity of the 100-day SMA also reinforces this region.
In the longer run, DXY is expected to maintain its constructive stance while above the 200-day SMA at 103.70.
DXY daily chart
-
13:33
Canada: Retail Sales rose 0.7% in August vs. 0.4% expected
- Retail Sales in Canada rose more than expected in August.
- USD/CAD sticks to strong intraday gains after the release.
The data published by Statistics Canada revealed on Friday that Retail Sales grew by 0.7% on a monthly basis in August following June's sharp contraction of 2.2%. This reading came in better than consensus estimates pointing to a modest rise of 0.4%.
Additional details of the report showed that core sales, which exclude gasoline stations and motor vehicle and parts dealers, recorded a stronger-than-expected growth of 0.7% during the reported month.
Market reaction
The USD/CAD pair, meanwhile, moves little following the data and maintains its strong bid tone just below mid-1.3800s amid a strong pickup in the US dollar demand. Apart from this, softer crude oil prices undermine the commodity-linked loonie and support prospects for a further intraday appreciating move.
-
13:31
Canada New Housing Price Index (YoY): 6.3% (September) vs previous 6.9%
-
13:30
Canada Retail Sales (MoM) came in at 0.7%, above forecasts (0.2%) in August
-
13:30
Canada Retail Sales ex Autos (MoM) above forecasts (0.4%) in August: Actual (0.7%)
-
13:30
Canada New Housing Price Index (MoM) declined to -0.1% in September from previous 0.1%
-
13:19
Gold Price Forecast: No recovery potential for XAU/USD amid aggressive rate hikes – Commerzbank
Gold has dropped to $1,620. Growing rate hike expectations are set to continue weighing on the yellow metal, economists at Commerzbank report.
Gold demand is disappointing
“The ongoing outflows from the gold ETFs – September was already the fifth month in a row to register ETF outflows – point to weak investment demand.”
“No reversal of sentiment can be expected on the gold market for as long as there is no end in sight to the aggressive rate hikes.”
See – Gold Price Forecast: XAU/USD to remain under pressure as yields and dollar keep rallying – ANZ
-
12:31
India Bank Loan Growth climbed from previous 16.4% to 17.9% in October 7
-
12:29
USD/BRL: Break below 5.01 to open up further losses – SocGen
USD/BRL recently defended the bullish gap near 5.01 resulting in a steady bounce. Only a dip below here would risk a deeper pullback, economists at Société Générale report.
USD/BRL to target 5.51 if 5.42 gives way
“USD/BRL is evolving within two converging trend lines forming a symmetrical triangle. The pattern denotes a clear direction is lacking. This is also highlighted by crisscross moves around the 200-Day Moving Average.”
“If the pair breaks above the upper limit at 5.42, a move towards July high of 5.51 and the descending trend line drawn since 2020 at 5.62/5.66 is expected. This is an important resistance zone.”
“Only if the pair breaks below 5.01 would there be a risk of a deeper pullback.”
-
12:19
UK’s Wallace: I would lean towards Boris Johnson at the moment
When asked who he will back to be the new Prime Minister, the UK Defence Minister Ben Wallace said, “I would lean towards Boris Johnson at the moment.”
Additional quotes
I will not stand to be Prime Minister.
Keen to see what Sunak says on security and defence.
Conservative party needs to settle down and get on with delivering 2019 mandate.
Unity is important, will look at how candidates will bring party together.
Hope Jeremy hunt stays as finance minister.
Market reaction
Amidst the UK political turmoil and downbeat consumer spending data, GBP/USD is licking its wounds at around 1.1130, down 0.91% on the day.
-
12:18
GBP will likely continue to be under pressure in the time to come – Nordea
In the UK, rates have continued their fall on a policy U-turn. Still, economists at Nordea see more pain ahead for the British pound.
The policy U-turn will lessen the GBP blow, but it is not enough
“The proposal of the UK government – lower taxes and higher spending financed by more debt – broke havoc in the gilt markets while sending the pound in a free fall. Since then UK markets have stabilised. But it takes a long time to build up trust which can be easily lost in a moment.”
“Investors are unlikely to have strong renewed confidence in UK’s governance no matter who take over the helm – trust takes years to build, seconds to break and forever to repair.”
“The poor economic fundamentals in the UK, sky-high inflation, financial imbalances and pension funds under strain will continue to weigh upon the pound.”
-
12:02
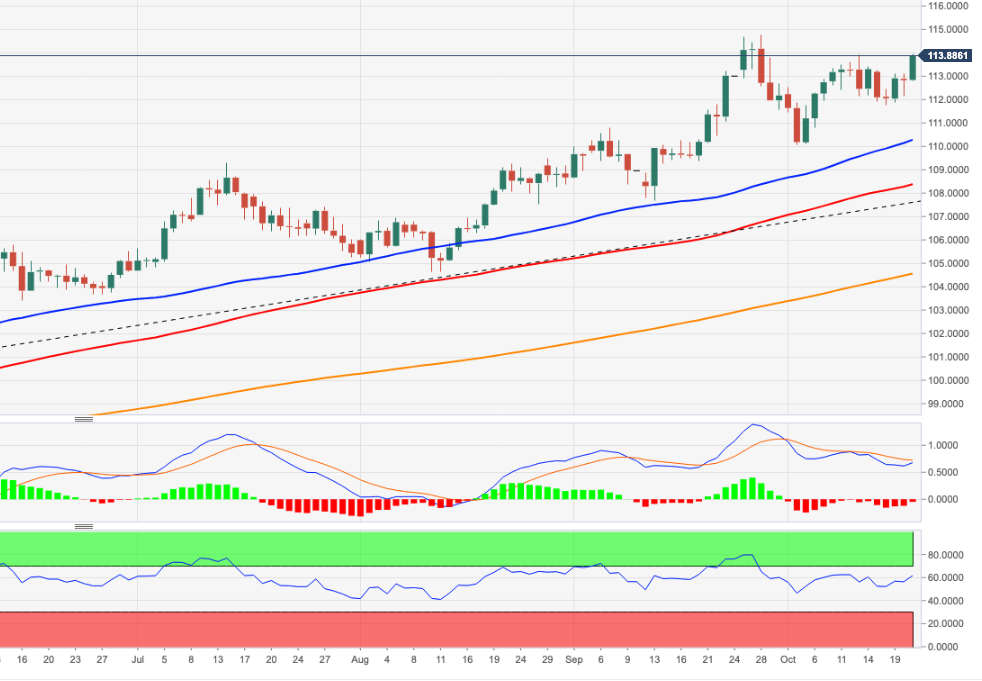
EUR/JPY Price Analysis: Room for extra upside near term
- EUR/JPY adds to Thursday’s gains and prints new highs.
- Further upside could target the 149.80 region in the short term.
EUR/JPY extends the optimism seen in the second half of the week and advances to new cycle highs around 147.60 on Friday.
Considering the current price action in the cross, the door still looks open to extra upside. That said, the immediate target now emerges at the December 2014 high at 149.78 (December 8).
In the short term the upside momentum is expected to persist while above the October lows near 141.00.
In the longer run, while above the key 200-day SMA at 136.85, the constructive outlook for the cross should remain unchanged.
EUR/JPY daily chart
-
12:00
Mexico Retail Sales (MoM) below forecasts (0.3%) in August: Actual (-0.4%)
-
12:00
Mexico Retail Sales (YoY) came in at 4.7% below forecasts (6.1%) in August
-
12:00
UK PM Truss Spokesman: Working in preparation for a medium-term fiscal plan on October 31
UK PM Liz Truss's spokesman said in a statement on Friday, “we are working in preparation for a medium-term fiscal plan on October 31.”
He added that “the new PM will decide whether it will be delivered then.”
Market reaction
GBP/USD found some support on the above headlines, as it moved away from weekly lows at 1.1100, currently trading at 1.1130, still down 0.91% so far.
-
11:57
EUR/USD set to bottom at 0.93 during Q1 2023 – Nordea
The stage is set for continued dollar strength. In the view of economists at Nordea, EUR/USD will continue lower and bottom at 0.93 around the start of 2023.
USD will continue to do well in the months to come due
“We have long been in the USD strengthening camp and see no reason to change our view yet. We believe the USD will continue to do well in the months to come due to the hawkish Fed conducting the fastest rate hikes in decades, a resilient US economy, and USD’s safe haven in these troubling times. This will bring EUR/USD to 0.93 during Q1.”
“Our take is that the current dollar strength will not stop until the Fed accomplishes bringing inflation down so it can relax its aggressive policy tightening or we see a clear improvement in the global growth outlook.”
-
11:52
USD/CAD sticks to gains near multi-day top, above 1.3800 ahead of Canadian Retail Sales
- A combination of supporting factors pushes USD/CAD to a multi-day high on Friday.
- Softer oil prices weigh on the loonie and offer support amid resurgent USD demand.
- Investors now look to Canadian Retail Sales data for short-term trading opportunities.
The USD/CAD pair builds on the overnight late rebound from the 1.3650 area, or a two-week low and gains strong follow-through traction on Friday. The intraday buying remains unabated through the first half of the European session and lifts spot prices to a four-day peak, around the 1.3830 region.
A fresh leg down in crude oil prices undermines the commodity-linked loonie and turns out to be a key factor acting as a tailwind for the USD/CAD pair. In fact, the black liquid remains well within the striking distance of the weekly low amid concerns that a deeper global economic downturn will hurt fuel demand.
Apart from this, a goodish pickup in the US dollar demand provides an additional lift to the USD/CAD pair and supports prospects for additional gains. The overnight hawkish remarks by Philadelphia Fed President Patrick Harker bets for another supersized rate hike in November and lifts the USD to over a one-week high.
Harker warned that the US central bank is actively trying to slow the economy to combat inflation and added fuel to the recent rally in the US Treasury bond yields. In fact, the yield on the benchmark 10-year US government bond rallies to its highest level since 2008, which, in turn, is seen lending support to the buck.
Investors also seem worried that rapidly rising borrowing costs will eventually trigger a recession in the world’s largest economy. Adding to this, the protracted Russia-Ukraine war and China's strict zero-COVID policy take a toll on the global risk sentiment and further benefits the greenback's relative safe-haven status.
There isn't any major market-moving macro data due for release from the US, leaving the greenback at the mercy of the US bond yields and the broader risk sentiment. The Canadian economic docket features monthly Retail Sales figures. This, along with oil price dynamics, should provide some impetus to the USD/CAD pair.
Technical levels to watch
-
11:36
Gold Price Forecast: XAU/USD eyes $1,615 and $1,607 amid a down week – Confluence Detector
- Gold price is on track for the second straight weekly loss amid surging Treasury yields.
- The US dollar jumps back into the game on risk-aversion and aggressive Fed rate hike bets.
- XAU/USD’s path of least resistance remains to the downside, with eyes on $1,607.
Gold price is testing bullish commitments near 2022 lows on its way to the $1,600 threshold heading into a new week. The Fed entered the blackout period ahead of its November 2 rate hike decision. Therefore, the recent speeches from Fed policymakers and a surprise drop in the US Jobless Claims data had a significant impact on the aggressive Fed rate hike expectations. The US Treasury yields shot through the roof, thereafter, driving the dollar northward alongside, throwing the metal under the bus. The parabolic rise in the USD/JPY pair on policy divergence is also benefiting dollar bulls. The bullion is headed for the second consecutive weekly decline, as higher borrowing costs continue denting the yieldless metal. All eyes now turn towards a fresh batch of top-tier US economic data due for release in the week ahead.
Also read: Gold Price Forecast: XAU/USD eyes a sustained break below $1,615 as yields keep rallying
Gold Price: Key levels to watch
The Technical Confluence Detector shows that the gold price is likely to find footing below the previous day’s low of $1,623, despite the renewed uptick.
The pivot point one-day S1 at $1,618 could come to the rescue of buyers before they look to attack the previous month’s low of $1,615.
A sustained break below the latter will open up downside towards the critical cap at the pivot point one-month S1 at $1,607. Ahead of that, the pivot point one-day S2 at $1,609 could offer temporary support.
Alternatively, gold price needs to find acceptance above the confluence of the Fibonacci 23.6% one-day and SMA5 four-hour at $1,628 on its recovery. The next powerful barrier is seen at the Fibonacci 38.2% one-day at $1,632.
Further up, the Fibonacci 61.8% one-day at $1,637 would be a tough nut to crack for XAU buyers.
Here is how it looks on the tool
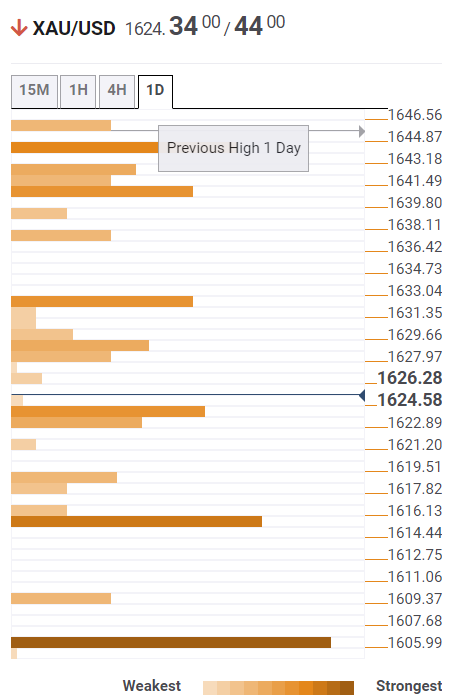
About Technical Confluences Detector
The TCD (Technical Confluences Detector) is a tool to locate and point out those price levels where there is a congestion of indicators, moving averages, Fibonacci levels, Pivot Points, etc. If you are a short-term trader, you will find entry points for counter-trend strategies and hunt a few points at a time. If you are a medium-to-long-term trader, this tool will allow you to know in advance the price levels where a medium-to-long-term trend may stop and rest, where to unwind positions, or where to increase your position size.
-
11:27
GBP/USD: Levels well below 1.1000 are achievable – MUFG
Sterling’s rally yesterday has fully reversed as investors conclude the resignation of Liz Truss as Prime Minister does not necessarily mean political uncertainty will be removed. Economists at MUFG believe that GBP/USD could return to sub-1.10 levels.
Potential for GBP underperformance also versus EUR
“The pound remains vulnerable to the downside and we still see levels well below 1.1000 as achievable. The conviction of the view comes more from the US dollar side but we also see potential for GBP underperformance versus EUR.”
“The political mess in the UK is unlikely to go away. If the right of the party (the Johnson/Truss/hard Brexit supporting faction) loses power the divisions will remain and getting tax rises/spending cuts through parliament could remain a challenge.”
-
11:07
AUD/USD flirts with daily low amid stronger USD, seems vulnerable near mid-0.6200s
- AUD/USD meets with a fresh supply on Friday amid a goodish pickup in the USD demand.
- Aggressive Fed rate hike bets and the continuous rise in the US bond yields boost the buck.
- Recession fears and a softer risk tone further drive flows away from the risk-sensitive aussie.
The AUD/USD pair comes under some selling pressure on Friday and retreats further from a nearly two-week high, around the 0.6355 region touched the previous day. The pair maintains its offered tone through the first half of the European session and is currently flirting with the daily low, just below mid-0.6200s.
The US dollar regains positive traction and climbs to over a one-week high, which, in turn, is seen as a key factor exerting pressure on the AUD/USD pair. The overnight hawkish remarks by Philadelphia Fed President Patrick Harker reinforced expectations for another supersized rate hike in November. Harker warned that the US central bank is actively trying to slow the economy to combat inflation.
His comments added fuel to the recent rally in the US Treasury bond yields. In fact, the rate on the benchmark 10-year US government bond jumps to its highest level since the 2008 financial crisis, which continues to act as a tailwind for the greenback. Apart from this, a softer risk tone further benefits the safe-haven buck and contributes to driving flows away from the risk-sensitive aussie.
Apart from this, the Reserve Bank of Australia's (RBA) decision to slow the pace of policy tightening earlier this month suggests that the path of least resistance for the AUD/USD pair is to the downside. Hence, a subsequent slide back towards the 0.6200 mark, en route to the YTD low, around the 0.6170 area, remains a distinct possibility amid the absent market-moving US macro releases.
Technical levels to watch
-
10:58
USD Index eyes next resistance at 113.70 – OCBC
US Dollar Index (DXY) extends its gains further north of the 113.00 hurdle. Economists at OCBC Bank expect the index to remain on a solid foot.
Slight risk to the upside
“Mild bearish momentum on the daily chart shows tentative signs of fading while RSI is rising. Slight risk to the upside.”
“Resistance here at 113.70.”
“Support at 112.40 (50% fibo retracement of Sep high top Oct low, 21 Day Moving Average), 111.85 levels (38.2% fibo), 111.20 (23.6% fibo).”
See: USD Index to return to the late-September 114/115 highs over the coming weeks – ING
-
10:54
German parliament votes to approve €200 billion emergency rescue package
German Parliament, as reported by Reuters, prepares to vote for the approval of a €200 billion emergency rescue package to tackle the energy crisis.
Market reaction:
The news pushes 10-year German bund yield to its highest since 2011. The shared currency, meanwhile, continues to lose ground and slides below mid-0.9700s, back closer to the weekly low amid the emergence of fresh US dollar buying.
-
10:47
Indonesia: BI delivers another 50 bps rate hike – UOB
UOB Group’s Economist Enrico Tanuwidjaja reviews the latest interest rate decision by the Bank Indonesia (BI).
Key Takeaways
“Bank Indonesia (BI) delivered a back-to-back 50bps rate hike in Oct MPC meeting, in line with market expectation, to 4.75%.”
“BI said that the decision is a front-loaded, pre-emptive, and forward-looking step to anticipate and mitigate the risk of rising inflation and anchor inflation expectations to remain within the 2-4% range in 1H23.”
“Going forward, we revised and brought forward our BI rate forecast to 5.25% (previously 5.00%) by the end of 2022 and revised higher the terminal rate to 5.75% (before 5.50%) that is likely to occur in 1Q23. This will give a reasonably comfortable yet historically tighter spread of circa 100bps with the expected terminal rate of the Fed funds rate of 4.75% by 1Q23.”
-
10:44
New cyclical highs for US Treasury bond yields mean new highs for USD/JPY – MUFG
USD/JPY is nearing the 151 level. Economists at MUFG expect the pair to continue grinding higher.
A break of 150 remains orderly
“The lack of action by the MoF certainly will likely encourage a pick-up in yen selling over the coming weeks. The risk of action will persist of course but Japan’s efforts to highlight that no particular level is being protected means there is scope for this relatively orderly grind higher in USD/JPY to continue.”
“We can’t see intervention working until we at least get to the point when market participants can be confident of a shift from the Fed.”
“New cyclical highs for US Treasury bond yields mean new highs for USD/JPY.”
-
10:32
GBP/USD: Two-way trades in 1.1060-1.1360 range for now – OCBC
The GBP/USD pair drops to over a one-week low on Friday. In the near-term, two-way trade is likely, in the opinion of economists at OCBC Bank.
Two-way trades
“Bullish momentum on the daily chart shows tentative signs of waning while RSI fell. Risks are skewed to the downside.”
“Support at 1.1130 (21-Day Moving Average), 1.1060 levels. Resistance at 1.1360, 1.1420 (50 DMA).”
“We look for two-way trades in the 1.1060-1.1360 range for now.”
See: There are too many reasons pointing towards weaker sterling – Commerzbank
-
10:25
USD Index to return to the late-September 114/115 highs over the coming weeks – ING
Strong Treasury yields and rate increases expected by the Federal Reserve are set to underpin the US dollar. Economists at ING expect USD Index (DXY) to retest 114/115.
Strong dollar drivers intact
“Yesterday’s small correction in the dollar proved very short-lived. This is not surprising, as most drivers of dollar strength have indeed remained intact.”
“Markets have pushed their peak Fed rate expectations to the 5.0% mark, and UST 2-year yields are inching closer to 4.60%. This rate environment continues to shed doubts about the sustainability of any rally in equities, and chances that the dollar will receive more safe-haven flows are elevated.”
“For the moment, we see no reasons to change our call for a return of DXY to the late-September 114/115 highs over the coming weeks.”
-
10:20
USD/JPY surges to 151.00 neighbourhood, fresh 32-year top amid rising US bond yields
- USD/JPY continues scaling higher on Friday and rallies to its highest level since August 1990.
- The Fed-BoJ policy divergence continues to weigh on the JPY and offers support to the pair.
- The continuous rise in the US bond yields underpins the USD and provides an additional lift.
The USD/JPY pair is prolonging its well-established bullish trend and gaining strong follow-through traction on the last day of the week. The buying interest picks up pace during the mid-European session and lifts spot prices to the 151.00 neighbourhood, or a new 32-year peak.
The selling bias around the Japanese yen remains unabated amid a big divergence in the monetary policy stance adopted by the Bank of Japan and other major central banks. This helps offset threats of an intervention by the Japanese government and continues to push the USD/JPY pair higher.
The US dollar, on the other hand, climbs to a fresh weekly high and remains well supported by hawkish Fed expectations. In fact, Philadelphia Fed President Patrick Harker warned on Thursday that the US central bank is actively trying to slow the economy to combat stubbornly high inflation.
Meanwhile, firming expectations for a more aggressive policy tightening by the Fed pushes the yield on the benchmark 10-year US government bond to its highest levels since the 2008 financial crisis. This results in a further widening of the US-Japan rate differential and weighs on the JPY.
Apart from this, the latest leg of a sharp move-up witnessed over the past hour or so could further be attributed to some technical buying above the 150.50 area. It will now be interesting to see if the momentum marks a fresh breakout or turns out to be a stop-run amid extremely overbought conditions.
There isn't any major market-moving economic data due for release from the US on Friday. Hence, the US bond yields will continue to influence the USD price dynamics and provide some impetus to the USD/JPY pair. Nevertheless, spot prices remain on track to register gains for the tenth straight week.
Technical levels to watch
-
10:05
WTI: Buyers defend $83 amid mixed oil headlines and USD strength
Saudi Energy Minister Abdulaziz bin Salman Al Saud said on Friday that OPEC+ is doing the right job for a stable energy market.
Meanwhile, an Iranian official said urged the US to “lift sanctions on Iran, if you want to reduce the price of oil.”
He added that “you cannot solve the problem by threatening one country.”
Separately, industry players and a US official told Reuters that Russia could skirt the new G7 price cap on its oil exports, Moscow has access to enough tankers to ship most of its oil to make the price cap ineffective.
Market reaction
WTI is licking its wounds near $83.35, at the time of writing, having hit a daily low at $82.96 earlier on. The US oil suffers from broad risk aversion and notable US dollar demand, as Treasury yields keep their relentless rise intact. Mixed oil headlines fail to have any impact on the black gold so far this Friday.
-
09:58
There are too many reasons pointing towards weaker sterling – Commerzbank
It is unlikely that UK politicians are going to regain market confidence any time soon. Therefore, the British pound is set to remain under pressure, economists at Commerzbank report.
UK political developments to keep investors on tenterhooks
“All the issues like high inflation, the looming recession and the effects of Brexit, which were in place prior to the government crisis and constitute a considerable challenge for the politicians are likely to ensure that markets remain cautious.”
“Against the background of a struggling economy, the BoE is likely to fight high inflation levels comparatively cautiously so that monetary policy will continue to put pressure on sterling. The fact that the BoE has intervened on the markets with bond purchases, thus threatening its credibility, is not likely to be forgotten easily by the markets either.”
-
09:43
Gold Price Forecast: XAU/USD to remain under pressure as yields and dollar keep rallying – ANZ
Gold price trades close to three-week lows near $1,620. The hawkish tone of the central banks is set to continue pressuring the yellow metal, economists at ANZ Bank report.
US real yields and the US dollar on a strong footing
“Increased prospects of aggressive rate hikes are keeping Treasury yields and the US dollar on a strong footing, leaving more room for downside.”
“While recession fears grow due to rising rates and sticky inflation, we should see some haven flows but not enough to reverse the bearish trend anytime soon.”
“We expect gold to remain under pressure.”
-
09:40
EUR/USD treads water around 0.9770, dollar remains bid
- EUR/USD meets resistance in the 0.9800 region on Friday.
- The dollar advances markedly above the 113.00 mark tracked by the DXY.
- The EMU flash Consumer Confidence will be on tap later.
The single currency comes under pressure and drags EUR/USD to the 0.9760 region at the end of the week.
EUR/USD weaker on USD-buying, high yields
EUR/USD now seems to stabilize in the lower end of the recent range in the 0.9770/60 band against the backdrop of further buying interest surrounding the greenback. The move higher in the buck, in the meantime, appears propped up by the unabated climb in US yields.
In the same line, but in the German money market, the 10-year bund yields climb to the vicinity of the 2.50% region for the first time since July 2011.
In the domestic calendar, the advanced Consumer Confidence gauge tracked by the European Commission will be the sole release later in the evening. In the US calendar, NY Fed J.Williams is due to speak ahead of the publication of the Monthly Budget Statement.
What to look for around EUR
EUR/USD now seems to have embarked on some consolidation in the sub-0.9800 area amidst the persistent advance in the dollar.
In the meantime, price action around the European currency is expected to closely follow dollar dynamics, geopolitical concerns and the Fed-ECB divergence. Following latest results from key economic indicators, the latter is expected to extend further amidst the ongoing resilience of the US economy.
Furthermore, the increasing speculation of a potential recession in the region - which looks propped up by dwindling sentiment gauges as well as an incipient slowdown in some fundamentals – adds to the sour sentiment around the euro
Key events in the euro area this week: European Council Meeting, EMU Flash Consumer Confidence (Friday).
Eminent issues on the back boiler: Continuation of the ECB hiking cycle vs. increasing recession risks. Impact of the war in Ukraine and the persistent energy crunch on the region’s growth prospects and inflation outlook.
EUR/USD levels to watch
So far, the pair is retreating 0.05% at 0.9776 and the breakdown of 0.9631 (monthly low October 13) would target 0.9535 (2022 low September 28) en route to 0.9411 (weekly low June 17 2002). On the flip side, the next up barrier comes at 0.9875 (weekly high October 18) followed by 0.9999 (monthly high October 4) and finally 1.0050 (weekly high September 20).
-
09:38
Japan aims to get cabinet approval for stimulus spending plan on October 28 – Kyodo
Kyodo News Agency reports, citing sources, Japan aims to get cabinet approval for an economic stimulus package spending plan on October 28.
The Japanese government and ruling coalition are considering state outlays of more than JPY20 trillion to fund the economic stimulus package, Kyodo reported.
Market reaction
Amidst the latest Japanese fiscal headlines and renewed US dollar strength, USD/JPY is seeing a fresh leg towards 151.00, fresh 32-year highs. The pair was last seen trading at 150.85, adding 0.48% on the day.
-
09:33
Hong Kong SAR Consumer Price Index came in at 4.4%, above expectations (1.9%) in September
-
09:23
USD/CNH: A breakout of 7.3000 remains on the cards – UOB
Further upside could see USD/CNH challenging the 7.3000 region in the near term, comment Markets Strategist Quek Ser Leang and Economist Lee Sue Ann at UOB Group.
Key Quotes
24-hour view: “We did not expect the sharp pullback in USD to 7.2210 and the subsequent strong bounce from the low. While the rebound has not gained much momentum, the bias for today is on the upside. That said, a clear break of 7.2800 is unlikely (next resistance is at 7.3000). Support is at 7.2440, followed by 7.2240.”
Next 1-3 weeks: “We continue to hold the same view as yesterday (20 Oct, spot at 7.2650). As highlighted, the upside risk remains intact and there is a good chance for USD to break 7.3000. Only a break of 7.2150 (no change in ‘strong support’ level from yesterday) would indicate that the USD strength that started one week ago has ended.’
-
09:18
GBP/USD could return to 1.05 by year-end after failure at 1.15 – ING
GBP/USD is trading close to weekly lows below 1.1200. Economists at ING believe that the pair could be back at 1.05 by year-end.
EUR/GBP may struggle to break much lower than 0.8600
“Our view that: a) UK politicians will struggle to quickly reclaim all of the lost fiscal credibility and b) US real interest rates look set to push even higher this year meaning that GBP/USD will likely struggle to break above the 1.15 area over coming weeks.”
“Into year-end, we favour broader dollar strength as US real rates push to 2.00%, meaning that GBP/USD could be back at 1.05.”
“0.8600 may well prove the lower end of the EUR/GBP trading range over coming weeks and maybe months too any policy misstep could easily push the pair back to 0.90.”
-
09:16
USD Index regains the smile and the 113.00 barrier
- The index rose to 4-day highs near 113.15 on Friday.
- There is no respite for the rally in US yields across the curve.
- Fedspeak, Monthly Budget Statement next in the calendar.
The USD Index (DXY), which gauges the greenback vs. a basket of its main competitors, manages to regain upside traction and surpasses the 113.00 mark at the end of the week.
USD Index supported by yields
The index maintains the recovery from weekly lows near 111.80 (October 18) well in place and looks to extend the upside momentum further north of the 113.00 hurdle on Friday.
The bounce in the dollar comes in tandem with the continuation of the rally in US yields, which navigate in multi-year peaks across the curve and always underpinned by expectations of a tighter-for-longer stance from the Federal Reserve.
In the US docket, NY Fed J.Williams (permanent voter, centrist) will speak later in the NA session followed by the release of the Monthly Budget Statement.
What to look for around USD
The dollar probes once again the area above the 113.00 mark at the end of the week.
In the meantime, the firmer conviction of the Federal Reserve to keep hiking rates until inflation looks well under control regardless of a likely slowdown in the economic activity and some loss of momentum in the labour market continues to prop up the underlying positive tone in the index.
Looking at the more macro scenario, the greenback also appears bolstered by the Fed’s divergence vs. most of its G10 peers in combination with bouts of geopolitical effervescence and occasional re-emergence of risk aversion.
Key events in the US this week: Monthly Budget Statement (Friday).
Eminent issues on the back boiler: Hard/soft/softish? landing of the US economy. Prospects for further rate hikes by the Federal Reserve vs. speculation of a recession in the next months. Geopolitical effervescence vs. Russia and China. US-China persistent trade conflict.
USD Index relevant levels
Now, the index is gaining 0.18% at 113.05 and faces the next up barrier at 113.88 (monthly high October 13) followed by 114.76 (2022 high September 28) and then 115.32 (May 2002 high). On the other hand, the breakdown of 110.05 (weekly low October 4) would open the door to 109.35 (weekly low September 20) and finally 107.68 (monthly low September 13).
-
09:04
USD/JPY: Extra gains now look at 151.00 – UOB
Further upside momentum in USD/JPY could see 151.00 revisited in the next few weeks, note Markets Strategist Quek Ser Leang and Economist Lee Sue Ann at UOB Group.
Key Quotes
24-hour view: “Yesterday, we highlighted that ‘a break of 150.00 would not be surprising but USD is unlikely to be able to maintain a foothold above this level’. The anticipated USD strength was more resilient than expected as USD rose to 150.28 and closed at 150.14 (+0.17%). Further USD strength is not ruled out but overbought conditions suggest that a sustained rise above 150.60 is unlikely (next resistance is at 151.00). On the downside, a break of 149.70 (minor support is at 149.95) would indicate that the deeply overbought advance is ready to take a breather.”
Next 1-3 weeks: “We highlighted yesterday that ‘A break of 150.00 is likely to lead to further USD strength but it might take a while before the next resistance at 150.60 comes into view’. USD subsequently took out 150.00 and rose to a high of 150.28. We continue to expect USD strength, albeit at a slower pace and any gains could be relatively limited. The next resistance above 150.60 is at 151.00. Overall, only a breach of 149.00 (‘strong support’ level was at 148.50 yesterday) would indicate that the USD strength that started more than a week ago has run its course.”
-
09:01
Greece Current Account (YoY) fell from previous €1.104B to €0.449B in August
-
08:57
Brent Crude Oil: Retest of $103/05 is not ruled out – SocGen
Brent defended the lower limit of a multi-month descending channel at $83 resulting in an impressive rebound. Strategists at Société Générale believe that the black gold could challenge the important $103/05 resistance zone.
Recent pullback formed a higher trough as compared to $83.00
“Recent pullback has formed a higher trough as compared to $83.00. Daily MACD is above its trigger and is about to enter positive territory denoting regain of upside momentum.”
“Holding above $87.20, the 76.4% retracement of the bounce, Brent is likely to head higher towards $99 and perhaps even towards the descending trend line since March at $103/105. This could be an important resistance zone.”
-
08:44
FX option expiries for Oct 21 NY cut
FX option expiries for Oct 21 NY cut at 10:00 Eastern Time, via DTCC, can be found below.
- EUR/USD: EUR amounts
- 0.9600 2.2b
- 0.9700 1.8b
- 0.9725 1.2b
- 0.9745-50 1.1b
- 0.9775 514m
- 0.9800 1.3b
- 0.9840 1.7b
- 1.0000 485m
- GBP/USD: GBP amounts
- 1.1325 330m
- USD/JPY: USD amounts
- 147.00 490m
- 147.50 1b
- 150.50 630m
- AUD/USD: AUD amounts
- 0.6500 526m
- USD/CAD: USD amounts
- 1.3500 876m
- 1.3600 687m
- 1.3650 400m
- 1.3700 455m
- 1.3750 725m
- 1.3850 405m
- NZD/USD: NZD amounts
- 0.5600 439m
-
08:26
EUR/USD: 0.98 to continue working as an anchor – ING
EUR/USD is under pressure below 0.9800. It looks like this level is working as an anchor from the pair at the moment, in the view of economists at ING.
Still no benefits from falling gas prices
“Falling consumer confidence is hardly surprising, but the fact that the euro is drawing very little benefits from the recent drop in gas prices is likely a testament to how markets are clearly looking well beyond short-term dynamics and may actually be growing increasingly concerned about Europe’s energy supply for next year, not just this winter.”
“It looks like 0.9800 is working as an anchor from EUR/USD at the moment, and this could continue to be the case today unless we receive some truly exciting news from the ongoing EU summit, which has so far only displayed lingering divergence in EU members’ views on energy price caps.”
“We retain a bearish bias on EUR/USD and expect a drop below 0.9500 by year-end.”
-
08:11
Euro Stoxx 50 to extend its downtrend on a move below 3250 – SocGen
Euro Stoxx 50 recently formed a double bottom near 3250 resulting in a short-term bounce. Failure to hold 3250 would reinforce the downtrend, economists at Société Générale report.
Euro Stoxx 50 to see an extended bounce on a break past 3530
“If the index overcomes 3530, an extended bounce could materialize towards the target of the formation at 3700/3720 which is also the 200-Day Moving Average (DMA). This is an important resistance.”
“Failure to hold 3250 would mean persistence in the downtrend that started last year.”
-
08:01
Gold Price Forecast: XAU/USD renews monthly low near $1,620 as yields propel DXY
- Gold price prints second weekly loss as bears approach the lowest level in 2022.
- Market sentiment remains dicey but hawkish Fed bets, inflation woes propel yields to multi-year high.
- Risk-aversion could weigh on XAU/USD amid light calendar, Fedspeak eyed.
Gold price (XAU/USD) takes offers to renew intraday low near $1,620 amid the initial hour of Friday’s European session. In doing so, the bullion price remains inside a bearish chart formation while approaching the yearly low marked in September.
That said, the multi-year high Treasury yields appear to be the biggest challenge for the metal prices of late. It should be observed that the US 10-year Treasury bond yields refreshed a 14-year high of 4.27% before a few minutes while the two-year counterpart rose to the highest levels since 2007 around 4.64%. Both the key bond coupons are near 4.25% and 4.60% respectively by the press time.
The jump in the latest hawkish Fed bets, comments suggesting further rate hikes from the US Federal Reserve (Fed) officials and mostly upbeat US data seemed to have underpinned the bond rout of late. Also weighing on the market sentiment, and weighing on the XAU/USD prices, is the political crisis in Britain, fresh covid woes from China and the Russia-Ukraine tussles.
Given the firmer yields, the US Dollar Index (DXY) pares the first weekly loss in three around 113.15 by the pres time while the stock futures and equities in the Asia-Pacific, as well as in Europe, print mild losses.
Moving on, the last dose of the Fed speakers’ comments before the blackout period preceding November’s Federal Open Market Committee (FOMC) meeting appears crucial for the metal traders to watch for fresh impulse while keeping the bearish bias intact.
Technical analysis
Gold price remains inside a short-term bearish channel while extending late Thursday’s pullback from the 100-HMA, around $1,643 by the press time. Bearish MACD signals add strength to the downside bias.
The metal’s further weakness, however, appears to have a bumpy road as the lower line of the stated channel joins the yearly bottom, as well as the nearly oversold RSI, to challenge the bears.
That said, the $1,600 threshold adds to the downside filters past the $1,615 immediate support convergence.
On the flip side, 100-HMA guards the short-term XAU/USD upside near $1,643 before challenging the bearish channel by poking the pattern’s resistance line near $1,645.
Even if the quote rises past $1,645, the bullion buyers remain off the table unless the quote renews the monthly top, around $1,730.
Gold: Hourly chart
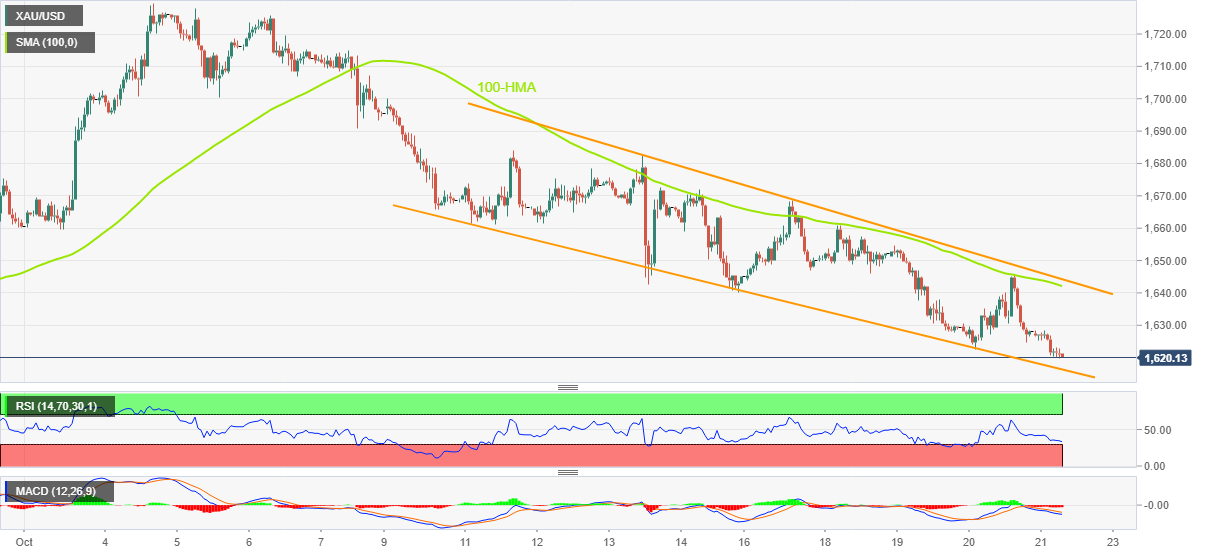
Trend: Limited downside expected
-
08:01
Turkey Consumer Confidence: 76.2 (October) vs 72.4
-
08:00
GBP to remain stable until the new Prime Minister is announced – ANZ
UK financial markets have responded well to the resignation of Liz Truss as Prime Minister. Economists at ANZ Bank expect the pound to remain stable until the announcement of the new PM.
All eyes on Bank of England
“We expect the GBP to remain stable until the new Prime Minister is announced, after which the focus will be on the fiscal statement on 31 October, and the Bank of England meeting on 3 November.”
“Up to three candidates can be nominated in the party’s leadership race, with only two going to membership. It is likely that the new leader will be announced by the end of next week. However, if only one candidate is nominated, that may result in an earlier announcement.”
“The BoE next meets on 3 November. After underwhelming the markets in previous months, we expect the BoE will have to raise rates by a minimum of 75 bps and possibly 100 bps. We think a 75 bps rise will also be warranted in December. Failure to deliver a comprehensive and credible rate rise supported by appropriate hawkish forward guidance could see GBP come under renewed selling pressure.”
-
07:56
UK’s Hunt: We will put public finances on sustainable path
British finance minister Jeremy Hunt reiterated on Friday, “we will put public finances on a sustainable path as we grow the economy.”
Additional quotes
"Strong public finances are the foundation of a strong economy. To stabilize markets.”
“We will do whatever is necessary to get drive down debt in the medium term and to ensure that taxpayers’ money is well spent."
Market reaction
The pound finds little respite from Hunt’s comments, as GBP/USD drops 0.38% on the day at 1.1188, as of writing.
-
07:53
BOJ’s Kuroda: Must watch FX impact on economy
Bank of Japan (BOJ) Governor Haruhiko Kuroda said on Friday, they “must closely watch the impact of FX market moves on Japan's economy and prices.”
Additional quotes
Japan's economy is looking better than during pandemic, private consumption is also on the rise.
Will continue current monetary policy to achieve BOJ target stably.
Seeing economic risks from ukraine crisis and pandemic, still need to be cautious of these risks.
Market reaction
USD/JPY was last seen trading at 150.41, adding 0.18% on the day.
-
07:48
Natural Gas Futures: Door open to further downtrend
Open interest in natural gas futures markets rose for the second straight session on Thursday, this time by nearly 2K contracts according to preliminary readings from CME Group. Volume, on the flip side, remained choppy and dropped by around 3.3K contracts.
Natural Gas now targets the March low near $4.30
The downtrend in prices of the natural gas appears unabated. Indeed, Thursday’s daily decline was on the back of rising open interest, which is supportive of further retracements in the very near term and with the next target of note at the March low at $4.34 per MMBtu (March 1).
-
07:44
USD/JPY: Nobody knows if the BoJ intervened at 150 – Commerzbank
The Japanese yen weakened through 150 per US dollar for the first time since 1990 yesterday. Did the Bank of Japan (BoJ) intervene? In truth, nobody knows, economists at Commerzbank report.
Hidden interventions cannot be systematically successful
“Did the BoJ intervene at 150 or not? One of my colleagues is convinced that it did, I am convinced that it didn’t. But in truth nobody knows. Neither the BoJ nor the MOF have commented. And everyone seems to interpret price developments differently.”
“USD/JPY rose above the 150 level in the course of yesterday evening and is currently holding above this level. This provides an argument that the BoJ has not intervened. However, this cannot be ruled out completely, because the BoJ may be pursuing a ‘leaning against the wind’ strategy. It may have intervened, but still allowed this mark to be broken. If the BoJ intervened on the market then it was only secretly and timidly.”
“If the FX market really has been dis-regulated to such an extent that ‘proper’ interventions do not work any longer then it is no longer possible to control exchange rates. I cannot imagine that hidden interventions can be systematically successful.”
-
07:42
AUD/USD: Further side-lined trading in the pipeline – UOB
In the opinion of Markets Strategist Quek Ser Leang and Economist Lee Sue Ann at UOB Group, AUD/USD faces extra range bound in the near term, likely between 0.6190 and 0.6390.
Key Quotes
24-hour view: “We highlighted yesterday that AUD ‘could edge lower but is not expected to challenge the major support at 0.6190’. We added, ‘There is another support at 0.6230’. We were not expecting such erratic price movements as AUD dropped to 0.6229, surged to 0.6357, and then fell back to close at 0.6283 (+0.20%). The volatile movement has resulted in a mixed outlook and AUD could continue to trade in a choppy manner, with the expected range being between 0.6230 and 0.6330.”
Next 1-3 weeks: “Our latest narrative from Tuesday (18 Oct, spot at 0.6295) still stands. As highlighted, AUD is likely to consolidate and trade between 0.6190 and 0.6390 for the time being.”
-
07:36
Crude Oil Futures: Scope for a deeper decline
Considering advanced prints from CME Group for crude oil futures markets, open interest increased by around 3.2K contracts on Thursday, reversing at the same time a multi-session downtrend. By contrast, volume dropped by around 141.7K contracts after two consecutive daily gains.
WTI: Next on the downside comes $80.00
Prices of the barrel of WTI charted an inconclusive session on Thursday amidst increasing open interest. Against that, extra downside now appears on the cards and could motivate the commodity to challenge the key support at the $80.00 mark.
-
07:36
PBoC unlikely to cut its policy rates any time soon – Commerzbank
USD/CNY rose to 7.2145 yesterday from 7.1160 at the end of September. Economists at Commerzbank do not expect the People’s Bank of China (PBoC) to cut its policy rates amid the current yen weakness.
Currency pressure keeps interest rates in check
“We think the PBoC may still guide banks to lower their loan prime rate (LPR) in the coming months. In particular, further cuts in the 5-year rate will effectively reduce mortgage rates as a mean to support the battered housing market.”
“However, we continue to think that the central bank will unlikely cut its policy rates any time soon, particularly the medium-term lending facility (MLF) rate. This is because it will further widen the US-China yield spread and add further pressure on the CNY.”
See: Chinese yuan to suffer further sustained weakness – Credit Suisse
-
07:35
Forex Today: Dollar rises with Treasury yields amid a dour mood
Here is what you need to know on Friday, October 21:
The market mood remains somber on the final trading day of the week, keeping the buoyant tone intact around the US dollar across the board. Asian markets track the overnight weakness in Wall Street stocks. The S&P 500 futures drop nearly 0.40%, as investors stay cautious amid surging US Treasury yields and looming recession fears. An unexpected drop in the US weekly Jobless Claims data and hawkish Fed commentary reinforced expectations that the central bank will be aggressive in hiking interest rates, which negated the impact of strong corporate earnings.
Federal Reserve Governor Lisa Cook said that ongoing rate increases will be required, as “inflation is too high, it must come down and we will keep at it until the job is done.” Philadelphia Fed President Patrick Harker said that they are not done with raising its short-term interest rate target amid very high levels of inflation, adding that “the interest rate will be above 4% by the end of 2022.”
The UK political developments also keep investors on tenterhooks. UK PM Liz Truss resigned as leader of the governing Conservative Party and said a new party leader and Prime Minister would be selected next week. So far, no MPs have publicly confirmed they are running, but names including former chancellor Rishi Sunak and the leader of the House of Commons, Penny Mordaunt, have been touted. Nominations will close at 2 pm on Monday and candidates are expected to have the backing of at least 100 MPs to run.
Amidst UK political chaos, disappointing Retail Sales data and rising US yields, GBP/USD is trading close to weekly lows below 1.1200 in early European hours. The benchmark 10-year US rates has surpassed the 4.25% level for the first time since 2008, helping dollar bulls regain upside traction. In light of this, USD/JPY is refreshing 32-year highs near 150.50, warranting caution for a likely Japanese intervention, as jawboning by the authorities continues. The BOJ once again conducted a bond-buying operation this Friday to defend its yield curve target (YCC).
EUR/USD is under pressure below 0.9800, largely in its familiar range so far this week. The upside attempts appear limited by the dollar and yields strength. Germany’s Bundesbank monthly report could offer some trading incentives, in an otherwise data-light docket on both sides of the Atlantic.
Meanwhile, the commodity currencies incurred sizeable losses amid firmer yields and a risk-averse market environment. AUD/USD is losing 0.27% on the day to challenge 0.6250 while NZD/USD is down 0.50% to mid-0.5600s. USD/CAD is advancing to near 1.3800, as WTI drops towards the $84 mark amid broad US dollar strength.
Gold remains on track to test the 2022 low at $1,615, as sellers retain control for the third day in a row.
Bitcoin price is threatening the $19,000 threshold after Thursday’s tepid recovery while Ethereum maintains its range play below $1,300.
-
07:24
EUR/HUF: Forint strength unlikely to last – Commerzbank
The Hungarian forint reached record lows on 13 October. The HUF has since rebounded c.5%, though it remains down 22% year-to-date. Economists at Commerzbank remain sceptical about the HUF strength.
EUR/HUF levels seem to suggest that the MNB’s strategy was working
“We remain sceptical as far as the strength of the forint is concerned and see it more as a reflection of improved market sentiment. The central bank (MNB) has committed to a mixture of different tools, above all aimed at financial stability and the support of the currency, which in the end make monetary policy measures less transparent. They are less suited for the fight against inflation.”
“It might be dangerous for the MNB to hope that inflation rates might ease soon, thus reducing the pressure to take action regarding the key rate (and thus the downside pressure on the forint).”
“For the time being, EUR/HUF levels seem to suggest that the MNB’s strategy was working. It remains to be seen how long the market will swallow that. The first test will be the key rate decision on Tuesday, and more importantly the publication of the October inflation data in early November.”
-
07:23
BOJ Semi-Annual Financial Report: The creditworthiness of highly leveraged firms could deteriorate
“With overseas interest rates rising quickly, there is a risk the creditworthiness of highly leveraged firms could deteriorate,” states the Bank of Japan (BOJ) in its semi-annual financial report published early Friday.
Key quotes
Japan's financial system remains stable as a whole.
Japan's financial institutions hold sufficient capital, liquidity buffers.
There is a chance Japan's financial system may come under prolonged stress such as from continued rate hikes by overseas central banks, fears of global growth slowdown.
Don't see big financial imbalances in Japan financial system now.
Foreign loan portfolios have a somewhat high percentage of highly leveraged firms, which are likely to be sensitive to interest rate rises.
Financial institutions' valuation losses on securities have increased recently, such losses could increase further depending on future interest rate developments.
Results of macro stress test indicates Japanese financial institutions on the whole are resilient to stress events.
USD/JPY grinds higher
USD/JPY remains firmer around the 32-year high marked earlier in the day, around 150.40 by the press time.
Also read: USD/JPY teases Tokyo intervention near 32-year high above 150.00 despite strong Japan inflation, yields
-
07:23
GBP/USD still looks range bound near term – UOB
GBP/USD is expected to navigate the 1.1050-1.1370 range for the time being, suggest Markets Strategist Quek Ser Leang and Economist Lee Sue Ann at UOB Group.
Key Quotes
24-hour view: “We highlighted yesterday that ‘the oversold GBP weakness has room to dip below 1.1150 first before stabilization is likely’. However, GBP rebounded strongly from 1.1172 to 1.1338 before plummeting back down to end the day at 1.1239 (+0.14%). Despite the volatile price actions, the underlying tone appears to be soft and we see room for GBP to edge lower. However, a sustained decline below 1.1150 is unlikely (next support is at 1.1100). Resistance is at 1.1260, followed by 1.1310.”
Next 1-3 weeks: “Our update from yesterday (20 Oct, spot at 1.1220) still stands. As highlighted, GBP has moved into a consolidation phase and is likely to trade within a range of 1.1050/1.1370 for the time being.”
-
07:18
GBP/JPY slides to 168.00 neighbourhood on dismal UK Retail Sales, downside seems limited
- GBP/JPY edges lower on Friday, though the intraday downtick lacks bearish conviction.
- The recent UK political turmoil and dismal UK macro data continue to weigh on sterling.
- Rising bets for a full 100 bps BoE rate hike in November help limit any further downfall.
The GBP/JPY cross remains on the defensive through the early European session and refreshes daily low, around the 168.15-168.10 region in reaction to the dismal UK macro data.
In fact, the UK Office for National Statistics reported this Friday that Retail Sales declined by 1.4% in September, missing estimates pointing to a 0.5% fall. On an annualized basis, the UK Retail Sales plunged -6.9% during the reported month against the 5.0% slide expected. Moreover, the core Retail Sales tumbled 6.2% YoY in September versus -4.1% anticipated and -5.3% previous.
The data adds to concerns about the cost-of-living crisis in the United Kingdom amid growing worries about a deeper economic downturn. This comes on the back of the recent UK political turmoil, which undermines the British pound and exerts some downward pressure on the GBP/JPY cross. That said, bets for a full 100 bps rate hike by the Bank of England in November help limit the downside.
The Japanese yen, on the other hand, is prolonging its recent depreciating move amid a big divergence in the monetary policy stance adopted by the Bank of Japan and other major central banks. In fact, the BoJ, so far, has shown no inclination to hike interest rates and remains committed to continuing with its ultra-lose policy settings. This further seems to offer some support to the GBP/JPY cross.
It, however, remains to be seen if spot prices manage to regain any positive traction amid speculations that authorities might intervene again to stem any further weakness in the domestic currency. This, along with the cautious market mood, amid looming recession risks, could offer support to the safe-haven JPY and contribute to keeping a lid on any meaningful upside for the GBP/JPY cross.
Technical levels to watch
-
07:16
EUR/GBP Price Analysis: Downbeat UK Retails Sales opens doors for further upside
- EUR/GBP has advanced to 0.8740 amid downbeat UK Retail Sales data.
- A negative divergence formation has bolstered signs of a bullish reversal.
- The cross is overlapping with the 200-EMA at around 0.8715.
The EUR/GBP pair has picked significant bids and has accelerated to near 0.8740 as the UK Office for National Statistics has reported downbeat Retail Sales data. The annual Retail Sales have declined by 6.9%, against the expectations of a 5.0% decline and the prior release of -5.4%. While the monthly retail sales figure remained negative by 1.4% vs. the projections of a 0.5% decline.
Meanwhile, public Sector Net Borrowings have remained marginally lower at GBP 19.248B vs. the estimate of GBP 19.325B.
On an hourly scale, the asset has displayed a rebound after a bullish negative divergence formation. It is worth noting that the asset was continuously making lower lows while the momentum oscillator, Relative Strength Index (RSI) (14) made a higher low. This indicates a loss in the downside momentum. Also, the momentum oscillator has shifted into the 40.00-60.00 range.
The cross is overlapping with the 200-Exponential Moving Average (EMA) at around 0.8715, which signals a consolidation ahead.
Going forward, a break above the upward-sloping trendline from October 4 low at 0.8649 will drive the asset towards the round-level hurdle of 0.8900, followed by September 29 high at 0.8980.
On the contrary, a drop below Monday’s low at 0.8578 will drag the asset toward August 19 high at 0.8511. A slippage below the latter will expose the cross to August 19 low at 0.8449.
EUR/GBP hourly chart
-638019297337774391.png)
-
07:15
GBP/USD: A neutral stance is appropriate – TDS
Liz Truss resigned as UK prime minister after only 44 days in office. Economists at TD Securities view this as a reduction in the risk premium around GBP but prefer a neutral standing for now.
Truss stepping down helps to reduce the downside from a risk sentiment perspective
“UK PM Truss decided to resign. There will be a Conservative Leadership election next week, which is expected to come down to Rishi Sunak as the odds on favourite over Penny Mourdant. However, this is not a done deal.”
“The Fiscal Statement plans to go ahead on Oct 31, even with the lame duck government showing signs of the dysfunction of the Party and fear of testing market pressure once again.”
“A change in UK leadership is not a major surprise. At a minimum, it helps to reduce the downside risk around GBP.”
“We do not see a clear directional pull for GBP but provided that the fiscal statement later this month reinforces fiscal prudence, we expect broader market forces like data, Fed, BoE and the USD to be the dominant influencers to GBP's outlook.”
-
07:14
Gold Futures: Further decline still on the cards
CME Group’s flash data for gold futures markets noted traders added just 893 contracts to their open interest positions on Thursday, reaching the third consecutive daily build. Volume, instead, reversed two daily advances in a row and shrank by more than 16K contracts.
Gold keeps targeting $1,614
Thursday’s inconclusive price action in gold was amidst a small uptick in open interest, hinting at the likelihood that further losses could be in store in the very near term. That said, the next target of note for the precious metal remains at the 2022 low at $1,614 (September 28).
-
07:11
Gold Price Forecast: XAU/USD on track to test $1,600 as technical setup favors sellers
Gold price extends weakness. XAU/USD eyes a sustained break below $1,615 toward the $1,600 level, FXStreet’s Dhwani Mehta notes.
Sellers alive and kicking
“Bears now gather strength to take out the 2022 lows at $1,615, paving way for a test of the $1,600 round figure.”
“The 14-day Relative Strength Index (RSI) is pointing south towards the oversold territory while below the midline, suggesting that there is more room to the downside.”
“Bulls could attempt a dead cat bounce to the $1,630 level, above which a fresh upswing towards the $1,650 resistance cannot be ruled out. The mildly bearish 21-Daily Moving Average (DMA) at $1,663 will be next on buyers’ radars.”
-
07:11
GBP/USD slides below 1.1200 on downbeat UK Retail Sales, Fedspeak, British political turmoil in focus
- GBP/USD renews intraday low after softer-than-expected UK data.
- UK Retail Sales in September shrank 6.9% YoY, weaker than expected and prior.
- Multi-year high Treasury yields also exert downside pressure.
- Updates from UK’s leadership race, and final Fedspeak before the pre-FOMC blackout will be crucial.
GBP/USD extends early-day losses on the disappointing UK Retail Sales figures during Friday’s initial London trading. In doing so, the cable pair refreshes intraday low around 1.1180 while slipping beneath the key 1.1200 support.
That said, the UK’s Retail Sales dropped to -6.9% YoY versus -5.0% expected and -5.6% revised down prior. Further, the monthly prints also missed the mark with -1.4% data versus -0.5% expected and -1.7% previous readings.
Contrary to the disappointment from the crucial component of the British Gross Domestic Product (GDP), hopes that the UK’s next leader will be more sound and can carve out the nation from the brink of recession also seem to restrict the Cable pair’s immediate downside. Additionally, the multi-year high US Treasury yields weigh on the cable price amid political uncertainty, until the next leader is found, as well as the hawkish Fed bets.
Earlier in the day, the UK’s GfK Consumer Confidence improved to -47 in September versus the record low of -49 marked the previous month which was the lowest level on record.
That said, the US 10-year Treasury bond yields refreshed a 14-year high the previous day, around 4.22% by the press time. Also, the two-year US Treasury yields rose to the highest levels since 2007 before recently taking rounds to 4.62%. It’s worth noting that Wall Street closed in the red following an initially upbeat performance while the S&P 500 Futures extend the previous day’s losses with a 0.50% intraday downside at the latest.
It should be noted that the upbeat US data joined hawkish Fedspeak to propel the yields and exert downside pressure on the GBP/USD prices the previous day. Additionally, UK PM Lizz Truss’ resignation made her the shortest-serving national leader and pleased the pair sellers on Thursday.
Moving on, the bears will be focusing on developments surrounding how the UK policymakers will find and vote to choose the next national leader. Also important will be the last dose of the Fed speakers’ comments before the blackout period preceding November’s Federal Open Market Committee (FOMC) meeting.
Technical analysis
10-DMA joins a three-week-old ascending trend line to constitute 1.1200 as the key short-term key support, a break of which won’t hesitate to drag the quote towards the parity. Meanwhile, GBP/USD recovery remains elusive unless the quote stays below the five-week-old resistance line, near 1.1330 by the press time.
-
07:06
Chinese yuan to suffer further sustained weakness – Credit Suisse
The Chinese yuan has seen a significant deterioration since late April. Economists at Credit Suisse think the risk of a further sustained weakness in the CNY space is highly elevated.
CNY to see further sustained weakness
“With medium-term MACD staying outright positive and showing no signs of tiring, we look for a break above the high from September at 7.2502 to put USD/CNY into a fresh upside territory and expose the 61.8% retracement of the 2005/14 downtrend and the trendline from late 2016 at 7.4220/7.4540. Whilst we would stay wary of another pause here, a sustained break higher would be seen to clear way to the 78.6% retracement at 7.7978/7.8000, where would have greater confidence of a ceiling.”
“With weekly MACD continuing to rise, we think EUR/CNY looks set for a deeper recovery, with next significant resistance above 7.0977 seen at the high from May at 7.2525 and then eventually at the 38.2% retracement at 7.3316, which we think is likely to act as firm cap for any additional upside.”
-
07:03
UK Retail Sales decline 1.4% MoM in September vs. -0.5% expected
- The UK Retail Sales came in at -1.4% MoM in September, a big miss.
- Core Retail Sales for the UK fell by 1.5% MoM in September.
- The cable extends losses below 1.1200 on the downbeat UK data.
The UK retail sales arrived at -1.4% over the month in September vs. -0.5% expected and -1.7% previous. The core retail sales, stripping the auto motor fuel sales, dropped 1.5% MoM vs. -0.3% expected and -1.6% previous.
On an annualized basis, the UK retail sales plunged -6.9% in September versus -5.0% expected and -5.6% prior while the core retail sales tumbled 6.2% in the reported month versus -4.1% expectations and -5.3% previous.
Main points (via ONS)
Food store sales volumes fell by 1.8% in September 2022, which leaves them 3.2% below their pre-coronavirus levels in February 2020.
Non-store retailing (predominantly online retailers) sales volumes fell by 3.0% in September 2022; despite this fall, sales volumes were 18.0% above their February 2020 levels.
Non-food stores sales volumes fell by 0.6% in September 2022 and are 2.7% below February 2020 levels.
Automotive fuel sales volumes fell by 1.3% in September 2022; these were 10.2% below their February 2020 levels.
FX implications
GBP/USD is holding the lower ground on the disappointing UK Retail Sales data. The spot was last seen trading at 1.1185, down 0.41% on the day.
-
07:02
Sweden Unemployment Rate came in at 6.5%, above forecasts (6.3%) in September
-
07:02
United Kingdom Public Sector Net Borrowing below expectations (£19.325B) in September: Actual (£19.248B)
-
07:02
United Kingdom Retail Sales ex-Fuel (MoM) below forecasts (-0.3%) in September: Actual (-1.5%)
-
07:02
Denmark Consumer Confidence dipped from previous -32.1 to -37 in October
-
07:02
United Kingdom Retail Sales (MoM) below forecasts (-0.5%) in September: Actual (-1.4%)
-
07:01
United Kingdom Retail Sales (YoY) came in at -6.9%, below expectations (-5%) in September
-
07:01
United Kingdom Retail Sales ex-Fuel (YoY) registered at -6.2%, below expectations (-4.1%) in September
-
06:43
EUR/USD: No changes to the consolidative stance – UOB
Markets Strategist Quek Ser Leang and Economist Lee Sue Ann at UOB Group still see EUR/USD trading within the 0.9670-0.9860 range in the next few weeks.
Key Quotes
24-hour view: “Our expectation for ‘the rapid decline in EUR to extend’ was incorrect as it popped to a high of 0.9845 and dropped back quickly to close at 0.9783 (+0.12%). The current price movement is likely part of a broad consolidation range and we expect EUR to trade within a range of 0.9730/0.9830 for today.”
Next 1-3 weeks: “We continue to hold the same view as from yesterday (20 Oct, spot at 0.9760). As highlighted, EUR remains in a broad consolidation range and is likely to trade between 0.9670 and 0.9860 for the time being.”
-
06:38
USD/CNH advances towards 7.30 as the market mood sours, focus shifts to PMIs
- USD/CNH is eyeing a test of a weekly high at 7.2790 amid a vulnerable market mood.
- The DXY has refreshed the day’s high at 113.12 amid an improvement in safe-haven appeal.
- An unchanged PBOC’s monetary policy has kept yuan bulls on the tenterhooks.
The USD/CNH pair has shifted its business above the crucial hurdle of 7.2600 after a perpendicular rally from Thursday’s low of 7.2209. The asset is marching vigorously towards the weekly high of 7.2790 as the risk-off impulse has rebounded firmly after a minor optimism. A pullback move in S&P500 futures has terminated and the index futures have started their downside journey.
The US dollar index (DXY) has refreshed its day’s high at 113.12 as negative market sentiment has resulted in a flight of safety at the safe-haven counter for the market participants. Now, the DXY is aiming to test the weekly high at 113.21. Returns on US government bonds are buzzing in the global markets after overstepping figures recorded at the time of the sub-prime crisis. The 10-year US Treasury yields have printed a fresh 14-year high at 4.26%.
Meanwhile, investors are shifting their focus toward the S&P PMI data, which will release on Monday. Earlier, the Manufacturing PMI landed at 52.0 while the Services PMI was recorded at 49.3.
On the China front, an unchanged monetary policy by the People’s Bank of China (PBOC) has kept the Chinese yuan on the tenterhooks. The central bank maintained the status quo despite the headwinds of weaker economic prospects and sluggish price pressures. Also, the real estate demand is extremely vulnerable, which needed a booster dose.
Meanwhile, oil prices have turned sideways after a correction below $85.00 as soaring yields have bolstered signs of recession ahead. It is worth noting that China is a leading import of oil and subdued oil prices could retreat the major.
-
06:36
EUR/USD Price Analysis: 10/21-DMA challenge bears around mid-0.9700s
- EUR/USD sellers attack short-term key support but snaps two-week losing streak on weekly frame.
- Convergence of the short-term key moving averages tests bears amid steady RSI, bullish MACD signals.
- Six-week-old triangle restricts short-term moves despite fundamental bearishness.
EUR/USD holds lower ground near the intraday bottom of 0.9763 as it pares the first weekly gains in three heading into Friday’s European session.
In doing so, the major currency pair sellers poke a convergence of the 10-DMA and 21-DMA, surrounding 0.9760 by the press time.
It should, however, be noted that the bullish MACD signals and steady RSI (14) suggest further grinding toward the south, not an abrupt slump.
Hence, the latest downside may witness a bounce from the stated key DMA confluence before activating another round of bearish moves.
That said, a one-month-old horizontal support area near 0.9670 restricts short-term EUR/USD downside before directing the bears toward the yearly low of 0.9535.
On the contrary, recovery moves need to cross the descending trend line from September 12, around 0.9855 at the latest, to lure the EUR/USD buyers.
Following that, a run-up toward the monthly high near the parity level of 1.0000 can’t be ruled out.
However, any further upside past-1.0000 won’t hesitate to challenge the previous month’s top surrounding 1.0200.
EUR/USD: Daily chart
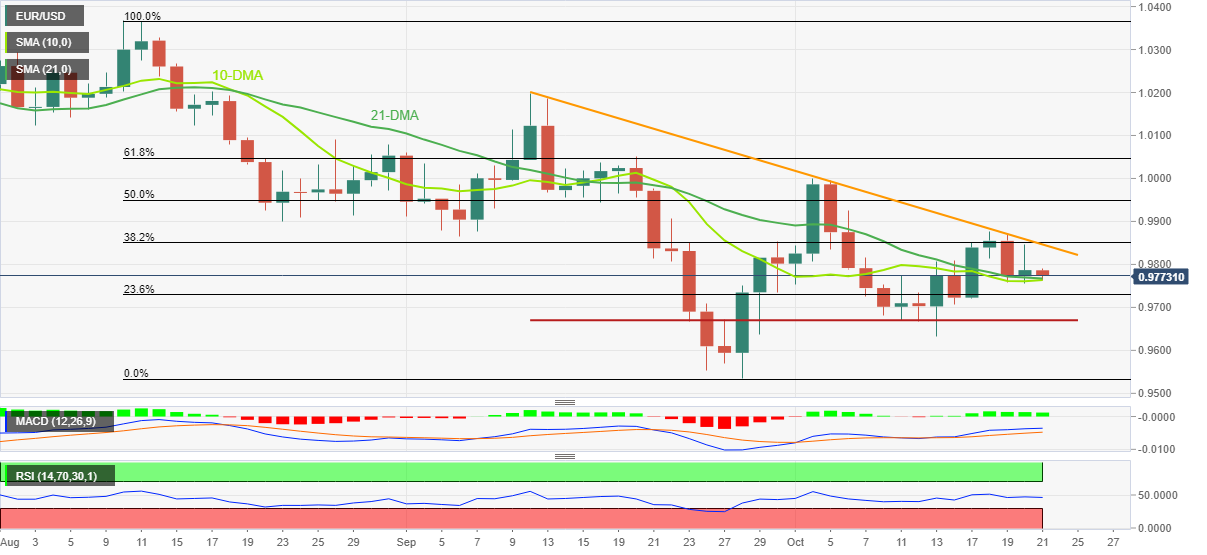
Trend: Limited downside expected
-
06:21
WTI Price Analysis: Flat-lines above 100-hour SMA, $84.00 holds the key for bulls
- WTI crude oil prices continue to find support ahead of the $84.00 mark, or the 23.6% Fibo. level.
- The lack of follow-through buying warrants some caution before positioning for meaningful gains.
- A sustained move beyond the $86.00 round figure is needed to negate any near-term bearish bias.
WTI crude oil prices reverse an Asian session dip to the $84.15 area, though the intraday uptick lacks bullish conviction. The black liquid is currently trading around the $84.74-$84.80 region, nearly unchanged for the day.
From a technical perspective, the overnight pullback from the weekly high showed some resilience below the 100-hour SMA and found some support near the $84.00 mark. The said handle coincides with the 50% Fibonacci retracement level of the recent fall from the monthly peak and should now act as a pivotal point.
A convincing break below will suggest that the corrective bounce witnessed over the past two trading sessions has run out of steam and will shift the bias back in favour of bearish traders. WTI crude oil prices might then accelerate the fall towards the $83.00 round figure en route to the $82.75-$82.70 support.
The next relevant support is pegged near the $82.00 mark, below which WTI crude oil prices could retest the weekly low, around the $81.25 region. Some follow-through selling would make the commodity vulnerable to extending its recent sharp downfall from the monthly peak touched at the beginning of the previous week.
On the flip side, any subsequent strength beyond the $85.00 mark is likely to confront resistance near the 38.2% Fibo. level, around the $85.55-$85.60 region. This is
followed by the $86.00 mark, or the 200-hour SMA, which if cleared should lift WTI crude oil prices towards the overnight swing high, near the $86.90 area.WTI 1-hour chart
-638019262808098262.png)
Key levels to watch
-
06:19
Asian Stock Market: China, Australia lead bears amid sluggish day, strong yields
- Asia-Pacific equity markets grind lower amid lack of major data.
- China’s lockdown in Xi’an, multi-year high Treasury yields keep bears hopeful.
- Indian shares buck the trend amid strong earnings report.
- Wall Street closed lower on firmer US data, hawkish Fedspeak.
Asian stock markets remain mostly lower as multi-year high Treasury bond yields join a lack of major data/events on Friday. Also negatively affecting the region’s equities are fears of higher inflation and central bank meddling to defend the respective currencies in Japan, China and India. Furthermore, fresh covid fears from China exert additional downside pressure on the market sentiment amid a sluggish session.
While portraying the mood, MSCI’s Index of Asia-Pacific shares outside Japan prints 0.50% intraday gains whereas Japan’s Nikkei 225 drops to the same tune as we write.
Elsewhere, India’s BSE Sensex adds 0.40% at the latest, following an upbeat start, amid firmer company earnings. “Indian shares opened higher on Friday, as strong earnings reports, including from Axis Bank, helped resist the weakness in global markets on fears of the impact of aggressive rate hikes from central banks on economic growth and corporate results,” stated Reuters.
On the other hand, Chinese stock remains pressured after witnessing a corrective bounce the previous day as policymakers announce fresh covid-led lockdowns in Xi’an. “China locked down parts of the central metropolis of Xi’an, confining some of the city’s 13 million people to their homes for at least a week, and other major hubs are rolling out virus restrictions in a reinforcement of the country’s commitment to covid zero,” per Bloomberg.
It should be noted that an eight-year high core Consumer Price Index (CPI) from Japan and looming fears of Tokyo’s meddling to defend the yen, as well as the same hopes from policymakers in China and India, keeps the risk appetite weak.
Australia’s ASX 200 drops nearly 0.80% intraday as traders await the annual budget and expect downbeat growth and firmer inflation ahead. On the same line, New Zealand’s (NZ) NZX 50 also holds lower ground even as NZ trade numbers printed upbeat figures for September.
On a broader front, the US 10-year Treasury bond yields refreshed a 14-year high the previous day, around 4.22% by the press time. Also, the two-year US Treasury yields rose to the highest levels since 2007 before recently taking rounds to 4.62%. It’s worth noting that Wall Street closed in the red following an initially upbeat performance while the S&P 500 Futures extend the previous day’s losses with 0.50% intraday downside at the latest.
Also read: S&P 500 Futures pare weekly gains as yields dribble around multi-year high
-
05:54
USD/JPY Price Analysis: BOJ’s intervention is key, else stability above 150.00 seems certain
- USD/JPY has continued its 12-day winning streak after surpassing 150.30.
- An ultra-loose monetary policy is responsible for the sheer destruction of the Japanese yen.
- The absence of divergence and momentum loss indicates that the upside is intact.
The USD/JPY pair continued its 12-day winning streak on Friday by overstepping Thursday’s high at 150.29. The asset is not reacting to any rebound in the risk-on impulse but is capitalizing negative market sentiment period effectively. Ultra-loose monetary policy is responsible for the sheer destruction of the Japanese yen.
The US dollar index (DXY) is gathering interest for stabilization above the critical hurdle of 113.00. While the returns on US government bonds are soaring like there is no tomorrow. The 10-year US Treasuring yields are continuously refreshing their 14-year highs. At the time of writing, 10-year yields stand at 4.26%.
Monthly chart
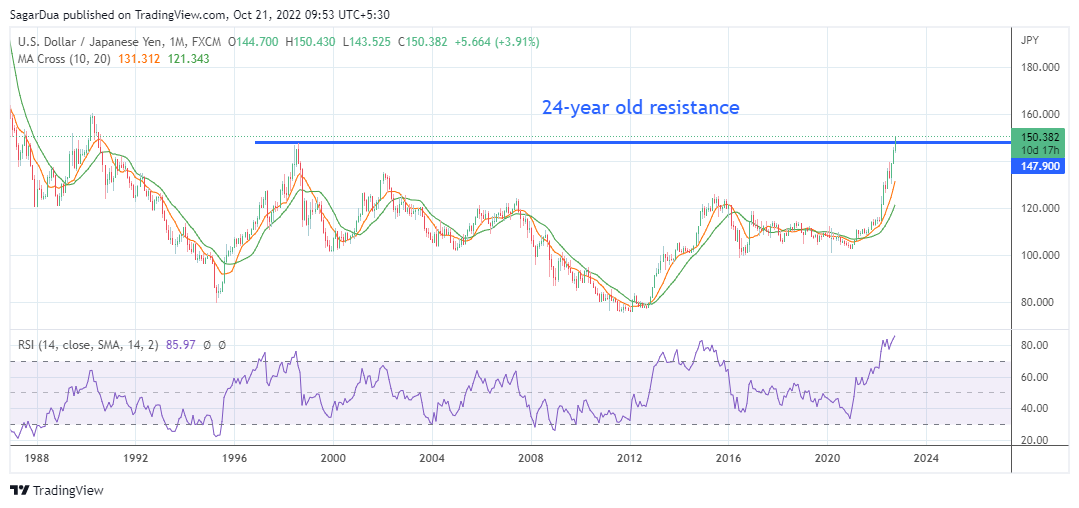
An upside break of the 24-year-old resistance at 147.67 has infused adrenaline rush into the greenback bulls. The 10-and 20-period Exponential Moving Averages (EMAs) at 131.31 and 121.34 respectively are advancing, which indicates more upside ahead.
The Relative Strength Index (RSI) (14) has printed a high near 86.00. There is no denying the fact that the momentum oscillator is showing overbought signals. However, the absence of divergence signals and momentum loss is not favoring any correction yet.
Daily chart
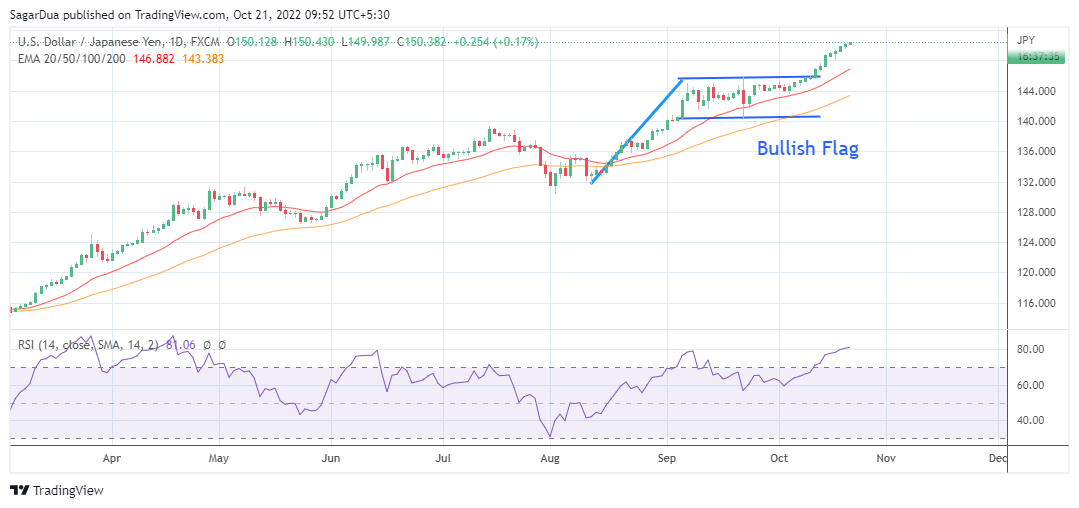
On a daily scale, the asset has delivered a perpendicular upside move after a breakout of the Bullish Flag. The chart pattern indicates an upside break of the mark-up inventory adjustment. Advancing 20-and 50-period EMAs at 146.68 and 143.38 respectively adds to the upside filters.
Also, the RSI (14) has crossed 80.00, showing no signs of divergence but an overbought situation cannot be ruled out.
A mild correction towards the psychological support of 150.00 will present a bargain buy for investors, which will drive the asset towards a fresh 32-year high at 150.43, followed by July 1990 high at 152.25.
On the flip side, the asset could trigger reversal if it drops below Monday’s low of 148.11, which will drag the asset towards the October 13 high at 147.67. A slippage below the latter will further drop the major to October 13 low at 146.42.
-
05:50
NZD/USD Price Analysis: Weekly support, 200-HMA challenge bears around 0.5650
- NZD/USD sellers attack short-term key support, extends the previous day’s pullback from weekly top.
- Eight-day-old rising wedge formation joins bearish MACD signal to keep bears hopeful.
- 200-HMA adds to the downside filters, bulls need validation from the monthly top.
NZD/USD appears all set to confirm a one-week-old bearish chart pattern called a rising wedge as sellers poke the support line around 0.5650 heading into Friday’s European session.
The kiwi pair refreshed the weekly top before reversing from 0.5743. Even so, the quote stays on the way to the biggest weekly gains since early August.
Not only the rising wedge but bearish MACD signals also keep the NZD/USD sellers hopeful of breaking the support near the mid-0.5600s. Even so, the 200-HMA level of 0.5631 acts as an extra filter towards the south before welcoming the bears.
Following that, the yearly low of 0.5511 marked in the last week could offer an intermediate halt during the theoretical target surrounding the 0.5400 mark.
Alternatively, recovery moves may initially aim for the 61.8% Fibonacci retracement of October 03-13 downside, near 0.5700, before approaching the stated wedge’s upper line, close to 0.5755 by the press time.
It should be noted that the NZD/USD pair’s run-up beyond 0.5755 needs validation from the monthly high of 0.5815 to convince the buyers.
NZD/USD: Hourly chart
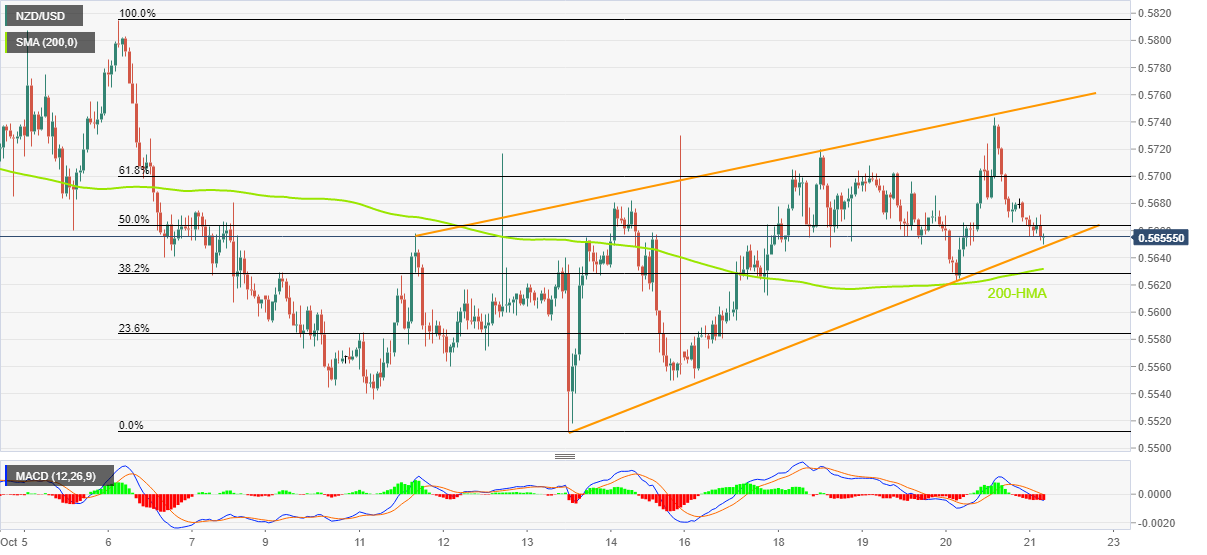
Trend: Further weakness expected
-
05:37
GBP/USD Price Analysis: Struggles near weekly low, seems vulnerable below 1.1200 mark
- GBP/USD meets with a fresh supply on Friday and is pressured by a modest USD strength.
- The overnight rejection near a two-month-old descending trendline favours bearish traders.
- Weakness below the weekly low is needed to support prospects for further near-term losses.
The GBP/USD pair edges lower during the Asian session on Friday and is currently trading around the 1.1200 mark, just a few pips above the weekly low touched the previous day.
The US dollar regains some positive traction amid the continuous rise in the US Treasury bond yields, bolstered by expectations that the Fed will continue to hike interest rates at a faster pace. Apart from this, a generally weaker risk tone offers additional support to the safe-haven buck, which, in turn, is seen exerting some pressure on the GBP/USD pair.
Spot prices did get a minor lift on Thursday after Liz Truss said that she will resign as the UK's Prime Minister. The momentum, however, faltered ahead of a downward sloping trend-line resistance extending from late August. The subsequent pullback favours bearish traders and supports prospects for a further near-term depreciating move for the GBP/USD pair.
That said, technical indicators on the daily chart are yet to confirm a bearish bias and warrant some caution. Hence, it will be prudent to wait for some follow-through selling below the overnight swing low, around the 1.1170 area, before positioning for any further depreciating move. The GBP/USD pair might then accelerate the fall towards testing the 1.1100 mark.
The downward trajectory could further get extended towards the next relevant support near the 1.1055-1.1050 support zone. The GBP/USD pair could eventually drop to the 1.1000 psychological mark, which if broken decisively will be seen as a fresh trigger for bearish traders.
On the flip side, the 1.1250-1.1260 region now seems to act as an immediate strong resistance, above which a bout of a short-covering should allow the GBP/USD pair to reclaim the 1.1300 mark. Any subsequent move up, however, might continue to confront stiff resistance near the aforementioned trend line, which is currently pegged near the 1.1350-1.1355 region.
A convincing breakthrough will negate any near-term negative bias and pave the way for additional gains. The momentum could then lift the GBP/USD pair towards the 1.1400 mark en route to the weekly high, around the 1.1440 region. The latter coincides with the 50-day SMA, which should act as a pivotal point and help determine the next leg of a directional move.
GBP/USD daily chart
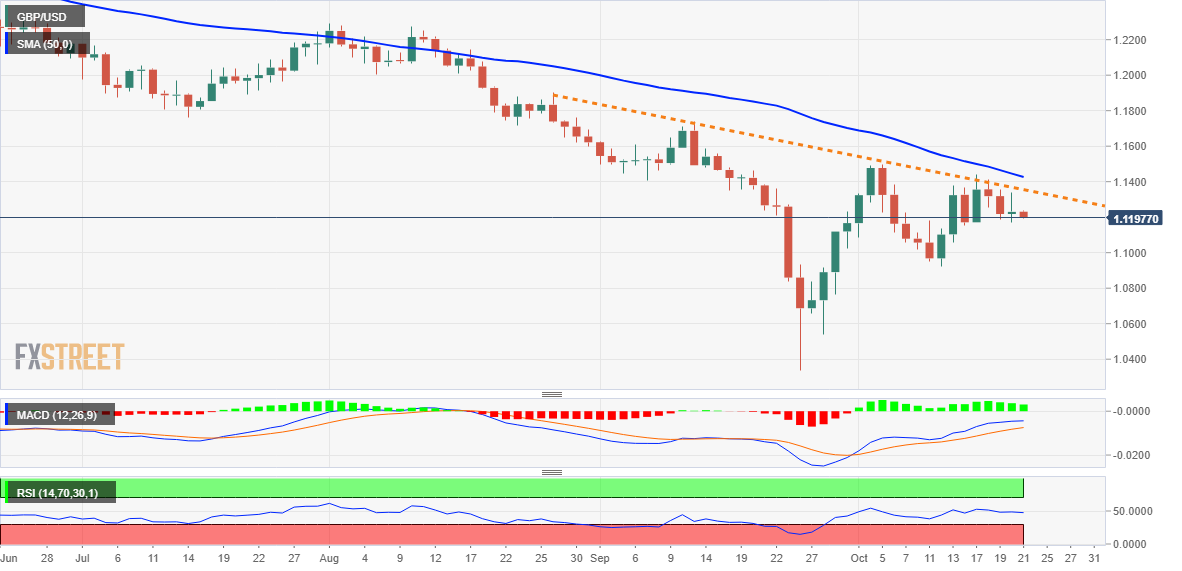
Key levels to watch
-
05:28
USD/CAD leans bullish towards 1.3800, ignores the most bearish options markets bias in four months
USD/CAD grinds higher around the intraday top near 1.3790 during early Friday morning in Europe. In doing so, the Loonie pair ignores the downbeat signals from the options market.
That said, One-month risk reversal (RR) on USD/CAD, a measure of the spread between call and put prices, drops for the third consecutive week per the data source Reuters.
A call option gives the holder the right but not the obligation to buy the underlying asset at a predetermined price on or before a specific date. A put option represents a right to sell.
It’s worth noting that the weekly RR drops to -0.372 by the press time while the daily gauge of the options market prints a four-day losing streak with 0.187 being the latest print.
While searching for the bullish catalysts, the recent weakness in the oil prices, Canada’s main export, and the firmer US Treasury yields gain major attention.
Also read: USD/CAD aims to regain 1.3800 as oil retreats, Canada Retail Sales eyed
-
05:21
USD/INR Price News: Indian rupee extends RBI-led gains below 83.00 despite firmer yields
- USD/INR remains pressured after reversing from record high.
- RBI’s so-called meddling in spot, forward markets defends INR.
- Treasury yields refresh multi-year high as inflation fears join hawkish central banks.
- Fedspeak, RBI’s intervention eyed for fresh impulse as buyer push for entry.
USD/INR takes offers to renew the intraday low near 82.70 while extending the previous day’s pullback from the all-time high during early Friday.
In doing so, the Indian rupee (INR) pair justifies the Reserve Bank of India (RBI) intervention to defend the currency around an all-time low even as firmer yields challenge the pair sellers.
Reuters quotes an anonymous trader from a bank in India as saying that the RBI sold USD/INR aggressively on Thursday, while also adding, “RBI likely to protect psychological 83 level on USD/INR and Thursday’s high of 83.25-83.30.”
The news also mentioned, “Like in previous sessions of late, the RBI did buy/sell swaps alongside spot dollar sales, pushing forward premiums lower. The USD/INR 1-year implied yield dropped to near 2.50%.”
It should be noted that the downbeat oil prices also weigh on the USD/INR due to India’s reliance on energy imports and record current account deficit.
Elsewhere, mostly firmer US data and hawkish Fedspeak underpinned the US Treasury yields to refresh multi-year high. However, the US dollar struggles to avoid the weekly loss.
US Initial Jobless Claims eased to 214K for the week ended on October 07 versus 230K expected and a revised down 226K prior. Further, Philadelphia Fed Manufacturing Survey Index dropped to -8.7 for October versus the -5 market consensus and -9.9 previous reading. Additionally, US Existing Home Sales rose past 4.7M expected to 4.71M but eased below 4.78M prior. Recently, Federal Reserve Governor Lisa Cook mentioned that ongoing rate increases will be required. Previously, Philadelphia Fed President Patrick Harker mentioned, per Reuters, “The central bank is not done with raising its short-term rate target amid very high levels of inflation.”
Moving on, the RBI’s moves will be closely watched to determine near-term USD/INR performance. Also important will be the last dose of the Fed speakers’ comments before the blackout period preceding November’s Federal Open Market Committee (FOMC) meeting.
Technical analysis
A trend-widening formation called megaphone restricts USD/INR moves between 84.00 and 82.20.
-
05:02
AUD/USD faces hurdles around 0.6280 as market mood dampens, yields skyrocket
- AUD/USD has sensed offers around 0.6280 as the risk-off impulse has rebounded.
- The 10-year yields have printed a high of 4.26% while the DXY has crossed 113.00 confidently.
- Hawkish commentary from Fed policymakers has infused fresh blood into yields.
The AUD/USD pair has sensed selling pressure while attempting to cross the critical hurdle of 0.6280 in the Tokyo session. As the risk-off impulse has rebounded with sheer momentum, risk-sensitive currencies are feeling the heat. The asset traded sideways in early Tokyo, however, the infused volatility in the market may drag it sharply.
The US dollar index (DXY) has rebounded firmly and has refreshed its day’s high above 113.07. The DXY is expected to deliver an upside break ahead as returns on US Treasury yields are skyrocketing. The 10-year benchmark US Treasury yields have reached 4.26%, the highest since the sub-prime crisis.
It seems that the market participants are anticipating the fourth consecutive rate 75 basis points (bps) rate hike by the Federal Reserve (Fed) despite the headwinds of moderation in the labor market and a decline in retail spending.
Hawkish commentary from Fed Governor Lisa Cook has infused fresh blood in yields. Fed policymaker cited that the price growth is unacceptably higher and policy tightening will continue. After reaching a certain level, the policy will be stable until the central bank observes a slowdown in price pressures for several months.
On the Australian front, the maintenance of a status quo by the People’s Bank of China (PBOC) and the downbeat Aussie employment data have impacted the antipodean dramatically. The PBOC kept monetary policy unchanged despite the toil and turmoil in the economy and the lower inflation rate. As per September’s payroll report, the Australian economy has added mere 0.9k jobs vs. the expectations of 25k.
-
04:21
Gold Price Forecast: XAU/USD turns sideways below $1,630 as DXY losses momentum, yields reach 4.24%
- Gold prices are oscillating, following the footprints of the DXY.
- S&P500 futures have attempted a rebound, however, the risk impulse is still negative.
- The 10-year US yields have kissed 4.24% for the first time since the sub-prime crisis.
Gold price (XAU/USD) is displaying back-and-forth moves in a narrow range of $1,625.00-1,628.55 in the Tokyo session. The precious metal is awaiting price action from the US dollar index (DXY). The DXY is struggling to sustain above the immediate hurdle of 113.00. The asset attempted to sustain above the 113.00 hurdle but failed to sustain as S&P500 futures have retreated from near 3,645.00.
Well, returns from the US government bonds are not sensing any barricade and are flying like there is no tomorrow. The 10-year US Treasury yields have accelerated to 4.24% for the first time since the sub-prime crisis. The yields are being strengthened by hawkish commentaries from Federal Reserve (Fed) policymakers.
On Thursday, Fed Governor Lisa Cook crossed wires citing that inflationary pressures are unacceptably higher and more rate hikes are needed to curtail them. She further added that more rate hikes will line up and later the restrictive policy will be kept.
As per the CME FedWatch tool, chances for a fourth consecutive 75 basis point (bps) rate hike remain more than 93%.
Gold technical analysis
On an hourly scale, the gold price has witnessed a steep fall after testing the highest auction area placed in a $1,642.58-1,671.83 range. The precious metal is declining toward the two-year low at $1,614.85, 8 September 2022. Declining 20 and 50-period Exponential Moving Averages (EMAs) at $1,629.86 and $1,634.46 add to the downside filters.
Meanwhile, the Relative Strength Index (RSI) (14) is oscillating in a 40.00-60.00 range and a shift into the bearish range of 20.00-40.00will trigger the downside momentum
Gold hourly chart
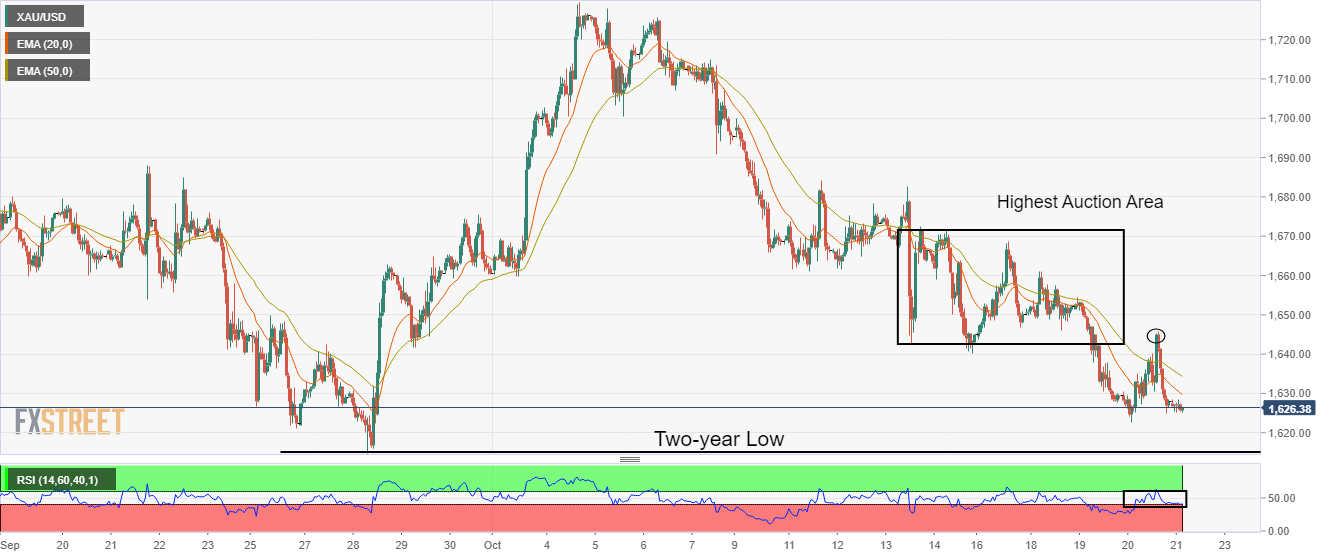
-
04:11
EUR/USD skates on thin ice below 0.9800 amid sluggish yields, eyes on Fed speakers
- EUR/USD picks up bids to pare intraday losses, braces for the first weekly gain in three.
- Yields dribble around multi-year high as markets wait for fresh clues.
- Last round of Fedspeak before pre-FOMC blackout will be crucial as DXY struggles despite hawkish wagers on Fed.
- Eurozone preliminary Consumer Confidence for October will be important as well.
EUR/USD prints mild intraday losses around 0.9780 despite the recent bounce of the day’s low, which in turn portrays the market’s indecision amid a light calendar day on Friday. Even so, the major currency braces for the first weekly gain in three as the US Dollar Index (DXY) struggles to justify strong Treasury yields and hawkish Fed bets.
DXY prints a three-day uptrend as it pokes 113.00 by the press time, up 0.12% intraday. Even so, the greenback gauge snaps a two-week uptrend while posting 0.30% weekly loss by the press time.
That said, the greenback’s weekly loss could be linked to Monday’s heavy fall while the latest recovery takes clues from the US data and Fedspeak.
US Initial Jobless Claims eased to 214K for the week ended on October 07 versus 230K expected and a revised down 226K prior. Further, Philadelphia Fed Manufacturing Survey Index dropped to -8.7 for October versus the -5 market consensus and -9.9 previous reading. Additionally, US Existing Home Sales rose past 4.7M expected to 4.71M but eased below 4.78M prior. Recently, Federal Reserve Governor Lisa Cook mentioned that ongoing rate increases will be required.
Amid these plays, the US 10-year Treasury bond yields refreshed a 14-year high the previous day, around 4.22% by the press time. Also, the two-year US Treasury yields rose to the highest levels since 2007 before recently taking rounds to 4.62%. It’s worth noting that Wall Street closed in the red following an initially upbeat performance while the S&P 500 Futures extend the previous day’s losses with 0.50% intraday downside at the latest.
Other than the US dollar recovery, the fears of escalating the energy crisis in the bloc also exert downside pressure on the EUR/USD. During the ongoing EU Summit, Germany drops opposition to the bloc’s natural gas price cap and hence Moscow may convey dislike soon.
Considering the aforementioned details, the EUR/USD is likely to remain dicey but the last dose of the Fed speakers’ comments before the blackout period preceding November’s Federal Open Market Committee (FOMC) meeting will be crucial for clear market directions. Also important to watch will be the preliminary readings of October month Eurozone Consumer Confidence, expected -30.00 versus -28.8 prior.
Technical analysis
50-SMA joins an upward-sloping trend line from September 28 to restrict the immediate EUR/USD downside around 0.9760 support, a break of which could quickly drag the quote towards a horizontal area comprising multiple lows marked since September 23, near 0.9680-70.
-
03:44
Australia Treasurer Chalmers: Latest floods to cut quarter of a percentage point from GDP growth
“Widespread floods that have inundated large parts of Australia's southeast will dent the country's economic growth and increase inflation,” Treasurer Jim Chalmers said on Friday, ahead of next week's federal budget, reported Reuters.
Key quotes
Floods will likely detract a quarter of a percentage point from GDP growth in the December quarter, and add 0.1 percentage points to inflation in the December quarter and again in the March quarter.
It is too early for us to put a very precise price tag on the flooding that we are seeing through such large swathes of Australia, but we do know that there will be consequences for the economy and the budget.
My focus is on this inflation challenge, it's about responsible cost-of-living relief, it's about getting wages moving again.
The previous Liberal National government had ‘booby trapped’ the budget with more than A$6 billion ($3.7 billion) in unfunded spending that would have to be covered in the deficit due to be announced on Oct. 25.
AUD/USD fades bounce off intraday low
AUD/USD remains mildly offered as it retreats to 0.6270 while extending the previous day’s pullback from the weekly top.
Also read: AUD/USD Price Analysis: Grinds lower towards 0.6240 support
-
03:37
S&P 500 Futures pare weekly gains as yields dribble around multi-year high
- Global markets remain sluggish amid light calendar, early week optimism defends buyers.
- S&P 500 Futures drop for the third consecutive day.
- US 10-year Treasury yields seesaw around 14-year high.
- Inflation woes keep markets on thin ice, last round of Fedspeak before blackout appears important to watch.
Traders cheer the Friday mood as an absence of major data/events joins mixed catalysts to keep them off the table during the last day of the week. Even so, cautious optimism prevails as the US dollar struggles to benefit from the strong yields and risk-off mood.
While portraying the mood, the US 10-year Treasury bond yields refreshed a 14-year high the previous day, around 4.22% by the press time. Also, the two-year US Treasury yields rose to the highest levels since 2007 before recently taking rounds to 4.62%.
That said, Wall Street closed in the red following an initially upbeat performance while the S&P 500 Futures extend the previous day’s losses with 0.50% intraday downside at the latest.
“US stocks closed lower on Thursday as data on the labor market and comments from a U.S. Federal Reserve official reinforced expectations the central bank will be aggressive in hiking interest rates outweighed a flurry of solid corporate earnings,” said Reuters.
Looking at the data, US Initial Jobless Claims eased to 214K for the week ended on October 07 versus 230K expected and a revised down 226K prior. Further, Philadelphia Fed Manufacturing Survey Index dropped to -8.7 for October versus the -5 market consensus and -9.9 previous reading. Additionally, US Existing Home Sales rose past 4.7M expected to 4.71M but eased below 4.78M prior.
Also, Federal Reserve Governor Lisa Cook mentioned that ongoing rate increases will be required.
Amid these plays, the CME’s FedWatch Tool suggests a near 98% chance of the Fed’s 75 bps rate hike.
Elsewhere, the political crisis in the UK and Japan’s reluctance to intervene despite the multi-year low of the yen, exert downside pressure on the markets. However, China’s readiness to ease virus-led travel curbs seems to defend the buyers. On the same line could be the hopes that Britain will soon overcome the jittery markets.
Moving on, the UK’s Retail Sales and the last dose of the Fed speakers’ comments before the blackout period preceding November’s Federal Open Market Committee (FOMC) meeting will be crucial for clear market directions.
-
03:30
Commodities. Daily history for Thursday, October 20, 2022
Raw materials Closed Change, % Silver 18.663 1.15 Gold 1628.05 -0.08 Palladium 2057 2.87 -
03:21
US Dollar Price Analysis: Bulls are moving in towards Thursday's highs
- DXY bulls are moving in and extending the US rally.
- US yields are also perky, fuelling the bid.
In trade on Thursday, the US dollar and US bond yields rose, with the US 2-year topping the highest since 2008 at 4.614%. Federal Reserve Bank of Philadelphia President Patrick Harker who said the central bank is not done with raising its short-term rate target amid very high levels of inflation. His most hawkish of remarks sent yields to fresh cycle highs, the strongest in a decade. He said the Fed has made disappointing progress at lower inflation and added that inflation in 2023 would fall to around 4% and 2.5% in 2024, which is still well above the 2%.The US dollar hit a high of 113.09. The following illustrates a bullish thesis for the day ahead.
US dollar daily chart
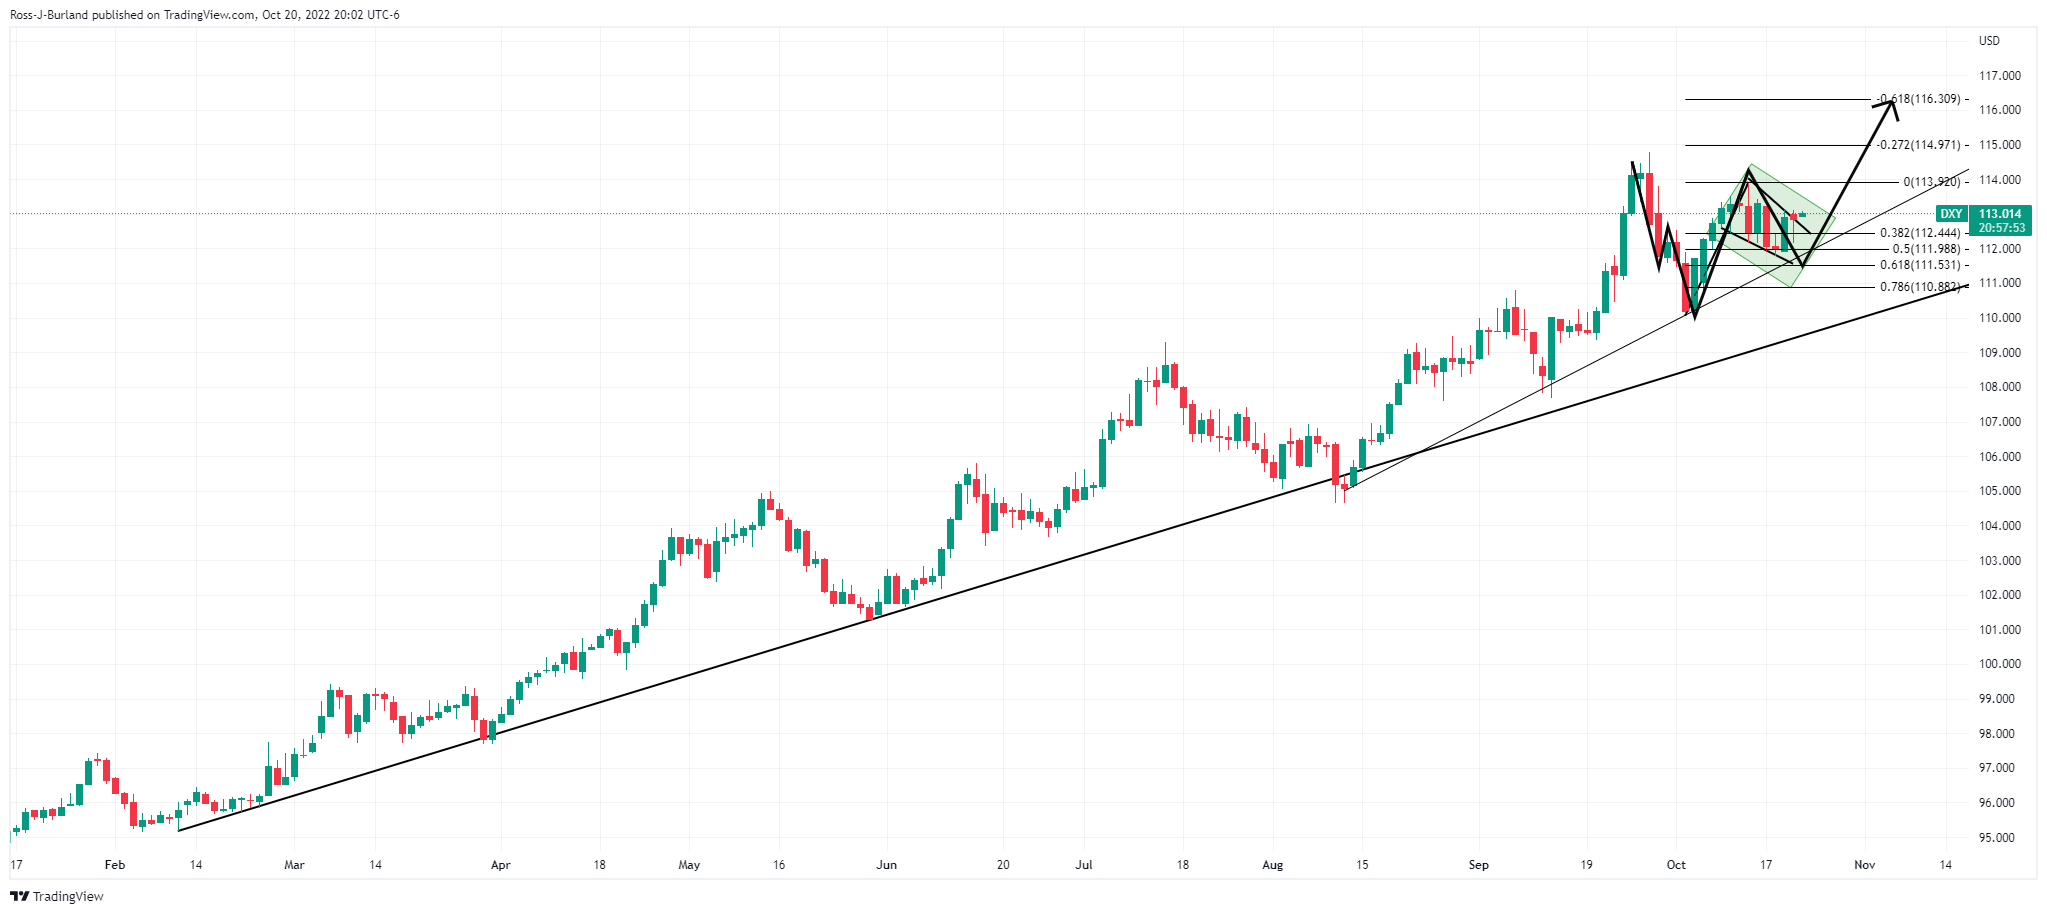
The confluence of the bullish flag pattern and W-formation, with the correction, supported the neckline meeting a 50% mean reversion and trendline likely give fuel for the bulls.
US 2-year yields
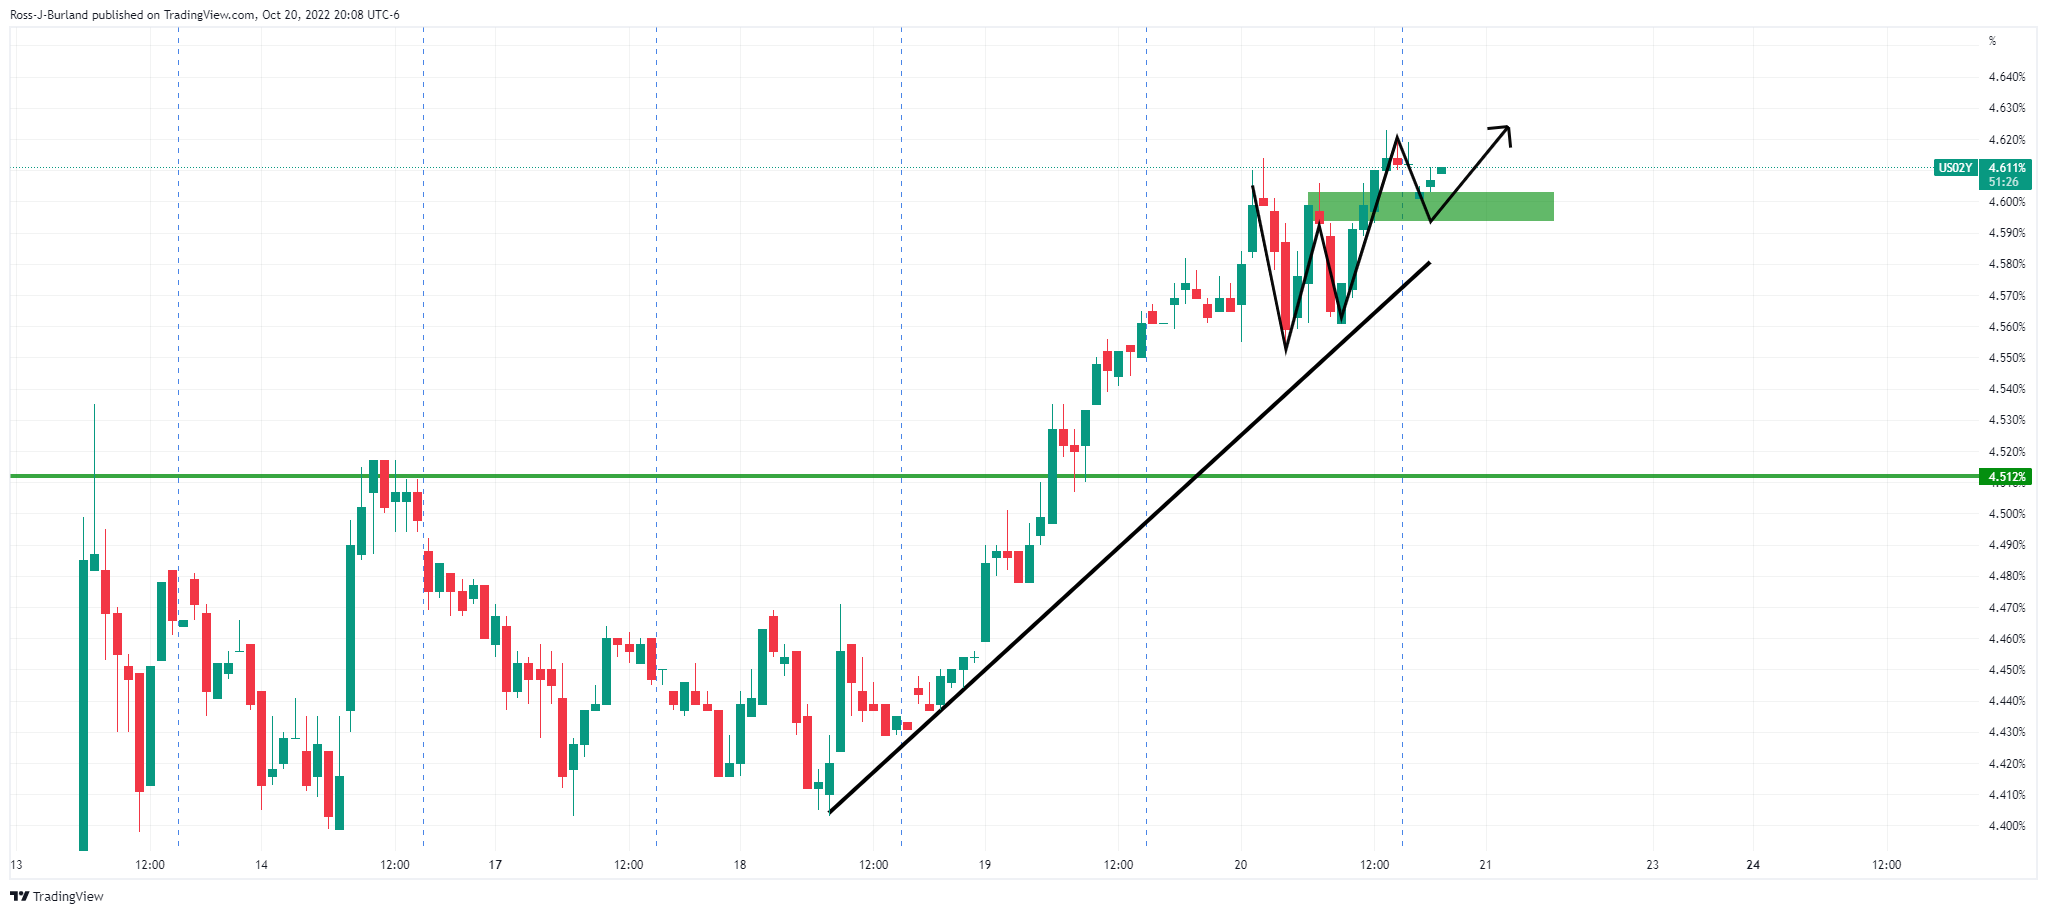
The yield is paying out at the highest levels in years and remains on the front side of the trendline. A test into the W-formations support and the trendline support could be underway for the way ahead, but should the yield move higher, the US dollar could fly.
-
03:20
Silver Price Analysis: XAG/USD retreats towards $18.30 key support
- Silver price fades bounce off the seven-week-old support line.
- Death cross, steady RSI favor sellers targeting fresh yearly low.
- Key SMAs restrict immediate upside, monthly low can test sellers.
Silver price (XAG/USD) eases from the weekly high to $18.60, inching closer to the key trend line support during Friday’s Asian session. In doing so, the bright metal pares the previous day’s gains while bracing for a positive weekly closing.
That said, the metal’s failure to provide a successful break of the 50-SMA during the previous day’s run-up joins the steady RSI (14) to keep sellers hopeful.
As a result, the XAG/USD prices may again attempt to break the upward-sloping support line from early September, around $18.30 by the press time, for the fourth consecutive time.
It’s worth noting, however, that the death cross on the four-hour chart adds strength to the bearish bias for the metal, suggesting a clear downside break of the $18.30 support, which in turn could direct the quote towards the yearly low near $17.55.
The 50-SMA’s downside break of the 200-SMA is known as the death cross and is generally favorable to the sellers. Also notable is that the lows marked in October and late September, around $18.00, could act as extra downside filters for the silver bears to watch.
Meanwhile, recovery moves not only need to cross the 50-SMA hurdle of $18.80 but should also stay beyond the 200-SMA level of $19.23 to convince buyers.
Silver: Four-hour chart

Trend: Further downside expected
-
02:58
USD/JPY teases Tokyo intervention near 32-year high above 150.00 despite strong Japan inflation, yields
- USD/JPY picks up bids to renew intraday high near the multi-year top marked on Thursday.
- Yields remain firmer amid fears of high inflation, and recession.
- Japan’s Core CPI jumped to the highest in eight years, stronger for the sixth consecutive month.
- BOJ again plans for emergency bond buying but policymakers resist meddling in the market and defend buyers.
USD/JPY stays mildly bid as it pokes the 32-year around 150.25-30 during Friday’s Asian session. In doing so, the yen pair rises for the consecutive 13 days while poking the highest levels since 1990 amid strong yields and the Bank of Japan’s (BOJ) defense of the easy money policy.
It’s worth noting that Japan’s inflation data refreshed a multi-year high earlier in the day, which in turn exerted more pressure on the policymakers to intervene in the markets and safeguard the yen. That said, “Japan's core consumer inflation rate accelerated to a fresh eight-year high of 3.0% in September, exceeding the central bank's 2% target for the sixth straight month as the yen's slump to 32-year lows continues to push up import costs,” said Reuters.
Following the data, Japanese Finance Minister Shunichi Suzuki said on Friday that authorities were dealing with currency speculators "strictly", as an extended sell-off of the yen kept markets on heightened alert for further dollar-selling intervention by Tokyo. Also, the BOJ announced emergency bond-buying operations for a second consecutive day and increase the amount of bonds it is buying for its scheduled operations, per Reuters.
Elsewhere, US Initial Jobless Claims eased to 214K for the week ended on October 07 versus 230K expected and a revised down 226K prior. Further, Philadelphia Fed Manufacturing Survey Index dropped to -8.7 for October versus the -5 market consensus and -9.9 previous reading. Additionally, US Existing Home Sales rose past 4.7M expected to 4.71M but eased below 4.78M prior. Recently, Federal Reserve Governor Lisa Cook mentioned that ongoing rate increases will be required.
Amid these plays, the US 10-year Treasury bond yields refreshed a 14-year high the previous day, around 4.22% by the press time. Also, the two-year US Treasury yields rose to the highest levels since 2007 before recently taking rounds to 4.62%. Further, Wall Street closed in the red following an initially upbeat performance while the S&P 500 Futures extend the previous day’s losses with 0.50% intraday downside at the latest.
It should be noted that the escalating hawkish Fed calls, versus the BOJ’s dovish done, also underpins the USD/JPY pair’s upside momentum. That said, the CME’s FedWatch Tool suggests a near 98% chance of the Fed’s 75 bps rate hike.
Moving on, any market meddling from the Japanese policymakers will be closely eyed and can trigger the USD/JPY sell-off. Until then, the bulls could keep the reins. Also important to watch will be the last dose of the Fed speakers’ comments before the blackout period preceding November’s Federal Open Market Committee (FOMC) meeting.
Technical analysis
Unless declining back below the six-month-old support line, around 149.70 by the press time, USD/JPY remains bullish.
-
02:45
USD/CAD Price Analysis: Buying tails at 20-EMA warrants a resumption of rally
- The 20-EMA at around 1.3080 has acted as major support for the counter.
- The dismal market mood is supporting the greenback bulls.
- The asset may test October high at 1.3978 after overstepping the round-level hurdle of 1.3900.
The USD/CAD pair is attempting to re-test the critical hurdle of 1.3811 as the risk-off market mood has strengthened further. S&P500 futures have escalated their losses in Tokyo after two consecutive bearish trading sessions, which indicates that the risk aversion theme will stay for a while.
This has also infused fresh blood into the US dollar index (DXY), which has overstepped the round-level resistance of 113.00 in Asia. Also, the 10-year US treasury yields haven’t shown any sign of exhaustion despite a juggernaut rally to near 4.23%.
On a daily scale, the asset has remained in the grip of bulls after breaching the upward-sloping trendline placed from May 12 high at 1.3077. The formation of buying tails after a correction to near the 20-period Exponential Moving Average (EMA) at around 1.3680 indicates that the corrective move is concluded now and the asset will resume its upside journey.
Also, the upside trending 50-EMA at 1.3445 indicates that the upside bias is intact.
The Relative Strength Index (RSI) (14) tested 40.00-60.00 after remaining in the bullish range of 60.00-80.00. A conclusion of the corrective move may drive the momentum oscillator again into the bullish range.
Going forward, a break above Wednesday’s high at 1.3810 will send the asset toward the round-level cushion of 1.3900, followed by the previous week’s high at 1.3978.
On the contrary, a decisive drop by the asset below the round-level support of 1.3700 will drag the asset toward October 6 low at 1.3565. A breakdown of the latter will bring further weakness in the asset towards October 5 low at 1.3504.
USD/CAD daily chart
-638019134492683943.png)
-
02:28
GBP/USD sellers poke 1.1200 support with scrutiny on UK politics, Retail Sales
- GBP/USD remains mildly offered as bears attack short-term key support.
- Political turmoil in the UK escalates after PM Truss’ resignation, fresh elections is to be held on Monday.
- Hawkish bets on the BOE failed to impress pair buyers amid multi-year high US Treasury yields.
- UK Retail Sales are the key to recall buyers amid strong inflation.
GBP/USD takes offers to renew intraday low near the 1.1200 support confluence as traders await the UK Retail Sales during early Friday. Other than the pre-data jitters, the political crisis in Britain also weighs on the Cable pair amid upbeat US Dollar Index (DXY) and firmer US Treasury yields.
Liz Truss resigned from the UK’s Prime Minister’s post after serving the shortest tenure as the national leader. Truss’ fall was mainly linked to the downbeat fiscal policies conveyed in the “mini-budget” and the British dislike for the same, which in turn raised concerns for the return of Boris Johnson as UK PM. It’s worth noting that Reuters said, “The Conservative Party, which holds a big majority in parliament and need not call a nationwide election for another two years, will now elect a new leader by Oct. 28 - Britain's fifth prime minister in six years.”
Elsewhere, the UK’s GfK Consumer Confidence improved to -47 in September versus the record low of -49 marked the previous month, as per the latest data release on Friday. Following the data, Reuters stated that confidence among British consumers remained close to the lowest level on record this month with households facing double-digit inflation, rising interest rates and political chaos, the survey showed on Friday.
It is important to know that the UK’s headline inflation jumped to the multi-year high near 10.0% earlier in the week and hence propelled the odds of the Bank of England’s (BOE) faster/heavier rate hikes. Hence, today’s UK Retail Sales, expected to improve to -0.5% MoM in September versus -1.6% prior, will be crucial for the GBP/USD buyers as a firmer number could defend the pair from breaking the immediate key support.
Even so, hawkish Fedbets and multi-year high US Treasury bond yields could join the hawkish Fedspeak to weigh on the quote. Furthermore, political developments in the UK will be crucial to watch for fresh impulse.
Technical analysis
An upward-slopping trend line from September 28 joins the 10-DMA to restrict immediate GBP/USD downside around 1.1200. The pair buyers, however, remain uninterested unless the quote crosses the five-week-old resistance line, near 1.1330 by the press time.
-
02:18
USD/CNY fix: 7.1186 vs. the last close of 7.2160
In recent trade today, the People’s Bank of China (PBOC) set the yuan (CNY) at 7.1186 vs. the last close of 7.2160.
About the fix
China maintains strict control of the yuan’s rate on the mainland.
The onshore yuan (CNY) differs from the offshore one (CNH) in trading restrictions, this last one is not as tightly controlled.
Each morning, the People’s Bank of China (PBOC) sets a so-called daily midpoint fix, based on the yuan’s previous day's closing level and quotations taken from the inter-bank dealer.
-
02:12
NZD/USD Price Analysis: The bird is perched on a broken branch of the week's bearish template
- NZD/USD bears are lurking at key structures.
- The day ahead could be a whitewash for the bird if the US dollar rallies.
NZD/USD could be on the verge of a final long squeeze into positions that have been in the money since the start of the week. The US dollar is ripening for a rally from key daily support as US yields tear into fresh bulls cycle highs. The following illustrates the prospects for a sell-off into last week's lows for a fresh low on the week down to 0.5512. this is below the daily ATR of 97.
NZD/USD daily chart
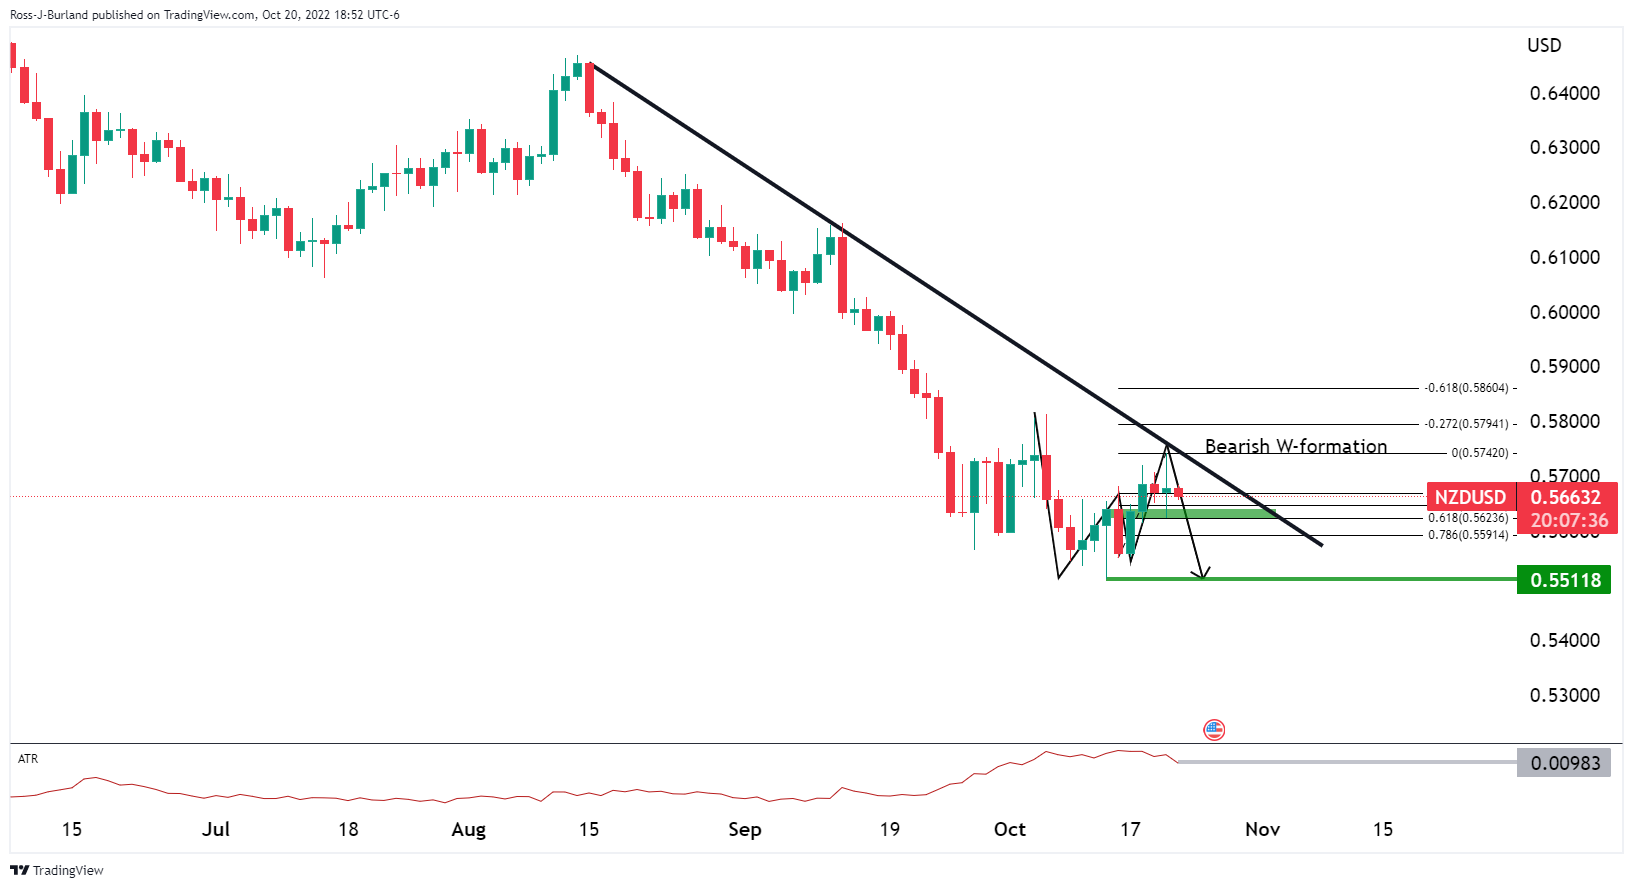
NZD/USD H1 chart, weekly template
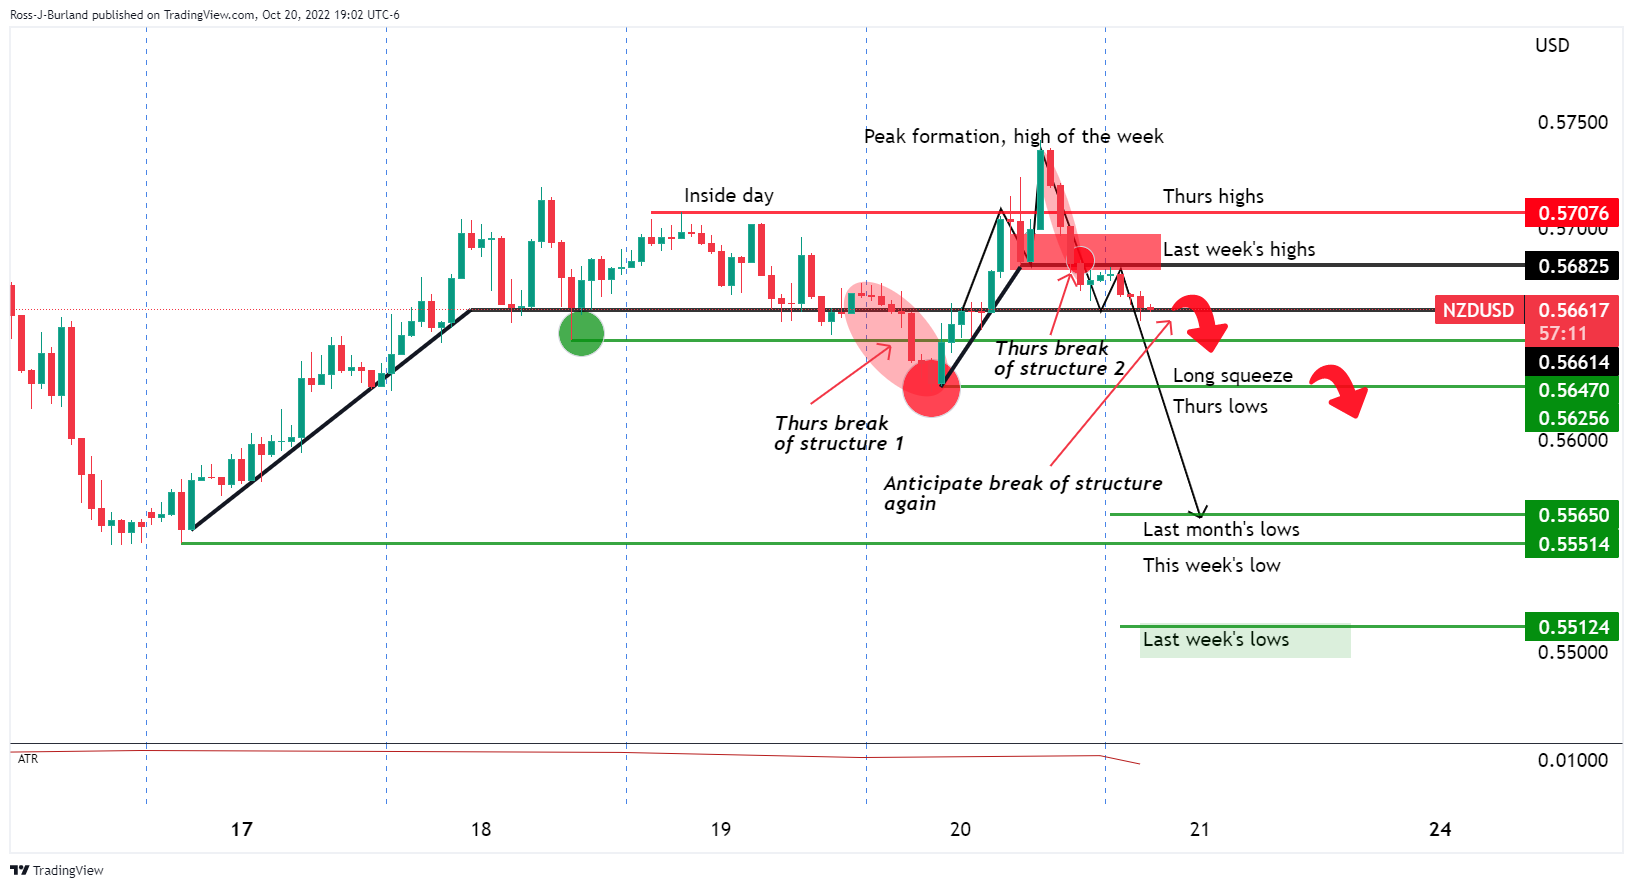
The bird is perched on a broken branch of this week's bearish template, hovering over longs like a guillotine given that this structure was already broken in Tokyo on Wednesday. The price is below the daily peaks and the M-formation's neckline and recently broken structure 2 at 0.5682. There are prospects of a break of structure 1 0.5661 again for the sessions ahead.
If the bears can get below there, 0.5650 will be eyed as the final structure that guards in-the-money long positions to the start of the week's prices near 0.5550 and then last week's bear cycle lows of 0.5512.
For now, eyes are being kept on US yields:
US 2-year yields and DXY
The yield is paying out at the highest levels in years and remains on the front side of the trendline. A test into the W-formations support and the trendline support could be underway for the way ahead, but should the yield move higher, the US dollar could take off and be the catalyst for the long squeeze in the kiwi.
-
02:01
USD/CHF Price Analysis: Prepares for a fresh three-year high above 1.0070
- Strengthening of the risk-off impulse has underpinned the greenback bulls.
- The DXY has crossed the immediate hurdle of 113.00 as yields soar.
- Advancing 20-and 50-EMAs add to the upside filters.
The USD/CHF pair has overstepped its immediate hurdle at 1.0050 in the Tokyo session and is pulling up socks to test a three-year high at 1.0074, recorded on October 13. A dismal market mood led by late selling in S&P500 amid upbeat yields has underpinned the greenback bulls.
The 10-year US Treasury yields reached 4.23% amid soaring bets on an expectation of a bumper rate hike announcement by the Federal Reserve (Fed). Meanwhile, the US dollar index (DXY) has crossed the critical hurdle of 113.00, at the press time.
On a daily scale, the asset is trading closely around the supply zone, placed in a narrow range of 1.0048-1.0074. The 20-and 50-period Exponential Moving Averages (EMAs) at 0.9931 and 0.9823 respectively, are vertical towards the north side, which adds to the upside filters.
Simultaneously, the Relative Strength Index (RSI) (14) is seeking a confident shift into the bullish range of 60.00-80.00. An occurrence of the same will strengthen the greenback bulls further.
Should the asset oversteps October 13 high at 1.0074, the asset will expose to a fresh three-year high. The major will towards the round-level resistance of 1.0100, followed by 15 April 2019 high at 1.0160.
Alternatively, the Swiss franc bulls could regain strength if the asset violates September 29 low at 0.9742. This would drag the pair toward September 19 high and September 22 low at 0.9695 and 0.9620 respectively.
USD/CHF daily chart
-638019108473961490.png)
-
01:48
AUD/USD Price Analysis: Grinds lower towards 0.6240 support
- AUD/USD fades bounce off weekly support line inside 1.5-month-old bearish channel.
- Firmer oscillators defend buyers during the first weekly gain in six, 21-DMA adds to the upside filters.
- Yearly low, 21-DMA act as additional trading filters.
AUD/USD prints mild losses while renewing its intraday low near 0.6265 during early Friday. In doing so, the Aussie pair retreats towards the one-week-old support line, after bouncing off the same on Thursday. Also keeping sellers hopeful is a downward-slopping trend channel established since September 07.
However, the recently bullish MACD signals, the first since mid-August, join nearly oversold RSI to challenge the AUD/USD pair’s downside past the aforementioned support line, around 0.6240 by the press time.
Even if the quote drops below 0.6240, the 0.6200 threshold and the yearly low of 0.6170 will act as extra challenges for the AUD/USD bears.
In a case where AUD/USD remains bearish past 0.6170, the aforementioned channel’s support line, close to 0.6050 at the latest, will be in focus during the south-run targeting the 0.6000 psychological magnet and April 2020 low near 0.5980.
Alternatively, recovery moves not only need to defy the bearish chart formation by crossing the 0.6305 immediate resistance but should also provide a daily closing beyond the 21-DMA of 0.6375 to convince buyers.
Following that, a run-up toward the monthly high of 0.6540 becomes imminent. It should be noted that the early September swing low near 0.6700 could lure the AUD/USD bulls past 0.6540.
AUD/USD: Daily chart
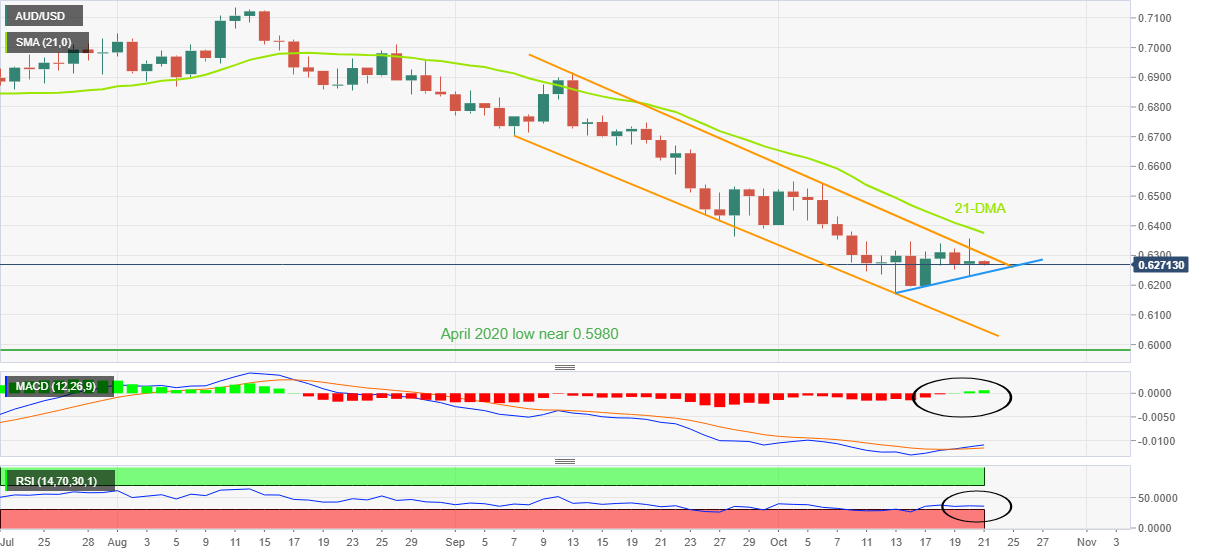
Trend: Gradual recovery expected
-
01:43
Japanese finance minister Suzuki: Excess FX volatility by speculative trading is unacceptable
Ahead of Japan's core consumer inflation rate data accelerated to a fresh eight-year high of 3.0% in September, exceeding the central bank's 2% target for the sixth straight month as the yen's slump to 32-year lows continue to push up import costs, the Japanese finance minister Suzuki crossed the wires:
- Important to take seamless steps against rising prices.
- Weak yen has both merits and demerits.
- Recent sharp, one-sided yen weakening is undesirable.
- Excess FX volatility by speculative trading is unacceptable.
The broadening price pressures in Japan and the yen's tumble below the key psychological barrier of 150 to the dollar will likely keep alive market speculation of a tweak to the Bank of Japan's dovish stance over the coming months.
USD/JPY update

-
USD/JPY Price Analysis: 149.00 is being eyed by the bears
In the meantime, however, traders are on alert with respect to the BoJ's forex market intervention timings which has a ripple effect across currencies, such as the euro:
- EUR/USD is carving out the risk of an imminent downside breakout, US yields rocket to the moon (and back?)
-
01:30
Stocks. Daily history for Thursday, October 20, 2022
Index Change, points Closed Change, % NIKKEI 225 -250.42 27006.96 -0.92 Hang Seng -231.06 16280.22 -1.4 KOSPI -19.35 2218.09 -0.86 ASX 200 -69.4 6730.7 -1.02 FTSE 100 18.91 6943.91 0.27 DAX 26 12767.41 0.2 CAC 40 46.18 6086.9 0.76 Dow Jones -90.22 30333.59 -0.3 S&P 500 -29.38 3665.78 -0.8 NASDAQ Composite -65.67 10614.84 -0.61 -
01:27
EUR/GBP stabilizes above 0.8700 as UK Political crisis escalates, British Retail Sales eyed
- EUR/GBP has shifted its business above 0.8700 amid escalating UK Political crisis.
- Higher interest rates, price pressures, and supply chain disruptions have trimmed retail spending.
- The Eurozone Consumer Confidence data is expected to drop to -30.0.
The EUR/GBP pair has established confidently above the critical hurdle of 0.8700 in the Tokyo session. In the New York session, the asset witnessed a responsive buying action below 0.8680 after novel UK Prime Minister Liz Truss resigned. The resignation of UK Leader Truss came after cabinet ministries and MPs lost confidence in her leadership skills. Apart from that, bewildered decisions from UK’s Truss on taxation decisions escalated financial chaos.
General elections for the next UK Prime Minister will take place on October 28 with Rishi Sunak, Penny Mordaunt, Ben Wallace, and ex-UK PM Boris Johnson himself as potential candidates for the role.
This week, the release of the escalated inflationary pressures bolstered the odds of bigger rate hikes by the Bank of England (BOE). The headline inflation rate has returned to the double-digit territory, therefore, the central bank is left with no other option than to hike interest rates sooner. Also, the core Consumer Price index (CPI) elevated to 6.5%.
On Friday, the release of the UK Retail Sales data will be of utmost importance. The Retail Sales data is seen declining by 5% for September on an annual basis. The decline is lower than the prior drop by 5.4%. Retail demand has tumbled amid higher interest rates, soaring price pressures, and supply chain disruptions led by the Russia-Ukraine war.
Meanwhile, euro investors are awaiting the release of the Eurozone Consumer Confidence data. The sentiment data is expected to decline to -30.0 vs. the prior release of -28.8. It is worth noting that the economic catalyst has remained double-digit with negative sentiment consecutively for the past seven months. This could bring some volatility in the cross ahead.
-
01:24
Gold Price Forecast: XAU/USD stays depressed below $1,650 inside bearish channel, focus on yields
- Gold price remains mildly offered while bracing for the second weekly loss.
- Fears of higher inflation, central bank’s aggression propels yields, DXY.
- Last round of Fedspeak before pre-FOMC silence will be crucial for XAU/USD bears amid hawkish bets.
Gold price (XAU/USD) remains on the back foot around $1,625, grinds lower of late, as the metal traders seek fresh clues during Friday’s sluggish session. Even so, fears of recession and firmer yields keep the bears hopeful around the yearly low.
The market’s pessimism could be learned from the multi-year high US Treasury bond yields as the benchmark 10-year coupons refreshed 14-year high the previous day, around 4.22% by the press time. Also, the two-year US Treasury yields rose to the highest levels since 2007 before recently taking rounds to 4.62%.
Underlying the fears of a recession are the mostly firmer US data and hawkish Fedspeak. On Thursday, US Initial Jobless Claims eased to 214K for the week ended on October 07 versus 230K expected and a revised down 226K prior. Further, Philadelphia Fed Manufacturing Survey Index dropped to -8.7 for October versus the -5 market consensus and -9.9 previous reading. Additionally, US Existing Home Sales rose past 4.7M expected to 4.71M but eased below 4.78M prior.
Recently, Federal Reserve Governor Lisa Cook mentioned that ongoing rate increases will be required.
Amid these plays, Wall Street closed in the red following an initially upbeat performance while the S&P 500 Futures extend the previous day’s losses with 0.50% intraday downside at the latest. Further, the CME’s FedWatch Tool suggests a near 98% chance of the Fed’s 75 bps rate hike.
To sum up, gold’s latest weakness is likely to extend but a lack of major data/events could restrict the heavy downside. Even so, today’s Fedspeak will be important as it precedes the pre-Fed blackout period.
Technical analysis
Gold price holds lower ground inside a fortnight-long bearish channel, retreating from the top of late.
Given the bearish MACD signals and the downbeat RSI, not oversold, the XAU/USD prices may extend the latest pullback from the stated channel’s upper line towards the yearly low near $1,615.
However, the bearish formation’s bottom surrounding $1,595 could challenge gold bears afterward.
Meanwhile, an upward clearance of the $1,635 hurdle, comprising the channel’s upper line, will defy the bearish chart pattern and could propel the quote toward the 21-DMA hurdle surrounding $1,663. Even so, the gold buyers remain unconvinced below the 50-DMA level of $1,696.
Gold: Daily chart
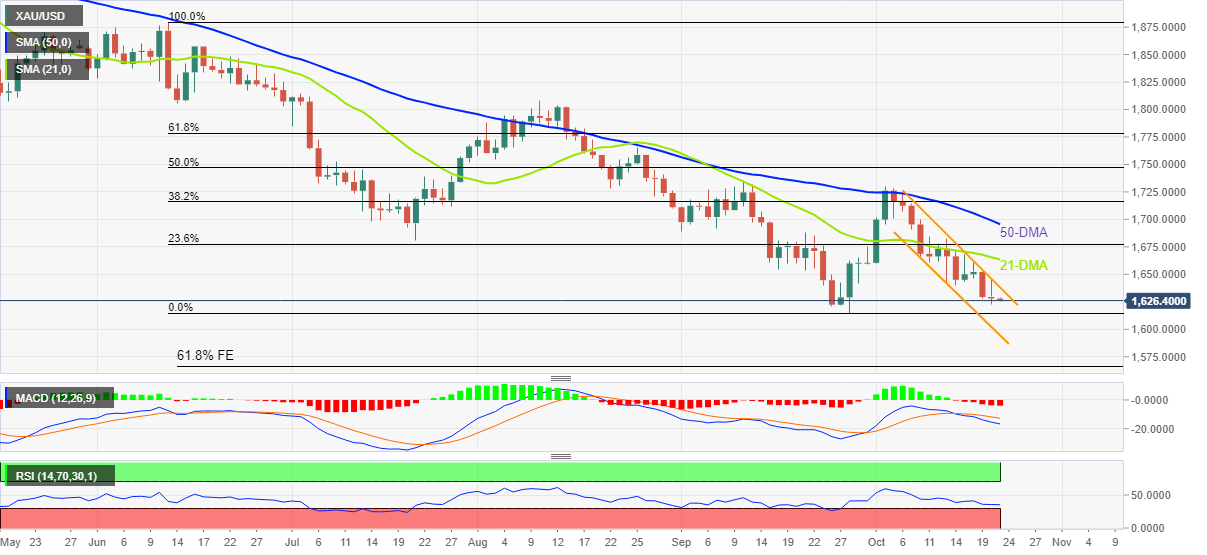
Trend: Further downside expected
-
01:15
Currencies. Daily history for Thursday, October 20, 2022
Pare Closed Change, % AUDUSD 0.62815 0.16 EURJPY 146.822 0.28 EURUSD 0.9782 0.08 GBPJPY 168.597 0.3 GBPUSD 1.12354 0.13 NZDUSD 0.56777 0.16 USDCAD 1.37643 0 USDCHF 1.00308 -0.15 USDJPY 150.077 0.18 -
01:05
US Dollar Index pares the first weekly loss in three near 113.00 on strong yields, hawkish Fedspeak
- US Dollar Index grinds higher during three-day uptrend.
- Multi-year high yields keep DXY bulls hopeful but sluggish markets, mixed data probe upside moves.
- Fedspeak gains attention as pre-Fed silence period begins onSaturday.
US Dollar Index (DXY) bulls approach 113.00 threshold, extending the mid-week rebound from the 21-day EMA, even as markets remain quiet during early Friday. Even so, the greenback’s gauge versus the six major currencies braces for the first weekly loss in three.
The DXY weakened the UK’s cautious optimism earlier in the week before the chaos surrounding Prime Minister (PM) Liz Truss’ resignation underpinned the greenback’s safe-haven demand. On the same line could be the growing fears of inflation and the central bank aggression that propelled the US Treasury bond yields to a multi-year high.
It should be observed that the news surrounding China’s easing of quarantine rules and mixed US data probed the greenback buyers the previous day.
That said, US Initial Jobless Claims eased to 214K for the week ended on October 07 versus 230K expected and a revised down 226K prior. Further, Philadelphia Fed Manufacturing Survey Index dropped to -8.7 for October versus the -5 market consensus and -9.9 previous reading. Additionally, US Existing Home Sales rose past 4.7M expected to 4.71M but eased below 4.78M prior. Recently, Federal Reserve Governor Lisa Cook mentioned that ongoing rate increases will be required.
Against this backdrop, Wall Street closed in the red following an initially upbeat performance while the US 10-year Treasury yields rose to the highest since 2008. That said, S&P 500 Futures extend the previous day’s losses with 0.50% intraday downside while the CME’s FedWatch Tool suggests a near 98% chance of the Fed’s 75 bps rate hike.
Looking forward, a light calendar in the US could restrict the DXY moves but the last dose of the Fed speakers’ comments before the blackout period preceding November’s Federal Open Market Committee (FOMC) meeting will be important to watch for fresh impulse.
Technical analysis
Sustained bounce off the 21-day EMA support, at 112.25 by the press time, directs DXY buyers towards the monthly resistance line near 113.45.
-
00:40
AUD/NZD extends gains to near 1.1070 despite upbeat NZ Trade data
- AUD/NZD has recovered sharply to near 1.1070 despite better-than-projected NZ Trade data.
- NZ Exports have accelerated in spite of external demand shocks.
- Weaker Australian labor market data has made RBA policymakers' job more tedious.
The AUD/NZD pair has extended its recovery to near 1.1070 despite the release of the downbeat NZ Trade data. In early Tokyo, the asset sensed a stellar buying interest after testing monthly lows at 1.1044. A revisit to monthly lows with less selling confidence has infused fresh blood into the aussie bulls.
The annual NZ fiscal deficit has widened by $11.95M, lower than the projections of $13.19B and the prior release of $12.5B. And, on a monthly basis, the fiscal deficit has widened by $1,615M against the projections of $2,205M and the former figure of $2,625M.
Imports in the kiwi zone have dropped to $7.64B against the figure of 47.92B reported earlier exports have advanced to $6.03B vs. the prior figure of $5.29B. While major countries are facing the headwinds of external demand shocks, kiwi’s exports have accelerated firmly.
This week, kiwi’s inflation data also impacted the cross. Price pressures remained extremely elevated led by rising input prices used in manufacturing activities. This bolstered the odds of the continuation of the current pace of rate hike by the Reserve Bank of New Zealand (RBNZ). It is worth noting that RBNZ Governor Adrian Orr has already increased the Official Cash Rate (OCR) to 3.50%.
On the Australian front, weaker job additions reported by the Australian Bureau of Statistics for September month has made the Reserve Bank of Australia (RBA) policymakers' job more cumbersome now. Price pressures in the Australian economy have not been exhausted yet and subdued employment opportunities will not allow RBA Governor Philip Lowe to tighten policy further unhesitatingly. In September, the Australian economy created only 0.9k jobs vs. the projections of 25k.
-
00:35
WTI bears approach $84.00 as inflation woes weigh on commodities
- WTI crude oil remains on the way to printing the second weekly loss.
- Fears of energy demand escalate as higher inflation, hawkish central banks amplify recession woes in major economies.
- Hopes of potential increase in China’s oil demand, optimism from OPEC+ supply cuts challenge bears.
WTI crude oil holds lower ground near $84.30, after reversing from $86.94, as bears brace for another weekly loss during Friday’s Asian session.
The black gold’s latest weakness could be linked to the market’s fears of recession amid upbeat inflation readings and hawkish central bank signals. Also likely to have weighed the energy benchmark could be the US-led efforts to increase the oil output by reducing its Strategic Petroleum Reserve (SPR).
On the contrary, China’s easing of quarantine rules for travelers triggered hopes of more oil demand from the world’s biggest industrial player. Additionally, the OPEC+ supply cuts and the ongoing Russia-Ukraine tussles are extra positives for commodity prices.
That said, the US data and hawkish Fedspeak could be linked to the fears of recession. S Initial Jobless Claims eased to 214K for the week ended on October 07 versus 230K expected and a revised down 226K prior. Further, Philadelphia Fed Manufacturing Survey Index dropped to -8.7 for October versus the -5 market consensus and -9.9 previous reading. Additionally, US Existing Home Sales rose past 4.7M expected to 4.71M but eased below 4.78M prior. Recently, Federal Reserve Governor Lisa Cook mentioned that ongoing rate increases will be required.
Amid these plays, Wall Street closed in the red following an initially upbeat performance while the US 10-year Treasury yields rose to the highest since 2008. That said, S&P 500 Futures extend the previous day’s losses with 0.50% intraday downside while the CME’s FedWatch Tool suggests a near 98% chance of the Fed’s 75 bps rate hike.
Moving on, a light calendar may restrict the WTI crude oil’s moves but fears of economic slowdown and likely reduction in the energy demand seems to keep the bears hopeful. With this in mind, Reuters said, “Oil prices were near flat during a choppy trading session on Thursday, as worries about inflation dampening demand for oil contended with news that China is considering easing COVID-19 quarantine measures for visitors.”
Technical analysis
Failure to cross the 50-DMA hurdle, around $86.40 by the press time, directs WTI sellers towards the previous resistance line from October 10, near $83.60 at the latest.
-
00:31
Japan National CPI ex-Fresh Food (YoY) meets forecasts (3%) in September
-
00:31
Japan National CPI ex Food, Energy (YoY) below expectations (2%) in September: Actual (1.8%)
-
00:30
Japan National Consumer Price Index (YoY) came in at 3% below forecasts (3.1%) in September
-
00:22
USD/JPY Price Analysis: 149.00 is being eyed by the bears
- USD/JPY bears looking for fuel into critical support structures.
- 149.00 is beckoning as risks of BoJ forex market operations hangover head.
Attempting to draw technical analysis on a market that is so out of whack with normality is a tall order if not just outright futile, but USD/JPY has rallied to draw droppingly high levels as per the following 5-monthly chart:

The price is resting in the 150s following a European drop that followed the test of the level to 149.67 and then the US lows of 149.55. Bank of Japan intervention risk is brewing up and if the market decides to front run such a risk, a 100 pip move to 149.00 could evolve in the near term, and lower ahead of the Federal Reserve November 1/2.
USD/JPY M15 chart
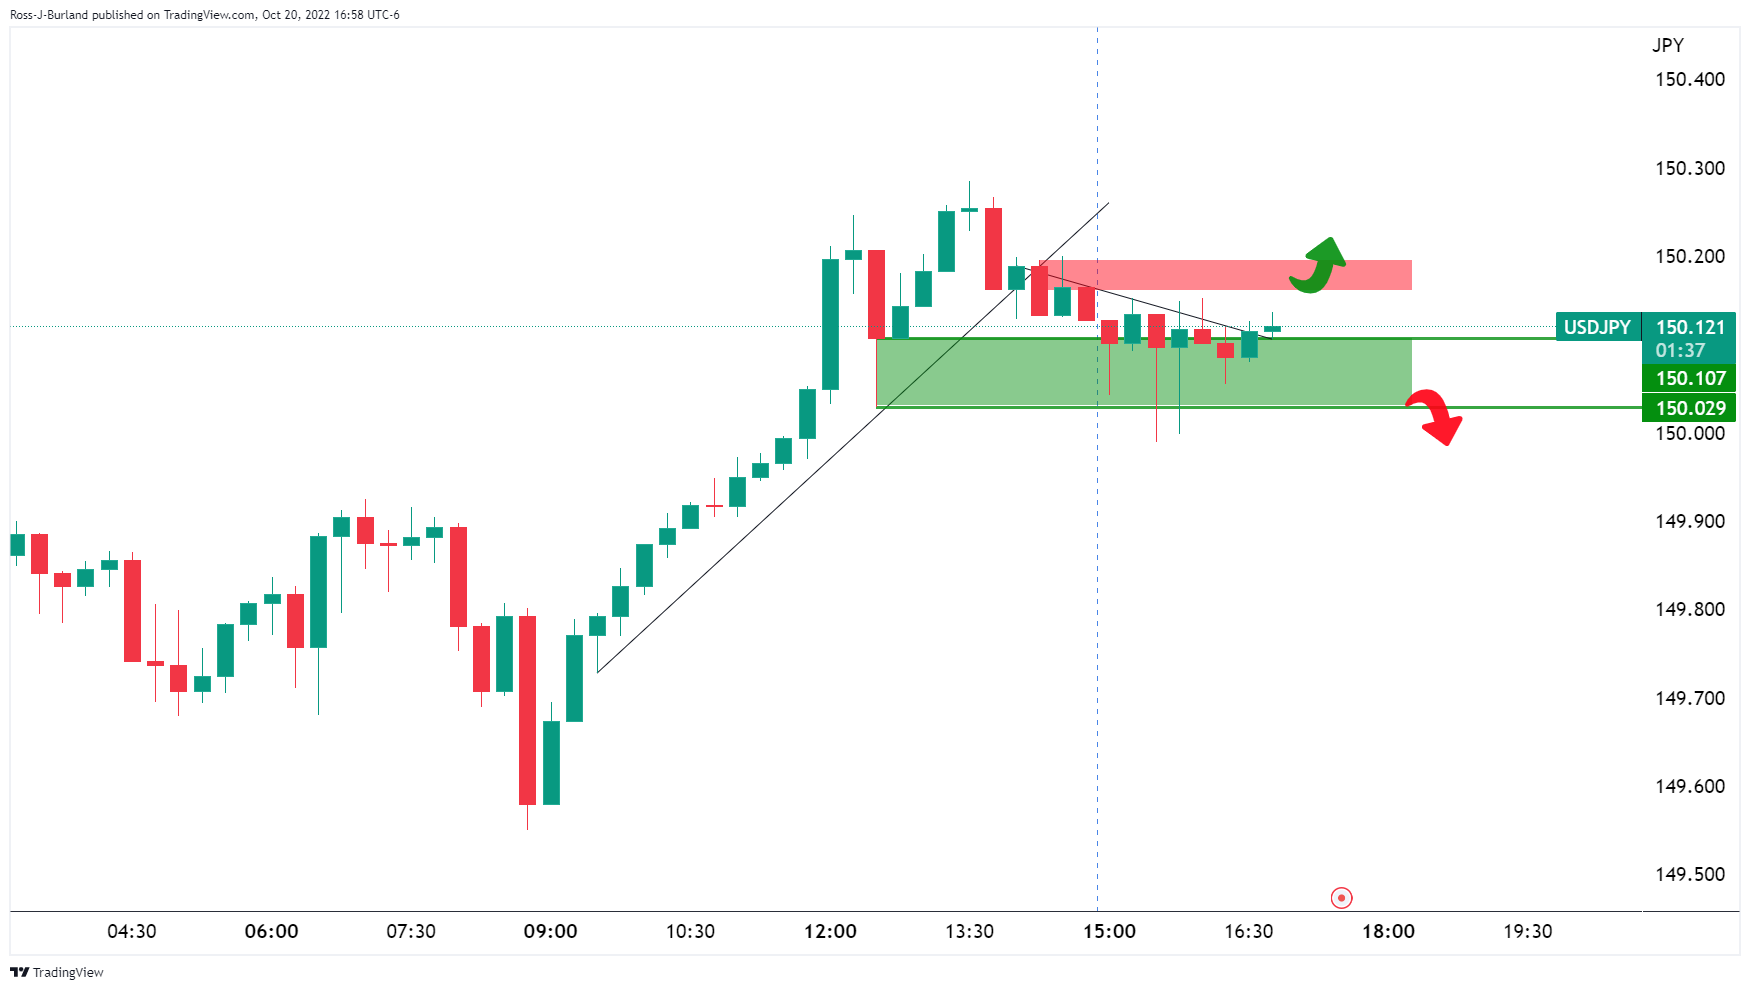
The 15 min chart see the price testing recent support ahead of the Tokyo open. However, a break of 150.00 opens the risk of a significant drop for the day ahead.
USD/JPY H1 update
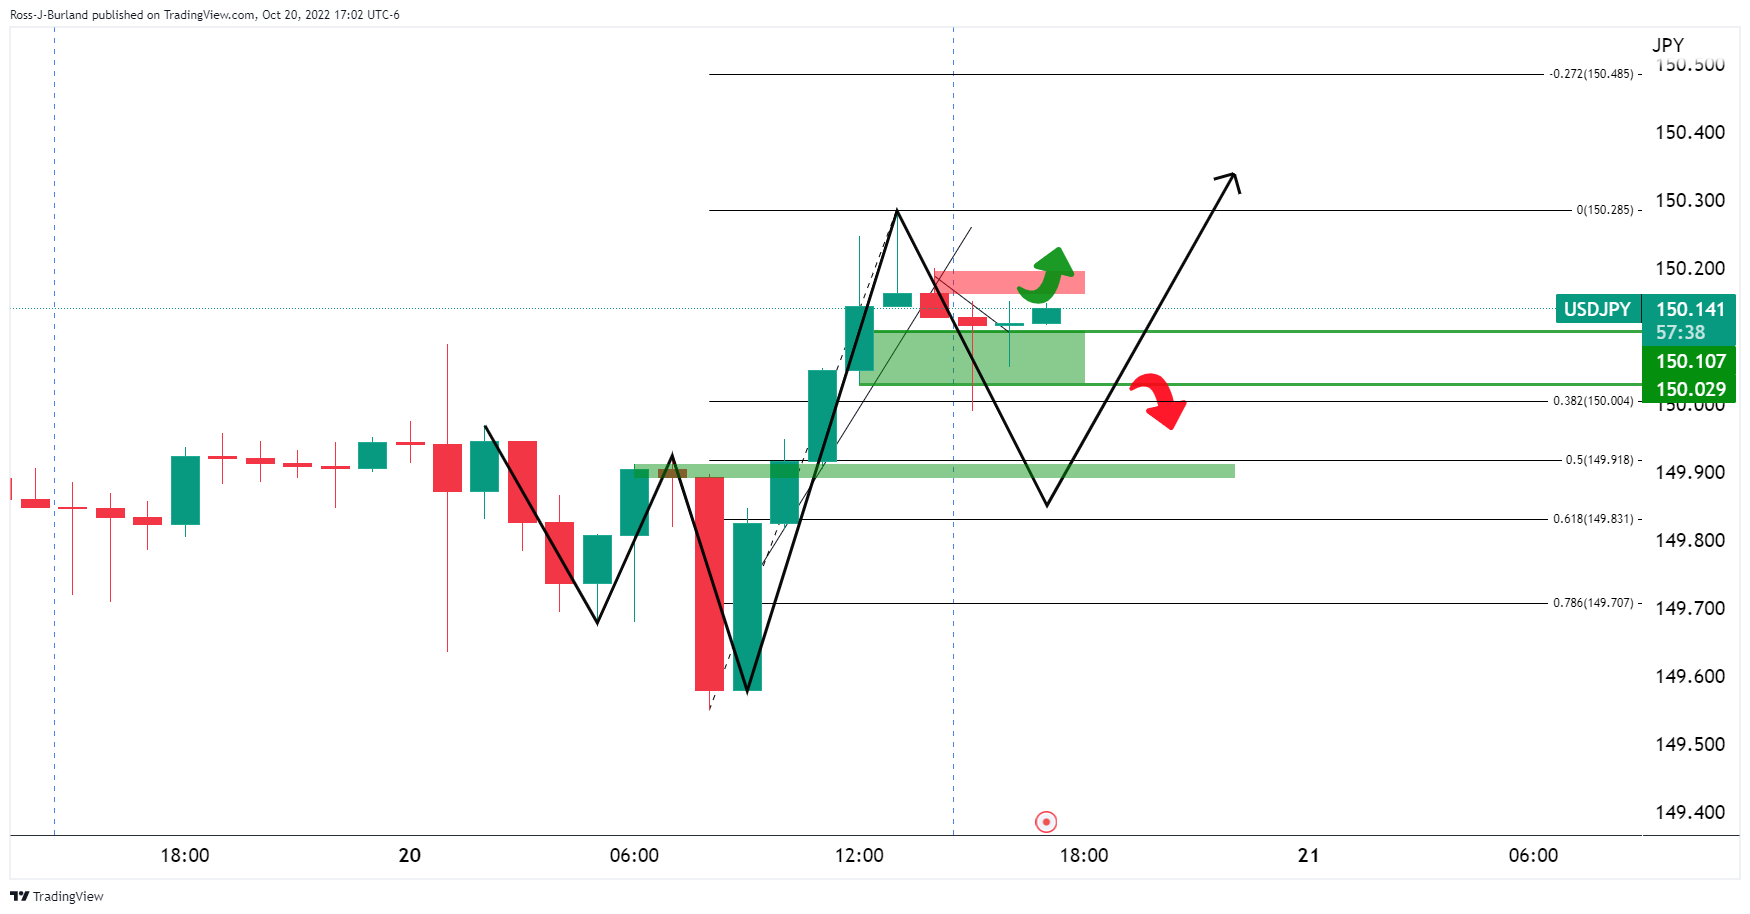
On the hourly chart, the W-formation, which was illustrated prior to this article below, is starting to play out as seen above. This is a reversion pattern.

As seen, there was a 100 pip move in the yen which coincided with a hot inflation report from the US and it was suspected to have been BoJ intervention. We saw something similar in Europen markets on Thursday following the test of 150.00.
If the bears commit, then a move to 149.00 may satisfy the BoJ, and indeed exporters will still be locking in the weakest levels seen in decades at those levels.
USD/JPY daily chart

When the BoJ announced they had intervened after the Federal Reserve raised rates by 75bps, the price moved 500 pips on the day
Meanwhile, we have the 2-year yields soaring:
This is fuelling bullish prospects for the the US dollar:

The confluence of the bullish flag pattern and W-formation, with the correction, supported the neckline meeting a 50% mean reversion and trendline likely give fuel for the bulls.
So markets will be wary of further intervention from the Bank of Japan that could come soon considering the time of the month (last intervened a month ago)and the Fed at the start of November, one trading week away.
-
00:17
EUR/USD Price Analysis: Stays pressured near 0.9760 support confluence
- EUR/USD retreats towards the short-term key support while paring the first weekly gain in three.
- Convergence of 50-SMA, monthly support line restrict immediate downside.
- Downbeat oscillators, pullback from 200-SMA favor bears targeting one-month-old horizontal support.
EUR/USD consolidates the first weekly gain in three as sellers approach 0.9760 support confluence during Friday’s Asian session. In doing so, the major currency pair reverses the previous day’s recovery moves amid bearish MACD signals and steady RSI (14).
That said, 50-SMA joins an upward-sloping trend line from September 28 to restrict the immediate downside of the EUR/USD pair, a break of which could quickly drag the quote towards a horizontal area comprising multiple lows marked since September 23, near 0.9680-70.
In a case where EUR/USD bears keep the reins past 0.9670, the odds of witnessing a fresh 2022 low, currently around 0.9535, can’t be ruled out. In that case, the 0.9600 and the 0.9500 round figures may act as extra downside filters.
Alternatively, EUR/USD recovery remains elusive unless the quote crosses the 0.9850-55 resistance confluence including the 200-SMA and a six-week-old resistance line.
Even so, the weekly high of around 0.9875 could act as an extra filter to the north before directing buyers towards the monthly top surrounding the parity level.
Overall, EUR/USD is likely to witness further downside but a clear break of 0.9760 is necessary to convince the pair sellers.
EUR/USD: Four-hour chart
Trend: Further weakness expected
-
00:06
EUR/JPY Price Analysis: Eight-year high above 147.00 kept bulls from testing 149.00
- EUR/JPY retraces from weekly highs around 147.30s, on risk-aversion, due to BoJ’s intervention woes.
- Near-term, the EUR/JPY is neutral biased, though a break above 147.30 will expose 148.00 and beyond; otherwise, a fall under 146.00 is on the cards.
The EUR/JPY consolidates nearby weekly highs, around the 146.80 mark, retracing from YTD highs at 147.29, due to risk-aversion and high US Treasury yields advancing sharply, while Fed hawkish commentary on Thursday, spooked investors as the Federal Reserve gets ready to lift rates to 4%. Therefore, the EUR/JPY is trading at 146.87, below its opening price by a minuscule 0.03%.
EUR/JPY Price Forecast
The EUR/JPY daily chart portrays the pair as upward biased. Worth noting, the cross-currency pair, is reange-bound, trading in the upper 146.00-14730 area, unable to test the 148.00 mark. Of note, EUR buyers were unable to rally to 148.00, probably on fears that the Bank of Japan (BoJ) could intervene in the market, as speculations mounted that on Thursday, they did it. Nevertheless, if those rumors fade, a test to 148.00 is likely, as EUR/JPY buyer eye 150.00.
Short term, the EUR/JPY one-hour chart suggests the pair as range-bound, supported by the confluence of the daily pivot point and the 20-Exponential Moving Average (EMA) at 146.84. Underneath the latter, the 50-EMA flat-slope suggests the pair will remain volatile around the 146.80-147.30 area, but the Relative Strength Index (RSI) aiming lower, about to enter the bearish territory, could open the door for a retest of October 19 lows at 146.07, followed by the October 18, weekly low of 145.81.
On the other hand, if the cross clears the YTDhigh at 147.30, the next resistance is 147.39. Once broken, the following supply areas would be the S2 pivot level at 147.87, followed by the S3 pivot point at 148.44.
EUR/JPY Key Technical Levels
-
00:01
United Kingdom GfK Consumer Confidence above forecasts (-52) in October: Actual (-47)
-
00:01
Ireland Consumer Confidence rose from previous 42.1 to 46.1 in October
-