Notícias do Mercado
-
23:30
Schedule for today, Tuesday, January 29, 2019
Time Country Event Period Previous value Forecast 00:30 Australia National Australia Bank's Business Confidence December 3 07:00 Switzerland Trade Balance December 3.07 07:45 France Consumer confidence January 87 89 14:00 U.S. S&P/Case-Shiller Home Price Indices, y/y November 5% 5% 15:00 U.S. Consumer confidence January 128.1 124 19:00 United Kingdom Parliament Brexit Vote 23:50 Japan Retail sales, y/y December 1.4% 0.8% -
21:45
New Zealand: Trade Balance, mln, December 264 (forecast 225)
-
21:25
Major US stock indexes finished trading in negative territory
Major US stock indexes ended the session in the red due to weak forecasts of Caterpillar (CAT) and Nvidia Corp. (NVDA), which were caused by concerns about a slowdown in China, with the result that corporate profits declined significantly.
However, some support for the market provided a message on the completion of the Shatdaun. The Senate and House of Representatives of the US Congress supported the bill providing for the financing of the work of the government and some federal institutions until February 15, which President Trump then signed. At the same time, Trump made it clear that he is ready to partially close the government again or use emergency powers if lawmakers do not provide funds to finance the construction of a wall on the border with Mexico by the middle of next month.
Oil prices fell by about 3% on Monday, and were on the way to the biggest one-day drop in a month. The reason for this was evidence of an even greater increase in US crude supply. Growing oil production in the United States, which reached a record 11.9 million barrels per day at the end of last year, also had a negative effect on sentiment in the oil market, traders said.
Most of the components of DOW finished trading in the red (24 of 30). The growth leader was DowDuPont Inc. (DWDP, + 0.64%). Caterpillar Inc. shares turned out to be an outsider. (CAT, -9.13%).
Almost all sectors of the S & P recorded a decline. The largest decline was in the commodity sector (-1.1%). Only the conglomerate sector grew (+ 0.3%).
At the time of closing:
Dow 24,528.22 -208.98 -0.84%
S & P 500 2,643.85 -20.91 -0.78%
Nasdaq 100 7,085.69 -79.18 -1.11%
-
20:50
Schedule for tomorrow, Tuesday, January 29, 2019
Time Country Event Period Previous value Forecast 00:30 Australia National Australia Bank's Business Confidence December 3 07:00 Switzerland Trade Balance December 3.07 07:45 France Consumer confidence January 87 89 14:00 U.S. S&P/Case-Shiller Home Price Indices, y/y November 5% 5% 15:00 U.S. Consumer confidence January 128.1 124 19:00 United Kingdom Parliament Brexit Vote 23:50 Japan Retail sales, y/y December 1.4% 0.8% -
20:01
DJIA -0.94% 24,505.11 -232.09 Nasdaq -1.16% 7,081.57 -83.29 S&P -0.86% 2,641.80 -22.96
-
17:02
European stocks closed: FTSE 100 -62.12 6747.10 -0.91% DAX -71.48 11210.31 -0.63% CAC 40 -37.24 4888.58 -0.76%
-
15:13
-
14:33
U.S. Stocks open: Dow -1.19%, Nasdaq -1.26%, S&P -1.01%
-
14:31
ECB's Draghi: Weaker Data Reflect Softer External Demand, Some Country-Specific Factors
Uncertainties Relating to Geopolitics, Protectionism Weighing on Sentiment
ECB Stands Ready to Adjust All Its Instruments, as Appropriate
Incoming Information Has Continued to Be Weaker Than Expected
-
14:27
Before the bell: S&P futures -0.64%, NASDAQ futures -0.65%
U.S. stock-index fell on Monday, as investors were disappointed by Caterpillar's (CAT) quarterly earnings.
Global Stocks:
Index/commodity
Last
Today's Change, points
Today's Change, %
Nikkei
20,649.00
-124.56
-0.60%
Hang Seng
27,576.96
+7.77
+0.03%
Shanghai
2,596.98
-4.75
-0.18%
S&P/ASX
-
-
-
FTSE
6,768.75
-40.47
-0.59%
CAC
4,894.62
-31.20
-0.63%
DAX
11,241.20
-40.59
-0.36%
Crude
$52.64
-1.96%
Gold
$1,305.00
+0.06%
-
13:52
Wall Street. Stocks before the bell
(company / ticker / price / change ($/%) / volume)
3M Co
MMM
193.26
-2.64(-1.35%)
7679
ALCOA INC.
AA
28.7
-0.32(-1.10%)
10435
ALTRIA GROUP INC.
MO
44.7
0.46(1.04%)
34878
Amazon.com Inc., NASDAQ
AMZN
1,655.00
-15.57(-0.93%)
46120
AMERICAN INTERNATIONAL GROUP
AIG
43.38
0.20(0.46%)
101
Apple Inc.
AAPL
156.38
-1.38(-0.87%)
223926
AT&T Inc
T
30.68
0.02(0.07%)
20538
Boeing Co
BA
359.6
-4.60(-1.26%)
16920
Caterpillar Inc
CAT
128.9
-7.96(-5.82%)
754991
Chevron Corp
CVX
112
-1.22(-1.08%)
382
Cisco Systems Inc
CSCO
45.92
-0.21(-0.46%)
17307
Citigroup Inc., NYSE
C
63.68
-0.34(-0.53%)
6249
Deere & Company, NYSE
DE
157.5
-4.00(-2.48%)
32302
Exxon Mobil Corp
XOM
71.3
-0.42(-0.59%)
7638
Facebook, Inc.
FB
148.41
-0.60(-0.40%)
91081
Ford Motor Co.
F
8.81
-0.05(-0.56%)
18152
Freeport-McMoRan Copper & Gold Inc., NYSE
FCX
11.18
-0.06(-0.53%)
8138
General Electric Co
GE
9.05
-0.11(-1.20%)
180881
General Motors Company, NYSE
GM
38.43
-0.21(-0.54%)
2059
Goldman Sachs
GS
198.73
-2.01(-1.00%)
4164
Google Inc.
GOOG
1,083.00
-7.99(-0.73%)
1821
Hewlett-Packard Co.
HPQ
22
-0.10(-0.45%)
101
Home Depot Inc
HD
179.4
-1.00(-0.55%)
800
HONEYWELL INTERNATIONAL INC.
HON
140.5
-1.21(-0.85%)
919
Intel Corp
INTC
46.6
-0.44(-0.94%)
83506
International Business Machines Co...
IBM
133.31
-0.66(-0.49%)
4775
International Paper Company
IP
46.9
-0.07(-0.15%)
250
Johnson & Johnson
JNJ
127.36
-0.87(-0.68%)
2385
JPMorgan Chase and Co
JPM
102.92
-0.47(-0.45%)
1686
Merck & Co Inc
MRK
72.96
0.01(0.01%)
1233
Microsoft Corp
MSFT
106.87
-0.30(-0.28%)
165303
Nike
NKE
80.3
-0.31(-0.38%)
3234
Pfizer Inc
PFE
40.6
-0.04(-0.10%)
5397
Procter & Gamble Co
PG
93.3
-0.30(-0.32%)
295
Starbucks Corporation, NASDAQ
SBUX
66.19
-0.90(-1.34%)
9841
Tesla Motors, Inc., NASDAQ
TSLA
292.09
-4.95(-1.67%)
54438
Travelers Companies Inc
TRV
124.8
-0.18(-0.14%)
199
Twitter, Inc., NYSE
TWTR
32.95
0.05(0.15%)
6082755
Visa
V
138.21
-0.46(-0.33%)
10465
Wal-Mart Stores Inc
WMT
96.16
-0.78(-0.80%)
3331
Walt Disney Co
DIS
111
-0.09(-0.08%)
1718
Yandex N.V., NASDAQ
YNDX
32.87
-0.73(-2.17%)
24918
-
13:32
U.S.: Chicago Federal National Activity Index, December 0.27
-
13:23
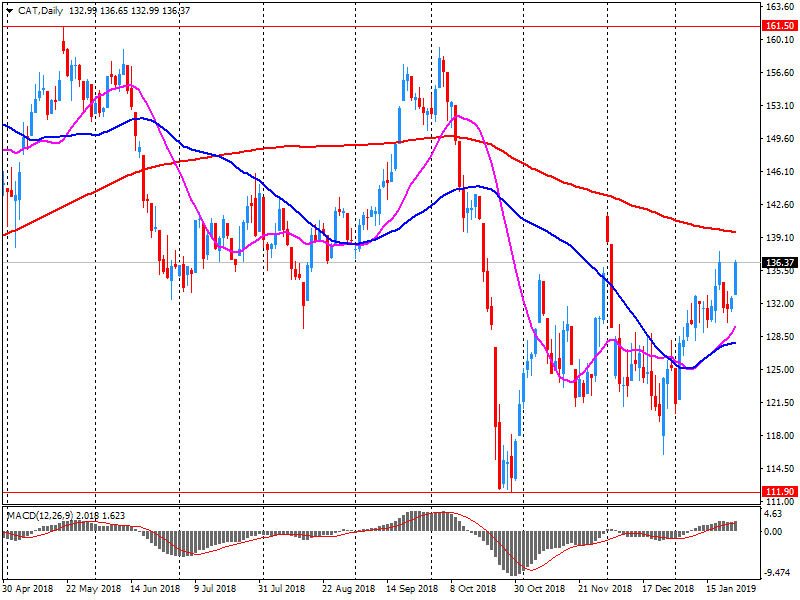
Company News: Caterpillar (CAT) quarterly earnings miss analysts’ expectations
Caterpillar (CAT) reported Q4 FY 2018 earnings of $2.55 per share (versus $2.16 in Q4 FY 2017), missing analysts’ consensus estimate of $2.99.
The company’s quarterly revenues amounted to $14.342 bln (+11.2% y/y), being generally in line with analysts’ consensus estimate of $14.365 bln.
The company also issued downside guidance for FY 2019, projecting EPS of $11.75-12.75versus analysts’ consensus estimate of $12.77.
CAT fell to $129.25 (-5.56%) in pre-market trading.
-
13:06
Earnings Season in U.S.: Major Reports of the Week
January 28
Before the Open:
Caterpillar (CAT). Consensus EPS $2.99, Consensus Revenues $14364.78 mln.
January 29
Before the Open:
3M (MMM). Consensus EPS $2.28, Consensus Revenues $7883.17 mln.
Pfizer (PFE). Consensus EPS $0.63, Consensus Revenues $13956.21 mln.
Verizon (VZ). Consensus EPS $1.08, Consensus Revenues $34445.64 mln.
After the Close:
Advanced Micro (AMD). Consensus EPS $0.09, Consensus Revenues $1448.29 mln.
Apple (AAPL). Consensus EPS $4.17, Consensus Revenues $84023.75 mln.
eBay (EBAY). Consensus EPS $0.68, Consensus Revenues $2866.03 mln.
January 30
Before the Open:
Alibaba (BABA). Consensus EPS $11.52, Consensus Revenues $118657.70 mln.
AT&T (T). Consensus EPS $0.84, Consensus Revenues $48496.29 mln.
Boeing (BA). Consensus EPS $4.55, Consensus Revenues $26763.70 mln.
McDonald's (MCD). Consensus EPS $1.89, Consensus Revenues $5171.09 mln.
After the Close:
Facebook (FB). Consensus EPS $2.17, Consensus Revenues $16392.60 mln.
Microsoft (MSFT). Consensus EPS $1.09, Consensus Revenues $32516.19 mln.
Tesla (TSLA). Consensus EPS $2.21, Consensus Revenues $7077.95 mln.
Visa (V). Consensus EPS $1.25, Consensus Revenues $5411.52 mln.
January 31
Before the Open:
Altria (MO). Consensus EPS $0.95, Consensus Revenues $4819.20 mln.
DowDuPont (DWDP). Consensus EPS $0.88, Consensus Revenues $20911.93 mln.
General Electric (GE). Consensus EPS $0.24, Consensus Revenues $32159.21 mln.
Int'l Paper (IP). Consensus EPS $1.60, Consensus Revenues $5953.40 mln.
MasterCard (MA). Consensus EPS $1.53, Consensus Revenues $3813.88 mln.
After the Close:
Amazon (AMZN). Consensus EPS $5.71, Consensus Revenues $71931.21 mln.
February 1
Before the Open:
Chevron (CVX). Consensus EPS $1.88, Consensus Revenues $43519.80 mln.
Exxon Mobil (XOM). Consensus EPS $1.10, Consensus Revenues $78870.53 mln.
Honeywell (HON). Consensus EPS $1.89, Consensus Revenues $9723.63 mln.
Merck (MRK). Consensus EPS $1.03, Consensus Revenues $10921.03 mln.
-
13:05
UK PM May's Spokesman: Selection Of Amendments In Parliament Is Entirely A Matter For The Speaker - Reuters
Sure He Will Want To Make Sure A Wide Range Of Views Are Considered
-
13:04
U.S treasury yields inched higher on Monday as investors are awaiting billions of fresh bond supply, kicking off a packed week that will include the Federal Reserve's first policy meeting of the year
The 10-year Treasury note yield rose 1.1 basis points to 2.762%, while the 2-year note yield also rose 1.1 basis points to 2.611%. The 30-year bond yield was up 0.9 basis point to 3.070%, according to Tradeweb data. Bond prices move in the opposite direction of yields
-
11:28
-
10:26
EUR/USD will likely continue to trade between 1.13 and 1.15 in the near term, says UniCredit
EUR/USD will likely continue to trade between 1.13 and 1.15 in the near term, says UniCredit, as concerns about the U.S. economy and Federal Reserve policy offset eurozone economic weakness, limiting dollar gains and euro losses. At its Wednesday meeting, the U.S. Federal Reserve is likely to reaffirm "patience on rates and its data dependency," even as U.S. 4Q gross domestic product data the same day should highlight a stronger U.S. economy. On Friday, data revealing weaker eurozone inflation and slower U.S. net job creation "will probably offset each other, likely contributing to prolonging the ongoing EUR/USD deadlock," UniCredit says - via WSJ.
-
09:13
Annual growth rate of the Euro Area broad monetary aggregate M3 increased to 4.1% in December 2018 from 3.7% in November
The annual growth rate of the broad monetary aggregate M3 increased to 4.1% in December 2018 from 3.7% in November, averaging 3.9% in the three months up to December. The components of M3 showed the following developments.
The annual growth rate of the narrower aggregate M1, which comprises currency in circulation and overnight deposits, stood at 6.6% in December, compared with 6.7% in November.
The annual growth rate of short-term deposits other than overnight deposits (M2-M1) was -0.8% in December, compared with -1.0% in November. The annual growth rate of marketable instruments (M3-M2) increased to 0.6% in December from -5.8% in November.
-
09:00
Eurozone: M3 money supply, adjusted y/y, December 4.1% (forecast 3.8%)
-
09:00
Eurozone: Private Loans, Y/Y, December 3.3% (forecast 3.4%)
-
08:39
-
06:27
-
06:26
-
06:20
Options levels on monday, January 28, 2019
EUR/USD
Resistance levels (open interest**, contracts)
$1.1514 (3527)
$1.1494 (650)
$1.1474 (551)
Price at time of writing this review: $1.1407
Support levels (open interest**, contracts):
$1.1368 (4128)
$1.1331 (4452)
$1.1289 (2604)
Comments:
- Overall open interest on the CALL options and PUT options with the expiration date February, 8 is 70754 contracts (according to data from January, 25) with the maximum number of contracts with strike price $1,1700 (4512);
GBP/USD
Resistance levels (open interest**, contracts)
$1.3296 (1433)
$1.3271 (1948)
$1.3246 (1208)
Price at time of writing this review: $1.3194
Support levels (open interest**, contracts):
$1.3068 (396)
$1.2999 (368)
$1.2960 (556)
Comments:
- Overall open interest on the CALL options with the expiration date February, 8 is 23381 contracts, with the maximum number of contracts with strike price $1,3000 (1948);
- Overall open interest on the PUT options with the expiration date February, 8 is 26617 contracts, with the maximum number of contracts with strike price $1,2600 (2016);
- The ratio of PUT/CALL was 1.14 versus 1.14 from the previous trading day according to data from January, 25
* - The Chicago Mercantile Exchange bulletin (CME) is used for the calculation.
** - Open interest takes into account the total number of option contracts that are open at the moment.
-
02:30
Commodities. Daily history for Friday, January 25, 2019
Raw materials Closed Change, % Brent 61.41 0.43 WTI 53.59 0.81 Silver 15.7 2.68 Gold 1299.448 1.46 Palladium 1359.13 2.84 -
00:30
Stocks. Daily history for Friday, January 25, 2019
Index Change, points Closed Change, % NIKKEI 225 198.93 20773.56 0.97 Hang Seng 448.21 27569.19 1.65 KOSPI 32.7 2177.73 1.52 ASX 200 39.9 5905.6 0.68 FTSE 100 -9.73 6809.22 -0.14 DAX 151.61 11281.79 1.36 CAC 40 53.86 4925.82 1.11 Dow Jones 183.96 24737.2 0.75 S&P 500 22.43 2664.76 0.85 NASDAQ Composite 91.4 7164.86 1.29 -
00:15
Currencies. Daily history for Friday, January 25, 2019
Pare Closed Change, % AUDUSD 0.71827 1.29 EURJPY 125.001 0.85 EURUSD 1.14135 0.96 GBPJPY 144.679 1.03 GBPUSD 1.32103 1.13 NZDUSD 0.68477 1.29 USDCAD 1.32243 -0.96 USDCHF 0.99246 -0.37 USDJPY 109.515 -0.1 -