Notícias do Mercado
6 dezembro 2017
-
23:26
Commodities. Daily history for Dec 06’2017:
(raw materials / closing price /% change)
Oil 57.73 -0.45%
Gold 1,295.00 +0.01%
-
11:05
Crude Oil (WTI) 4-hour time frame chart
On 4-hour time frame chart we can see that the price has broken the upside trend line and it has tested below the trend and after that test, the price started a new bearish movement.
If the bearish movement confirms, then we might expect a further depreciation on Crude Oil close to 61.8 fibonnaci levels (blue rectangle)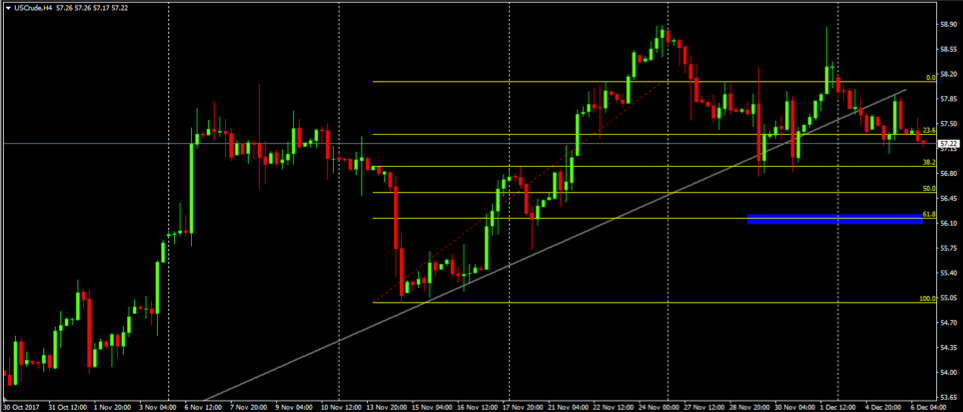
-
O foco de mercado
Abrir Conta Demo e Página Pessoal