Notícias do Mercado
15 fevereiro 2018
-
23:28
Currencies. Daily history for Feb 15’2018:
(raw materials / closing price /% change)
Oil 61.42 +1.35%
Gold 1,356.30 -0.13%
-
17:39
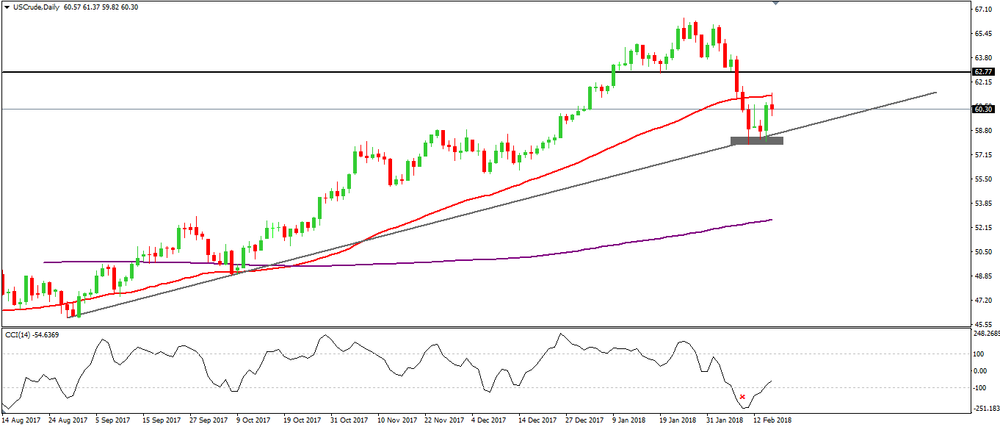
Crude oil analysis
On daily time frame chart, we can see that the price is giving signals of rejections of more downside movements.
If we look to CCI indicator we can see that the price is "oversold" and when it breaks the EMA 50 we might have an opportunity to go long again on Crude oil
-
O foco de mercado
Abrir Conta Demo e Página Pessoal