Notícias do Mercado
-
20:00
DJIA +0.57% 28,372.47 +161.65 Nasdaq +0.22% 11,509.77 +25.07 S&P +0.52% 3,453.50 +17.94
-
17:01
European stocks closed: FTSE 100 5,785.65 +9.15 +0.16% DAX 12,543.06 -14.58 -0.12% CAC 40 4,851.38 -2.57 -0.05%
-
14:34
U.S. Stocks open: Dow +0.25%, Nasdaq +0.47%, S&P +0.28%
-
14:28
Before the bell: S&P futures -0.23%, NASDAQ futures -0.22%
U.S. stock-index futures fell on Thursday, as weekly jobless claims data pointed to a slowing recovery in the U.S. labor market, while stimulus talks dragged on.
Global Stocks:
Index/commodity
Last
Today's Change, points
Today's Change, %
Nikkei
23,474.27
-165.19
-0.70%
Hang Seng
24,786.13
+31.71
+0.13%
Shanghai
3,312.50
-12.52
-0.38%
S&P/ASX
6,173.80
-18.00
-0.29%
FTSE
5,762.68
-13.82
-0.24%
CAC
4,845.45
-8.50
-0.18%
DAX
12,513.56
-44.08
-0.35%
Crude oil
$40.08
+0.12%
Gold
$1,907.00
-1.17%
-
14:11
S&P 500 Index: Another potential reversal pattern reinforces solid floor at 3428 - Credit Suisse
FXStreet reports that analysts at Credit Suisse note that S&P 500 posted another potentially bullish “inverted hammer” candlestick reversal on Wednesday, which reinforces the conviction that the “neckline” to its “head & shoulders” base and the 38.2% retracement of the recent recovery at 3428/18 will hold for a turn back higher.
“The S&P 500 completed another potentially bullish ‘inverted hammer’ candlestick reversal on Wednesday above the ‘neckline’ to its recently completed base at 3428/27 and the 38.2% retracement of the recent recovery at 3420/18. Yet another potential reversal pattern reinforces our view that 3428/18 will provide a solid floor for the uptrend to resume.”
“Resistance stays at 3477, above which would bullishly confirm yesterday’s session for strength back to 3516/18, then 3550, above which would trigger a move back to the 3588/95 high, which is also the upper end of its ‘typical’ extreme (15% above the 200-day average). Whilst this should clearly be respected, we look for a break in due course, with our ‘measured base objective’ at 3653.”
-
13:54
Wall Street. Stocks before the bell
(company / ticker / price / change ($/%) / volume)
ALCOA INC.
AA
13.51
0.19(1.43%)
3429
ALTRIA GROUP INC.
MO
38.49
-0.02(-0.05%)
7701
Amazon.com Inc., NASDAQ
AMZN
3,191.25
6.31(0.20%)
40191
American Express Co
AXP
101.5
0.07(0.07%)
2727
AMERICAN INTERNATIONAL GROUP
AIG
31.7
0.03(0.09%)
451
Apple Inc.
AAPL
117.45
0.58(0.50%)
1301677
AT&T Inc
T
28.06
1.34(5.02%)
2802208
Boeing Co
BA
164.63
0.77(0.47%)
55794
Caterpillar Inc
CAT
167.5
0.10(0.06%)
4095
Chevron Corp
CVX
70.96
0.09(0.13%)
11813
Cisco Systems Inc
CSCO
38.86
-0.20(-0.51%)
69407
Citigroup Inc., NYSE
C
43.04
0.03(0.07%)
47741
E. I. du Pont de Nemours and Co
DD
59
0.34(0.58%)
400
Exxon Mobil Corp
XOM
33.27
0.11(0.33%)
58775
Facebook, Inc.
FB
278
-0.73(-0.26%)
101281
FedEx Corporation, NYSE
FDX
283.6
1.32(0.47%)
20703
Ford Motor Co.
F
7.92
0.07(0.89%)
277686
Freeport-McMoRan Copper & Gold Inc., NYSE
FCX
17.8
0.08(0.45%)
148272
General Electric Co
GE
7.34
0.02(0.27%)
400369
General Motors Company, NYSE
GM
35.88
0.11(0.31%)
51870
Goldman Sachs
GS
203.1
0.19(0.09%)
4865
Google Inc.
GOOG
1,593.69
0.38(0.02%)
6790
Home Depot Inc
HD
283.43
-1.08(-0.38%)
5524
HONEYWELL INTERNATIONAL INC.
HON
172.78
-0.09(-0.05%)
575
Intel Corp
INTC
53.56
0.06(0.11%)
101521
International Business Machines Co...
IBM
115.15
0.09(0.08%)
13776
International Paper Company
IP
46.5
0.02(0.04%)
130
Johnson & Johnson
JNJ
144.25
0.32(0.22%)
1883
JPMorgan Chase and Co
JPM
99.43
0.06(0.06%)
19468
McDonald's Corp
MCD
228.62
0.43(0.19%)
2250
Microsoft Corp
MSFT
214.15
-0.65(-0.30%)
144177
Nike
NKE
129.89
0.46(0.36%)
3133
Pfizer Inc
PFE
37.13
0.05(0.13%)
58868
Procter & Gamble Co
PG
142.19
-0.27(-0.19%)
2907
Starbucks Corporation, NASDAQ
SBUX
88.2
-0.07(-0.08%)
89611
Tesla Motors, Inc., NASDAQ
TSLA
441.36
18.72(4.43%)
1219691
The Coca-Cola Co
KO
51.19
1.20(2.40%)
390769
Travelers Companies Inc
TRV
124
-1.00(-0.80%)
1787
Twitter, Inc., NYSE
TWTR
50.2
-0.04(-0.08%)
53456
UnitedHealth Group Inc
UNH
322.98
0.19(0.06%)
46314
Verizon Communications Inc
VZ
56.93
0.18(0.32%)
57503
Visa
V
199
0.57(0.29%)
3289
Wal-Mart Stores Inc
WMT
144.8
0.40(0.28%)
4029
Walt Disney Co
DIS
126.5
-0.13(-0.10%)
7643
Yandex N.V., NASDAQ
YNDX
58.44
1.22(2.13%)
15632
-
13:46
Upgrades before the market open
Tesla (TSLA) upgraded to Outperform from Neutral at Robert W. Baird; target raised to $488
Tesla (TSLA) upgraded to Mkt Outperform from Mkt Perform at JMP Securities; target $516
-
13:45
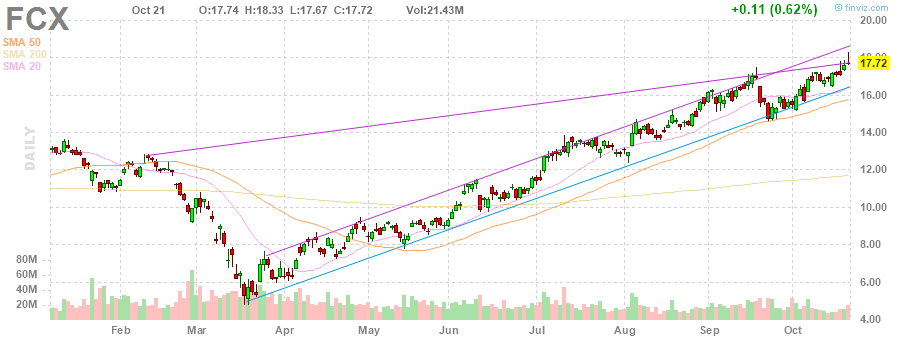
Company News: Freeport-McMoRan (FCX) quarterly results beat analysts’ forecasts
Freeport-McMoRan (FCX) reported Q3 FY 2020 earnings of $0.29 per share (versus $0.01 per share in Q3 FY 2019), beating analysts’ consensus estimate of $0.21 per share.
The company’s quarterly revenues amounted to $3.851 bln (+16.4% y/y), beating analysts’ consensus estimate of $3.676 bln.
FCX rose to $17.80 (+0.45%) in pre-market trading.
-
12:29
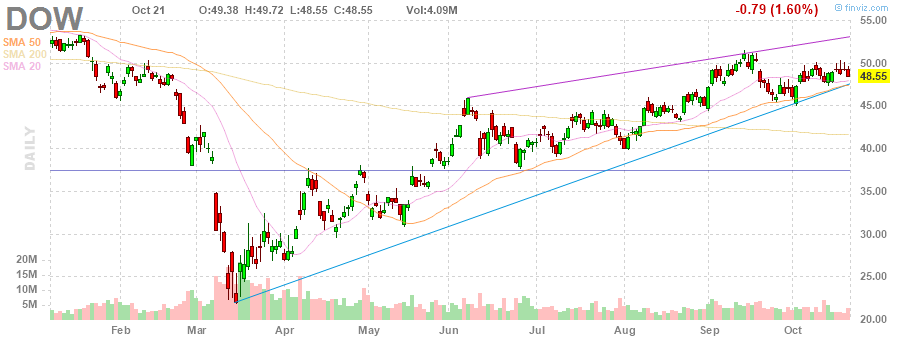
Company News: Dow (DOW) quarterly results beat analysts’ forecasts
Dow (DOW) reported Q3 FY 2020 earnings of $0.50 per share (versus $0.91 per share in Q3 FY 2019), beating analysts’ consensus estimate of $0.29 per share.
The company’s quarterly revenues amounted to $9.712 bln (-9.8% y/y), beating analysts’ consensus estimate of $9.509 bln.
DOW rose to $49.16 (+1.26%) in pre-market trading.
-
12:22
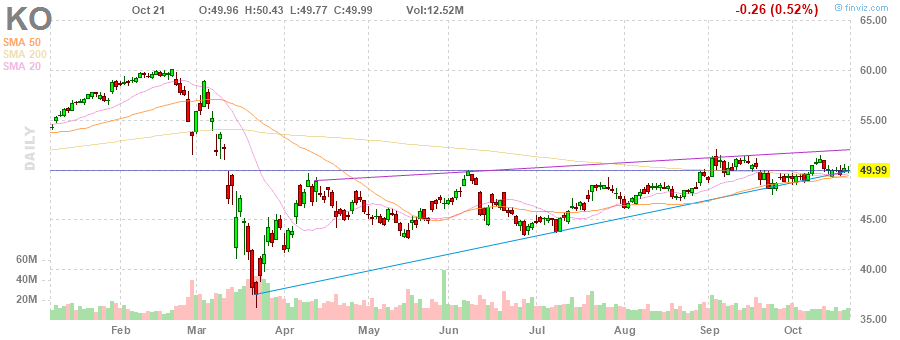
Company News: Coca-Cola (KO) quarterly results beat analysts’ estimates
Coca-Cola (KO) reported Q3 FY 2020 earnings of $0.55 per share (versus $0.56 per share in Q3 FY 2019), beating analysts’ consensus estimate of $0.46 per share.
The company’s quarterly revenues amounted to $8.652 bln (-9.0% y/y), beating analysts’ consensus estimate of $8.366 bln.
KO rose to $50.72 (+1.46%) in pre-market trading.
-
12:15
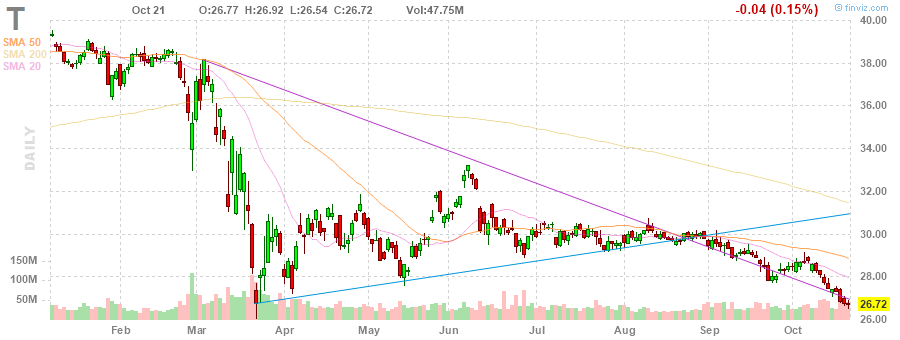
Company News: AT&T (T) quarterly earnings miss analysts’ forecast
AT&T (T) reported Q3 FY 2020 earnings of $0.76 per share (versus $0.94 per share in Q3 FY 2019), missing analysts’ consensus estimate of $0.77 per share.
The company’s quarterly revenues amounted to $42.430 bln (-4.8% y/y), beating analysts’ consensus estimate of $41.659 bln.
T rose to $27.16 (+1.65%) in pre-market trading.
-
12:04
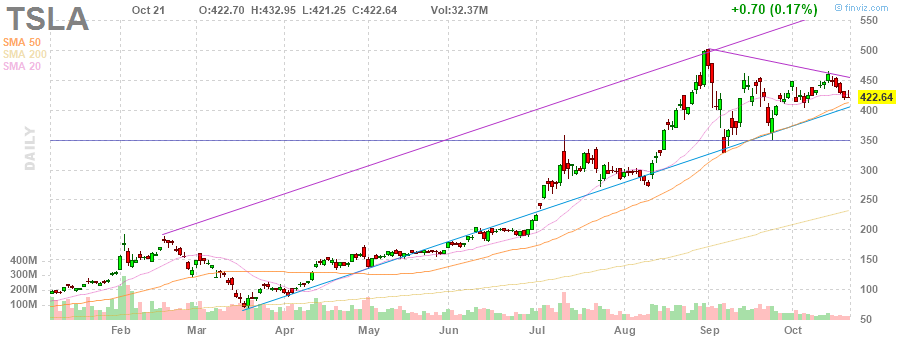
Company News: Tesla (TSLA) quarterly results beat analysts’ expectations
Tesla (TSLA) reported Q3 FY 2020 earnings of $0.76 per share (versus $1.91 per share in Q3 FY 2019), beating analysts’ consensus estimate of $0.60 per share.
The company’s quarterly revenues amounted to $8.771 bln (+39.2% y/y), beating analysts’ consensus estimate of $8.292 bln.
TSLA rose to $443.01 (+4.82%) in pre-market trading.
-
01:30
Stocks. Daily history for Wednesday, October 21, 2020
Index Change, points Closed Change, % NIKKEI 225 72.42 23639.46 0.31 Hang Seng 184.88 24754.42 0.75 KOSPI 12.45 2370.86 0.53 ASX 200 7.2 6191.8 0.12 FTSE 100 -112.72 5776.5 -1.91 DAX -179.31 12557.64 -1.41 CAC 40 -75.33 4853.95 -1.53 Dow Jones -97.97 28210.82 -0.35 S&P 500 -7.56 3435.56 -0.22 NASDAQ Composite -31.8 11484.69 -0.28 -