Notícias do Mercado
-
20:00
DJIA +0.53% 28,644.56 +152.29 Nasdaq +0.38% 11,669.06 +43.72 S&P +0.42% 3,499.02 +14.47
-
17:00
European stocks closed: FTSE 100 5,963.57 -36.42 -0.61% DAX 13,033.20 -63.16 -0.48% CAC 40 5,002.94 -13.03 -0.26%
-
14:32
U.S. Stocks open: Dow +0.29%, Nasdaq +0.54%, S&P +0.31%
-
14:22
Before the bell: S&P futures +0.22%, NASDAQ futures +0.05%
U.S. stock-index futures rose on Friday, as prospects that interest rates would stay low for a prolonged period bolstered risk appetite.
Global Stocks:
Index/commodity
Last
Today's Change, points
Today's Change, %
Nikkei
22,882.65
-326.21
-1.41%
Hang Seng
25,422.06
+140.91
+0.56%
Shanghai
3,403.81
+53.69
+1.60%
S&P/ASX
6,073.80
-52.40
-0.86%
FTSE
5,993.82
-6.17
-0.10%
CAC
5,016.34
+0.37
+0.01%
DAX
13,070.74
-25.62
-0.20%
Crude oil
$43.08
+0.09%
Gold
$1,961.70
+1.51%
-
14:09
S&P 500 moves into a more accelerated phase with next resistance at 3541/43 - Credit Suisse
FXStreet notes that the S&P 500 posted a neutral ‘doji’ on Thursday as the market digested the new Fed policy announcement, however, the Credit Suisse analyst team still believes that the market has entered a more accelerated trend state, with daily RSI momentum remaining above its June peak, reinforcing the move higher. The next major resistance is seen at 3541/43.
“The break above our prior objective at the Fibonacci projection level at 3432/36 and the top of the potential trend channel resistance earlier in the week still suggests the market has entered a more accelerated phase, with daily RSI momentum also remaining above its June peak, reinforcing the break higher.”
“Next resistance is seen at the top of the weekly BollingerBand at 3500/03, then the top of our typical extreme zone (i.e. 15% above the 200- day average) at 3541/44, which is expected to prove a tougher barrier.”
“Support stays at 3468/66 initially, below which would complete a very small intraday top, however, only a break below the uptrend from late June and the 13-day exponential average at 3418/12 would remove the upside bias.”
-
14:02
Wall Street. Stocks before the bell
(company / ticker / price / change ($/%) / volume)
ALCOA INC.
AA
14.98
0.14(0.94%)
6187
ALTRIA GROUP INC.
MO
43.91
0.16(0.37%)
5801
Amazon.com Inc., NASDAQ
AMZN
3,417.80
17.80(0.52%)
33612
American Express Co
AXP
102.23
0.70(0.69%)
1747
AMERICAN INTERNATIONAL GROUP
AIG
29.9
0.22(0.74%)
665
Apple Inc.
AAPL
503.19
3.15(0.63%)
537550
AT&T Inc
T
29.93
0.03(0.10%)
93651
Boeing Co
BA
175.65
1.45(0.83%)
199596
Caterpillar Inc
CAT
142.4
-0.97(-0.68%)
1238
Chevron Corp
CVX
85.22
0.31(0.37%)
6319
Cisco Systems Inc
CSCO
42.1
-0.19(-0.45%)
95637
Citigroup Inc., NYSE
C
52.01
0.29(0.56%)
73700
E. I. du Pont de Nemours and Co
DD
56.8
0.22(0.39%)
1133
Exxon Mobil Corp
XOM
39.9
0.16(0.40%)
60617
Facebook, Inc.
FB
293.3
0.08(0.03%)
105724
FedEx Corporation, NYSE
FDX
219.39
1.18(0.54%)
1521
Ford Motor Co.
F
6.92
0.01(0.15%)
171898
Freeport-McMoRan Copper & Gold Inc., NYSE
FCX
15.2
0.30(2.01%)
50467
General Electric Co
GE
6.53
0.05(0.77%)
360520
General Motors Company, NYSE
GM
29.9
0.21(0.71%)
8816
Goldman Sachs
GS
211.67
1.52(0.72%)
3776
Google Inc.
GOOG
1,636.26
1.93(0.12%)
4031
Hewlett-Packard Co.
HPQ
19.27
0.57(3.05%)
61634
Home Depot Inc
HD
289.8
1.17(0.41%)
5449
HONEYWELL INTERNATIONAL INC.
HON
166.49
0.50(0.30%)
1051
Intel Corp
INTC
49.45
0.05(0.10%)
186532
International Business Machines Co...
IBM
124.83
0.18(0.14%)
10521
Johnson & Johnson
JNJ
153.68
0.70(0.46%)
7011
JPMorgan Chase and Co
JPM
102.92
0.57(0.56%)
28306
McDonald's Corp
MCD
212.21
0.02(0.01%)
3411
Merck & Co Inc
MRK
86.1
0.28(0.33%)
1222
Microsoft Corp
MSFT
227.94
1.36(0.60%)
375706
Nike
NKE
111.18
0.59(0.53%)
1429
Pfizer Inc
PFE
37.88
0.02(0.05%)
27167
Procter & Gamble Co
PG
138.84
0.63(0.46%)
3008
Starbucks Corporation, NASDAQ
SBUX
83.55
0.14(0.17%)
9295
Tesla Motors, Inc., NASDAQ
TSLA
2,299.00
60.25(2.69%)
482849
The Coca-Cola Co
KO
48.6
0.37(0.77%)
89303
Twitter, Inc., NYSE
TWTR
40.5
0.11(0.27%)
9268
Verizon Communications Inc
VZ
59.47
0.04(0.07%)
4653
Visa
V
212.1
1.07(0.51%)
6407
Wal-Mart Stores Inc
WMT
141.35
4.72(3.45%)
430439
Walt Disney Co
DIS
134.8
1.07(0.80%)
22475
Yandex N.V., NASDAQ
YNDX
65.47
0.88(1.36%)
129442
-
13:43
Target price changes before the market open
HP (HPQ) target raised to $20 from $18 at Cowen
-
12:28
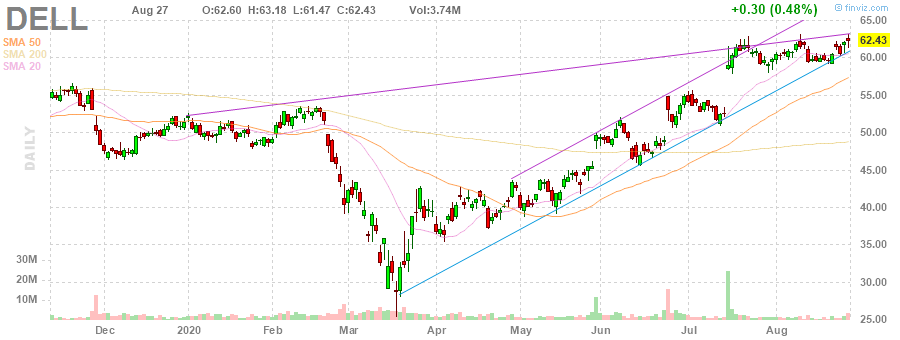
Company News: Dell Technologies Inc. (DELL) quarterly results beat analysts’ forecasts
Dell Technologies Inc. (DELL) reported Q2 FY 2020 earnings of $1.92 per share (versus $2.15 per share in Q2 FY 2019), beating analysts’ consensus estimate of $1.40 per share.
The company’s quarterly revenues amounted to $22.775 bln (-2.9% y/y), beating analysts’ consensus estimate of $22.498 bln.
DELL rose to $64.25 (+2.92%) in pre-market trading.
-
12:09
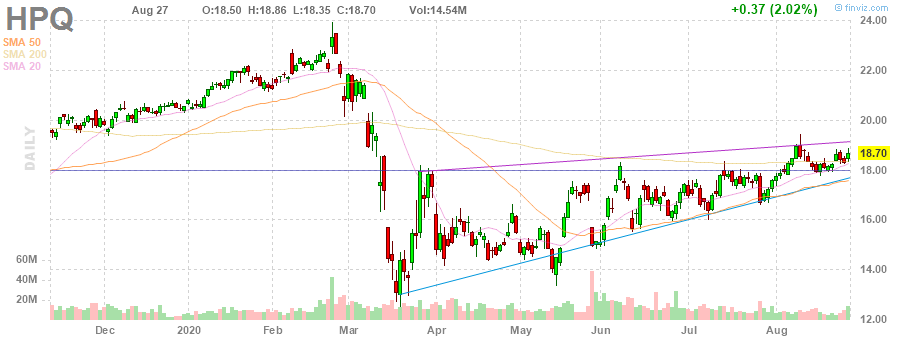
Company News: HP Inc. (HPQ) quarterly results beat analysts’ expectations
HP Inc. (HPQ) reported Q3 FY 2020 earnings of $0.49 per share (versus $0.58 per share in Q3 FY 2019), beating analysts’ consensus estimate of $0.43 per share.
The company’s quarterly revenues amounted to $14.294 bln (-2.1% y/y), beating analysts’ consensus estimate of $13.286 bln.
The company also issued upside guidance for Q4 FY 2020, projecting EPS of $0.50-0.54, versus analysts’ consensus estimate of $0.50.
HPQ rose to $19.30 (+3.21%) in pre-market trading.
-
01:30
Stocks. Daily history for Thursday, August 27, 2020
Index Change, points Closed Change, % NIKKEI 225 -82 23208.86 -0.35 Hang Seng -210.64 25281.15 -0.83 KOSPI -24.87 2344.45 -1.05 ASX 200 9.8 6126.2 0.16 FTSE 100 -45.61 5999.99 -0.75 DAX -93.79 13096.36 -0.71 CAC 40 -32.46 5015.97 -0.64 Dow Jones 160.35 28492.27 0.57 S&P 500 5.82 3484.55 0.17 NASDAQ Composite -39.72 11625.34 -0.34 -