Market news
-
23:50
Japan: Core Machinery Orders, y/y, June 18.6% (forecast 15.8%)
-
23:50
Japan: Core Machinery Orders, June -1.5% (forecast -2.8%)
-
22:45
New Zealand: PPI Output (QoQ) , Quarter II 2.6%
-
22:45
New Zealand: PPI Input (QoQ), Quarter II 3%
-
19:50
Schedule for tomorrow, Wednesday, August 18, 2021
Time Country Event Period Previous value Forecast 01:00 (GMT) Australia Leading Index July -0.07% 01:30 (GMT) Australia Wage Price Index, y/y Quarter II 0.6% 1.9% 01:30 (GMT) Australia Wage Price Index, q/q Quarter II 1.5% 0.6% 02:00 (GMT) New Zealand RBNZ Interest Rate Decision 0.25% 0.5% 03:00 (GMT) New Zealand RBNZ Press Conference 06:00 (GMT) United Kingdom Retail Price Index, m/m July 0.7% 0.3% 06:00 (GMT) United Kingdom Producer Price Index - Output (YoY) July 4.3% 4.4% 06:00 (GMT) United Kingdom Producer Price Index - Input (MoM) July -0.1% 0.5% 06:00 (GMT) United Kingdom Producer Price Index - Input (YoY) July 9.1% 9.1% 06:00 (GMT) United Kingdom Producer Price Index - Output (MoM) July 0.4% 0.4% 06:00 (GMT) United Kingdom Retail prices, Y/Y July 3.9% 3.6% 06:00 (GMT) United Kingdom HICP ex EFAT, Y/Y July 2.3% 06:00 (GMT) United Kingdom HICP, m/m July 0.5% 0.3% 06:00 (GMT) United Kingdom HICP, Y/Y July 2.5% 2.3% 09:00 (GMT) Eurozone Construction Output, y/y June 13.6% 09:00 (GMT) Eurozone Harmonized CPI ex EFAT, Y/Y July 0.9% 0.7% 09:00 (GMT) Eurozone Harmonized CPI July 0.3% -0.1% 09:00 (GMT) Eurozone Harmonized CPI, Y/Y July 1.9% 2.2% 12:30 (GMT) U.S. Building Permits July 1.594 1.61 12:30 (GMT) U.S. Housing Starts July 1.643 1.602 12:30 (GMT) Canada Bank of Canada Consumer Price Index Core, y/y July 2.7% 12:30 (GMT) Canada Consumer Price Index m / m July 0.3% 0.3% 12:30 (GMT) Canada Consumer price index, y/y July 3.1% 3.4% 14:30 (GMT) U.S. Crude Oil Inventories August -0.447 -1.259 18:00 (GMT) U.S. FOMC meeting minutes -
19:03
DJIA -0.99% 35,273.24 -352.16 Nasdaq -1.03% 14,640.75 -153.01 S&P -0.88% 4,440.20 -39.51
-
16:01
European stocks closed: FTSE 100 7,181.11 +27.13 +0.38% DAX 15,921.95 -3.78 -0.02% CAC 40 6,819.84 -18.93 -0.28%
-
15:02
U.S. retail sales retreated in July as spending likely shifted towards services - CIBC
eFXdata reports that analysts at CIBC Research offered their views on today's U.S. retail sales report for July.
"US retail sales retreated in July from well above trend levels, as spending likely shifted towards services during the month. Total retail sales fell by 1.1%, below the consensus expectation for a 0.3% drop. The fall reflected a drop in auto sales, an area that has been challenged by supply chain bottlenecks, as well as large drops in online sales, clothing, and sporting goods. That left the control group of sales (ex. autos, restaurants, gasoline, and building materials), which feeds more directly into goods consumption in GDP, down by 1.0% on the month (vs. -0.2% expected by the consensus)."
"With sales in the control group still 18% above pre-pandemic levels, a further easing off in goods spending ahead is likely as demand shifts to services. However, the spread of the Delta variant poses a downside risk."
-
14:38
U.S. business inventories rise 0.8 percent in June
The Commerce Department announced on Tuesday that business inventories increased 0.8 percent m-o-m in June, following a revised 0.6 percent m-o-m advance in May (originally a 0.5 percent m-o-m gain).
This was in line with economists’ forecast for a 0.8 percent m-o-m rise and marked the biggest monthly gain since October 2020.
According to the report, inventories at wholesalers jumped 1.3 percent m-o-m, while those at manufacturers rose 1.1 percent m-o-m. At the same time, stocks at retailers decreased 0.9 percent m-o-m.
In y-o-y terms, business inventories surged 6.6 percent in June.
-
14:17
U.S. builder confidence unexpectedly declines in August
The National Association of Homebuilders (NAHB) announced on Tuesday its housing market index (HMI) stood at 75 in August, down from 80 in July. This was the lowest reading since July 2020.
Economists had forecast the HMI to remain unchanged at 80.
A reading over 50 indicates more builders view conditions as good than poor.
Two of three HMI components recorded declines this month. The indicator gauging current sales conditions fell 5 points to 81 and the component measuring traffic of prospective buyers also dropped 5 points to 60. Meanwhile, the measure charting sales expectations in the next six held steady at 81.
NAHB Chairman Chuck Fowke noted: “Buyer traffic has fallen to its lowest reading since July 2020 as some prospective buyers are experiencing sticker shock due to higher construction costs. Policymakers need to find long-term solutions to supply-chain issues.”
Meanwhile, NAHB Chief Economist Robert Dietz said: “While the demographics and interest for home buying remain solid, higher costs and material access issues have resulted in lower levels of home building and even put a hold on some new home sales. While these supply-side limitations are holding back the market, our expectation is that production bottlenecks should ease over the coming months and the market should return to more normal conditions.”
-
14:00
U.S.: Business inventories , June 0.8% (forecast 0.8%)
-
14:00
U.S.: NAHB Housing Market Index, August 75 (forecast 80)
-
13:52
U.S. industrial production grows more than forecast in July
The Federal Reserve reported on Tuesday the U.S. industrial production increased 0.9 percent m-o-m in July, following a revised 0.2 percent m-o-m rise in June (originally a 0.4 percent m-o-m advance). This represente the largest monthly gain in industrial production since March.
Economists had forecast industrial production would increase 0.5 percent m-o-m in July.
According to the report, the manufacturing output rose 1.4 percent m-o-m, mainly due to a 11.2 percent m-o-m jump in production of motor vehicles and parts, as a number of vehicle manufacturers trimmed or canceled their typical July shutdowns, though vehicle assemblies continued to be constrained by a persistent shortage of semiconductors. In the meantime, the mining production increased 1.2 percent m-o-m in July, while the output of utilities fell 2.1 percent m-o-m.
Capacity utilization for the industrial sector rose 0.7 percentage point m-o-m to 76.1 percent in July. That was 0.4 percentage points above economists’ forecast but 3.5 percentage points below its long-run (1972-2020) average.
In y-o-y terms, the industrial output surged 6.6 percent in July, following a revised 9.9 percent climb in the prior month (originally a 9.8 percent jump). This was the smallest annual increase in industrial production since March, as the last year's low base effect fades away.
-
13:34
U.S. Stocks open: Dow -0.78%, Nasdaq -0.98%, S&P -0.71%
-
13:21
Before the bell: S&P futures -0.42%, NASDAQ futures -0.53%
U.S. stock-index futures declined on Tuesday, as worse-than-feared U.S. retail sales data for July increased growth concerns.
Global Stocks:
Index/commodity
Last
Today's Change, points
Today's Change, %
Nikkei
27,424.47
-98.72
-0.36%
Hang Seng
25,745.87
-435.59
-1.66%
Shanghai
3,446.98
-70.37
-2.00%
S&P/ASX
7,511.00
-71.50
-0.94%
FTSE
7,170.26
+16.28
+0.23%
CAC
6,810.82
-27.95
-0.41%
DAX
15,912.59
-13.14
-0.08%
Crude oil
$67.08
-0.31%
Gold
$1,791.60
+0.10%
-
13:17
U.S.: Industrial Production YoY , July 6.6%
-
13:15
U.S.: Capacity Utilization, July 76.1% (forecast 75.7%)
-
13:15
U.S.: Industrial Production (MoM), July 0.9% (forecast 0.5%)
-
12:58
Wall Street. Stocks before the bell
(company / ticker / price / change ($/%) / volume)
3M Co
MMM
202
-0.32(-0.16%)
4608
ALCOA INC.
AA
42.79
-0.63(-1.45%)
12009
ALTRIA GROUP INC.
MO
48.3
-0.09(-0.19%)
31705
Amazon.com Inc., NASDAQ
AMZN
3,282.25
-16.74(-0.51%)
21591
American Express Co
AXP
164
-1.75(-1.06%)
9873
AMERICAN INTERNATIONAL GROUP
AIG
54.25
-0.36(-0.66%)
6845
Apple Inc.
AAPL
150.53
-0.59(-0.39%)
1442902
AT&T Inc
T
28.08
-0.12(-0.43%)
70349
Boeing Co
BA
226.61
-2.45(-1.07%)
43414
Caterpillar Inc
CAT
217
-0.71(-0.33%)
8100
Chevron Corp
CVX
100.58
-0.34(-0.34%)
36166
Cisco Systems Inc
CSCO
56.09
-0.19(-0.34%)
40913
Citigroup Inc., NYSE
C
71.45
-0.65(-0.90%)
39503
Deere & Company, NYSE
DE
379
-4.03(-1.05%)
4454
Exxon Mobil Corp
XOM
55.59
-0.35(-0.63%)
84191
Facebook, Inc.
FB
364.8
-1.76(-0.48%)
70850
FedEx Corporation, NYSE
FDX
280.1
-1.56(-0.55%)
2914
Ford Motor Co.
F
13.29
-0.17(-1.26%)
376711
Freeport-McMoRan Copper & Gold Inc., NYSE
FCX
35.91
-0.93(-2.52%)
61906
General Electric Co
GE
102.81
-0.54(-0.52%)
28267
General Motors Company, NYSE
GM
52
-0.95(-1.79%)
114164
Goldman Sachs
GS
406.01
-2.34(-0.57%)
8520
Google Inc.
GOOG
2,763.11
-15.21(-0.55%)
7544
Home Depot Inc
HD
324.21
-10.84(-3.24%)
167419
HONEYWELL INTERNATIONAL INC.
HON
232.76
-0.98(-0.42%)
6232
Intel Corp
INTC
53.27
-0.20(-0.37%)
67214
International Business Machines Co...
IBM
143.19
-0.40(-0.28%)
7759
Johnson & Johnson
JNJ
176.67
-1.17(-0.66%)
19044
JPMorgan Chase and Co
JPM
157.85
-1.08(-0.68%)
41654
McDonald's Corp
MCD
240.69
-0.28(-0.12%)
6031
Merck & Co Inc
MRK
77.7
-0.23(-0.30%)
26530
Microsoft Corp
MSFT
293.03
-1.57(-0.53%)
197348
Nike
NKE
171.24
-1.12(-0.65%)
13880
Pfizer Inc
PFE
48.67
-0.24(-0.49%)
317296
Procter & Gamble Co
PG
144.71
0.07(0.05%)
18087
Starbucks Corporation, NASDAQ
SBUX
116.95
-0.59(-0.50%)
13267
Tesla Motors, Inc., NASDAQ
TSLA
671.86
-14.31(-2.09%)
277862
The Coca-Cola Co
KO
57.38
-0.10(-0.17%)
45241
Twitter, Inc., NYSE
TWTR
63.11
-0.67(-1.05%)
20247
UnitedHealth Group Inc
UNH
415.64
-1.57(-0.38%)
6287
Verizon Communications Inc
VZ
55.89
-0.09(-0.16%)
43311
Visa
V
234.9
-0.46(-0.20%)
8384
Wal-Mart Stores Inc
WMT
151.1
0.35(0.23%)
633746
Walt Disney Co
DIS
177.75
-1.35(-0.75%)
27811
Yandex N.V., NASDAQ
YNDX
69.49
-0.02(-0.03%)
350
-
12:55
Initiations before the market open
American Intl (AIG) initiated with an Outperform at Wolfe Research; target $63
Travelers (TRV) initiated with an Outperform at Wolfe Research; target $180
-
12:49
U.S. retail sales decrease more than anticipated in July
The Commerce Department reported on Tuesday the sales at U.S. retailers dropped 1.1 percent m-o-m in July, following a revised 0.7 percent m-o-m advance in June (originally a 0.6 percent m-o-m increase).
Economists had expected total sales would fall 0.3 percent m-o-m in July.
According to the report, most of the July decline came from lower sales at motor vehicles and parts dealers (-3.9 percent m-o-m).
Excluding auto, retail sales declined 0.4 percent m-o-m in July after a revised 1.6 percent m-o-m climb in the previous month (originally a 1.3 percent m-o-m increase), being worse than economists’ forecast of a 0.1 percent m-o-m gain.
Meanwhile, closely watched core retail sales, which exclude automobiles, gasoline, building materials and food services, and are used in GDP calculations, decreased 1.0 percent m-o-m in July after a revised 1.4 percent m-o-m rise in June (originally a 1.1 percent m-o-m advance).
In y-o-y terms, the U.S. retail sales climb 15.8 percent in July after a revised 18.7 percent jump in the previous month (originally an 18.0 percent surge).
-
12:32
U.S.: Retail Sales YoY, July 15.78%
-
12:30
U.S.: Retail sales excluding auto, July -0.4% (forecast 0.1%)
-
12:30
U.S.: Retail sales, July -1.1% (forecast -0.2%)
-
12:30
Canada: Foreign Securities Purchases, June 19.63
-
12:25
Canada’s housing starts decline more than expected in July
The Canada Mortgage and Housing Corp. (CMHC) reported on Tuesday the seasonally adjusted annual rate of housing starts was at 272,176 units in July, down 3.2 percent from a downwardly revised 281,200 units in June (originally 282,070 units). This was the lowest reading since December 2020.
Economists had forecast an annual pace of 275,000 for July.
According to the report, urban starts dropped by 0.7 percent m-o-m last month to 249,001 units, as multiple urban starts declined by 3.1 percent m-o-m to 184,759 units, while single-detached urban starts surged 7.1 percent m-o-m to 64,242 units. At the same time, rural starts were estimated at a seasonally adjusted annual rate of 23,175 units.
-
12:13
Canada: Housing Starts, July 272.2 (forecast 275)
-
12:08
European session review: USD appreciates, as demand for safe havens persists amid heightened growth concerns
Time Country Event Period Previous value Forecast Actual 06:00 United Kingdom Average earnings ex bonuses, 3 m/y June 6.6% 7.4% 7.4% 06:00 United Kingdom Average Earnings, 3m/y June 7.4% 8.6% 8.8% 06:00 United Kingdom ILO Unemployment Rate June 4.8% 4.8% 4.7% 06:00 United Kingdom Claimant count July -114.8 -7.8 09:00 Eurozone Employment Change Quarter II -0.2% 0.5% 0.5% 09:00 Eurozone GDP (YoY) Quarter II -1.3% 13.7% 13.6% 09:00 Eurozone GDP (QoQ) Quarter II -0.3% 2% 2% USD rose against most of its major rivals in the European session on Tuesday, as demand for safe-haven currencies remained strong amid heightened growth concerns, many of which stem from the effects of the highly contagious delta variant of COVID-19 on global supply chains.
The U.S. Dollar Index (DXY), measuring the U.S. currency's value relative to a basket of foreign currencies, went up 0.13% to 92.75.
Market participants also awaited the speech of the Federal Reserve Chairman Jerome Powell at a virtual event later today, hoping to receive clues on the timing of changes to its $120 billion in monthly bond purchases. CNBC reported on Monday that the Fed could begin tapering its bond purchases as soon as October, depending on the U.S. employment report for August. Boston Fed president Eric Rosengren also confirmed yesterday that another strong labor market report "would be supportive of announcing in September that we are ready to start the taper program.”
In addition, investors looked for the U.S. retail sales data for July, set to be released at 12:30 GMT. Economists expect the data to show retail sales fell 0.3% m/m last month after a 0.6% m/m increase in June.
-
11:39
S&P 500 Index to decline 10% and end the year at the 4000 level - Morgan Stanley
FXStreet reports that Mike Wilson, Chief Investment Officer and Chief US Equity Strategist for Morgan Stanley, expects a greater than 10% correction in the S&P 500 Index in the coming months.
“We are raising our earnings forecast after the strong 2Q results and we now expect $205 per share for the S&P 500 and 2021. We're not as bullish on earnings growth for 2022 as the consensus given our view there will be payback in demand and profitability.”
“The combination of lower than consensus earnings next year and lower valuation leads us to believe there is very little upside, if any, to major US equity indices over the next few quarters. In fact, our S&P 500 target price for year end is 4000, which is 10% below current levels. Between here and there, we expect a greater than 10% correction.”
“The recovery is well underway, and we think the Delta variant will prove to be manageable as vaccines and natural herd immunity allow for us to fend off further lockdowns. This is well understood by markets and now expectations may be a bit too high on earnings growth leaving valuations vulnerable in the short term.”
-
11:17
NZD/USD: RBNZ to reverse the downtrend triggered by weak Chinese data - ANZ
FXStreet notes that the kiwi is struggling under the weight of softer global sentiment but economists at ANZ Bank think that could all change tomorrow if the Reserve Bank of New Zealand (RBNZ) delivers an upbeat MPS.
“It’s difficult to pinpoint the exact catalyst, but the going seemed to get tougher for the kiwi following weaker Chinese data yesterday.”
“The next few days are all likely to be about the RBNZ. We’ve discussed this at length – a hike is coming – it’s just a question of how big, and how many are projected to follow it. That will in turn put carry back on the table for the NZD, and it’s this that could suddenly be the focus, not just for spot markets, but for bond investors too. Buckle in for the ride.”
“Support 0.6760/0.6900 Resistance 0.7100/0.7170.”
-
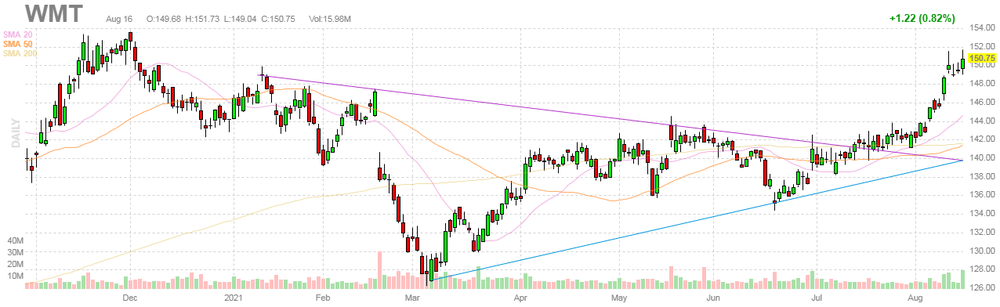
11:11
Company News: Walmart (WMT) quarterly results beat analysts’ estimates
Walmart (WMT) reported Q2 FY 2022 earnings of $1.78 per share (versus $1.56 per share in Q2 FY 2021), beating analysts’ consensus estimate of $1.57 per share.
The company’s quarterly revenues amounted to $141.000 bln (+2.4% y/y), beating analysts’ consensus estimate of $136.065 bln.
WMT fell to $148.44 (-1.53%) in pre-market trading.
-
10:54
USD/JPY: Extra losses seen below 109.00 - UOB
FXStreet reports that in the opinion of FX Strategists at UOB Group, USD/JPY could extend the drop to the 108.70 area if 109.00 is cleared in the near term.
24-hour view: “We highlighted yesterday that USD ‘could weaken further to 109.25’. We added, ‘the next support at 109.00 is unlikely to come into the picture’. While our view for USD to weaken was not wrong, USD easily took out 109.25 as it dropped to 109.10. While oversold, the weakness has room to test 109.00 first before stabilization can be expected. For today, a sustained decline below 109.00 is unlikely.”
Next 1-3 weeks: “Yesterday (16 Aug, spot at 109.55), we highlighted that ‘risk has shifted quickly to the downside’ and USD ‘could weaken to 109.00’. USD subsequently dropped to 109.10 before settling on a soft note at 109.23 (-0.31%). There is no change in our view and a break of 109.00 would shift the focus to the month-to-date low near 108.70.”
-
10:37
AUD/USD: Break below 0.7285 to lead to further decline - SocGen
FXStreet notes that AUD/USD has tumbled below 0.73 after the Reserve Bank of Australia's (RBA) Meeting Minutes revealed uncertainty about the economy following covid-related lockdowns. Economists at Société Générale expect the aussie to extend its slump on a break below 0.7285.
“RBA says prepared to act if lockdowns stall economic recovery.”
“AUD/USD has reached downside projections near 0.7300/0.7285 however signals of rebound are still not visible.”
“0.7450 caps upside.”
-
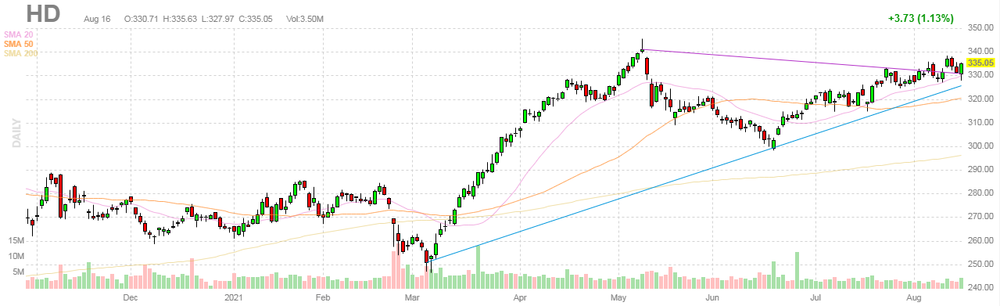
10:26
Company News: Home Depot (HD) quarterly earnings beat analysts’ expectations
Home Depot (HD) reported Q2 FY 2021 earnings of $4.53 per share (versus $4.02 per share in Q2 FY 2020), beating analysts’ consensus estimate of $4.43 per share.
The company’s quarterly revenues amounted to $41.118 bln (+8.1% y/y), roughly in line with analysts’ consensus estimate of $40.738 bln.
HD fell to $318.36 (-4.98%) in pre-market trading.
-
10:17
USD/CNH keeps looking to 6.5000 - UOB
FXStreet reports that UOB Group’s FX Strategists noted USD/CNH could grab further gains once 6.5000 is cleared.
24-hour view: “The muted price actions offer no fresh clues and USD could continue to trade sideways. Expected range for today, 6.4740/6.4860.”
Next 1-3 weeks: “We have held the same since last Tuesday (10 Aug, spot at 6.4830) where USD ‘has to close above the major resistance at 6.5000 before a sustained advance can be expected’. There is no change in our view for now but USD has to move above 6.5000 within these few days or a break of 6.4650 would indicate that the current build-up in momentum has fizzled out.”
-
09:58
U.S. retail sales likely dipped in July
CNBC reports that retail sales were expected to have fallen off in July, as consumers reacted to the delta variant of Covid and held off on online and vehicle purchases.
Economists expect retail sales fell by 0.3% in July, compared to a 0.6% gain in June. Excluding autos, sales were expected to have gained 0.2%, after a 1.3% gain in the month of June.
The data will be released just days after University of Michigan consumer sentiment fell to the lowest level since 2011 on concerns about Covid and the impact on the economy.
However, Bank of America economists expect the decline in sales could look even more ominous, with a 2.3% month-over-month decline. The economists use Bank of America credit card data in their sales analysis, and they also expect the report to show a bigger decline than normal since July has included Prime Day sales in the past. This year, Amazon’s Prime Day was early, on June 22.
-
09:39
New Zealand: Fundamental factors set to lift the kiwi – Westpac
FXStreet reports that economists at Westpac discuss NZD prospects.
“The New Zealand economy is outperforming most of its peers. And, reflecting this outperformance, the RBNZ is poised to lift the OCR in advance of other key central banks. As a result, interest rate differentials should provide a tailwind for the NZD, and we have upgraded our NZD forecast over coming quarters despite an initially lower starting point.”
“We expect that red hot commodity prices will continue to provide support to the NZD. The stronger outlook for the NZ economy has led us to upgrade our forecast for the NZD/AUD cross. Like the USD story, New Zealand is facing greater capacity pressures compared to Australia. Part of this has been our success in containing covid, which has supported a faster recovery in activity. The RBNZ is currently more hawkish than the RBA as it has already tightened some aspects of monetary policy, and is expected to increase interest rates in the next few reviews.”
-
09:20
Eurozone: GDP up by 2.0% and employment up by 0.5% in the second quarter
According to a flash estimate published by Eurostat, in the second quarter of 2021, seasonally adjusted GDP increased by 2.0% in the euro area and by 1.9% in the EU, compared with the previous quarter. In the first quarter of 2021, GDP had declined by 0.3% in the euro area and 0.1% in the EU.
Compared with the same quarter of the previous year, seasonally adjusted GDP increased by 13.6% in the euro area and by 13.2% in the EU in the second quarter of 2021, after -1.3% in both zones in the previous quarter
During the second quarter of 2021, GDP in the United States increased by 1.6% compared with the previous quarter (after +1.5% in the first quarter of 2021). Compared with the same quarter of the previous year, GDP increased by 12.2% (after +0.5% in the previous quarter).
The number of employed persons increased by 0.5% in the euro area and by 0.6% in the EU in the second quarter of 2021, compared with the previous quarter. In the first quarter of 2021, employment had decreased by 0.2% in both the euro area and the EU. Compared with the same quarter of the previous year, employment increased by 1.8% in both the euro area and in the EU in the second quarter of 2021, after -1.8% and -1.6% respectively in the first quarter of 2021.
-
09:00
Eurozone: Employment Change, Quarter II 0.5% (forecast 0.5%)
-
09:00
Eurozone: GDP (YoY), Quarter II 13.6% (forecast 13.7%)
-
09:00
Eurozone: GDP (QoQ), Quarter II 2% (forecast 2%)
-
08:39
Investors raise cash holdings as European economic outlook darkens - BoFA survey
Reuters reports that BoFA's August survey edition said that less than half of respondents in a monthly fund manager survey expect the European economy to further improve over the next twelve months, marking the lowest proportion since last June.
Cooling growth expectations are mainly due to COVID concerns, with 19% of investors citing the Delta variant as the biggest tail risk to the European economy, closely behind inflation risks and worries about a taper tantrum.
As a result, a net 23% of investors were overweight cash, the highest share in a year, BoFA said.
-
08:19
U.S. treasury yields ebb lower ahead of retail sales data
CNBC reports that U.S. Treasury yields ebbed lower, ahead of the release of July’s retail sales data.
The yield on the benchmark 10-year Treasury note fell 2.2 basis points to 1.235%. The yield on the 30-year Treasury bond gave up 1.9 basis points, falling to 1.905%.
The Census Bureau is due to release July’s retail sales data at 12:30 GMT, with an expected slowdown in spending last month amid concerns around the spread of the delta variant. Economists expect retail sales fell by 0.3% in July, compared to a 0.6% gain in June. Excluding autos, sales were expected to have gained 0.2%, after a 1.3% gain in June.
-
07:59
USD to grind higher on a surge in risk aversion and more rapid tightening by the Fed – HSBC
FXStreet reports that economists at HSBC discuss US dollar prospects.
“There are signs that global growth has peaked and is losing some momentum. If we expected the USD to temporarily weaken this year against a still recovering global economy, then the opposite should also hold true.”
“Fed’s plan to taper and its divergent monetary policy stance from other central banks should eventually guide the USD stronger, especially once tapering actually starts.”
“We believe that the slowing global growth and the Fed moving gradually towards monetary policy normalisation should see the USD grinding higher versus most major currencies through the rest of 2021 and into 2022.”
-
07:40
Yuan’s global use faces test as Xi’s reforms rattle markets
Bloomberg reports that the Chinese yuan has been making inroads in the world of cross-border payments in recent years, but a pair of data points due this week will reveal whether the country’s sudden industry crackdowns have dented international trust in the currency.
The Swift and China’s foreign-exchange regulator will both announce figures this week that together paint a picture of the yuan’s role in international trade and investment. Previous data through June showed a steady increase in its use but that was before a regulatory crackdown escalated in July.
The authorities scaled up their anti-monopoly attacks against the nation’s largest technology companies, banned profits in the after-school tutoring industry, and launched a critique of online gaming.
The share of yuan payments via Swift increased to 2.46% in June, just under the peak reached in March that was the highest level since a shock devaluation in August 2015. The percentage of cross-border transactions that were conducted in the currency increased to 42.3% in the same month, close to January’s record high of 43.8%.
Since the devaluation, China has since worked to revive the yuan’s popularity, urging greater use of the currency in trade and easing exchange-rate controls and intervention.
Global funds boosted holdings of Chinese government bonds to a record in July despite that month’s market turmoil, and inflows are expected to continue as some of the securities will be included in FTSE Russell’s flagship global index this October.
-
07:20
Asian session review: the dollar rose against major currencies
Time Country Event Period Previous value Forecast Actual 01:30 Australia RBA Meeting's Minutes 04:30 Japan Tertiary Industry Index June -2.7% 2.3% 06:00 United Kingdom Average earnings ex bonuses, 3 m/y June 6.6% 7.4% 7.4% 06:00 United Kingdom Average Earnings, 3m/y June 7.4% 8.6% 8.8% 06:00 United Kingdom ILO Unemployment Rate June 4.8% 4.8% 4.7% 06:00 United Kingdom Claimant count July -114.8 -7.8 During today's Asian trading, the US dollar rose against most of the world's major currencies.
Traders are looking for opportunities for more reliable investments, trying to avoid risks amid fears that the rapid spread of the new COVID-19 "delta" strain will slow down the pace of global economic recovery. An additional factor limiting the risk appetite on world markets is the situation in Afghanistan, experts say. The economy of Afghanistan is small in volume, but other states were caught off guard by how quickly the government of the country fell.
The ICE index, which tracks the dynamics of the dollar against six currencies (euro, swiss franc, yen, canadian dollar, pound sterling and swedish krona), rose by 0.13%.
The Australian dollar fell by 0.7% against the US dollar, and is trading at lows since November 2020 due to fears that the country's economy will be seriously affected as a result of a new wave of lockdowns.
The Reserve Bank of Australia (RBA) on Tuesday published the minutes of a meeting held earlier this month. According to the document, the heads of RBA noted during the meeting that the new COVID-19 strain "delta" and related restrictive measures suspended the recovery of the country's economy and created serious uncertainty about the prospects for the second half of the year.
At the same time, the RBA leaders noted that the measures already taken by the budget and monetary stimulus are sufficient to mitigate the negative consequences for the economy.
-
06:59
Fed: Tapering by year-end, tightening a long way away – TDS
FXStreet reports that strategists at TD Securities discuss their current outlook as well as some key sources of risk and uncertainty.
“We don't expect the latest COVID-19 wave to have a major growth impact, but there will likely be some fallout. We expect fiscal stimulus to fade to the point of policy turning contractionary on a change basis in FY22, even with another fiscal package. We expect real GDP to slow from a still-very-strong 7% QoQ AR in the current quarter to 4% in Q4 and 2.5% on a Q4/Q4 basis in 2022.!
“We expect sharp slowing in inflation as base and reopening effects fade and the surge in used vehicle prices is partly reversed.”
“We expect enough ‘substantial further progress’ for Fed officials to announce the start of QE tapering before year-end. We forecast a formal tapering announcement in December 2021, with November also possible, but no rate hike until December 2023.”
-
06:42
Australia economic activity, employment to decline in the 3rd quarter - RBA minutes
RTTNews reports that policymakers of the Reserve Bank of Australia said the economic activity and employment were expected to decline in the September quarter as the high transmissibility of the Delta variant raised the possibility of a more gradual reopening.
Nonetheless, members expect the economy to rebound from the current setback later in the year as restrictions are eased, consistent with the previously observed pattern in Australia and overseas.
The current virus outbreaks and lockdowns had interrupted the recovery and many households and businesses were facing difficult conditions, the minutes said. Members therefore considered the case for delaying the tapering of bond purchases to A$4 billion a week currently scheduled for September 2021.
The board repeated that it will not increase the cash rate until actual inflation is sustainably within the 2 to 3 percent target range. The central scenario for the economy is that this condition will not be met before 2024, the board observed.
-
06:32
Options levels on tuesday, August 17, 2021
EUR/USD
Resistance levels (open interest**, contracts)
$1.1848 (1468)
$1.1823 (725)
$1.1806 (175)
Price at time of writing this review: $1.1766
Support levels (open interest**, contracts):
$1.1752 (1355)
$1.1734 (2506)
$1.1708 (2710)
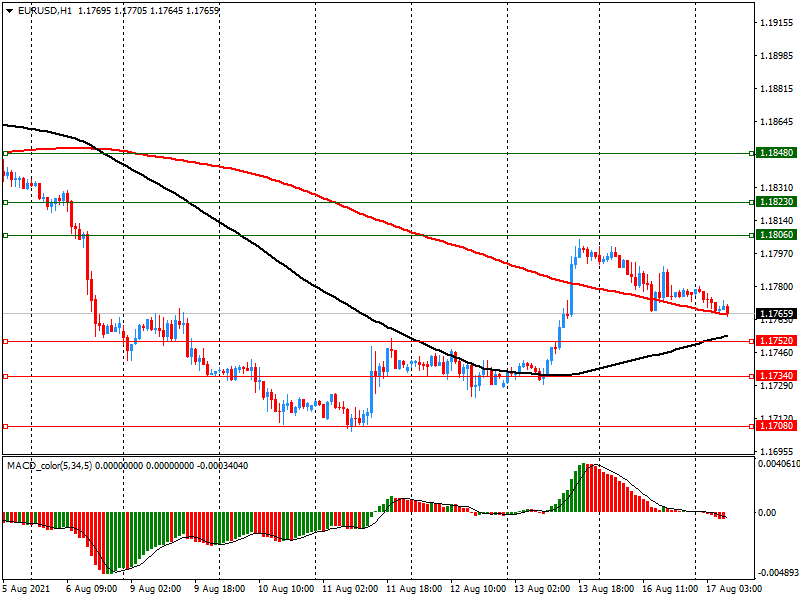
Comments:
- Overall open interest on the CALL options and PUT options with the expiration date September, 3 is 86509 contracts (according to data from August, 16) with the maximum number of contracts with strike price $1,2000 (8362);
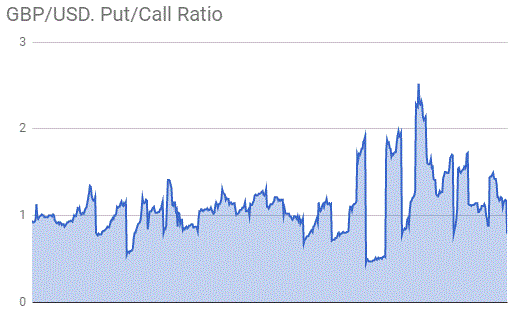
GBP/USD
$1.3945 (555)
$1.3917 (706)
$1.3894 (222)
Price at time of writing this review: $1.3810
Support levels (open interest**, contracts):
$1.3771 (438)
$1.3744 (1128)
$1.3711 (907)
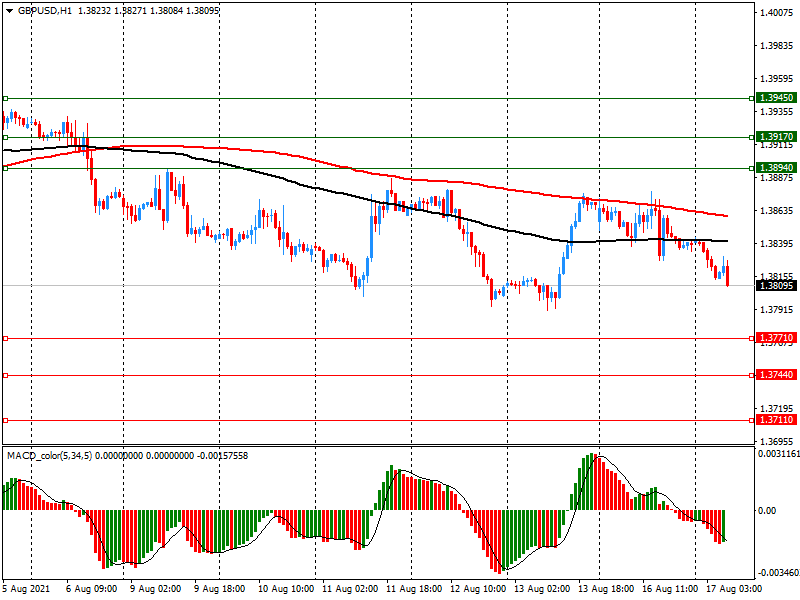
Comments:
- Overall open interest on the CALL options with the expiration date September, 3 is 15930 contracts, with the maximum number of contracts with strike price $1,4300 (2170);
- Overall open interest on the PUT options with the expiration date September, 3 is 13593 contracts, with the maximum number of contracts with strike price $1,3800 (1128);
- The ratio of PUT/CALL was 0.85 versus 0.83 from the previous trading day according to data from August, 16
* - The Chicago Mercantile Exchange bulletin (CME) is used for the calculation.
** - Open interest takes into account the total number of option contracts that are open at the moment.
-
06:21
UK unemployment rate unexpectedly fell from April to June
The Office for National Statistics said that the most recent data show the labour market continuing to recover.
The number of payroll employees showed another monthly increase, up 182,000 to 28.9 million in July 2021. However, it remains 201,000 below pre-coronavirus (COVID-19) pandemic levels.
Following a period of employment growth and low unemployment, since the start of the pandemic, the employment rate has generally decreased, and the unemployment rate increased. However, since the end of 2020, both have shown signs of recovery. In the latest period (April to June 2021), there was a quarterly increase in the employment rate of 0.3 percentage points, to 75.1%, and a decrease in the unemployment rate of 0.2 percentage points, to 4.7%. The economic inactivity rate is down 0.2 percentage points on the previous quarter, to 21.1%.
There were an estimated 953,000 job vacancies in May to July 2021, a record high, having grown by 290,000 compared with the previous quarter and 168,000 more than its pre-pandemic level (January to March 2020).
Growth in average total pay (including bonuses) was 8.8% and regular pay (excluding bonuses) was 7.4% in April to June 2021. However, annual growth in average employee pay is being affected by temporary factors that have inflated the increase in the headline growth rate. These are compositional effects where there has been a fall in the number and proportion of lower-paid employee jobs so increasing average earnings and base effects where the latest months are now compared with low base periods when earnings were first affected by the pandemic.
-
06:01
United Kingdom: Average earnings ex bonuses, 3 m/y, June 7.4% (forecast 7.4%)
-
06:01
United Kingdom: Average Earnings, 3m/y , June 8.8% (forecast 8.6%)
-
06:00
United Kingdom: ILO Unemployment Rate, June 4.7% (forecast 4.8%)
-
06:00
United Kingdom: Claimant count , July -7.8
-
04:33
Japan: Tertiary Industry Index , June 2.3%
-
02:30
Commodities. Daily history for Monday, August 16, 2021
Raw materials Closed Change, % Brent 69.61 -0.74 Silver 23.823 0.35 Gold 1787.038 0.46 Palladium 2602.25 -1.4 -
00:30
Schedule for today, Tuesday, August 17, 2021
Time Country Event Period Previous value Forecast 01:30 (GMT) Australia RBA Meeting's Minutes 04:30 (GMT) Japan Tertiary Industry Index June -2.7% 06:00 (GMT) United Kingdom Average earnings ex bonuses, 3 m/y June 6.6% 7.4% 06:00 (GMT) United Kingdom Average Earnings, 3m/y June 7.3% 8.7% 06:00 (GMT) United Kingdom ILO Unemployment Rate June 4.8% 4.8% 06:00 (GMT) United Kingdom Claimant count July -114.8 09:00 (GMT) Eurozone Construction Output, y/y June 13.6% 09:00 (GMT) Eurozone Employment Change Quarter II -0.3% 09:00 (GMT) Eurozone GDP (YoY) Quarter II -1.3% 13.7% 09:00 (GMT) Eurozone GDP (QoQ) Quarter II -0.3% 2% 12:15 (GMT) Canada Housing Starts July 282.1 12:30 (GMT) Canada Foreign Securities Purchases June 20.79 12:30 (GMT) U.S. Retail sales July 0.6% -0.3% 12:30 (GMT) U.S. Retail Sales YoY July 18.0% 12:30 (GMT) U.S. Retail sales excluding auto July 1.3% 0.2% 13:15 (GMT) U.S. Capacity Utilization July 75.4% 75.7% 13:15 (GMT) U.S. Industrial Production YoY July 9.8% 13:15 (GMT) U.S. Industrial Production (MoM) July 0.4% 0.5% 14:00 (GMT) U.S. NAHB Housing Market Index August 80 80 14:00 (GMT) U.S. Business inventories June 0.5% 0.8% 17:30 (GMT) U.S. Fed Chair Powell Speaks 22:45 (GMT) New Zealand PPI Output (QoQ) Quarter II 1.2% 22:45 (GMT) New Zealand PPI Input (QoQ) Quarter II 2.1% 23:50 (GMT) Japan Core Machinery Orders, y/y June 12.2% 15.8% 23:50 (GMT) Japan Trade Balance Total, bln July 383.2 202.3 23:50 (GMT) Japan Core Machinery Orders June 7.8% -2.8% -
00:15
Currencies. Daily history for Monday, August 16, 2021
Pare Closed Change, % AUDUSD 0.73353 -0.4 EURJPY 128.623 -0.51 EURUSD 1.17749 -0.18 GBPJPY 151.206 -0.43 GBPUSD 1.38401 -0.1 NZDUSD 0.70173 -0.31 USDCAD 1.25709 0.46 USDCHF 0.91185 -0.38 USDJPY 109.242 -0.32 -