Market news
-
23:27
Currencies. Daily history for Mar 08’2017:
(pare/closed(GMT +2)/change, %)
EUR/USD $1,0540 -0,24%
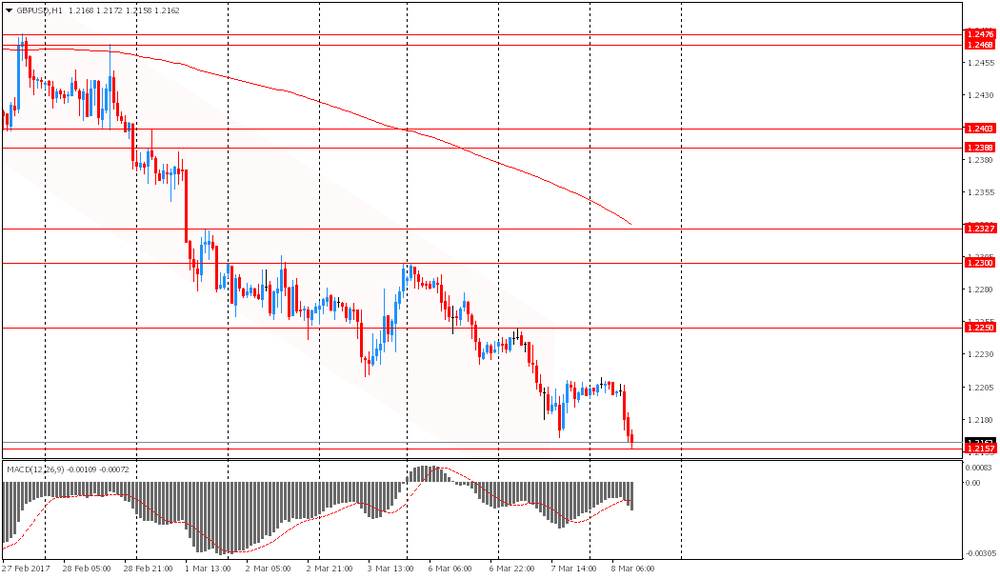
GBP/USD $1,2165 -0,28%
USD/CHF Chf1,0145 +0,14%
USD/JPY Y114,34 +0,32%
EUR/JPY Y120,51 +0,08%
GBP/JPY Y139,09 +0,05%
AUD/USD $0,7525 -0,82%
NZD/USD $0,6912 -0,58%
USD/CAD C$1,3489 +0,58%
-
22:59
Schedule for today,Thursday, Mar 09’2017 (GMT0)
00:00 Japan Labor Cash Earnings, YoY January 0.1% 0.3%
01:30 China PPI y/y February 6.9% 7.7%
01:30 China CPI y/y February 2.5% 1.7%
06:00 Japan Prelim Machine Tool Orders, y/y February 3.5%
06:30 France Non-Farm Payrolls (Finally) Quarter IV 0.3% 0.4%
06:45 Switzerland Unemployment Rate (non s.a.) February 3.7%
12:45 Eurozone ECB Interest Rate Decision 0% 0%
13:30 Eurozone ECB Press Conference
13:30 Canada Capacity Utilization Rate Quarter IV 81.9%
13:30 Canada New Housing Price Index, MoM January 0.1%
13:30 U.S. Continuing Jobless Claims 2066 2060
13:30 U.S. Import Price Index February 0.4% 0.1%
13:30 U.S. Initial Jobless Claims 223 235
23:50 Japan BSI Manufacturing Index Quarter I 7.5 8.4
-
15:37
U.S. commercial crude oil inventories rose over 8 mln barrels
U.S. commercial crude oil inventories (excluding those in the Strategic Petroleum Reserve) increased by 8.2 million barrels from the previous week. At 528.4 million barrels, U.S. crude oil inventories are above the upper limit of the average range for this time of year.
Total motor gasoline inventories decreased by 6.6 million barrels last week, but are near the upper limit of the average range. Both finished gasoline inventories and blending components inventories decreased last week.
Distillate fuel inventories decreased by 2.7 million barrels last week but are near the upper limit of the average range for this time of year. Propane/propylene inventories fell 4.1 million barrels last week but are in the middle of the average range. Total commercial petroleum inventories decreased by 2.4 million barrels last week
-
15:30
U.S.: Crude Oil Inventories, March 8.209 (forecast 1.660)
-
15:09
US wholesale inventories decline more than expected in January
Total inventories of merchant wholesalers, except manufacturers' sales branches and offices, after adjustment for seasonal variations but not for price changes, were $600.0 billion at the end of January, down 0.2 percent from the revised December level. Total inventories are up 2.2 percent from the revised January 2016 level. The December 2016 to January 2017 percent change was revised from the advance estimate of down 0.1 percent to down 0.2 percent.
The January inventories/sales ratio for merchant wholesalers, except manufacturers' sales branches and offices, based on seasonally adjusted data, was 1.29. The January 2016 ratio was 1.37.
-
15:00
U.S.: Wholesale Inventories, January -0.2% (forecast -0.1%)
-
14:47
UK Office for Budget Responsibility expects GDP growth to slow during H1 2017 as inflation squeezes household budgets
-
Consumer spending growth cannot continue to outpace income growth by current margin indefinitely
-
Continues to have "no meaningful basis" to predict precise outcome of UK Brexit talks
-
Revised down forecasts for UK earnings growth from 2019 onwards due to lower profile for inflation and medium-term productivity growth
-
-
13:46
Option expiries for today's 10:00 ET NY cut
EURUSD: 1.0450 (USD 660m) 1.0490 (338m) 1.0500 (242m) 1.0530 (585m) 1.0550 (552m) 1.0580-90 (1bln) 1.0595-1.0605 (1.3bln) 1.0620 (628m) 1.0700 (365m)
USDJPY: 112.25-30 (USD 310m) 113.50-60 (662m) 114.00 (536m) 114.20 (341m) 114.50 (226m) 115.00-10 (573m)
USDCHF: 1.0080 (USD 238m) 1.0135 (180m)
AUDUSD: 0.7600-05 (AUD 392m)
USDCAD: 1.3200 (USD 962m) 1.3400 (192m)
-
13:45
Canadian building permits rose for the first time in 3 months
The value of building permits issued by Canadian municipalities rose 5.4% to $7.6 billion in January, following two consecutive monthly decreases. Six provinces posted increases, led by Alberta and British Columbia. Nationally, construction intentions rose in every component, particularly institutional buildings.
Construction intentions in the non-residential sector rose 11.2% to $2.5 billion in January, following a 10.3% decline in December. Every component increased, led by institutional buildings. Growth was registered in six provinces, with Alberta contributing the most to the gain. British Columbia was a distant second.
The value of building permits issued for institutional structures rose 19.0% to $732 million in January, the second increase in six months. The gain was mainly attributable to six provinces, led by Alberta, moderated by declines in Yukon and Ontario.
-
13:42
US nonfarm business sector labor productivity increased at a 1.3% annual rate
Nonfarm business sector labor productivity increased at a 1.3-percent annual rate during the fourth quarter of 2016, the U.S. Bureau of Labor Statistics reported today, as output increased 2.4 percent and hours worked increased 1.0 percent. (All quarterly percent changes in this release are seasonally adjusted annual rates.) From the fourth quarter of 2015 to the fourth quarter of 2016, productivity increased 1.0 percent, reflecting increases in output and hours worked of 2.2 percent and 1.2 percent, respectively. Annual average productivity increased 0.2 percent from 2015 to 2016.
-
13:30
U.S.: Nonfarm Productivity, q/q, Quarter IV 1.3% (forecast 1.5%)
-
13:30
Canada: Labor Productivity, Quarter IV 0.4%
-
13:30
Canada: Building Permits (MoM) , January 5.4% (forecast 5%)
-
13:30
U.S.: Unit Labor Costs, q/q, Quarter IV 1.7% (forecast 1.6%)
-
13:22
Canadian housing starts rose more tha expected in Feb - Canada Mortgage and Housing Corporation
Housing starts are now on pace to hit 204,669 units in Canada, whereas January saw them hitting 200,255 units, according to Canada Mortgage and Housing Corporation (CMHC). This trend measure is a six-month moving average of the monthly seasonally adjusted annual rates (SAAR) of housing starts.
"This winter has seen Canada's national housing starts trend upward, supported mostly by increased construction of homes in Ontario," said Bob Dugan, CMHC Chief Economist. "New single-detached home construction in Ontario is reaching levels not seen in the province since July 2008 - offsetting recent slowdowns in British Columbia."
-
13:21
February proved to be an incredibly strong month for employment - Ahu Yildirmaz, vice president and co-head of the ADP Research Institute
Private sector employment increased by 298,000 jobs from January to February according to the February ADP National Employment Report.
"February proved to be an incredibly strong month for employment with increases we have not seen in years," said Ahu Yildirmaz, vice president and co-head of the ADP Research Institute. "Gains were driven by a surge in the goods sector, while we also saw the information industry experience a notable increase."
Mark Zandi, chief economist of Moody's Analytics said, "February was a very good month for workers. Powering job growth were the construction, mining and manufacturing industries. Unseasonably mild winter weather undoubtedly played a role. But near record high job openings and record low layoffs underpin the entire job market."
-
13:18
Huge US ADP employment report in Feb. USD/JPY up 45 pips so far
-
13:17
Canada: Housing Starts, February 210.2 (forecast 200)
-
13:15
U.S.: ADP Employment Report, February 298 (forecast 190)
-
13:00
Orders
EUR/USD
Offers: 1.0580 1.0600 1.0620 1.0635 1.0650 1.0680 1.0700
Bids: 1.0550 1.0520 1.0500 1.0480-85 1.0450
GBP/USD
Offers: 1.2185 1.2200 1.2220 1.2250-55 1.2285 1.2300 1.2320-25 1.2360 1.2400
Bids: 1.2165 1.2150 1.2130 1.2100 1.2075 1.2050 1.2030 1.2000
EUR/JPY
Offers: 120.50 120.85 121.00 121.50
Bids: 120.25 120.00 119.80 119.50 119.00
EUR/GBP
Offers: 0.8680-85 0.8700 0.8725-30 0.8750
Bids: 0.8650 0.8625-30 0.8600 0.8580 0.8565 0.8550
USD/JPY
Offers: 114.00 114.20 114.50-55114.80 115.00 115.20 115.55-60
Bids: 113.65 113.50 113.00112.80112.50 112.20 112.00
AUD/USD
Offers: 0.7585 0.7600 0.7620 0.7635 0.7650 0.7685 0.7700
Bids: 0.7550 0.7520 0.7500 0.7485 0.7450
Информационно-аналитический отдел TeleTrade
-
12:31
UK PM May's spokesman says finance minister Hammond told ministers his budget will increase economic resilience for Britain's future outside the EU
-
PM has been clear EU's Tusk has done a good job, will not say how she will vote on his re-election at EU Summit
-
-
12:02
EU's Vestager says Monte Paschi case will set precedent on banking rescue cases
-
ECB has answered commission questions over Monte Paschi racapitalisation plan
-
-
11:35
Polish Central Bank keeps key interest rate unchanged at 1.50 pct, as expected
-
11:06
Danske Bank expect EUR/GBP to move higher in coming months ahead of and after the triggering of Article 50 and target EUR/GBP at 0.87 in 3M
"The UK government suffered its second defeat in the House of Lords in less than a week, as the Lords voted for an amendment to the EU bill demanding a 'meaningful vote' on the final Brexit deal (366 voted in favour, 268 voted against). On Wednesday, the Lords amended the EU bill by demanding protection of EU citizens currently living in the UK, see also Brexit Monitor #23: PM May still set to trigger Article 50 before 'end of March' despite defeat in House of Lords, 2 March. Note that the Lords voted against a second referendum on the final Brexit deal (a proposal by LibDems).
....EUR/GBP has depreciated recently and is currently trading at 0.866. We expect EUR/GBP to move higher in coming months ahead of and after the triggering of Article 50 and target EUR/GBP at 0.87 in 3M.
That said, EUR/GBP is not only affected by political uncertainty in the UK but also in Europe, not least due to the French presidential election, which may put downward pressure on EUR/GBP if Marine Le Pen gains momentum in polls and markets begin to price in a political risk premium in the euro".
Copyright © 2017 Danske, eFXnews™
-
10:24
Greek statistics service says first estimate of full-year 2016 GDP growth at 0.0 pct
-
09:56
The pound fell to $ 1.2157, updating a seven-week low after yesterday the House of Lords decided to extend the parliament's rights over Brexit
Now, British Prime Minister Therese May will receive another obstacle in the negotiations on the withdrawal from the European Union. The nearest support for the pair may be the level of $ 1.2115 (January 13 low).
-
09:54
The yield on the benchmark 10-year German bond jumped 3-1/2 basis points to 0.35 percent, the long-term 30-year bond yields rose nearly 3 basis points to 1.18 percent
-
09:04
Sterling falls to seven-week low of $1.2165, down 0.3 pct on day
-
08:27
Swiss CPI up 0.5% in February
The consumer price index (IPC) increased by 0.5% in February 2017 compared with the previous month, reaching 100.4 points (December 2015=100). Inflation was 0.6% compared with the same month the previous year. These are the results of the Federal Statistical Office (FSO).
-
08:15
Switzerland: Consumer Price Index (MoM) , February 0.5% (forecast 0.2%)
-
08:15
Switzerland: Consumer Price Index (YoY), February 0.6%
-
08:15
Switzerland: Consumer Price Index (MoM) , February 0.5% (forecast 0.2%)
-
08:00
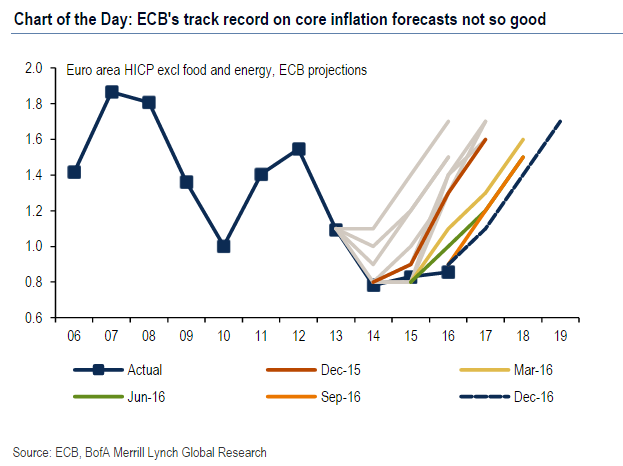
Bank of America Merrill expects a dovish message from ECB. How to trade?
"We think the current "truce" between the hawks and doves will be reflected in a dovish tone by Draghi this week, with no decision. After the summer, though, we think a proper debate about the future of QE will be unavoidable. We expect the ECB meeting to be a non-event for the Euro. Draghi bought time when he extended QE by a year last December and he intends to use it. Eurozone data have continued to improve and headline inflation has reached 2%. However, core inflation remains below 1%, while headline inflation will decline later in the year, as the effect from higher oil prices fades. Draghi knows that he will face challenges later in the year, when markets will be looking for answers about the future of QE, but this is too far from now. Accordingly, we think the March ECB meeting should be a non-event.
The USD and European politics are the main EUR drivers for now. The Fed is the main USD driver, but we expect fiscal policy to become more important in early summer. The French elections have been weighing on the euro and we expect this to continue. Even if Le Pen has a very slim chance based on all polls, markets could get more concerned closer to the elections as her victory could eventually break up the Eurozone.
Assuming no surprises in the European elections, the Euro should gradually strengthen, particularly against JPY, as the market starts pricing the end of ECB QE".
Copyright © 2017 BofAML, eFXnews™
-
07:45
France: Trade Balance, bln, January -7.9 (forecast -3.7)
-
07:26
Negative start of trading expected on the main European stock markets: DAX -0.2%, CAC -0.2%, FTSE -0.2%
-
07:25
Japan’s current account fell in January
Japan's current account amounted to Y65.5 billion, which is lower than the previous value of Y1112.2 billion, and the forecast of Y 270.0 billion, lower for the first time in eight months.
The current account balance is an indicator published by the Ministry of Finance and reflecting the balance of current export and import transactions with goods and services, with the addition of net investment income and current transfers. The surplus of the current account indicates that the inflow of capital into the country exceeds its outflow.
-
07:22
Japan's GDP expanded 0.3 percent in the fourth quarter of 2016
Japan's gross domestic product expanded 0.3 percent on quarter in the fourth quarter of 2016, the Cabinet Office cited by rttnews.
That missed forecasts 0.4 percent and was up from last month's preliminary reading of 0.2 percent. GDP gained 0.3 percent in Q3.
On a yearly basis, GDP was revised up to 1.2 percent from 1.0 percent, although that also missed forecasts for 1.5 percent.
GDP gained 1.4 percent in the three months prior.
-
07:19
German Economy Ministry says industrial production off to a good start in 2017, upswing likely to gain further momentum
-
07:16
Chinese trade balance below forecast
In February, China registered a trade balance deficit in the national currency. As it became known, the trade balance decreased by CNY 60.4 billion. Economists had expected an increase in the foreign trade of CNY 172.5 billion. In January, the trade surplus amounted to CNY 354.4 billion
Data on the trade balance, published by the People's Bank of China, reflect the difference in exports and imports of goods and services.
Exports from China increased by + 4.2%, which is lower than economists' forecast of + 14.6% and the previous value + 15.9%.
Imports to China in January increased by 44.7%, after rising 25.2% prior. Economists had expected an increase of 23.1%.
-
07:12
New Zeeland manufacturing rose 0.8% in Q4 2016
Sales (seasonally adjusted) for the December 2016 quarter compared with the September 2016 quarter:
-
Total manufacturing fell 1.8 percent.
-
Excluding meat and dairy product manufacturing, sales fell 0.6 percent.
-
Meat and dairy product manufacturing fell 5.7 percent.
Values:-
Total manufacturing rose 0.8 percent.
-
Excluding meat and dairy product manufacturing, sales rose 0.5 percent.
-
Meat and dairy product manufacturing rose 5.2 percent.
-
-
07:04
German industrial production up 2.8% in January
In January 2017, production in industry was up by 2.8% from the previous month on a price, seasonally and working day adjusted basis according to provisional data of the Federal Statistical Office (Destatis). In December 2016, the corrected figure shows a decrease of 2.4% (primary -3.0%) from November 2016.
In January 2017, production in industry excluding energy and construction was up by 3.7%. Within industry, the production of capital goods increased by 6.1% and the production of consumer goods by 2.3%. The production of intermediate goods showed an increase by 1.7%. Energy production was down by 0.7% in January 2017 and the production in construction decreased by 1.3%.
-
07:00
Germany: Industrial Production s.a. (MoM), January 2.8% (forecast 2.5%)
-
05:08
Japan: Coincident Index, January 114.9
-
05:08
Japan: Leading Economic Index , January 105.5 (forecast 105.4)
-