Market news
-
19:00
U.S.: Federal budget , January 51 (forecast 40)
-
15:35
The French presidential election is putting the eurozone's stability back on the agenda, but it will be Anglo-Saxon courts that may have the final say on which currency holders of euro corporate debt will receive after re-denomination - Dow Jones
-
15:14
US consumer confidence retreated from the decade-peak recorded in January
Surveys of Consumers chief economist, Richard Curtin: "consumer confidence retreated from the decade-peak recorded in January, with the decline centered in the Expectations Index. To be sure, confidence remains quite favorable, with only five higher readings in the past decade. Importantly, the data do not reflect any closing of the partisan divide.
The Michigan survey includes several free-response questions which ask respondents to answer in their own words, without any prompting or proposed answer categories. When asked to describe any recent news that they had heard about the economy, 30% spontaneously mentioned some favorable aspect of Trump's policies, and 29% unfavorably referred to Trump's economic policies. Thus a total of nearly six-in-ten consumers made a positive or negative mention of government policies. In the long history of the surveys, this total had never reached even half that amount, except for five surveys in 2013 and 2014 that were solely dominated by negative references to the debt and fiscal cliff crises".
-
15:00
U.S.: Reuters/Michigan Consumer Sentiment Index, February 95.7 (forecast 97.9)
-
15:00
United Kingdom: NIESR GDP Estimate, January 0.7%
-
14:28
NIESR estimates a rise of 0.7% in UK GDP
Our monthly estimates of GDP suggest that output grew by 0.7 per cent in the three months ending in January 2017 after growth of 0.6 per cent in the three months ending in December 2016.
Oriol Carreras, Research Fellow at NIESR, said "Our estimates suggest economic output in the three months ending in January 2017 was 0.7 per cent higher than in the previous three months. Driving growth is strong momentum in consumer spending combined with a pickup in output growth of manufacturing." NIESR's latest quarterly forecast (published 1 st February 2017) projected GDP growth of 2 per cent per annum for 2016 and 1.7 per cent in 2017 (see here for the associated press release).
-
13:44
Option expiries for today's 10:00 ET NY cut
EUR/USD 1.0500 (EUR 217 M) 1.0600 (EUR 1,258 M) 1.0625-1.0640 (EUR 371 M) 1.0650 (EUR 1,103 M) 1.0660-1.0675 (EUR 184 M) 1.0685-1.0690 (EUR 225 M)
GBP/USD 1.2445-1.2460 (GBP 251 M) 1.2485 (GBP 228 M) 1.2535-1.2550 (GBP 808 M)
EUR/GBP 0.8550 (EUR 551 M)
USD/JPY 112.00 (USD 2,059 M) 112.50-112.60 (USD 350 M) 113.00 (USD 995 M) 113.10-113.25 (USD 184 M) 114.00 (USD 1,548 M) 114.50 (USD 430 M) 115.00-115.10 (USD 1,281 M)
AUD/USD 0.7490-0.7500 (AUD 223 M) 0.7600 (AUD 325 M) 0.7750 (AUD 201 M)
USD/CAD 1.3020-1.3030 (USD 200 M) 1.3040-1.3055 (USD 548 M) 1.3115-1.3131 (USD 451 M) 1.3135-1.3150 (USD 537 M) 1.3155-1.3170 (USD 279 M) 1.3200-1.3205 (USD 205 M) 1.3245-1.3250 (USD 272 M)
NZD/USD 0.6990 (NZD 320 M) 0.7275-0.7280 (NZD 558 M) 0.7310-0.7320 (NZD 202 M)
-
13:37
US import prices rose in January, exports almost flat
U.S. import prices advanced 0.4 percent in January, the U.S. Bureau of Labor Statistics reported today, following a 0.5-percent increase in December. For both months, a rise in fuel prices more than offset declining nonfuel prices. Prices for U.S. exports advanced 0.1 percent in January, after rising 0.4 percent the previous month.
Export prices ticked up 0.1 percent in January, following a 0.4-percent increase in December. Rising prices for nonagricultural exports more than offset falling agricultural prices in each of the 2 months. With the exception of a 0.8-percent drop in August 2016, export prices have trended up since April 2016 and rose 2.3 percent for the year ended in January. The 2.3-percent rise was the largest 12-month advance since the index increased 2.6 percent between January 2011 and January 2012. -
13:35
-
13:33
Canadian unemployment rate declined to 6.8% in January. USD/CAD down 70 pips after the news
Employment rose by 48,000 (+0.3%) in January, building on gains observed in the latter part of 2016. The unemployment rate fell by 0.1 percentage points to 6.8%.
On a year-over-year basis, employment rose by 276,000 (+1.5%), with most of the increase occurring from August to January.
Following a significant increase in December, full-time employment held steady in January. Compared with 12 months earlier, full-time employment was up 86,000 (+0.6%), with increases totalling 141,000 since August.
-
13:30
U.S.: Import Price Index, January 0.4% (forecast 0.2%)
-
13:30
Canada: Unemployment rate, January 6.8% (forecast 6.9%)
-
13:30
Canada: Employment , January 48.3 (forecast -5)
-
13:00
Orders
EUR/USD
Offers 1.0665 1.0680 1.0700-05 1.0730 1.0750
Bids 1.0625-30 1.0600 1.0580 1.0550 1.0520 1.0500
GBP/USD
Offers 1.2500 1.2525-30 1.2550-55 1.2580 1.2600 1.2630 1.2650
Bids 1.2450 1.2430 1.2400 1.2380 1.2345-50 1.2320 1.2300
EUR/GBP
Offers 0.8535 0.8550 0.8585 0.8600 0.8630-350.8650
Bids 0.8500 0.8485 0.8465 0.8450 0.8430 0.8400
EUR/JPY
Offers 121.35 121.50 121.80 122.00 122.50
Bids 121.00 120.80 120.50 102.30 120.00 119.75 119.50
USD/JPY
Offers 113.80 114.00 114.20 114.50 114.75 115.00
Bids 113.50 113.20 113.00 112.80 112.50 112.00
AUD/USD
Offers 0.7665 0.7685 0.7700 0.7730 0.7750
Bids 0.7620 0.7600 0.7580 0.7550 0.7520 0.7500
-
10:35
Senior Eurozone Official: Eurozone Lenders, IMF Said To Reach Agreement On Common Stance On Greece - Reuters
-
10:04
Option expiries for today's 10:00 ET NY cut
EUR/USD: 1.0600-05 (EUR 693m) 1.0650 (955m) 1.0700 (887m) 1.0780 (1.33bln) 1.0950 (880m)
USD/JPY: 112.00 (USD 607m) 112.50 (350m) 114.00 (670m) 115.00 (465m)
GBP/USD: 1.2565-70 (GBP 437m) 1.2600 (469m)
AUD/USD: 0.7400 (AUD 571m)
USD/CAD 1.2975 (USD 485m)
Информационно-аналитический отдел TeleTrade
-
09:36
The UK trade deficit on goods and services narrowed to £8.6 billion in Quarter 4
The UK trade deficit on goods and services narrowed to £8.6 billion in Quarter 4 (Oct to Dec) 2016, following a sharp widening of the deficit in Quarter 3 (July to Sept) 2016; this narrowing was predominantly due to an increase in exports of goods to non-EU countries.
At the commodity level, the main causes of the narrowing of the deficit in Quarter 4 were increased exports of non-monetary gold, oil and aircraft as well as a decrease in imports of non-monetary gold.
Exports and imports of goods excluding oil and erratics have grown between each consecutive quarter of 2016; the deficit on goods excluding oil and erratics continued to widen in each quarter in 2016 because the import values increased more than exports.
-
09:34
UK industrial production rose 1.1% in December as manufacturing provided the largest contribution
The Index of Production for Quarter 4 (Oct to Dec) 2016 was estimated to have increased by 0.3%, revised upwards from 0.0% in the Gross domestic product preliminary estimate: Oct to Dec 2016.
Manufacturing provided the largest contribution to quarterly growth, largely due to a strong increase in the volatile pharmaceuticals industry.
In December 2016, total production was estimated to have increased by 1.1% compared with November 2016; the only contribution to the increase came from manufacturing.
Total production output for 2016 as a whole is estimated to have increased by 1.2%, with manufacturing providing the largest contribution, which increased by 0.7%.
-
09:30
United Kingdom: Total Trade Balance, December -3.30
-
09:30
United Kingdom: Industrial Production (YoY), December 4.3% (forecast 3.2%)
-
09:30
United Kingdom: Manufacturing Production (MoM) , December 2.1% (forecast 0.5%)
-
09:30
United Kingdom: Manufacturing Production (YoY), December 4% (forecast 1.8%)
-
09:30
United Kingdom: Industrial Production (MoM), December 1.1% (forecast 0.2%)
-
09:24
Italian industrial production up 1.4% in December
In December 2016 the seasonally adjusted industrial production index increased by 1.4 compared with the previous month. The percentage change of the average of the last three months with respect to the previous three months was +1.3.
The calendar adjusted industrial production index increased by 6.6% compared with December 2015 (calendar working days being 20 versus 21 days in December 2015); in the period January-December 2016 the percentage change was +1.6 compared with the same period of 2015.
The unadjusted industrial production index increased by 3.4% compared with December 2015.
-
08:10
French payroll employment increased in the non-farm market sectors in Q4
In Q4 2016, payroll employment increased in the non-farm market sectors (+0.4%) for the seventh consecutive quarter. The net job creation reached +62,200 after +52,400 jobs in the previous quarter. Year on year, payroll employment increased by +1.2% in the principally market sectors (+191,700 jobs).
Employment declined at the same pace as in the previous quarter in industry (−0.2%, i.e. −4,700 jobs). In construction, it decreased slightly (−0.1%, i.e. −1,900 jobs after 0.0% in Q3 2016). Year on year, industry shed −23,200 jobs and construction shed −5,700 jobs.
-
08:09
French industrial production down 0.8% in December
In December 2016, output fell back in the manufacturing industry (−0.8% after +2.4%), as well as in the whole industry (−0.9% after +2.4%).
Over the last quarter of 2016, output grew in the manufacturing industry (+0.8% q-o-q), as well as in the overall industry (+1.1% q-o-q).
Output increased markedly in the mining and quarrying, energy, water supply (+3.1%), in that of transport equipment (+2.8%) and in the manufacture of machinery and equipment goods (+2.1%), and slightly in the "other manufacturing" (+0.3%). It soared in the manufacture of coke and refined petroleum products (+7.4%). Conversely, it decreased in the manufacture of food products and beverages (−0.7%).
Manufacturing output of the last quarter of 2016 grew slightly compared to the last quarter of 2015 (+0.2% y-o-y). It also went up in the whole industry (+0.4%).
-
07:54
France: Non-Farm Payrolls, Quarter IV 0.4% (forecast 0.3%)
-
07:53
France: Industrial Production, m/m, December -0.9% (forecast -0.7%)
-
07:49
President Trump and the dollar, according to Goldman Sachs. Bullish view unchanged
"Markets are worrying over the "true" intentions of the new administration. Concern that President Trump is mercantilist and may talk down the Dollar has seen the Dollar fall notably below the 2-year rate differential, as markets have priced a protectionist risk premium.
Our last FX Views argued that this decoupling is unlikely to last, given that the correlation of the Dollar with front-end differentials is one of the more stable relationships out there.
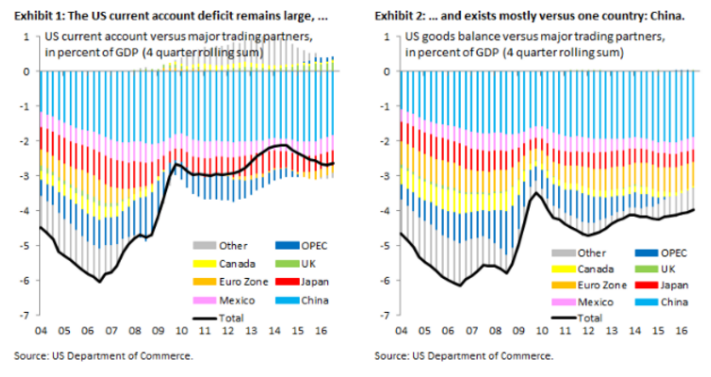
That said, today we examine the persistent and large US current account deficit, given that it is often cited as evidence that the Dollar is overvalued and needs to fall.
We argue that the current account deficit, which stands at 2.6 percent of GDP, is a flawed metric on which to make a valuation judgment for the broad Dollar. This is because the deficit is heavily skewed towards one country - China - which alone accounts for 1.8 percentage points, while Mexico, Japan and the Euro zone each play only supporting roles. The US current account deficit is therefore to a large degree a bilateral phenomenon vis-à-vis China, which also means that it bears implications not for the broad, trade-weighted Dollar but for $/CNY. We examine the implications that the bilateral current account has for the $/CNY exchange rate, concluding that - if the new administration wants to have a material impact on external trade - this is where its focus will ultimately have to be.
We remain firmly convicted RMB bears and, in the broader context, Dollar bulls".
Copyright © 2017 Goldman Sachs, eFXnews™
-
07:44
China's trade balance surplus rose more than expected in January
China's exports recovered at a faster-than-expected pace at the start of the year ahead of the protectionist policies that U.S. President Donald Trump could take, deterring shipments of most Asian economies.
Exports climbed 7.9 percent year-on-year in January, reversing December's 6.2 percent fall, data from the General Administration of Customs revealed, cited by rttnews. Shipments were expected to climb 3.2 percent.
At the same time, annual growth in imports accelerated sharply to 16.7 percent from 3.1 percent and also exceeded the expected expansion of 10 percent.
As a result, the trade surplus increased to $51.35 billion from $40.71 billion a month ago. The surplus was expected to rise to $48.5 billion.
-
07:29
Options levels on friday, February 10, 2017
EUR/USD
Resistance levels (open interest**, contracts)
$1.0767 (2812)
$1.0723 (2597)
$1.0698 (1706)
Price at time of writing this review: $1.0657
Support levels (open interest**, contracts):
$1.0623 (2634)
$1.0603 (3507)
$1.0577 (3664)
Comments:
- Overall open interest on the CALL options with the expiration date March, 13 is 68659 contracts, with the maximum number of contracts with strike price $1,0800 (4852);
- Overall open interest on the PUT options with the expiration date March, 13 is 80145 contracts, with the maximum number of contracts with strike price $1,0000 (5070);
- The ratio of PUT/CALL was 1.17 versus 1.17 from the previous trading day according to data from February, 9
GBP/USD
Resistance levels (open interest**, contracts)
$1.2703 (2960)
$1.2705 (2254)
$1.2608 (2134)
Price at time of writing this review: $1.2503
Support levels (open interest**, contracts):
$1.2392 (1971)
$1.2295 (3548)
$1.2197 (1540)
Comments:
- Overall open interest on the CALL options with the expiration date March, 13 is 33037 contracts, with the maximum number of contracts with strike price $1,2500 (3392);
- Overall open interest on the PUT options with the expiration date March, 13 is 37246 contracts, with the maximum number of contracts with strike price $1,2300 (3548);
- The ratio of PUT/CALL was 1.13 versus 1.09 from the previous trading day according to data from February, 9
* - The Chicago Mercantile Exchange bulletin (CME) is used for the calculation.
** - Open interest takes into account the total number of option contracts that are open at the moment.
-
07:23
The Australian dollar climbed on an upbeat assessment of the economic outlook by the Reserve Bank of Australia, which economists said signalled no immediate risk of interest rate cuts - Dow Jones
-
07:22
Australian home loans rose less than expected in December
The trend estimate for the total value of dwelling finance commitments excluding alterations and additions rose 0.8%. Investment housing commitments rose 1.7%, and owner occupied housing commitments rose 0.2%.
In seasonally adjusted terms, the total value of dwelling finance commitments excluding alterations and additions rose 0.4%.
In trend terms, the number of commitments for owner occupied housing finance rose 0.1% in December 2016.
In trend terms, the number of commitments for the purchase of new dwellings rose 1.4%, the number of commitments for the construction of dwellings rose 0.2%, and the number of commitments for the purchase of established dwellings rose 0.1%.
-
07:20
RBA Statement on Monetary Policy
"The global economy entered 2017 with more momentum than earlier expected. Along with various survey indicators pointing to improved sentiment, growth in global industrial production and merchandise trade have picked up. Partly reflecting the run of recent data, the outlook for GDP growth in Australia's major trading partners has improved. GDP growth in China has been stronger than earlier anticipated, supported by accommodative macroeconomic policies, although growth is still expected to slow over coming years and the credit-based financing of some of the expansion poses risks. The largely policy-induced rebound in residential investment in China has spurred stronger demand for construction-related materials, such as steel, which in turn has boosted demand for iron ore and coal. High and rising debt, combined with excess capacity in some sectors, remains a risk to the medium-term outlook for growth in China. Growth in the major advanced economies is expected to be above potential, although there is significant uncertainty around policy in the United States and its effect on global growth and prices.
The prices of bulk commodities increased significantly over the past year. Australia's terms of trade have consequently risen by more than 15 per cent since mid 2016, following the large falls over the previous few years. These higher price levels are unlikely to be sustained. Coal prices have already fallen from very elevated levels, partly because some earlier supply disruptions have been resolved. Also, additional low-cost iron ore production from Australia and Brazil is expected to come on line over the period ahead. The forecasts accordingly assume that much of the recent increase in the terms of trade and commodity prices will be unwound over the next couple of years, although the terms of trade are expected to remain above the lows of a year ago".
-
03:28
China: Trade Balance, bln, January 51.35 (forecast 47.9)
-
00:31
Australia: Home Loans , December 0.4% (forecast 1%)
-