Market news
-
23:28
Currencies. Daily history for Nov 10’2016:
(pare/closed(GMT +3)/change, %)
EUR/USD $1,0891 -0,17%
GBP/USD $1,2551 +1,16%
USD/CHF Chf0,9865 +0,22%
USD/JPY Y106,82 +1,09%
EUR/JPY Y116,35 +0,95%
GBP/JPY Y134,08 +2,25%
AUD/USD $0,7611 -0,29%
NZD/USD $0,7212 -0,90%
USD/CAD C$1,3467 +0,33%
-
23:00
Schedule for today, Friday, Nov 11’2016
01:00 Australia RBA Assist Gov Debelle Speaks
04:30 Japan Tertiary Industry Index September 0.0% -0.2%
07:00 Germany CPI, m/m (Finally) October 0.1% 0.2%
07:00 Germany CPI, y/y (Finally) October 0.7% 0.8%
14:00 U.S. FED Vice Chairman Stanley Fischer Speaks
15:00 U.S. Reuters/Michigan Consumer Sentiment Index (Preliminary) November 87.2 87.5
15:50 Canada BOC Gov Stephen Poloz Speaks
-
21:30
New Zealand: Business NZ PMI, October 55.2
-
19:00
U.S.: Federal budget , October -44 (forecast -80)
-
16:00
Natural gas storage increases in line with expectations
Working gas in storage was 4,017 Bcf as of Friday, November 4, 2016, according to EIA estimates. This represents a net increase of 54 Bcf from the previous week. Stocks were 47 Bcf higher than last year at this time and 189 Bcf above the five-year average of 3,828 Bcf. At 4,017 Bcf, total working gas is above the five-year historical range.
-
14:33
What Bank of America Merrill thinks about the dollar
"We have argued in the past few months that the significance of the US election lies in what it means for US fiscal policy. We believe the outcome of a Republican clean sweep means fiscal loosening is now a foregone conclusion. We believe this will lead to both higher rates and a higher USD.
Beyond the noise: Higher rates and higher dollar.
- A clean sweep is an exception rather than the norm in the US. There have been only 18 years since 1965 that a single party controlled the presidency as well as both houses of Congress.
- A clean sweep is a recipe for fiscal easing. During the eighteen years in which a single party controlled the presidency and both houses of Congress, US structural budget balance worsened by 0.4pp of potential GDP a year.
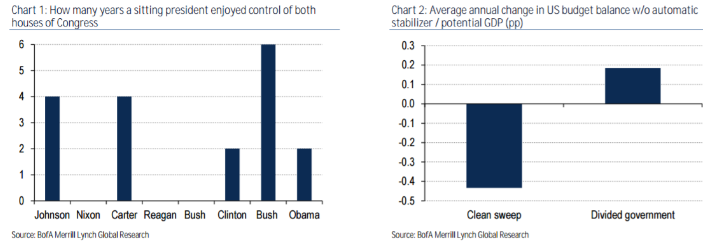
- Fiscal easing is bearish rates. A fiscal stimulus of 1% of GDP has been associated with 48bp increase in 10y yields. We expect 10y rates to test 2.25%-2.5% by Q1/Q2 next year.
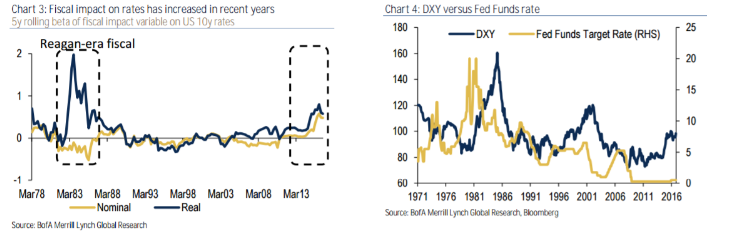
- Higher rates is bullish for the USD. The last time the US unleashed fiscal stimulus when the economy was not in a recession was under Ronald Reagan (1981-84). This emboldened the Fed to enter a hiking cycle propelling the USD 60% higher.
- HIA 2.0 even more bullish the USD: We believe the lowest hanging fruit for the Trump administration will be tax reforms to encourage repatriation of the $2trn that US companies are sitting on. Our estimates suggest that nearly $400bn of overseas cash could be converted to USD, providing a positive USD tailwind. The only year from 2001 to 2008 in which the USD rallied was in 2005, during the first HIA.
- Deregulation: A combination of higher deficits and deregulation (lower buying of belly USTs from bank portfolios) leaves us biased towards tighter swap spreads in the 5y-10y part of the curve.
In FX, our highest conviction remains higher USD/JPY given its interest rate sensitivity. JPY is the most highly correlated to rate spreads within G10. Additionally, domestic flows are set to turn JPY-negative in 2017, further supporting our view. The biggest risk to our higher rates view is if Beijing takes advantage and pushes the RMB lower before the new president takes office. In such an event, we cannot rule out a risk-off environment that could drive down commodities, EM and inflation BEs".
Copyright © 2016 BofAML, eFXnews™
-
14:28
Fed's Bullard Expects 'Low' Interest Rates Over Next 2-3 Years
-
14:12
Canadian New House Pice Index in line with expectations
The New Housing Price Index (NHPI) rose 0.2% in September compared with the previous month. Prices rose in 11 census metropolitan areas (CMAs), with the indexes from the combined region of Toronto and Oshawa and from Vancouver contributing the most to the monthly increase.
Windsor and the combined region of Saint John, Fredericton and Moncton, which both rose 1.2% in September, posted the largest monthly price advances among the CMAs covered by the survey. Builders in Windsor reported market conditions and higher land costs as reasons for the increase. This was the largest monthly price gain in Windsor since November 2011.
In the combined region of Saint John, Fredericton and Moncton, higher construction costs were the primary reason for the advance. This was the second consecutive price increase in the region this year, and the largest since June 2010.
-
14:10
US unemployment claims continue to decline
In the week ending November 5, the advance figure for seasonally adjusted initial claims was 254,000, a decrease of 11,000 from the previous week's unrevised level of 265,000. The 4-week moving average was 259,750, an increase of 1,750 from the previous week's revised average. The previous week's average was revised up by 250 from 257,750 to 258,000.
There were no special factors impacting this week's initial claims. This marks 88 consecutive weeks of initial claims below 300,000, the longest streak since 1970.
-
13:50
Option expiries for today's 10:00 ET NY cut
EUR/USD 1.0845-50 (EUR 1.78bln) 1.0945-50 (1.44bn) 1.1000 (1.29bn)
USD/JPY 103.00 (USD 921m) 103.50 ( 960m) 105.00 (1.05bln)
USD/CHF: 0.9685 (USD 830m)
AUD/USD: 0.7560-70 (AUD 1.28bn)
USD/CAD 1.3400 (USD 1.47bln)
AUD/JPY 78.85 (AUD 1.04bn)
-
13:30
U.S.: Initial Jobless Claims, 254 (forecast 260)
-
13:30
U.S.: Continuing Jobless Claims, 2041 (forecast 2030)
-
13:30
Canada: New Housing Price Index, MoM, September 0.2% (forecast 0.2%)
-
12:51
Orders
EUR/USD
Offers : 1.0930-35 1.0950 1.0980-85 1.1000 1.1025-30 1.1055-60 1.1085 1.1100 1.1200
Bids : 1.0900 1.0885 1.0850 1.0830 1.0800 1.0785 1.0765 1.0750
GBP/USD
Offers : 1.2460 1.2480-85 1.2500 1.2530 1.2550-60 1.2580 1.2600
Bids : 1.2420 1.2400 1.2375-80 1 .2350 1.2330 1.2300 1.2280 1.2250-55
EUR/GBP
Offers : 0.8800 0.8820-25 0.8850-55 0.8880-85 0.8900 0.8925 0.8950
Bids : 0.8750-60 0.8735 0.8700 0.8680 0.8650 0.8600
EUR/JPY
Offers : 115.70 116.00 116.30 116.50 117.00 117.30 117.50
Bids : 115.00 114.80 114.50 114.20 114.00 113.80 113.50 113.00
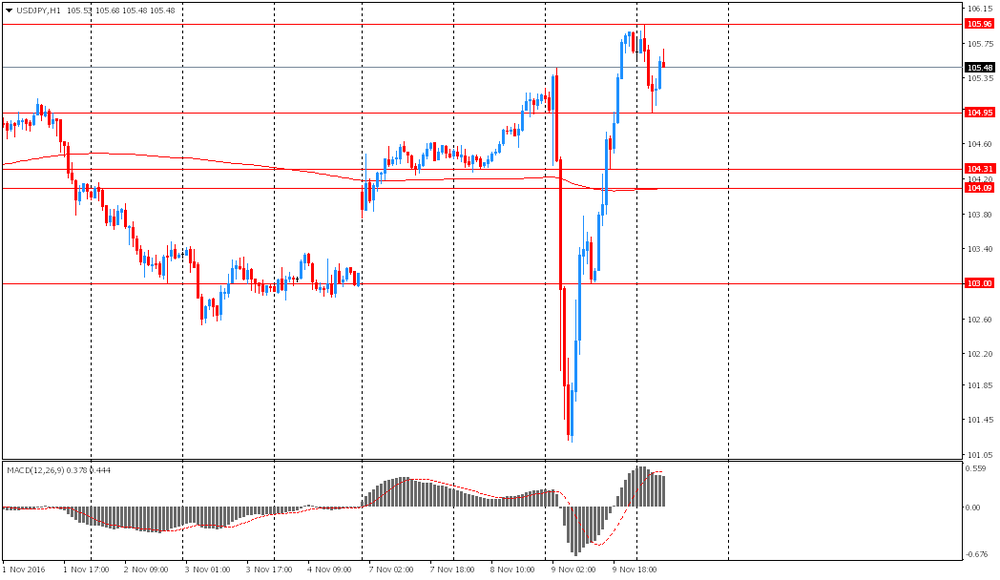
USD/JPY
Offers : 105.85 106.00 106.50 106.70 107.00 107.50
Bids : 105.20 105.00 104.85 104.50 104.30 104.00 103.80 103.50 103.00 102.80 102.50-55
AUD/USD
Offers : 0.7700 0.7730 0.7750 0.7765 0.7780 0.7800
Bids : 0.7650 0.7630 0.7600 0.7550 0.7520 0.7500 0.7475-80 0.7450 0.7400
-
11:09
Russian oil companies have identified a list of Iranian fields - the deputy head of the Ministry of Energy of the Russian Federation
"Rosneft", "Gazprom", "Lukoil", "Gazprom Neft", "Zarubezhneft" and "Tatneft" had identified a list of fields of interest in Iran. This was stated by Deputy Energy Minister Kirill Molodtsov on the sidelines of the forum "The exploration, mining, processing."
Russia and Iran are discussing the possibility of an exclusive presentation of the Iranian oil and gas contracts for Russian companies. Molodcov added that the presentation date has been determined and it will be held in November.
-
09:18
Japan PM Advisor Shibayama: Gov't Has Said It Will Take Bold Action In FX If Needed, Will Not Comment On Specific Moves - Reuters
-
09:18
Italian industrial production index decreased by 0.8%
In September 2016 the seasonally adjusted industrial production index decreased by 0.8% compared with the previous month. The percentage change of the average of the last three months with respect to the previous three months was +1.2.
The calendar adjusted industrial production index increased by 1.8% compared with September 2015 (calendar working days in September 2016 being the same as in September 2015); in the period January-September 2016 the percentage change was +1.1 compared with the same period of 2015.
The unadjusted industrial production index increased by 1.9% compared with September 2015.
-
08:44
Option expiries for today's 10:00 ET NY cut
EUR/USD 1.0845-50 (EUR 1.78bln) 1.0945-50 (1.44bn) 1.1000 (1.29bn)
USD/JPY 103.00 (USD 921m) 103.50 ( 960m) 105.00 (1.05bln)
USD/CHF: 0.9685 (USD 830m)
AUD/USD: 0.7560-70 (AUD 1.28bn)
USD/CAD 1.3400 (USD 1.47bln)
AUD/JPY 78.85 (AUD 1.04bn)
-
08:26
Today’s events
-
At 17:15 GMT FOMC member James Bullard will give a speech
-
At 17:50 GMT the ECB Vice-President Vitor Constancio will give a speech
-
At 20:00 GMT Andy Haldane of the Bank of England will make a speech
-
At 21:01 GMT the United States will hold an auction of 30-year bonds
-
-
07:48
French industrial production down 1.1% in September
Over the third quarter of 2016, output grew slightly in the manufacturing industry (+0.2%) compared to the previous quarter. It was virtually stable in the overall industry (-0.1% q-o-q), due to a sharp fall in mining and quarrying; energy; water supply (-2.0%).
Output grew in the manufacture of food products and beverages (+1.7%) and bounced back strongly in the manufacture of coke and refined petroleum products (+14.9%). It was virtually stable in "other manufacturing" (+0.1%) and increased slightly in the manufacture of machinery and equipment goods(+0.3%). Conversely, it fell sharply in the manufacture of transport equipment(-2.3%).
-
07:46
USD/JPY: To Test Above 110 Before Seeing 100 Again - ANZ
"In a fundamental sense the JPY looks set to turn.
Real rates will turn from a driver of strength to weakness, while the better commodity environment will reduce the scale of the trade surplus. The key future uncertainty is likely to be the scale of outflows. Here, the recent steepening in global rates will play a key role. In the near term our indicators of liquidity suggest volatility could remain suppressed, and as such drive further JPY weakness. We will watch our indicator closely and be alert to the risk that global curves steepen to a point which tightens liquidity and drives volatility higher. For this reason, the upcycle for USD/JPY is likely to be much more shallow than usual.
As such, we expect USD/JPY to test above 110 before seeing 100 again.
We have revised our forecasts for USD/JPY higher".

(Source: eFXplus Forecasts, ANZ)
Copyright © 2016 ANZ, eFXnews™
-
07:45
France: Industrial Production, m/m, September -1.1% (forecast -0.3%)
-
07:45
France: Non-Farm Payrolls, Quarter III 0.3% (forecast 0.2%)
-
07:43
Asian session review: NZD sold as RBNZ announces downside risks for interest rates
The Australian dollar rose onpositive data from Australia. According to the data released on Thursday, the number of approved housing loans in September increased by 1.6% compared with August. The surveyed economists had expected a decrease of 1.6%. The volume of approved housing loans in September rose by 4.6% compared with August. This means that lower interest rates provide some support for the housing market.
In addition, the strengthening of commodity prices also supported the Australian dollar. Iron ore prices on Wednesday rose 4.7%, to highs since the beginning of last year. Price of iron ore increased by 3.20 US dollars to 71 US dollars.
New Zealand's dollar fell after the Reserve Bank of New Zealand decided to reduce the interest rate. The Reserve Bank of New Zealand cut its official interest rate by 25 bp from 2.0% to 1.75% The decision of the central bank was not a surprise for investors, as the probability of a rate cut was more than 80%. Lower interest rate was necessary mainly to maintain the level of inflation. According to forecasts of the RBNZ, inflation will reach the target level of 2% in the fourth quarter of 2018. Earlier, the central bank expected to achieve the goal in the third quarter of 2018. In its accompanying statement, the RBNZ leaders expressed fears of a global political uncertainty. Trump, Brexit, China - among the global uncertainties. Graeme Wheeler is also concerned about how the business will respond to global risks, in particular, he noted the risks associated with the prospects of the Chinese economy. Wheeler also said he did not need one more drop in rates in the near future.
EUR / USD: during the Asian session, the pair rose to $ 1.1300
GBP / USD: during the Asian session, the pair rose to $ 1.2545
USD / JPY: on Asian session the pair fell to Y101.20
-
07:33
Options levels on thursday, November 10, 2016:
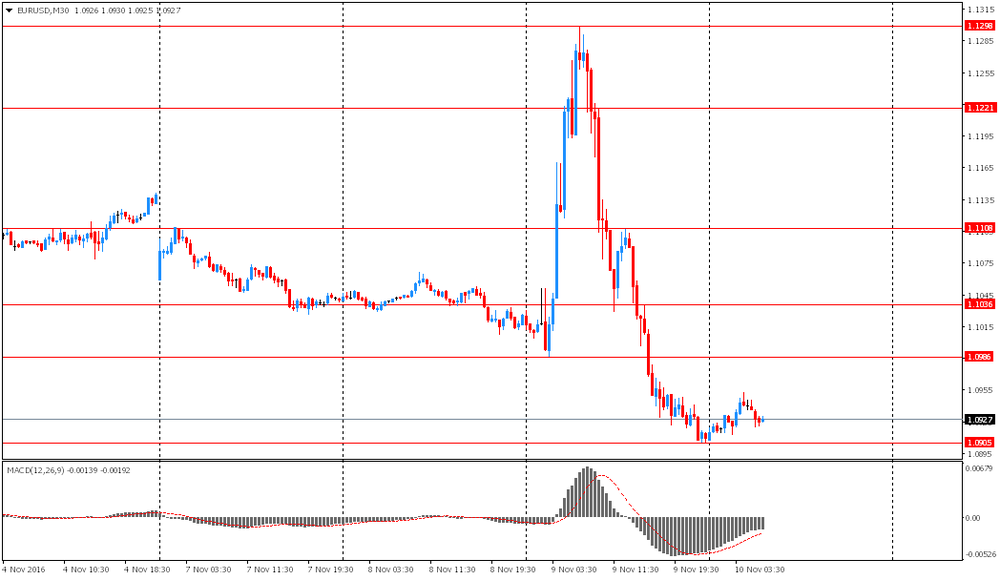
EUR/USD
Resistance levels (open interest**, contracts)
$1.1154 (3904)
$1.1089 (2239)
$1.1039 (739)
Price at time of writing this review: $1.0926
Support levels (open interest**, contracts):
$1.0857 (3515)
$1.0834 (3018)
$1.0807 (4574)
Comments:
- Overall open interest on the CALL options with the expiration date December, 9 is 63564 contracts, with the maximum number of contracts with strike price $1,1400 (6747);
- Overall open interest on the PUT options with the expiration date December, 9 is 56058 contracts, with the maximum number of contracts with strike price $1,0900 (4574);
- The ratio of PUT/CALL was 0.88 versus 0.87 from the previous trading day according to data from November, 9
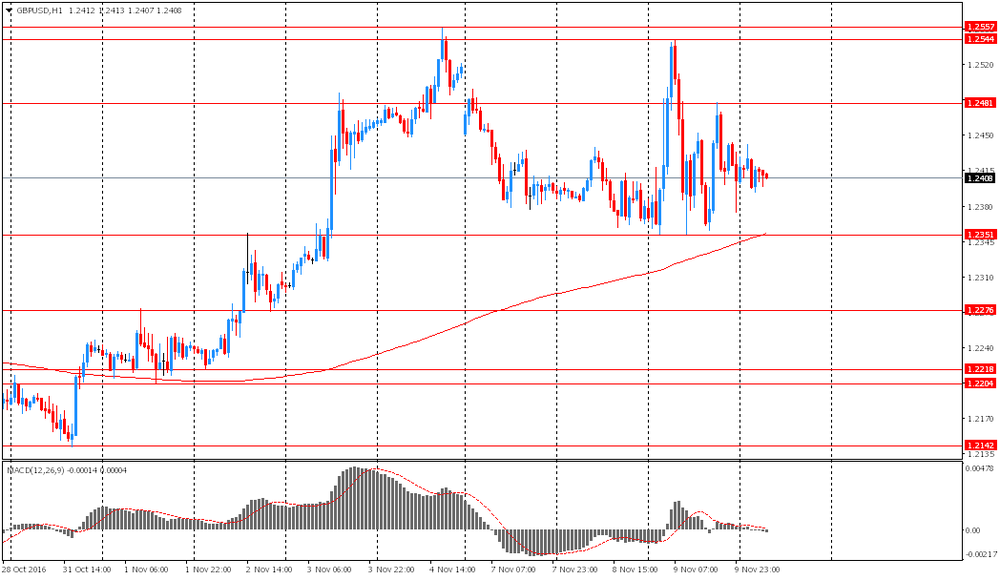
GBP/USD
Resistance levels (open interest**, contracts)
$1.2705 (1516)
$1.2608 (1246)
$1.2512 (1870)
Price at time of writing this review: $1.2437
Support levels (open interest**, contracts):
$1.2388 (1276)
$1.2292 (3506)
$1.2195 (951)
Comments:
- Overall open interest on the CALL options with the expiration date December, 9 is 32176 contracts, with the maximum number of contracts with strike price $1,3400 (2560);
- Overall open interest on the PUT options with the expiration date December, 9 is 34301 contracts, with the maximum number of contracts with strike price $1,2300 (3506);
- The ratio of PUT/CALL was 1.07 versus 1.06 from the previous trading day according to data from November, 9
* - The Chicago Mercantile Exchange bulletin (CME) is used for the calculation.
** - Open interest takes into account the total number of option contracts that are open at the moment.
-
07:32
Orders for machinery and equipment in Japan continues to decline
According to data released today by the Institute of Economic and Social Research of Japan, core orders for machinery and equipment continue to decline in September for the fourth consecutive month and fell by -3.3% in relation to August. It is worth noting that the majority of analysts forecast a decline by only 0.5%. Thus data was significantly worse and showed a decline in absolute value of 843.7 billion yen. The annualized figure rose by 4.3%, while the previous year was +11.6%.
The total number of orders for machinery and equipment, including those for ships and electric power companies, fell by 0.7% in monthly terms and rose by 0.9% over the year to 972.1 billion yen.
-
07:26
Fed's Williams: FOMC can start gradually removing accommodation over the next few years, confident inflation will move towards target soon
-
07:11
RBNZ's McDermott: Can cut rate more if needed, risks on rates still to the downside
-
07:10
RBNZ cuts rates to 1.75% as expected
The Reserve Bank of New Zeeland today reduced the Official Cash Rate (OCR) by 25 basis points to 1.75 percent.
Significant surplus capacity exists across the global economy despite improved economic indicators in some countries. Global inflation remains weak even though commodity prices have come off their lows. Political uncertainty remains heightened and market volatility is elevated.
Weak global conditions and low interest rates relative to New Zealand are keeping upward pressure on the New Zealand dollar exchange rate. The exchange rate remains higher than is sustainable for balanced economic growth and, together with low global inflation, continues to generate negative inflation in the tradables sector. A decline in the exchange rate is needed.
Domestic growth is being supported by strong population growth, construction activity, tourism, and accommodative monetary policy. Recent dairy auctions have been positive, but uncertainty remains around future outcomes. High net immigration is supporting growth in labour supply and limiting wage pressure.
House price inflation remains excessive and is posing concerns for financial stability. Although house price inflation has moderated in Auckland, it is uncertain whether this will be sustained given the continuing imbalance between supply and demand.
-
06:16
Japan: Prelim Machine Tool Orders, y/y , October -8.9%
-
00:30
Australia: Home Loans , September 1.6% (forecast -2%)
-
00:00
Australia: Consumer Inflation Expectation, October 3.2%
-