Market news
-
15:35
-
15:06
US consumer confidence remained unchanged in January
Consumer confidence remained unchanged at the cyclical peak levels recorded in December. The Current Conditions Index rose 0.6 points to reach its highest level since 2004, and the Expectations Index fell 0.6 points which was lower than only the 2015 peak during the past dozen years. The post-election surge in optimism was accompanied by an unprecedented degree of both positive and negative concerns about the incoming administration spontaneously mentioned when asked about economic news. The importance of government policies and partisanship has sharply risen over the past half century.
-
15:05
US business inventories rose more than expected
The combined value of distributive trade sales and manufacturers' shipments for November, adjusted for seasonal and trading-day differences but not for price changes, was estimated at $1,326.7 billion, up 0.1 percent from October 2016 and was up 2.3 percent from November 2015.
Inventories Manufacturers' and trade inventories, adjusted for seasonal variations but not for price changes, were estimated at an end-of-month level of $1,827.5 billion, up 0.7 percent from October 2016 and were up 1.5 percent (±0.4 percent) from November 2015
-
15:00
U.S.: Business inventories , November 0.7% (forecast 0.5%)
-
15:00
U.S.: Reuters/Michigan Consumer Sentiment Index, January 98.1 (forecast 98.5)
-
14:38
-
13:45
Option expiries for today's 10:00 ET NY cut
EUR/USD 1.0500 (EUR 2,790 M) 1.0550 (EUR 1,473 M) 1.0570-1.0575 (EUR 434 M) 1.0600 (EUR 3,755 M) 1.0615-1.0620 (EUR 198 M) 1.0630-1.0635 (EUR 738 M) 1.0650-1.0665 (EUR 686 M) 1.0695-1.0705 (EUR 1,357 M) 1.0750-1.0765 (EUR 1,206 M)
GBP/USD 1.2000 (GBP 619 M) 1.2180 (GBP 482 M) 1.2200 (GBP 496 M) 1.2295-1.2305 (GBP 905 M)
USD/JPY 113.50 (USD 1,220 M) 113.75 (USD 320 M) 114.00-114.10 (USD 342 M) 114.50 (USD 856 M) 114.75-114.90 (USD 398 M) 115.00 (USD 1,830 M) 115.10-115.17 (USD 270 M) 115.35-115.50 (USD 1,093 M) 116.00 (USD 1,762 M) 116.10-116.25 (USD 2,020 M)
EUR/JPY 122.00 (EUR 221 M) 122.42-122.55 (EUR 517 M)
USD/CHF 1.0115-1.0120 (USD 255 M)
AUD/USD 0.7300 (AUD 1,199 M) 0.7340-0.7350 (AUD 390 M) 0.7375-0.7380 (AUD 192 M) 0.7400-0.7415 (AUD 250 M) 0.7420-0.7425 (AUD 369 M) 0.7480-0.7495 (AUD 301 M) 0.7500-0.7505 (AUD 265 M) 0.7535-0.7550 (AUD 399 M) 0.7600-0.7610 (AUD 1,119 M)
USD/CAD 1.3095-1.3105 (USD 766 M) 1.3150-1.3155 (USD 626 M) 1.3230 (USD 213 M) 1.3300 (USD 2,302 M)
NZD/USD 0.7040-0.7050 (NZD 196 M)
-
13:38
US Producer Price Index for final demand increased 0.3 percent in December
The Producer Price Index for final demand increased 0.3 percent in December, seasonally adjusted, the U.S. Bureau of Labor Statistics reported today. Final demand prices advanced 0.4 percent in November and were unchanged in October. On an unadjusted basis, the final demand index climbed 1.6 percent in 2016 after falling 1.1 percent in 2015.
In December, nearly 80 percent of the advance in the final demand index is attributable to a 0.7 percent increase in prices for final demand goods. The index for final demand services inched up 0.1 percent.
-
13:34
US retail sales in line with expectations in December
Advance estimates of U.S. retail and food services sales for December 2016, adjusted for seasonal variation and holiday and trading-day differences, but not for price changes, were $469.1 billion, an increase of 0.6 percent from the previous month, and 4.1 percent (±0.9 percent) above December 2015.
Total sales for the 12 months of 2016 were up 3.3 percent from 2015. Total sales for the October 2016 through December 2016 period were up 4.1 percent from the same period a year ago. The October 2016 to November 2016 percent change was revised from up 0.1 percent (±0.5 percent)* to up 0.2 percent.
Retail trade sales were up 0.8 percent (±0.5 percent) from November 2016, and up 4.3 percent (±0.7 percent) from last year. Nonstore retailers were up 13.2 percent (±1.8 percent) from December 2015, while Miscellaneous stores were up 7.1 percent (±4.6 percent) from last year.
-
13:30
U.S.: PPI excluding food and energy, Y/Y, December 1.6% (forecast 1.5%)
-
13:30
U.S.: Retail sales excluding auto, December 0.2% (forecast 0.5%)
-
13:30
U.S.: Retail sales, December 0.6% (forecast 0.7%)
-
13:30
U.S.: PPI excluding food and energy, m/m, December 0.2% (forecast 0.1%)
-
13:30
U.S.: Retail Sales YoY, December 4.1%
-
13:30
U.S.: PPI, m/m, December 0.3% (forecast 0.3%)
-
13:30
U.S.: PPI, y/y, December 1.6% (forecast 1.6%)
-
13:14
-
13:00
Orders
EUR/USD
Offers 1.0650 1.0680 1.0700 1.0725-30 1.0750 1.0785 1.0800
Bids 1.0620 1.0600 1.0580 1.0550 1.0520 1.0500 1.0480 1.0450
GBP/USD
Offers 1.2200 1.2225-30 1.2250 1.2280 1.2300 1.2320-25 1.2360 1.2380 1.2400
Bids 1.2150 1.2125-30 1.2100 1.2080 1.20550 1.2030 1.2000
EUR/GBP
Offers 0.8750 0.8780 0.8800 0.8830 0.8850
Bids 0.8700 0.8685 0.8665 0.8650 0.8620 0.8600
EUR/JPY
Offers 122.30 122.50 122.85 123.00 123.30 123.60 123.85 124.00
Bids 121.50 121.20 121.00 120.80 120.50 120.00
USD/JPY
Offers 114.80 115.00 115.20 115.50 115.80 116.00 116.20-25 116.50
Bids 114.50 114.20 114.00 113.80 113.50 113.20-25 113.00 112.85 112.65 112.50
AUD/USD
Offers 0.7520 0.7550 0.7575 0.7600 0.7620 0.7650-60
Bids 0.7475-80 0.7450 0.7430 0.7400 0.7380 0.7350-55
-
10:30
Greece's Cash Reserves Can Last Up To May, Says Eurobank
-
09:47
Option expiries for today's 10:00 ET NY cut
EUR/USD 1.0500 (EUR 2.42bln) 1.0600 (505m) 1.0700 (2.41bln) 1.0800 (281m) 1.0850 (690m)
USD/JPY 115.00 (USD 1.3bln) 116.00 (700m) 117.00 (420m) 117.25 (380m) 118.00 (839m)
USD/CAD 1.3245 (USD 300m) 1.3300 (1.26bln)
NZD/USD 0.7005 (NZD 173m)
Информационно-аналитический отдел TeleTrade
-
09:30
Goldman Sachs staying short GBP, more downside expected on Article 50
"We see the path for the British Pound as a function of two things.
First, there is the question of where GBP/$ would trade in the event of a "hard Brexit." We have used several approaches to show that Sterling could fall between 20-40 percent relative to pre-referendum levels, with a low of 1.10 for GBP/$ quite possible.
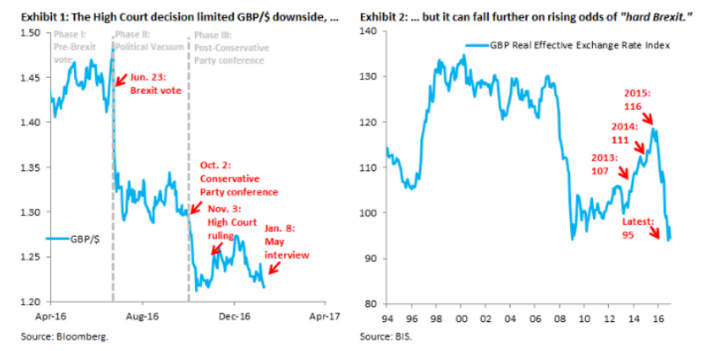
Second, what probability should markets assign to "hard Brexit." In our minds, it has been this probability that has been moving the Pound around since June of last year. In particular, the political vacuum following the referendum meant that there was some probability that Article 50 might never be triggered. In the presence of large speculative shorts, this kept the Pound supported after its initial referendum fall. But the Conservative party conference changed that, with Prime Minster May committing to trigger Article 50 by March. We thought the market would price a greater probability of "hard Brexit" as a result, reiterating our near-term target of 1.20 for Cable in the days ahead of the 'flash crash'. The November High Court decision was a move back in the opposite direction, reducing in the market's eyes the odds that Article 50 could be triggered by March and, more fundamentally, limiting how aggressive the government could be in its negotiating position. This buoyed Cable, pushing it back up towards 1.28 and pre-'flash crash' levels in mid-December (Exhibit 1). However, our underlying conviction is that Sterling needs to weaken quite a bit more, given that the trade-weighted decline is only 13 percent so far (Exhibit 2), well shy of our 20-40 percent range.
We think the most recent decline, sparked by Prime Minister May's latest speech re-affirming her Brexit vision, is the start of that process, with the FX market only beginning to re-engage in the idiosyncratic Sterling down story.
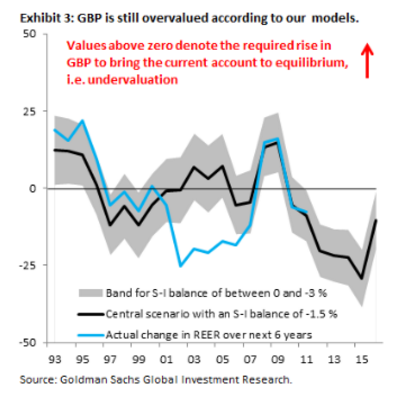
Our 3-, 6- and 12-month forecasts for GBP/$ now stand at 1.20, 1.18 and 1.14, respectively, with risks tilted in the direction of a sharper, more front-loaded decline. Our conviction for this forecast rests on the fact that the fall in GBP is still relatively small in trade-weighted terms, something that has been overlooked, while we also think the market continues to under-price Prime Minister May's commitment to trigger Article 50 by March. Taking into account that the Pound has fallen 13 percent from pre-Brexit vote levels, this is still well short of the upper bound of our range between 20-40 percent that we derive using various approaches (Exhibit 3).
We continue to think that - even with the decline since June - the Pound is not yet cheap and that more declines are coming. We remain short Sterling also in our Top Trade for 2017, where we are short GBP and EUR equally weighted against the Dollar".
Copyright © 2017 Goldman Sachs, eFXnews™
-
08:30
Today’s events
-
At 09:30 GMT the Bank of England Member of the Commission Michael Saunders will make a speech
-
At 14:30 GMT FOMC member Patrick T. Harker will deliver a speech
-
-
08:28
Australian Dollar consolidates after strong weekly rally
-
07:21
Options levels on friday, January 13, 2017
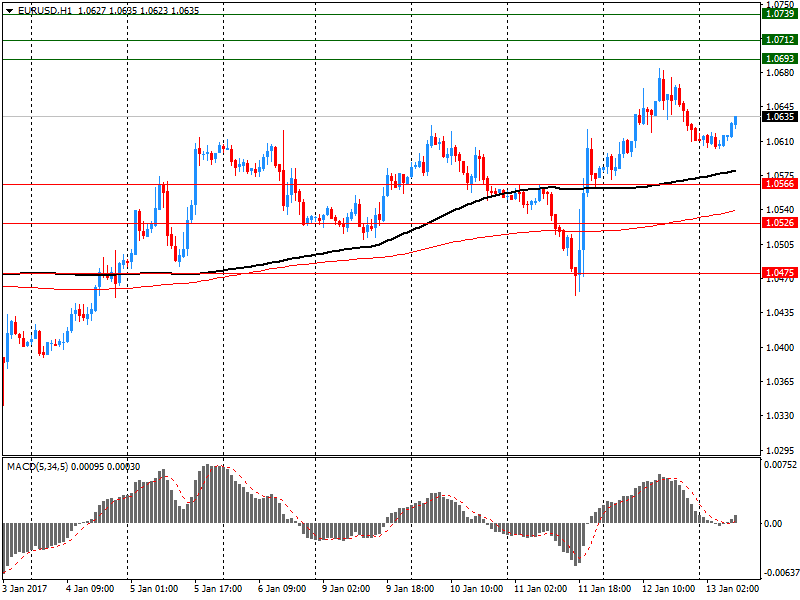
EUR/USD
Resistance levels (open interest**, contracts)
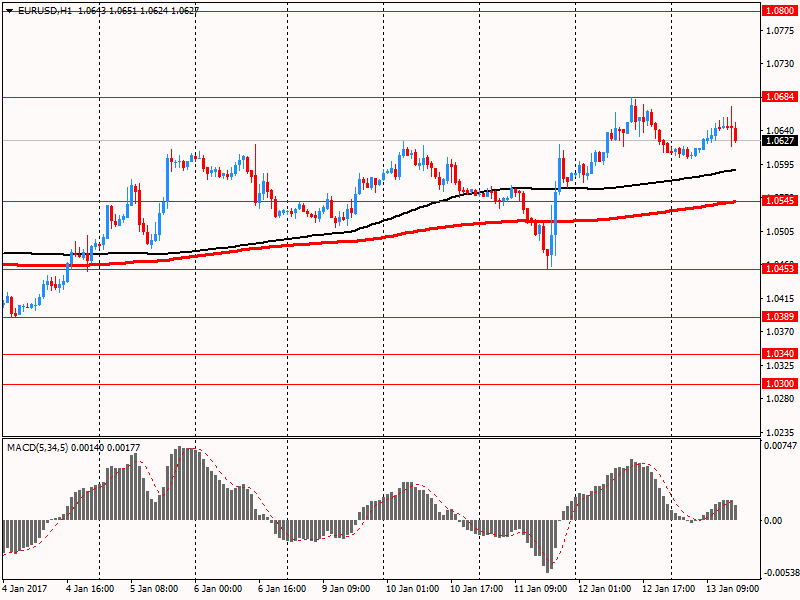
$1.0739 (2214)
$1.0712 (442)
$1.0693 (254)
Price at time of writing this review: $1.0635
Support levels (open interest**, contracts):
$1.0566 (1201)
$1.0526 (1145)
$1.0475 (2385)
Comments:
- Overall open interest on the CALL options with the expiration date March, 13 is 53089 contracts, with the maximum number of contracts with strike price $1,1500 (3331);
- Overall open interest on the PUT options with the expiration date March, 13 is 62478 contracts, with the maximum number of contracts with strike price $1,0000 (5389);
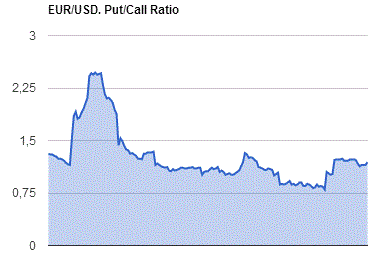
- The ratio of PUT/CALL was 1.18 versus 1.19 from the previous trading day according to data from January, 12
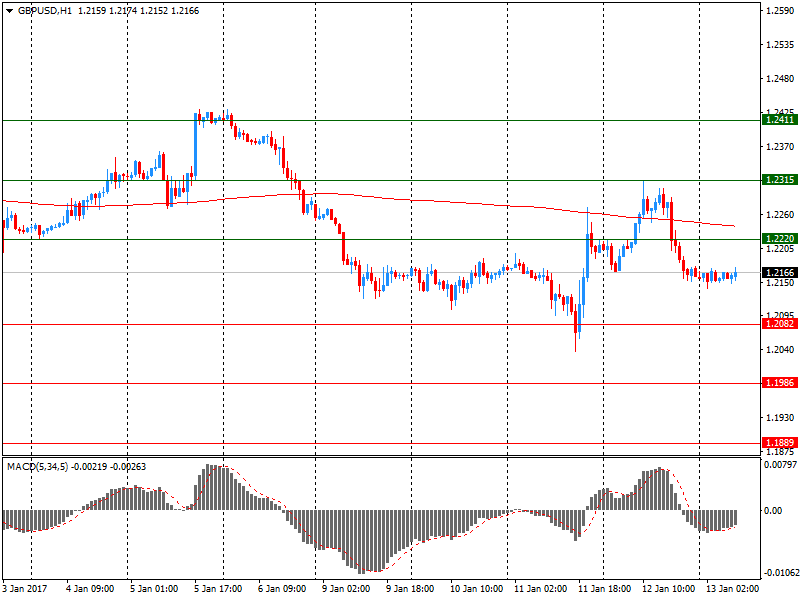
GBP/USD
Resistance levels (open interest**, contracts)
$1.2411 (330)
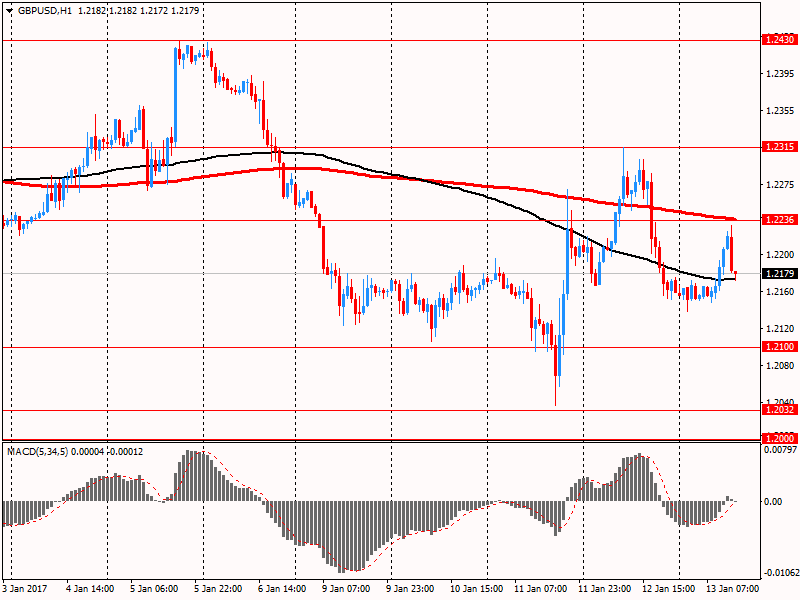
$1.2315 (437)
$1.2220 (222)
Price at time of writing this review: $1.2166
Support levels (open interest**, contracts):
$1.2082 (467)
$1.1986 (2161)
$1.1889 (3022)
Comments:
- Overall open interest on the CALL options with the expiration date March, 13 is 16654 contracts, with the maximum number of contracts with strike price $1,2800 (3018);
- Overall open interest on the PUT options with the expiration date March, 13 is 20859 contracts, with the maximum number of contracts with strike price $1,1500 (3218);
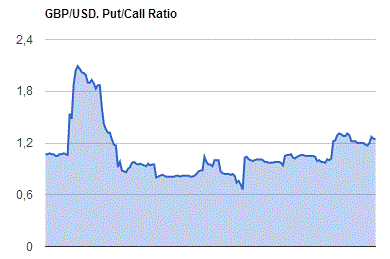
- The ratio of PUT/CALL was 1.25 versus 1.24 from the previous trading day according to data from January, 12
* - The Chicago Mercantile Exchange bulletin (CME) is used for the calculation.
** - Open interest takes into account the total number of option contracts that are open at the moment.
-
07:03
German index of selling prices in wholesale trade was down 1.0% on an annual average
The index of selling prices in wholesale trade was down 1.0% on an annual average in 2016 from the preceding year, as reported by the Federal Statistical Office (Destatis).
Compared with December 2015, the index increased by 2.8% in December 2016. In November 2016 the annual rate of change was +0.8% and in October 2016 it was +0.5%, respectively.
Compared with November 2016 the index of wholesale prices rose by 1.2% in December 2016.
-
07:01
UAE oil minister, Suhail Al-Mazrui: the price of $ 50 a barrel is too low for most of the producer countries
Analysts of the IMF stated that the price of $ 60 per barrel is the minimum cost-effective for the United Arab Emirates.
-
07:00
Yellen: Fed Working on Behalf of Main Street, Not Wall Street
-
Fed Not Trying to Give Advantage to One Group Over Another With Policy Decisions
-
Made No Comments on Monetary Policy, Interest Rates
-
Fed Committed to Promoting Diversity in Fed Ranks, Economics Profession
-
Consumers Skilled in Financial Management Better Able to Weather Hard Times
-
Improving Education Can Help Spur Economic Growth, Raise Living Standards
-
Without Fed Emergency Lending, 2008 Crisis Outcomes Would Have Been 'Far Worse'
-
Important for Students to Understand Fed's Unconventional Monetary Policies
-
Women Hugely Underrepresented in Economics Jobs, College Majors, PhD Programs
-
-
06:55
China's trade surplus declined in December
As reported today by the General Customs Administration of China, China's trade surplus of the foreign trade balance in December was $ 40.81 billion. Analysts had expected an increase of $ 46.5 billion
The trade balance - the indicator assesses the overall ratio of exports and imports of goods and services. A positive balance indicates a surplus, while a negative a deficit. As China's economy has a major impact on the global economy, this indicator has a specific meaning for the Forex market.
As the volume of exports from China fell by 6.1% year on year, lower than the previous value of -1.9% and -3.5% forecast. Imports to China increased by 3.1%, after rising 4.7% in October.
-
03:01
China: Trade Balance, bln, December 40.82 (forecast 46.5)
-
