Market news
-
14:55
U.S treasury yields retreat further from near 5-month lows in the wake of stronger-than-forecast U. Michigan U.S consumer sentiment data in early April
-
14:28
Merkel would beat social democrats' Schulz in theoretical direct vote for chancellor by 46 pct to - Deutschlandtrend poll
-
14:01
Michigan consumer sentiment tops expectations
Consumer sentiment inched upward in early April mainly due to more favorable views of current economic conditions. The Current Economic Conditions Index rose to its highest level since 2000 and nearly reached its all-time peak of 121.1 set in 1999. The Expectations Index improved only slightly, remaining largely unchanged at favorable levels for the past three months.
While partisanship had no impact on the Current Conditions Index (Democrats and Republicans differed by just 0.4 points), the data suggest the beginning of a convergence on the Expectations Index, with the figure for Democrats rising 7% and falling for Republicans by 7%, although the gap still remained an astonishing 50.5 Index points.
-
14:00
U.S.: Reuters/Michigan Consumer Sentiment Index, April 98 (forecast 96.5)
-
13:46
Option expiries for today's 10:00 ET NY cut
EURUSD: 1.0550 (EUR 214m) 1.0575 (310m) 1.0650 (535m) 1.0700 (930m) 1.0750 (455m)
USDJPY: 108.00 (USD 270m) 108.40-50 (1.4bln) 109.00-10 (370m) 109.50 (188m) 109.80 (190m) 110.00 (645m)
GBPUSD: 1.2500 (GBP 222m)
EURGBP: 0.8300 (EUR 212m) 0.8550 (234m)
AUDUSD: 0.7400 (AUD 200m) 0.7500 (362m) 0.7600 (230m) 0.7700 (395m)
USDCAD 1.3100 (USD 440m) 1.3200-05 (646m) 1.3280 (896m) 1.3300 ( 733m) 1.3450 (260m)
NZDUSD: 0.7000 (NZD 200m)
-
12:42
Canadian manufacturing sales edged down 0.2%
Manufacturing sales edged down 0.2% in February to $53.6 billion, following three consecutive monthly increases.
The largest declines were in the motor vehicle assembly and petroleum and coal product manufacturing industries. However, these decreases were largely offset by gains in the aerospace products and parts, primary metal and machinery industries.
Sales were down in 10 of the 21 industries, representing 37% of the Canadian manufacturing sector.
Once the effects of price changes are taken into consideration, manufacturing sales in volumes edged up 0.1% in February.
-
12:41
US Producer Price Index declined 0.1 percent in March
The Producer Price Index for final demand declined 0.1 percent in March, seasonally adjusted, the U.S. Bureau of Labor Statistics reported today. Final demand prices advanced 0.3 percent in February and 0.6 percent in January. On an unadjusted basis, the final demand index rose 2.3 percent for the 12 months ended March 2017, the largest increase since moving up 2.4 percent for the 12 months ended March 2012.
In March 2017, three-fourths of the decrease in the final demand index is attributable to prices for final demand services, which fell 0.1 percent. The index for final demand goods also inched down 0.1 percent.
Prices for final demand less foods, energy, and trade services edged up 0.1 percent in March, the tenth straight advance. For the 12 months ended in March, the index for final demand less foods, energy, and trade services climbed 1.7 percent.
-
12:40
US unemployment claims continue to decline
In the week ending April 8, the advance figure for seasonally adjusted initial claims was 234,000, a decrease of 1,000 from the previous week's revised level. The previous week's level was revised up by 1,000 from 234,000 to 235,000. The 4-week moving average was 247,250, a decrease of 3,000 from the previous week's revised average. The previous week's average was revised up by 250 from 250,000 to 250,250.
-
12:30
U.S.: PPI, m/m, March -0.1% (forecast 0%)
-
12:30
U.S.: PPI excluding food and energy, m/m, March 0% (forecast 0.2%)
-
12:30
U.S.: PPI, y/y, March 2.3% (forecast 2.4%)
-
12:30
U.S.: PPI excluding food and energy, Y/Y, March 1.6% (forecast 1.8%)
-
12:30
Canada: New Housing Price Index, MoM, February 0.4% (forecast 0.2%)
-
12:30
U.S.: Initial Jobless Claims, 234 (forecast 245)
-
12:30
U.S.: Continuing Jobless Claims, 2028 (forecast 2028)
-
12:30
Canada: Manufacturing Shipments (MoM), February -0.2% (forecast -0.7%)
-
11:59
Orders
EUR/USD
Offers: 1.0670 1.0685 1.0700 1.0730 1.0750 1.0780 1.0800
Bids: 1.0620 1.0600 1.0580 1.0565 1.0550 1.0530 1.0500
GBP/USD
Offers: 1.2580 1.2600 1.2620 1.2650 1.2675-80 1.2700
Bids: 1.2540 1.2520 1.2500 1.2480 1.2465 1.2450 1.2430 1.2400
EUR/JPY
Offers: 116.30 116.50 116.80 117.00 117.30 117.50
Bids: 115.85 115.50 115.20 115.00
EUR/GBP
Offers: 0.8500-05 0.8520 0.8550-55 0.8580 0.8600
Bids: 0.8470-75 0.8450 0.8425-30 0.8400
USD/JPY
Offers: 109.20-25 109.50 109.80 110.00 110.30 110.50
Bids: 108.70-75 108.50 108.30 108.00 1.0780 1.0750
AUD/USD
Offers: 0.7600 0.7620 0.7650 0.7670 0.7700
Bids: 0.7560 0.7530 0.7500 0.7480-85 0.7465 0.7450
-
11:50
Ukraine central bank expects current account deficit of $4.3 bln in 2017-2019
-
Expects foreign reserves to grow to $21.1 bln by end-2017 if it receives imf tranches and related loans
-
Keeps 2017 gdp forecast unchanged at 1.9 pct
-
Raises 2018 gdp forecast to 3.2 pct
-
Keeps 2017 inflation forecast at 9.1 pct
-
Expects inflation to slow to single figures in q4
-
Trade blockade in eastern regions will not affect inflation significantly
-
-
09:48
RBI: cut-off price for 6.97 pct 2026 bond at 101.10 rupees, yield at 6.8080 pct
-
09:16
Czech Central bank Apr 6 mtg minutes: renewed use of fx rate, other unconventional tool could not be ruled out if risk of deflation was to re-emerge, this highly unlikely to happen in near future
-
08:41
Bank of England: net balance of 18.8 pct of lenders expect to tighten supply of unsecured consumer credit, largest share since q4 2008
-
Lenders expect to tighten supply of unsecured consumer credit
-
Lenders report weaker business investment exerted "significant drag" on demand for corporate lending in q1
-
-
08:40
Forex option contracts rolling off today at 14.00 GMT:
EURUSD: 1.0550 (EUR 214m) 1.0575 (310m) 1.0650 (535m) 1.0700 (930m) 1.0750 (455m)
USDJPY: 108.00 (USD 270m) 108.40-50 (1.4bln) 109.00-10 (370m) 109.50 (188m) 109.80 (190m) 110.00 (645m)
GBPUSD: 1.2500 (GBP 222m)
EURGBP: 0.8300 (EUR 212m) 0.8550 (234m)
AUDUSD: 0.7400 (AUD 200m) 0.7500 (362m) 0.7600 (230m) 0.7700 (395m)
USDCAD 1.3100 (USD 440m) 1.3200-05 (646m) 1.3280 (896m) 1.3300 ( 733m) 1.3450 (260m)
NZDUSD: 0.7000 (NZD 200m)
-
08:38
Japan’s Suga: FX Stability Is Important, Watching Market Moves With Sense Of Urgency - Reuters
-
08:35
Russia Central Bank's Yudayeva says high oil price volatility remains a risk for Russian currency market
-
Risks linked to possible outflow from OFZ market low
-
Capital inflow into OFZ market, in our assessment, could be rather stable
-
Strengthening of rouble in q1 was dictated by inflow of fx via foreign trade
-
-
07:25
Swiss PPI rose 1.3% in March, as in the previous month
The Producer and Import Price Index rose in March 2017 by 0.1% compared with the previous month, reaching 100.3 points (base December 2015 = 100). The slight rise is due in particular to higher prices for scrap. Compared with March 2016, the price level of the whole range of domestic and imported products rose by 1.3%. These are some of the findings from the Federal Statistical Office (FSO).
-
07:15
Switzerland: Producer & Import Prices, y/y, March 1.3% (forecast 0.9%)
-
07:15
Switzerland: Producer & Import Prices, m/m, March 0.1% (forecast 0.1%)
-
07:14
French CPI accelerated to +0.6% over a month after a weak rebound in Feb
In March 2017, the Consumer Prices Index (CPI) accelerated to +0.6% over a month after a weak rebound by 0.1% in February. Seasonally adjusted, it was stable, after having decreased by 0.2% in February. Year on year, consumer prices slowed down slightly (+1.2% after +1.3%).
Over a month, the acceleration resulted from a rebound in the prices of manufactured products after the end of winter sales and from a further rise in tobacco prices. Contrariwise, food prices slipped back due to fresh products. Energy prices fell too, because of a downturn in petroleum product prices. Besides, services prices were at a standstill.
-
07:01
France: CPI, y/y, March 1.1% (forecast 1.1%)
-
06:47
Negative start of trading on the main European stock markets expected: DAX -0.3%, CAC40 -0.2%, FTSE without change.
-
06:47
France: CPI, m/m, March 0.6% (forecast 0.6%)
-
06:44
Options levels on thursday, April 13, 2017
EUR/USD
Resistance levels (open interest**, contracts)
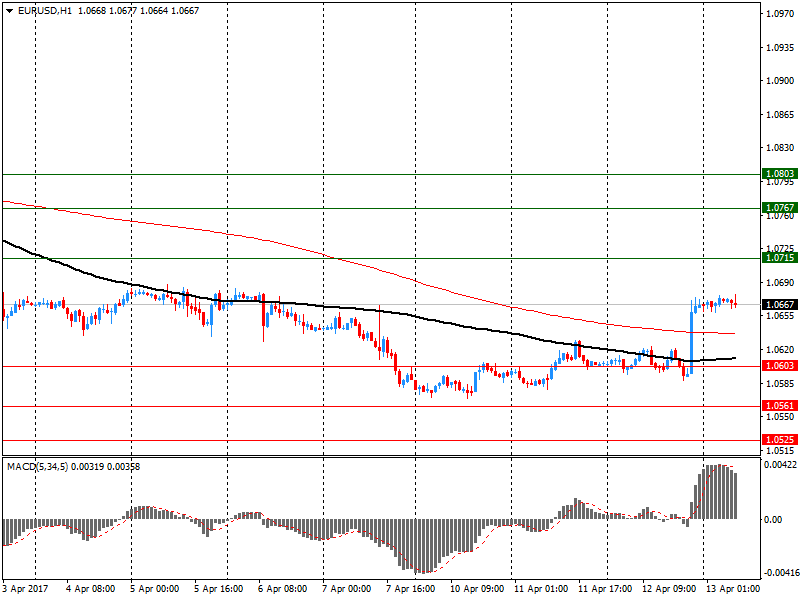
$1.0803 (626)
$1.0767 (1070)
$1.0715 (462)
Price at time of writing this review: $1.0667
Support levels (open interest**, contracts):
$1.0603 (131)
$1.0561 (506)
$1.0525 (781)
Comments:
- Overall open interest on the CALL options with the expiration date June, 9 is 53991 contracts, with the maximum number of contracts with strike price $1,1000 (4995);
- Overall open interest on the PUT options with the expiration date June, 9 is 58153 contracts, with the maximum number of contracts with strike price $1,0400 (5249);
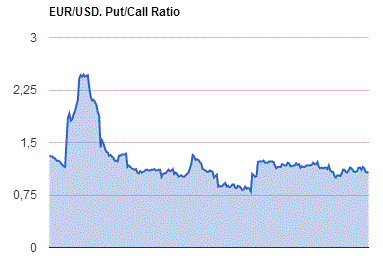
- The ratio of PUT/CALL was 1.08 versus 1.07 from the previous trading day according to data from April, 12

GBP/USD
Resistance levels (open interest**, contracts)
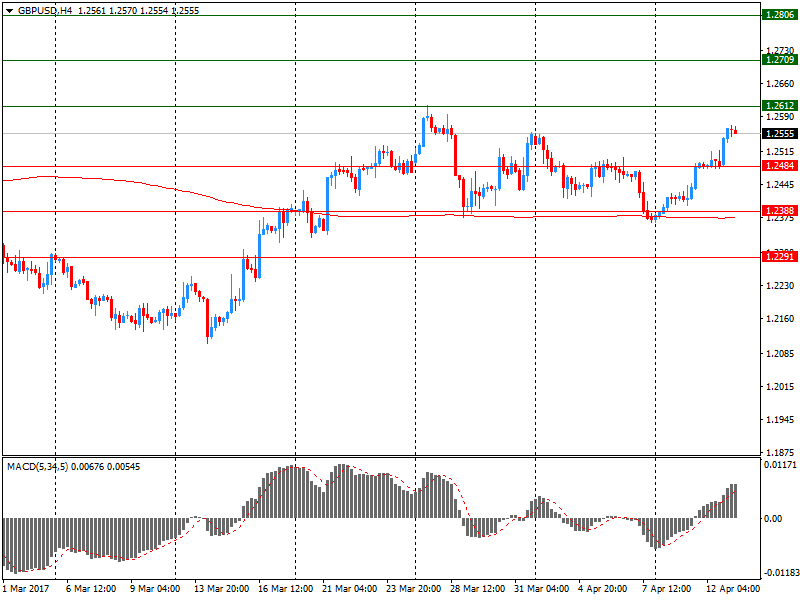
$1.2806 (1075)
$1.2709 (625)
$1.2612 (425)
Price at time of writing this review: $1.2555
Support levels (open interest**, contracts):
$1.2484 (590)
$1.2388 (702)
$1.2291 (807)
Comments:
- Overall open interest on the CALL options with the expiration date June, 9 is 16085 contracts, with the maximum number of contracts with strike price $1,3000 (1336);
- Overall open interest on the PUT options with the expiration date June, 9 is 18489 contracts, with the maximum number of contracts with strike price $1,1500 (3063);
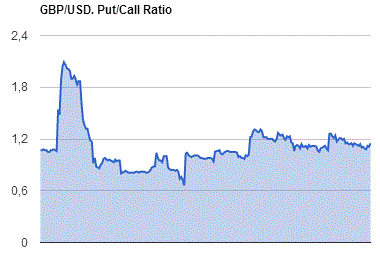
- The ratio of PUT/CALL was 1.15 versus 1.11 from the previous trading day according to data from April, 12

* - The Chicago Mercantile Exchange bulletin (CME) is used for the calculation.
** - Open interest takes into account the total number of option contracts that are open at the moment.
-
06:34
Chineze exports and imports rose more than expected in March
China's exports rebounded at a faster than expected pace, while growth in imports slowed in March, data from the General Administration of Customs showed, cited by rttnews.
In dollar terms, exports grew 16.4 percent year-on-year in March, reversing February's 1.3 percent decline. Shipments were expected to rise 3.4 percent.
At the same time, imports advanced 20.3 percent after expanding 38.1 percent in February. Economists had forecast a 15.5 percent increase.
As a result, the trade surplus totaled $23.9 billion in March, smaller the expected surplus of $12.5 billion.
-
06:31
New Zeeland food prices fell 0.3 percent
Food prices fell 0.3 percent in the March 2017 month. After seasonal adjustment, food prices fell 0.4 percent.
In March 2017 compared with February 2017:
-
Fruit and vegetable prices fell 3.0 percent (down 2.0 percent after seasonal adjustment).
-
Meat, poultry, and fish prices rose 0.3 percent.
-
Grocery food prices rose 0.2 percent (up 0.2 percent after seasonal adjustment).
-
Non-alcoholic beverage prices fell 0.4 percent.
-
Restaurant meals and ready-to-eat food prices rose 0.1 percent.
-
-
06:30
Economic confidence is soaring as we unleash the power of private sector job creation and stand up for the American Workers #AmericaFirst @realDonaldTrump
-
06:29
Big jump for Australian employment in March. AUD/USD rally strong
-
Employment increased 16,500 to 12,033,400.
-
Unemployment increased 5,800 to 749,500.
-
Unemployment rate increased by less than 0.1 pts to 5.9%.
-
Participation rate increased by less than 0.1 pts to 64.7%.
-
Monthly hours worked in all jobs decreased 0.4 million hours to 1,668.5 million hours.
Seasonally adjusted estimates (monthly change)
-
Employment increased 60,900 to 12,059,600. Full-time employment increased 74,500 to 8,238,600 and part-time employment decreased 13,600 to 3,821,000.
-
Unemployment increased 4,000 to 753,100. The number of unemployed persons looking for full-time work increased 2,900 to 528,600 and the number of unemployed persons only looking for part-time work increased 1,100 to 224,500.
-
Unemployment rate remained steady at 5.9%.
-
Participation rate increased by 0.2 pts to 64.8%.
-
Monthly hours worked in all jobs increased 3.2 million hours to 1,664.2 million hours.
-
-
06:25
Consumer prices in Germany were 1.6% higher in March 2017
Consumer prices in Germany were 1.6% higher in March 2017 than in March 2016. The inflation rate - measured by the consumer price index - thus decreased. In February 2017, it had been +2.2%. Compared with the previous month, the consumer price index rose by 0.2% in March 2017. The Federal Statistical Office (Destatis) thus confirms its provisional overall results of 30 March 2017.
The inflation rate in March 2017 was characterised mainly by the development of energy prices, as had been the case in the previous months. The year-on-year price increase (+5.1%), however, was markedly smaller than in February 2017 (+7.2%). This applies in particular to heating oil (+25.2%; February 2017: +43.8%) and motor fuels (+11.9%; February 2017: +15.6%). One of the reasons for the lower rates in March 2017 is that mineral oil product prices were up a year ago (basis-related effect). For the other energy products, the year-on-year rates of price increase in March 2017 were lower (for example, electricity: +1.5%; gas: -3.3%). Excluding energy prices, the inflation rate in March 2017 would have been +1.2%; excluding the prices of mineral oil products, it would have been +1.0%.
Food prices, too, were higher (+2.3%) in March 2017 than in March 2016. In February 2017, the rate of food price increase had been +4.4%. In March 2017, a considerable year-on-year increase in prices was recorded especially for edible fats and oils (+16.5%, including butter: +33.8%). Consumers paid markedly more than a year earlier also for fish and fish products (+4.2%), vegetables (+4.0%) and dairy products (+3.1%). The price increases regarding other food groups were rather moderate (for example, meat and meat products: +1.4%; confectionery: +1.1%).
-
06:24
US President Trump: U.S. Dollar 'is getting too strong'
-
06:01
Germany: CPI, m/m, March 0.2% (forecast 0.2%)
-
06:01
Germany: CPI, m/m, March 0.2% (forecast 0.2%)
-
06:01
Germany: CPI, y/y , March 1.6% (forecast 1.6%)
-
03:14
China: Trade Balance, bln, March 23.93 (forecast 10)
-
01:31
Australia: Changing the number of employed, March 60.9 (forecast 20)
-
01:30
Australia: Unemployment rate, March 5.9% (forecast 5.9%)
-
01:00
Australia: Consumer Inflation Expectation, April 4.1%
-

