Market news
-
20:00
U.S.: Federal budget , September 33 (forecast 25)
-
15:14
BOE's Carney: "Not Indifferent" to Pound But Don't Target Exchange Rate
-
Economy in Period of Major Adjustment
-
Expect Small Overshoot in Inflation
-
Economy Performing Broadly in Line With Expectations
-
Uncertainty Slowing the Economy
-
-
14:15
US Sentiment Index slipped in early October to its lowest level since last September - UoM
The Sentiment Index slipped in early October to its lowest level since last September and the second lowest level in the past two years. The early October loss was concentrated among households with incomes below $75,000, whose Index fell to its lowest level since August of 2014.
In contrast, confidence among upper income households remained unchanged in early October from last month, and more importantly, at a level that was nearly identical to its average in the prior twenty-four months (98.3 vs. 98.2).
Perhaps the most concerning figure was a decline in the Expectations Index, which fell to its lowest level in the past two years, again mainly due to declines among households with incomes below $75,000. It is likely that the uncertainty surrounding the presidential election had a negative impact, especially among lower income consumers, and without that added uncertainty, the confidence measures may not have weakened.
Prospects for renewed gains, other than a relief rally following the election results, would require somewhat larger wage increases and continued job growth as well as the maintenance of low inflation. Overall, real personal consumption can be expected to increase by 2.5% through mid 2017.
-
14:13
U.S. business inventories rose in August boosted by a larger increase in stocks at retailers
U.S. business inventories rose in August, boosted by a larger increase in stocks at retailers than previously estimated, supporting views that inventory investment will contribute to economic growth in the third quarter.
The Commerce Department said on Friday business inventories increased 0.2 percent after being unchanged in July.
August's rise in inventories, a key component of gross domestic product, was in line with economists' expectations.
Retail inventories increased 0.6 percent in August, instead of rising 0.5 percent as reported in an advance report published last month. They fell 0.2 percent in July.
-
14:00
U.S.: Business inventories , August 0.2% (forecast 0.2%)
-
14:00
U.S.: Reuters/Michigan Consumer Sentiment Index, October 87.9 (forecast 91.9)
-
13:46
Option expiries for today's 10:00 ET NY cut
EUR/USD 1.0925 (EUR 611m) 1.0950 (299m) 1.1000 (320m) 1.1050 (269m) 1.1090 (233m) 1.1150 (833m) 1.1170 (407m) 1.1288 (815m) 1.1295-1.1300 (524m)
GBP/USD 1.2275 (GBP 228m) 1.2295 (204m) 1.2345-50 (634m) 1.2400 (310m) 1.2450 (226m) 1.2800 (789m) 1.3000 (1.04bln)
USD/JPY 102.00 (USD 1.21bln) 102.40-50 (1.23bln) 103.75 (906m) 105.00 (1.06bln)
USD/CHF: 0.9700 (250m) 0.9885 (225m)
EUR/GBP: 0.8850 (EUR 402m) 0.9000 (599m)
EUR/JPY 114.00 (EUR 1.0bln)
AUD/USD 0.7400 (AUD 733m) 0.7450 (468m) 0.7500 (586m) 0.7750 (433m)
USD/CAD: 1.3150 (USD 386m) 1.3180 (312m) 1.3195-1.3200 (917m), C$1.3300-05($352mn)
AUD/JPY 76.00 (AUD 208m) 76.70 (AUD 955m)
NZD/USD: 0.7075 (NZD 223m) 0.7120 (NZD 235m)
-
13:14
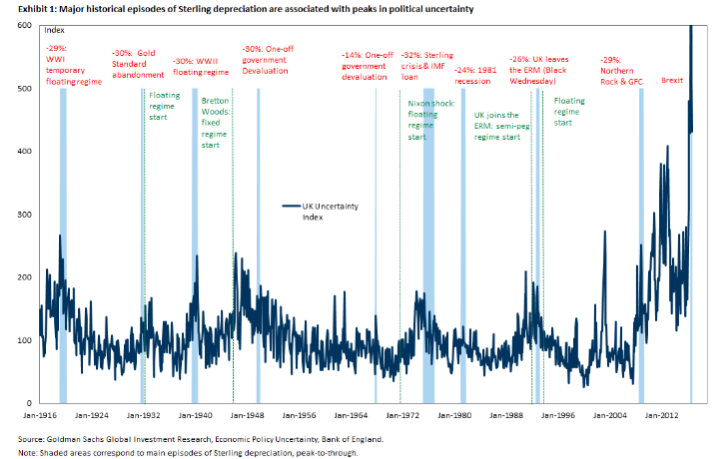
5 Reasons Why Sterling Could Fall By Add'l 7% In 2 Months - Goldman Sachs
"With the prospect of a 'hard Brexit' becoming a reality, investors who were previously expecting a 'soft' Brexit, or no Brexit at all, have updated their priors, and Sterling has depreciated about 5 percent over the space of a week against G10 currencies. GBP/$ is about 1.5 percent above 1.20, which is our 3-months forecast published on 5 July 2016.
We quantify the magnitude of a potential further fall in the Pound. Based on our benchmark model that assesses the impact of political uncertainty on currencies, the cumulative depreciation of Cable could be as large as 25 percent by year-end, an additional 7 percent decline from its current value.
While this estimate is subject to the usual degree of model uncertainty and should be viewed with a degree of caution, the following additional considerations lead us to think that such a downside move in Sterling is quite likely to materialize over the next couple of months.
First, while difficulties and hostilities around the process of negotiating Brexit have come to the forefront in the past week, in our view, the negative news has not yet been fully reflected in FX.
Second, we expect data to deteriorate over the next year, surprising more to the downside than it has done so far, also weighing negatively on the currency.
Third, we expect that monetary and fiscal policy will continue to place more weight on economic activity than on inflation; hence, policy news will be at worst neutral and at best negative for the currency.
Fourth, the repricing of a policy rate hike in December by the Fed and the USD strength associated with it can also contribute to Cable downside.
Finally, at the current juncture, we continue to think that, despite the large current account deficit, the UK will not face a balance of payments crisis of the type seen in emerging markets. A sudden stop of capital inflows forcing a much larger devaluation of the currency is unlikely, as long as the UK's rule of law and institutions remain stable and business friendly. That said, even without a balance of payments crisis, we show below that there have been eight episodes in the UK where the currency depreciated by 25 percent or more over a period of less than a year, even though in many of these cases the exchange rate regime was either fixed or pegged, and the UK government either moved to a flexible regime or announced a one-off devaluation".
Copyright © 2016 Goldman Sachs, eFXnews™
-
12:40
Improvement for US retail sales in September
The U.S. Census Bureau announced today that advance estimates of U.S. retail and food services sales for September, adjusted for seasonal variation and holiday and trading-day differences, but not for price changes, were $459.8 billion, an increase of 0.6 percent (±0.5%) from the previous month, and 2.7 percent (±0.9%) above September 2015.
Total sales for the July 2016 through September 2016 period were up 2.4 percent (±0.5%) from the same period a year ago. The July 2016 to August 2016 percent change was revised from down 0.3 percent (±0.5%)* to down 0.2 percent (±0.2%).
Retail trade sales were up 0.6 (±0.5%) from August 2016, and up 2.2 percent (±0.7%) from last year. Nonstore retailers were up 10.6 percent (±1.6%) from September 2015, while Food services and drinking places were up 6.1 percent (±3.3%) from last year.
-
12:35
US producer prices rose in line with expectations
The Producer Price Index for final demand rose 0.3 percent in September, seasonally adjusted, the U.S. Bureau of Labor Statistics reported today. Final demand prices were unchanged in August and declined 0.4 percent in July. On an unadjusted basis, the final demand index increased 0.7 percent for the 12 months ended in September, the largest 12-month rise since advancing 0.9 percent in December 2014.
In September, over three-quarters of the advance in final demand prices can be traced to a 0.7 percent increase in the final demand goods index. Prices for final demand services inched up 0.1 percent.
The index for final demand less foods, energy, and trade services moved up 0.3 percent in September, the same as in August. For the 12 months ended in September, prices for final demand less foods, energy, and trade services rose 1.5 percent, the largest increase since climbing 1.5 percent for the 12 months ended November 2014. -
12:30
U.S.: Retail sales, September 0.6% (forecast 0.6%)
-
12:30
U.S.: PPI, y/y, September 0.7% (forecast 0.6%)
-
12:30
U.S.: Retail Sales YoY, September 2.7%
-
12:30
U.S.: PPI, m/m, September 0.3% (forecast 0.2%)
-
12:30
U.S.: PPI excluding food and energy, Y/Y, September 1.2% (forecast 1.2%)
-
12:30
U.S.: PPI excluding food and energy, m/m, September 0.2% (forecast 0.1%)
-
12:01
Fed's Rosengren: Expecting to See More Wage Growth -CNBC
-
`Seems Appropriate' to Hike Rates in December
-
Not Worried About Inflationary Dangers
-
Favors Having Sustainable Unemployment Rate
-
Concerned About Commercial Real Estate
-
Expects Unemployment at 4.5% by End of 2017
-
Concerned About Jobs Data Falling Below Full Employment
-
-
09:55
Mark Carney: BOE wants to remove uncertainty around inflation and rates
-
UK faces wealth distribution issues
-
UK banking system will continue to function regardless of what happens in Europe, China or the UK
-
All G20 leaders raised concerns about inclusive growth
*forexlive -
-
09:19
UK construction output declines significantly
This is the second release of construction output covering data post-EU referendum. Following a revised increase in July 2016 of 0.5%, construction output decreased in August 2016 by 1.5%. You should note that we always warn against overly interpreting one month's figures.
All new work, and repair and maintenance reported decreases, falling by 1.4% and 1.5% respectively, with the largest downwards contribution in all new work coming from infrastructure.
The underlying pattern as suggested by the 3 month on 3 month movement in output in the construction industry decreased by 1.3%.
The longer-term picture as suggested by the year-on-year movement shows output in the construction industry increased by 0.2% compared with August 2015 with all new work increasing by 1.1%, however, repair and maintenance decreased by 1.3%.
-
09:18
EuroZone trade balance surplus increased in August
The first estimate for euro area (EA19) exports of goods to the rest of the world in August 2016 was €160.3 billion, an increase of 8% compared with August 2015 (€148.1 bn). Imports from the rest of the world stood at €141.9 bn, a rise of 4% compared with August 2015 (€136.9 bn). As a result, the euro area recorded a €18.4 bn surplus in trade in goods with the rest of the world in August 2016, compared with +€11.2 bn in August 2015. Intra-euro area trade rose to €121.6 bn in August 2016, up by 6% compared with August 2015.
In January to August 2016, euro area exports of goods to the rest of the world stood at €1 335.3 bn (a decrease of 1% compared with January-August 2015) and imports at €1 156.6 bn (a decrease of 3% compared with JanuaryAugust 2015). As a result the euro area recorded a surplus of €178.7 bn, compared with +€151.9 bn in JanuaryAugust 2015. Intra-euro area trade remained stable at €1 117.4 bn in January-August 2016 compared with January-August 2015.
-
09:02
Eurozone: Trade balance unadjusted, August 18.4 (forecast 15.3)
-
08:04
Option expiries for today's 10:00 ET NY cut
EUR/USD 1.0925 (EUR 611m) 1.0950 (299m) 1.1000 (320m) 1.1050 (269m) 1.1090 (233m) 1.1150 (833m) 1.1170 (407m) 1.1288 (815m) 1.1295-1.1300 (524m)
GBP/USD 1.2275 (GBP 228m) 1.2295 (204m) 1.2345-50 (634m) 1.2400 (310m) 1.2450 (226m) 1.2800 (789m) 1.3000 (1.04bln)
USD/JPY 102.00 (USD 1.21bln) 102.40-50 (1.23bln) 103.75 (906m) 105.00 (1.06bln)
USD/CHF: 0.9700 (250m) 0.9885 (225m)
EUR/GBP: 0.8850 (EUR 402m) 0.9000 (599m)
EUR/JPY 114.00 (EUR 1.0bln)
AUD/USD 0.7400 (AUD 733m) 0.7450 (468m) 0.7500 (586m) 0.7750 (433m)
USD/CAD: 1.3150 (USD 386m) 1.3180 (312m) 1.3195-1.3200 (917m), C$1.3300-05($352mn)
AUD/JPY 76.00 (AUD 208m) 76.70 (AUD 955m)
NZD/USD: 0.7075 (NZD 223m) 0.7120 (NZD 235m)
-
07:59
Major stock exchanges trading in the green zone: FTSE + 0.3%, DAX + 0.4%, CAC40 + 0.5%, FTMIB + 0.1%, IBEX + 0.4%
-
07:31
Swiss producer and import prices above expectations
The Producer and Import Price Index rose in September 2016 by 0.3% compared with the previous month, reaching 99.7 points (base December 2015 = 100). The rise is due in particular to higher prices for petroleum products. Compared with September 2015, the price level of the whole range of domestic and imported products fell by 0.1%. These are the findings of the Federal Statistical Office (FSO).
-
07:15
Switzerland: Producer & Import Prices, y/y, September -0.1% (forecast -0.2%)
-
07:06
Spanish CPI dissappoints in September
The annual change in the CPI in September is 0.2%, three tenths above that registered the previous month.
The annual rate of core inflation decreased one tenth to 0.8%. The monthly variation of the general index is 0.0%.
The Harmonized Index of Consumer Prices (HICP) annual change stands in the 0.0%, which increased three tenths for the month of August.
Annual evolution of consumer prices
The annual rate of Consumer Price Index (CPI) in September is 0.2%, three tenths higher than that recorded the previous month.
The groups highlighting positive influence on increasing the annual rate were: Transport, which undergoes a variation of 0.0%, almost two points above that of August, mostly due to the prices of fuels and lubricants increase this month, while they declined in September last year.
-
07:03
Today’s events
-
At 11:45 GMT the Bank of England's Forbes will deliver a speech
-
At 12:30 GMT FOMC member Eric Rosengren will give a speech
-
At 13:30 GMT the Bank of England Governor Mark Carney will deliver a speech
-
At 13:30 GMT the Bank of England Deputy Governor for Monetary Policy Ben Broadbent will deliver a speech
-
At 13:30 GMT the Bank of England Deputy Governor for Financial Stability John Cunliffe deliver a speech
-
At 13:30 GMT Deputy Governor of the Bank of England and the banking Nemat Shafik will deliver a speech
-
At 13:30 GMT BoE Deputy Governor Sam Woods will deliver a speech
-
At 17:30 GMT the Federal Reserve Board of Governors Chairman Janet Yellen will deliver a speech
-
-
06:50
Expected positive start of trading on the major stock exchanges in Europe: DAX + 0.6%, CAC 40 + 0.6%, FTSE + 0.4%
-
06:32
Options levels on friday, October 14, 2016:
EUR/USD
Resistance levels (open interest**, contracts)
$1.1204 (2714)
$1.1154 (1039)
$1.1111 (263)
Price at time of writing this review: $1.1024
Support levels (open interest**, contracts):
$1.0980 (4517)
$1.0948 (7772)
$1.0912 (4899)
Comments:
- Overall open interest on the CALL options with the expiration date November, 4 is 35585 contracts, with the maximum number of contracts with strike price $1,1300 (3741);
- Overall open interest on the PUT options with the expiration date November, 4 is 44344 contracts, with the maximum number of contracts with strike price $1,1000 (7772);
- The ratio of PUT/CALL was 1.25 versus 1.30 from the previous trading day according to data from October, 13
GBP/USD
Resistance levels (open interest**, contracts)
$1.2506 (876)
$1.2410 (722)
$1.2314 (1016)
Price at time of writing this review: $1.2197
Support levels (open interest**, contracts):
$1.2091 (1473)
$1.1993 (512)
$1.1895 (388)
Comments:
- Overall open interest on the CALL options with the expiration date November, 4 is 28322 contracts, with the maximum number of contracts with strike price $1,2800 (2310);
- Overall open interest on the PUT options with the expiration date November, 4 is 28011 contracts, with the maximum number of contracts with strike price $1,2250 (1479);
- The ratio of PUT/CALL was 0.99 versus 1.00 from the previous trading day according to data from October, 13
* - The Chicago Mercantile Exchange bulletin (CME) is used for the calculation.
** - Open interest takes into account the total number of option contracts that are open at the moment.
-
06:13
Fed's Harker Says Central Bank Should Have Raised Rates at September FOMC
-
05:53
Wall Street Journal Poll: 80% of economists expect a Fed rate hike in December
Wall Street Journal published details of its latest survey conducted among 59 economists on monetary policy by the Federal Reserve. It turned out that two experts will determine their position in November, 48 expect the Fed to raise intrest rates in December and 9 do not expect changes in the Fed's monetary settings this year.
-
05:50
AUD/USD: Make Or Break At a Resistance Zone - JP Morgan
"While the medium-term uptrend for AUD/USD is intact, the current setup suggests that a corrective phase is close, given the deteriorating short-term technical backdrop. For that view, the recent struggles to extend through the next zone of critical resistance highlight the growing risk of a retracement.
In this regard, the .7700/.7850 resistance area has capped the upside for now. It includes the downtrend line from the 2013 high, the August and April highs, the 76.4% retracement from the May '15 high, as well as the 38.2% retracement from the 2014 peak. Given this strong confluence of resistance, we sense it will remain a tough hurdle to exceed. Note that this view is also consistent with the overbought and diverging momentum setup. Still, we continue to monitor key support levels for confirmation of a sustained corrective phase, given similar bearish frameworks since Q1.
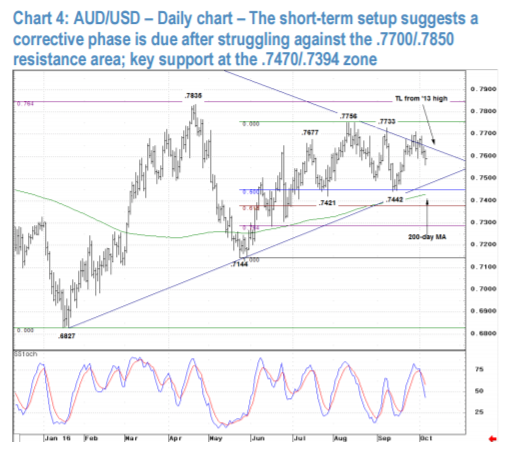
In turn, the .7470/.7394 support zone, which includes the 38.2% retracement of the rally from the May low, the August low, the late July low and the 200-day moving average, represents a critical test. Violations confirm the onset of a deeper pullback into the .7300 area (76.4% retracement), if not lower.
Alternately, a break above the .7850 resistance would signal that the medium-term uptrend can extend in a more significant manner".
Copyright © 2016 eFXplus™
-
05:47
M2 money stock in Japan was up 3.6 percent on year in September
According to rttnews, the M2 money stock in Japan was up 3.6 percent on year in September, the Bank of Japan said on Friday - coming in at 943.2 trillion yen.
That followed the 3.3 percent gain in August.
The M3 money stock advanced an annual 3.1 percent to 1,265.1 trillion yen after gaining 2.8 percent in the previous month.
The L money stock gained 1.8 percent to 1,653.7 trillion yen after picking up 1.6 percent a month earlier.
-
05:45
RBA Financial Stability Review
"A number of risks continue to weigh on the outlook for the global financial system. In China, the level of debt is high and rising despite slower economic growth and signs of excess capacity in some areas; much of the new debt is being extended by the more opaque yet interconnected parts of its financial system.
Non-performing loans (NPLs) are increasing, albeit off a relatively low base. While the authorities in China retain levers to support growth, using many of them would likely entail a further increase in debt that could increase the risks to longer-term reform and stability.
Some other emerging market economies, especially commodity exporters and those with high levels of foreign currency-denominated corporate debt, face a varying mix of low commodity prices, lower exchange rates, slower economic growth and fiscal pressures. Private debt-servicing burdens have risen in some of these economies, and bond defaults have picked up, though banking systems in most emerging economies seem reasonably well placed to weather higher corporate defaults.
Conditions in the banking sectors of many advanced economies are also challenging. European banks' prospects remain mired in an unfavourable mix of low profitability, high NPLs and weak equity prices. While the recent stress tests of European Union (EU) banks highlight the gradual rise in capital ratios, the financial position of some Italian and other banks is weak.
The vote in the United Kingdom to leave the EU led to significant volatility in many financial markets though, other than the UK pound, most prices largely recovered soon after. Low or negative interest rates continue to squeeze banks' net interest margins in Japan and elsewhere, and credit losses in the energy and related sectors have weighed on bank profits in some major countries. More generally, the ongoing low interest rate environment is boosting asset prices globally.
Relatedly, housing prices in New Zealand have risen strongly, despite successive rounds of macroprudential measures; low milk prices are also weighing on prospects for New Zealand's dairy sector. Domestic risks have continued to shift towards property development and resource-related areas. Risks to financial stability from lending to households have lessened a little over the past six months, as serviceability metrics and other lending standards have continued to strengthen and the pace of credit growth has slowed.
Housing price growth is also slower than it was a year or so ago, although it has picked up a little in Sydney and Melbourne in recent months. The risk profile of new borrowing has improved further. The share of new high loan-to-valuation (LVR) lending and interest-only loans has fallen; high-LVR lending is now at its lowest share in almost a decade. Nonetheless, the household debt-to-income ratio is still drifting higher, even after adjusting for the rapid growth of balances in offset accounts.
Non-performing mortgage loans have also picked up nationally but remain low. This pick-up has been most pronounced in mining areas where housing market conditions have deteriorated sharply, though only a small share of banks' mortgage lending is to these areas".
-
05:40
Important rise in Chinese CPI inflation in September
Consumer prices in China were up 1.9 percent on year in September, the National Bureau of Statistics said on Friday.
That exceeded forecasts for 1.6 percent and was up from 1.3 percent in August.
On a monthly basis, consumer prices gained 0.7 percent after gaining 0.1 percent a month earlier.
Producer prices were up 0.1 percent on year - turning positive after more than four years of contraction. That compared to forecasts for a 0.3 percent decline following the 0.8 percent contraction in the previous month.
-
01:30
China: CPI y/y, September 1.9% (forecast 1.6%)
-
01:30
China: PPI y/y, September 0.1% (forecast -0.3%)
-