Market news
-
23:28
Currencies. Daily history for Nov 17’2016:
(pare/closed(GMT +3)/change, %)
EUR/USD $1,0625 -0,61%
GBP/USD $1,2418 -0,18%
USD/CHF Chf1,0068 +0,49%
USD/JPY Y110,11 +0,95%
EUR/JPY Y117,00 +0,34%
GBP/JPY Y136,7 +0,75%
AUD/USD $0,7405 -1,00%
NZD/USD $0,7023 -0,65%
USD/CAD C$1,3521 +0,57%
-
23:00
Schedule for today,Friday, Nov 18’2016
07:00 Germany Producer Price Index (MoM) October -0.2% 0.1%
07:00 Germany Producer Price Index (YoY) October -1.4% -0.9%
08:30 Eurozone ECB President Mario Draghi Speaks
09:00 Eurozone Current account, unadjusted, bln September 23.6
09:10 United Kingdom MPC Member Dr Ben Broadbent Speaks
10:30 Eurozone ECB's Jens Weidmann Speaks
10:30 U.S. FOMC Member James Bullard Speaks
13:30 Canada Consumer Price Index m / m October 0.1% 0.2%
13:30 Canada Consumer price index, y/y October 1.3% 1.5%
13:30 Canada Bank of Canada Consumer Price Index Core, y/y October 1.8% 1.8%
14:30 U.S. FOMC Member Dudley Speak
14:30 U.S. FOMC Member Esther George Speaks
15:00 U.S. Leading Indicators October 0.2% 0.1%
-
15:27
Yellen: FOMC may have to adjust outlook when more clarity on next administration's policies
-
15:18
Bloomberg: the level of consumer confidence in the US improved slightly last week
The research results published by Bloomberg have shown that the index of US consumer confidence improved again at the end of last week, registering the fourth increase in a row and reached the highest level since April 2015.
According to data for the week ending 13 November consumer comfort index rose to 45.4 points from 45.1 points the previous week (November 6). Over the past four weeks, the index gained 4.1 points. It is worth emphasizing that the increase of this size or larger (for a 4-week period) was recorded only 5 times since the end of the Great Recession. The average value of 2016 now stands at 43.3 points, while the long-term average, which is calculated from the end of 1985, is 41.7 points.
-
14:27
Fed’s Dudley: speed of changes in labor market needs close monitoring
-
13:51
Option expiries for today's 10:00 ET NY cut
EURUSD 1.0746 (EUR 226m) 1.0775-80 (385m) 1.0800 (2.48bln) 1.0830 (208m) 1.0840 (250m) 1.0900 (499m)
USDJPY 107.25 (250m) 107.50 (650m) 107.90-95 (705m) 108.05-10 (380m)
GBPUSD 1.2475 (GBP 355m) 1.2700 (1.17bln)
EURGBP 0.8750 (EUR 451m)
AUDUSD 0.7400 (AUD 911m) 0.7560 (219m) 0.7600 (431m) 0.7665 (248m)
NZDUSD 0.7070 (NZD 207m) 0.7100 (789m)
USDCAD 1.3500 (USD 510m)
EURJPY 115.50 (EUR 216m)
AUDJPY 79.00 (AUD 300m)
NOK SEK: 1.0680 (NOK 2.85bln) 1.0750 (2.71bln)
-
13:43
US housing market continues to improve as both building permits and housing starts rise
Privately-owned housing units authorized by building permits in October were at a seasonally adjusted annual rate of 1,229,000. This is 0.3 percent (±2.0%) above the revised September rate of 1,225,000 and is 4.6 percent (±1.4%) above the October 2015 estimate of 1,175,000.
Single-family authorizations in October were at a rate of 762,000; this is 2.7 percent (±1.4%) above the revised September figure of 742,000. Authorizations of units in buildings with five units or more were at a rate of 439,000 in October.
Housing starts in October were at a seasonally adjusted annual rate of 1,323,000. This is 25.5 percent (±12.6%) above the revised September estimate of 1,054,000 and is 23.3 percent (±14.4%) above the October 2015 rate of 1,073,000.
Single-family housing starts in October were at a rate of 869,000; this is 10.7 percent (±10.2%) above the revised September figure of 785,000. The October rate for units in buildings with five units or more was 445,000.
-
13:40
US weekly jobless claims at the lowest level since November 24, 1973
In the week ending November 12, the advance figure for seasonally adjusted initial claims was 235,000, a decrease of 19,000 from the previous week's unrevised level of 254,000. This is the lowest level for initial claims since November 24, 1973 when it was 233,000. The 4-week moving average was 253,500, a decrease of 6,500 from the previous week's revised average. The previous week's average was revised up by 250 from 259,750 to 260,000.
There were no special factors impacting this week's initial claims. This marks 89 consecutive weeks of initial claims below 300,000, the longest streak since 1970.
-
13:38
US regional manufacturing activity continued to expand
Results from the November Manufacturing Business Outlook Survey suggest that regional manufacturing activity continued to expand. The indexes for general activity, new orders, and shipments all remained positive this month. Overall, labor market conditions remained weak, however. More firms reported increases in prices in November compared with October. Firms expect continued growth for manufacturing over the next six months, although expectations were less optimistic than last month.
The index for current manufacturing activity in the region edged down, from a reading of 9.7 in October to 7.6 this month.
-
13:36
US core CPI rose less than expected
The Consumer Price Index for All Urban Consumers increased 0.4 percent in October on a seasonally adjusted basis, the U.S. Bureau of Labor Statistics reported today. Over the last 12 months, the all items index rose 1.6 percent before seasonal adjustment.
The energy index increased 3.5 percent, its largest advance since February 2013. The indexes for fuel oil and gasoline were up 5.9 percent and 7.0 percent, respectively, while the indexes for electricity and natural gas saw relatively smaller increases of 0.4 percent and 0.9 percent. In contrast, the index for food was unchanged for the fourth consecutive month, as the food at home index continued to decline.
The index for all items less food and energy rose 0.1 percent for the second straight month. Along with the shelter index, the indexes for apparel, new vehicles, and motor vehicle insurance all increased in October, as did the indexes for education, household furnishings and operations, alcoholic beverages, and tobacco. The indexes for personal care, communication, used cars and trucks, recreation, and airfare all declined. The medical care index was flat over the month. -
13:31
U.S.: Philadelphia Fed Manufacturing Survey, November 7.6 (forecast 8)
-
13:30
U.S.: Housing Starts, October 1323 (forecast 1156)
-
13:30
U.S.: Building Permits, October 1229 (forecast 1198)
-
13:30
U.S.: CPI, Y/Y, October 1.6% (forecast 1.6%)
-
13:30
U.S.: Initial Jobless Claims, 235 (forecast 257)
-
13:30
U.S.: CPI, m/m , October 0.4% (forecast 0.4%)
-
13:30
U.S.: CPI excluding food and energy, Y/Y, October 2.1% (forecast 2.2%)
-
13:30
Canada: Foreign Securities Purchases, September 11.77
-
13:30
U.S.: Continuing Jobless Claims, 1977 (forecast 2038)
-
13:30
U.S.: CPI excluding food and energy, m/m, October 0.1% (forecast 0.2%)
-
13:21
Yellen’s hawkish comments not helping the dollar. Rate hike priced in?
-
13:17
AUD/USD can’t hold below yesterday's low. Looks like we are in an accumulation phase
-
13:12
Qatar says they are talking with Iran and Iraq to freeze oil output at current levels - Forexlive
-
13:07
Fed's Yellen: Rate Increase Could Become Appropriate 'Relatively Soon'. Dollar moderately bid
-
13:00
Orders
EUR/USD
Offers 1.0730 1.0750-60 1.0780 1.0800 1.0825-30 1.0850 1.0865 1.0900 1.0925-301.0950
Bids 1.0700 1.0680-85 1.0665 1.0650 1.0630 1.0600
GBP/USD
Offers 1.2485 1.2500-05 1.2530 1.2550 1.2580-85 1.2600 1.2620 1.2650
Bids 1.2430 1.2400 1.2375-80 1 .2350 1.2330 1.2300
EUR/GBP
Offers 0.8620-25 0.8660 0.8680-85 0.8700 0.8730 0.8750
Bids 0.8580 0.8560-65 0.8550 0.8500 0.8480 0.8450
EUR/JPY
Offers 117.25 117.50 118.00 118.45-50 119.00 119.50 120.00
Bids 116.50 116.25-30 116.00 115.80 115.60 115.30 115.00
USD/JPY
Offers 109.50 109.80 110.00 110.20 110.50 110.80 111.00
Bids 108.75-80 108.50 108.20 108.00 107.70-75 107.50 107.30 107.00
AUD/USD
Offers 0.7500-05 0.7530 0.7550 0.7570 0.7585 0.7600 0.7630 0.7660 0.7685 0.7700
Bids 0.7465 0.7450 0.7420-25 0.7400 0.7380-85 0.7350 0.7300
-
12:58
ECB Fully Determined to Execute Asset Purchases, Adopt Further Measures If Needed - Meeting Minutes
-
Officials Saw Lack of 'Convincing Upward Trend' in Core Инфлатион
-
Officials Agreed In October on Need to Preserve Stimulus Until Inflation Picks Up
-
Some ECB Officials Saw Risks That Inflation Would Rise Faster Than Expected
-
-
11:49
Major stock indices in Europe trading mixed
European stocks traded mixed as traders continue to assess the impact of Trump's victory. However, the markets were supported by the renewed increase in oil prices.
"Stock indexes in Europe will potentially continue trading in a narrow range, - said William Hobbs, chief investment officer at Barclays -. The looming Italian referendum, Trump's administration as well as elections in France and Germany in the next year may well enhance the care of many investors' .
Oil prices have risen by about 1% in response to the weakening of the US dollar in anticipation of US data on inflation and the real estate market.
Certain influence on the dynamics of trade had statistical data on Britain and the euro zone. The Office for National Statistics reported that retail sales in the UK increased significantly in October, as cold weather boosted sales of clothing and Halloween celebrations contributed to the growth of sales in supermarkets. Recent data highlight the robust state of the British consumer since the referendum, even if the one-off factors that caused the rise in demand in October, unlikely to be sustainable.
The volume of retail sales rose by 1.9 percent after +0.1 percent in September. Analysts had expected an increase of 0.4 percent. Compared with 2015, sales rose by 7.4 percent.
Meanwhile, the final data provided by Eurostat showed that in October, consumer prices in the eurozone rose by 0.2% after rising 0.4% in September. Analysts had expected that the prices will increase by 0.3%. Meanwhile, the annual rate of inflation accelerated to 0.5% from 0.4% in the previous month. The core index, which excludes energy and food prices, rose 0.8% year on year, confirming the forecasts and coincided with the previous estimate.
The composite index of the largest companies in the region Stoxx Europe 600 added 0.2 percent.
Capitalization of Royal Ahold Delhaize NV fell 2.8 percent, as the volume of the company's quarterly earnings did not meet analysts' forecasts.
Shares of Royal Mail fell 7 percent after reporting a drop in adjusted operating profit.
Cost of Sodexo shares sank 1.9 percent after the company reported a smaller-than-expected amount of income.
ABN Amro Group shares fell 2.5 percent on the news that the Dutch bank sold 65 million of its shares.
Shares of Zurich Insurance Group AG increased by 2.6 per cent after the insurer announced its intention to increase dividends and reduce costs.
At the moment:
FTSE 100 +27.08 6776.80 + 0.40%
DAX -19.51 10644.36 -0.18%
CAC 40 +3.09 4504.23 + 0.07%
-
10:29
ECB Yves Mersch cautions on winding down stimulus
-
10:05
Euro area annual inflation rose in line with expectations - Eurostat
Euro area annual inflation was 0.5% in October 2016, up from 0.4% in September. In October 2015 the rate was 0.1%. European Union annual inflation was 0.5% in October 2016, up from 0.4% in September. A year earlier the rate was 0.0%. These figures come from Eurostat, the statistical office of the European Union. In October 2016, negative annual rates were observed in six Member States.
The lowest annual rates were registered in Bulgaria and Cyprus (both -1.0%). The highest annual rates were recorded in Belgium (1.9%) and Austria (1.4%). Compared with September 2016, annual inflation fell in six Member States, remained stable in one and rose in twenty-one.
The largest upward impacts to euro area annual inflation came from restaurants & cafés (+0.07 percentage points), rents and tobacco (both +0.04 pp), while gas (-0.12 pp), vegetables (-0.06 pp) and milk, cheese & eggs (-0.05 pp) had the biggest downward impacts.
-
10:00
Eurozone: Harmonized CPI, Y/Y, October 0.5% (forecast 0.5%)
-
10:00
Eurozone: Harmonized CPI, October 0.2% (forecast 0.3%)
-
10:00
Eurozone: Harmonized CPI ex EFAT, Y/Y, October 0.8% (forecast 0.8%)
-
09:35
Important increase for UK retail sales in October - ONS
In October 2016, the quantity of goods bought (volume) in the retail industry was estimated to have increased by 7.4% compared with October 2015; all store types showed growth with the largest contribution coming from non-store retailing. This is the highest rate of growth since April 2002.
Compared with September 2016, the quantity bought was estimated to have increased by 1.9%; there were increases in all store types, except department stores. The largest contribution to growth came from textiles, clothing and footwear stores.
The underlying pattern in the retail industry continues to show strong growth with the 3 month on 3 month movement in the quantity bought increasing by 1.9%; this is the 34th consecutive period of 3 month on 3 month growth.
Average store prices (including petrol stations) fell by 0.7% in October 2016 compared with October 2015; there were falls in average store price across all store types, except petrol stations. This is the smallest decrease since July 2014 and the latest Consumer Prices Index (CPI) shows that the largest upwards pressure on inflation is from transport costs.
-
09:30
United Kingdom: Retail Sales (MoM), October 1.9% (forecast 0.4%)
-
09:30
United Kingdom: Retail Sales (YoY) , October 7.4% (forecast 5.3%)
-
09:08
Italian trade balance surplus grows in September
In September 2016 seasonally-adjusted data, compared to August 2016, decreased for both flows: -1.6% for exports and -4.5% for imports. Exports decreased by 3.3% for EU countries while increased by 0.5% for non EU countries. Imports fell down by 4.6% for EU countries and by 4.3% for non EU countries. During the quarter July-September 2016, seasonally-adjusted data, in comparison with the previous quarter, increased by 0.6% for exports and by 1.7% for imports.
In September 2016, compared with the same month of the previous year, exports increased by 3.1% and imports decreased by 2.7%. Outgoing flows grew by 3.2% for EU countries and by 3.0% for non EU countries. Incoming flows increased by 1.3 for EU area and decreased by 8.7% for non EU area. The trade balance in August amounted to +3,7 billion Euros (+0,8 billion Euros for EU area and +2,9 billion Euros for non EU countries).
-
08:49
Today’s events
-
At 08:10 GMT ECB member Yves Mersch will make a speech
-
At 13:50 GMT FOMC member William Dudley will make a speech
-
At 15:00 GMT the Federal Reserve Board of Governors Chairman Janet Yellen testifies
-
At 17:30 GMT SNB Andrea Mehler will deliver a speech
-
At 17:30 GMT Alternative board member of the SNB Duve Moser will deliver a speech
-
At 17:30 GMT FOMC member Lyell Braynard deliver will make a speech
-
At 21:45 GMT the ECB Board Member Peter Praet will make a speech
-
-
08:39
Option expiries for today's 10:00 ET NY cut
EUR/USD 1.0746 (EUR 226m) 1.0775-80 (385m) 1.0800 (2.48bln) 1.0830 (208m) 1.0840 (250m) 1.0900 (499m)
USD/JPY 107.25 (250m) 107.50 (650m) 107.90-95 (705m) 108.05-10 (380m)
GBP/USD 1.2475 (GBP 355m) 1.2700 (1.17bln)
EUR/GBP 0.8750 (EUR 451m)
AUD/USD 0.7400 (AUD 911m) 0.7560 (219m) 0.7600 (431m) 0.7665 (248m)
NZD/USD 0.7070 (NZD 207m) 0.7100 (789m)
USD/CAD 1.3500 (USD 510m)
EUR/JPY 115.50 (EUR 216m)
AUD/JPY 79.00 (AUD 300m)
NOK/SEK: 1.0680 (NOK 2.85bln) 1.0750 (2.71bln)
-
07:31
Options levels on thursday, November 17, 2016:
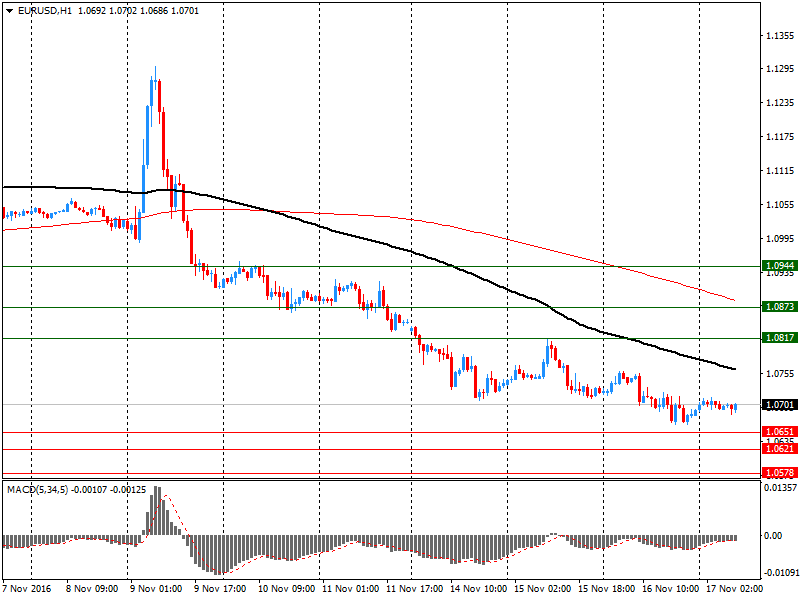
EUR/USD
Resistance levels (open interest**, contracts)
$1.0944 (3322)
$1.0873 (1822)
$1.0817 (405)
Price at time of writing this review: $1.0701
Support levels (open interest**, contracts):
$1.0651 (4130)
$1.0621 (3889)
$1.0578 (3972)
Comments:
- Overall open interest on the CALL options with the expiration date December, 9 is 69381 contracts, with the maximum number of contracts with strike price $1,1200 (6126);
- Overall open interest on the PUT options with the expiration date December, 9 is 59561 contracts, with the maximum number of contracts with strike price $1,0900 (4130);
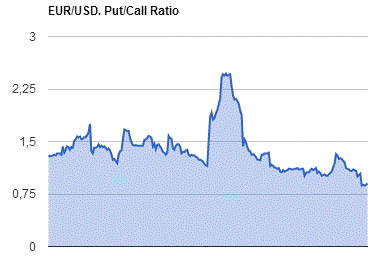
- The ratio of PUT/CALL was 0.86 versus 0.88 from the previous trading day according to data from November, 16

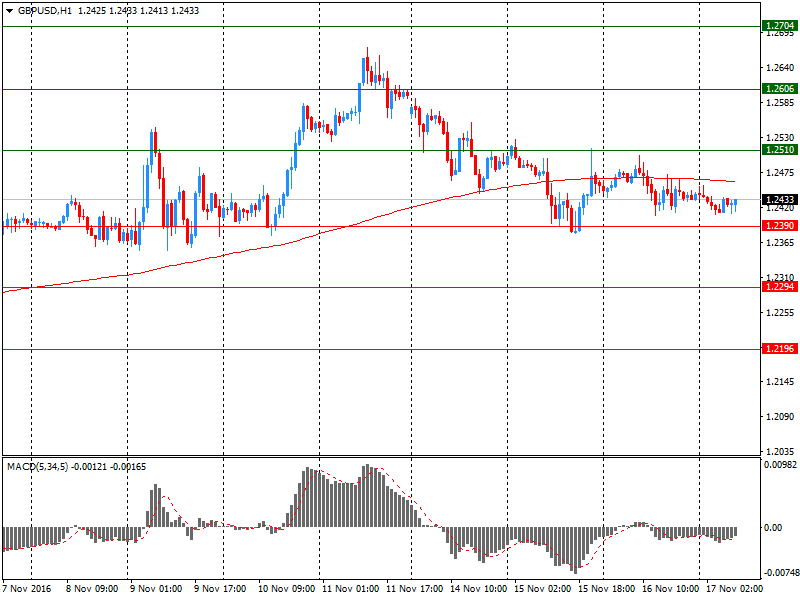
GBP/USD
Resistance levels (open interest**, contracts)
$1.2704 (1780)
$1.2606 (1699)
$1.2510 (1813)
Price at time of writing this review: $1.2433
Support levels (open interest**, contracts):
$1.2390 (1455)
$1.2294 (4069)
$1.2196 (1317)
Comments:
- Overall open interest on the CALL options with the expiration date December, 9 is 34920 contracts, with the maximum number of contracts with strike price $1,3400 (2560);
- Overall open interest on the PUT options with the expiration date December, 9 is 36860 contracts, with the maximum number of contracts with strike price $1,2300 (4069);
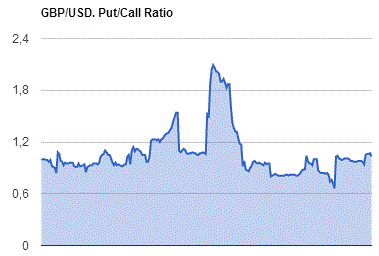
- The ratio of PUT/CALL was 1.06 versus 1.05 from the previous trading day according to data from November, 16

* - The Chicago Mercantile Exchange bulletin (CME) is used for the calculation.
** - Open interest takes into account the total number of option contracts that are open at the moment.
-
07:10
Fitch Ratings predicts a continuing high level of exports of steel from China
The export of steel from China were to remain at about 100 million tons in 2017. Agency experts refer to sustainable consumption and slowing rationalization potential of steel. Competitiveness of Chinese production continues to be supported by a cheap yuan and the reduction in commodity prices. In addition, some analysts predict a further state support in the next few years.
-
07:08
No reason for USD to correct, no look-back for USD/JPY says Morgan Stanley
"USD strength is making the headlines, with the DXY Index trying to make its way through the key 100 level, but we are noticing that the weakness in JPY is being debated less.
We think the rising USDJPY is the real pain trade in respect of positioning. That said, the moves in the JGB market are being closely watched by our team. On JPY positioning, when the USDJPY rally started in September the JPY long position was extreme relative to its long-term average. Now, as the pair trades impulsively higher, supported by rapidly gaining real yield differentials, investors are not as long as they would like to be, given the change in the global macro picture.
Hence, we think it may be wrong to speculate that the DXY is forming a 'triple' top coming off from here. Markets will be looking for a break of the 100.51 high in the DXY from December 2015. We see no reason for USD to correct and USDJPY to trade lower.
Stronger US data: As US bond market volatility eased yesterday, USDJPY in particular was able to move higher based on an upside surprise in US economic data. In fact October saw the best rise in core retail sales since April, with support from a slightly better Empire State Manufacturing PMI for November (+1.5 after -6.8), driven by the new orders and shipments. The President-elect's fiscal and deregulation proposals have fallen on very fertile ground, namely a US economy showing signs of closing it eight-year output gap. For markets the inflation data are important as the sharp rise in US nominal yields is this time not being primarily driven by rising real rates as seen during the 2013 taper tantrum, but by upward-adjusting long-term inflation expectations.
Accordingly, there may be no look-back for USDJPY: JPY remains vulnerable at this stage as global reflation signals become stronger by the day. Even in Japan 3Q growth has been stronger than expected, providing a positive signal of Japan's own inflation expectations. Lower Japanese real yields are undermining JPY".
Copyright © 2016 Morgan Stanley, eFXnews
-
07:04
Fed’s Harker: Too Soon to Say What Fed Should Do in December
-
Need Time to Assess New Policy Landscape
-
Fed Remains on Path Toward Rate Rises
-
New Fiscal Stimulus Could Drive Faster Rate Rises
-
Not First Time Fed Has Face Political Criticism
-
-
07:02
UBS: China Likely to Keep Interest Rates Unchanged Through 2018
-
07:02
Bank of Japan Surprises With Plan to Buy Unlimited JGBs at Fixed Rates - Dow Jones
The Bank of Japan on Thursday offered to buy an unlimited amount of Japanese government bonds at fixed rates for the first time since the introduction of a new policy framework-a sign of its concerns over recent rises in yields.
The move is the first clear sign from the central bank that it intends to take action to keep a lid on rising yields, and took market participants by surprise.
"I thought there was still a lot more room left" before the BOJ took action, said Masahiro Ichikawa, senior strategist at Sumitomo Mitsui Asset Management.
-
07:00
Australian employment report: more part time workers noted
In October 2016, trend employment decreased by 1,000 persons to 11,946,600 persons, the first decrease in the trend series since November 2013. This slight fall in trend employment reflected an increase in part-time employment of 8,400 persons being more than offset by a decrease in full-time employment of 9,500 persons.
"Since December 2015 we have seen a continued decline in trend full-time employment and an increase in part-time employment, with a corresponding increase in the share of hours worked by part-time workers. This shift to part-time employment has been more pronounced for males compared to females," said the Program Manager of ABS' Labour and Income Branch, Jacqui Jones.
"Over the past year, part-time employment has increased from around 31 per cent of employment to 32 per cent. That's a relatively large shift, if you consider that it was around 29 per cent 10 years ago.
"Since December 2015, there are now around 132,700 more persons working part-time, compared with a 69,900 decrease in those working full-time," said Ms Jones.
The trend monthly hours worked increased by 3.2 million hours (0.2 per cent), with increases in total hours worked by both full-time and part-time workers.
The trend unemployment rate remained steady at 5.6 per cent. The participation rate decreased by 0.1 percentage points to 64.5 per cent. Participation has decreased by 0.6 percentage points over the past year.
-
00:31
Australia: Changing the number of employed, October 9.8 (forecast 20)
-
00:30
Australia: Unemployment rate, October 5.6% (forecast 5.6%)
-

