Market news
-
15:32
Fed's George Expects 'Moderate Pace of Growth,' Continued Job Gains
-
15:18
Fed's Kaplan: Said for Some Time He's Ready to Remove Some Amount of Accommodation - Fox Business News
-
15:18
US leading index continued to increase
Leading economic indicators from the Conference Board (LEI) index for the US increased by 0.1 percent in October to 124.5 (2010 = 100), after rising 0.2 percent in September. Last change coincided with forecasts.
"The leading indicator rose for the second consecutive month in October. Although the 6-month rate of growth has slowed, the index still shows that the economy will continue to expand in early 2017. Improving in the sub-index of interest rate and the sub-index of the average working week were the main factors to improve the overall index in October"- said Ataman Oziildirim, director of business cycles in the Conference Board.
-
15:01
Fed's Dudley Doesn't Comment on Rate Policy, Economic Outlook
-
15:01
U.S.: Leading Indicators , October 0.1% (forecast 0.1%)
-
15:00
Fitch: Downside Potential for Asset Quality, Loan Growth, Profitability at Mexican Banks Should U.S. Policy Shift
-
14:58
Survey: US economic prospects have not changed, but the uncertainty has increased after the elections
Economic forecasts for the United States have not changed since then, as D. Trump unexpectedly won the presidential election. However, uncertainty has jumped on a lack of clarity on the issue of a possible aggressive tax cuts and trade barriers in the coming years.
Nevertheless, a survey of more than 100 economists, conducted by Reuters, showed that the Fed remains on track to raise interest rates next month.
This week, the dollar index hit a high of 13.5 years and is now trading nearly 3 percent higher than 8 November, when the presidential elections were held in the United States.
About two-thirds of respondents said Trump/s presidency would have a negative impact on US exports in the next year. Ten economists said that his victory will not have much effect, whereas only three respondents said that export volume will increase. Much will depend on the extent to which Trump will follow his pre-election promises to curb trade protectionism and migration levels. The survey also showed that the probability of a recession in the next year is 20 percent compared to 15 percent last month.
-
13:45
Option expiries for today's 10:00 ET NY cut
EURUSD 1.0725-30 (EUR 252m) 1.0800 (886m) 1.0850 (362m)
USDJPY 107.00 (USD 2.3bln) 107.50 (300m) 108.50 (431m) 109.00 (920m) 110.00 (741m)
GBPUSD 1.2000 (GBP 1.05bln) 1.2075 (301m) 1.2100 (488m) 1.2400 (1.67bln)1.2700 (1.18bln)
EURGBP 0.8600 (EUR 231m)
AUDUSD 0.7300 (AUD 386m) 0.7390 (319m) 0.7480 (209m) 0.7500 (595m) 0.7570 (280m) 0.7600 (825m) 0.7750 (533m)
USDCAD 1.3400 (586m) 1.3425 (758m) 1.3500 (3.0bln) 1.3600 (501m) 1.3640 (376m) 1.3700 (484m)
EURJPY 117.25 (EUR 537m)
EURNOK 9.0000 (EUR 300m)
EURSEK 9.8300 (EUR 285m)
-
13:37
Canadian inflation rose in line with expectations in October
The Consumer Price Index (CPI) rose 1.5% on a year-over-year basis in October, following a 1.3% gain in September.
Excluding gasoline, the CPI was up 1.4% year over year in October, after posting a 1.5% increase in September.
Prices were up in six of the eight major components in the 12 months to October, with the transportation and shelter indexes contributing the most to the year-over-year rise in the CPI. This increase in the CPI was moderated by a decline in the food index.
The transportation index rose 3.0% in the 12 months to October, following a 2.3% gain in September. This acceleration was mainly attributable to gasoline prices, which posted a 2.5% year-over-year increase in October, after declining 3.2% in September. The purchase of passenger vehicles index rose less year over year in October (+4.4%) than in September (+5.8%), but remained the top upward contributor to the 12-month change in the transportation index.
The shelter index posted its largest increase since January 2015, rising 1.9% in the 12 months to October, after a 1.7% gain in September. The homeowners' replacement cost index was up 4.1% on a year-over-year basis in October, following a 3.9% increase the previous month. Property taxes rose 2.8% in the 12 months to October. At the same time, the natural gas index was down 3.4% on a year-over-year basis in October, after declining 11.1% in September.
-
13:30
Canada: Consumer Price Index m / m, October 0.2% (forecast 0.2%)
-
13:30
Canada: Consumer price index, y/y, October 1.5% (forecast 1.5%)
-
13:30
Canada: Bank of Canada Consumer Price Index Core, y/y, October 1.7% (forecast 1.8%)
-
13:18
Danske Bank targeting 113 in 1 month on USD/JPY
"USD/JPY has rallied significantly since Donald Trump was elected the next US President.
In the short term, we believe USD/JPY is likely to remain supported by improved risk appetite and expectations of a Fed rate hike in December, which we still call for. We lift our targets for USD/JPY to 113 (from 104) in 1M and 115 (from 106) in 3M.
Over the medium term, the case for higher yields on 10-year US treasuries and higher commodity prices has been strengthened by a rise in US inflation expectations, which are assumed to be supportive factors for USD/JPY. Hence, while the underlying JPY appreciation pressure stemming from, among other things, a large current account surplus is likely to remain intact, we expect US reflation to support the case for further portfolio investment outflows out of Japan, which combined with higher FX hedging costs on USD assets is likely to weigh on the JPY. We now target USD/JPY at 115 (previously 106) in 6M and 115 (was 106) in 12M.
For the longer term forecasts, we see risks fairly balanced but stress that uncertainty is unusual high given the many unknown factors for US economic policy under Trump".
-
13:13
SNB's Maechler: Question Is 'If Negative Interest Rates Have Exacerbated Debt Dynamics In Switzerland Or Not' - Reuters
-
12:50
Orders
EUR/USD
Offers 1.0625-30 1.0650 1.0665 1.0685 1.0700 1.0730 1.0750-60 1.0780 1.0800 1.0825-30 1.0850
Bids 1.0575-80 1.0550 1.0535 1.0520 1.0500 1.04801.0450
GBP/USD
Offers 1.2425-30 1.2450-55 1.2485 1.2500-05 1.2530 1.2550 1.2580-85 1.2600
Bids 1.2400 1.2375-80 1.2350 1.2330 1.2300 1.2285 1.2270 1.2250
EUR/GBP
Offers 0.8560 0.8585 0.8600 0.8620-25 0.8660 0.8680-85 0.8700
Bids 0.8525-30 0.8500 0.8480 0.8455-60 0.8430 0.8400
EUR/JPY
Offers 117.50 117.65 118.00 118.45-50 119.00 119.50 120.00
Bids 117.00 116.80 116.50 116.25-30 116.00 115.80 115.60 115.30 115.00
USD/JPY
Offers 110.80-85 111.00 111.20 111.35 111.50 111.85 112.00
Bids 110.50 110.20 110.00 109.80 109.50 109.30 109.00 108.75-80 108.50
AUD/USD
Offers 0.7420 0.7445-50 0.7480 0.7500-05 0.7530 0.7550
Bids 0.7380-85 0.7350 0.7325-30 0.7300 0.7285 0.7250
-
11:50
Bundesbank, Weidmann: Unconventional tools should be used with extreme caution
-
Monetary policy should not automatically respond to low inflation
-
Inflation in the euro may rise to 1.5% by February
-
Most of the factors to keep inflation at a low level are of a temporary nature
-
The leaders of the central bank can not close the eyes to the low profitability of commercial banks
-
Purchase of government bonds blurs the line between fiscal and monetary policy
-
-
11:48
Fed's Bullard: I'm Leaning Toward Supporting December Rate Hike
-
10:17
Greek finance minister urges quick deal on debt relief
-
09:16
Eurozone: Current account, unadjusted, bln , September 29.8
-
09:09
The current account of the euro area recorded a lower than expected surplus
The current account of the euro area recorded a surplus of €25.3 billion in September 2016 (see Table 1). This reflected surpluses for goods (€30.3 billion), services (€4.8 billion) and primary income (€4.2 billion), which were partly offset by a deficit for secondary income (€14.0 billion).
The 12-month cumulated current account for the period ending in September 2016 recorded a surplus of €337.5 billion (3.2% of euro area GDP), compared with one of €322.5 billion (3.1% of euro area GDP) for the 12 months to September 2015 (see Table 1 and Chart 1). This was mostly due to an increase in the surplus for goods (from €333.4 billion to €368.1 billion), as well as a decrease in the deficit for secondary income (from €131.2 billion to €128.4 billion). These were partly offset by decreases in the surpluses for services (from €62.8 billion to €56.9 billion) and primary income (from €57.5 billion to €41.0 billion).
-
08:39
Option expiries for today's 10:00 ET NY cut
EUR/USD 1.0746 (EUR 226m) 1.0775-80 (385m) 1.0800 (2.48bln) 1.0830 (208m) 1.0840 (250m) 1.0900 (499m)
USD/JPY 107.25 (250m) 107.50 (650m) 107.90-95 (705m) 108.05-10 (380m)
GBP/USD 1.2475 (GBP 355m) 1.2700 (1.17bln)
EUR/GBP 0.8750 (EUR 451m)
AUD/USD 0.7400 (AUD 911m) 0.7560 (219m) 0.7600 (431m) 0.7665 (248m)
NZD/USD 0.7070 (NZD 207m) 0.7100 (789m)
USD/CAD 1.3500 (USD 510m)
EUR/JPY 115.50 (EUR 216m)
AUD/JPY 79.00 (AUD 300m)
NOK/SEK: 1.0680 (NOK 2.85bln) 1.0750 (2.71bln)
-
08:29
Draghi: Eurozone Recovery is Less Vulnerable to External Shocks
-
We Cannot Yet Drop our Guard
-
Should Be No Rolling Back of Bank Regulation
-
NPL Ratio Has Been Decreasing in Euro Area
-
Banks' Profitability Remains A Challenge
-
Low Bank Stock Prices Could Curb Lending
-
-
08:22
ECB Draghi: Sustained Rise in Inflation Still Relies on Unprecedented Financing Conditions - Dow Jones
-
08:18
Euro Below $1.06 as Yellen Reinforces Rate Hike Expectations
-
08:15
Today’s events
-
At 08:30 GMT the ECB president Mario Draghi will deliver a speech
-
At 09:10 GMT the Bank of England Deputy Governor for Monetary Policy Ben Broadbent will deliver a speech
-
At 10:30 GMT ECB Jens Weidmann will make a speech
-
At 10:30 GMT the SNB Board Member Andrea Mehler deliver a speech
-
At 10:30 GMT FOMC member James Bullard will give a speech
-
At 14:30 GMT FOMC member William Dudley will make a speech
-
At 14:30 GMT FOMC member Easter George will deliver a speech
-
-
07:35
Options levels on friday, November 18, 2016:
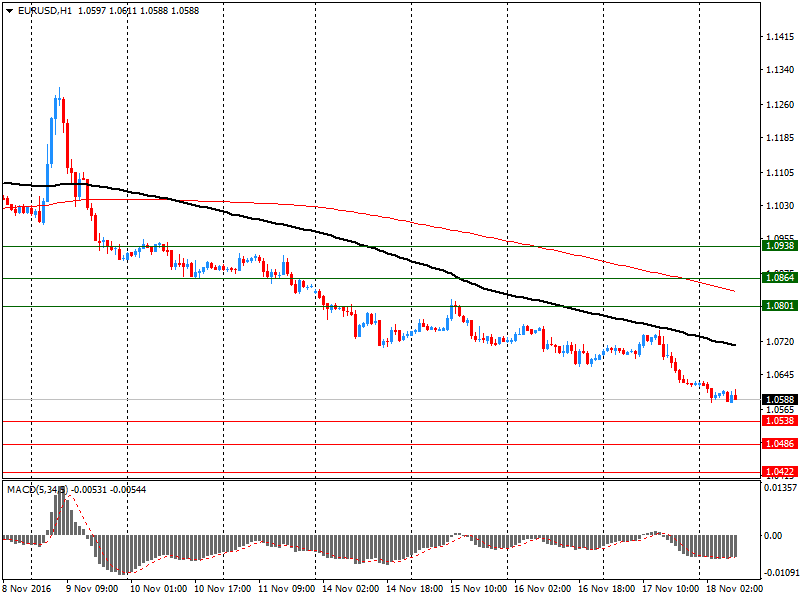
EUR/USD
Resistance levels (open interest**, contracts)
$1.0938 (3352)
$1.0863 (2761)
$1.0801 (751)
Price at time of writing this review: $1.0588
Support levels (open interest**, contracts):
$1.0538 (3903)
$1.0486 (3961)
$1.0422 (5080)
Comments:
- Overall open interest on the CALL options with the expiration date December, 9 is 72458 contracts, with the maximum number of contracts with strike price $1,1200 (6175);
- Overall open interest on the PUT options with the expiration date December, 9 is 63301 contracts, with the maximum number of contracts with strike price $1,0500 (5080);
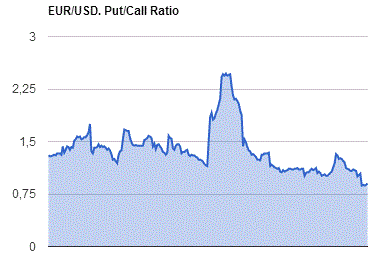
- The ratio of PUT/CALL was 0.87 versus 0.86 from the previous trading day according to data from November, 17
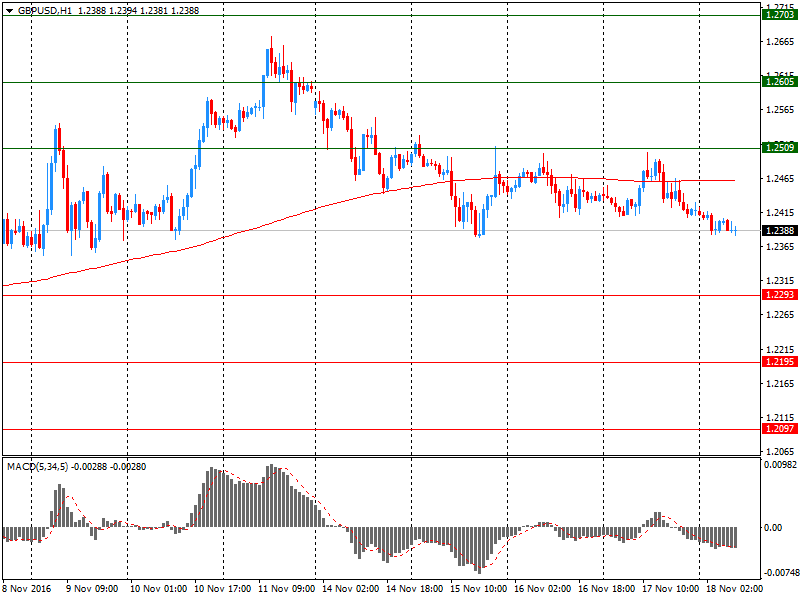
GBP/USD
Resistance levels (open interest**, contracts)
$1.2703 (1780)
$1.2605 (1699)
$1.2509 (1853)
Price at time of writing this review: $1.2388
Support levels (open interest**, contracts):
$1.2293 (4060)
$1.2195 (1294)
$1.2097 (1134)
Comments:
- Overall open interest on the CALL options with the expiration date December, 9 is 34919 contracts, with the maximum number of contracts with strike price $1,3400 (2489);
- Overall open interest on the PUT options with the expiration date December, 9 is 36911 contracts, with the maximum number of contracts with strike price $1,2300 (4060);
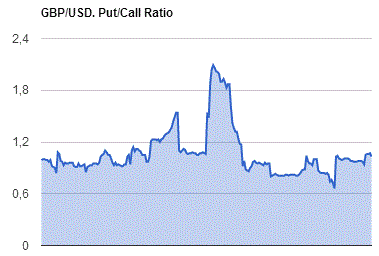
- The ratio of PUT/CALL was 1.06 versus 1.06 from the previous trading day according to data from November, 17
* - The Chicago Mercantile Exchange bulletin (CME) is used for the calculation.
** - Open interest takes into account the total number of option contracts that are open at the moment.
-
07:13
Societe Generale about GBP/USD and NZD/USD
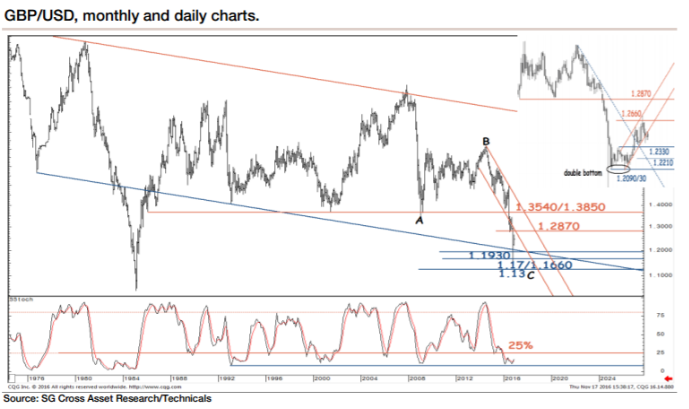
"GBP/USD violated a multi-decade support and breached a steeper descending channel (1.2870), indicating long-term bearish signals. This is confirmed by the monthly stochastic, which remains in negative territory (below 25%).
The pair did rebound recently, however, and achieved the maximum potential at 1.2660. Given likely long-term bearish price action, pullbacks are expected to remain corrective. The pair has breached a daily trend support, which suggests that the recovery has run its course and that the down move should resume.
Thus, GBP/USD should head towards the mid-October high of 1.2330 and perhaps even towards 1.2090/30.
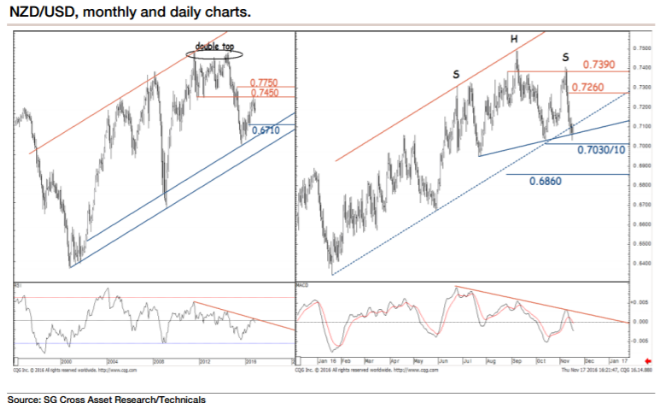
After exhibiting exhaustion signs near the neckline of a double top, NZD/USD has been undergoing a correction.
Recently, it rebounded towards 0.7390, the 76.4% retracement from September, and it has breached a multi-month upward channel.It is probing the neckline of a head-and-shoulders pattern, which denotes further down move.
A break below 0.7030/10 will confirm the pattern and indicate a correction towards 0.6860, the 76.4% retracement from May".
Copyright © 2016 Societe Generale, eFXnews™
-
07:09
German producer prices fell in October
In October 2016 the index of producer prices for industrial products fell by 0.4% compared with the corresponding month of the preceding year. In September 2016 the annual rate of change all over had been -1.4%.
Compared with the preceding month September 2016 the overall index rose by 0.7% in October 2016 (-0.2% in September and -0.1% in August).
In October 2016 energy prices decreased by 2.2% compared with October 2015, prices of intermediate goods fell by 0.7%. In contrast prices of non-durable consumer goods rose by 1.1%, prices of capital goods by 0.6% and prices of durable consumer goods by 1.2%.
-
07:00
Germany: Producer Price Index (MoM), October 0.7% (forecast 0.1%)
-
07:00
Germany: Producer Price Index (YoY), October -0.4% (forecast -0.9%)
-
06:53
New Zealand consumer confidence strengthened
New Zealand consumer confidence strengthened to the highest level in more than a year in November, survey data from ANZ Bank showed Friday, cited by rttnews.
The ANZ Roy Morgan Consumer Confidence Index rose to 127.2 in November from 122.9 in October. This was the highest score since April 2015 and the reading improved for six consecutive months.
The current conditions and future conditions indexes rose 4 points each, to 127.3 and 127.2 respectively.
A net 13 percent feel better off compared with a year ago, which was the highest since June 2014.
-
06:51
Bank of Mexico raises the overnight rate by 50 bps to 5.25% in line with expectations
-
