Market news
-
17:02
U.S.: Baker Hughes Oil Rig Count, April 688
-
14:17
On Sunday voters will elect two candidates to run for the office of the 25th President of France. Keep in mind the open positions on EUR pairs, gaps can occur
-
14:02
US existing-home sales took off in March to their highest pace in over 10 years
Existing-home sales took off in March to their highest pace in over 10 years, and severe supply shortages resulted in the typical home coming off the market significantly faster than in February and a year ago, according to the National Association of Realtors. Only the West saw a decline in sales activity in March.
Total existing-home sales, which are completed transactions that include single-family homes, townhomes, condominiums and co-ops, ascended 4.4 percent to a seasonally adjusted annual rate of 5.71 million in March from a downwardly revised 5.47 million in February. March's sales pace is 5.9 percent above a year ago and surpasses January as the strongest month of sales since February 2007 (5.79 million).
-
14:00
U.S.: Existing Home Sales , March 5.71 (forecast 5.6)
-
13:45
U.S.: Services PMI, April 52.5 (forecast 53)
-
13:45
U.S.: Manufacturing PMI, April 52.8 (forecast 53.5)
-
13:32
Option expiries for today's 10:00 ET NY cut
EURUSD: 1.0600 (EUR 1.2bln) 1.0680 (803m) 1.0700-10 (1.7bln) 1.0725 (860m) 1.0750 (531m) 1.0780 (450m) 1.0800 (620m)
USDJPY: 108.00 (USD 1.1bln) 108.30 (388m) 108.50 (544m) 109.00 (651m) 109.15-25 (530M) 110.00 (782m) 110.25 (540m)
GBPUSD 1.2650 (GBP 430m) 1.2675 (350m) 1.2745-50 (211m) 1.2900-10 (365m)
EURGBP: 0.8465 (EUR 401m)
USDCHF 0.9925 (USD 250m)
AUDUSD 0.7500 (192m) 0.7515-25 (528m) 0.7570 (279m)
USDCAD: 1.3340-50 (332m) 1.3380-90 (200m) 1.3400 (320m) 1.3500 (393m) 1.3540 (605m)
NZDUSD: 0.6950-60 (NZD 272m) 0.7025 (357m)
-
13:29
BoE's Saunders: Mpc not obliged to delay rate move until it has certainty over exact implications of Brexit
-
Would not be surprised if cpi inflation reaches 3 pct in late 2017 or early 2018, above BoE feb forecasts
-
Prospective inflation pressure does not imply UK will face persistently high inflation, MPC has not gone soft
-
Current monetary policy stance is "clearly accommodative", would provide "considerable stimulus" even after modest rate rise
-
-
12:36
Canadian CPI rose less than expected in March
The Consumer Price Index (CPI) rose 1.6% on a year-over-year basis in March, following a 2.0% gain in February.
Excluding food and energy, the CPI was up 1.7% year over year in March, after posting a 2.0% increase in February.
Prices were up in five of the eight major components in the 12 months to March, with the transportation and shelter indexes contributing the most to the year-over-year rise in the CPI. The food index and the clothing and footwear index declined year over year, while the price index for household operations, furnishings and equipment was unchanged.
Transportation costs rose 4.6% over the 12-month period ending in March, after increasing 6.6% in February. The increase in transportation costs, as well as the deceleration in the growth of these prices compared with the previous month, was led by the gasoline index. On a year-over-year basis, gasoline prices rose 15.2% in March, following a 23.1% increase in February. The purchase of passenger vehicles index was up 2.1% in the 12 months to March, following a gain of 3.6% in February
-
12:30
Canada: Bank of Canada Consumer Price Index Core, y/y, March 1.3%
-
12:30
Canada: Consumer price index, y/y, March 1.6% (forecast 1.8%)
-
12:30
Canada: Consumer Price Index m / m, March 0.2% (forecast 0.4%)
-
12:02
Orders
EUR/USD
Offers: 1.0750-55 1.0770-75 1.0800 1.0830 1.0850
Bids: 1.0720 1.0700 1.0680-85 1.0650 1.0635 1.0620 1.0600
GBP/USD
Offers: 1.2850 1.2880 1.2900 1.2920 1.2950-60 1.2975 1.3000
Bids: 1.2800 1.2770-75 1.2760 1.2750 1.2720 1.2700 1.2680 1.2650
EUR/JPY
Offers: 117.30 117.50 117.80 118.00 118.50
Bids: 117.00 116.80 116.50 116.30 116.00 115.80-85 115.50
EUR/GBP
Offers: 0.8380-85 0.8400 0.8425-30 0.8445-50 0.8480 0.8500-05
Bids: 0.8360 0.8350 0.8335 0.8320 0.8300 0.8280 0.8260 0.8200
USD/JPY
Offers: 109.50 109.80 110.00 110.30 110.50 110.80 111.00
Bids: 109.00 108.70 108.50108.30 108.00 107.80 107.50 107.00
AUD/USD
Offers: 0.7550 0.7580 0.7600 0.7620 0.7650
Bids: 0.7520-25 0.7500 0.7480-85 0.7465 0.7450
-
11:42
French PM Cazeneuve says Le Pen seeking to use Paris shooting incident to divide the french people
-
10:23
Macron seen getting 24 pct of votes in first round of french presidential election, Le Pen 22 pct - Sopra/Steria poll
-
09:47
French presidential candidate Fillon says fight against "islamist totalitarianism" should be priority of next president
-
will renegotiate Schengen Treaty
-
-
09:12
UK government says if political agreement in N. Ireland not possible before june 8 uk election, govt will provide flexibility to allow a deal to be concluded
-
09:01
Forex option contracts rolling off today at 14.00 GMT:
EURUSD: 1.0600 (EUR 1.2bln) 1.0680 (803m) 1.0700-10 (1.7bln) 1.0725 (860m) 1.0750 (531m) 1.0780 (450m) 1.0800 (620m)
USDJPY: 108.00 (USD 1.1bln) 108.30 (388m) 108.50 (544m) 109.00 (651m) 109.15-25 (530M) 110.00 (782m) 110.25 (540m)
GBPUSD 1.2650 (GBP 430m) 1.2675 (350m) 1.2745-50 (211m) 1.2900-10 (365m)
EURGBP: 0.8465 (EUR 401m)
USDCHF 0.9925 (USD 250m)
AUDUSD 0.7500 (192m) 0.7515-25 (528m) 0.7570 (279m)
USDCAD: 1.3340-50 (332m) 1.3380-90 (200m) 1.3400 (320m) 1.3500 (393m) 1.3540 (605m)
NZDUSD: 0.6950-60 (NZD 272m) 0.7025 (357m)
-
08:39
UK retail sales decreased more than expected in March. GBP/USD down 50 pips
The 3 months to March shows a decrease of 1.4%; the third consecutive decrease for the underlying 3 month on 3 month pattern.
Looking at the quarterly movement, the 3 months to March 2017 (Quarter 1) is the first quarterly decline since 2013 (Quarter 4).
In March 2017, the quantity bought in the retail industry is estimated to have increased by 1.7% compared with March 2016 and decreased by 1.8% compared with February 2017; decreases are seen across the four main store types.
Average store prices (including fuel) increased by 3.3% on the year, the largest growth since March 2012; the largest contribution came from petrol stations, where year-on-year average prices rose by 16.4%.
Online sales (excluding automotive fuel) increased year-on-year by 19.5% and by 0.5% on the month, accounting for approximately 15.5% of all retail spending.
-
08:30
United Kingdom: Retail Sales (MoM), March -1.8% (forecast -0.2%)
-
08:30
United Kingdom: Retail Sales (YoY) , March 1.7% (forecast 3.4%)
-
08:14
The current account of the euro area recorded a surplus of €37.9 billion in February
The current account of the euro area recorded a surplus of €37.9 billion in February 2017. This reflected surpluses for goods (€29.5 billion), services (€9.5 billion) and primary income (€4.2 billion), which were partly offset by a deficit for secondary income (€5.4 billion).
The 12-month cumulated current account for the period ending in February 2017 recorded a surplus of €360.2 billion (3.4% of euro area GDP), compared with one of €341.2 billion (3.2% of euro area GDP) for the 12 months to February 2016 (see Table 1 and Chart 1). This was due to increases in the surpluses for goods (from €344.0 billion to €368.6 billion) and primary income (from €53.7 billion to €79.5 billion). These were partly offset by a decrease in the surplus of services (from €70.7 billion to €49.5 billion) and an increase in the deficit for secondary income (from €127.1 billion to €137.4 billion).
-
08:13
Eurozone economic growth hit a fresh six-year high in April
Eurozone economic growth hit a fresh six-year high in April, according to PMI survey data. Job creation also rose to the highest for almost a decade as firms boosted operating capacity in line with buoyant demand and widespread optimism about future prospects. Price pressures meanwhile remained among the strongest seen over the past six years.
The Markit Eurozone PMI rose to 56.7 in April, according to the preliminary 'flash' estimate (based on approximately 85% of final replies). Up from 56.4 in March, the latest reading was the highest since April 2011.
-
08:00
Eurozone: Current account, unadjusted, bln , February 27.9
-
08:00
Eurozone: Manufacturing PMI, April 56.8 (forecast 56)
-
08:00
Eurozone: Services PMI, April 56.2 (forecast 56)
-
07:44
German economic growth remained strong at the start of the second quarter - Markit
German economic growth remained strong at the start of the second quarter of 2017, despite slower increases in both manufacturing output and services activity compared with the highs seen in March. The April PMI survey data also registered slightly softer rates of new business expansion and job creation, plus a slight moderation in price pressures.
The Markit Flash Germany Composite Output Index registered 56.3 in April, down from March's near six-year high of 57.1. This signalled the first easing in growth of private sector business activity since the start of the year, but still the secondfastest rate of expansion in over three years. The latest data extended the current sequence of continuous growth to four years.
-
07:30
Germany: Manufacturing PMI, April 58.2 (forecast 58)
-
07:30
Germany: Services PMI, April 54.7 (forecast 55.5)
-
07:18
Tenth consecutive month of private sector growth in France
April's flash France PMI data pointed to a tenth consecutive month of private sector growth in France. The Markit Flash France Composite Output Index, based on around 85% of normal monthly survey replies, registered 57.4, compared to March's reading of 56.8.
The latest figure was indicative of the sharpest rate of growth in almost six years. In the service sector, activity increased for the tenth time in as many months. Moreover, the rate of expansion accelerated to a 71-month high and was sharp overall. Manufacturing output also continued to rise markedly, and at the fastest pace in six years.
-
07:00
France: Manufacturing PMI, April 55.1 (forecast 53)
-
07:00
France: Services PMI, April 57.7 (forecast 57.1)
-
06:53
Positive start of trading expected on the main European stock markets: DAX + 0.5%, CAC40 + 0.4%, FTSE + 0.2%
-
06:30
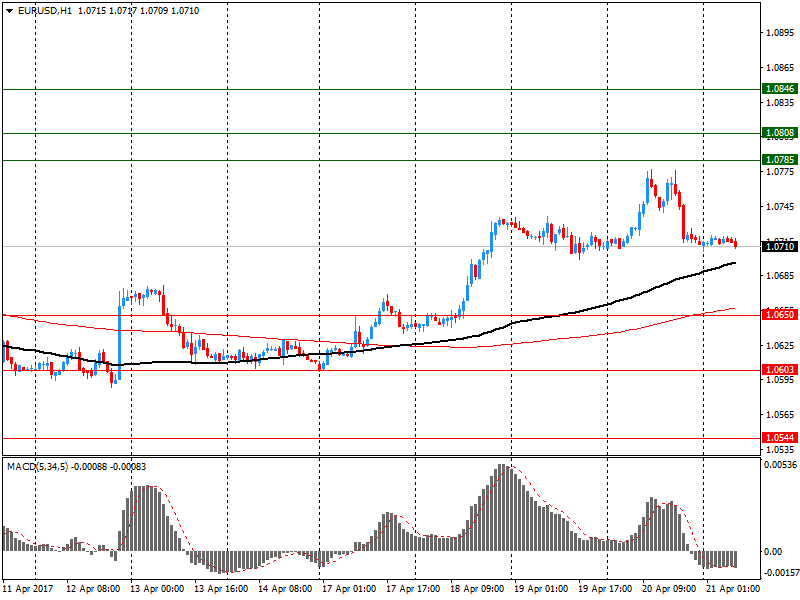
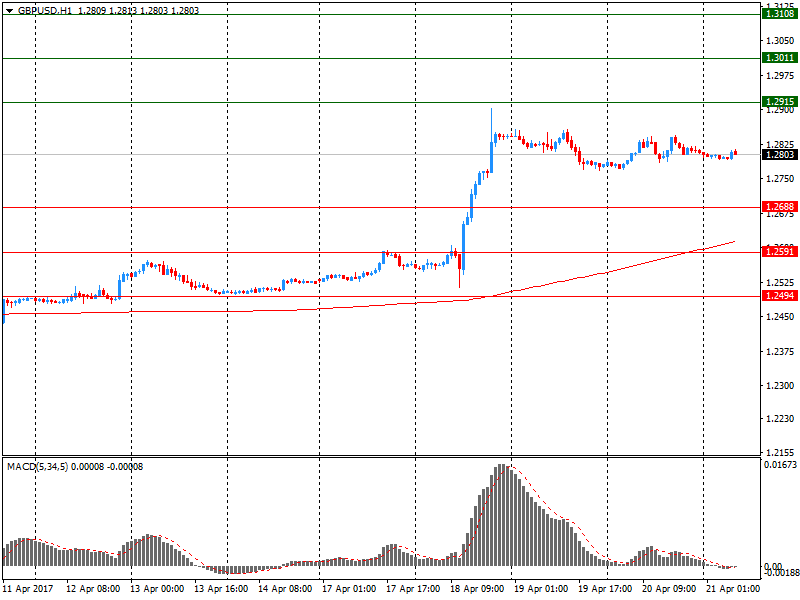
Options levels on friday, April 21, 2017
EUR/USD
Resistance levels (open interest**, contracts)
$1.0846 (1042)
$1.0808 (466)
$1.0785 (177)
Price at time of writing this review: $1.0710
Support levels (open interest**, contracts):
$1.0650 (644)
$1.0603 (862)
$1.0544 (2606)
Comments:
- Overall open interest on the CALL options with the expiration date June, 9 is 61998 contracts, with the maximum number of contracts with strike price $1,1100 (5063);
- Overall open interest on the PUT options with the expiration date June, 9 is 64139 contracts, with the maximum number of contracts with strike price $1,0400 (5181);
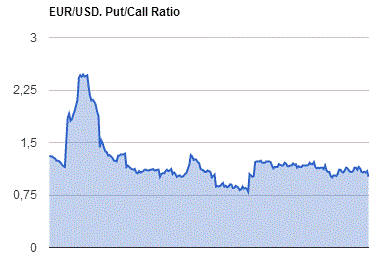
- The ratio of PUT/CALL was 1.03 versus 1.03 from the previous trading day according to data from April, 20

GBP/USD
Resistance levels (open interest**, contracts)
$1.3108 (1934)
$1.3011 (1333)
$1.2915 (1069)
Price at time of writing this review: $1.2803
Support levels (open interest**, contracts):
$1.2688 (219)
$1.2591 (1195)
$1.2494 (4602)
Comments:
- Overall open interest on the CALL options with the expiration date June, 9 is 21009 contracts, with the maximum number of contracts with strike price $1,2800 (2241);
- Overall open interest on the PUT options with the expiration date June, 9 is 25897 contracts, with the maximum number of contracts with strike price $1,2500 (4602);
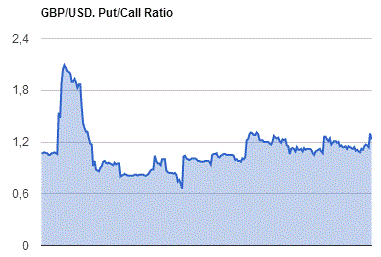
- The ratio of PUT/CALL was 1.23 versus 1.30 from the previous trading day according to data from April, 20

* - The Chicago Mercantile Exchange bulletin (CME) is used for the calculation.
** - Open interest takes into account the total number of option contracts that are open at the moment.
-
05:59
Flash Japan Manufacturing PMI up to 2-month high
Flash Japan Manufacturing PMI up to 2-month high of 52.8 in April (52.4 in March).
Flash Manufacturing Output Index at 53.6 (53.0 in March). Marked increase in production signalled.
Stronger growth in new export orders recorded.
Commenting on the Japanese Manufacturing PMI survey data, Paul Smith, Senior Economist at IHS Markit, which compiles the survey, said: "April's PMI data signalled continued healthy growth of Japan's manufacturing sector, and the latest results were again consistent with production rising at a quarterly rate of around 2%. "Driven by firmer external demand, the sector was underpinned by a stronger export performance in April, with new export orders rising at a rate amongst the best seen in the past three years. Companies are also adding to their workforces at a rate that matched January's 34- month peak, but price pressures continue to mount with input costs and output charges rising at stronger rates."
-
05:57
Japan Fin Min Aso says told G20 Japan sees as great benefit that G20 reconfirmed at Baden-Baden excess fx volatility, disorderly moves undesirable
-
05:51
One Policeman Killed, Another Wounded In Shooting Incident In Paris - Police Source
-
04:31
Japan: Tertiary Industry Index , February 0.2%
-
00:30
Japan: Manufacturing PMI, April 52.8
-

