Market news
-
23:29
Commodities. Daily history for Mar 20’02’2017:
(raw materials / closing price /% change)
Oil 48.29 +0.15%
Gold 1,234.00 0.00%
-
23:28
Stocks. Daily history for Mar 20’2017:
(index / closing price / change items /% change)
TOPIX -6.84 1565.85 -0.43%
Hang Seng +192.06 24501.99 +0.79%
CSI 300 +3.80 3449.61 +0.11%
Euro Stoxx 50 -10.93 3437.48 -0.32%
FTSE 100 +4.85 7429.81 +0.07%
DAX -42.34 12052.90 -0.35%
CAC 40 -17.08 5012.16 -0.34%
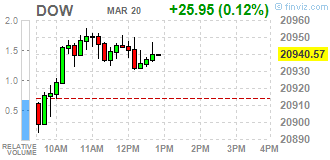
DJIA -8.76 20905.86 -0.04%
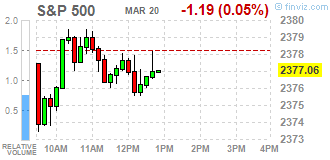
S&P 500 -4.78 2373.47 -0.20%
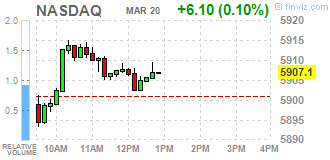
NASDAQ +0.53 5901.53 +0.01%
S&P/TSX -48.17 15442.32 -0.31%
-
23:27
Currencies. Daily history for Mar 20’2017:
(pare/closed(GMT +2)/change, %)
EUR/USD $1,0736 -0,01%
GBP/USD $1,2357 -0,30%
USD/CHF Chf0,9985 +0,02%
USD/JPY Y112,49 -0,16%
EUR/JPY Y120,77 -0,19%
GBP/JPY Y139 -0,46%
AUD/USD $0,7728 +0,31%
NZD/USD $0,7052 +0,51%
USD/CAD C$1,3353 +0,06%
-
22:59
Schedule for today,Tuesday, Mar 21’2017 (GMT0)
00:30 Australia House Price Index (QoQ) Quarter IV 1.5%
00:30 Australia RBA Meeting's Minutes
06:45 Switzerland SECO Economic Forecasts
07:00 Switzerland Trade Balance February 4.7
09:30 United Kingdom Producer Price Index - Input (MoM) February 1.7% 0%
09:30 United Kingdom Producer Price Index - Output (MoM) February 0.6% 0.3%
09:30 United Kingdom HICP ex EFAT, Y/Y February 1.6% 1.7%
09:30 United Kingdom Retail prices, Y/Y February 2.6% 2.9%
09:30 United Kingdom Producer Price Index - Input (YoY) February 20.5% 20%
09:30 United Kingdom Retail Price Index, m/m February -0.6% 0.8%
09:30 United Kingdom Producer Price Index - Output (YoY) February 3.5% 3.7%
09:30 United Kingdom PSNB, bln February 9.82 -2.5
09:30 United Kingdom HICP, m/m February -0.5% 0.5%
09:30 United Kingdom HICP, Y/Y February 1.8% 2.1%
10:00 United Kingdom BOE Gov Mark Carney Speaks
10:00 U.S. FOMC Member Dudley Speak
11:00 United Kingdom CBI industrial order books balance March 8 4
12:30 Canada Retail Sales, m/m January -0.5% 1.1%
12:30 Canada Retail Sales YoY January 4.3%
12:30 Canada Retail Sales ex Autos, m/m January -0.3% 1.2%
12:30 U.S. Current account, bln Quarter IV -113 -128.2
16:00 U.S. FOMC Member Esther George Speaks
20:00 Canada Annual Budget
22:00 U.S. FOMC Member Mester Speaks
23:30 Australia Leading Index February 0.0%
23:50 Japan Monetary Policy Meeting Minutes
23:50 Japan Trade Balance Total, bln February -1087 822
-
21:45
New Zealand: Visitor Arrivals, February 1.8%
-
20:06
The main US stock indexes finished trading almost unchanged
Major US stock indexes finished the session near the zero mark, as growth in the consumer market was offset by a fall in the utility sector.
A certain impact on the mood of market participants had a fall in prices on the oil market, as well as the outcome of the meeting of the G20 countries, which ended at the weekend in Germany. Recall, the key point of the annual meeting of the G20 finance ministers was their inability to reach an agreement on protecting free trade and combating protectionism because of the US refusal to sign the document.
The cost of oil slightly declined amid fears of investors that a growing volume of oil production in the US could hamper OPEC's efforts to reduce production. Pressure on quotes also provided the latest data from Baker Hughes on the number of drilling rigs in the US. On Friday, Baker Hughes reported that from March 11 to 17, the number of active oil drilling rigs in the US increased to 631 units from 617 units.
The focus was also the statements of representatives of the Fed, namely Evans, Kashkari and Harker. Head of the Federal Reserve Bank of Chicago, Evans, said that this year the Fed can start raising rates faster against the backdrop of positive economic outlook. In the meantime, the head of the Federal Reserve Bank of Minneapolis Kashkari noted that since inflation is now below 2% and there is still uncertainty about the weakness of the market, there are prerequisites for a more cautious increase in rates. Meanwhile, FRB President Philadelphia Harker said that, probably, the Central Bank will continue to raise rates gradually throughout 2017. Harker also noted that the rate increase last week was appropriate given all the data on the economy.
The components of the DOW index have mostly grown (19 out of 30). Caterpillar Inc. was the growth leader. (CAT, + 2.70%). More shares fell The Home Depot, Inc. (HD, -1.09%).
Most sectors of the S & P index recorded a decline. The utilities sector fell most of all (-0.5%). The leader of growth was the consumer goods sector (+ 0.3%).
At closing:
Dow -0.04% 20,907.12 -7.50
Nasdaq + 0.01% 5,901.53 +0.53
S & P -0.20% 2,373.46 -4.79
-
19:00
DJIA -0.09% 20,895.83 -18.79 Nasdaq -0.15% 5,892.39 -8.61 S&P -0.30% 2,371.09 -7.16
-
17:00
European stocks closed: FTSE 100 +4.85 7429.81 +0.07% DAX -42.34 12052.90 -0.35% CAC 40 -17.08 5012.16 -0.34%
-
16:52
Wall Street. Major U.S. stock-indexes little changed
Major U.S. stock-indexes little changed on Monday. The U.S. stock market has been on record-setting spree since the election of Donald Trump as president, but the rally has faltered in recent weeks as investors fret over the lack of clarity on his proposals to reform taxes and cut regulation.
Most of Dow stocks in positive area (18 of 30). Top loser - Visa Inc. (V, -1.13%). Top gainer - Caterpillar Inc. (CAT, +2.41%).
Most of S&P sectors in negative area. Top loser - Utilities (-0.5%). Top gainer - Consumer goods (+0.4%).
At the moment:
Dow 20883.00 +20.00 +0.10%
S&P 500 2372.75 -2.50 -0.11%
Nasdaq 100 5418.00 +9.50 +0.18%
Oil 49.12 -0.19 -0.39%
Gold 1232.80 +2.60 +0.21%
U.S. 10yr 2.48 -0.03
-
15:30
Oil prices pare losses, brent crude turns positive after Reuters reports OPEC support increases for extending oil supply cut
-
15:08
OPEC support increases for extending oil supply cut into H2 2017, but non-OPEC participation needed – OPEC sources
-
14:38
CIBC targets USD/CAD at 1.36 by the end of Q2, 1.39 by the end of Q3
The Canadian dollar reversed its course following the Fed's interest rate decision, seeing its greatest daily appreciation in a year but such gains are likely to fade in the near-term, says CIBC World Markets Research.
"Look for Governor Poloz to retain a dovish tilt in April, especially given that Trump-related risks have yet to be resolved," CIBC argues.
As such, CIBC argues that a few months the stronger post-Fed loonie will likely look like just a 'flash in the pan' on the way to an even weaker exchange rate.
CIBC targets USD/CAD at 1.36 by the end of Q2, and at 1.39 by the end of Q3.
Source: CIBC Economics - CIBC Capital Markets, efxnews.
-
14:00
It's OK if inflation overshoots target a bit as the labor markets tighten, Fed's Harker says - CNBC
-
13:31
U.S. Stocks open: Dow -0.05%, Nasdaq -0.03%, S&P -0.11%
-
13:19
Before the bell: S&P futures -0.18%, NASDAQ futures -0.05%
U.S. stock-index futures were flat, as investors lacked a catalyst to decisively move the major averages in one direction or the other.
Global Stocks:
Nikkei -
Hang Seng 24,501.99 +192.06 +0.79%
Shanghai 3,250.81 +13.36 +0.41%
FTSE 7,413.81 -11.15 -0.15%
CAC 5,013.10 -16.14 -0.32%
DAX 12,056.63 -38.61 -0.32%
Crude $48.05 (-1.50%)
Gold $1,230.80 (+0.05%)
-
12:58
Wall Street. Stocks before the bell
(company / ticker / price / change ($/%) / volume)
3M Co
MMM
192.65
0.29(0.15%)
550
ALTRIA GROUP INC.
MO
75.3
0.14(0.19%)
675
Amazon.com Inc., NASDAQ
AMZN
852.55
0.24(0.03%)
2494
AMERICAN INTERNATIONAL GROUP
AIG
62
-0.42(-0.67%)
1260
Apple Inc.
AAPL
140.31
0.32(0.23%)
97675
Barrick Gold Corporation, NYSE
ABX
18.97
0.12(0.64%)
14254
Caterpillar Inc
CAT
92.85
-0.06(-0.06%)
2674
Chevron Corp
CVX
107.81
0.13(0.12%)
924
Citigroup Inc., NYSE
C
60.05
-0.32(-0.53%)
17030
Exxon Mobil Corp
XOM
81.6
-0.40(-0.49%)
5800
Facebook, Inc.
FB
139.9
0.06(0.04%)
7809
Ford Motor Co.
F
12.49
0.01(0.08%)
11602
Freeport-McMoRan Copper & Gold Inc., NYSE
FCX
12.67
-0.09(-0.71%)
17358
General Electric Co
GE
29.9
0.02(0.07%)
558
General Motors Company, NYSE
GM
36.45
0.12(0.33%)
234
Goldman Sachs
GS
243
-0.94(-0.39%)
6089
Home Depot Inc
HD
149.3
-0.30(-0.20%)
5301
Intel Corp
INTC
35.36
0.09(0.26%)
12289
International Business Machines Co...
IBM
175.49
-0.16(-0.09%)
1537
Johnson & Johnson
JNJ
127.78
-0.28(-0.22%)
2729
JPMorgan Chase and Co
JPM
90.23
-0.45(-0.50%)
13568
Microsoft Corp
MSFT
65.01
0.14(0.22%)
1380
Nike
NKE
57.85
0.05(0.09%)
16215
Procter & Gamble Co
PG
91.04
0.04(0.04%)
1010
Starbucks Corporation, NASDAQ
SBUX
55.87
0.09(0.16%)
1042
Tesla Motors, Inc., NASDAQ
TSLA
261.35
-0.15(-0.06%)
14045
The Coca-Cola Co
KO
42.05
0.02(0.05%)
1837
Twitter, Inc., NYSE
TWTR
15.1
0.02(0.13%)
21949
Visa
V
90.48
0.24(0.27%)
1373
Wal-Mart Stores Inc
WMT
70.05
0.16(0.23%)
9099
Walt Disney Co
DIS
112.5
0.74(0.66%)
9910
Yahoo! Inc., NASDAQ
YHOO
46.71
0.12(0.26%)
192
Yandex N.V., NASDAQ
YNDX
23.43
-0.19(-0.80%)
601
-
12:58
Orders
EUR/USD
Offers: 1.0780 1.0800 1.0830 1.0850 1.0880 1.0900
Bids: 1.0750 1.0730 1.0700 1.0680 1.0650 1.0615-20 1.0600
GBP/USD
Offers: 1.2435 1.2445-50 1.2480 1.2500 1.2520 1.2550-55
Bids: 1.2400 1.2380 1.2365 1.2350 1.2330 1.2300 1.2285 1.2250 1.2200
EUR/JPY
Offers: 121.80 122.00 122.30 122.50 122.65 122.85 123.00
Bids: 121.00 120.75 120.50 120.30 120.00
EUR/GBP
Offers: 0.8720 0.8735 0.8750 0.8780-85 0.8800 0.8820 0.8850
Bids: 0.8665 0.8650 0.8630 0.8600 0.8580-85 0.8550 0.8520 0.8500
USD/JPY
Offers: 112.85 113.00 113.25-30 113.50 113.80 114.00 114.50
Bids: 112.45-50 112.30 112.00 111.85 111.65 111.50 111.00
AUD/USD
Offers: 0.7750 0.7780 0.7800 0.7830 0.785
Bids: 0.7700 0.7685 0.7665 0.7650 0.7600
Информационно-аналитический отдел TeleTrade
-
12:54
Upgrades and downgrades before the market open
Upgrades:
Downgrades:
Other:
Apple (AAPL) target raised to $155 from $135 at Cowen
-
12:40
Canadian wholesale sales rose 3.3% to a record high $59.1 billion in January
This was the largest monthly percentage gain since November 2009, when wholesale sales rose 3.8%. Sales were up in four of seven subsectors, representing 55% of total wholesale sales. The motor vehicle and parts subsector contributed the most to the gain.
In volume terms, wholesale sales increased 3.4%.
The motor vehicle and parts subsector recorded the largest gain in dollar terms in January, rising 17.1% to $11.9 billion, the first increase in three months. Excluding this subsector, wholesale sales increased 0.3% in January. Sales in the motor vehicle industry (+20.8%) rose to a record high, and accounted for most of the advance in the subsector. There were higher imports and exports of motor vehicles and parts in January, and motor vehicle manufacturing sales increased for a second consecutive month.
-
12:31
Sterling turns lower, falls almost half a cent to $1.2366
-
12:30
Canada: Wholesale Sales, m/m, January 3.3% (forecast 0.5%)
-
12:30
U.S.: Chicago Federal National Activity Index, February 0.34
-
12:11
European Commission says ready to begin Brexit negotiations
-
Tusk says will present EU 27 with draft Brexit negotiating guidelines within 48 hours from UK trigger
-
Everything is ready on this side", "we are waiting for notificaiton"
-
-
11:39
EU Told By Britain That It Will Announce On Monday It Will Trigger Art.50 Exit Clause On March 29 @LiveSquawk
-
10:50
German economy to grow by 1.6 pct in 2018 (1.6 pct workday adjusted) - Panel of Economic Advisers
-
2017 growth forecast by 0.1 pct point to 1.4 pct (1.7 pct workday adjusted)
-
Ecb should start winding down its bond-buying programme 'as soon as possible'
-
Expect german inflation to jump to 2.2 pct this year from 0.5 pct in 2016
-
German growth helped by robust labour market, positive outlook for global economy, higher state spending and ecb's 'still extremely' expansionary monetary policy
-
Trump's protectionist stance poses threat to international trade system, global economy
-
-
10:15
GBP/USD breaks major resistance at 1.2400. Retest expected
-
10:12
Wages and salaries per hour worked grew by 1.6% in the euro area
Hourly labour costs rose by 1.6% in the euro area (EA19) and by 1.7% in the EU28 in the fourth quarter of 2016, compared with the same quarter of the previous year. In the third quarter of 2016, hourly labour costs increased by 1.4% and 1.8% respectively. These figures are published by Eurostat, the statistical office of the European Union.
The two main components of labour costs are wages & salaries and non-wage costs. In the euro area, wages & salaries per hour worked grew by 1.6% and the non-wage component by 1.5%, in the fourth quarter of 2016 compared with the same quarter of the previous year. In the third quarter of 2016, the annual changes were +1.5% and +1.0% respectively. In the EU28, hourly wages & salaries rose by 1.8% and the non-wage component by 1.5% in the fourth quarter of 2016. In the third quarter of 2016, annual changes were +1.9% and +1.4% respectively.
-
09:36
Major stock exchanges in Europe started trading in the red zone: FTSE 7404.30 -20.66 -0.28%, DAX 12065.15 -30.09 -0.25%, CAC 5011.18 -18.06 -0.36%
-
09:35
Russia's finance minister says may buy up to $1 bln for current budget needs in 2017 - TASS
-
Good time to buy fx to fulfill ministry's commitments
-
Rouble overvalued
-
-
08:28
Gold long positions declined for second consecutive week. The net long position decreased by 27,647 contracts to +106K contracts - CFTC
-
08:13
Hungary's January gross wage growth 10 pct y/y vs 5.7 pct y/y in December - Stats
-
07:42
Barclays Capital FX Strategy now sees room for further near-term USD consolidation
Barclays Capital FX Strategy now sees room for further near-term USD consolidation in light of last week's 'unhurried' Fed which boosted risk assets and weakened the USD as the central bank seemed in no hurry to project a higher path of rate hikes next year.
In particular, Barclays expects further near-term USD weakness, concentrated primarily against high-yielding currencies.
"History suggests that this point in the Fed's tightening cycle is typically followed by further near-term USD weakness, stable equity prices and lower 10y UST yields," Barclays notes.
Barclays also continues to forecast two more rate hikes this year and three hikes in 2018 and expect to hear more from the committee about its balance sheet policies at the June FOMC.
Source: Barclays Research, efxnews.
-
07:38
Negative start of trading on the main European stock markets expected: DAX -0.3%, CAC -0.2%, FTSE -0.1%
-
07:32
Danish Central Bank says that for the first time in at least 183 years the Danish central government has no foreign currency loans
-
07:31
UK annual HPI rate of increase lowest since April 2013 at +2.3% - Rightmove
Annual rate of increase lowest since April 2013 at +2.3%, though overall demand remains strong:
-
Rightmove traffic at record January levels, with visits up 3% on January 2016's buy-to-let boosted period
-
Investor sectors understandably quieter than this time last year on number of properties coming to market and number of properties sold
-
Slower rate of price increases makes it riskier for sellers to over-price their property:
-
Analysis shows sellers are 40% more likely to sell if priced right when they first come to market
-
Three quarters of agents surveyed by Rightmove report price-sensitive markets with buyers reluctant to enquire if property is priced just a few percent too high
-
Price of property coming to market up 2.0% (+£5,986) this month, the smallest price rise at this time of year since February 2009
-
-
07:22
ECB Council member Visco: ECB could shorten break between of QE exit, rate hike
-
07:21
German producer prices for industrial products rose by 3.1%
In February 2017 the index of producer prices for industrial products rose by 3.1% compared with the corresponding month of the preceding year. This was the highest annual rate of change since December 2011 (+3.5%). In January 2017 the annual rate of change all over had been 2.4%.
Compared with the preceding month January 2017 the overall index rose by 0.2% in February 2017 (0.7% in January and 0.4% in December).
In February 2017 the price indices of all main industrial groups rose compared with February 2016: Energy prices increased by 5.4%, though prices of the different energy carriers diverged. Prices of petroleum products increased by 22.7%, whereas prices of natural gas (distribution) decreased by 7.5%. Prices of intermediate goods rose by 3.3%, prices of non-durable consumer goods by 2.3%. Prices of durable consumer goods increased by 1.1% and prices of capital goods by 0.9%.
-
07:00
Germany: Producer Price Index (YoY), February 3.1% (forecast 3.2%)
-
07:00
Germany: Producer Price Index (MoM), February 0.2% (forecast 0.3%)
-
06:30
Global Stocks
U.K. blue-chip stocks edged higher Friday, enough for the market to close at a second consecutive record high, as focus turned to the Group of 20 meeting of finance chiefs in Germany. Investors moved with caution Friday as the G-20 meeting of finance ministers and central bankers from the world's largest economies kicked off in the German spa town of Baden-Baden.
U.S. stocks edged lower on Friday but managed to post moderate weekly gains with investors awaiting further catalysts before jumping back into the market.
Equity markets kicked off the week lacking direction as investors digested news from the G-20 meeting over the weekend, while major U.S. indexes didn't provide much of a lead. As trading got underway, bearish sentiment reigned and volumes were lighter with Japan away on vacation; cautious investors stayed on the sidelines.
-
06:04
Options levels on monday, March 20, 2017
EUR/USD
Resistance levels (open interest**, contracts)
$1.0878 (989)
$1.0856 (116)
$1.0826 (47)
Price at time of writing this review: $1.0762
Support levels (open interest**, contracts):
$1.0659 (387)
$1.0610 (574)
$1.0582 (1096)
Comments:
- Overall open interest on the CALL options with the expiration date June, 9 is 39385 contracts, with the maximum number of contracts with strike price $1,1450 (3964);
- Overall open interest on the PUT options with the expiration date June, 9 is 43630 contracts, with the maximum number of contracts with strike price $1,0350 (4007);
- The ratio of PUT/CALL was 1.11 versus 1.05 from the previous trading day according to data from March, 17
GBP/USD
Resistance levels (open interest**, contracts)
$1.2710 (788)
$1.2613 (325)
$1.2517 (754)
Price at time of writing this review: $1.2390
Support levels (open interest**, contracts):
$1.2284 (223)
$1.2188 (358)
$1.2091 (541)
Comments:
- Overall open interest on the CALL options with the expiration date June, 9 is 13811 contracts, with the maximum number of contracts with strike price $1,3000 (1177);
- Overall open interest on the PUT options with the expiration date June, 9 is 16603 contracts, with the maximum number of contracts with strike price $1,1500 (3142);
- The ratio of PUT/CALL was 1.20 versus 1.19 from the previous trading day according to data from March, 17
* - The Chicago Mercantile Exchange bulletin (CME) is used for the calculation.
** - Open interest takes into account the total number of option contracts that are open at the moment.
-