Noticias del mercado
-
17:46
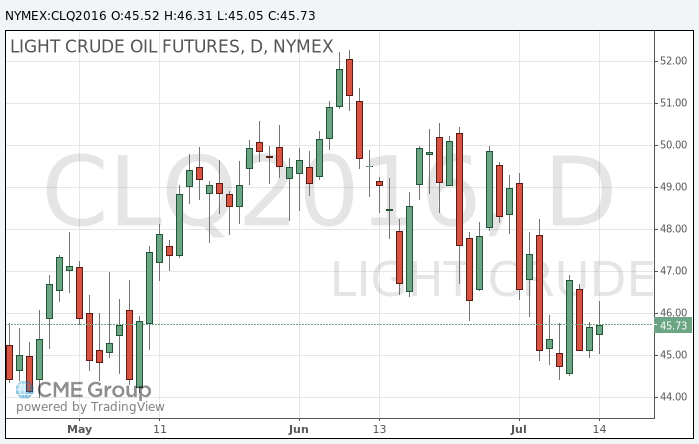
Oil rose moderatly
Oil prices rose as more positive than expected Chinese economic data reinforced expectations for oil demand in the country.
Oil demand this year is stable due to relatively low prices on the world market against the backdrop of continuing oversupply. Oil traders are closely watching China, in order to understand whether the consumption growth is not slowing down against a background of doubt in the sustainability of economic growth in this country.
The growth of China's GDP in the 2nd quarter, as in the 1st quarter amounted to 6.7%. Economists believe that growth will be slightly less.
However, some analysts have pointed out that oil production in China continues to decline due to aging fields and reduced investment.
"Oil production in China is significantly less than the amount of its consumption, and the only way to compensate for this gap - to increase oil imports," - said Gao Jian of SCI International.
Concerns about unexpected supply disruptions in various regions of the world continue to support prices. Exxon Mobil Corp. reported that its unit in Nigeria has suspended oil exports due to some problems. Earlier, local rebels attacking oil facilities led to the production decline.
Meanwhile, Libyan oil exports remains well below historic highs due to the contradictions between the various regional groupings, despite a recent agreement to merge competing oil companies in the country. "In the short term supply of oil in Libya is unlikely to grow sufficiently to affect the world markets", - ClearView Energy Partners LLC. The company does not rule out that "for many years" may be necessary to restore Libya's substantial oil production.
Meanwhile, signs that the global oversupply is reducing more slowly than expected, caping price increases.
In the US, production goes down after low prices led producers to reduce investment in new drilling, but oil and petroleum products stocks worldwide are redundant.
In June, the global oil supply increased by 600,000 barrels per day to 96 million barrels a day, according to a recent report from the International Energy Agency (IEA).
The cost of August futures for US light crude oil WTI rose to 46.31 dollars per barrel.
September futures price for Brent crude rose to 48.05 dollars a barrel on the London Stock Exchange ICE Futures Europe.
-
16:33
United States: the volume of inventories continued to rise in May
The US Commerce Department said that inventories increased again by the end of May, slightly speeding up the pace compared to April and exceeding the average forecast. Meanwhile, analysts believe that investment in inventories again will put pressure on economic growth in the second quarter.
According to the data, the volume of inventories increased in May by 0.2 percent after rising 0.1 percent in April, which has not been revised. Economists had expected the reserves, a key component of gross domestic product to rise by 0.1 percent.
Retail stocks except for the cars that go into the calculation of GDP, increased by 0.4 percent after falling 0.2 percent in April. However, the latter growth is likely to reflect the higher price. Against this background, analysts say it is unlikely that May data change will be an incentive for GDP growth adjusted for inflation.
Inventories icontributed to the growth of GDP in the first quarter of 2015 and were the reason for slowing down in each of the last three quarters. Companies have accumulated a record amount of reserves in the first half of 2015, which is ahead of demand. Although the pace of accumulation slowed down, the volume of inventories remained high in the second half of 2015 and the first quarter of 2016.
Also, the Ministry of Commerce reported that the volume of manufacturing sales rose 0.2 percent in May after rising 0.8 percent in April. The ratio of inventories to sales was 1.40 months in May, unchanged compared to April. This is a relatively high ratio and implies that the companies will continue to place fewer orders for the goods.
-
16:17
US consumer sentiment unexpectedly worsened in July
Preliminary results presented by Thomson-Reuters and Institute of Michigan, revealed: the mood among US consumers have deteriorated significantly in July, beating analysts' estimates, and reached its lowest level since March of this year.
According to the data, consumer sentiment index fell to 89.5 points compared with a final reading of 93.5 points in June. According to average estimates, the index should remain at the level of 93.5 points. Recall, this figure represents the results of a consumer survey on the subject of confidence in the current economic situation. The survey involved 500 respondents. With the help of this report, it appears the desire of consumers to spend their money. The index is a leading indicator of consumer sentiment. The indicator is calculated by adding 100 to the difference between the number of optimists and pessimists, expressed as a percentage.
Also presented in the report the results of studies have shown:
Index of 12-month inflation expectations in July was + 2.8% vs. + 2.6% in June
Index of 5-year inflation expectations in July, 2.6% against 2.6% in June
Preliminary expectations index in July fell from 82.4 to 77.1 (lowest from September 2014). The forecast was at 83.0
Preliminary current conditions index in July fell to 108.7 from 110.8 in June. It was expected to decline to 109.9
-
16:15
Bank of Italy lowers GDP growt
-
GDP: below 1% from 1,1% previous estimate
-
Growth may have slowed slightly in the Spring months
-
Italian economy may grow around 1% next year (prior forecast was 1.2%)
-
Risks may increase if financial market tensions spread
-
-
16:00
U.S.: Reuters/Michigan Consumer Sentiment Index, July 89.5 (forecast 93.5)
-
16:00
U.S.: Business inventories , May 0.2% (forecast 0.1%)
-
15:46
Option expiries for today's 10:00 ET NY cut
EURUSD: 1.1000 (EUR 1.5bln) 1.1085 (695m) 1.1100 (443m) 1.1200 (806m)
USDJPY: 104.00 (USD 1.1bln) 105.00 (350m) 105.50 (1.6bln)
GBPUSD: 1.2950 (GBP 603) 1.3000 (626m) 1.3500 (451m)
AUDUSD: 0.7520 (AUD 820m) 0.7530 (252m)
USDCAD 1.3000 (USD 300m) 1.3150 (500m) 1.3200 (289m)
EURGBP 0.8275 (EUR 351m)
AUDJPY 79.60 (AUD 4.3bln)
-
15:28
US industrial production well above forecasts
Industrial production in June grew at the fastest monthly rate in eleven months, on the back of strong auto and utility output. The Federal Reserve said Friday that industrial production grew 0.6% in June, topping the MarketWatch-compiled economist consensus for 0.5% growth. This is the fastest growth since last July. In addition, May's decline was revised to a 0.3% fall from an initially reported 0.4% drop.
Despite the gains, the factory sector is still struggling. For the second quarter as a whole, industrial production fell at an annual rate of 1%, its third consecutive quarterly decline and the fifth out of the past six. Compared to a year ago, production was down 0.7%. Manufacturing has been hurt by the strong dollar, the drop in oil prices, and the sluggish global economy.
Economists believe the sector has bottomed but signs of an upturn have proven elusive. There is concern that the Brexit vote could increase business uncertainty. The dollar has risen sharply against the British pound since the referendum in late June.
Utilities output jumped 2.4% in June due to hot weather in the month and capacity utilization rose to 75.4% in June from 74.9% in May. - Marketwatch
-
15:15
U.S.: Capacity Utilization, June 75.4% (forecast 75%)
-
15:15
U.S.: Industrial Production (MoM), June 0.6% (forecast 0.2%)
-
15:15
U.S.: Industrial Production YoY , June -0.7%
-
14:43
Canadian manufacturing sales down 1% in May
Manufacturing sales declined 1.0% to $49.9 billion in May, the third decrease in five months. The decline in May reflected lower sales of motor vehicles and petroleum and coal products.
Sales fell in 15 of 21 industries, representing nearly 70% of total Canadian manufacturing.
Constant dollar sales were down 2.1%, indicating that a lower volume of manufactured goods was sold in May.
Motor vehicle sales fell 4.2% to $5.6 billion in May, while sales of motor vehicle parts declined 2.3%. The declines in both industries were partly as a result of supply interruptions associated with the earthquake in Japan in April.
-
14:38
Retail sales in US rose more than forecasts
According to Bloomberg. sales at U.S. retailers rose more than forecast last month in a broad advance that shows consumers delivered for the economy in the second quarter.
The 0.6 percent increase in June retail receipts exceeded the highest estimate in a Bloomberg survey and followed a 0.2 percent gain the previous month that was smaller than previously estimated, Commerce Department figures showed Friday. So-called core sales, used to calculate gross domestic product, rose a larger-than-projected 0.5 percent for a second month.
A prolonged period of job creation and slowly improving wage gains are providing households with the means to keep spending. Consumers are key to shaping the growth path for the world's largest economy as global demand remains lackluster and threatens to damp business investment.
"The U.S. consumer is the backbone of the economic recovery," Bob Keiser, vice president of financial market research at S&P Global Market Intelligence in New York, said before the report. "We're creating jobs and we're growing wages. That's a very solid fundamental backdrop for consumption and retail sales."
-
14:36
Dollar bid after inflation and retail sales data
The Consumer Price Index for All Urban Consumers increased 0.2 percent in June on a seasonally adjusted basis, the U.S. Bureau of Labor Statistics reported today. Over the last 12 months, the all items index rose 1.0 percent before seasonal adjustment.
For the second consecutive month, increases in the indexes for energy and all items less food and energy more than offset a decline in the food index to result in the seasonally adjusted all items increase. The food index fell 0.1 percent, with the food at home index declining 0.3 percent. The energy index rose 1.3 percent, due mainly to a 3.3-percent increase in the gasoline index; the indexes for natural gas and electricity declined.
The index for all items less food and energy increased 0.2 percent in June. The shelter index rose 0.3 percent, and a broad array of indexes also increased, including medical care, education, airline fares, motor vehicle insurance, and recreation. In contrast, the indexes for used cars and trucks, apparel,
communication, and household furnishings and operations all declined in June.
The all items index rose 1.0 percent for the 12 months ending June. This is the same increase as for the 12 months ending May, but smaller than the 1.7 percent average annual increase over the past 10 years. The index for all items less food and energy rose 2.3 percent for the 12 months ending June, a larger increase than the 2.2 percent rise for the 12 months ending May, and above the average annual rate of 1.9 percent over the past 10 years.
-
14:30
U.S.: NY Fed Empire State manufacturing index , July 0.55 (forecast 5)
-
14:30
U.S.: CPI, Y/Y, June 1% (forecast 1.1%)
-
14:30
U.S.: Retail sales, June 0.6% (forecast 0.1%)
-
14:30
U.S.: CPI, m/m , June 0.2% (forecast 0.3%)
-
14:30
U.S.: Retail sales excluding auto, July 0.7% (forecast 0.4%)
-
14:30
U.S.: CPI excluding food and energy, Y/Y, June 2.3% (forecast 2.3%)
-
14:30
U.S.: Retail Sales YoY, June 2.7%
-
14:30
U.S.: CPI excluding food and energy, m/m, June 0.2% (forecast 0.2%)
-
14:30
Canada: Manufacturing Shipments (MoM), May -1% (forecast -0.7%)
-
14:22
European session review: US dollar fell against the euro
The following data was published:
(Time / country / index / period / previous value / forecast)
12:00 Eurozone trade balance, without seasonal adjustment in May 27.5 23 24.6
12:00 Eurozone Consumer Price Index m / m in June 0.4% 0.2% 0.2%
12:00 Eurozone Consumer Price Index y / y (final data) June -0.1% 0.1% 0.1%
12:00 Eurozone Consumer Price Index, the base value, y / y (final data) June 0.8% 0.9% 0.9%
15:00 UK BOE Speech Mark Carney
Euro rose moderately against the dollar, approaching yesterday's highs. Some support for the single currency had inflation statistics for the euro area, which coincided with forecasts. The statistical agency Eurostat reported that in June, consumer prices in the eurozone rose by 0.2% after rising 0.4% in May. Meanwhile, annual inflation rose in June by 0.1% after falling 0.1% the previous month. Last change (MoM and YoY) in line with expectations and preliminary estimate. Recall that in June 2015, annual inflation was 0.1%. The base index, which excludes energy and food prices, rose 0.9% year on year, confirming the forecasts and coincided with the previous estimate. Recall that in May, the index increased by 0.8%. Among the EU countries, annual inflation remained unchanged in June, after falling 0.1% in May. A year earlier the rate was 0.1%. Experts point out that despite the improvement, inflation is now just as far from the target of the ECB, as well as two years ago, when the first stimulus measures have been taken. However, during July meeting ECB not be likely to change the parameters of monetary policy and will continue to focus on the implementation of the stimulus package, announced in March this year.
Trading dynamics also affected by expectations of the US data sets, namely retail sales, consumer price inflation, industrial production and consumer confidence. In the latest statement the Fed's monetary policy stated that household spending rising and inflation is below the target level, partly reflecting the drop in energy prices and import prices excluding energy.
The British pound depreciated significantly against the dollar, returning to the opening levels of the session. The decline was caused by the release of the pound weak data on the UK, as well as statements by the representatives of the Central Bank of England. Office for National Statistics reported that the volume of construction fell sharply in May, during the preparations for the referendum on membership in the European Union. Last update indicates that the sector could put pressure on economic growth in the second quarter. The report showed that in May, the volume of production in the construction sector decreased by 2.1% compared to April. Analysts had expected that the volume of construction to decrease by 1.1% after rising 2.8% in April (revised from + 2.5%). Housing construction fell by 3.2 percent in May, recording the biggest drop since February, 2014. The ONS said that the volume of construction should increase by 1.9 percent in June, in order to avoid impact on economic growth in the second quarter. However, experts note that such growth looks unlikely. In addition, data showed that construction fell by 1.9 percent after declining 0.6 percent in annual terms in April. Economists had expected a decline of 3.5 percent.
However, today the Bank of England representative Haldane noted that in August is need a substantial easing of monetary policy. "The referendum significantly increased economic uncertainty, which will put pressure on costs in the foreseeable future, - the politician said -. The economy is likely to slow, and slowing down can cause a significant increase in unemployment, however, there is no reason to predict the financial crisis." In addition, Haldane said that inflation may exceed the target level, but it is unlikely that inflation will stabilize at a high level
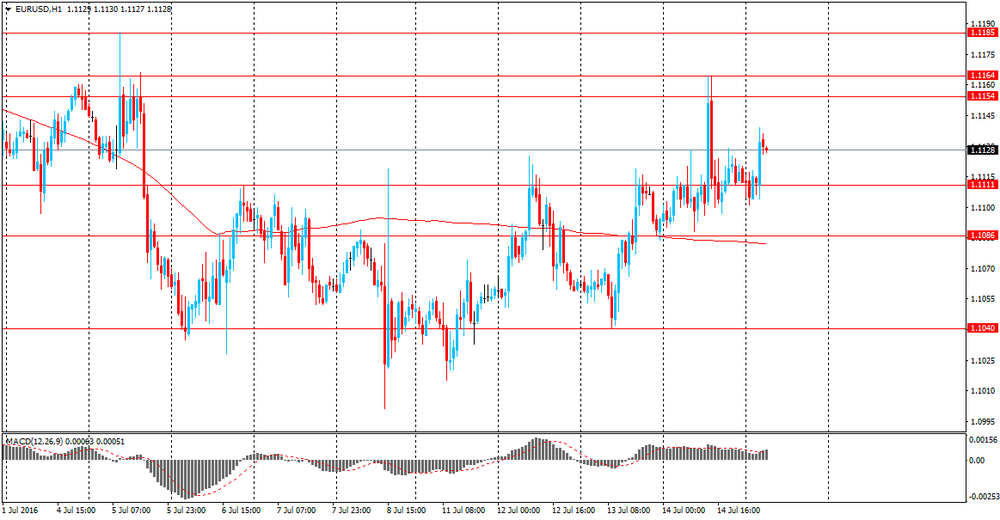
EUR / USD: during the European session, the pair rose to $ 1.1148, but then retreated slightly
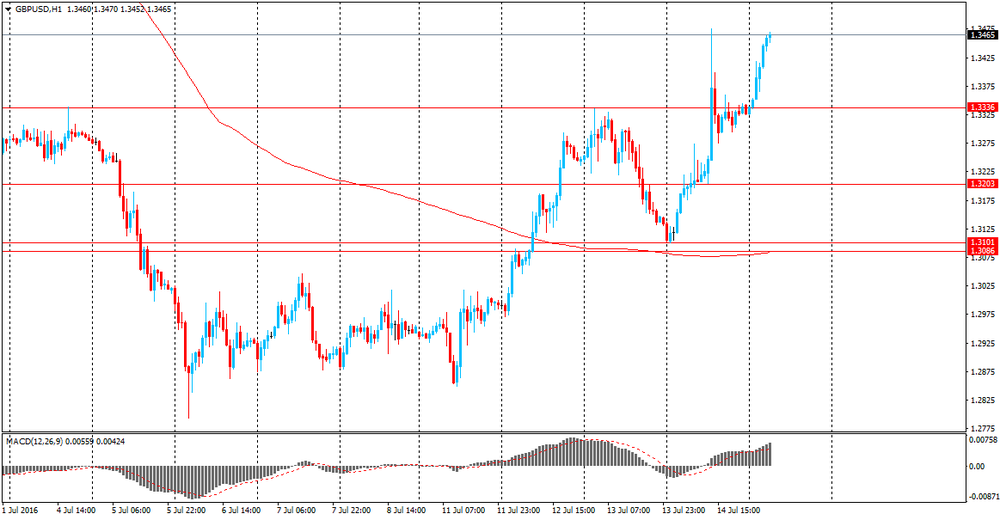
GBP / USD: during the European session, the pair fell to $ 1.3343 from $ .3481
USD / JPY: during the European session, the pair traded in a narrow range
-
14:00
Orders
EUR/USD
Offers 1.1140-45 1.1170 1.1185 1.1200 1.1230 1.1250
Bids 1.1100 1.1080-85 1.1050 1.1030 1.1000 1.0975-80 1.0950 1.0930 1.0900
GBP/USD
Offers 1.3380 1.3400 1.3420-25 1.3450 1.3480 1.3500 1.3520 1.3550
Bids 1.3350 1.3335 1.3320 1.3300 1.3280 1.3250 1.3220 1.3200 1.3180 1.31501.31301.3100
EUR/GBP
Offers 0.8355-60 0.8385 0.8400 0.8420-25 0.8450 0.8470 0.8485 0.8500
Bids 0.8300 0.8285 0.8255-60 0.8230 0.8200 0.8150
EUR/JPY
Offers 118.00 118.50 119.00 119.50 119.85 120.00
Bids 117.20 117.00 116.80 116.50 116.25 116.00 115.50 115.00
USD/JPY
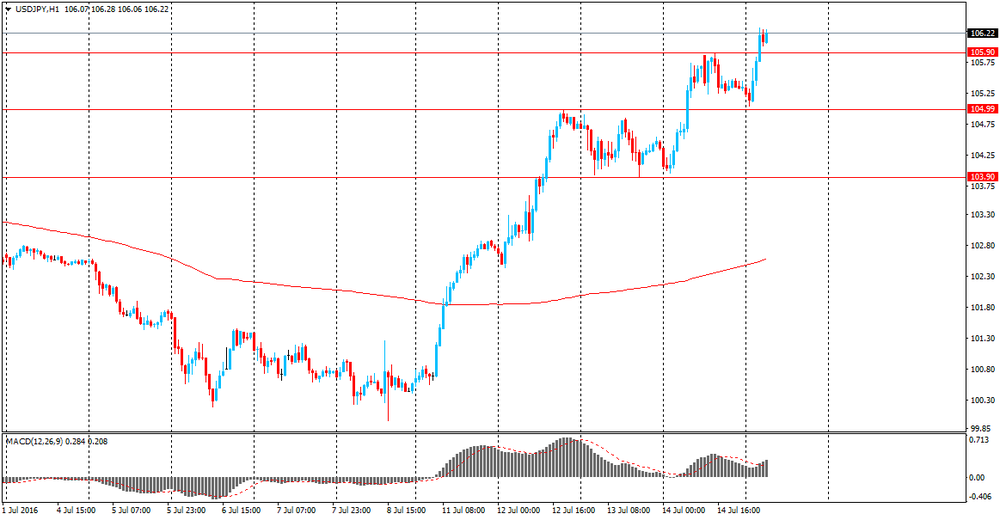
Offers 106.00 106.30-35 106.50 106.70 107.00 107.50
Bids 105.30-35 105.00 104.80 104.50-60 104.20 104.00 103.80 103.50 103.30 103.00
AUD/USD
Offers 0,7635 0.7650 0.7670 0.7700 0.7720 0.7750-55
Bids 0.7600-0.7590 0.7575 0.7550 0.7520 0.7500 0.7480 0.7450-55
-
13:53
Bank of England Governor, Mark Carney due to speak about climate change and the financial markets, in Toronto
-
12:10
Chinese Prime Minister, Lee: downward economic preasure remains
-
stable in H1 2016, performed in line with expectations.
-
government confident of meeting major targets for this year.
-
government debt ratio is low.
-
household savings are high.
-
plenty of tools available in the governments policy box.
-
-
11:46
Bank of England, Haldane: Material easing likely to be needed in August. GBP/USD down 100 pips so far
-
11:17
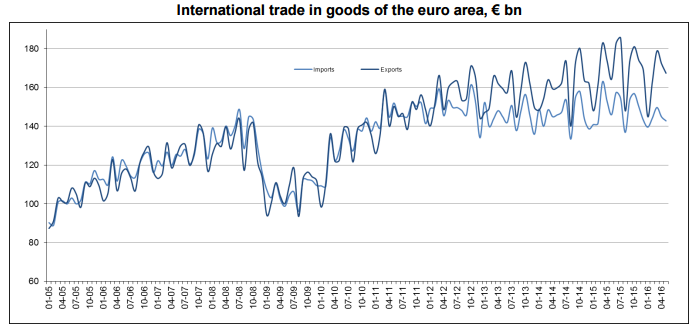
Trade balance surplus in Euro Zone
The first estimate for euro area (EA19) exports of goods to the rest of the world in May 2016 was €167.4 billion, an increase of 2% compared with May 2015 (€164.3 bn). Imports from the rest of the world stood at €142.8 bn, a fall of 2% compared with May 2015 (€146.0 bn). As a result, the euro area recorded a €24.6 bn surplus in trade in goods with the rest of the world in May 2016, compared with +€18.3 bn in May 2015. Intra-euro area trade rose to €139.4 bn in May 2016, up by 1% compared with May 2015.
-
11:14
Euro Area inflation up 0.2% in June
Euro area annual inflation was 0.1% in June 2016, up from -0.1% in May. In June 2015 the rate was 0.2%. European Union annual inflation was 0.0% in June 2016, up from -0.1% in May. A year earlier the rate was 0.1%, according to Eurostat figures.
In June 2016, negative annual rates were observed in thirteen Member States. The lowest annual rates were registered in Cyprus (-2.0%), Bulgaria (-1.9%) and Croatia (-1.2%). The highest annual rates were recorded in Belgium (1.8%), Sweden (1.2%) and Malta (1.0%). Compared with May 2016, annual inflation fell in two Member States, remained stable in eight and rose in seventeen.
The largest upward impacts to euro area annual inflation came from restaurants & cafés (+0.11 percentage points), rents and tobacco (both +0.06 pp), while fuels for transport (-0.41 pp), heating oil (-0.16 pp) and gas (-0.13 pp) had the biggest downward impacts.
-
11:01
Eurozone: Harmonized CPI ex EFAT, Y/Y, June 0.9% (forecast 0.9%)
-
11:00
Eurozone: Trade balance unadjusted, May 24.6 (forecast 23)
-
11:00
Eurozone: Harmonized CPI, Y/Y, June 0.1% (forecast 0.1%)
-
11:00
Eurozone: Harmonized CPI, June 0.2% (forecast 0.2%)
-
10:40
Construction output decreased 2.1% in UK
The reporting period for this release covers the calendar month of May 2016; therefore, the data refers to the period prior to the EU referendum.
In May 2016, output in the construction industry was estimated to have decreased by 2.1% compared with April 2016. Both all new work and repair and maintenance reported decreases, falling by 2.6% and 1.4% respectively.
Within all new work, there were decreases in all work types, except infrastructure. The main contribution to the decrease came from private new housing.
Within repair and maintenance (R&M) there were falls in all work types.
Compared with May 2015, output in the construction industry decreased by 1.9%.
The underlying pattern, as suggested by the 3-month on 3-month movement in output in the construction industry, decreased by 2.1%. This was the third consecutive month of 3-month on 3-month falls.
-
10:10
Germany's manufacturing employment increased in May
Germany's manufacturing employment increased in May, provisional results from Destatis showed Friday.
Manufacturing employment increased 0.9 percent or about 49,000 in May from the prior year. Nearly 5.4 million people worked in local units of manufacturing.
The number of hours worked climbed 3.4 percent in May from a year earlier to 653 million. The earnings totaled EUR 23.9 billion, which was down by 0.2 percent from prior year.
-
10:00
Option expiries for today's 10:00 ET NY cut
EUR/USD: 1.1000 (EUR 1.5bln) 1.1085 (695m) 1.1100 (443m) 1.1200 (806m)
USD/JPY: 104.00 (USD 1.1bln) 105.00 (350m) 105.50 (1.6bln)
GBP/USD: 1.2950 (GBP 603) 1.3000 (626m) 1.3500 (451m)
AUD/USD: 0.7520 (AUD 820m) 0.7530 (252m)
USD/CAD 1.3000 (USD 300m) 1.3150 (500m) 1.3200 (289m)
EUR/GBP 0.8275 (EUR 351m)
AUD/JPY 79.60 (AUD 4.3bln)
-
09:47
Review of financial and economic press: Kazakhstan has reduced oil production
newspaper. ru
Kazakhstan to cut oil production
As a result of a cut in production by 2.4% in the first half of 2016 the volume of oil production was 32.975 million tons.
IMF chief called Brexit a "sobering shower" for the EU
the referendum results were a "sobering shower" for politicians in the EU, said the head of the International Monetary Fund, Christine Lagarde.
Theresa May has changed the UK Minister for Business
New British Prime Minister Theresa May has deprived Conservative Sajid Javid the post of Minister of State for Business, reports The Independent. It is noted that Javid was appointed head of the Department of Local Government. At the same time the new Minister of State for Business became Greg Clark.
The Bank of England kept its benchmark rate unchanged
The Bank of England kept interest rates at the same level regardless of the outcome of the referendum on withdrawal from the European Union, according to Reuters. The rate remained unchanged at 0.5%.
Britain will not impose a budget crisis due to Brexit
The new Minister of Finance Philip Hammond said that the new UK Government will not impose a budget crisis in connection with Brexit, but the final statement of the Ministry of Finance in this regard will be presented in the autumn, according to The Guardian.
-
09:04
Today’s events:
At 12:00 GMT the Bank of England Governor Mark Carney will deliver a speech
At 13:00 GMT Andy Haldane of the Bank of England will make a speech
At 14:00 GMT FOMC member James Bullard will give a speech
At 17:00 GMT FOMC members John Williams will deliver a speech
At 17:15 GMT FOMC member James Bullard will give a speech and the FOMC members Neil Kashkari will deliver a speech
-
08:50
Asian session review: the dollar rose against the yen
Since the beginning of the trading session, the US dollar rose against the yen reaching Y106,23, the highest since June 24 after strong data on China's GDP, which increased risk appetite.
China's gross domestic product in the second quarter increased by 6.7% compared to the same period of the previous year. However, the figure was slightly above economists' expectations of 6.6%. Seasonally adjusted, GDP in the second quarter rose by 1.8% after rising 1.1% in the first quarter.
The growth of China's economy in the second quarter remained stable, indicating the positive impact of stimulus measures implemented by the Chinese government
China's central bank lowered interest rates six times since November 2014 in an attempt to support economic growth.
Also, the National Bureau of Statistics of China released data on industrial production and retail sales, according to which industrial production in China from January to June increased by 6.2% compared to the same period of the previous year of 6.0%. The indicator was higher than economists' forecast of 5.9%.
Retail sales in China increased by 10.6% in June, higher than the previous value, and analysts' expectations of 10% year on year.
Investment in China's urban sector in the first half of the current year increased by 9%, which is lower than the previous value of 9.6% and 9.4% of analysts' expectations. Reduced investments in the urban sector indicates a weakening of the pace of overall economic growth of China. As the economy of China has a major impact on the global economy, this indicator has a specific meaning for the Forex market.
The report by the National Bureau of Statistics of China said that in the first half the volume of investment in agriculture increased by 21.1%. Investments in industry increased by 4.4%. The inflow of investments in the services sector grew by 11.7%.
In China, in recent years there there has been a slowdown in the growth of investment in fixed assets. So, in 2011 the volume of investments increased by 31.8% and by the end of 2015 - only 10%.
Pound, during the session received support from the Bank of England meeting results. Despite the experts' forecasts, the Central Bank decided to leave the interest rate unchanged at 0.5%. The minutes of the meeting noted that the number of votes cast in favor of keeping the key was 8, and the number of votes cast in favor of raising the key rate, 1. Also in the report it was said that most members of the Committee are expected easing in August. "The committee members previously discussed the different possible packages of measures, but the degree of additional incentives will depend on the August forecasts, need a detailed analysis of all the policy options.". "Economic activity is likely to weaken after the referendum. Recently revealed a sharp drop in household confidence indicators and the business community, however, some companies have postponed investment and personnel decisions.".
EUR / USD: during the Asian session, the pair was trading in the $ 1.1100-25 range.
GBP / USD: during the Asian session, the pair is trading in the $ 1.3325-1.3420 range,
USD / JPY: during the Asian session, the pair rose to Y106.31
-
08:38
Whats next for Eur/Usd? - Morgan Stanley
"EURUSD has traded at a discount relative to real rate and yield differentials due to the EMU's financial sector weakness and uncertainties about the impact of Brexit on European economies.
Real yield differentials against GBP and the USD point in favour of the EUR and with domestic balance sheets weak, there will be no export of long-term capital sufficient to offset the Eurozone's current account surpluses without an FX adjustment.
Over recent weeks, the EUR has traded increasingly tight to the performance of the EMU's banking sector share prices indices. Italian bank shares have rebounded recently, increasing the chance of a EUR rally".
-
08:35
Investment in China's urban sector declined in June
Investment in China's urban sector in the first half of the current year increased by 9%, which is lower than the previous value of 9.6% and 9.4% analysts' expectations. This indicator published by China's National Bureau of Statistics estimates the total amount of money spent on business activity in the construction sector and for the purchase of fixed assets. It is a comprehensive index, which reflects the scope, pace and a proportional ratio of investments in fixed assets. Reduced investments in the urban sector indicates a weakening of the pace of overall economic growth of China. As the economy of China has a major impact on the global economy, this indicator has a specific meaning for the Forex market.
The report by the National Bureau of Statistics of China said that in the first half of the volume of investment in agriculture increased by 21.1%. Investments in industry increased by 4.4%. The inflow of investments in the services sector grew by 11.7%.
In China, in recent years there has been a slowdown in the growth of investment in fixed assets. So, in 2011 the volume of investments increased by 31.8% and by the end of 2015 - only 10%.
-
08:33
Retail sales in China increased slightly in June
Retail sales in China from January to June 2016 increased by 10.6% compared with the same period of last year (10%). Analysts had expected an increase of 10%
Retail sales - the indicator published by the National Bureau of Statistics of China that estimate the total amount of cash proceeds from the sale of consumer goods to end consumers. In calculating the index is takes into account the total of all consumer goods delivered by various industries for households and social groups through a variety of channels in the retail trade. This is an important indicator that allows to study the changes in the retail market in China and reflects the level of economic well-being. In general, its high levels are considered to be positive for the Chinese economy
According to the data released earlier, China's economic growth in the second quarter remained stable. This suggests that the stimulus measures implemented by the government may have some influence.
-
08:31
Options levels on friday, July 15, 2016:
EUR/USD
Resistance levels (open interest**, contracts)
$1.1335 (3033)
$1.1268 (3190)
$1.1201 (1640)
Price at time of writing this review: $1.1125
Support levels (open interest**, contracts):
$1.1030 (3291)
$1.0960 (3427)
$1.0879 (7085)
Comments:
- Overall open interest on the CALL options with the expiration date August, 5 is 34234 contracts, with the maximum number of contracts with strike price $1,1200 (3190);
- Overall open interest on the PUT options with the expiration date August, 5 is 46828 contracts, with the maximum number of contracts with strike price $1,0900 (7085);
- The ratio of PUT/CALL was 1.37 versus 1.42 from the previous trading day according to data from July, 14
GBP/USD
Resistance levels (open interest**, contracts)
$1.3706 (503)
$1.3608 (1192)
$1.3511 (851)
Price at time of writing this review: $1.3434
Support levels (open interest**, contracts):
$1.3378 (305)
$1.3283 (332)
$1.3187 (284)
Comments:
- Overall open interest on the CALL options with the expiration date August, 5 is 21431 contracts, with the maximum number of contracts with strike price $1,3400 (1941);
- Overall open interest on the PUT options with the expiration date August, 5 is 18499 contracts, with the maximum number of contracts with strike price $1,2950 (2414);
- The ratio of PUT/CALL was 0.86 versus 0.87 from the previous trading day according to data from July, 14
* - The Chicago Mercantile Exchange bulletin (CME) is used for the calculation.
** - Open interest takes into account the total number of option contracts that are open at the moment.
-
08:30
Federal Reserve of St. Louis President James Bullard: Fed should not hurry with rate increase
The president of the Federal Reserve Bank of St. Louis James Bullard said today that we should not rush to raise interest rates at the next Fed meeting in August. He said the central bank should take a wait and see attitude after the British decision to withdraw from the European Union.
Dallas Fed President Robert Kaplan suggested that the central bank should gradually tighten monetary policy to return the economy to normal conditions. "We should try to give up soft policy we should do it gradually".
According to Kaplan, the preservation of a low interest rate creates an imbalance that is difficult to quickly discern.
-
08:16
Industrial production in China jumped 6.2 percent
Industrial production in China jumped 6.2 percent on year in June, the National Bureau of Statistics said on Friday.
That beat forecasts for 5.9 percent, and it was up from 6.0 percent in May.
Output added 0.4 percent on month.
The bureau also said that retail sales advanced 10.6 percent - beating expectations for 9.9 percent and up from 10.0 percent in the previous month.
Fixed asset investment gained .0 percent, shy of forecasts for 9.4 percent and down from 9.6 percent a month earlier.
-
08:12
China's economy expanded 6.7% in the second quarter
China's economy expanded 6.7% in the second quarter, the government reported Friday local time, matching Q1's year-over-year gain and just above views for a drop to 6.6%.
The last two quarters show the weakest growth since the start of 2009, but they suggest that the gradual deceleration may be ending, easing concerns about global growth that could upset financial markets.
Many economists also have doubts about the accuracy of Chinese data.
-
04:01
China: Fixed Asset Investment, June 9.0% (forecast 9.4%)
-
04:01
China: Fixed Asset Investment, June 9.0% (forecast 9.4%)
-
04:00
China: Industrial Production y/y, June 6.2% (forecast 5.9%)
-
04:00
China: GDP y/y, Quarter II 6.7% (forecast 6.6%)
-
04:00
China: Retail Sales y/y, June 10.6% (forecast 10.0%)
-
00:31
Currencies. Daily history for Jul 14’2016:
(pare/closed(GMT +3)/change, %)
EUR/USD $1,1112 +0,20%
GBP/USD $1,3326 +1,45%
USD/CHF Chf0,981 -0,37%
USD/JPY Y105,35 +0,94%
EUR/JPY Y117,09 +1,11%
GBP/JPY Y140,4 +2,37%
AUD/USD $0,7626 +0,28%
NZD/USD $0,7191 -1,15%
USD/CAD C$1,2898 -0,64%
-
00:00
Schedule for today, Friday, Jul 15’2016:
(time / country / index / period / previous value / forecast)
02:00 China Industrial Production y/y June 6.0% 5.9%
02:00 China Fixed Asset Investment June 9.6% 9.4%
02:00 China Retail Sales y/y June 10.0% 10.0%
02:00 China GDP y/y Quarter II 6.7% 6.6%
09:00 Eurozone Trade balance unadjusted May 27.5 23
09:00 Eurozone Harmonized CPI June 0.4% 0.2%
09:00 Eurozone Harmonized CPI, Y/Y (Finally) June -0.1% 0.1%
09:00 Eurozone Harmonized CPI ex EFAT, Y/Y (Finally) June 0.8% 0.9%
12:00 United Kingdom BOE Gov Mark Carney Speaks
12:30 Canada Manufacturing Shipments (MoM) May 1.0% -0.7%
12:30 U.S. Retail sales June 0.5% 0.1%
12:30 U.S. Retail Sales YoY June 2.5%
12:30 U.S. Retail sales excluding auto July 0.4% 0.4%
12:30 U.S. NY Fed Empire State manufacturing index July 6.01 5
12:30 U.S. CPI, m/m June 0.2% 0.3%
12:30 U.S. CPI, Y/Y June 1% 1.1%
12:30 U.S. CPI excluding food and energy, m/m June 0.2% 0.2%
12:30 U.S. CPI excluding food and energy, Y/Y June 2.2% 2.3%
13:15 U.S. Capacity Utilization June 74.9% 75%
13:15 U.S. Industrial Production (MoM) June -0.4% 0.2%
13:15 U.S. Industrial Production YoY June -1.4%
14:00 U.S. Reuters/Michigan Consumer Sentiment Index (Preliminary) July 93.5 93.5
14:00 U.S. Business inventories May 0.1% 0.1%
-