Noticias del mercado
-
17:14
Official: IMF May Not Join Greek Program Before German Election - Bloomberg
-
16:54
EUR / USD has increased significantly, updating session highs, move caused by weak US data, some easing of concerns about the Deutsche Bank and month end flows. Now the pair is trading at $ 1.1218
According to Livesquawk, Deutsche Bank may be fined by the US Department of Justice only $ 5.4 billion (previously reported $ 14.0 billion).
-
16:09
US consumer sentiment revised up
According to the University of Michigan, the confidence edged upward in September due to gains among higher income households, while the Sentiment Index among households with incomes under $75,000 has remained at exactly the same level for the third consecutive month. Importantly, the data provide no evidence of an upward trend as the average level of the Sentiment Index since the start of 2016 is nearly identical with the September level (91.4 versus 91.2).
All of the September gains were concentrated in the Expectations Index, while assessments of current economic conditions were slightly less favorable. Fewer reports of recent income gains were counterbalanced by an uptick in income gains expected during the year ahead. The larger recent gains among upper income households was partly due to continued declines in their inflation expectations. Buying plans edged downward mainly due to the declining availability of price discounts. Real personal consumption expenditures can be expected to increase by 2.7% through mid 2017.
-
16:04
Chicago PMI surges to 54.2 in September
The MNI Chicago Business Barometer increased 2.7 points to 54.2 in September from 51.5 in August, recovering most of lost ground experienced in the previous month. On a trend basis, the MNI Chicago Report paints a slightly better picture than earlier in the year with the Barometer averaging 53.8 in Q3, up from 52.2 in Q2 and the highest quarterly level since Q4 2014.
The latest increase was driven by a sharp gain in Production, which rose 7.3 points to 59.8, the highest since January 2016. New Orders and Order Backlogs, which led the Barometer's decline last month, were little changed in September, with the latter failing to bounce back above the 50 breakeven level. Employment was the only Barometer component that fell, having rallied to a 16-month high in August
-
16:00
U.S.: Reuters/Michigan Consumer Sentiment Index, September 91.2 (forecast 90)
-
15:45
U.S.: Chicago Purchasing Managers' Index , September 54.2 (forecast 52)
-
15:30
Option expiries for today's 10:00 ET NY cut
EUR/USD: 1.1100 (800m) 1.1165-70 (844m) 1.1190 (589m) 1.1250 (278m) 1.1350 (346m)
USD/JPY: 100.00 (USD 786m) 102.00 (600m)
GBP/USD: 1.3100 (641m)
AUD/USD: 0.7650 (AUD 342m)
USD/CAD: 1.2990 (USD 380m) 1.3075 (260m) 1.3125 (206m) 1.3144-50 (USD 509m)
-
14:39
Canada: Industrial Product Prices declined
The Industrial Product Price Index (IPPI) declined 0.5% in August, after increasing 0.2% in July. Of the 21 major commodity groups, 2 were up, 11 were down and 8 were unchanged.
The decline in the IPPI in August was mainly attributable to prices for meat, fish, and dairy products (-2.3%), which posted their largest decrease since October 2007. The main reason for the lower prices in this commodity group was fresh and frozen pork (-5.8%) and, to a lesser extent, fresh and frozen beef and veal (-2.8%). The price of fresh and frozen beef and veal began a downward trend in September 2015, recording a 17.9% year-over-year decline in August 2016. This decrease coincided with a 25.5% year-over-year drop in the price of cattle and calves in August. Prices for fresh and frozen pork have fallen 0.3% since August 2015; however, they were down 8.6% over the past two months (July and August 2016).
Energy and petroleum products (-1.3%) also exerted downward pressure on the IPPI, as prices for heavy fuel oils (-4.9%), light fuel oils (-1.6%), diesel fuel (-1.6%) and motor gasoline (-0.5%) fell in August. The IPPI excluding energy and petroleum products declined 0.3%.
-
14:37
Canadian gross domestic product grows in July above expectations. USD/CAD 70 pips lower on the initial move
Real gross domestic product grew 0.5% in July, led by higher output in the mining, quarrying, and oil and gas extraction sector. The rise in July followed a 0.6% increase in June, which had essentially offset an equivalent decline in May.
The output of goods-producing industries rose 1.0% in July, with mining, quarrying, and oil and gas extraction contributing the most to the gain. Manufacturing, the agriculture and forestry sector, and utilities also increased, while construction decreased.
The output of service-producing industries advanced 0.3% in July. Most sectors posted increases, led by finance and insurance, transportation and warehousing, and accommodation and food services. The public sector (education, health and public administration combined) was essentially unchanged.
-
14:34
US personal spending flat in August
Personal income increased $39.3 billion (0.2 percent) in August according to estimates released today by the Bureau of Economic Analysis. Disposable personal income (DPI) increased $31.9 billion (0.2 percent) and personal consumption expenditures (PCE) increased $6.2 billion (less than 0.1 percent).
Real DPI increased 0.1 percent in August and Real PCE decreased 0.1 percent. The PCE price index increased 0.1 percent. Excluding food and energy, the PCE price index increased 0.2 percent.
The increase in personal income in August primarily reflected increases in compensation of employees, personal income receipts on assets, and government social benefits to persons.
The decrease in real PCE in August primarily reflected a decrease in spending for durable goods that was partially offset by an increase in spending for services.
Personal outlays increased $6.1 billion in August. Personal saving was $807.6 billion in August and the personal saving rate, personal saving as a percentage of disposable personal income, was 5.7 percent.
-
14:31
U.S.: Personal Income, m/m, August 0.2% (forecast 0.2%)
-
14:30
U.S.: PCE price index ex food, energy, m/m, August 0.2% (forecast 0.2%)
-
14:30
Canada: Industrial Product Price Index, m/m, August -0.5% (forecast 0.1%)
-
14:30
Canada: GDP (m/m) , July 0.5% (forecast 0.3%)
-
14:30
Canada: Industrial Product Price Index, y/y, August -1.3%
-
14:30
U.S.: Personal spending , August 0.0% (forecast 0.1%)
-
14:30
U.S.: PCE price index ex food, energy, Y/Y, August 1.7% (forecast 1.7%)
-
14:23
SNB Declines To Comment On Market Speculation On FX Interventions - Livesquawk
-
13:59
Orders
EUR/USD
Offers : 1.1200 1.1225-30 1.1250 1.1280 1.1300 1.1320 1.1350
Bids : 1.1150-60 1.1125-30 1.1100 1.1080 1.1050 1.1030 1.1000
GBP/USD
Offers : 1.2980 1.3000 1.3025-30 1.3055-60 1.3080-85 1.3100 1.3120 1.3150
Bids : 1.2935 1.2915 1.2900 1.2880 1.2865 1.2850 1.2800 1.2750
EUR/GBP
Offers : 0.8650 0.8665 0.8685 0.8700 0.8720-25 0.8750
Bids : 0.8620 0.8600 0.8585 0.8565 0.8550 0.8520-25 0.8500
EUR/JPY
Offers : 113.20 113.50 113.80 114.00 114.20 114.50
Bids : 112.50 112.25 112.00 111.85 111.50 111.00
USD/JPY
Offers : 101.00 101.20 101.50 101.80 102.00 102.20 102.50
Bids : 100.70 100.50 100.25 100.00-05 99.80 99.50
AUD/USD
Offers : 0.7635 0.7650 0.7665 0.7680 0.7700 0.7720 0.7750
Bids : 0.7585 0.7565 0.7550 0.7530 0.7500 0.7475 0.7450
-
12:39
Major European stock indices traded in the red zone
European stocks sharply lower as concerns about the European banking sector overcomes markets, while investors evaluate reports on inflation and the labor market in the eurozone.
European stock market influneced by the problems of the largest German bank Deutsche Bank after reports that professional market participants are pulling money out of the bank, as it faces a fine from the US Department of Justice.
Shares of Deutsche Bank fell by almost 9%, for the first time dropping below 10 euros, after Bloomberg reported that some hedge funds have decided to abandon the bank's services for the clearing of transactions in derivatives, signaling the concerns regarding the conduct of the creditor's businesses.
Deutsche reiterated that customers in general continue to support the bank.
The focus of investors was data on inflation and unemployment in the euro zone.
Inflation in the euro zone has doubled in September, and core inflation remained stable. Inflation rose to 0.4 percent from 0.2 percent in August. It was the fourth consecutive increase in prices and in line with expectations of economists. Nevertheless, inflation remains below the European Central Bank's target of "below but close to 2 percent" since the beginning of 2013. Core inflation, which excludes energy, food, alcohol and tobacco, remained stable at 0.8 percent in September. Prices of food, alcohol and tobacco prices rose 0.7 percent, while energy prices decreased at a slower pace of 3 percent. At the same time, the prices of non-energy industrial goods and prices of services rose by 0.3 percent and 1.2 percent respectively.
The unemployment rate in the euro area remained at five-year low for the fourth month in a row in August, according to Eurostat preliminary data. The seasonally adjusted unemployment rate was 10.1 percent, the same as in July. Economists had forecast the unemployment rate at 10 percent. The indicator remains at its lowest level since July 2011l. A year ago, the unemployment rate was 10.7 percent. The unemployment rate in the 28 EU countries was also unchanged in August at 8.6 percent, the lowest level since March 2009. A year ago, the figure was 9.3 percent. In August, there were 20.973 million unemployed in the UE28, of whom 16.326 million were in the euro area. The number of unemployed decreased by 40 000 per month in EU28, while this figure rose to 8000 in the euro area. In annual terms, unemployment fell by 1.587 million in the EU28 and 875 000 in the euro area. The lowest unemployment rates were recorded in the Czech Republic and Germany, and the highest unemployment rate is observed in Greece and Spain.
Shares of the French AXA lost 3.1%, while the German Allianz fell 1.6%, as both companies continue talks over a deal with Standard Chartered, which may allow insurance companies to sell their products in the Asian branches of the bank.
Shares of Telefonica fell 4.3% after the company canceled a planned output on a stock exchange of its Telxius units due to weak interest from investors.
Shares of Burberry Group rose 0.2% after RBC analysts raised the target price of the shares.
Osram's shares rose 1.1% after the German newspaper Handelsblatt reported that several Chinese companies are interested in acquiring the manufacturer of lighting fixtures.
At the moment:
FTSE 6849.88 -69.54 -1.00%
DAX 10286.96 -118.58 -1.14%
CAC 4382.75 -61.09 -1.37%
-
11:58
BOJ Gov Kuroda Says Amount of JGB Buying Could Fluctuate
-
11:08
Month end flows expected to influence today’s trading
-
11:02
Euro area annual inflation up to 0.4%
Euro area annual inflation is expected to be 0.4% in September 2016, up from 0.2% in August 2016, according to a flash estimate from Eurostat, the statistical office of the European Union.
Looking at the main components of euro area inflation, services is expected to have the highest annual rate in September (1.2%, compared with 1.1% in August), followed by food, alcohol & tobacco (0.7%, compared with 1.3% in August), non-energy industrial goods (0.3%, stable compared with August) and energy (-3.0%, compared with -5.6% in August).
-
11:01
Eurozone: Harmonized CPI ex EFAT, Y/Y, September 0.8% (forecast 0.9%)
-
11:00
Eurozone: Unemployment Rate , August 10.1% (forecast 10%)
-
11:00
Eurozone: Harmonized CPI, Y/Y, September 0.4% (forecast 0.4%)
-
10:40
UK's Current Account deficit declines helped by a weaker pound
The UK's current account deficit was £28.7 billion in Quarter 2 (April to June) 2016, up from a revised deficit of £27.0 billion in Quarter 1 (January to March) 2016. The deficit in Quarter 2 2016 equated to 5.9% of gross domestic product (GDP) at current market prices, up from 5.7% in Quarter 1 2016.
The widening in the current account deficit was mainly due to a widening in the deficits on trade and secondary income, partially offset by a narrowing in the primary income deficit.
The total trade deficit widened to £12.7 billion in Quarter 2 2016, from £10.0 billion in Quarter 1 2016. This was due to the trade in goods deficit widening by £1.8 billion and a £0.9 billion narrowing in the trade in services surplus.
-
10:37
UK index of services improves
This release shows that services output increased by 0.4% between June 2016 and July 2016. Users should note that ONS always warns against focusing on the month-on-month growth rates.
The Index of Services was estimated to have increased by 2.9% in July 2016 compared with July 2015. All of the 4 main components of the services industries increased in the most recent month compared with the same month a year ago.
The 0.4% growth in services between June 2016 and July 2016 follows growth of 0.3% between May 2016 and June 2016, which is revised up 0.1 percentage points from the previous estimate.
The Index of Services increased by 0.6% in Quarter 2 (Apr to June) 2016 compared with Quarter 1 (Jan to Mar) 2016. This figure has been revised up by 0.1 percentage points from that included in the Gross Domestic Product (GDP) Second Estimate, published on 26 August 2016. This figure is consistent with the Quarterly National Accounts, published on 30 September 2016.
-
10:35
UK Q2 GDP final reading better than expected
UK GDP in volume terms was estimated to have increased by 0.7% in Quarter 2 2016, revised up 0.1 percentage points from the second estimate of GDP published on 26 August 2016. This is the 14th consecutive quarter of positive growth since Quarter 1 (Jan to Mar) 2013.
Revisions to GDP quarterly volume growths are small compared with the previously published estimate - with a 0.1 percentage point upward revision to Quarter 2 2015 and a 0.1 percentage point downward revision to Quarter 3 (July to Sept) 2015 and no revisions to Quarter 1 2015, Quarter 4 (Oct to Dec) 2015 and Quarter 1 2016.
Between 2014 and 2015, GDP in volume terms increased by 2.2%, unrevised from the previous estimate. Between Quarter 2 2015 and Quarter 2 2016, GDP in volume terms increased by 2.1%, revised down 0.1 percentage points from the previously published estimate.
GDP per head in volume terms was estimated to have increased by 0.5% between Quarter 1 2016 and Quarter 2 2016. Between 2014 and 2015, GDP per head increased by 1.4%.
GDP in current prices increased by 1.5% between Quarter 1 2016 and Quarter 2 2016, revised down 0.1 percentage points from the previously published estimate.
-
10:30
United Kingdom: GDP, q/q, Quarter II 0.7% (forecast 0.6%)
-
10:30
United Kingdom: GDP, y/y, Quarter II 2.1% (forecast 2.2%)
-
10:30
United Kingdom: Current account, bln , Quarter II -28.7 (forecast -30.5)
-
10:16
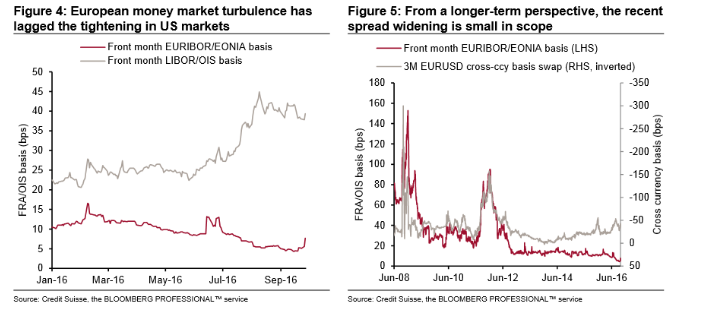
3 Reasons Why This European Banking Crisis Won't Hurt The Euro - Credit Suisse
"The G10 market has pirouetted away from its extreme JPY focus last week to consider the potential FX impact of European banking frailties. With a notable German lender under the microscope due to concerns about capital adequacy in light of potential fines and related problems, European equities and credit have come under a degree of pressure. This has spilled over to some extent to the FX market via a widening of the EUR basis towards the widest levels this year, though still far from the lofty levels seen in genuine crises such as 2008 or 2012
Historically, banking crises and widening basis would have quickly led to a weaker EUR and much higher realised and implied volatility. But so far, the latest stresses have had almost no discernable impact on these vol metrics despite starting points that were already very low.
We see three key reasons for this mild response as follows:
1. ECB liquidity and systemic stability: unlike 2012, many more ECB mechanisms with a range of acronyms are in play to support the wider system and provide easy access to liquidity. These range from OMT to TLTRO to QE among others, but also factors such as negative rates and excess deposits from other sources help too. This can be seen in Figure 4 and Figure 5. European money markets are not showing material signs of idiosyncratic stress. Dec IMM Euribor minus Eonia spreads have moved a touch higher but are easily lagging the move that money market reforms in the US prompted earlier in similar US LIBOR minus OIS spreads. And from a longer-term perspective, the spread widening in both Euribor minus OIS and the EUR basis is trivial. Also, the USD funding requirement of European banks is much lower than before 2012 due to lower operational requirements for USD-funded balance sheets
2. German policy: markets suspect the German government would not allow a major lender to fail, even if significant losses are imposed on shareholders and some creditors. This limits the capacity to generate systemic risk.
3. EUR is now a funding currency: unlike the period up to 2012, the euro area now systematically runs a large current account surplus, which both adds to excess liquidity and means that euro area investors provide rather than need capital flow funding on a net basis. This limits exposure to risk-off situations - indeed those that could trigger repatriation flows could even be helpful.
In this context, we take a relatively benign view of these events and maintain our EURUSD 1.15 three month target".
Copyright © 2016 Credit Suisse, eFXnews™
-
10:13
Italian unemployment rate at 11.4% in August
In August 2016, 22,768 million people were employed, +0.1% compared with July. Unemployed were 2,932 million, -0.1% over the previous month.
Employment rate was 57.3%, unemployment rate was 11.4% and inactivity rate was 35.2%, all unchanged over the previous month. Youth unemployment rate (aged 15-24) was 38.8%, -0.4 percentage points over July and youth unemployment ratio in the same age group was 10.2%, -0.1 percentage points in a month.
-
10:02
Option expiries for today's 10:00 ET NY cut
EUR/USD: 1.1100 (800m) 1.1165-70 (844m) 1.1190 (589m) 1.1250 (278m) 1.1350 (346m)
USD/JPY: 100.00 (USD 786m) 102.00 (600m)
GBP/USD: 1.3100 (641m)
AUD/USD: 0.7650 (AUD 342m)
USD/CAD: 1.2990 (USD 380m) 1.3075 (260m) 1.3125 (206m) 1.3144-50 (USD 509m)
-
09:04
Slight recovery for Swiss KOF Economic Barometer
The KOF Economic Barometer, with a current reading of 101.3, increased 1.6 points in September 2016 (from revised 99.7 in August). Therefore, the Economic Barometer recovered from its fall below the 100 points level that was witnessed last month and climbs just above its long-term average. The outlook for the Swiss economy remains stable, consistent with its long-term average growth pace.
-
09:01
Switzerland: KOF Leading Indicator, September 101.3 (forecast 100.8)
-
08:38
Japanese industrial production improves in August
Industrial production in Japan advanced 1.56 percent on month in August, the Ministry of Economy, Trade and Industry said on Friday.
That beat forecasts for an increase of 0.5 percent following the 0.4 percent decline in July.
On a yearly basis, output jumped 4.6 percent - also topping forecasts for a gain of 3.4 percent after sliding 4.2 percent in the previous month.
Output is projected to gain 2.2 percent in September and 1.2 percent in October.
-
08:36
USD To Fall Another 3-4% From Current Levels - Morgan Stanley
"Flatter curve, weaker USD. We project the USD to fall another 3-4% from current levels, with the US economy slowing into Q4 working as the catalyst. The rates market is pricing around a 50% probability of the Fed hiking by year end, but with growth expected to dip in Q4, headwinds for the Fed to act are likely to become stronger. We believe weaker US data should not only reprice US front end rates but also flatten the US curve further from here, taking the USD lower.
Liquidity hunting yield. Liquidity conditions remain ample, with Japan's latest flow of funds report suggesting its corporate sector cash position increasing to USD2.2trn. Hence, demand for safe assets remains ample, pushing valuation for these assets to high if not extreme levels. Exhibit 1 shows that DM yields have fallen in recent weeks, increasing the amount of negative-yielding bonds to around USD11trn. Investors seem to have little choice other than piling into yield-enhancing strategies, suggesting accepting high risks relative to returns. However, it is not only the hunt for yield that is putting the USD under selling pressure. Rising USD funding costs coming on the back of rising US LIBOR rates have reduced international demand for USD-denominated debt. Despite foreign accounts slowing their purchases of US bonds, US bond yields have come down, which for us provides additional evidence that the US economy is slowing down.
The message of falling DM yields. When bond yields are falling at the same time as foreign purchases ease, it suggests that the internal supply-demand balance for US capital market is shifting toward the demand side. This in turn suggests that the slowing US economy is creating additional net savings, causing its capital costs to fall. The remaining yield is no longer high enough to attract the same amount of FX unhedged inflows. Instead, these funds go elsewhere looking for higher yield, but this yield comes at a higher risk too.
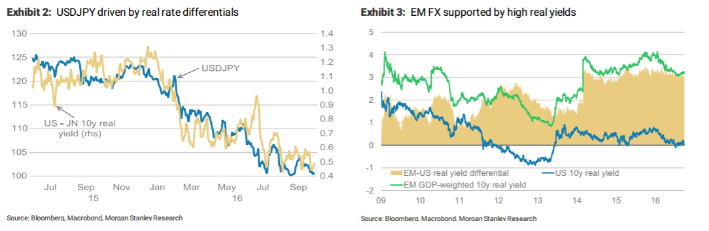
USD: Two pressures. So far, we have argued from a real rate and yield differential point of view. Exhibit 2 reminds us how real yield differentials have driven USDJPY lower, which is typical for currencies experiencing near zero nominal yields and inflation projections falling faster. Exhibit 3 illustrates the US - EM real yield differential working in favour of the higher-yielding EM currencies. It seems that the current low-yielding environment promotes two types of currency appreciation. First, where nominal yields have limited room to fall further, declining inflation expectations drive real yields higher, pushing related currency higher. Second, high-yielding currencies appreciate with low volatility, allowing investors to increasing exposure without violating VAR rules. The USD stands in between these two currency blocks acting as a funding tool".
Copyright © 2016 Morgan Stanley, eFXnews
-
08:35
Options levels on friday, September 30, 2016:
EUR/USD
Resistance levels (open interest**, contracts)
$1.1328 (3038)
$1.1300 (1920)
$1.1269 (1072)
Price at time of writing this review: $1.1223
Support levels (open interest**, contracts):
$1.1171 (3743)
$1.1133 (4566)
$1.1089 (5549)
Comments:
- Overall open interest on the CALL options with the expiration date October, 7 is 38064 contracts, with the maximum number of contracts with strike price $1,1500 (5769);
- Overall open interest on the PUT options with the expiration date October, 7 is 39134 contracts, with the maximum number of contracts with strike price $1,1100 (5549);
- The ratio of PUT/CALL was 1.03 versus 1.02 from the previous trading day according to data from September, 29
GBP/USD
Resistance levels (open interest**, contracts)
$1.3201 (1443)
$1.3103 (1346)
$1.3007 (735)
Price at time of writing this review: $1.2968
Support levels (open interest**, contracts):
$1.2896 (1322)
$1.2798 (1742)
$1.2699 (1424)
Comments:
- Overall open interest on the CALL options with the expiration date October, 7 is 27614 contracts, with the maximum number of contracts with strike price $1,3500 (3374);
- Overall open interest on the PUT options with the expiration date October, 7 is 23085 contracts, with the maximum number of contracts with strike price $1,3000 (3485);
- The ratio of PUT/CALL was 0.84 versus 0.83 from the previous trading day according to data from September, 29
* - The Chicago Mercantile Exchange bulletin (CME) is used for the calculation.
** - Open interest takes into account the total number of option contracts that are open at the moment.
-
08:33
Yellen: Have to Carefully Consider Benefits, Costs of Stock Purchases
-
08:32
Fed's Kashkari Sees No Urgency to Raise Rates With Inflation Low
-
08:31
Moody's Sees Argentina's Debt Rising
Argentina's debt-to-GDP ratio will hit 49% this year and rise to 53% in 2017 thanks to high deficits and the effect of last December's currency devaluation, Moody's says. "The Macri administration has implemented credit positive policy changes, and aims to lower inflation and free the exchange rate," Moody's says. "Still, risks remain high and this is reflected in the country's 'high' susceptibility to event risk. A full return to a more sustainable economic position will likely take years."
-
08:29
The index of business activity in the manufacturing sector of China in line with expectations
China's manufacturing PMI published by Caixin / Markit Economics, amounted to 50.1 points, which coincided with the forecast of economists, but was higher than the previous value of 50.0. Values above 50 indicates growth, while falling below this level indicates contraction. As China's economy is one of the largest in the world, this indicator can have a strong impact on the Forex market.
From Caixin / Markit Economics report:
-
Domestic and export orders show only a slight improvement
-
The growth in September was the most insignificant in the last three months
-
New orders also continued to show moderate growth, after nine months of contraction
-
About 8% of the companies surveyed reported a decrease in the number of staff, resulting in lower costs.
-
-
08:25
Japanese core inflation down more than forecast...BoJ measures efficient?
According to rttnews, overall consumer prices in Japan were down 0.5 percent on year in August, the Ministry of Internal Affairs and Communications said on Friday.
That matched expectations following the 0.4 percent decline in July.
Core CPI, which excludes food prices, also was down 0.5 percent - in line with expectations and unchanged from the previous month.
Overall inflation in the Tokyo region, considered a leading indicator for the nationwide trend, was down 0.5 percent on year in September - matching expectations and unchanged from the previous month.
Core CPI was also down 0.5 percent versus forecasts for -0.4 percent, which would have been unchanged.
-
08:21
UK house prices stable in September as both demand and supply soften
-
House prices increased by 0.3% in September
-
Annual house price growth slowed to 5.3%, from 5.6% in August
Commenting on the figures, Robert Gardner, Nationwide's Chief Economist, said: "The pace of annual house price growth slowed to 5.3% in September, from 5.6% in August, though it remained within the narrow range of 3% to 6% that has prevailed since early 2015.
"The relative stability in the rate of house price growth suggests that the softening in housing demand evident in recent months has been broadly matched on the supply side of the market. Survey data indicates that, while new buyer enquiries have remained fairly subdued, the number of homes on the market has remained close to all-time lows, in part due to low rates of construction activity (discussed in more detail opposite).
"Regional price trends were also little changed. Regions in the south east of England continued to record the strongest gains even though price growth slowed noticeably in the Outer Metropolitan region (from 12.4% in Q2 to 9.6% in Q3) and in London (from 9.9% in Q2 to 7.1% in Q3). "House price growth remained subdued in Scotland (+2%) and Northern Ireland (+2.4%) and small price declines were recorded in Wales (-0.5%) and the North of England (-0.2%), all relative to Q3 last year (see page 3 for more commentary on regional house price trends)
-
-
08:19
German retail sales increased in real terms 3.7% y/y
According to provisional results of the Federal Statistical Office (Destatis), retail turnover in August 2016 in Germany increased in real terms 3.7% and in nominal terms 3.9% compared with the corresponding month of the previous year. The number of days open for sale was 27 in August 2016 and 26 in August 2015.
Compared with the previous year, turnover in retail trade was in the first eight months 2016 in real terms 2.2% and in nominal terms 2.3% larger than in in the corresponding period of the previous year.
When adjusted for calendar and seasonal variations (Census-X-12-ARIMA), the August turnover was both in real terms and in nominal terms 0.4% smaller than that in July 2016.
-
08:01
United Kingdom: Nationwide house price index, y/y, September 5.3% (forecast 5.3%)
-
08:01
United Kingdom: Nationwide house price index , September 0.3% (forecast 0.3%)
-
08:00
Germany: Retail sales, real adjusted , August -0.4% (forecast -0.3%)
-
08:00
Germany: Retail sales, real unadjusted, y/y, August 3.7% (forecast 1.3%)
-
07:16
Japan: Construction Orders, y/y, August 13.8%
-
07:02
Japan: Housing Starts, y/y, August 2.5% (forecast 7.1%)
-
03:48
China: Markit/Caixin Manufacturing PMI, September 50.1
-
03:31
Australia: Private Sector Credit, m/m, August 0.4% (forecast 0.5%)
-
03:31
Australia: Private Sector Credit, y/y, August 5.8%
-
03:16
Australia: HIA New Home Sales, m/m, August 6.1%
-
02:00
New Zealand: ANZ Business Confidence, September 27.9 (forecast 25)
-
01:50
Japan: Industrial Production (MoM) , August 1.5% (forecast 0.5%)
-
01:31
Japan: Unemployment Rate, August 3.1% (forecast 3%)
-
01:31
Japan: Tokyo CPI ex Fresh Food, y/y, September -0.5% (forecast -0.4%)
-
01:31
Japan: Tokyo Consumer Price Index, y/y, September -0.5%
-
01:30
Japan: National Consumer Price Index, y/y, August -0.5% (forecast -0.5%)
-
01:30
Japan: National CPI Ex-Fresh Food, y/y, August -0.5% (forecast -0.4%)
-
01:30
Japan: Household spending Y/Y, August -4.6% (forecast -2.5%)
-
01:04
United Kingdom: Gfk Consumer Confidence, September -1 (forecast -5)
-
00:28
Currencies. Daily history for Sep 29’2016:
(pare/closed(GMT +3)/change, %)
EUR/USD $1,1218 +0,03%
GBP/USD $1,2965 -0,40%
USD/CHF Chf0,9659 -0,54%
USD/JPY Y101,09 +0,37%
EUR/JPY Y113,40 +0,39%
GBP/JPY Y131,07 -0,02%
AUD/USD $0,7631 -0,71%
NZD/USD $0,7253 -0,25%
USD/CAD C$1,3148 +0,44%
-
00:01
Schedule for today,Friday, Sep 30’2016
00:00 Japan BOJ Governor Haruhiko Kuroda Speaks
00:00 New Zealand ANZ Business Confidence September 15.5 25
01:00 Australia HIA New Home Sales, m/m August -9.7%
01:30 Australia Private Sector Credit, m/m August 0.4% 0.5%
01:30 Australia Private Sector Credit, y/y August 6%
01:45 China Markit/Caixin Manufacturing PMI September 50.0
05:00 Japan Construction Orders, y/y August -10.9%
05:00 Japan Housing Starts, y/y August 8.9% 7.1%
06:00 United Kingdom Nationwide house price index, y/y September 5.6% 5.3%
06:00 United Kingdom Nationwide house price index September 0.6% 0.3%
06:00 Germany Retail sales, real adjusted August 1.7% -0.3%
06:00 Germany Retail sales, real unadjusted, y/y August -1.5% 1.3%
07:00 Switzerland KOF Leading Indicator September 99.8 100.8
08:30 United Kingdom Current account, bln Quarter II -32.6 -30.5
08:30 United Kingdom GDP, q/q (Finally) Quarter II 0.4% 0.6%
08:30 United Kingdom GDP, y/y (Finally) Quarter II 2% 2.2%
09:00 Eurozone Unemployment Rate August 10.1% 10%
09:00 Eurozone Harmonized CPI, Y/Y (Preliminary) September 0.2% 0.4%
09:00 Eurozone Harmonized CPI ex EFAT, Y/Y (Preliminary) September 0.8% 0.9%
12:30 Canada Industrial Product Price Index, m/m August 0.2% 0.1%
12:30 Canada Industrial Product Price Index, y/y August -1.3%
12:30 Canada GDP (m/m) July 0.6% 0.3%
12:30 U.S. Personal Income, m/m August 0.4% 0.2%
12:30 U.S. Personal spending August 0.3% 0.1%
12:30 U.S. PCE price index ex food, energy, m/m August 0.1% 0.2%
12:30 U.S. PCE price index ex food, energy, Y/Y August 1.6% 1.7%
13:45 U.S. Chicago Purchasing Managers' Index September 51.5 52
14:00 U.S. Reuters/Michigan Consumer Sentiment Index (Finally) September 89.8 90
-