Noticias del mercado
-
23:58
Schedule for today, Thursday, May 5’2016:
(time / country / index / period / previous value / forecast)
00:00 Japan Bank holiday
01:00 Australia HIA New Home Sales, m/m March -5.3%
01:30 Australia Trade Balance March -3.41 -2.9
01:30 Australia Retail Sales, M/M March 0.0% 0.3%
01:45 China Markit/Caixin Services PMI April 52.2 52.6
06:00 France Bank holiday
06:00 Germany Bank Holiday
06:00 Switzerland Bank holiday
07:00 United Kingdom Halifax house price index 3m Y/Y April 10.1% 9.6%
07:00 United Kingdom Halifax house price index April 2.6% 0.1%
08:00 Eurozone ECB Economic Bulletin
08:30 United Kingdom Purchasing Manager Index Services April 53.7 53.5
12:30 Canada Building Permits (MoM) March 15.5% -5%
12:30 U.S. Continuing Jobless Claims April 2130 2133
12:30 U.S. Initial Jobless Claims April 257 260
15:50 U.S. FOMC Member James Bullard Speaks
23:30 Australia AiG Performance of Construction Index April 45.2
-
21:00
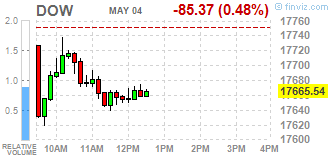
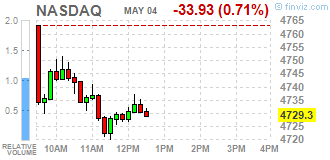
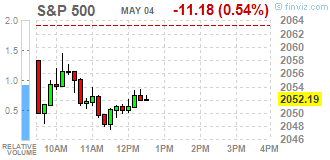
Dow -0.61% 17,643.25 -107.66 Nasdaq -0.82% 4,724.25 -38.97 S&P -0.65% 2,049.94 -13.43
-
20:20
American focus: the US dollar strengthened significantly against the Canadian dollar
The US dollar traded mixed against the euro as a whole has remained in a narrow range. Currency Fluctuations were associated with mixed US data. Initially, the pressure on the dollar has had a report on the labor market from ADP, which has lowered the likelihood that the Fed will be able to raise twice this year. As it became known, in April, the number of employees increased by 156 thousand. People in comparison with the revised figure for March at the level of 194 thousand. (Originally reported 200 thousand.). Analysts had expected the number of people employed will increase by 196 thousand. In sectoral terms of number of employees among the goods-producing companies decreased by 11 thousand., While among those who provide services, rose to 166 thousand.
Positive impact on the US currency had statistics on business activity. Final data presented Markit Economics, showed: the seasonally adjusted index of business activity in the US service sector grew in April to 52.8 points compared to 51.3 points in March. Analysts had expected the index to reach 52.1 points. The last reading was the highest since January and above the average for the 1st quarter (51.4). Also add that the index remains in expansion territory for the second month in a row. The final composite index of the PMI, which covers the production sector and the service sector, rose to 52.4 from 51.3, also reaching the highest level since January 2016.
Another report showed that the index of business activity in the US service sector, calculated by the ISM, rose in April, reaching 55.7 compared to 54.5 in March. According to the forecast, the index value would grow to 54.7. The ISM said that the expansion of activity in the service sector has recorded the 75th consecutive month.
The British pound lost ground against the previously-earned dollar, and returned to the minimum session, which was caused by the publication of strong business activity in the US data. Pressure on the pound also continued to present a report on activity in the construction sector. It became known that the index of business activity in the UK construction sector fell to 52.0 in April from 54.2 in March .. Analysts had expected a decline to 54.0. Despite the fact that the general business activity index remains above the contraction of the construction sector activity index reached almost three-year low. According to Markit economist Tim Moore, "the weakening of the growth outlook for the UK economy, along with the uncertainty in the run-up to the referendum on the exit from the EU, give rise to major customers to defer a decision on costs." He also added that the construction companies prefer to wait and see what happens, before taking any decision.
The Canadian dollar fell by almost 200 points against the US dollar, approaching the minimum of 18 April. Currency Decrease was due to the negative dynamics of the oil market, as well as the publication of disappointing data on Canada. The fall in oil prices accelerated after the US Department of Energy reported a significant increase in oil reserves than expected. As it became known, in the week crude oil inventories 23-29 April rose by 2.8 million barrels to 543.4 million barrels, a record high for this time of year. Analysts had expected an increase of 1.444 million. Barrels. Meanwhile, oil inventories in Cushing terminal rose 243,000 barrels to 66.3 million barrels. Gasoline stocks rose by 536,000 barrels to 241.8 million barrels. Analysts had expected stocks to fall 200,000 barrels. Recall yesterday's report, submitted to the American Petroleum Institute showed that US crude stocks rose 1.3 million barrels. Distillate stocks fell by 2.6 million barrels, while gasoline inventories fell by 1.2 mln. Barrels.
With regard to statistics on Canada's trade deficit unexpectedly rose in March, reaching a record 3.41 billion. Canadian dollars. Last change reflects prolonged problems faced by the economy due to low oil prices. Analysts had expected the deficit to drop to 1.4 billion. Canadian dollars. It is worth emphasizing the figure for February was revised to -2.47 billion. Canadian dollars to -1.91 billion. Canadian dollars. In addition, data showed that in March, the volume of exports fell by 4.8 percent to 40.99 billion. Canadian dollars (the lowest rate in more than two years). Meanwhile, the volume of imports decreased by 2.4 percent to 44.40 billion. Canadian dollars.
-
18:40
Wall Street. Major U.S. stock-indexes fell
Major U.S. stock-indexes fell as ADP private jobs data misses expectations badly. The ADP National Employment Report showed U.S. companies hired just 156,000 people last month, the smallest gain since April 2013. Economists surveyed by Reuters had forecast a gain of 196,000 jobs, with estimates ranging from 116,000 to 225,000.
Most of Dow stocks in negative area (20 of 30) The Goldman Sachs Group, Inc. (GS, -2,27%). Top gainer - McDonald's Corp. (MCD, +1,24%).
Most of S&P sectors in negative area. Top looser - Basic Materials (-1,3%). Top gainer - Conglomerates (+1,7%).
At the moment:
Dow 17589.00 -84.00 -0.48%
S&P 500 2047.00 -10.00 -0.49%
Nasdaq 100 4311.75 -22.75 -0.52%
Oil 43.91 +0.26 +0.60%
Gold 1280.80 -11.00 -0.85%
U.S. 10yr 1.80 -0.01
-
18:00
European stocks closed: FTSE 100 6,112.02 -73.57 -1.19% CAC 40 4,324.23 -47.75 -1.09% DAX 9,828.25 -98.52 -0.99%
-
18:00
European stocks close: stocks traded lower as market participants eyed the economic data from the Eurozone
Stock indices traded lower on the economic data from the Eurozone. Markit Economics released final services purchasing managers' index (PMI) for the Eurozone on Wednesday. Eurozone's final services PMI remained unchanged at 53.1 in April, down from the preliminary reading of 53.2.
Eurozone's final composite output index fell to 53.0 in April from 53.1 in March, in line with the preliminary reading.
The decline was mainly driven by a fall in output prices.
"The final PMI data confirm the earlier flash estimate that the Eurozone economy grew at a steady but unspectacular annual rate of 1.5% at the start of the second quarter," Chief Economist at Markit Chris Williamson said.
"However, while still tepid, the sustained Eurozone growth contrasts with slowdowns in the US and UK, suggesting the ECB's more aggressive stimulus is helping to drive a steady recover," he added.
Germany's final services PMI fell to 54.5 in April from 55.1 in March, down from the preliminary reading of 54.6. The index was mainly driven by a slower growth in employment, while backlogs of work declined.
France's final services PMI increased to 50.6 in April from 49.9 in March, down from the preliminary reading of 50.8. The index was mainly driven by rises in new business, backlogs of work and input prices.
Eurostat released its retail sales data for the Eurozone on Wednesday. Retail sales in the Eurozone decreased 0.5% in March, missing expectations for a 0.1% fall, after a 0.3% gain in February. February's figure was revised up from a 0.2% increase.
Non-food sales decreased 0.5% in March, food, drinks and tobacco sales slid 1.3%, while automotive fuel sales were down 0.4%.
On a yearly basis, retail sales in the Eurozone climbed 2.1% in March, missing forecasts of a 2.5% gain, after a 2.7% increase in February. February's figure was revised up from a 2.4% rise.
Non-food sales gained 2.1% year-on-year in March, gasoline sales jumped 2.5%, while food, drinks and tobacco sales rose 1.5%.
Markit's and the Chartered Institute of Purchasing & Supply's construction PMI for the U.K. dropped to 52.0 in April from 54.2 in March, missing expectations for a decrease to 54.0. It was the lowest level since June 2013. The decline was mainly driven by a drop in new work.
"UK construction firms reported their worst month for almost three years in April, meaning that the first quarter slowdown is unlikely to prove temporary," Senior Economist at Markit, Tim Moore, said.
"Softer growth forecasts for the UK economy alongside uncertainty ahead of the EU referendum appear to have provided reasons for clients to delay major spending decisions until the fog has lifted," he added.
According to the British Retail Consortium (BRC), the U.K. shop prices declined by 1.7% year-on-year in April, after a 1.7% decline in March.
The decline was mainly driven by a drop in non-food prices, which plunged 2.9% year-on-year in April. Food prices rose at an annual rate of 0.1% in April.
Indexes on the close:
Name Price Change Change %
FTSE 100 6,112.02 -73.57 -1.19 %
DAX 9,828.25 -98.52 -0.99 %
CAC 40 4,324.23 -47.75 -1.09 %
-
17:44
Oil quotes are back in the red zone
Oil futures become cheaper again after a moderate increase earlier today. Negative influence report on US petroleum inventories
US Department of Energy reported that crude oil inventories rose in the week 23-29 April by 2.8 million barrels to 543.4 million barrels, a record high for this time of year. Analysts had expected an increase of 1.444 million. Barrels. Meanwhile, oil inventories in Cushing terminal rose 243,000 barrels to 66.3 million barrels. Gasoline stocks rose by 536,000 barrels to 241.8 million barrels. Analysts had expected stocks to fall 200,000 barrels. Distillate stocks fell by 1.3 million barrels to 157 million barrels. Analysts expected distillate stocks remain unchanged. The utilization of refining capacity increased by 1.6% to 89.7%. Analysts suggested that the figure will rise to 0.4%. Oil in the US during the week April 23-29, dropped to 8.825 million barrels per day versus 8.938 million barrels per day in the previous week.
Recall, the report presented yesterday by the American Petroleum Institute showed that crude oil inventories in the US for the week rose by 1.3 million barrels. Distillate stocks fell by 2.6 million barrels, while gasoline inventories fell by 1.2 mln. Barrels.
Little support for oil have reported that the company Suncor Energy cuts production due to forest fires in Alberta, Canada. "Fires in Canada have helped to reduce the decline in quotations before leaving the Ministry of Energy report," - said an analyst at Saxo Bank Ole Hansen.
Oil prices rose far more than 60% after reaching lows earlier this year as traders suggest slower growth of production and the beginning of the restoration of the balance in the oil market. "If demand continues to grow, it can be a support factor for oil prices," - said the expert Tyche Capital Advisors Tariq Zahir.
WTI for delivery in June fell to $43.80 a barrel. Brent for June fell to $44.87 a barrel.
-
17:42
WSE: Session Results
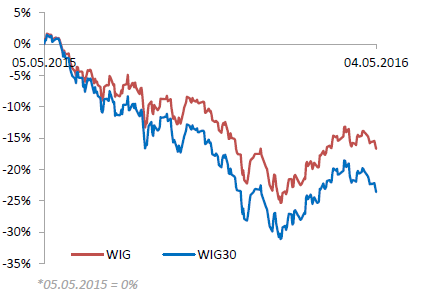
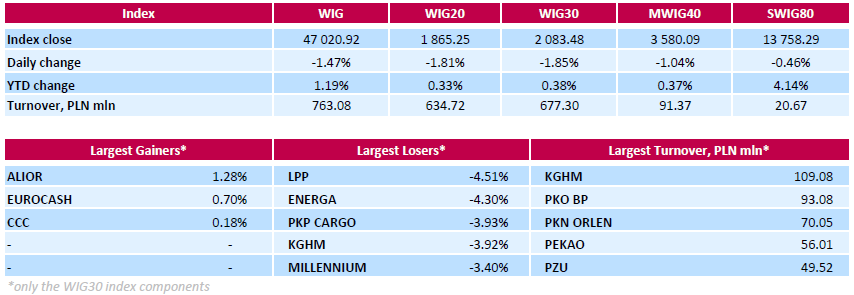
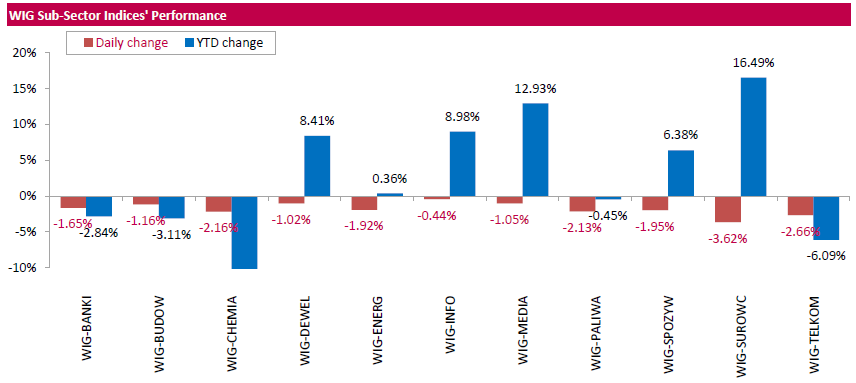
Polish equity market plunged on Wednesday. The broad market measure, the WIG Index, declined by 1.47%. All sectors in the WIG retreated, with materials (-3.62%) lagging behind.
The large-cap stocks' measure, the WIG30 Index, fell by 1.85%. A majority of the index components recorded losses. Clothing retailer LPP (WSE: LPP) and genco ENERGA (WSE: ENG) topped the decliners' list, dropping by 4.51% and 4.3% respectively. They were followed by railway freight transport operator PKP CARGO (WSE: PKP), copper producer KGHM (WSE: KGH), bank MILLENNIUM (WSE: MIL) and telecommunication services provider ORANGE POLSKA (WSE: OPL), slumping between 3.38% and 3.93%. At the same time, the handful advancers included bank ALIOR (WSE: ALR), FMCG-wholesaler EUROCASH (WSE: EUR) and footwear retailer CCC (WSE: CCC), gaining 1.28%, 0.7% and 0.18% respectively.
-
17:23
The price of gold fell slightly
Gold retreated from the session low, but still continues to trade in the red zone. Support for precious metals have data on the US labor market, which reduced the likelihood that the Fed will be able to raise twice this year, as planned.
Recall, higher interest rates have a downward pressure on the price of gold, which brings its holders to interest income and that is difficult to compete with the assets, bringing that income against the background of increasing interest rates.
The report submitted by the Automatic Data Processing (ADP), showed that employment growth in the US private sector slowed sharply in April, confounding expectations of experts. According to the report, in April, the number of employees increased by 156 thousand. People in comparison to the revised downward the March index at the level of 194 thousand. (Originally reported 200 thousand.). Analysts had expected the number of people employed will increase by 196 thousand. In addition, data showed that in the sectoral section of the number of employees among the goods-producing companies decreased by 11 thousand., While among those who provide services, rose to 166 thousand.
Gradually, investors' attention switched to the Friday employment report non-farm payrolls, a key barometer of the health of the US economy. "A weaker employment report could push gold prices above $ 1,300," - said an analyst at ABN Amro Georgette Boele. It is expected that the number of employees increased by 200 thousand. After increasing by 215 thousand. In April. The unemployment rate is likely to remain at around 5.1%.
In the course of trading is also affected by yesterday's statements by Fed officials. Recall, the Federal Reserve Bank of Atlanta President Lockhart said that an increase in US interest rates is possible in June. Lockhart said that the country's macroeconomic fundamentals look strong, but the data is received before the June meeting of the paint too rosy a picture. According to him, in April, Fed officials did not change rates, but then they did not have data on GDP for the 1st quarter. Meanwhile, the president of the Federal Reserve Bank of San Francisco John Williams said that he considered it possible to increase the Fed's interest rate in the current year, despite the weak data on economic growth in the 1st quarter. According to Williams, the slowdown in GDP growth in the 1st quarter was likely due to seasonal factors, and he would have expressed support for a rate hike this year, when will accelerate in the coming quarters economic growth.
The cost of the June gold futures on the COMEX fell to $ 1283.8 per ounce.
-
17:20
Australian Industry Group’s services purchasing managers’ index for Australia rises to 49.7 in April
The Australian Industry Group (AiG) released its services purchasing managers' index (PMI) for Australia on the late Tuesday evening. The index rose to 49.7 in April from 49.5 in March.
A reading above 50 indicates expansion in the sector, while a reading below 50 indicates contraction in the sector.
Four of the five activity sub-indexes were below 50 points in March.
Main contributor to the rise were finance & insurance and health & community services.
-
16:49
U.S. crude inventories rise by 2.8 million barrels to 543.4 million in the week to April 29
The U.S. Energy Information Administration (EIA) released its crude oil inventories data on Wednesday. U.S. crude inventories rose by 2.8 million barrels to 543.4 million in the week to April 29.
Analysts had expected U.S. crude oil inventories to rise by 1.4 million barrels.
Gasoline inventories increased by 536,000 barrels, according to the EIA.
Crude stocks at the Cushing, Oklahoma, climbed by 243,000 barrels.
U.S. crude oil imports rose by 110,000 barrels per day.
Refineries in the U.S. were running at 89.7% of capacity, up from 88.1% the previous week.
Oil production fell by 0.2% last week to 8.825 million barrels a day from 8.938 million barrels a day in the previous week.
-
16:30
U.S.: Crude Oil Inventories, April 2.784 (forecast 1.444)
-
16:21
U.S. factory orders climb 1.1% in March
The U.S. Commerce Department released factory orders data on Wednesday. Factory orders in the U.S. climbed 1.1% in March, exceeding expectations for a 0.6% gain, after a 1.9% decline in February. February's figure was revised down from a 1.7% decrease.
Durable goods orders were up 0.8% in March, while non-durable goods orders rose 1.5%.
Orders for transportation equipment jumped 2.8% in March, while orders for automobiles and parts declined 0.9%.
Factory orders excluding transportation increased 0.8% in March, after a 0.9% drop in February. February's figure was revised down from a 0.8% fall.
-
16:12
ISM non-manufacturing purchasing managers’ index rises to 55.7 in April
The Institute for Supply Management released its non-manufacturing purchasing managers' index for the U.S. on Wednesday. The index rose to 55.7 in April from 54.5 in March, beating expectations for an increase to 54.7.
A reading above 50 indicates a growth in the service sector.
The ISM's new orders index increased to 59.9 in April from 56.7 in March.
The business activity/production index decreased to 58.8 in April from 59.8 in March.
The ISM's employment index was up to 53.0 in April from 50.3 in March.
The prices index jumped to 53.4 in April from 49.1 in March.
-
16:00
U.S.: ISM Non-Manufacturing, April 55.7 (forecast 54.7)
-
16:00
U.S.: Factory Orders , March 1.1% (forecast 0.6%)
-
15:54
Final U.S. services PMI rises to 52.8 in April
Markit Economics released final services purchasing managers' index (PMI) for the U.S. on Wednesday. Final U.S. services purchasing managers' index (PMI) rose to 52.8 in April from 51.3 in March, up from the preliminary reading of 52.1.
A reading above 50 indicates expansion in the sector, a reading below 50 indicates contraction of activity.
The index was driven by a rise in new work and input prices, while job creation declined.
"The PMI surveys show the economy continuing to pick itself up after the stagnation seen in February, with growth accelerating for a second successive month in April," Chief Economist at Markit Chris Williamson said.
"However, the rate of expansion remains tepid, reliant on sluggish growth in services as manufacturers report a stalling of production," he added.
-
15:49
WSE: After start on Wall Street
U.S. Stocks open: Dow -0.38%, Nasdaq -0.55%, S&P -0.46%
Wall Street after considerable negative deviation of future contracts began in red. Declines, however, are so far less than those presented by futures market. Smaller than expected is also a decline in the DJIA index.
Before the market still reading ISM index for the US services sector and data on fuel inventories in the United States, but short-term sentiment remains corrective, so the data should not determine the balance of power on Wall Street. It is worth to noting that the sharp drop in the first half of the session on the WIG20 index caught a short breath and turned to consolidation in the area of 1865 points.
-
15:45
U.S.: Services PMI, April 52.8 (forecast 52.1)
-
15:41
Option expiries for today's 10:00 ET NY cut
EURUSD: 1.1315-20 (EUR 389m) 1.1400-05 (371m) 1.1455 (250m) 1.1530 (544m) 1.1540(674m) 1.1600 (362m)
EURGBP 0.7850 (EUR 245m)
AUDUSD 0.7350 (AUD 411m) 0.7800 (892m)
USDCAD 1.2640 (USD 220m) 1.3030 (266m) 1.3150 (254m)
NZDUSD 0.6950 (NZD 201m)
AUDNZD 1.0850 (AUD 200m)
-
15:32
U.S. Stocks open: Dow -0.38%, Nasdaq -0.55%, S&P -0.46%
-
15:18
Before the bell: S&P futures -0.64%, NASDAQ futures -0.73%
U.S. stock-index futures declined.
Global Stocks:
Nikkei Closed
Hang Seng 20,525.83 -151.11 -0.73%
Shanghai Composite 2,991.1 -1.54 -0.05%
FTSE 6,113.16 -72.43 -1.17%
CAC 4,339.91 -32.07 -0.73%
DAX 9,862.11 -64.66 -0.65%
Crude $44.00 (+0.80%)
Gold $1288.00 (-0.22%)
-
15:15
Productivity in the U.S. non-farm businesses slides at a 1.0% annual rate in the first quarter
The U.S. Labor Department released non-farm productivity figures on Wednesday. Preliminary productivity in the U.S. non-farm businesses slid at a 1.0% annual rate in the first quarter, beating expectations for a 1.4% decrease, after a 1.7% drop in the fourth quarter. The fourth quarter's figure was revised up from a 2.2% fall.
The drop was driven by a rise in labour-related production costs.
Hours worked jumped by 1.5% in the first quarter, while output rose by 0.4%.
Preliminary unit labour costs increased 4.1% in the first quarter, exceeding expectations for a 3.3% rise, after a 2.7% gain in the fourth quarter. It was the largest rise since the fourth quarter of 2014.
The fourth quarter's figure was revised down from a 3.3% increase.
-
15:08
U.S. trade deficit narrows to $40.44 billion in March
The U.S. Commerce Department released the trade data on Wednesday. The U.S. trade deficit narrowed to $40.44 billion in March from a deficit of $46.96 billion in February. It was the smallest gap since February 2015.
February's figure was revised up from a deficit of $47.06 billion.
Analysts had expected a trade deficit of $41.5 billion.
The decline of a deficit was driven by a drop in imports. Exports decreased by 0.9% in March, while imports slid by 3.6%, the largest fall since February 2009.
-
14:56
Wall Street. Stocks before the bell
(company / ticker / price / change ($/%) / volume)
ALCOA INC.
AA
10.28
-0.04(-0.3876%)
54397
Amazon.com Inc., NASDAQ
AMZN
666.95
-4.37(-0.651%)
16457
AMERICAN INTERNATIONAL GROUP
AIG
55.47
-0.47(-0.8402%)
1000
Apple Inc.
AAPL
94.82
-0.36(-0.3782%)
161864
Barrick Gold Corporation, NYSE
ABX
18.19
-0.19(-1.0337%)
165227
Boeing Co
BA
131.5
-0.99(-0.7472%)
132
Caterpillar Inc
CAT
76.33
-0.03(-0.0393%)
1292
Chevron Corp
CVX
101.16
-0.16(-0.1579%)
9253
Cisco Systems Inc
CSCO
26.71
-0.15(-0.5585%)
1708
Citigroup Inc., NYSE
C
45.03
-0.54(-1.185%)
54111
Exxon Mobil Corp
XOM
87.8
-0.31(-0.3518%)
848
Facebook, Inc.
FB
116.72
-0.71(-0.6046%)
137491
FedEx Corporation, NYSE
FDX
164.84
0.05(0.0303%)
1965
Ford Motor Co.
F
13.32
-0.11(-0.8191%)
20550
Freeport-McMoRan Copper & Gold Inc., NYSE
FCX
11.97
-0.04(-0.3331%)
278928
General Electric Co
GE
30.5
-0.13(-0.4244%)
5865
General Motors Company, NYSE
GM
30.79
-0.46(-1.472%)
304
Goldman Sachs
GS
161.49
-1.65(-1.0114%)
3175
Google Inc.
GOOG
689.01
-3.35(-0.4839%)
4588
Home Depot Inc
HD
133.98
-0.56(-0.4162%)
1480
Intel Corp
INTC
30.01
-0.09(-0.299%)
24199
Johnson & Johnson
JNJ
112.15
-0.54(-0.4792%)
796
JPMorgan Chase and Co
JPM
61.94
-0.62(-0.9911%)
1822
McDonald's Corp
MCD
128
-0.40(-0.3115%)
653
Microsoft Corp
MSFT
49.6
-0.18(-0.3616%)
28223
Nike
NKE
58.76
-0.76(-1.2769%)
340
Pfizer Inc
PFE
33.6
-0.10(-0.2967%)
3487
Procter & Gamble Co
PG
80.94
-0.16(-0.1973%)
335
Starbucks Corporation, NASDAQ
SBUX
55.95
-0.30(-0.5333%)
4954
Tesla Motors, Inc., NASDAQ
TSLA
230.27
-2.05(-0.8824%)
15607
The Coca-Cola Co
KO
44.66
-0.18(-0.4014%)
424
Twitter, Inc., NYSE
TWTR
13.97
-0.04(-0.2855%)
74222
Visa
V
76.54
-0.65(-0.8421%)
1503
Yahoo! Inc., NASDAQ
YHOO
35.83
-0.18(-0.4999%)
2855
Yandex N.V., NASDAQ
YNDX
19.73
-0.45(-2.2299%)
2500
-
14:51
Canada's trade deficit widens to C$3.41 billion in March
Statistics Canada released the trade data on Wednesday. Canada's trade deficit widened to C$3.41 billion in March from a deficit of C$2.47 billion in February. February's figure was revised down from a deficit of C$1.91 billion.
Analysts had expected a trade deficit of C$1.4 billion.
The rise in deficit was driven by a drop in exports. Exports slid 4.8% in March.
Exports of consumer goods plunged 4.6% in March, exports of metal and non-metallic mineral products dropped by 5.4%, while exports of motor vehicles and parts were down 6.0%.
Imports fell 2.4% in March.
Imports of energy products jumped by 13.5% in March, imports of consumer goods decreased by 4.6%, while imports of aircraft and other transportation equipment and parts fell 20.4%.
-
14:47
Upgrades and downgrades before the market open
Upgrades:
FedEx (FDX) upgraded to Overweight from Equal Weight at Barclays
Downgrades:
Other:
-
14:30
U.S.: International Trade, bln, March -40.44 (forecast -41.5)
-
14:30
U.S.: Unit Labor Costs, q/q, Quarter I 4.1% (forecast 3.3%)
-
14:30
Canada: Trade balance, billions, March -3.41 (forecast -1.4)
-
14:30
U.S.: Nonfarm Productivity, q/q, Quarter I -1% (forecast -1.4%)
-
14:25
U.S. ADP Employment Report: private sector adds 156,000 jobs in April
Private sector in the U.S. added 156,000 jobs in April, according the ADP report on Wednesday. March's figure was revised down to 194,000 jobs from a previous reading of 200,000 jobs.
Analysts expected the private sector to add 196,000 jobs.
Services sector added 166,000 jobs in April, while goods-producing sector shed 11,000.
"The job market appears to have stumbled in April. Job growth noticeably slowed, with some weakness across most sectors," the Chief Economist of Moody's Analytics Mark Zandi said.
"One month does not make a trend, but this bears close watching as the financial market turmoil earlier in the year may have done some damage to business hiring," he added.
Official labour market data will be released on Friday. Analysts expect that U.S. unemployment rate is expected to remain unchanged at 5.0% in April. The U.S. economy is expected to add 200,000 jobs in April, after adding 215,000 jobs in March.
-
14:15
U.S.: ADP Employment Report, April 156 (forecast 196)
-
14:06
Foreign exchange market. European session: the British pound traded lower against the U.S. dollar after the release of the weaker-than-expected construction PMI data from the U.K.
Economic calendar (GMT0):
(Time/ Region/ Event/ Period/ Previous/ Forecast/ Actual)
00:00 Japan Bank holiday
06:45 France Trade Balance, bln March -5.12 Revised From -5.18 -4.4 -4.37
07:50 France Services PMI (Finally) April 49.9 50.8 50.6
07:55 Germany Services PMI (Finally) April 55.1 54.6 54.5
08:00 Eurozone Services PMI (Finally) April 53.1 53.2 53.1
08:30 United Kingdom PMI Construction April 54.2 54 52
09:00 Eurozone Retail Sales (MoM) March 0.3% Revised From 0.2% -0.1% -0.5%
09:00 Eurozone Retail Sales (YoY) March 2.7% Revised From 2.4% 2.5% 2.1%
10:15 Eurozone ECB's Jens Weidmann Speaks
11:00 U.S. MBA Mortgage Applications April -4.1% -3.4%
The U.S. dollar traded mixed against the most major currencies ahead of the release of the U.S. economic data. Private sector in the U.S. is expected to add 196,000 jobs in April, according the ADP report on Wednesday.
Preliminary productivity in the U.S. non-farm businesses is expected to decline at a 1.4% annual rate in the first quarter, after a 2.2% drop in the fourth quarter.
Preliminary unit labour costs are expected to increase 3.3% in the first quarter, after a 3.3 gain in the fourth quarter.
The U.S. factory orders are expected to rise 0.6% in March, after a 1.7% fall in February.
The U.S. trade deficit is expected to narrow to $41.5 billion in March from $47.06 billion in February.
The ISM non-manufacturing purchasing managers' index is expected to rise to 54.7 in April from 54.5 in March.
The euro traded mixed against the U.S. dollar after the release of the weaker-than-expected economic data from the Eurozone. Markit Economics released final services purchasing managers' index (PMI) for the Eurozone on Wednesday. Eurozone's final services PMI remained unchanged at 53.1 in April, down from the preliminary reading of 53.2.
Eurozone's final composite output index fell to 53.0 in April from 53.1 in March, in line with the preliminary reading.
The decline was mainly driven by a fall in output prices.
"The final PMI data confirm the earlier flash estimate that the Eurozone economy grew at a steady but unspectacular annual rate of 1.5% at the start of the second quarter," Chief Economist at Markit Chris Williamson said.
"However, while still tepid, the sustained Eurozone growth contrasts with slowdowns in the US and UK, suggesting the ECB's more aggressive stimulus is helping to drive a steady recover," he added.
Germany's final services PMI fell to 54.5 in April from 55.1 in March, down from the preliminary reading of 54.6. The index was mainly driven by a slower growth in employment, while backlogs of work declined.
France's final services PMI increased to 50.6 in April from 49.9 in March, down from the preliminary reading of 50.8. The index was mainly driven by rises in new business, backlogs of work and input prices.
Eurostat released its retail sales data for the Eurozone on Wednesday. Retail sales in the Eurozone decreased 0.5% in March, missing expectations for a 0.1% fall, after a 0.3% gain in February. February's figure was revised up from a 0.2% increase.
Non-food sales decreased 0.5% in March, food, drinks and tobacco sales slid 1.3%, while automotive fuel sales were down 0.4%.
On a yearly basis, retail sales in the Eurozone climbed 2.1% in March, missing forecasts of a 2.5% gain, after a 2.7% increase in February. February's figure was revised up from a 2.4% rise.
Non-food sales gained 2.1% year-on-year in March, gasoline sales jumped 2.5%, while food, drinks and tobacco sales rose 1.5%.
The British pound traded lower against the U.S. dollar after the release of the weaker-than-expected construction PMI data from the U.K. Markit's and the Chartered Institute of Purchasing & Supply's construction PMI for the U.K. dropped to 52.0 in April from 54.2 in March, missing expectations for a decrease to 54.0. It was the lowest level since June 2013. The decline was mainly driven by a drop in new work.
"UK construction firms reported their worst month for almost three years in April, meaning that the first quarter slowdown is unlikely to prove temporary," Senior Economist at Markit, Tim Moore, said.
"Softer growth forecasts for the UK economy alongside uncertainty ahead of the EU referendum appear to have provided reasons for clients to delay major spending decisions until the fog has lifted," he added.
According to the British Retail Consortium (BRC), the U.K. shop prices declined by 1.7% year-on-year in April, after a 1.7% decline in March.
The decline was mainly driven by a drop in non-food prices, which plunged 2.9% year-on-year in April. Food prices rose at an annual rate of 0.1% in April.
The Canadian dollar traded lower against the U.S. dollar ahead of the release of the Canadian trade data. The Canadian trade deficit is expected to narrow to C$1.4 billion in March from C$1.91 billion in February.
EUR/USD: the currency pair traded mixed
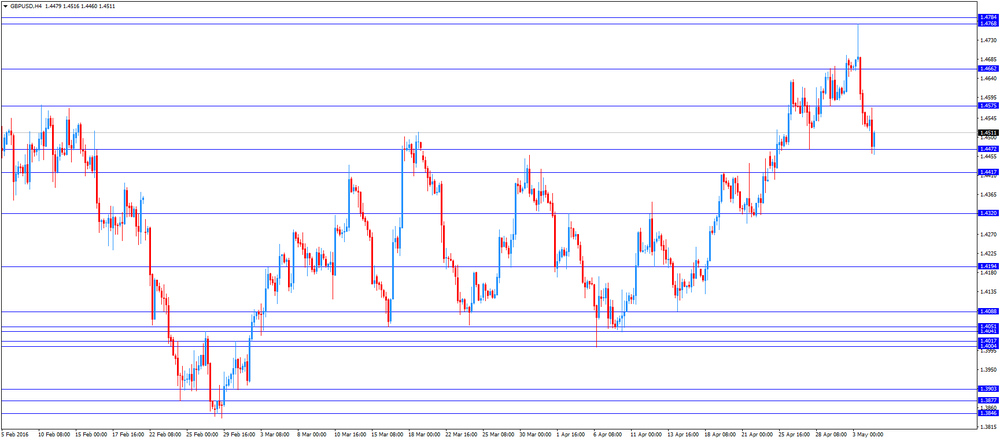
GBP/USD: the currency pair fell to $1.4460
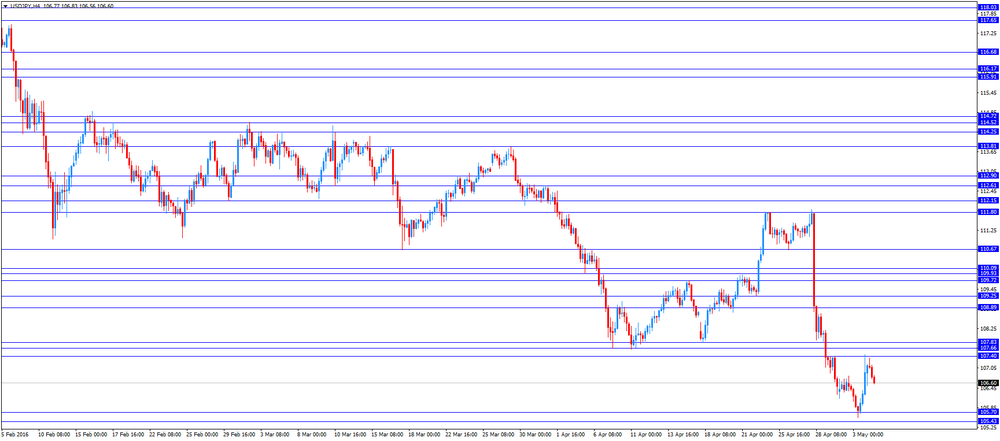
USD/JPY: the currency pair declined to Y106.56
The most important news that are expected (GMT0):
12:15 U.S. ADP Employment Report April 200 196
12:30 Canada Trade balance, billions March -1.91 -1.4
12:30 U.S. Unit Labor Costs, q/q (Preliminary) Quarter I 3.3% 3.3%
12:30 U.S. Nonfarm Productivity, q/q (Preliminary) Quarter I -2.2% -1.4%
12:30 U.S. International Trade, bln March -47.06 -41.5
13:45 U.S. Services PMI (Finally) April 51.3 52.1
14:00 U.S. Factory Orders March -1.7% 0.6%
14:00 U.S. ISM Non-Manufacturing April 54.5 54.7
14:30 U.S. Crude Oil Inventories April 1.999 1.444
-
13:20
WSE: Mid session comment
In the first half of the session, the Warsaw market show a weak trade. The WIG20 index descended to new lows session and fell below the Thursday's session minimum. Consequently, we are the lowest since almost two months, which of course increases the implementation of the favored medium-term negative scenario for the market.
At the halfway point of the session the WIG20 index was at 1866 points (-1.74%) traded at slightly more than PLN 290 mln turnover.
-
13:00
U.S.: MBA Mortgage Applications, April -3.4%
-
12:10
European stock markets mid session: stocks traded lower as market participants eyed the economic data from the Eurozone
Stock indices traded lower on the economic data from the Eurozone. Markit Economics released final services purchasing managers' index (PMI) for the Eurozone on Wednesday. Eurozone's final services PMI remained unchanged at 53.1 in April, down from the preliminary reading of 53.2.
Eurozone's final composite output index fell to 53.0 in April from 53.1 in March, in line with the preliminary reading.
The decline was mainly driven by a fall in output prices.
"The final PMI data confirm the earlier flash estimate that the Eurozone economy grew at a steady but unspectacular annual rate of 1.5% at the start of the second quarter," Chief Economist at Markit Chris Williamson said.
"However, while still tepid, the sustained Eurozone growth contrasts with slowdowns in the US and UK, suggesting the ECB's more aggressive stimulus is helping to drive a steady recover," he added.
Germany's final services PMI fell to 54.5 in April from 55.1 in March, down from the preliminary reading of 54.6. The index was mainly driven by a slower growth in employment, while backlogs of work declined.
France's final services PMI increased to 50.6 in April from 49.9 in March, down from the preliminary reading of 50.8. The index was mainly driven by rises in new business, backlogs of work and input prices.
Eurostat released its retail sales data for the Eurozone on Wednesday. Retail sales in the Eurozone decreased 0.5% in March, missing expectations for a 0.1% fall, after a 0.3% gain in February. February's figure was revised up from a 0.2% increase.
Non-food sales decreased 0.5% in March, food, drinks and tobacco sales slid 1.3%, while automotive fuel sales were down 0.4%.
On a yearly basis, retail sales in the Eurozone climbed 2.1% in March, missing forecasts of a 2.5% gain, after a 2.7% increase in February. February's figure was revised up from a 2.4% rise.
Non-food sales gained 2.1% year-on-year in March, gasoline sales jumped 2.5%, while food, drinks and tobacco sales rose 1.5%.
Markit's and the Chartered Institute of Purchasing & Supply's construction PMI for the U.K. dropped to 52.0 in April from 54.2 in March, missing expectations for a decrease to 54.0. It was the lowest level since June 2013. The decline was mainly driven by a drop in new work.
"UK construction firms reported their worst month for almost three years in April, meaning that the first quarter slowdown is unlikely to prove temporary," Senior Economist at Markit, Tim Moore, said.
"Softer growth forecasts for the UK economy alongside uncertainty ahead of the EU referendum appear to have provided reasons for clients to delay major spending decisions until the fog has lifted," he added.
According to the British Retail Consortium (BRC), the U.K. shop prices declined by 1.7% year-on-year in April, after a 1.7% decline in March.
The decline was mainly driven by a drop in non-food prices, which plunged 2.9% year-on-year in April. Food prices rose at an annual rate of 0.1% in April.
Current figures:
Name Price Change Change %
FTSE 100 6,106.4 -79.19 -1.28 %
DAX 9,848.37 -78.40 -0.79 %
CAC 40 4,337.34 -34.64 -0.79 %
-
12:04
BRC: U.K. shop prices are down 1.7% year-on-year in April
According to the British Retail Consortium (BRC), the U.K. shop prices declined by 1.7% year-on-year in April, after a 1.7% decline in March.
The decline was mainly driven by a drop in non-food prices, which plunged 2.9% year-on-year in April.
Food prices rose at an annual rate of 0.1% in April.
"The thirty-six consecutive months of price falls is being driven by intense competition across the industry. It has knock on implications for margins and profitability given the combination of continued investment in digital and rising cost pressures, compounded by recent policy announcements," BRC Chief Executive, Helen Dickinson, said.
-
12:00
Greece’s manufacturing PMI rises to 49.7 in April
Markit Economics released its manufacturing purchasing managers' index (PMI) for Greece on Wednesday. Greece's manufacturing purchasing managers' index (PMI) rose to 49.7 in April from 49.0 in March.
Output levels stabilised during April despite a decline in incoming new orders, while buying activity rose.
"Production stabilised for the first time during 2016 and job creation was still evident, highlighting firms' intentions to invigorate future output with increased manpower," Markit economist Samuel Agass said.
-
11:51
Italy’s services PMI climbs to 52.1 in April
Markit/ADACI's services purchasing managers' index (PMI) for Italy climbed to 52.1 in April from 51.2 in March.
A reading above 50 indicates expansion in the sector.
The index was mainly driven by rises in new business and job creation.
"All indices from the services PMI survey nudged higher in April, pointing to slightly faster rates of growth in business activity, new work and employment, as well as a strengthening of business confidence towards the outlook," an economist at Markit Phil Smith said.
-
11:47
Number of registered unemployed people in Spain decrease by 83,599 in April
Spain's labour ministry release its labour market figures on Wednesday. The number of registered unemployed people decreased by 83,599 in April, after a 58,216 rise in March.
The decline was driven by a rise in employment in the services sector.
The number of registered youth unemployed people fell by 40,955 in April from the last year.
The total number of jobless in Spain was 4.01 million in April.
-
11:41
Spain’s services PMI falls to 55.1 in April
Markit Economics released services purchasing managers' index (PMI) for Spain on Wednesday. Spain's services purchasing managers' index (PMI) fell to 55.1 in April from 55.3 in March.
The decline was driven by a softer growth in in new orders and employment, while output prices decreased.
"While the headline activity figure from the latest Spain services PMI suggests that growth remained marked during April, other indices from the survey paint a less positive picture," Senior Economist at Markit Andrew Harker said.
"Political uncertainty contributed to the weakest rise in new business for close to a year-and-a-half," he added.
-
11:37
France’s current account deficit falls to €1.8 billion in March
The Bank of France released its current account data on Wednesday. France's current account deficit was €1.8 billion in March, down from a deficit of €4.1 billion in February. January's figure was revised down from a deficit of €3.9 billion.
The trade goods deficit narrowed to €2.7 billion in March from €3.7 billion in February, while the deficit on services turned into a surplus of €1.2 billion from a deficit of €0.1 billion.
-
11:31
France's trade deficit narrows to €4.37 billion in March
According to the French Customs, France's trade deficit narrowed to €4.37 billion in March from €5.12 billion in February, beating expectations for a decline to a deficit of €4.4 billion. February's figure was revised up from a deficit of €5.18 billion.
The decrease in deficit was driven by lower imports. Exports declined to €36.38 billion in March from €37.87 billion in February, while imports dropped to €40.75 billion from €42.98 billion.
-
11:25
Eurozone’s retail sales decrease 0.5% in March
Eurostat released its retail sales data for the Eurozone on Wednesday. Retail sales in the Eurozone decreased 0.5% in March, missing expectations for a 0.1% fall, after a 0.3% gain in February. February's figure was revised up from a 0.2% increase.
Non-food sales decreased 0.5% in March, food, drinks and tobacco sales slid 1.3%, while automotive fuel sales were down 0.4%.
On a yearly basis, retail sales in the Eurozone climbed 2.1% in March, missing forecasts of a 2.5% gain, after a 2.7% increase in February. February's figure was revised up from a 2.4% rise.
Non-food sales gained 2.1% year-on-year in March, gasoline sales jumped 2.5%, while food, drinks and tobacco sales rose 1.5%.
-
11:19
France's final services PMI increases to 50.6 in April
Markit Economics released final services purchasing managers' index (PMI) for France on Wednesday. France's final services purchasing managers' index (PMI) increased to 50.6 in April from 49.9 in March, down from the preliminary reading of 50.8.
The index was mainly driven by rises in new business, backlogs of work and input prices.
"France's service sector expanded at the start of the second quarter, although the pace of growth signalled was marginal. PMI data continue to paint a weaker picture than the latest GDP figures," Senior Economist at Markit Jack Kennedy said.
-
11:11
Germany's final services PMI falls to 54.5 in April
Markit Economics released final services purchasing managers' index (PMI) for Germany on Wednesday. Germany's final services purchasing managers' index (PMI) fell to 54.5 in April from 55.1 in March, down from the preliminary reading of 54.6.
The index was mainly driven by a slower growth in employment, while backlogs of work declined.
"It is slightly disappointing, although not surprising that activity growth at German service providers slowed during April, as last months' new business and employment indicators had already pointed to a potential slowdown. Nonetheless, Germany's service sector continued to grow at a steady pace at the start of the second quarter," an economist at Markit, Oliver Kolodseike, said.
-
11:03
Eurozone's final services PMI remains unchanged at 53.1 in April
Markit Economics released final services purchasing managers' index (PMI) for the Eurozone on Wednesday. Eurozone's final services purchasing managers' index (PMI) remained unchanged at 53.1 in April, down from the preliminary reading of 53.2.
The downward revision was mainly driven by Germany.
Eurozone's final composite output index fell to 53.0 in April from 53.1 in March, in line with the preliminary reading.
The decline was mainly driven by a fall in output prices.
"The final PMI data confirm the earlier flash estimate that the Eurozone economy grew at a steady but unspectacular annual rate of 1.5% at the start of the second quarter," Chief Economist at Markit Chris Williamson said.
"However, while still tepid, the sustained Eurozone growth contrasts with slowdowns in the US and UK, suggesting the ECB's more aggressive stimulus is helping to drive a steady recover," he added.
-
11:00
Eurozone: Retail Sales (MoM), March -0.5% (forecast -0.1%)
-
11:00
Eurozone: Retail Sales (YoY), March 2.1% (forecast 2.5%)
-
10:53
UK construction PMI slides to 52.0 in April
Markit's and the Chartered Institute of Purchasing & Supply's construction purchasing managers' index (PMI) for the U.K. dropped to 52.0 in April from 54.2 in March, missing expectations for a decrease to 54.0. It was the lowest level since June 2013.
A reading above 50 indicates expansion in the construction sector.
The decline was mainly driven by a drop in new work.
"UK construction firms reported their worst month for almost three years in April, meaning that the first quarter slowdown is unlikely to prove temporary," Senior Economist at Markit, Tim Moore, said.
"Softer growth forecasts for the UK economy alongside uncertainty ahead of the EU referendum appear to have provided reasons for clients to delay major spending decisions until the fog has lifted," he added.
-
10:30
United Kingdom: PMI Construction, April 52 (forecast 54)
-
10:24
Goldman Sachs Group Inc.’s co-head of investment banking David Solomon: interest rates could lead to volatility
Goldman Sachs Group Inc.'s co-head of investment banking David Solomon said in a speech on Monday that negative interest rates could lead to volatility as market participants were seeking for higher yields. He noted that there were no asset bubbles, adding that the financial system was in good shape.
-
10:11
New Zealand’s unemployment rate climbs to 5.7% in the first quarter
Statistics New Zealand released its labour market data on late Tuesday evening. The unemployment rate rose to 5.7% in the first quarter from 5.4% in the fourth quarter, missing expectations for a rise to 5.5%. The fourth quarter's figure was revised up from 5.3%.
Employment increased 1.2% in the first quarter, exceeding expectations for a 0.7% gain, after a 0.9% rise in the fourth quarter.
The participation rate increased to 69.0% in the first quarter from 68.4% in the fourth quarter.
"The total labour force increased by 38,000 people in the March 2016 quarter. This resulted in more New Zealanders in unemployment and employment than three months ago," labour market and household senior manager Jason Attewell said.
-
10:01
Eurozone: Services PMI, April 53.1 (forecast 53.2)
-
09:55
Germany: Services PMI, April 54.5 (forecast 54.6)
-
09:50
France: Services PMI, April 50.6 (forecast 50.8)
-
09:21
Option expiries for today's 10:00 ET NY cut
EUR/USD: 1.1315-20 (EUR 389m) 1.1400-05 (371m) 1.1455 (250m) 1.1530 (544m) 1.1540(674m) 1.1600 (362m)
EUR/GBP 0.7850 (EUR 245m)
AUD/USD 0.7350 (AUD 411m) 0.7800 (892m)
USD/CAD 1.2640 (USD 220m) 1.3030 (266m) 1.3150 (254m)
NZD/USD 0.6950 (NZD 201m)
AUD/NZD 1.0850 (AUD 200m)
-
09:17
WSE: After opening
The WIG20 futures (WSE: FW20M16) started the day 15 points below Monday's closing or 0.8 percent in the red. After the scale of yesterday's declines on stock exchanges in Europe and the US such descent of contracts was not surprising.
WIG20 index opened at 1890.87 points (-0.47%)*
WIG 47457.73 -0.55%
WIG30 2107.45 -0.72%
mWIG40 3610.17 -0.21%
*/ - change to previous close
After a festive day in which through the European and American stock markets swept a wave of sell-off, the Warsaw Stock Exchange resumed trading in red. The direction pre-determined by the contract is clear. In this context, today's session could be very interesting. Bulls will have the opportunity to fight for the denial of yesterday's trend in Europe.
European markets started the day with modest changes. There are no surprises, but we can see attempts of chasing yesterday's losses on the part of the companies that served yesterday as leaders of the supply. In conjunction with the displacement in Warsaw it raises the chance of bulls to keep the WIG20 in the area of support.
-
08:45
France: Trade Balance, bln, March -4.37 (forecast -4.4)
-
08:32
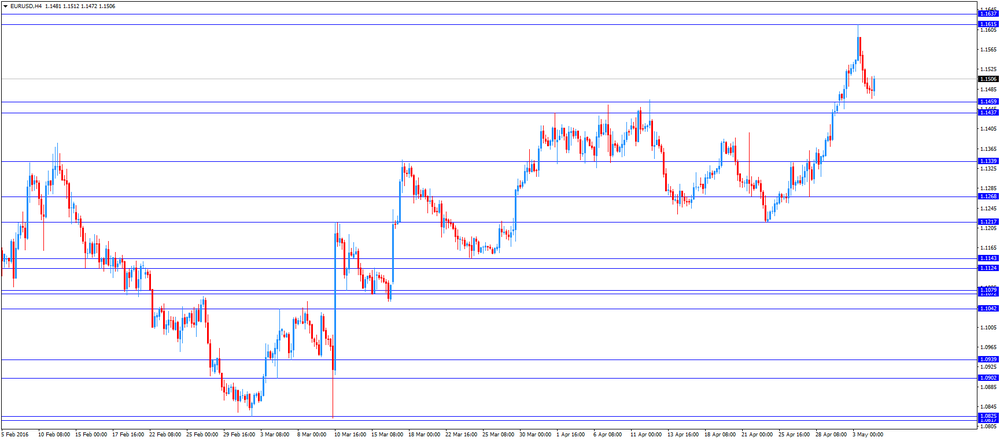
Options levels on wednesday, May 4, 2016:
EUR / USD
Resistance levels (open interest**, contracts)
$1.1589 (3813)
$1.1563 (5804)
$1.1532 (4804)
Price at time of writing this review: $1.1495
Support levels (open interest**, contracts):
$1.1457 (1494)
$1.1426 (1268)
$1.1388 (3419)
Comments:
- Overall open interest on the CALL options with the expiration date May, 6 is 43190 contracts, with the maximum number of contracts with strike price $1,1500 (5804);
- Overall open interest on the PUT options with the expiration date May, 6 is 63254 contracts, with the maximum number of contracts with strike price $1,1000 (10024);
- The ratio of PUT/CALL was 1.46 versus 1.44 from the previous trading day according to data from May, 3
GBP/USD
Resistance levels (open interest**, contracts)
$1.4801 (1391)
$1.4702 (1053)
$1.4605 (1296)
Price at time of writing this review: $1.4555
Support levels (open interest**, contracts):
$1.4495 (1059)
$1.4398 (1699)
$1.4299 (1071)
Comments:
- Overall open interest on the CALL options with the expiration date May, 6 is 24455 contracts, with the maximum number of contracts with strike price $1,4500 (2084);
- Overall open interest on the PUT options with the expiration date May, 6 is 36383 contracts, with the maximum number of contracts with strike price $1,3850 (4025);
- The ratio of PUT/CALL was 1.49 versus 1.44 from the previous trading day according to data from May, 3
* - The Chicago Mercantile Exchange bulletin (CME) is used for the calculation.
** - Open interest takes into account the total number of option contracts that are open at the moment.
-
08:24
Asian session: The yen slipped from an 18-month high against the dollar
The yen slipped from an 18-month high against the dollar on Wednesday, losing some steam as position squaring set in after its sharp rally since last week. The dollar's gains against the yen came in thin market conditions, with Japanese markets closed on Wednesday and Thursday for public holidays. Last week, the yen saw its biggest weekly gain since 2008 - more than 5 percent against the dollar - as the Bank of Japan held off from expanding its stimulus.
The Aussie had tumbled nearly 2.4 percent on Tuesday after the country's central bank cut interest rates for the first time in a year, and as commodity prices fell. Later on Wednesday, the focus will be on U.S. economic indicators such as a report on private employment and an industry report on the U.S. services sector.
EUR/USD: during the Asian session the pair fell to $1.1475
GBP/USD: during the Asian session the pair traded in the range of $1.4515-50
USD/JPY: during the Asian session the pair rose to Y107.35
Based on Reuters materials
-
08:17
WSE: Before opening
Tuesday's session ended in solidarity declines of most of the markets. From the morning on stock exchanges there was the mood of risk aversion triggered by a weaker-than-expected reading of the index of economic situation in the Chinese industry. During the day joined to it the strengthening of the dollar and declines in commodity prices. In the final the DAX lost nearly 2 percent and the US indices decreased from 0.8 to 1.1 percent. Night did not bring any major improvement. Contracts on the S&P500 and the DAX record losses, so maintaining the current atmosphere to the opening of markets in Europe will not be the basis for a rebound yesterday's declines.
From the WSE point of view the mix of above mentioned variables arranged in a simple downward scenario. On Monday WIG20 recorded a modest increase, part of which was the shallowness of trade and calm of the zloty to the dollar. Tuesday brought the weakening of the Polish currency to the euro and the dollar. When we take into account the fact that in recent weeks the USD/PLN relationship had an impact on the condition of the WIG20, there is an additional element supporting the forces of supply today. We have to expect the down opening gap and confrontation with violated already the level of support in the region of 1,892 points.
Corrective sentiment on core markets, more and more are beginning to fit into the scheme: "sell in May and go away".
-
06:54
Global Stocks
European stocks closed sharply lower Tuesday, logging its worst three-day decline in nearly three months as the euro hit a roughly nine-month high against the U.S. dollar. Selling in bank shares following poor financial results in the sector also weighed.
U.S. stocks fell to their lowest level in three weeks on Tuesday, as weaker-than-expected manufacturing data in China revived worries about global growth and sent investors scurrying out of the perceived risk of equities.
Most shares in Asia were back in the red Wednesday with Australia slipping below breaking even for the year amid a renewed fall in oil prices and a nearly 10% plunge in shares of Anglo-Australian BHP Billiton Ltd.
Based on MarketWatch materials
-
04:04
Hang Seng 20,462.53 -214.41 -1.04 %,S&P/ASX 200 5,285.1 -68.74 -1.28 %, Shanghai Composite 2,988.06 -4.59 -0.15 %
-
01:30
Australia: AIG Services Index, April 49.7
-
01:00
Commodities. Daily history for May 3’2016:
(raw materials / closing price /% change)
Oil 43.88 +0.53%
Gold 1,288.20 -0.28%
-
00:59
Stocks. Daily history for Sep Apr May 3’2016:
(index / closing price / change items /% change)
Hang Seng 20,676.94 -390.11 -1.85 %
S&P/ASX 200 5,353.84 +110.87 +2.11 %
Shanghai Composite 2,993.2 +54.87 +1.87 %
FTSE 100 6,185.59 -56.30 -0.90 %
CAC 40 4,371.98 -70.77 -1.59 %
Xetra DAX 9,926.77 -196.50 -1.94 %
S&P 500 2,063.37 -18.06 -0.87 %
NASDAQ Composite 4,763.22 -54.37 -1.13 %
Dow Jones 17,750.91 -140.25 -0.78 %
-
00:57
Currencies. Daily history for May 3’2016:
(pare/closed(GMT +3)/change, %)
EUR/USD $1,1497 -0,25%
GBP/USD $1,4532 -0,92%
USD/CHF Chf0,9547 0,00%
USD/JPY Y106,90 +0,47%
EUR/JPY Y122,92 +0,21%
GBP/JPY Y155,35 -0,44%
AUD/USD $0,7481 -2,41%
NZD/USD $0,6916 -1,45%
USD/CAD C$1,2721 +1,48%
-
00:45
New Zealand: Unemployment Rate, Quarter I 5.7% (forecast 5.5%)
-
00:45
New Zealand: Employment Change, q/q, Quarter I 1.2% (forecast 0.7%)
-