Noticias del mercado
-
23:59
Schedule for today, Thursday, May 18’2017 (GMT0)
01:00 Australia Consumer Inflation Expectation May 4.1%
01:30 Australia Unemployment rate April 5.9% 5.9%
01:30 Australia Changing the number of employed April 60.9 5
07:50 Eurozone ECB's Yves Mersch Speaks
08:30 United Kingdom Retail Sales (YoY) April 1.7% 2.1%
08:30 United Kingdom Retail Sales (MoM) April -1.8% 1%
11:30 Eurozone ECB Monetary Policy Meeting Accounts
12:30 Eurozone ECB's Yves Mersch Speaks
12:30 Canada Foreign Securities Purchases March 38.84
12:30 U.S. Continuing Jobless Claims 1918 1960
12:30 U.S. Philadelphia Fed Manufacturing Survey May 22 19.5
12:30 U.S. Initial Jobless Claims 236 240
14:00 U.S. Leading Indicators April 0.4% 0.4%
17:00 Eurozone ECB President Mario Draghi Speaks
17:15 U.S. FOMC Member Mester Speaks
22:45 New Zealand Visitor Arrivals April -0.2%
-
22:07
The main US stock indexes completed the session in a negative territory
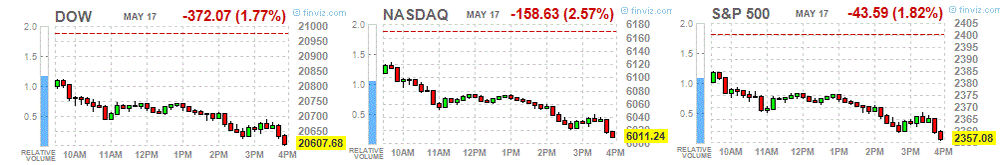
Major US stock indices fell significantly on Wednesday, as investors fled from risky assets amid uncertainty about the ability of US President Trump to implement tax and regulatory reform.
Reports that Trump asked FBI director Komi to stop the investigation into the former national security adviser raised the question of whether Trump tried to intervene in the federal investigation. In addition, today the congressman from Texas Al Green has already called on colleagues to announce Trump impeachment.
Oil prices rose by about 1%, helped by a positive report from the US Energy Ministry, which pointed to a drop in oil reserves, and gasoline and distillates. Additional support for oil was provided by the widespread weakening of the US dollar. The US Energy Ministry said that during the week of May 6-12, oil reserves fell by 1.8 million barrels to 520.8 million barrels. Analysts on average expected a drop in inventories at 2.283 million barrels. Oil reserves in the Cushing terminal increased by 35,000 barrels to 66.3 million barrels. The gasoline reserves decreased by 413,000 barrels to 240.7 million barrels.
Most components of the DOW index recorded a decline (25 out of 30). Most fell shares of The Goldman Sachs Group, Inc. (GS, -5.27%). The leader of growth was UnitedHealth Group Incorporated (UNH, + 0.57%).
Almost all sectors of the S & P index finished trading in the red. The conglomerate sector fell most of all (-2.9%). Growth was demonstrated only the utilities sector (+ 0.1%).
At closing:
DJIA -1.77% 20,609.28 -370.47
Nasdaq -2.57% 6,011.24 -158.63
S & P -1.81% 2,357.32 -43.35
-
20:59
DJIA -1.54% 20,657.16 -322.59 Nasdaq -2.23% 6,032.52 -137.35 S&P -1.57% 2,363.02 -37.65
-
18:00
European stocks closed: FTSE 100 -18.56 7503.47 -0.25% DAX -172.92 12631.61 -1.35% CAC 40 -88.21 5317.89 -1.63%
-
16:33
U.S. commercial crude oil inventories decreased by 1.8 million barrels from the previous week
U.S. commercial crude oil inventories (excluding those in the Strategic Petroleum Reserve) decreased by 1.8 million barrels from the previous week. At 520.8 million barrels, U.S. crude oil inventories are in the upper half of the average range for this time of year.
Total motor gasoline inventories decreased by 0.4 million barrels last week, but are above the upper limit of the average range. Finished gasoline inventories increased while blending components inventories decreased last week.
Distillate fuel inventories decreased by 1.9 million barrels last week but are in the upper half of the average range for this time of year. Propane/propylene inventories increased by 0.6 million barrels last week but are in the lower half of the average range. Total commercial petroleum inventories increased by 4.3 million barrels last week.
-
16:30
U.S.: Crude Oil Inventories, May -1753 (forecast -2.283)
-
15:53
Federal funds futures imply traders see 69 pct chance Fed raising rates at june 13-14 policy meeting, lowest since April 24 - CME group's Fedwatch data
-
15:50
Option expiries for today's 10:00 ET NY cut
EURUSD: 1.0965 (EUR 650m) 1.1000 (1bln ) 1.1030-35 (898m) 1.1100 (1.2bln) 1.1275 (438m)
USDJPY: 112.90-00 (USD 635m) 113.50 (297m) 114.00 (231m)
EURGBP: 0.8435 (224m) 0.8630 (220m)
AUDUSD: 0.7300 (AUD 412m) 0.7400 (461m) 0.7430-40 (667m) 0.7470 (257m)
USDCAD: 1.3600 (USD 1.2bln) 1.3800 (980m)
EURJPY: 123.50 (EUR 266m)
NZDUSD: 0.7000 (NZD 248m)
-
15:33
U.S. Stocks open: Dow -0.89%, Nasdaq -0.98%, S&P -0.81%
-
15:24
Before the bell: S&P futures -0.60%, NASDAQ futures -0.57%
U.S. stock-index futures fell amid concerns that a fresh controversy around President Donald Trump could derail his ambitious pro-growth agenda.
Stocks:
Nikkei 19,814.88 -104.94 -0.53%
Hang Seng 25,293.63 -42.31 -0.17%
Shanghai 3,104.74 -8.22 -0.26%
S&P/ASX 5,786.03 -64.49 -1.10%
FTSE 7,508.84 -13.19 -0.18%
CAC 5,371.67 -34.43 -0.64%
DAX 12,753.13 -51.40 -0.40%
Crude $48.82 (+0.33%)
Gold $1,250.90 (+1.17%)
-
14:55
Spot gold rises 1 pct to two-week high of $1,248.83/oz
-
14:55
Wall Street. Stocks before the bell
(company / ticker / price / change ($/%) / volume)
3M Co
MMM
196
-0.74(-0.37%)
14237
ALCOA INC.
AA
31.63
-0.53(-1.65%)
5859
ALTRIA GROUP INC.
MO
70.7
-0.25(-0.35%)
46044
Amazon.com Inc., NASDAQ
AMZN
958.15
-7.92(-0.82%)
45413
American Express Co
AXP
77.5
-0.63(-0.81%)
18638
AMERICAN INTERNATIONAL GROUP
AIG
61.53
-0.55(-0.89%)
21532
Apple Inc.
AAPL
154.06
-1.41(-0.91%)
324482
AT&T Inc
T
38.09
-0.10(-0.26%)
167996
Barrick Gold Corporation, NYSE
ABX
17.26
0.30(1.77%)
100926
Boeing Co
BA
181.85
-0.85(-0.47%)
17421
Caterpillar Inc
CAT
101.01
-1.33(-1.30%)
20149
Chevron Corp
CVX
105.81
-0.36(-0.34%)
48577
Cisco Systems Inc
CSCO
34.26
-0.04(-0.12%)
172899
Citigroup Inc., NYSE
C
61.48
-1.01(-1.62%)
184212
Exxon Mobil Corp
XOM
82.25
-0.30(-0.36%)
104866
Facebook, Inc.
FB
148.14
-1.64(-1.09%)
187382
Ford Motor Co.
F
10.91
-0.03(-0.27%)
141269
Freeport-McMoRan Copper & Gold Inc., NYSE
FCX
11.65
-0.12(-1.02%)
45730
General Electric Co
GE
27.81
-0.23(-0.82%)
245786
General Motors Company, NYSE
GM
33.22
-0.20(-0.60%)
40701
Goldman Sachs
GS
221.77
-3.83(-1.70%)
25563
Google Inc.
GOOG
935.51
-7.49(-0.79%)
11312
Home Depot Inc
HD
157.3
-0.96(-0.61%)
31996
Intel Corp
INTC
35.6
-0.22(-0.61%)
119712
International Business Machines Co...
IBM
153.67
-0.01(-0.01%)
24349
Johnson & Johnson
JNJ
126.99
-0.78(-0.61%)
67177
JPMorgan Chase and Co
JPM
86.25
-1.36(-1.55%)
148374
McDonald's Corp
MCD
146.8
-0.49(-0.33%)
20818
Microsoft Corp
MSFT
69
-0.41(-0.59%)
212291
Nike
NKE
52.55
-0.23(-0.44%)
34996
Pfizer Inc
PFE
32.4
-0.20(-0.61%)
149503
Procter & Gamble Co
PG
85.93
-0.31(-0.36%)
60713
Starbucks Corporation, NASDAQ
SBUX
59.75
-0.23(-0.38%)
46812
Tesla Motors, Inc., NASDAQ
TSLA
313.9
-3.11(-0.98%)
31979
The Coca-Cola Co
KO
43.7
-0.15(-0.34%)
99390
Twitter, Inc., NYSE
TWTR
19.14
-0.35(-1.80%)
172129
United Technologies Corp
UTX
120.11
-0.63(-0.52%)
17808
UnitedHealth Group Inc
UNH
167
-1.12(-0.67%)
38170
Verizon Communications Inc
VZ
45.13
-0.18(-0.40%)
121406
Visa
V
92.94
-0.05(-0.05%)
912
Wal-Mart Stores Inc
WMT
75.39
0.28(0.37%)
124689
Walt Disney Co
DIS
105.75
-2.23(-2.07%)
91407
Yahoo! Inc., NASDAQ
YHOO
50.6
-0.36(-0.71%)
23855
Yandex N.V., NASDAQ
YNDX
28.52
-0.47(-1.62%)
5728
-
14:50
Target price changes before the market open
Home Depot (HD) target raised to $175 from $154 at Telsey Advisory Group
-
14:49
Downgrades before the market open
Walt Disney (DIS) downgraded to Neutral from Outperform at Macquarie
-
14:43
Canadian manufacturing sales increased 1.0% to a record $53.9 billion in March
Manufacturing sales increased 1.0% to a record $53.9 billion in March, reflecting higher sales in the transportation equipment and food industries.
Overall, sales were up in 16 of 21 industries, representing 71% of the Canadian manufacturing sector. Sales of durable goods rose 1.3% to $28.4 billion, while sales of non-durable goods increased 0.7% to $25.4 billion.
In constant dollars, manufacturing sales in volume terms rose 0.2%.
Sales in the transportation equipment industry rose 2.1% to $11.1 billion in March, following two months of declines. The increase was the result of gains in the motor vehicle (+4.5%) and the motor vehicle parts (+1.8%) industries, reflecting higher volumes and prices. After removing the effect of price changes, sales in volume terms increased 3.1% and 0.5% respectively in these industries in March.
-
14:30
Canada: Manufacturing Shipments (MoM), March 1% (forecast 0.4%)
-
14:04
Orders
EUR/USD
Offers: 1.1130 1.1150 1.1180 1.1200 1.1260 1.1300
Bids: 1.1080 1.1065 1.1050 1.1030 1.1000 1.10980 1.0960 1.0920 1.0900
GBP/USD
Offers: 1.2935 1.2950 1.2965 1.2980-85 1.3000 1.3020 1.3050
Bids: 1.2900 1.2875-80 1.2850 1.2830 1.2800 1.2785 1.2750
EUR/JPY
Offers: 125.00 125.30 125.50 125.80 126.00 126.50
Bids: 124.60 124.30 124.00 123.80 123.50
EUR/GBP
Offers: 0.8600 0.8620-25 0.8655-60 0.8680 0.8700
Bids: 0.8565 0.8550 0.8535 0.8500-10 0.8480-85 0.8450
USD/JPY
Offers: 112.60 112.80 113.00 113.30 113.60 113.80-85 114.00
Bids: 112.20 112.00 111.80 111.50 111.30 111.00
AUD/USD
Offers: 0.7440 0.7450-55 0.7480 0.7500
Bids: 0.7400 0.7385 0.7370 0.7350 0.7330-35 0.7300
-
13:34
Russia Fin Min suggests cutting 2017 budget deficit by 829 bln roubles to 1.924 trln roubles - RIA cites Fin Min draft
-
12:49
Bank of England says consumer spending growth has moderated in real terms, as spending power has been hit by higher prices - Agents' survey
-
Investment intentions have also edged higher, consistent with modest growth in spending over year ahead
-
-
12:33
British Prime Minister May says decisions about what president Trump discusses with anybody is a matter for Trump
-
Continues to share intelligence with the United States
-
Working with the United State and others on the terrorist threat is important to maintaining national security
-
-
12:32
Real Brexit transition period is now, before withdrawal, and all economic players should prepare - EU's Barnier
-
11:12
Euro area annual inflation was 1.9%, as expected
Euro area annual inflation was 1.9% in April 2017, up from 1.5% in March. In April 2016 the rate was -0.2%. European Union annual inflation was 2.0% in April 2017, up from 1.6% in March. A year earlier the rate was -0.2%. These figures come from Eurostat, the statistical office of the European Union. The lowest annual rates were registered in Romania (0.6%), Ireland (0.7%) and Slovakia (0.8%). The highest annual rates were recorded in Estonia (3.6%), Lithuania (3.5%) and Latvia (3.3%). Compared with March 2017, annual inflation fell in six Member States, remained stable in three and rose in nineteen. The largest upward impacts to euro area annual inflation came from fuels for transport (+0.39 percentage points), package holidays (+0.12 pp) and heating oil (+0.11 pp), while telecommunication (-0.11 pp), garments (-0.08 pp) and bread & cereals (-0.05 pp) had the biggest downward impacts.
-
11:01
Eurozone: Construction Output, y/y, March 3.6%
-
11:00
Eurozone: Harmonized CPI, Y/Y, April 1.9% (forecast 1.9%)
-
11:00
Eurozone: Harmonized CPI, April 0.4% (forecast 0.4%)
-
11:00
Eurozone: Harmonized CPI ex EFAT, Y/Y, April 1.2% (forecast 1.2%)
-
10:35
UK average weekly earnings increased by 2.4% including bonuses
Latest estimates show that average weekly earnings for employees in Great Britain in nominal terms (that is, not adjusted for price inflation) increased by 2.4% including bonuses, and by 2.1% excluding bonuses, compared with a year earlier.
Latest estimates show that average weekly earnings for employees in Great Britain in real terms (that is, adjusted for price inflation) increased by 0.1% including bonuses, but fell by 0.2% excluding bonuses, compared with a year earlier.
-
10:33
UK unemployment rate declined 0.1% to 4.6%, claimant count change weaker than expected
Estimates from the Labour Force Survey show that, between October to December 2016 and January to March 2017, the number of people in work increased, the number of unemployed people fell, and the number of people aged from 16 to 64 not working and not seeking or available to work (economically inactive) also fell.
There were 31.95 million people in work, 122,000 more than for October to December 2016 and 381,000 more than for a year earlier.
The employment rate (the proportion of people aged from 16 to 64 who were in work) was 74.8%, the highest since comparable records began in 1971.
There were 1.54 million unemployed people (people not in work but seeking and available to work), 53,000 fewer than for October to December 2016 and 152,000 fewer than for a year earlier.
The unemployment rate (the proportion of those in work plus those unemployed, that were unemployed) was 4.6%, down from 5.1% for a year earlier and the lowest since 1975.
-
10:30
United Kingdom: ILO Unemployment Rate, March 4.6% (forecast 4.7%)
-
10:30
United Kingdom: Average earnings ex bonuses, 3 m/y, March 2.1% (forecast 2.2%)
-
10:30
United Kingdom: Claimant count , April 19.4 (forecast 7.5)
-
10:30
United Kingdom: Average Earnings, 3m/y , March 2.4% (forecast 2.4%)
-
10:24
Huge rise for Italian trade balance surplus in March
In March 2017 seasonally-adjusted data, compared to February 2017, increased by 4.0% for outgoing flows while they were stationary for incoming flows. Exports increased for both areas: +6.5% for non EU countries and +2.1% for EU countries. The stationary of imports is the result of an increase for non EU countries (+0.4%) and a drop for EU countries (-0.3%). Over the last three months, seasonally-adjusted data, in comparison with the previous three months, showed a growth of 3.0% for exports and of 3.3% for imports.
In March 2017, compared with the same month of the previous year, exports and imports increased (+14.5% and +16.3% respectively). Outgoing flows increased by 14.1% for EU countries and by 15.1% for non EU countries. Incoming flows increased by 14.7% for EU area and by 19.0% for non EU area. The trade balance in March amounted to +5,4 billion Euros (+1,250 million Euros for EU area and +4,168 million Euros for non EU countries).
-
10:04
Forex option contracts rolling off today at 14.00 GMT:
EURUSD: 1.0965 (EUR 650m) 1.1000 (1bln ) 1.1030-35 (898m) 1.1100 (1.2bln) 1.1275 (438m)
USDJPY: 112.90-00 (USD 635m) 113.50 (297m) 114.00 (231m)
EURGBP: 0.8435 (224m) 0.8630 (220m)
AUDUSD: 0.7300 (AUD 412m) 0.7400 (461m) 0.7430-40 (667m) 0.7470 (257m)
USDCAD: 1.3600 (USD 1.2bln) 1.3800 (980m)
EURJPY: 123.50 (EUR 266m)
NZDUSD: 0.7000 (NZD 248m)
-
09:38
Major European stock markets started trading in the red zone: FTSE 7496.78 -25.25 -0.34%, DAX 12713.05 -91.48 -0.71%, CAC 5370.47 -35.63 -0.66%
-
09:31
EU’s Tusk: Must Base Brexit Talks On ‘Phased Approach’ @LiveSquawk
-
08:38
Impressive rally for the Euro as it touches over 6 months high vs USD. First major resistance area seen at 1.14
-
08:36
New Zealand producer output prices rose 1.4 percent in the March quarter
Producer output prices rose 1.4 percent in the March 2017 quarter, while input prices rose 0.8 percent, Stats NZ said today.
In the March quarter, producer output prices were influenced by higher prices received for dairy products, while higher crude oil prices pushed up the input costs at oil refineries.
In the year to the March 2017 quarter, producer output prices increased 4.1 percent, and input prices increased 4.2 percent.
"The prices paid by fuel manufacturers were up 43 percent in the year, mainly due to higher crude oil prices," business prices manager Sarah Williams said. In March 2016, the prices fuel manufacturers paid were at the lowest level since the June 2003 quarter. This industry produces refined fuels that are used by many other industries.
-
08:32
Japan's industrial production declined less than expected in March
Japan's industrial production declined less than initially estimated in March, latest figures from the Ministry of Economy, Trade and Industry, cited by rttnews.
Industrial production fell 1.9 percent month-over-month in March instead of a 2.1 percent decrease reported earlier. In February, production had risen 3.2 percent.
Shipments dropped 0.8 percent over the month, slower than the 1.1 percent decrease seen in the flash data published on April 28. At the same time, inventories grew 1.5 percent, revised down slightly from 1.6 percent.
On a yearly basis, industrial production growth eased to 3.5 percent in March from 4.7 percent in February.
-
08:30
Australian wage price index rose 0.5% in Q1, as expected
The trend and seasonally adjusted indexes for Australia both rose 0.5% in the March quarter 2017. The WPI, seasonally adjusted, has recorded quarterly wages growth in the range of 0.4% to 0.6% for the last twelve quarters (from June quarter 2014).
The Private sector rose 0.5% and the Public sector rose 0.6%, seasonally adjusted.
The rises in indexes at the industry level (in original terms) ranged from 0.1% for Administrative and support services to 0.9% for Education and training.
The trend and seasonally adjusted indexes for Australia both rose 1.9% through the year to the March quarter 2017.
Rises in the original indexes through the year to the March quarter 2017 at the industry level ranged from 0.6% for Mining to 2.3% for Public administration and safety, Education and training and Health care and social assistance.
-
08:29
S&P - Australia ratings affirmed at 'AAA/A-1+'; outlook remains negative
-
Negative outlook on Australia reflects view that if downside risks to government revenue materialize, then budget deficits could persist for several years
-
Potential for wage growth and inflation to remain low remains a downside risk to the government's current projections
-
Expect fiscal deficits to widen again in the next couple of years
-
Continue to think that budget surpluses could remain elusive beyond fiscal 2021
-
Believe that balance of risks to government revenues remains negative
-
-
08:22
Options levels on wednesday, May 17, 2017
EUR/USD
Resistance levels (open interest**, contracts)
$1.1199 (6277)
$1.1159 (7561)
$1.1134 (4107)
Price at time of writing this review: $1.1109
Support levels (open interest**, contracts):
$1.1055 (278)
$1.1013 (335)
$1.0954 (1899)
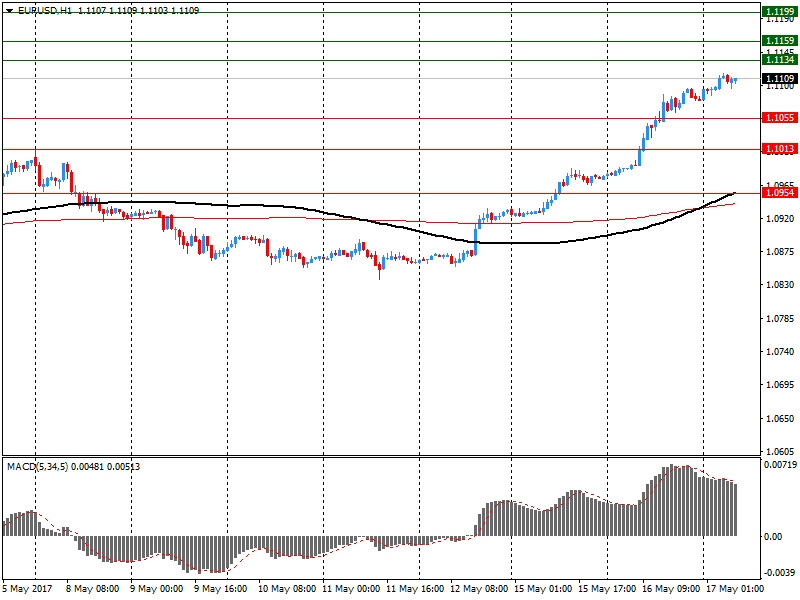
Comments:
- Overall open interest on the CALL options with the expiration date June, 9 is 82289 contracts, with the maximum number of contracts with strike price $1,1000 (7561);
- Overall open interest on the PUT options with the expiration date June, 9 is 91073 contracts, with the maximum number of contracts with strike price $1,0700 (6229);
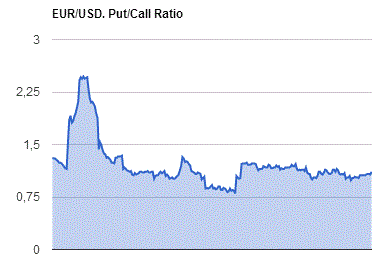
- The ratio of PUT/CALL was 1.11 versus 1.07 from the previous trading day according to data from May, 16
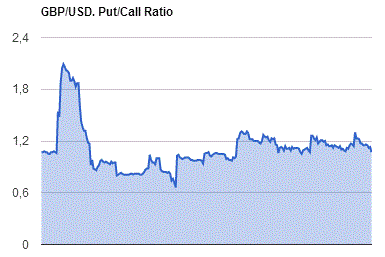
GBP/USD
Resistance levels (open interest**, contracts)
$1.3202 (2317)
$1.3104 (2763)
$1.3007 (3729)
Price at time of writing this review: $1.2934
Support levels (open interest**, contracts):
$1.2892 (1380)
$1.2795 (2207)
$1.2697 (2034)
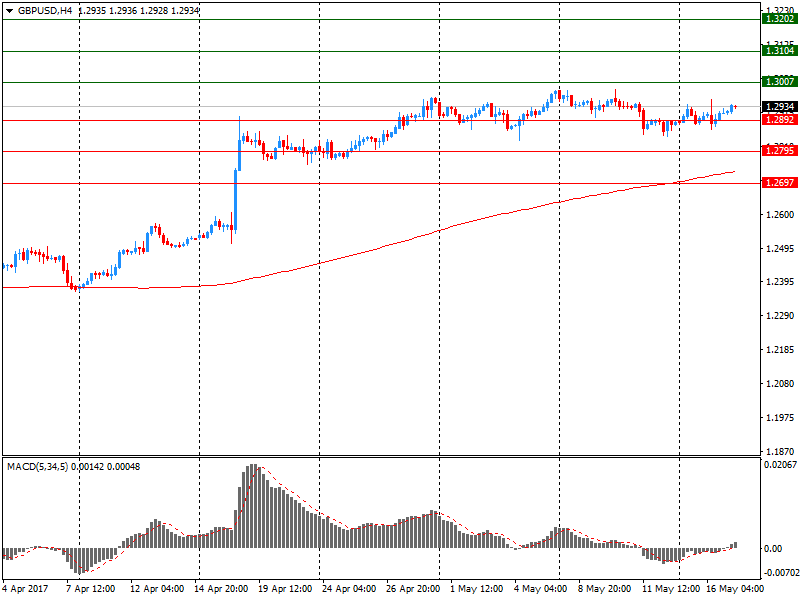
Comments:
- Overall open interest on the CALL options with the expiration date June, 9 is 33821 contracts, with the maximum number of contracts with strike price $1,3000 (3729);
- Overall open interest on the PUT options with the expiration date June, 9 is 35773 contracts, with the maximum number of contracts with strike price $1,1500 (3061);
- The ratio of PUT/CALL was 1.06 versus 1.07 from the previous trading day according to data from May, 16
* - The Chicago Mercantile Exchange bulletin (CME) is used for the calculation.
** - Open interest takes into account the total number of option contracts that are open at the moment.
-
07:33
Global Stocks
European stocks finished slightly lower Tuesday, with declines in automobile shares and a rise in the euro drawing Germany's benchmark down from its previous record. "Markets seem to be enjoying the signs that incumbent governments are set for victory in upcoming elections," said Jasper Lawler, senior market analyst at London Capital Group, in a note.
The S&P 500 index on Tuesday marked its 15th session with a move within 0.5%, representing the longest such streak in about 48 years, according to Dow Jones data. The longest consecutive period of closes within 0.5% for the S&P 500 SPX, -0.07% is a 20-session streak in February 1969. Tuesday's trading come amid heightened doubts that President Donald Trump can easily push through Congress the type of market-friendly policies that have helped so-called risk assets log a series of all-time highs.
A falling U.S. dollar pressured stocks in Japan and cast broader concern over equity markets in the region, as turmoil in Washington continued to raise doubts about the Trump administration's ability to make progress on policy. The WSJ Dollar Index has fallen for five straight sessions, putting it at its lowest level since November. It fell a further 0.1% in Asian trading Wednesday.
-
06:46
Japan: Industrial Production (YoY), March 3.3% (forecast 3.3%)
-
06:32
Japan: Industrial Production (MoM) , March -1.9% (forecast -2.1%)
-
03:30
Australia: Wage Price Index, y/y, Quarter I 1.9% (forecast 1.9%)
-
03:30
Australia: Wage Price Index, q/q, Quarter I 0.5% (forecast 0.5%)
-
02:35
Australia: Westpac Consumer Confidence, May 98
-
01:50
Japan: Core Machinery Orders, March 1.4% (forecast 2.1%)
-
01:50
Japan: Core Machinery Orders, y/y, April -0.7% (forecast 0.6%)
-
00:45
New Zealand: PPI Input (QoQ), Quarter I 0.8%
-
00:45
New Zealand: PPI Output (QoQ) , Quarter I 1.4%
-
00:32
Commodities. Daily history for May 16’2017:
(raw materials / closing price /% change)
Oil 48.23 -0.88%
Gold 1,236.80 +0.03%
-
00:30
Stocks. Daily history for May 16’2017:
(index / closing price / change items /% change)
Nikkei +49.97 19919.82 +0.25%
TOPIX +4.23 1584.23 +0.27%
Hang Seng -35.65 25335.94 -0.14%
CSI 300 +29.46 3428.65 +0.87%
Euro Stoxx 50 +0.01 3641.89 +0.00%
FTSE 100 +67.66 7522.03 +0.91%
DAX -2.51 12804.53 -0.02%
CAC 40 -11.30 5406.10 -0.21%
DJIA -2.19 20979.75 -0.01%
S&P 500 -1.65 2400.67 -0.07%
NASDAQ +20.20 6169.87 +0.33%
S&P/TSX -86.14 15543.33 -0.55%
-
00:29
Currencies. Daily history for May 16’2017:
(pare/closed(GMT +2)/change, %)
EUR/USD $1,1080 +0,93%
GBP/USD $1,2914 +0,14%
USD/CHF Chf0,9857 -1,04%
USD/JPY Y113,09 -0,44%
EUR/JPY Y125,31 +0,49%
GBP/JPY Y146,05 -0,29%
AUD/USD $0,7424 +0,15%
NZD/USD $0,6884 +0,03%
USD/CAD C$1,3606 -0,18%
-