Noticias del mercado
-
23:58
Schedule for today, Wednesday, May 17’2017 (GMT0)
00:30 Australia Westpac Consumer Confidence May 99.0
01:30 Australia Wage Price Index, q/q Quarter I 0.5% 0.5%
01:30 Australia Wage Price Index, y/y Quarter I 1.9% 1.9%
04:30 Japan Industrial Production (MoM) (Finally) March 3.2% -2.1%
04:30 Japan Industrial Production (YoY) (Finally) March 4.7% 3.3%
08:30 United Kingdom Average Earnings, 3m/y March 2.3% 2.4%
08:30 United Kingdom Average earnings ex bonuses, 3 m/y March 2.2% 2.2%
08:30 United Kingdom ILO Unemployment Rate March 4.7% 4.7%
08:30 United Kingdom Claimant count April 25.5 7.5
09:00 Eurozone Construction Output, y/y March 7.1%
09:00 Eurozone Harmonized CPI April 0.8% 0.4%
09:00 Eurozone Harmonized CPI ex EFAT, Y/Y (Finally) April 0.7% 1.2%
09:00 Eurozone Harmonized CPI, Y/Y (Finally) April 1.5% 1.9%
12:30 Canada Manufacturing Shipments (MoM) March -0.2% 0.4%
14:30 U.S. Crude Oil Inventories May -5.247
23:50 Japan GDP, q/q (Preliminary) Quarter I 0.3% 0.4%
23:50 Japan GDP, y/y (Preliminary) Quarter I 1.2% 1.7%
-
22:07
The main US stock indexes completed the session almost unchanged
The main US stock indexes finished trading near zero. The negative impact on the mood of investors was provided by data on the US housing market, as well as reports that Trump could give the Russian Foreign Minister secret information concerning the threat posed by the terrorist organization Islamic State.
As it became known, bookings of new houses in the USA unexpectedly fell in April against the background of a constant decrease in the construction of multi-apartment houses and a modest rebound in one-family projects, which indicates a slowdown in the housing market recovery. The Ministry of Housing reported that bookings of new homes fell 2.6% to 1.17 million (seasonally adjusted). This was the lowest level since November 2016, after a downward revision to the level of 1.20 million in March. Economists predicted that last month's bookmarks rose to 1.26 million units from the previously announced level of 1.22 million units in March.
Meanwhile, the optimism of the market has added data on industrial production. The Federal Reserve said that industrial production in April rose at the fastest monthly pace in more than three years, thanks to the broad achievements in the manufacturing sector. According to the data, the volume of industrial production grew by 1% in April, exceeding the consensus forecast of growth economists by 0.3%. This was the fastest growth rate since February 2014.
The components of the DOW index showed mixed dynamics (15 in positive territory, 15 in negative territory). Most fell shares of UnitedHealth Group Incorporated (UNH, -2.06%). The leader of growth was the shares of International Business Machines Corporation (IBM, + 1.53%).
Most sectors of the S & P index finished trading in the red. The conglomerate sector fell most of all (-1.2%). The leader of growth was the technological sector (+ 0.5%).
At closing:
DJIA -0.01% 20.979.54 -2.40
Nasdaq + 0.33% 6,169.87 +20.20
S & P -0.07% 2,400.64 -1.68
-
21:00
DJIA -0.06% 20,969.64 -12.30 Nasdaq +0.17% 6,159.90 +10.23 S&P -0.16% 2,398.48 -3.84
-
18:00
European stocks closed: FTSE 100 +67.66 7522.03 +0.91% DAX -2.51 12804.53 -0.02% CAC 40 -11.30 5406.10 -0.21%
-
16:34
European official to AP: Country might stop sharing intel with US if Trump gave classified info to Russian diplomats @AP
-
16:18
Greece eyeing july bond if deal reached with lenders, wants to test waters before bailout ends @zerohedge
-
15:46
Option expiries for today's 10:00 ET NY cut
EURUSD: 1.0850 (313m) 1.0880 ( 300m) 1.0900-10 (627m) 1.0920 (552m) 1.0950 (322m)
USDJPY: 112.50 (USD 255m) 112.75 (270m) 113.00 (271m) 113.30 (301m) 114.00 (477m) 114.15-25 (789m)
AUDUSD: 0.7300 (AUD 198m) 0.7400 (176m)
USDCAD: 1.3570 (USD 222m) 1.3650 (270m)
EURJPY: 123.80 (EUR 173m)
-
15:35
U.S. Stocks open: Dow +0.17%, Nasdaq +0.15%, S&P +0.10%
-
15:32
U.S interest rates futures hold at lower levels after U.S industrial output rises more than forecast in April
-
15:28
Before the bell: S&P futures +0.20%, NASDAQ futures +0.21%
U.S. stock-index futures rose moderately as investors paused for a breather a day after the S&P 500 and the Nasdaq closed at record highs. Investors assessed statistics on the U.S. housing market and industrial production.
Stocks:
Nikkei 19,919.82 +49.97 +0.25%
Hang Seng 25,335.94 -35.65 -0.14%
Shanghai 3,113.50 +23.27 +0.75%
S&P/ASX 5,850.52 +12.12 +0.21%
FTSE 7,511.95 +57.58 +0.77%
CAC 5,407.06 -10.34 -0.19%
DAX 12,817.24 +10.20 +0.08%
Crude $49.26 (+0.84%)
Crude $1,235.30 (+0.44%)
-
15:20
US industrial production advanced 1.0% in April
Industrial production advanced 1.0 percent in April for its third consecutive monthly increase and its largest gain since February 2014. Manufacturing output rose 1.0 percent as a result of widespread increases among its major industries.
The indexes for mining and utilities posted gains of 1.2 percent and 0.7 percent, respectively. At 105.1 percent of its 2012 average, total industrial production in April was 2.2 percent above its year-earlier level.
Capacity utilization for the industrial sector increased 0.6 percentage point in April to 76.7 percent, a rate that is 3.2 percentage points below its long-run (1972-2016) average.
-
15:15
US building permits and housing starts declined in April. USD to new lows
Privately-owned housing units authorized by building permits in April were at a seasonally adjusted annual rate of 1,229,000. This is 2.5 percent below the revised March rate of 1,260,000, but is 5.7 percent above the April 2016 rate of 1,163,000. Single-family authorizations in April were at a rate of 789,000; this is 4.5 percent below the revised March figure of 826,000. Authorizations of units in buildings with five units or more were at a rate of 403,000 in April.
Privately-owned housing starts in April were at a seasonally adjusted annual rate of 1,172,000. This is 2.6 percent below the revised March estimate of 1,203,000, but is 0.7 percent above the April 2016 rate of 1,164,000. Single-family housing starts in April were at a rate of 835,000; this is 0.4 percent above the revised March figure of 832,000. The April rate for units in buildings with five units or more was 328,000.
-
15:15
U.S.: Industrial Production (MoM), April 1% (forecast 0.3%)
-
15:15
U.S.: Capacity Utilization, April 76.7% (forecast 76.3%)
-
15:15
U.S.: Industrial Production YoY , April 2.2%
-
15:13
As President I wanted to share with Russia (at an openly scheduled W.H. meeting) which I have the absolute right to do, facts pertaining.... @realDonaldTrump
-
14:53
Wall Street. Stocks before the bell
(company / ticker / price / change ($/%) / volume)
Amazon.com Inc., NASDAQ
AMZN
960.57
2.60(0.27%)
10614
AMERICAN INTERNATIONAL GROUP
AIG
62.87
1.05(1.70%)
3768
Apple Inc.
AAPL
156.18
0.48(0.31%)
79932
AT&T Inc
T
38.6
0.01(0.03%)
1769
Barrick Gold Corporation, NYSE
ABX
17.04
0.14(0.83%)
37648
Caterpillar Inc
CAT
102.7
0.28(0.27%)
1116
Chevron Corp
CVX
107.5
0.65(0.61%)
1635
Cisco Systems Inc
CSCO
34.37
0.14(0.41%)
7045
Citigroup Inc., NYSE
C
61.5
0.08(0.13%)
3953
Exxon Mobil Corp
XOM
83
0.20(0.24%)
3273
Facebook, Inc.
FB
150.4
0.21(0.14%)
60536
Ford Motor Co.
F
11.02
0.08(0.73%)
138116
Freeport-McMoRan Copper & Gold Inc., NYSE
FCX
11.88
0.13(1.11%)
29422
General Motors Company, NYSE
GM
33.85
0.03(0.09%)
6408
Goldman Sachs
GS
225.1
-0.02(-0.01%)
1620
Home Depot Inc
HD
159.36
2.03(1.29%)
123780
Intel Corp
INTC
35.74
0.11(0.31%)
1934
JPMorgan Chase and Co
JPM
87.3
-0.04(-0.05%)
2191
Microsoft Corp
MSFT
68.2
0.16(0.24%)
16175
Nike
NKE
53.5
-0.27(-0.50%)
28935
Pfizer Inc
PFE
32.55
-0.57(-1.72%)
64195
Procter & Gamble Co
PG
86.68
0.35(0.41%)
6597
Starbucks Corporation, NASDAQ
SBUX
60.7
0.25(0.41%)
3289
Tesla Motors, Inc., NASDAQ
TSLA
318
2.12(0.67%)
47290
The Coca-Cola Co
KO
43.94
0.21(0.48%)
128
Twitter, Inc., NYSE
TWTR
19.39
0.16(0.83%)
87227
UnitedHealth Group Inc
UNH
171.02
-0.51(-0.30%)
11888
Verizon Communications Inc
VZ
45.5
0.12(0.26%)
5081
Visa
V
93.3
0.07(0.08%)
1359
Walt Disney Co
DIS
109
-0.13(-0.12%)
2672
Yahoo! Inc., NASDAQ
YHOO
50.09
0.23(0.46%)
302297
Yandex N.V., NASDAQ
YNDX
28.25
-0.65(-2.25%)
25632
-
14:46
Upgrades and downgrades before the market open
Upgrades:
Downgrades:
Pfizer (PFE) downgraded to Sell from Neutral at Citigroup
Other:
NIKE (NKE) initiated with a Buy at Berenberg; target $70
-
14:30
U.S.: Building Permits, April 1229 (forecast 1270)
-
14:30
U.S.: Housing Starts, April 1172 (forecast 1260)
-
14:12
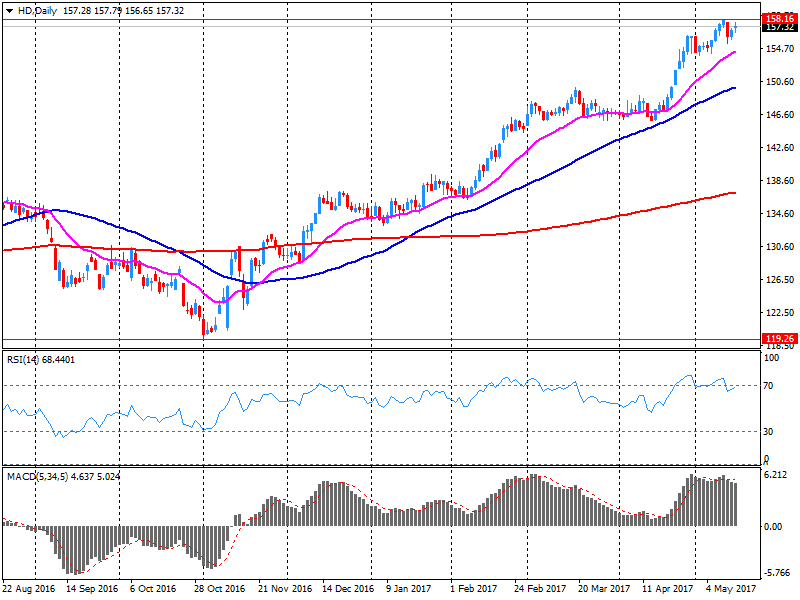
Company News: Home Depot (HD) Q1 EPS beat analysts’ expectations
Home Depot (HD) reported Q1 FY 2017 earnings of $1.67 per share (versus $1.44 in Q1 FY 2016), beating analysts' consensus estimate of $1.61.
The company's quarterly revenues amounted to $23.887 bln (+4.9% y/y), generally in-line with analysts' consensus estimate of $23.738 bln.
HD rose to $159.90 (+1.63%) in pre-market trading.
-
13:59
Orders
EUR/USD
Offers: 1.1035 1.1050 1.1080 1.1100 1.1130 1.1150
Bids: 1.1000 1.10980 1.0960 1.0920 1.0900 1.0880 1.0850
GBP/USD
Offers: 1.2935 1.2950 1.2965 1.2980-85 1.3000 1.3020 1.3050
Bids: 1.2900 1.2875-80 1.2850 1.2830 1.2800 1.2785 1.2750
EUR/JPY
Offers: 125.30 125.50 125.80 126.00 126.50
Bids: 125.00 124.80-85 124.60 124.30 124.00 123.80 123.50
EUR/GBP
Offers: 0.8535 0.8550 0.8585 0.8600 0.8655-60
Bids: 0.8500-10 0.8480-85 0.8450 0.8425 0.8400
USD/JPY
Offers: 13.60 113.80-85 114.00 114.20 114.35 114.50
Bids: 113.20 113.00 112.80 112.45-50 112.00
AUD/USD
Offers: 0.7435 0.7450-55 0.7480 0.7500
Bids: 0.7400 0.7385 0.7370 0.7350 0.7330-35 0.7300
-
12:48
Orders for UK 1.75 pct 2057 conventional gilt exceed 25 bln GBP, price guidance set at 2.5 bps over 4 pct 2060 gilt
-
12:08
Japan PM Abe: Have Consent From US To Proceed With TPP Talks With 11 Nations - Reuters
-
11:29
Euro area trade balance surplus continued to rise
The first estimate for euro area (EA19) exports of goods to the rest of the world in March 2017 was €202.3 billion, an increase of 13% compared with March 2016 (€178.9 bn), says Eurostat. Imports from the rest of the world stood at €171.4 bn, a rise of 14% compared with March 2016 (€150.7 bn).
As a result, the euro area recorded a €30.9 bn surplus in trade in goods with the rest of the world in March 2017, compared with +€28.2 bn in March 2016. Intra-euro area trade rose to €168.1 bn in March 2017, up by 12% compared with March 2016.
-
11:27
GDP rose by 0.5% in both the euro area and the EU28
Seasonally adjusted GDP rose by 0.5% in both the euro area (EA19) and the EU28 during the first quarter of 2017, compared with the previous quarter, according to a flash estimate published by Eurostat, the statistical office of the European Union. In the fourth quarter of 2016, GDP grew by 0.5% and 0.6% respectively. Compared with the same quarter of the previous year, seasonally adjusted GDP rose by 1.7% in the euro area and by 2.0% in the EU28 in the first quarter of 2017, after +1.8% and +1.9% respectively in the previous quarter.
During the first quarter of 2017, GDP in the United States increased by 0.2% compared with the previous quarter (after +0.5% in the fourth quarter of 2016). Compared with the same quarter of the previous year, GDP grew by 1.9% (after +2.0% in the previous quarter).
-
11:26
The assessment of the current situation and the economic sentiment show a positive outlook for the German economic growth - ZEW
The ZEW Indicator of Economic Sentiment for Germany continued to increase in May 2017. Compared to the previous month, it climbed by 1.1 points to a current reading of 20.6 points. The long-term average of 23.9 points has not quite been reached yet. The assessment of the current economic situation in Germany also improved once again in May. The indicator climbed by 3.8 points to 83.9 points. Taken together, the assessment of the current situation and the economic sentiment show a positive outlook for the German economic growth in the coming six months.
"The latest figures on the gross domestic product confirm that the German economy is in good shape. ZEW indicators have been pointing to this trend for some time. The prospects for the eurozone as a whole are gradually improving, further strengthening the economic environment for German exports," comments ZEW President Professor Achim Wambach.
-
11:01
Germany: ZEW Survey - Economic Sentiment, May 20.6 (forecast 22)
-
11:01
Eurozone: ZEW Economic Sentiment, May 35.1 (forecast 29.1)
-
11:00
Eurozone: GDP (YoY), Quarter I 1.7% (forecast 1.7%)
-
11:00
Eurozone: GDP (QoQ), Quarter I 0.5% (forecast 0.5%)
-
11:00
Eurozone: Trade balance unadjusted, March 30.9 (forecast 17.8)
-
10:45
UK factory gate prices have grown for 15 consecutive months to April
Factory gate prices have grown for 15 consecutive months to April 2017 despite raw material costs being relatively flat since January 2017.
The monthly rate of inflation for goods leaving the factory gate (output prices) was unchanged at 0.4% in April 2017, while input prices rose 0.1% following 2 months of no growth.
The annual rate for factory gate price inflation was positive but unchanged at 3.6%, while the annual growth rate for input prices fell back to 16.6% from a peak of 19.9% in January 2017.
Prices for imported materials and fuels rose 14.9% on the year and were lower than overall input costs for the third month in a row following a strengthening in the value of sterling over recent months.
-
10:43
UK house prices grew by 4.1%
UK house prices grew by 4.1% in the year to March 2017, 1.5 percentage points lower than in the year to February 2017.
In terms of housing demand, the Royal Institute of Chartered Surveyors' (RICS) residential market survey for March 2017 reported that housing market activity remained "relatively subdued". New buyer enquiries and agreed sales remain broadly unchanged since the start of the year. This is consistent with UK Property Transaction statistics which showed that in March 2017 the total number of seasonally adjusted property transactions completed in the UK with value of £40,000 or above has remained at a similar level for the last 3 months.
-
10:42
UK inflation rose 0.5% m/m, 2.7% on year, more than expected
The Consumer Prices Index including owner occupiers' housing costs (CPIH, not a National Statistic) 12-month inflation rate was 2.6% in April 2017, up from 2.3% in March.
The rate has been steadily increasing following a period of relatively low inflation in 2015 and is at its highest since June 2013.
Air fares were the main contributors to the increase in the rate in April 2017, although this balanced out a downward effect of similar magnitude in March 2017 and is due to Easter falling later than last year.
Rising prices for clothing, vehicle excise duty and electricity also contributed to the increase in the rate.
These upward contributions were partially offset by a fall in motor fuel prices between March 2017 and April 2017, compared with a rise between the same 2 months a year ago.
The Consumer Prices Index (CPI) 12-month rate was 2.7% in April 2017, up from 2.3% in March.
-
10:30
United Kingdom: HICP, Y/Y, April 2.7% (forecast 2.6%)
-
10:30
United Kingdom: Retail Price Index, m/m, April 0.5% (forecast 0.5%)
-
10:30
United Kingdom: HICP, m/m, April 0.5% (forecast 0.4%)
-
10:30
United Kingdom: Producer Price Index - Output (YoY) , April 3.6% (forecast 3.4%)
-
10:30
United Kingdom: Producer Price Index - Input (YoY) , April 16.6% (forecast 17%)
-
10:30
United Kingdom: Retail prices, Y/Y, April 3.5% (forecast 3.4%)
-
10:30
United Kingdom: Producer Price Index - Output (MoM), April 0.4% (forecast 0.2%)
-
10:30
United Kingdom: HICP ex EFAT, Y/Y, April 2.4% (forecast 2.2%)
-
10:30
United Kingdom: Producer Price Index - Input (MoM), April 0.1% (forecast 0.1%)
-
10:01
Forex option contracts rolling off today at 14.00 GMT:
EURUSD: 1.0850 (313m) 1.0880 ( 300m) 1.0900-10 (627m) 1.0920 (552m) 1.0950 (322m)
USDJPY: 112.50 (USD 255m) 112.75 (270m) 113.00 (271m) 113.30 (301m) 114.00 (477m) 114.15-25 (789m)
AUDUSD: 0.7300 (AUD 198m) 0.7400 (176m)
USDCAD: 1.3570 (USD 222m) 1.3650 (270m)
EURJPY: 123.80 (EUR 173m)
Информационно-аналитический отдел TeleTrade
-
09:51
Major stock exchanges in Europe trading mixed: FTSE 7466.96 +12.59 + 0.17%, DAX 12797.32 -9.72 -0.08%, CAC 5391.88 -25.52 -0.47%
-
09:07
Hungary's Q1 GDP growth 4.1 pct y/y (fcast 3.35 pct), 1.3 pct q/q as industry, construction and services all grow steadily
-
08:55
A standstill for French inflation in April
In April 2017, the Consumer Prices Index (CPI) was at a standstill (+0.1% over a month after +0.6% in March). Seasonally adjusted, it was stable, as in the previous month. Year on year, consumer prices accelerated barely, to +1.2% after +1.1% in the previous month.
Over a month, this marked slowdown came from that, seasonal, of manufactured product prices. Energy and food prices fell again, but less than in the previous month. Contrariwise, services prices accelerated a little, due to a sharp rebound in transport services prices.
In April 2017, manufactured product prices slackened sharply (+0.1% after +2.5%). Year on year, the fall in prices eased again (−0.7% after −1,0% in March and −1.6% in February). Seasonally in April, clothing and footwear prices slowed down (+0.9% after +14.5%; −0.1% year on year). The prices of "other manufactured products" were stable after an increase of 0.6% in the previous month
-
08:50
Moderate start of trading on the main European stock markets is expected: DAX flat, CAC40 flat, FTSE flat
-
08:46
France: CPI, y/y, April 1.2% (forecast 1.2%)
-
08:45
France: CPI, m/m, April 0.1% (forecast 0.1%)
-
08:31
US says President Trump did not discuss intel 'sources, methods' with Russians @AFP
-
08:29
RBA minutes: low wage growth, strong retail competition continue to have "dampening effect" on aggregate inflation
-
March qtr inflation increased confidence in forecasts that core inflation would pick up to around 2 pct by early 2018
-
Developments in labour and housing markets warrant "careful monitoring"
-
Members had in-depth discussion about changes in the composition of employment in recent decades
-
Recent data suggests economy expanded at a "moderate pace" in march quarter
-
Gdp still expected to pick up to be a little above 3 pct by h1 2018 as drag from mining investment wane, resources exports pick up
-
Utilities prices likely to increase in next few qtrs, could see second-round effects on cpi through upward pressure on business costs
-
Housing credit growth continue to outpace income rise, suggesting higher risks associated with household balance sheets
-
-
08:26
S.Korea defence minister says N.Korea missile launch was a success if Pyongyang had been aiming for IRBM development
-
08:25
BoJ Gov Kuroda: Japan's inflation rate is still quite low, our monetary policy is targeted at achieving 2 pct price target at earliest possible time
-
Not too concerned about normalisation of fed policy as it reflects strength of U.S. economy
-
It is well understood, well recognised in global community that free trade is key to global growth
-
If any country introduces protectionist measures, that would hurt that country as well as global growth
-
-
08:17
Options levels on tuesday, May 16, 2017
EUR/USD
Resistance levels (open interest**, contracts)
$1.1081 (7544)
$1.1039 (4162)
$1.1016 (3827)
Price at time of writing this review: $1.0995
Support levels (open interest**, contracts):
$1.0952 (274)
$1.0914 (1945)
$1.0856 (4364)
Comments:
- Overall open interest on the CALL options with the expiration date June, 9 is 84432 contracts, with the maximum number of contracts with strike price $1,1100 (7882);
- Overall open interest on the PUT options with the expiration date June, 9 is 90332 contracts, with the maximum number of contracts with strike price $1,0700 (6149);
- The ratio of PUT/CALL was 1.07 versus 1.08 from the previous trading day according to data from May, 15
GBP/USD
Resistance levels (open interest**, contracts)
$1.3202 (2364)
$1.3103 (2665)
$1.3005 (3733)
Price at time of writing this review: $1.2917
Support levels (open interest**, contracts):
$1.2795 (2185)
$1.2697 (2087)
$1.2598 (1553)
Comments:
- Overall open interest on the CALL options with the expiration date June, 9 is 33494 contracts, with the maximum number of contracts with strike price $1,3000 (3733);
- Overall open interest on the PUT options with the expiration date June, 9 is 35745 contracts, with the maximum number of contracts with strike price $1,1500 (3061);
- The ratio of PUT/CALL was 1.0 versus 1.05 from the previous trading day according to data from May, 15
* - The Chicago Mercantile Exchange bulletin (CME) is used for the calculation.
** - Open interest takes into account the total number of option contracts that are open at the moment.
-
07:40
Global Stocks
European equity-index gauges finished with modest gains Monday, scoring a fillip from commodity shares as oil and metals prices rose. The Stoxx Europe 600 index SXXP, +0.09% ended up 0.1% at 395.97, marking a second straight advance and keeping the index around its highest since August 2015. But the index moved between small gains and losses throughout the session. The oil-and-gas, basic-materials and financial sectors fared the best, but health-care, consumer-related and telecom shares struggled.
The S&P 500 and the Nasdaq Composite closed at fresh records on Monday as a jump in oil prices to a two-week high lifted Wall Street sentiment. The proposed extension still needs to be confirmed when the 13 members of the Organization of the Petroleum Exporting Countries gather for a closely watched meeting in Vienna on May 25.
Stock markets across Asia-Pacific lacked direction early Tuesday, with gains for regional energy and mining firms thanks to a jump in commodity prices, while Chinese markets again succumbed to selling pressure.
-
06:32
Japan: Tertiary Industry Index , March -0.2% (forecast 0.1%)
-
03:30
Australia: New Motor Vehicle Sales (MoM) , April 0.3%
-
03:30
Australia: New Motor Vehicle Sales (YoY) , April 0.1%
-
00:29
Commodities. Daily history for May 15’2017:
(raw materials / closing price /% change)
Oil 48.82 -0.06%
Gold 1,230.50 +0.04%
-
00:29
Stocks. Daily history for May 15’2017:
(index / closing price / change items /% change)
Nikkei -14.05 19869.85 -0.07%
TOPIX -0.71 1580.00 -0.04%
Hang Seng +215.25 25371.59 +0.86%
CSI 300 +13.81 3399.19 +0.41%
Euro Stoxx 50 +4.36 3641.88 +0.12%
FTSE 100 +18.98 7454.37 +0.26%
DAX +36.63 12807.04 +0.29%
CAC 40 +11.98 5417.40 +0.22%
DJIA +85.33 20981.94 +0.41%
S&P 500 +11.42 2402.32 +0.48%
NASDAQ +28.44 6149.68 +0.46%
S&P/TSX +91.59 15629.47 +0.59%
-
00:28
Currencies. Daily history for May 15’2017:
(pare/closed(GMT +2)/change, %)
EUR/USD $1,0977 +0,42%
GBP/USD $1,2896 +0,09%
USD/CHF Chf0,996 -0,50%
USD/JPY Y113,59 +0,22%
EUR/JPY Y124,70 +0,64%
GBP/JPY Y146,48 +0,30%
AUD/USD $0,7413 +0,36%
NZD/USD $0,6882 +0,38%
USD/CAD C$1,3631 -0,59%
-