Noticias del mercado
-
22:07
Major US stock indexes completed the session in different directions
The main US stock indexes finished trading without a single dynamic amid weak revenues of large banks and failures in the legislative agenda of President Donald Trump after the Republicans' efforts to review the health care system failed.
Meanwhile, the US Bureau of Labor Statistics said that in June, import prices fell by 0.2% after a decrease of 0.1% in May. Lower fuel prices led to a decline in June, which more than offset the increase in prices for non-fuel products. The US export price index fell 0.2% in June after a 0.5% decrease in May.
In addition, the confidence of builders in the market of newly built single-family houses fell by two points in July to a level of 64 from the revised June index of the index of the National Association of House Builders (HMI). This is the lowest since November 2016. All three components of the HMI recorded losses in July, but are still on solid territory. The component measuring current sales conditions fell by 2 points to 70, and the sales forecast index in the next six months decreased by 2 points to 73. The component measuring consumer traffic decreased by 1 point to 48.
Oil prices rose by almost 1%, as increased demand absorbed some of the surplus supplies of OPEC and the United States. Support for oil was also provided by the general weakness of the dollar.
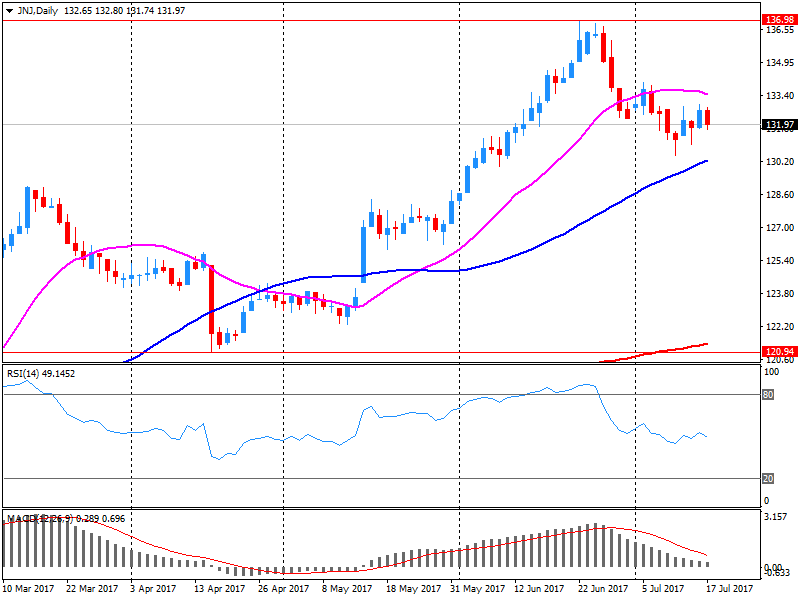
Most components of the DOW index recorded a decline (19 out of 30). Outsider were the shares of The Goldman Sachs Group, Inc. (GS, -2.62%). The leader of growth was the shares of Johnson & Johnson (JNJ, + 1.98%).
Most sectors of the S & P index showed an increase. The utilities sector grew most (+ 0.3%). The greatest decrease was shown by the sector of conglomerates (-0.6%).
At closing:
DJIA -0.25% 21.576.03 -53.69
Nasdaq + 0.47% 6.334.31 +29.88
S & P + 0.06% 2.460.65 +1.51
-
22:01
U.S.: Net Long-term TIC Flows , May 91.9 (forecast 20.3)
-
22:00
U.S.: Total Net TIC Flows, May 57.3
-
20:57
DJIA -0.29% 21,566.72 -63.00 Nasdaq +0.37% 6,337.90 +23.47 S&P -0.02% 2,458.54 -0.60
-
18:00
European stocks closed: FTSE 100 -13.91 7390.22 -0.19% DAX -156.77 12430.39 -1.25% CAC 40 -56.90 5173.27 -1.09%
-
16:05
Builder confidence in the US housing market slipped two points in July to a level of 64 - NAHB
Builder confidence in the market for newly-built single-family homes slipped two points in July to a level of 64 from a downwardly revised June reading on the National Association of Home Builders/Wells Fargo Housing Market Index (HMI). It is the lowest reading since November 2016.
"Our members are telling us they are growing increasingly concerned over rising material prices, particularly lumber," said NAHB Chairman Granger MacDonald, a home builder and developer from Kerrville, Texas. "This is hurting housing affordability even as consumer interest in the new-home market remains strong."
"The HMI measure of current sales conditions has been at 70 or higher for eight straight months, indicating strong demand for new homes," said NAHB Chief Economist Robert Dietz. "However, builders will need to manage some increasing supply-side costs to keep home prices competitive."
-
16:03
Euro hits more than one-year high vs U.S. dollar of $1.1582 after weaker-than-expected U.S. July NAHB housing market index data
-
16:00
U.S.: NAHB Housing Market Index, July 64 (forecast 67)
-
15:50
Option expiries for today's 10:00 ET NY cut
EURUSD: 1.1500 (EUR 345m) 1.1530 (275m)
USDJPY: 111.90-112.00 (USD 630m) 112.25 (850m) 112.50 (220m)
GBPUSD: 1.3050 (GBP 320m) 1.3100 (375m)
USDCHF: 0.9730 (USD 400m)
NZD USD: 0.7275 (NZD 280m) 0.7300 (210m)
-
15:49
Italy economy minister says Veneto banks resolution suggests state-managed liquidation should be available to other banks
-
15:32
U.S. Stocks open: Dow -0.28%, Nasdaq -0.19%, S&P -0.20%
-
15:23
Before the bell: S&P futures -0.22%, NASDAQ futures -0.30%
U.S. stock-index futures fell amid mixed earnings reports and concerns over the U.S. President Donald Trump's ability to implement his campaign pledges.
Global Stocks:
Nikkei 19,999.91 -118.95 -0.59%
Hang Seng 26,524.94 +54.36 +0.21%
Shanghai 3,186.93 +10.47 +0.33%
S&P/ASX 5,687.39 -68.08 -1.18%
FTSE 7,416.66 +38.27 +0.52%
CAC 5,185.29 -44.88 -0.86%
DAX 12,417.00 -170.16 -1.35%
Crude $46.72 (+1.52%)
Gold $1,238.40 (+0.38%)
-
14:51
Wall Street. Stocks before the bell
(company / ticker / price / change ($/%) / volume)
3M Co
MMM
210.99
-0.69(-0.33%)
320
ALTRIA GROUP INC.
MO
73.2
-0.17(-0.23%)
373
Amazon.com Inc., NASDAQ
AMZN
1,005.10
-4.94(-0.49%)
28093
Apple Inc.
AAPL
149.05
-0.51(-0.34%)
74367
AT&T Inc
T
36.4
0.01(0.03%)
4115
Barrick Gold Corporation, NYSE
ABX
16.28
0.20(1.24%)
13277
Caterpillar Inc
CAT
108.25
0.19(0.18%)
865
Chevron Corp
CVX
104.8
0.59(0.57%)
4041
Cisco Systems Inc
CSCO
31.53
0.03(0.10%)
1525
Citigroup Inc., NYSE
C
66.48
-0.35(-0.52%)
15762
Deere & Company, NYSE
DE
125.91
0.03(0.02%)
2583
Exxon Mobil Corp
XOM
81.1
0.24(0.30%)
1080
Facebook, Inc.
FB
159.87
0.14(0.09%)
58177
Freeport-McMoRan Copper & Gold Inc., NYSE
FCX
13.05
0.05(0.38%)
18960
General Electric Co
GE
26.81
-0.01(-0.04%)
7450
Goldman Sachs
GS
226.55
-2.71(-1.18%)
115471
Google Inc.
GOOG
954.99
1.57(0.16%)
1731
Home Depot Inc
HD
154.03
0.14(0.09%)
295
Intel Corp
INTC
34.37
-0.10(-0.29%)
521
International Business Machines Co...
IBM
153.1
0.09(0.06%)
2352
Johnson & Johnson
JNJ
132.92
0.77(0.58%)
64420
JPMorgan Chase and Co
JPM
90.87
-0.52(-0.57%)
13932
Microsoft Corp
MSFT
73.4
0.05(0.07%)
46429
Procter & Gamble Co
PG
87.57
0.02(0.02%)
569
Starbucks Corporation, NASDAQ
SBUX
58.35
0.02(0.03%)
1730
Tesla Motors, Inc., NASDAQ
TSLA
318.82
-0.75(-0.23%)
25803
The Coca-Cola Co
KO
44.81
0.08(0.18%)
4222
Twitter, Inc., NYSE
TWTR
19.85
-0.09(-0.45%)
33231
UnitedHealth Group Inc
UNH
186.75
0.40(0.21%)
10299
Verizon Communications Inc
VZ
43.75
0.09(0.21%)
919
Visa
V
97
0.17(0.18%)
13641
Wal-Mart Stores Inc
WMT
76.35
-0.02(-0.03%)
747
Walt Disney Co
DIS
104.7
-0.09(-0.09%)
902
Yandex N.V., NASDAQ
YNDX
31.47
0.13(0.41%)
3011
-
14:44
Target price changes before the market open
Visa (V) target raised to $112 from $104 at Jefferies
-
14:38
US export and import prices declined in June
U.S. import prices declined 0.2 percent in June, the U.S. Bureau of Labor Statistics reported today, after a 0.1-percent decrease in May. Lower fuel prices drove the drop in June, which more than offset higher nonfuel prices. The price index for U.S. exports fell 0.2 percent in June following a 0.5-percent decline in May.
The price index for fuel imports fell for a fourth consecutive month, declining 2.1 percent in June, after decreasing 4.6 percent over the previous 3 months. The main contributor to the drop was a 2.2-percent decline in petroleum prices. Natural gas prices also fell in June, decreasing 1.0 percent. Despite the
recent drops, import fuel prices advanced 6.3 percent over the 12-month period ended in June. The import price index for petroleum increased 4.5 percent over the past year and natural gas prices rose 58.6 percent.Prices for U.S. exports fell for a second consecutive month in June, declining 0.2 percent. Falling prices for agricultural exports drove the decrease as nonagricultural export prices recorded no change. U.S. export prices increased over the past year, advancing 0.6 percent. The price index for U.S. exports has not recorded a 12-month decline since a 0.2-percent fall in November.
-
14:30
U.S.: Import Price Index, June -0.2% (forecast -0.2%)
-
14:13
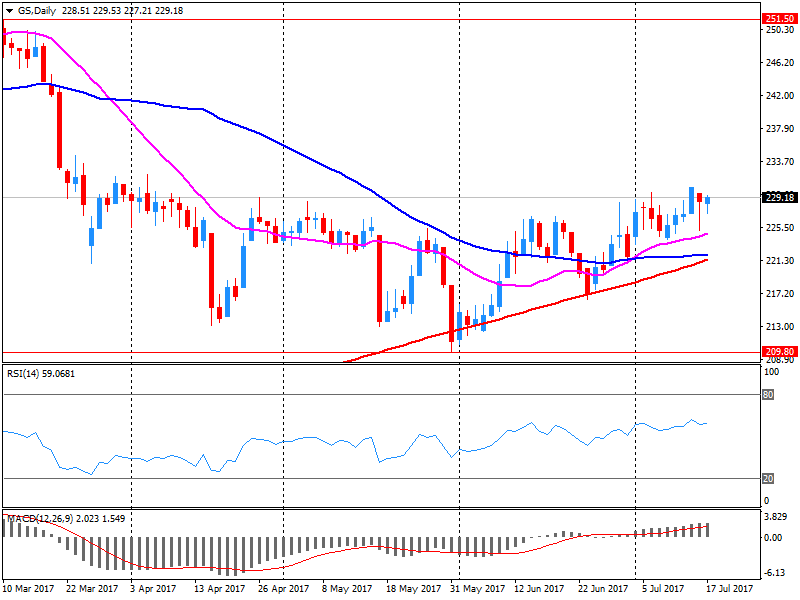
Company News: Goldman Sachs (GS) Q2 results beat analysts’ forecasts
Goldman Sachs (GS) reported Q2 FY 2017 earnings of $3.95 per share (versus $3.72 in Q2 FY 2016), beating analysts' consensus estimate of $3.39.
The company's quarterly revenues amounted to $7.887 bln (-0.6% y/y), beating analysts' consensus estimate of $7.475 bln.
GS fell to $227.01 (-0.98%) in pre-market trading.
-
14:11
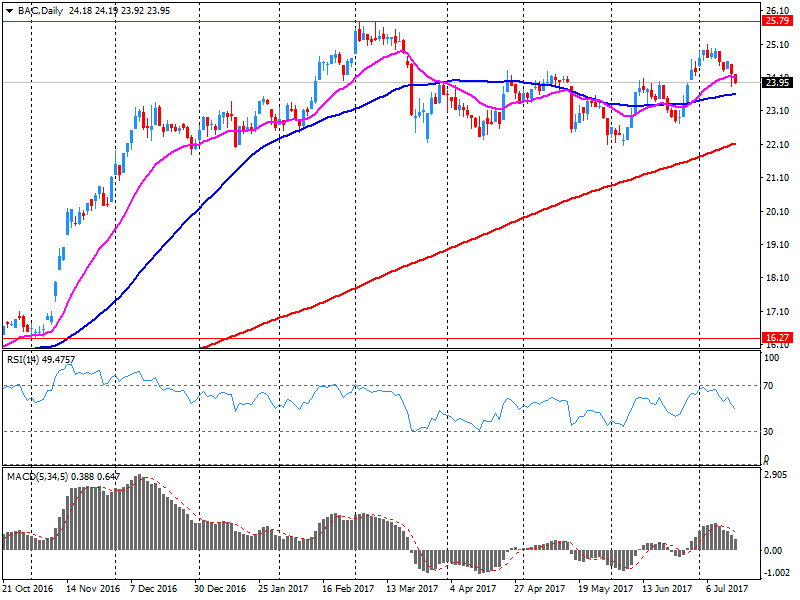
Company News: Bank of America (BAC) Q2 results beat analysts’ expectations
Bank of America (BAC) reported Q2 FY 2017 earnings of $0.46 per share (versus $0.36 in Q2 FY 2016), beating analysts' consensus estimate of $0.44.
The company's quarterly revenues amounted to $22.800 bln (+7.1% y/y), beating analysts' consensus estimate of $21.838 bln.
BAC fell to $23.80 (-0.92%) in pre-market trading.
-
14:07
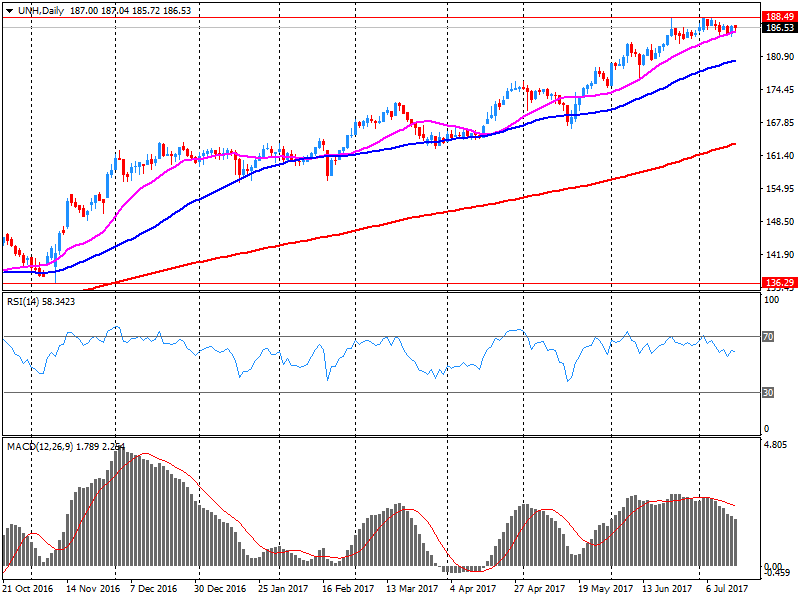
Company News: UnitedHealth (UNH) Q2 EPS beat analysts’ forecast
UnitedHealth (UNH) reported Q2 FY 2017 earnings of $2.46 per share (versus $1.96 in Q2 FY 2016), beating analysts' consensus estimate of $2.38.
The company's quarterly revenues amounted to $50.053 bln (+7.7% y/y), generally in-line with analysts' consensus estimate of $49.973 bln.
The company also improved guidance for FY 2017, projecting EPS of $9.75-9.90 compared to prior $9.65-9.85 and analysts' consensus estimate of $9.80.
UNH rose to $186.50 (+0.08%) in pre-market trading.
-
14:05
Company News: Johnson & Johnson (JNJ) Q2 EPS beat analysts’ estimate
Johnson & Johnson (JNJ) reported Q2 FY 2017 earnings of $1.83 per share (versus $1.74 in Q2 FY 2016), beating analysts' consensus estimate of $1.79.
The company's quarterly revenues amounted to $18.839 bln (+1.9% y/y), generally in-line with analysts' consensus estimate of $18.942 bln.
The company also issued upside guidance for FY 2017, raising EPS forecast to $7.12-7.22 from $7.00-7.15, (versus analysts' consensus estimate of $7.11) and revenues expectations to $75.8-76.1 bln from $75.4-76.1 bln (versus analysts' consensus estimate of $75.65 bln).
JNJ rose to $133.51 (+1.03%) in pre-market trading.
-
13:54
Saudis Considering Further 1m B/D Export Cut: Consultant PPI via BBG @zerohedge
-
13:07
Republican-led U.S. House budget panel unveils fiscal 2018 budget plan with reconciliation instructions for tax reform
-
Budget plan sets path for partisan repeal of Dodd-Frank Wall St. reforms
-
Includes $4.02 trillion in outlays for 2018, including $621.5 billion for defense and $511 billion in nondefense discretionary spending
-
Seeks $203 billion in savings over a decade from mandatory programs including welfare, food stamps
-
-
12:08
UK 5-year gilt yield falls to lowest since june 28 after weaker-than-expected CPI data, now down 2 bps on day at 0.64 pct
-
11:28
The ZEW Indicator of Economic Sentiment for Germany fell slightly by 1.1 points in July
The ZEW Indicator of Economic Sentiment for Germany fell slightly by 1.1 points in July 2017 and now stands at 17.5 points. The indicator thus still remains below the long-term average of 23.8 points. The assessment of the current economic situation in Germany decreased by 1.6 points in July.
The corresponding indicator, however, still remains at a fairly high level of 86.4 points. "Our overall assessment of the economic development in Germany remains unchanged compared to the previous month. The outlook for the German economic growth in the coming six months continues to be positive. This is now also reflected in the survey results for the eurozone," comments ZEW President Professor Achim Wambach, PhD.
-
11:00
Eurozone: ZEW Economic Sentiment, July 35.6 (forecast 37.2)
-
11:00
Germany: ZEW Survey - Economic Sentiment, July 17.5 (forecast 18)
-
10:43
UK house prices grew by 4.7% in the year to May
UK house prices grew by 4.7% in the year to May 2017, 0.6 percentage points lower than in the year to April 2017. While the annual growth rate has slowed since mid-2016 it has remained broadly around 5% during 2017.
In terms of housing demand the Royal Institute of Chartered Surveyors' (RICS) residential market survey for May 2017 reported that price expectations remain moderately positive while new buyer enquiries decreased over the month.
The UK Property Transaction statistics showed that in May 2017 the number of seasonally adjusted property transactions completed in the UK with a value of £40,000 or above increased by 13.4% compared to May 2016. The unusually low level of transactions in May 2016 was associated with the introduction of thehigher tax rates on additional propertiesintroduced from 1 April 2016. Comparing May 2017 to April 2017, property transactions fell by 3.3%.
Looking closer at the regional level of the UK, the East of England showed the highest annual growth, with prices increasing by 7.5% in the year to May 2017. This was followed by the East Midlands at 7.2%. The lowest annual growth was in the North East, where prices increased by 1.6% over the year, followed by London at 3.0%.
-
10:35
UK producer price inflation mixed in June
The annual rate of inflation for goods leaving the factory gate slowed for the second time this year in June and follows a steep decline in input price inflation since January 2017.
Factory gate prices (output prices) rose 3.3% on the year to June 2017 from 3.6% in May 2017, which is the slowest rate prices have increased since December 2016.
Input prices rose 9.9% on the year to June 2017 from 12.1% in May 2017, meaning the annual rate has fallen 10 percentage points since January 2017.
Inputs of crude oil is the main driver of the recent slowing of input price inflation as annual price growth for crude oil fell from 88.9% in February 2017 to 9.1% in June 2017.
Core output inflation rose 2.9% on the year to June 2017 from 2.8% in May 2017 and is now the largest contributor to the annual rate of inflation for goods leaving the factory gate.
-
10:33
UK CPI flat in June
The Consumer Prices Index including owner occupiers' housing costs (CPIH, not a National Statistic) 12-month inflation rate was 2.6% in June 2017, down from 2.7% in May 2017.
This is the first fall in the CPIH inflation rate since April 2016, although it remains higher than in recent years.
Falling prices for motor fuels and certain recreational and cultural goods and services were the main contributors to the fall in the rate.
These downward contributions were partially offset by rising prices for furniture and furnishings.
The Consumer Prices Index (CPI) 12-month rate was 2.6% in June 2017, down from 2.9% in May 2017.
-
10:32
United Kingdom: Producer Price Index - Output (YoY) , June 3.3% (forecast 3.3%)
-
10:31
United Kingdom: Producer Price Index - Output (MoM), June 0.0% (forecast 0.0%)
-
10:31
United Kingdom: Retail Price Index, m/m, June 0.2% (forecast 0.3%)
-
10:31
United Kingdom: Retail prices, Y/Y, June 3.5% (forecast 3.7%)
-
10:31
United Kingdom: Producer Price Index - Input (MoM), June -0.4% (forecast -1%)
-
10:31
United Kingdom: Producer Price Index - Input (YoY) , June 9.9% (forecast 8.7%)
-
10:31
United Kingdom: HICP ex EFAT, Y/Y, June 2.4% (forecast 2.6%)
-
10:30
United Kingdom: HICP, m/m, June 0.0% (forecast 0.2%)
-
10:30
United Kingdom: HICP, Y/Y, June 2.6% (forecast 2.9%)
-
10:00
Minutes - Swedish Central Bank's Ingves says a rapid krona appreciation, as a result of, for example, changes to monetary policy in the major currency areas, poses a risk that requires vigilance
-
Jansson says if the ECB continues to buy more assets next year, a scenario expected on the financial markets, it will probably be very difficult for the Riksbank to stop new purchases altogether already at the turn of the year
-
-
09:51
Major stock markets in Europe trading in the red zone: FTSE 7382.28 -21.85 -0.30%, DAX 12540.43 -46.73 -0.37%, CAC 5213.30 -16.87
-
09:30
German 10-year bond yields briefly touch highest level since jan 2016 at 0.589 pct
-
08:36
Options levels on tuesday, July 18, 2017
EUR/USD
Resistance levels (open interest**, contracts)
$1.1579 (5243)
$1.1558 (2744)
$1.1543 (1514)
Price at time of writing this review: $1.1519
Support levels (open interest**, contracts):
$1.1480 (60)
$1.1463 (250)
$1.1439 (773)
Comments:
- Overall open interest on the CALL options and PUT options with the expiration date August, 4 is 65415 contracts (according to data from July, 17) with the maximum number of contracts with strike price $1,1500 (5243);
GBP/USD
Resistance levels (open interest**, contracts)
$1.3241 (2271)
$1.3179 (3029)
$1.3136 (2221)
Price at time of writing this review: $1.3099
Support levels (open interest**, contracts):
$1.3025 (543)
$1.2978 (353)
$1.2946 (377)
Comments:
- Overall open interest on the CALL options with the expiration date August, 4 is 26479 contracts, with the maximum number of contracts with strike price $1,3100 (3029);
- Overall open interest on the PUT options with the expiration date August, 4 is 24711 contracts, with the maximum number of contracts with strike price $1,2800 (3056);
- The ratio of PUT/CALL was 0.93 versus 0.94 from the previous trading day according to data from July, 17
* - The Chicago Mercantile Exchange bulletin (CME) is used for the calculation.
** - Open interest takes into account the total number of option contracts that are open at the moment.
-
08:32
Negative start of trading expected on the main European stock markets: DAX -0.2%, CAC 40 -0.1%, FTSE 100 flat
-
08:15
Republican Sen. Mike Lee and Jerry Moran announce opposition to health care bill, dealing blow to GOP hopes @AP
-
08:08
RBA minutes: jobs data positive, provided further confirmation of improvement in labour market
-
Data suggest gdp growth increased in q2, household consumption picked up
-
Underemployment still elevated, wage pressures subdued
-
Recent rise in employment to support household incomes, spending
-
Fiscal policy to be more expansionary in 2017/18 than previously expected
-
Too early for tighter lending rules to have full effect on housing market
-
Stronger infrastructure spending to have significant positive spillovers to economy
-
Repeats a rising AUD would complicate economic rebalancing
-
-
08:05
Powerful 7.4-magnitude earthquake strikes the Bering Sea between American and Russian islands; no tsunami threat - USGS
-
08:02
New Zealand CPI was flat overall at 0.0% in Q2
Quarterly change:
In the June 2017 quarter compared with the March 2017 quarter:
The consumers price index (CPI) was flat overall at 0.0 percent (down 0.1 percent with seasonal adjustment).
Food prices rose 0.7 percent, influenced by higher prices for vegetables (up 19 percent).
Housing and household utilities prices rose 0.8 percent, influenced by purchase of new housing (up 1.8 percent).
Transport prices fell 1.3 percent, with cheaper domestic airfares (down 15 percent).
Annual change:
From the June 2016 quarter to the June 2017 quarter:
The CPI inflation rate was 1.7 percent.
Housing and household utilities increased 3.1 percent, with purchase of new housing up 6.4 percent.
Communication prices decreased 4.6 percent, with large decreases for telecommunications services and equipment.
Tradable prices increased 0.9 percent, while prices for non-tradables increased 2.4 percent.
The average price of 1 litre of 91 octane petrol was $1.86 in the June 2017 quarter, down from $1.90 in the March 2017 quarter, and up from $1.78 in the June 2016 quarter.
-
07:59
Trump urges republicans in U.S. Congress to pass repeal of Obamacare healthcare law and work on replacement legislation - Twitter
-
07:58
U.S. 10-year treasuries yield at 2.305 percent vs U.S. close of 2.309 percent on Monday
-
07:37
Global Stocks
Stocks in Europe broadly logged a steady finish Monday, with mining shares bumped higher after China's quarterly growth figures topped expectations.
U.S. stocks finished little changed Monday, after a session of struggling to push higher only to fall short of records, as investors looked toward key quarterly results that will be released this week to set the tone.
Asian shares were broadly weaker Tuesday, with Chinese stocks stabilizing after Monday's slump and Japanese stocks falling in reaction to the dollar's weakness. Tokyo investors returned from their Monday holiday and sold shares in reaction to the slide in the dollar on Friday after disappointing U.S. economic data added to skepticism about more Federal Reserve rate increases this year.
-
03:31
Australia: New Motor Vehicle Sales (MoM) , June 1.2%
-
03:31
Australia: New Motor Vehicle Sales (YoY) , June 3.6%
-
00:46
New Zealand: CPI, y/y, Quarter II 1.7% (forecast 1.9%)
-
00:45
New Zealand: CPI, q/q , Quarter II 0.0% (forecast 0.2%)
-
00:19
Commodities. Daily history for Jul 17’2017:
(raw materials / closing price /% change)
Oil 46.00 -0.04%
Gold 1,233.20 -0.04%
-
00:17
Stocks. Daily history for Jul 17’2017:
(index / closing price / change items /% change)
Nikkei +19.05 20118.86 +0.09%
TOPIX +6.37 1625.48 +0.39%
Hang Seng +81.35 26470.58 +0.31%
CSI 300 -39.53 3663.56 -1.07%
Euro Stoxx 50 -9.59 3516.35 -0.27%
FTSE 100 +25.74 7404.13 +0.35%
DAX -44.56 12587.16 -0.35%
CAC 40 -5.14 5230.17 -0.10%
DJIA -8.02 21629.72 -0.04%
S&P 500 -0.13 2459.14 -0.01%
NASDAQ +1.97 6314.43 +0.03%
S&P/TSX -9.45 15165.36 -0.06%
-
00:17
Currencies. Daily history for Jul 17’2017:
(pare/closed(GMT +2)/change, %)
EUR/USD $1,1477 +0,09%
GBP/USD $1,3054 -0,36%
USD/CHF Chf0,96227 -0,12%
USD/JPY Y112,62 +0,08%
EUR/JPY Y129,27 +0,18%
GBP/JPY Y147,032 -0,27%
AUD/USD $0,7794 -0,41%
NZD/USD $0,7319 -0,37%
USD/CAD C$1,26959 +0,38%
-