Notícias do Mercado
-
23:58
Japan's Kato: Country not using foreign exchange policy to weaken Yen
Japan's Finance Minister, Katsunobu Kato, said early Tuesday that the country is not devaluing the Japanese Yen.
Key quotes
Japan is not pursuing a policy of devaluaing the Yen.
I have confirmed with US Treasury Secretary Bessent our basic stance on forex.
I won't comment on foreign leaders have to say.Market reaction
At the press time, the USD/JPY pair is down 0.12% on the day to trade at 149.25.
Japanese Yen FAQs
The Japanese Yen (JPY) is one of the world’s most traded currencies. Its value is broadly determined by the performance of the Japanese economy, but more specifically by the Bank of Japan’s policy, the differential between Japanese and US bond yields, or risk sentiment among traders, among other factors.
One of the Bank of Japan’s mandates is currency control, so its moves are key for the Yen. The BoJ has directly intervened in currency markets sometimes, generally to lower the value of the Yen, although it refrains from doing it often due to political concerns of its main trading partners. The BoJ ultra-loose monetary policy between 2013 and 2024 caused the Yen to depreciate against its main currency peers due to an increasing policy divergence between the Bank of Japan and other main central banks. More recently, the gradually unwinding of this ultra-loose policy has given some support to the Yen.
Over the last decade, the BoJ’s stance of sticking to ultra-loose monetary policy has led to a widening policy divergence with other central banks, particularly with the US Federal Reserve. This supported a widening of the differential between the 10-year US and Japanese bonds, which favored the US Dollar against the Japanese Yen. The BoJ decision in 2024 to gradually abandon the ultra-loose policy, coupled with interest-rate cuts in other major central banks, is narrowing this differential.
The Japanese Yen is often seen as a safe-haven investment. This means that in times of market stress, investors are more likely to put their money in the Japanese currency due to its supposed reliability and stability. Turbulent times are likely to strengthen the Yen’s value against other currencies seen as more risky to invest in.
-
23:56
GBP/USD rallies on a moment of Greenback weakness, but tensions remains high
- GBP/USD rose nearly a full percent on Monday.
- US President Donald Trump continues to explore tariff threats, but lacks action.
- ANother NFP Friday looms ahead as markets hope for more tariff walkbacks.
GBP/USD rose on Monday, buoyed by a broadly-underbid US Dollar and a latent recovery in Pound Sterling flows. The pair is knocking back into the 1.2700 handle, with price action continuing to get mired in the 200-day Exponential Moving Average (EMA).
US President Donald Trump reiterated his threats to impose a 25% tariff package on Canada and Mexico on Monday, which are set to automatically go into effect at midnight EST Tuesday morning. Markets have gotten used to President Trump kicking the can on his own policy threats since taking office in January, but this time may turn out to be different and general market sentiment is wobbling.
Data remains limited this week on the UK side of the economic data docket, leaving markets to toil under the burden of tariff threats, as well as a looming Friday Nonfarm Payrolls (NFP) print due at the end of the week.
Trader confidence in the US economy has grown shaky quite quickly, and investors will be watching this week’s NFP jobs print with a keen eye. However, a smattering of Federal Reserve (Fed) policymakers will be making public appearances throughout the week, and US ISM Services Purchasing Managers Index (PMI) Services figures are due on Wednesday. According to a sampling of key business operators, business activity expectations for March shrank slightly, with the ISM Manufacturing PMI falling to 50.3. The economic indicator is still holding above the key 50.0 level that typically separates contraction versus expansion expectations, but the one-month fall from February’s 50.9 accelerated through median market forecasts of a slight trim to 50.5.
GBP/USD price forecast
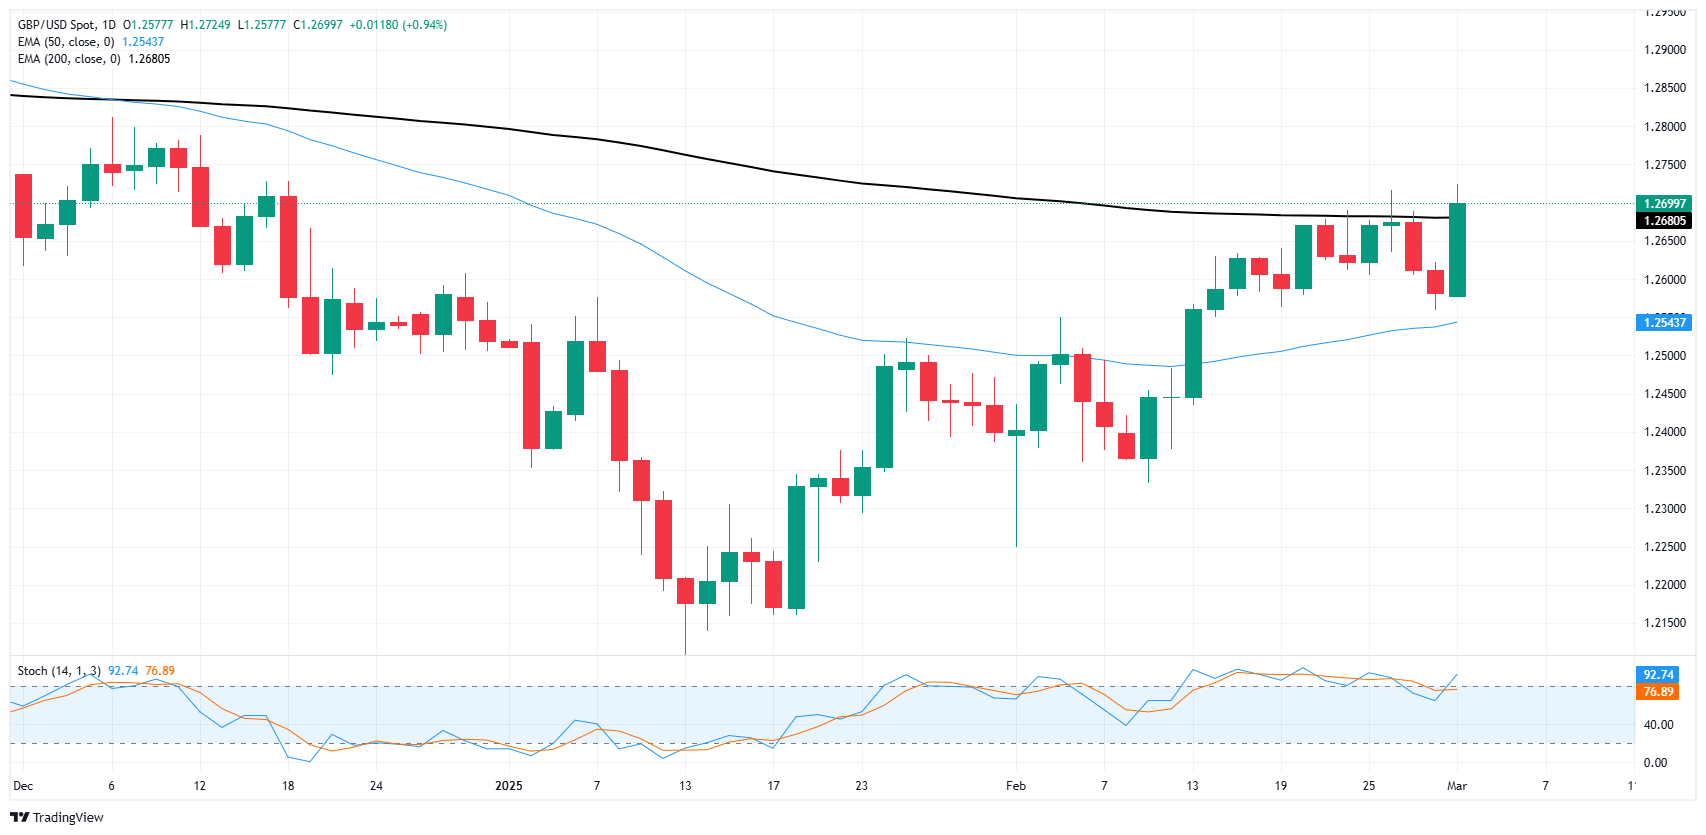
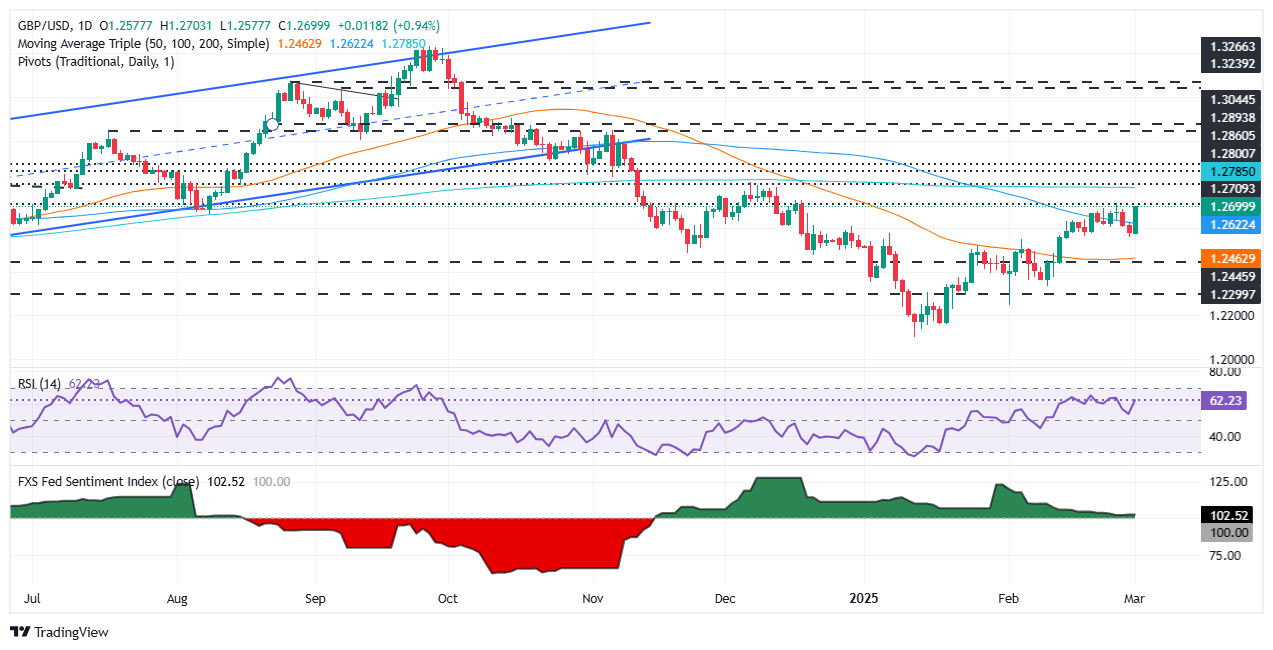
GBP/USD is trading back into the 200-day EMA once again, testing chart paper near the 1.2700 handle. Cable has skidded sideways recently, with price action getting squeezed between the 200-day EMA and the 50-day EMA near 1.2540.
Bullish momentum has been a steady force since GBP/USD bottomed out at 1.2100 in January, but topside momentum looks about over. Cable traders remain unwilling to sell off enough to kick off a fresh leg lower, but a fresh push into bull country looks unlikely with technical oscillators stuck in overbought territory.
GBP/USD daily chart
Pound Sterling FAQs
The Pound Sterling (GBP) is the oldest currency in the world (886 AD) and the official currency of the United Kingdom. It is the fourth most traded unit for foreign exchange (FX) in the world, accounting for 12% of all transactions, averaging $630 billion a day, according to 2022 data. Its key trading pairs are GBP/USD, also known as ‘Cable’, which accounts for 11% of FX, GBP/JPY, or the ‘Dragon’ as it is known by traders (3%), and EUR/GBP (2%). The Pound Sterling is issued by the Bank of England (BoE).
The single most important factor influencing the value of the Pound Sterling is monetary policy decided by the Bank of England. The BoE bases its decisions on whether it has achieved its primary goal of “price stability” – a steady inflation rate of around 2%. Its primary tool for achieving this is the adjustment of interest rates. When inflation is too high, the BoE will try to rein it in by raising interest rates, making it more expensive for people and businesses to access credit. This is generally positive for GBP, as higher interest rates make the UK a more attractive place for global investors to park their money. When inflation falls too low it is a sign economic growth is slowing. In this scenario, the BoE will consider lowering interest rates to cheapen credit so businesses will borrow more to invest in growth-generating projects.
Data releases gauge the health of the economy and can impact the value of the Pound Sterling. Indicators such as GDP, Manufacturing and Services PMIs, and employment can all influence the direction of the GBP. A strong economy is good for Sterling. Not only does it attract more foreign investment but it may encourage the BoE to put up interest rates, which will directly strengthen GBP. Otherwise, if economic data is weak, the Pound Sterling is likely to fall.
Another significant data release for the Pound Sterling is the Trade Balance. This indicator measures the difference between what a country earns from its exports and what it spends on imports over a given period. If a country produces highly sought-after exports, its currency will benefit purely from the extra demand created from foreign buyers seeking to purchase these goods. Therefore, a positive net Trade Balance strengthens a currency and vice versa for a negative balance.
-
23:52
Japan Monetary Base (YoY) climbed from previous -2.5% to -1.8% in February
-
23:50
Japan Capital Spending came in at -0.2%, below expectations (4.9%) in 4Q
-
23:30
Japan Jobs / Applicants Ratio registered at 1.26 above expectations (1.25) in January
-
23:30
Japan Unemployment Rate registered at 2.5% above expectations (2.4%) in January
-
23:26
OPEC+ sets to raise oil output in April following extended cuts
The Organization of the Petroleum Exporting Countries Plus (OPEC+) said it will proceed with a plan to increase oil production from April. This increase follows a series of output cuts made by OPEC+ to stabilize the market, per Financial Times
Market reaction
At the time of writing, the WTI price is trading around $68.10, down 0.05% on the day.
WTI Oil FAQs
WTI Oil is a type of Crude Oil sold on international markets. The WTI stands for West Texas Intermediate, one of three major types including Brent and Dubai Crude. WTI is also referred to as “light” and “sweet” because of its relatively low gravity and sulfur content respectively. It is considered a high quality Oil that is easily refined. It is sourced in the United States and distributed via the Cushing hub, which is considered “The Pipeline Crossroads of the World”. It is a benchmark for the Oil market and WTI price is frequently quoted in the media.
Like all assets, supply and demand are the key drivers of WTI Oil price. As such, global growth can be a driver of increased demand and vice versa for weak global growth. Political instability, wars, and sanctions can disrupt supply and impact prices. The decisions of OPEC, a group of major Oil-producing countries, is another key driver of price. The value of the US Dollar influences the price of WTI Crude Oil, since Oil is predominantly traded in US Dollars, thus a weaker US Dollar can make Oil more affordable and vice versa.
The weekly Oil inventory reports published by the American Petroleum Institute (API) and the Energy Information Agency (EIA) impact the price of WTI Oil. Changes in inventories reflect fluctuating supply and demand. If the data shows a drop in inventories it can indicate increased demand, pushing up Oil price. Higher inventories can reflect increased supply, pushing down prices. API’s report is published every Tuesday and EIA’s the day after. Their results are usually similar, falling within 1% of each other 75% of the time. The EIA data is considered more reliable, since it is a government agency.
OPEC (Organization of the Petroleum Exporting Countries) is a group of 12 Oil-producing nations who collectively decide production quotas for member countries at twice-yearly meetings. Their decisions often impact WTI Oil prices. When OPEC decides to lower quotas, it can tighten supply, pushing up Oil prices. When OPEC increases production, it has the opposite effect. OPEC+ refers to an expanded group that includes ten extra non-OPEC members, the most notable of which is Russia.
-
23:09
USD/JPY Price Forecast: Struggles on weak US data, tariff woes
- Momentum remains bearish, with key support at 149.00 and 148.57.
- JPY strengthens as safe-haven demand rises amid US trade tensions.
- A rebound above 150.00 could open the door for 151.14 and 152.38.
The USD/JPY begins Tuesday’s Asian session unchanged after registering losses of 0.74% on Monday. Soft US data and tariffs on Mexico, Canada, and China beginning on March 4 keep the Greenback on the backfoot against most G7 currencies. The pair trades at 149.59, up 0.06%.
USD/JPY Price Forecast: Technical outlook
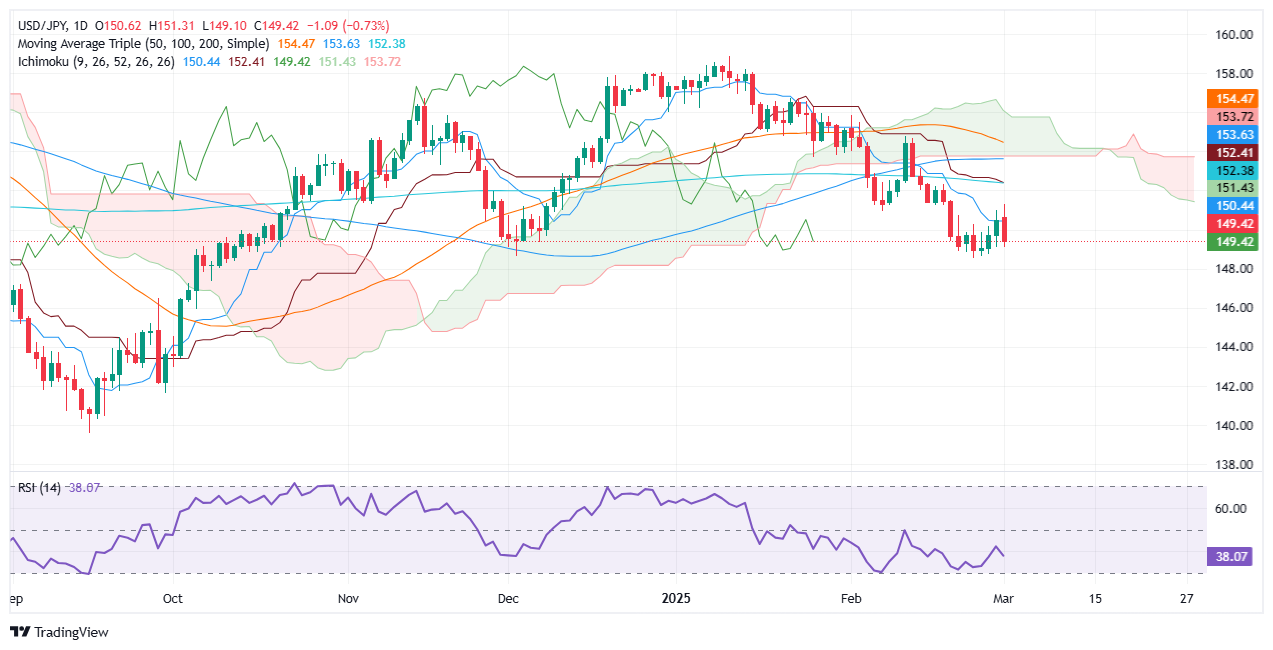
After posting solid gains in the last week, the USD/JPY began the current one negatively as Japanese Yen (JPY) buyers entered the market at a better price. This followed an eight-day rally that witnessed an appreciation of 3.87% for the JPY, which drove the pair from 154.55 to 148.57.
Momentum remains tilted to the downside, as depicted by the Relative Strength Index (RSI). With that said, the USD/JPY's first support would be 149.00. Once surpassed, the next stop would be the February 25 low of 148.57, followed by the September 30 swing low of 141.64.
On the other hand, if USD/JPY recovers and climbs past 150.00, look for a retest of the Senkou Span A at 151.14 before challenging the Kijun-sen at 152.38.
USD/JPY Price Chart – Daily
Japanese Yen FAQs
The Japanese Yen (JPY) is one of the world’s most traded currencies. Its value is broadly determined by the performance of the Japanese economy, but more specifically by the Bank of Japan’s policy, the differential between Japanese and US bond yields, or risk sentiment among traders, among other factors.
One of the Bank of Japan’s mandates is currency control, so its moves are key for the Yen. The BoJ has directly intervened in currency markets sometimes, generally to lower the value of the Yen, although it refrains from doing it often due to political concerns of its main trading partners. The BoJ ultra-loose monetary policy between 2013 and 2024 caused the Yen to depreciate against its main currency peers due to an increasing policy divergence between the Bank of Japan and other main central banks. More recently, the gradually unwinding of this ultra-loose policy has given some support to the Yen.
Over the last decade, the BoJ’s stance of sticking to ultra-loose monetary policy has led to a widening policy divergence with other central banks, particularly with the US Federal Reserve. This supported a widening of the differential between the 10-year US and Japanese bonds, which favored the US Dollar against the Japanese Yen. The BoJ decision in 2024 to gradually abandon the ultra-loose policy, coupled with interest-rate cuts in other major central banks, is narrowing this differential.
The Japanese Yen is often seen as a safe-haven investment. This means that in times of market stress, investors are more likely to put their money in the Japanese currency due to its supposed reliability and stability. Turbulent times are likely to strengthen the Yen’s value against other currencies seen as more risky to invest in.
-
23:04
USD/CAD extends the rally to near 1.4500 as Trump confirms tariffs
- USD/CAD gains momentum to near 1.4490 in Monday’s late American session.
- Trump said that tariffs on Canada and Mexico will go into effect on Tuesday, denting hopes of another reprieve.
- US ISM Manufacturing PMI declined to 50.3 in February vs. 50.9 prior, weaker than expected.
The USD/CAD pair extends its upside to around 1.4490 during the late American session on Monday. The Canadian Dollar (CAD) weakens to near a one-month low against the Greenback as US President Donald Trump was due to place 25% tariffs on Canadian goods, with the exception of a 10% levy on energy goods, by Tuesday.
Trump confirmed on Monday that tariffs on Canada and Mexico would go into effect on Tuesday. Trump had previously reaffirmed the new March date after having initially set it for April. Fresh tariff threats from Trump exert some selling pressure on the Loonie.
Additionally, a fall in crude oil prices on reports OPEC+ will proceed with a planned oil output increase in April and worries that a trade war could hurt the global economy also weigh on the commodity-linked Canadian Dollar. It’s worth noting that Canada is the largest oil exporter to the United States (US), and lower crude oil prices tend to have a negative impact on the CAD value.
On the other hand, the weaker US Dollar (USD) after weaker US economic data might cap the upside for the pair. Data released by the Institute for Supply Management (ISM) on Monday showed that the US Manufacturing Purchasing Managers' Index (PMI) eased to 50.3 in February from 50.9 in January. This figure came in weaker than the expectation of 50.5.Canadian Dollar FAQs
The key factors driving the Canadian Dollar (CAD) are the level of interest rates set by the Bank of Canada (BoC), the price of Oil, Canada’s largest export, the health of its economy, inflation and the Trade Balance, which is the difference between the value of Canada’s exports versus its imports. Other factors include market sentiment – whether investors are taking on more risky assets (risk-on) or seeking safe-havens (risk-off) – with risk-on being CAD-positive. As its largest trading partner, the health of the US economy is also a key factor influencing the Canadian Dollar.
The Bank of Canada (BoC) has a significant influence on the Canadian Dollar by setting the level of interest rates that banks can lend to one another. This influences the level of interest rates for everyone. The main goal of the BoC is to maintain inflation at 1-3% by adjusting interest rates up or down. Relatively higher interest rates tend to be positive for the CAD. The Bank of Canada can also use quantitative easing and tightening to influence credit conditions, with the former CAD-negative and the latter CAD-positive.
The price of Oil is a key factor impacting the value of the Canadian Dollar. Petroleum is Canada’s biggest export, so Oil price tends to have an immediate impact on the CAD value. Generally, if Oil price rises CAD also goes up, as aggregate demand for the currency increases. The opposite is the case if the price of Oil falls. Higher Oil prices also tend to result in a greater likelihood of a positive Trade Balance, which is also supportive of the CAD.
While inflation had always traditionally been thought of as a negative factor for a currency since it lowers the value of money, the opposite has actually been the case in modern times with the relaxation of cross-border capital controls. Higher inflation tends to lead central banks to put up interest rates which attracts more capital inflows from global investors seeking a lucrative place to keep their money. This increases demand for the local currency, which in Canada’s case is the Canadian Dollar.
Macroeconomic data releases gauge the health of the economy and can have an impact on the Canadian Dollar. Indicators such as GDP, Manufacturing and Services PMIs, employment, and consumer sentiment surveys can all influence the direction of the CAD. A strong economy is good for the Canadian Dollar. Not only does it attract more foreign investment but it may encourage the Bank of Canada to put up interest rates, leading to a stronger currency. If economic data is weak, however, the CAD is likely to fall.
-
23:00
South Korea Service Sector Output fell from previous 1.7% to -0.8% in January
-
23:00
South Korea Industrial Output Growth registered at -2.3% above expectations (-3.1%) in January
-
23:00
South Korea Industrial Output (YoY) came in at -4.1%, below expectations (-2%) in January
-
22:40
Crude Oil backslides after OPEC announces production increase, WTI eases to $68
- Crude Oil markets declined on Monday, sending WTI 2.5% lower.
- OPEC has announced a tentative agreement to begin increasing production.
- Challenges still lie ahead, as many OPEC members rely on high barrel prices.
West Texas Intermediate (WTI) Crude Oil prices took a tumble on Monday, falling 2.5% at the outset of the new trading week after the Organization of the Petroleum Exporting Countries (OPEC) announced a tentative agreement to begin ramping up Crude Oil production globally. OPEC has had trouble convincing its own cartel members of following through with production quotas; historically, OPEC member states are either desperate to sell more Crude Oil at any price so they can fund their government spending, or prefer to wait out low-production periods in order to bolster barrel prices, and thus raise Crude Oil prices.
According to OPEC’s announcement, the global oil cartel is due to begin a “gradual and flexible” increase of voluntary production caps in April, but with the caveat attached that this move is entirely dependent on a positive global growth outlook and “healthy market fundamentals”, which is typically code for “rising Crude Oil demand.”
US President Donald Trump has been pursuing lower Crude Oil prices as a part of his campaign platform, and OPEC appears set to throw the US President a bone. However, OPEC gave itself an out, noting that OPEC reserves the right to “pause or reverse the decision based on market conditions”.
WTI price forecast
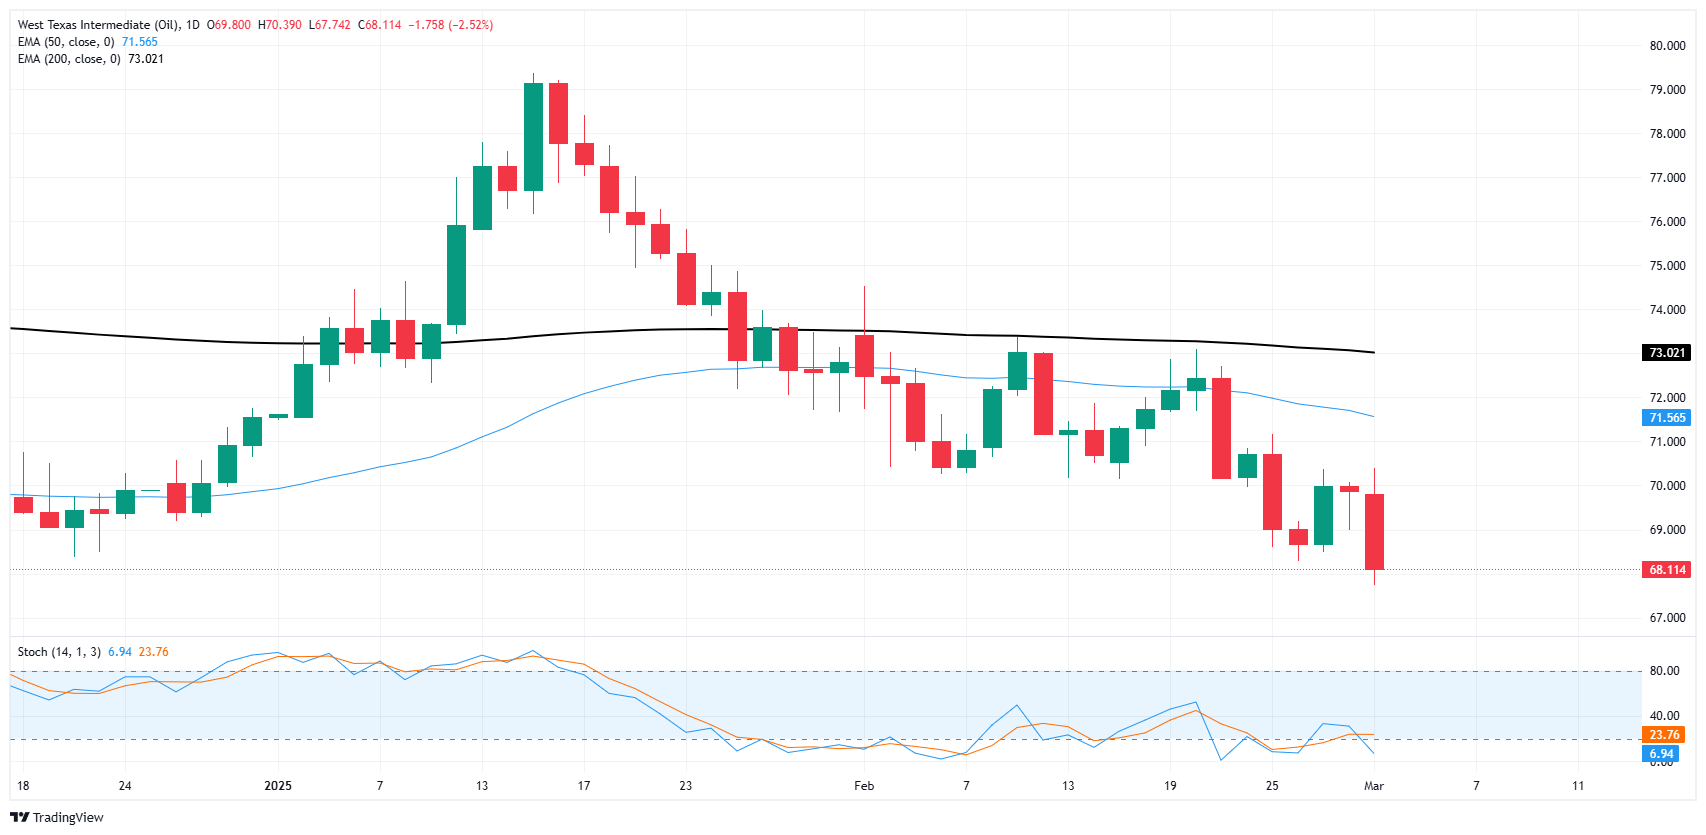
Monday’s sharp decline in WTI prices has pushed US Crude Oil barrel bids into fresh 12-week lows near $68.25. WTI has declined for the past six straight weeks, and Monday’s early declines put US Crude Oil prices on pace for a seventh week of weakness.
WTI bids are reeling following a technical rejection from the 50-day Exponential Moving Average (EMA) near $71.50, and January’s bullish push back above the 200-day EMA at the 73.00 handle has fizzled into a fresh bearish trend.
WTI daily chart
WTI Oil FAQs
WTI Oil is a type of Crude Oil sold on international markets. The WTI stands for West Texas Intermediate, one of three major types including Brent and Dubai Crude. WTI is also referred to as “light” and “sweet” because of its relatively low gravity and sulfur content respectively. It is considered a high quality Oil that is easily refined. It is sourced in the United States and distributed via the Cushing hub, which is considered “The Pipeline Crossroads of the World”. It is a benchmark for the Oil market and WTI price is frequently quoted in the media.
Like all assets, supply and demand are the key drivers of WTI Oil price. As such, global growth can be a driver of increased demand and vice versa for weak global growth. Political instability, wars, and sanctions can disrupt supply and impact prices. The decisions of OPEC, a group of major Oil-producing countries, is another key driver of price. The value of the US Dollar influences the price of WTI Crude Oil, since Oil is predominantly traded in US Dollars, thus a weaker US Dollar can make Oil more affordable and vice versa.
The weekly Oil inventory reports published by the American Petroleum Institute (API) and the Energy Information Agency (EIA) impact the price of WTI Oil. Changes in inventories reflect fluctuating supply and demand. If the data shows a drop in inventories it can indicate increased demand, pushing up Oil price. Higher inventories can reflect increased supply, pushing down prices. API’s report is published every Tuesday and EIA’s the day after. Their results are usually similar, falling within 1% of each other 75% of the time. The EIA data is considered more reliable, since it is a government agency.
OPEC (Organization of the Petroleum Exporting Countries) is a group of 12 Oil-producing nations who collectively decide production quotas for member countries at twice-yearly meetings. Their decisions often impact WTI Oil prices. When OPEC decides to lower quotas, it can tighten supply, pushing up Oil prices. When OPEC increases production, it has the opposite effect. OPEC+ refers to an expanded group that includes ten extra non-OPEC members, the most notable of which is Russia.
-
22:20
Canadian Dollar falls again as tariff threats loom
- The Canadian Dollar lost nearly half of a percent on Monday at its lowest.
- The Loonie has shed weight against the Greenback for seven straight sessions.
- Canadian PMI figures widely missed the mark, signaling risk of recession.
The Canadian Dollar (CAD) turned tail and ran from the Greenback on Monday, backsliding around one-fifth of one percent after plumbing the depths of a seventh straight bearish session. The Loonie is broadly backsliding as fresh threats of a 25% tariff package on all Canadian goods came from the social media of US President Donald Trump.
President Trump issued threats of steep tariff packages on some of the US’ closest trading allies at the start of his presidency, but after kicking the can repeatedly since January Donald Trump looks set to finally make good on his threat to “punish” foreign countries he has decreed as “taking advantage” of the US by steeply taxing his own constituents. Donald Trump’s tariffs exist in a particular quantum state, where they are both meant to change other countries’ trade behaviour, but are also meant to shore up US government finances, which are facing steep deficits if President Trump’s planned tax and government revenue cuts go through, which are poised to add trillions of dollars to the US government deficit in the coming years.
Daily digest market movers: Fresh tariff threats pummel Canadian Dollar
- The Canadian Dollar is poised for a return to multi-year lows as Loonie weakness pushes USD/CAD back into the 1.4500 region.
- President Trump reiterated his intent to begin 25% tariffs on US imports from Canada on Tuesday.
- The Organization of the Petroleum Exporting Countries (OPEC) also tentatively announced a production limit increase in the coming months, further suppressing the Loonie.
- Canadian officials already have retaliatory tariffs and punitive economic actions prepared for US consumers if tariffs go ahead this week.
- According to Donald Trump, further “reciprocal tariffs” are also slated to begin in April.
- Adding insult to injury, Canadian Purchasing Managers Index (PMI) Manufacturing figures for March declined sharply to 47.8, entirely missing the forecast uptick from 51.6 to 51.9. The survey results index has fallen to its lowest level in a little over a year as recession fears loom over businesses in the face of potential steep trade tariffs.
Canadian Dollar price forecast
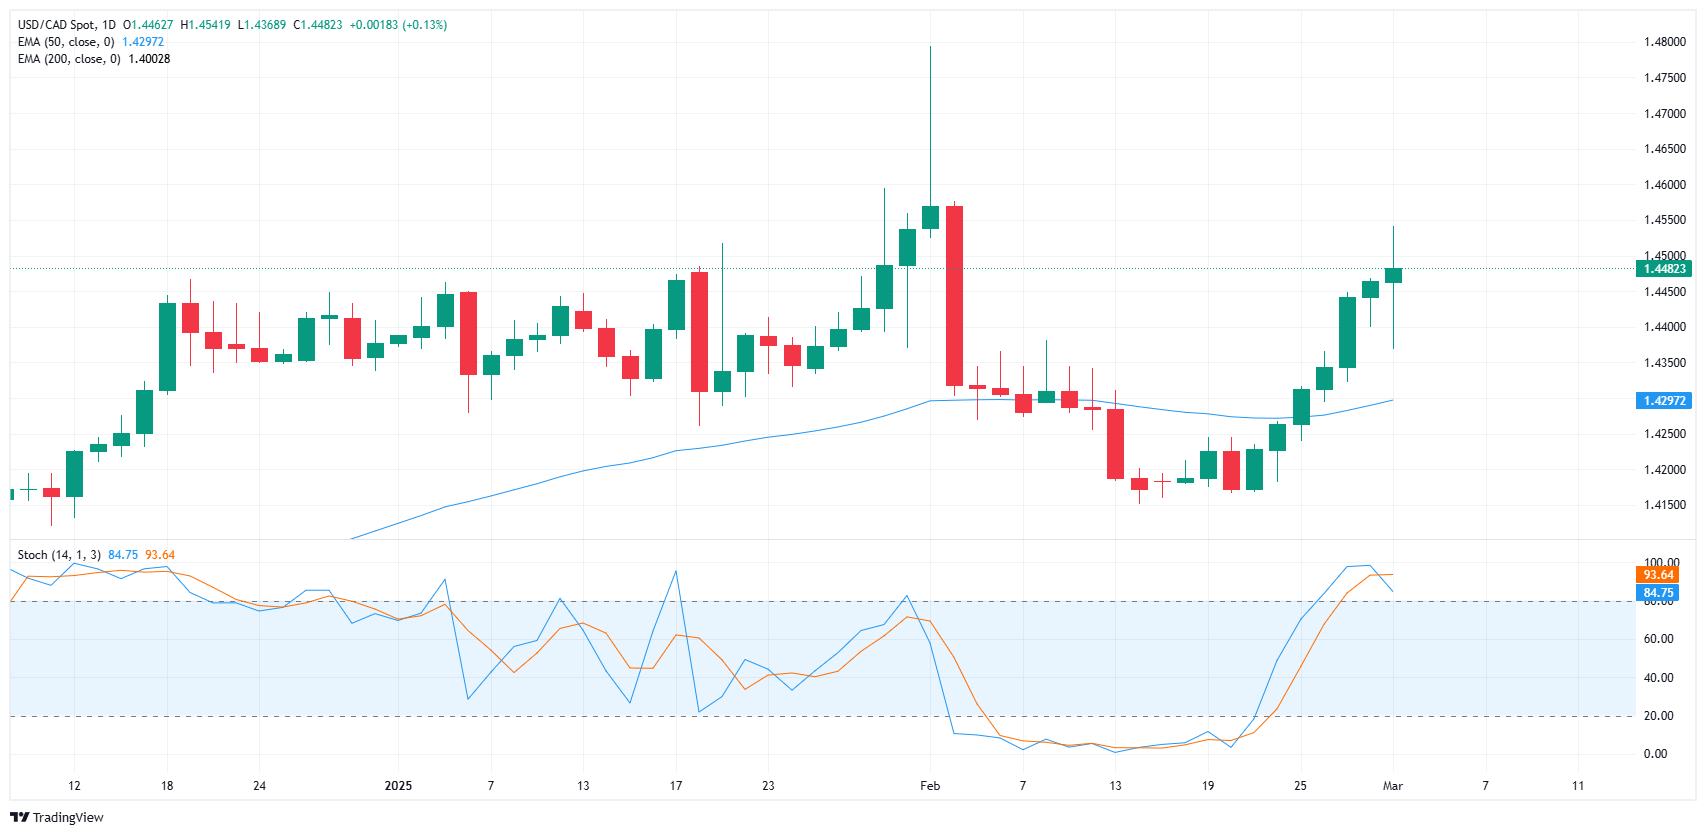
Fresh weakness in the Canadian Dollar has bullied USD/CAD higher, clipping into a seventh straight gaining session as the Greenback climbs against the Loonie. After a brief recovery from multi-year highs in January, the Canadian Dollar has resumed waffling against the US Dollar, dragging USD/CAD back into the 1.4500 handle.
The pair is trending back above the 50-day Exponential Moving Average (EMA) near 1.4300, but technical oscillators are beginning to pivot in overbought territory in a clear signal of potential exhaustion. While it’s unlikely that a fresh bout of bullish momentum behind the Loonie will fundamentally change the ongoing trend, a brief pullback period could be on the cards.
USD/CAD daily chart
Tariffs FAQs
Tariffs are customs duties levied on certain merchandise imports or a category of products. Tariffs are designed to help local producers and manufacturers be more competitive in the market by providing a price advantage over similar goods that can be imported. Tariffs are widely used as tools of protectionism, along with trade barriers and import quotas.
Although tariffs and taxes both generate government revenue to fund public goods and services, they have several distinctions. Tariffs are prepaid at the port of entry, while taxes are paid at the time of purchase. Taxes are imposed on individual taxpayers and businesses, while tariffs are paid by importers.
There are two schools of thought among economists regarding the usage of tariffs. While some argue that tariffs are necessary to protect domestic industries and address trade imbalances, others see them as a harmful tool that could potentially drive prices higher over the long term and lead to a damaging trade war by encouraging tit-for-tat tariffs.
During the run-up to the presidential election in November 2024, Donald Trump made it clear that he intends to use tariffs to support the US economy and American producers. In 2024, Mexico, China and Canada accounted for 42% of total US imports. In this period, Mexico stood out as the top exporter with $466.6 billion, according to the US Census Bureau. Hence, Trump wants to focus on these three nations when imposing tariffs. He also plans to use the revenue generated through tariffs to lower personal income taxes.
-
22:14
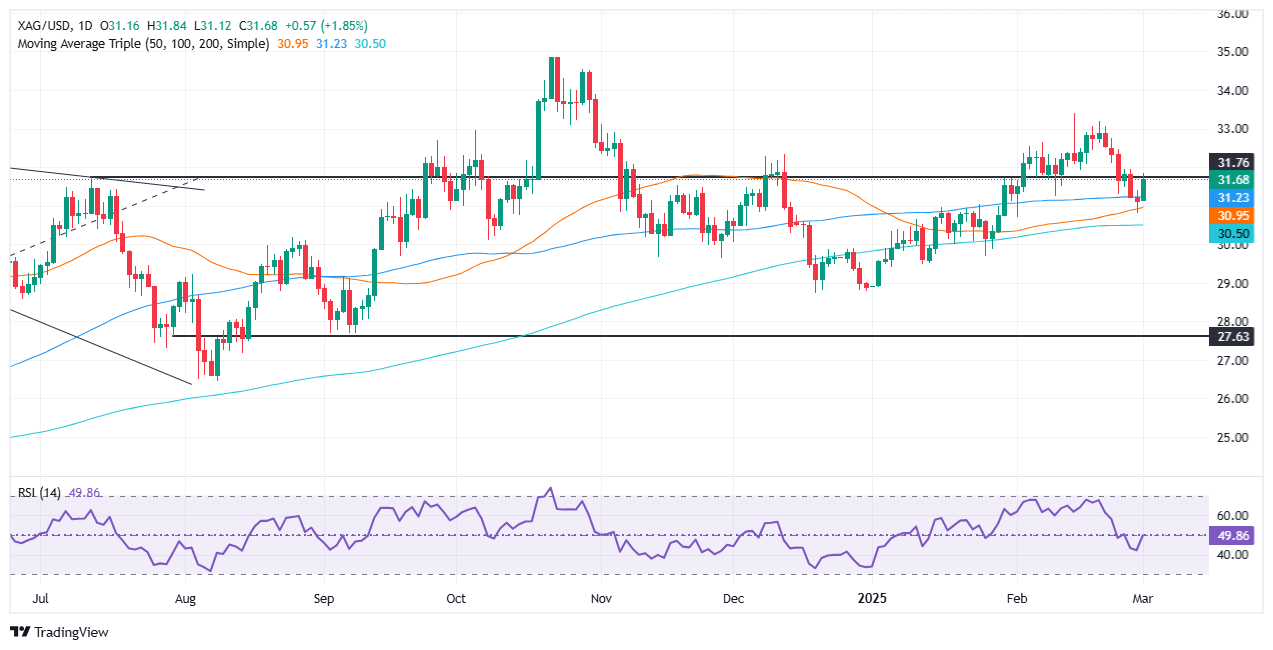
Silver Price Forecast: XAG/USD surges past $31.50 on soft USD
- XAG/USD reclaims $31.50, as tariff uncertainty lifts demand.
- Silver rebounds after dipping below 50-day SMA, now targeting $32.00.
- Trump confirms March 4 tariffs on Mexico, Canada, and China, fueling safe-haven demand.
- A daily close above $31.50 could pave the way for a retest of $33.20.
Silver price recovers, climbs above the $31.50 mark on Monday as the Greenback depreciates sharply across the board. Tariffs on Mexico, Canada and China would begin on March 4, according to US President Donald Trump in a press conference held at the Oval Office. This and the drop in US Treasury bond yields keep XAG/USD trading at $31.67, gaining over 1.76%.
XAG/USD Price Forecast: Technical outlook
Silver price rebound after dipping below the 50-day Simple Moving Average (SMA) of $30.93, before reclaiming $31.00. On its way to the current spot price, XAG/USD climbed past the 100-day SMA at $31.21, exacerbating Silver’s advance past the $31.50 area.
If XAG/USD closes on a daily basis above the latter, it would be poised to challenge key resistance levels like the $32.00 mark, and the February 20 peak at $33.20.
Conversely, if XAG/USD drops below $31.50, the immediate support would be the 50-day SMA, followed by the 200-day SMA at $30.43.
XAG/USD Price Chart – Daily
Silver FAQs
Silver is a precious metal highly traded among investors. It has been historically used as a store of value and a medium of exchange. Although less popular than Gold, traders may turn to Silver to diversify their investment portfolio, for its intrinsic value or as a potential hedge during high-inflation periods. Investors can buy physical Silver, in coins or in bars, or trade it through vehicles such as Exchange Traded Funds, which track its price on international markets.
Silver prices can move due to a wide range of factors. Geopolitical instability or fears of a deep recession can make Silver price escalate due to its safe-haven status, although to a lesser extent than Gold's. As a yieldless asset, Silver tends to rise with lower interest rates. Its moves also depend on how the US Dollar (USD) behaves as the asset is priced in dollars (XAG/USD). A strong Dollar tends to keep the price of Silver at bay, whereas a weaker Dollar is likely to propel prices up. Other factors such as investment demand, mining supply – Silver is much more abundant than Gold – and recycling rates can also affect prices.
Silver is widely used in industry, particularly in sectors such as electronics or solar energy, as it has one of the highest electric conductivity of all metals – more than Copper and Gold. A surge in demand can increase prices, while a decline tends to lower them. Dynamics in the US, Chinese and Indian economies can also contribute to price swings: for the US and particularly China, their big industrial sectors use Silver in various processes; in India, consumers’ demand for the precious metal for jewellery also plays a key role in setting prices.
Silver prices tend to follow Gold's moves. When Gold prices rise, Silver typically follows suit, as their status as safe-haven assets is similar. The Gold/Silver ratio, which shows the number of ounces of Silver needed to equal the value of one ounce of Gold, may help to determine the relative valuation between both metals. Some investors may consider a high ratio as an indicator that Silver is undervalued, or Gold is overvalued. On the contrary, a low ratio might suggest that Gold is undervalued relative to Silver.
-
21:47
NZD/USD Price Analysis: Kiwi steadies after a prolonged sell-off but downside risks persist
- NZD/USD edged higher, pausing its five-day losing streak, but gains remain limited.
- After losing the 20-day SMA and reaching its lowest level since mid-February, the pair stabilized as selling pressure eased.
- Resistance is seen at 0.5680, while support lies near 0.5580; indicators suggest a fragile recovery.
NZD/USD posted a mild gain on Monday after a prolonged losing streak, as the pair found some stability following its recent sell-off. Despite the brief upside move, the broader trend remains bearish, with the pair trading well below the 20-day Simple Moving Average (SMA). The downtrend has been reinforced by technical signals, suggesting that any bullish attempt might face strong resistance.
Momentum indicators highlight the fragility of the recovery. The Relative Strength Index (RSI) is turning higher but remains in negative territory, indicating that selling pressure is not yet fully exhausted. Meanwhile, the Moving Average Convergence Divergence (MACD) has crossed below its signal line, a bearish development that hints at continued downside risks.
From a technical perspective, the pair now faces immediate resistance at 0.5680, aligning with the 20-day SMA. A sustained move above this level could provide some breathing room for the bulls. On the downside, support emerges near 0.5580, a level that, if breached, could accelerate declines toward the 0.5540 region.
NZD/USD daily chart

-
21:34
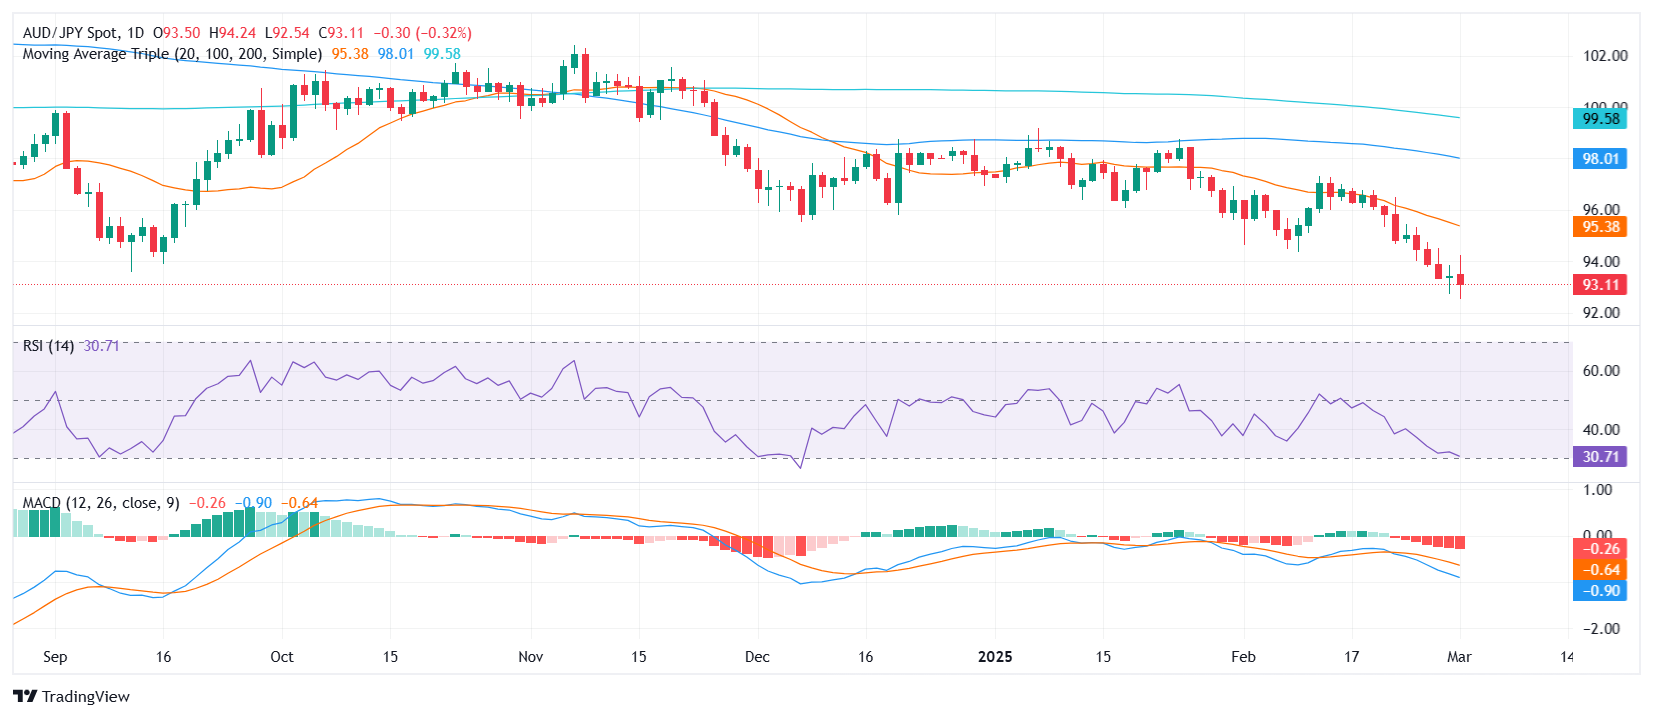
AUD/JPY Price Analysis: Volatile session sees gains erased as key support holds
- AUD/JPY saw a choppy session, briefly rising to 94.00 before retreating back toward 93.00.
- The pair remains near its lowest levels since mid-September, with indicators suggesting potential consolidation.
- Key support holds around 93.00, while resistance at 94.00 remains a hurdle for bulls.
The AUD/JPY pair experienced a volatile trading session, initially climbing towards 94.00 before reversing and retreating back near 93.00. This price action highlights continued uncertainty in the market, with sellers stepping in at higher levels to cap bullish attempts. Despite the intraday fluctuations, the pair remains near multi-month lows, suggesting that bearish sentiment still lingers.
From a technical standpoint, the Relative Strength Index (RSI) remains in a near-oversold zone, reflecting weak upside momentum. Meanwhile, the Moving Average Convergence Divergence (MACD) histogram prints flat red bars, signaling a pause in selling pressure but no decisive shift toward bullish control.
Looking ahead, the pair is currently testing support around 93.00, a key level that has held so far. A break below this area could intensify losses, exposing 92.50 as the next downside target. On the upside, resistance at 94.00 continues to limit bullish advances. A decisive push above this level could encourage buyers and open the door toward 94.50.
AUD/JPY daily chart
-
20:44
Gold price rallies on haven demand amid trade and geopolitical tensions
- XAU/USD climbs to $2,888 as markets brace for tariffs, weaker US growth
- Gold snaps a two-day losing streak as risk-off sentiment drives safe-haven flows.
- Trump’s tariff threats, clash with Zelenskyy fuel market uncertainty.
- Atlanta Fed GDP Now forecast plunges to -2.8%, boosts Gold’s appeal.
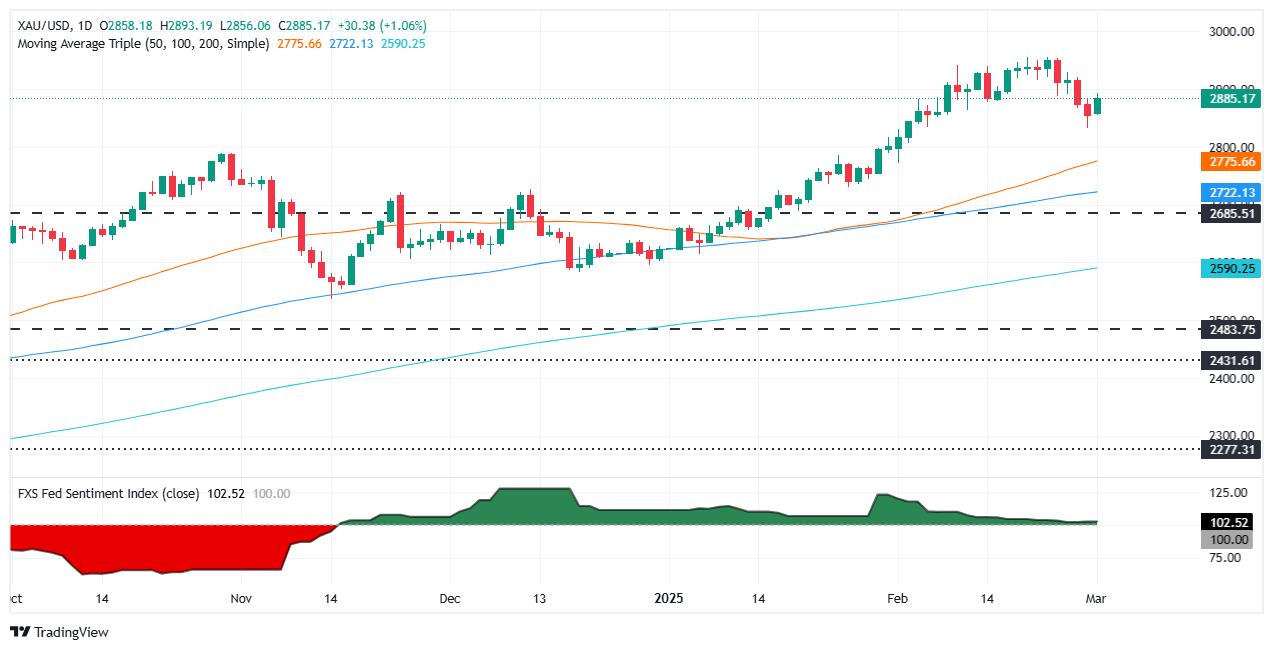
Gold price is rallying over 1% on Monday, snapping two days of losses as the Greenback gets battered due to safe-haven demand and falling United States (US) Treasury bond yields. Geopolitical tensions and tariff threats by US President Donald Trump increased demand for the safety appeal of Bullion. XAU/USD trades at $2,888 at the time of writing.
Risk appetite deteriorated following the clash between US President Donald Trump and Ukrainian President Volodymir Zelenskyy last Friday. In the meantime, tariffs imposed on Mexico, Canada and China are expected to kick in on Tuesday.
Data-wise, business activity in the manufacturing sector in February was mixed, with S&P Global improving, while the ISM dipped but continued to expand.
In the meantime, the last round of US economic data pushed the Atlanta GDP Now Q1 2025 forecast model further deep into negative territory from -1.6% on February 28 to -2.8% as of writing.
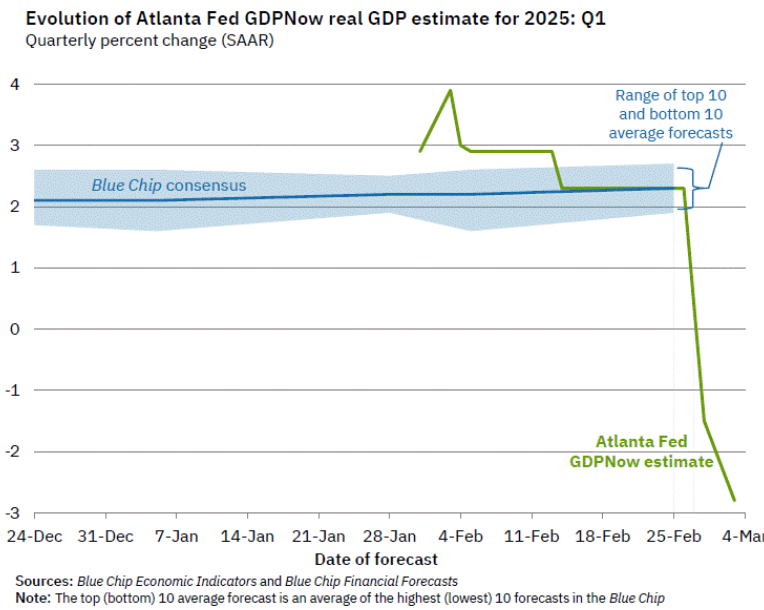
Source: GDPNow
Therefore, traders seeking safety bought Bullion pushing prices on the way towards $2,900. The US 10-year Treasury note falls two basis points (bps) down to 4.176% levels last seen in December 2024.
Alongside the data, St. Louis Fed President Alberto Musalem said the economic outlook is for continued solid economic growth, but recent data pose some downside risks.
Daily digest market movers: Gold price surges amid pessimistic US economic outlook
- US real yields, as measured by the yield in the US 10-year Treasury Inflation-Protected Securities (TIPS), tumble almost three bps to 1.808%.
- The US ISM Manufacturing PMI for February held steady at 50.3, slightly down from 50.9 and below the 50.5 forecast, indicating a mild slowdown in business activity.
- S&P Global Manufacturing PMI showed improvement, rising to 52.7 from 51.2, surpassing expectations of 51.6, signaling continued expansion in the sector.
- Money markets had priced in that the Federal Reserve (Fed) would ease policy by 71 basis points (bps), up from 58 bps last week, revealed data from Prime Market Terminal.
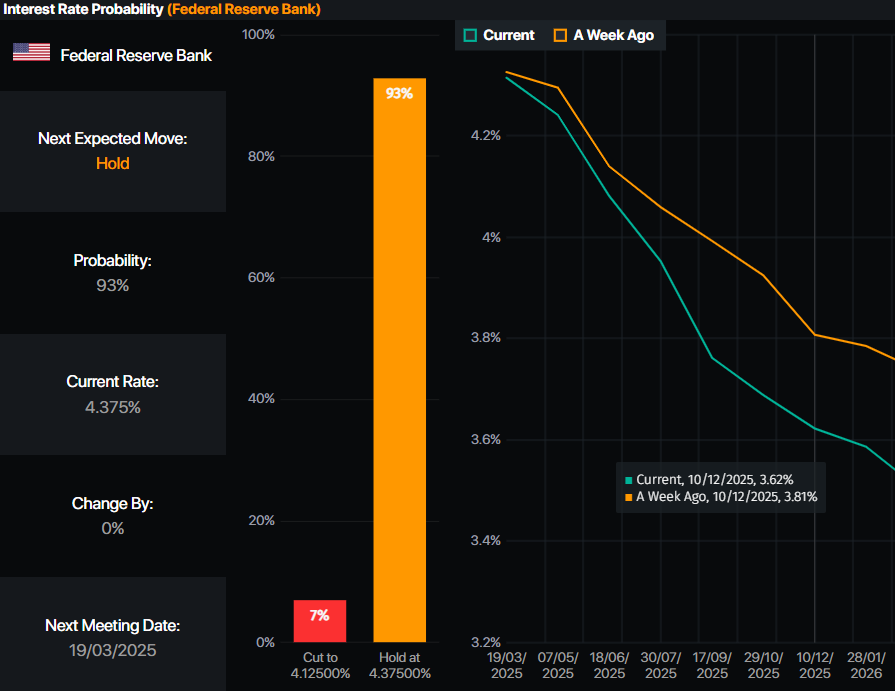
Source: Prime Market Terminal
XAU/USD technical outlook: Gold price advances towards $2,900
Gold price uptrend resumed after two days of losses that drove XAU/USD below the $2,900 figure. Nevertheless, buyers stepped in near the $2,830 mark, lifting spot prices above $2,850, which exacerbated the rally toward $2,893. If buyers achieve a daily close above $2,900, bullion could be poised to challenge the year-to-date (YTD) peak at $2,954.
Otherwise, on further weakness, XAU/USD could aim toward the February 14 low of $2,877, followed by the February 12 swing low of $2,864. However, the broader uptrend remains intact unless XAU/USD drops below $2,800.
Gold FAQs
Gold has played a key role in human’s history as it has been widely used as a store of value and medium of exchange. Currently, apart from its shine and usage for jewelry, the precious metal is widely seen as a safe-haven asset, meaning that it is considered a good investment during turbulent times. Gold is also widely seen as a hedge against inflation and against depreciating currencies as it doesn’t rely on any specific issuer or government.
Central banks are the biggest Gold holders. In their aim to support their currencies in turbulent times, central banks tend to diversify their reserves and buy Gold to improve the perceived strength of the economy and the currency. High Gold reserves can be a source of trust for a country’s solvency. Central banks added 1,136 tonnes of Gold worth around $70 billion to their reserves in 2022, according to data from the World Gold Council. This is the highest yearly purchase since records began. Central banks from emerging economies such as China, India and Turkey are quickly increasing their Gold reserves.
Gold has an inverse correlation with the US Dollar and US Treasuries, which are both major reserve and safe-haven assets. When the Dollar depreciates, Gold tends to rise, enabling investors and central banks to diversify their assets in turbulent times. Gold is also inversely correlated with risk assets. A rally in the stock market tends to weaken Gold price, while sell-offs in riskier markets tend to favor the precious metal.
The price can move due to a wide range of factors. Geopolitical instability or fears of a deep recession can quickly make Gold price escalate due to its safe-haven status. As a yield-less asset, Gold tends to rise with lower interest rates, while higher cost of money usually weighs down on the yellow metal. Still, most moves depend on how the US Dollar (USD) behaves as the asset is priced in dollars (XAU/USD). A strong Dollar tends to keep the price of Gold controlled, whereas a weaker Dollar is likely to push Gold prices up.
-
20:27
AUD/USD jumps to near 0.6230 as US Dollar tumbles, upside remains capped
- The Aussie rebounded by roughly 0.67%, lifting the pair toward 0.6245 but still under last week’s negative outlook.
- Federal Reserve (Fed) dovish bets firm up after softer United States Personal Spending data.
- President Donald Trump reiterates he will double China tariffs to 20%.
- Tariff stalemate extends to Mexico and Canada, with no room left for negotiation according to Trump.
AUD/USD gains sharply to near 0.6230 as the US Dollar (USD) faces strong selling pressure. Fed dovish bets have escalated following a decline in United States (US) Personal Spending for January. However, the Australian Dollar (AUD) could again face selling pressure if President Donald Trump proceeds with additional tariffs on key trading partners, including China, Mexico, and Canada.
Daily digest market movers: Traders eye Trump’s new tariff pledges and RBA policy signals
- President Trump announced an intention to lift tariffs on Chinese imports to 20%, up from the currently planned 10%. He also said there is “no room left for a deal” on duties affecting Mexico and Canada, intensifying trade uncertainty across currency markets.
- Regarding the Fed policy, the probability of a Fed rate cut at June’s meeting has risen to 74%, according to the CME FedWatch tool, triggered by a downbeat US Personal Spending report. Markets interpret the data as a sign that the Fed may soften its policy stance sooner.
- On the local front, the Reserve Bank of Australia (RBA) cut its Official Cash Rate by 25 basis points to 4.10% in February and signaled a measured approach going forward. Investors await the RBA minutes due on Tuesday for hints of further easing measures as inflation remains a priority.
- While the US Dollar has weakened amid Fed cut speculation, President Trump’s decision to double China tariffs stirs caution. The Aussie, sensitive to Chinese demand, could rapidly drop if Beijing retaliates or if other trading partners see increased barriers.
- On Monday, Trump clarified he has “not talked about suspending military aid to Ukraine,” yet tensions emerged after Ukrainian officials rejected a prior “rare earth deal.”
- Meanwhile, the People’s Bank of China’s (PBOC) supportive stance might buffer some risk for China, but any slowdown there still undermines Australia’s commodity-driven economy.
AUD/USD technical outlook: Pair halts losing streak but remains vulnerable below key barriers
The AUD/USD pair rose by about 0.67% to the mid-0.6200 region, temporarily reversing its downward momentum from last week. While the Aussie stopped the bleeding on account of a softer US Dollar, the outlook stays bearish after multiple sessions of losses. The Relative Strength Index (RSI) currently sits in a lower band, although it is rising sharply and suggests some buyer interest returning. Meanwhile, the Moving Average Convergence Divergence (MACD) histogram shows red bars, indicating lackluster upside strength. Key resistance stands near the 0.6300–0.6330 handle, with further hurdles around recent swing highs. A renewed tariff threat or weaker Chinese demand could easily cap gains and trigger a retest of last week’s lows.
Australian Dollar FAQs
One of the most significant factors for the Australian Dollar (AUD) is the level of interest rates set by the Reserve Bank of Australia (RBA). Because Australia is a resource-rich country another key driver is the price of its biggest export, Iron Ore. The health of the Chinese economy, its largest trading partner, is a factor, as well as inflation in Australia, its growth rate and Trade Balance. Market sentiment – whether investors are taking on more risky assets (risk-on) or seeking safe-havens (risk-off) – is also a factor, with risk-on positive for AUD.
The Reserve Bank of Australia (RBA) influences the Australian Dollar (AUD) by setting the level of interest rates that Australian banks can lend to each other. This influences the level of interest rates in the economy as a whole. The main goal of the RBA is to maintain a stable inflation rate of 2-3% by adjusting interest rates up or down. Relatively high interest rates compared to other major central banks support the AUD, and the opposite for relatively low. The RBA can also use quantitative easing and tightening to influence credit conditions, with the former AUD-negative and the latter AUD-positive.
China is Australia’s largest trading partner so the health of the Chinese economy is a major influence on the value of the Australian Dollar (AUD). When the Chinese economy is doing well it purchases more raw materials, goods and services from Australia, lifting demand for the AUD, and pushing up its value. The opposite is the case when the Chinese economy is not growing as fast as expected. Positive or negative surprises in Chinese growth data, therefore, often have a direct impact on the Australian Dollar and its pairs.
Iron Ore is Australia’s largest export, accounting for $118 billion a year according to data from 2021, with China as its primary destination. The price of Iron Ore, therefore, can be a driver of the Australian Dollar. Generally, if the price of Iron Ore rises, AUD also goes up, as aggregate demand for the currency increases. The opposite is the case if the price of Iron Ore falls. Higher Iron Ore prices also tend to result in a greater likelihood of a positive Trade Balance for Australia, which is also positive of the AUD.
The Trade Balance, which is the difference between what a country earns from its exports versus what it pays for its imports, is another factor that can influence the value of the Australian Dollar. If Australia produces highly sought after exports, then its currency will gain in value purely from the surplus demand created from foreign buyers seeking to purchase its exports versus what it spends to purchase imports. Therefore, a positive net Trade Balance strengthens the AUD, with the opposite effect if the Trade Balance is negative.
-
19:53
Forex Today: The RBA takes centre stage
The US Dollar made a U-turn and left behind three days of gains in quite a negative kick-off of the new trading week, all amid a generalised sharp recovery in the risk-associated universe.
Here is what you need to know on Tuesday, March 4:
The US Dollar Index (DXY) came under renewed selling pressure, setting aside three daily advances in a row and returning to the 106.50 region amid a mixed tone in US yields. The RCM/TIPP Economic Optimism Index is due, seconded by the API’s weekly report on US crude oil inventories. In addition, the Fed’s Williams is due to speak.
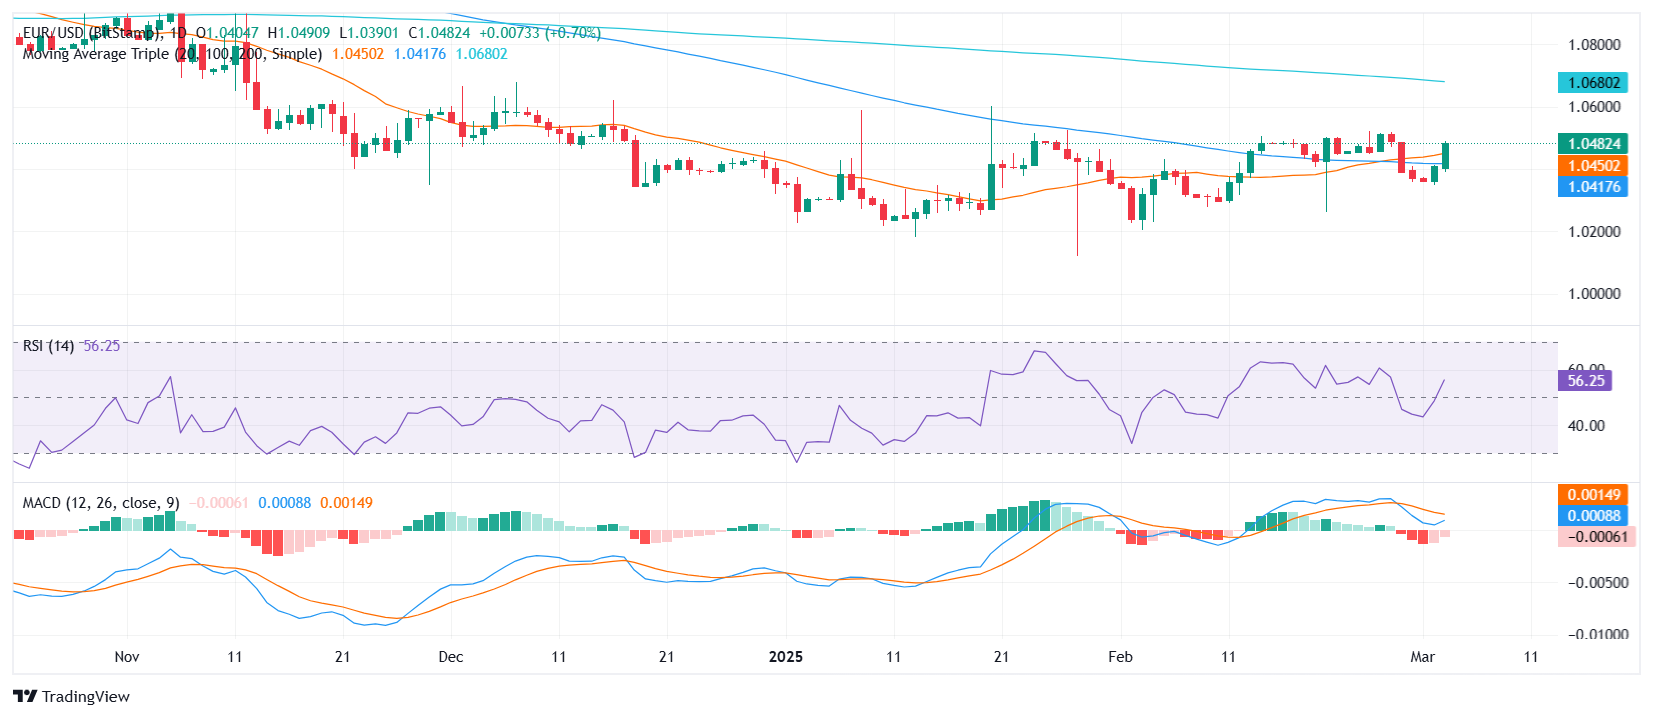
EUR/USD jumped to two-day highs above the 1.0500 mark on the back of renewed optimism around a potential end of the Russia-Ukraine war. Next on tap on the euro docket will be the release of the Unemployment Rate in the region, while the final HCOB Services PMIs in Germany and the euro area, as well as Producer Prices in the whole bloc are all expected on March 5.
GBP/USD climbed to fresh 2025 peaks past the 1.2700 hurdle on the back of the intense sell-off in the Greenback. The final S&P Global Services PMI will take centre stage on March 5, seconded by speeches by the BoE’s Bailey and Pill.
Renewed downside pressure motivated USD/JPY to leave behind three consecutive days of gains despite an initial move to muti-day highs around 151.30. Japan’s Unemployment Rate will be published, followed by Capital Spending figures and the Consumer Confidence gauge.
AUD/USD set aside six consecutive daily pullbacks and regained the 0.6200 barrier and above on Monday. The publication of the RBA Minutes will be at the centre of the debate, along with Retail Sales, and quarterly Current Account results. Additionally, the RBA’s Hauser is due to speak.
WTI dropped markedly and broke below the $68.00 mark per barrel to hit new YTD lows after the OPEC+ confirmed it will proceed with supply hikes in April.
Prices of Gold charted a decent advance and revisited the vicinity of the $2,900 region per troy ounce, leaving behind two daily drops in a row. Silver prices rebounded markedly to two-day peaks around $31.70 per ounce.
-
19:31
US President Donald Trump: US agriculture products should be sold in US
United States (US) President Donald Trump hit social media wires on Monday, touching on a wide swath of subjects, but carving time out of his social posting to briefly signal his plans to fundamentally shift how the US agriculture sector works at a foundational level.
The US is a net exporter of food products, exporting high-value agriculture and food products for profit and importing low-cost food goods at a discount. According to President Trump, this arrangement is no longer desirable. Donald Trump is likely in a rush to pivot to a new topic for the day after facing blowback from key conservatives and crypto industry professionals after ham-handedly backing a "cryptocurrency reserve" stockpile.
President Trump is expected to make a final decision on Mexico, Canada, and China tariffs, which are due to begin on Tuesday, sometime this afternoon.
Key highlights
US agricultural products will be sold inside the US.
Tariffs on external agricultural products April 2nd.
Trump on Zelenskiy's comment that the war will go on for a very long time: This is the worst statement that could have been made by Zelenskyy.
TSMC will invest at least $100B in new capital.
The TSMC investment will be in Arizona.
TSMC's total investment in the US will be at least $165 billion, building 5 additional chip factories in the US.
Many companies want to announce investments.
The world's most powerful chips will be made in the US.
CNN, citing US Commerce Secretary Lutnick: Trump wants automaker manufacturing jobs back in the US.
-
18:18
US Dollar tumbles as Ukraine peace talks gain traction
- DXY erases Friday’s gains, slipping as European leaders back Ukraine peace deal guarantees.
- US Manufacturing PMI beats estimates, while ISM Manufacturing PMI misses expectations.
- Bond yields edge lower, reinforcing expectations of Fed rate cuts later in 2025.
- Technical indicators suggest further downside as key moving averages converge near 107.00.
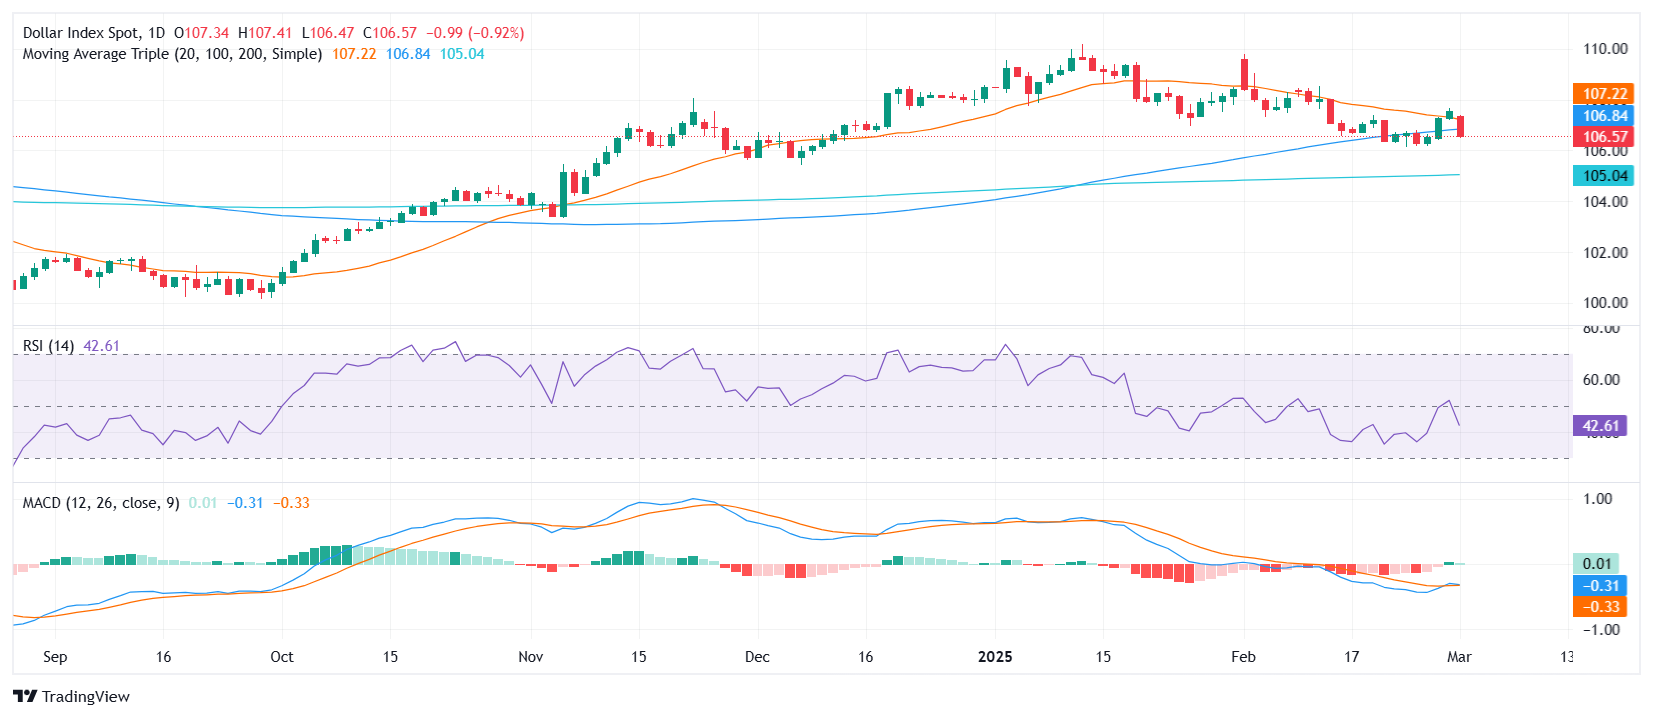
The US Dollar Index (DXY), which tracks the performance of the Greenback against a basket of six major currencies, is diving sharply on Monday as optimism surrounding a potential Ukraine peace deal weighs on safe-haven demand. European leaders have signaled their willingness to back security guarantees for Ukraine, boosting risk sentiment across global markets.
Meanwhile, United States (US) economic data provided mixed signals. The ISM Manufacturing PMI missed forecasts, while the S&P Global Manufacturing PMI came in stronger than expected. As a result, DXY slides back from last week's highs, undoing Friday’s advance.
Daily digest market movers: US Dollar plunges as geopolitical optimism lifts sentiment, US data comes mixed
- DXY tumbles as investors reduce safe-haven exposure amid Ukraine peace deal optimism. This came after several European leaders cooled down the jitters after Friday’s heated conversations between the American and Ukrainian presidents.
- On the data front, S&P Global’s final Manufacturing PMI for February exceeded estimates at 52.7, strengthening from the preliminary reading.
- ISM Manufacturing PMI came in at 50.3, slightly below the 50.5 forecast and down from January’s 50.9.
- The ISM Prices Paid subindex spiked to 62.4, surpassing estimates and accelerating from January’s 54.9.
- New Orders component dropped to 48.6, reflecting a significant decline from 55.1 in January.
- As a reaction, Wall Street trades mixed, with major US indices posting marginal gains and losses. US Treasury yields drift lower, extending the downtrend from last week’s highs.
- The CME FedWatch Tool indicates an increasing probability of a Fed rate cut in June, though some odds still favor steady rates.
DXY technical outlook: Bearish crossover looms as downside momentum builds
The US Dollar Index (DXY) turns lower, slipping below the 20-day and 100-day Simple Moving Averages (SMA), which are nearing a bearish crossover around the 107.00 level. Momentum indicators such as the Relative Strength Index (RSI) and Moving Average Convergence Divergence (MACD) are reinforcing the negative outlook. Key support levels emerge at 106.00 and 105.50, while 107.00 remains the first resistance level should the index attempt a rebound. However, with fundamental and technical factors aligning to the downside, further weakness is likely in the short term.
Interest rates FAQs
Interest rates are charged by financial institutions on loans to borrowers and are paid as interest to savers and depositors. They are influenced by base lending rates, which are set by central banks in response to changes in the economy. Central banks normally have a mandate to ensure price stability, which in most cases means targeting a core inflation rate of around 2%. If inflation falls below target the central bank may cut base lending rates, with a view to stimulating lending and boosting the economy. If inflation rises substantially above 2% it normally results in the central bank raising base lending rates in an attempt to lower inflation.
Higher interest rates generally help strengthen a country’s currency as they make it a more attractive place for global investors to park their money.
Higher interest rates overall weigh on the price of Gold because they increase the opportunity cost of holding Gold instead of investing in an interest-bearing asset or placing cash in the bank. If interest rates are high that usually pushes up the price of the US Dollar (USD), and since Gold is priced in Dollars, this has the effect of lowering the price of Gold.
The Fed funds rate is the overnight rate at which US banks lend to each other. It is the oft-quoted headline rate set by the Federal Reserve at its FOMC meetings. It is set as a range, for example 4.75%-5.00%, though the upper limit (in that case 5.00%) is the quoted figure. Market expectations for future Fed funds rate are tracked by the CME FedWatch tool, which shapes how many financial markets behave in anticipation of future Federal Reserve monetary policy decisions.
-
18:13
Fed's Musalem: Unanchoring inflation expectations would concern me
Federal Reserve (Fed) Bank of St Louis Alberto Musalem hit newswires on Monday, admitting that signs of economic deterioration are beginning to show through the cracks, but that overall growth and labor figures still look good, at least for the time being.
Key highlights
Signs inflation expectations unanchoring would concern me.
Recent data suggest downside risk to economic growth.
Long-term inflation expectations are broadly anchored.
More monetary policy work required for price stability.
Economic growth outlook looks good and job market is healthy.
Outlook is for continued solid economic growth, but recent consumer and housing data pose some downside risk.
Patient approach to policy will help achieve Fed's goals and sustain economic growth.
Restrictive monetary policy still needed to ensure inflation returns to 2% target.
It's hard to separate weather and confidence from January spending.
I see the labor market as at, or around, full employment.
There are good reasons to think that productivity growth is persistent.
-
18:06
Dow Jones Industrial Average softens on uneasy Monday
- The Dow Jones shed some weight on Monday, easing lower around 270 points.
- Equity markets await the latest news on Trump tariff plans; details are expected on Tuesday.
- Manufacturing expectations dipped again, but price worries continue to rise.
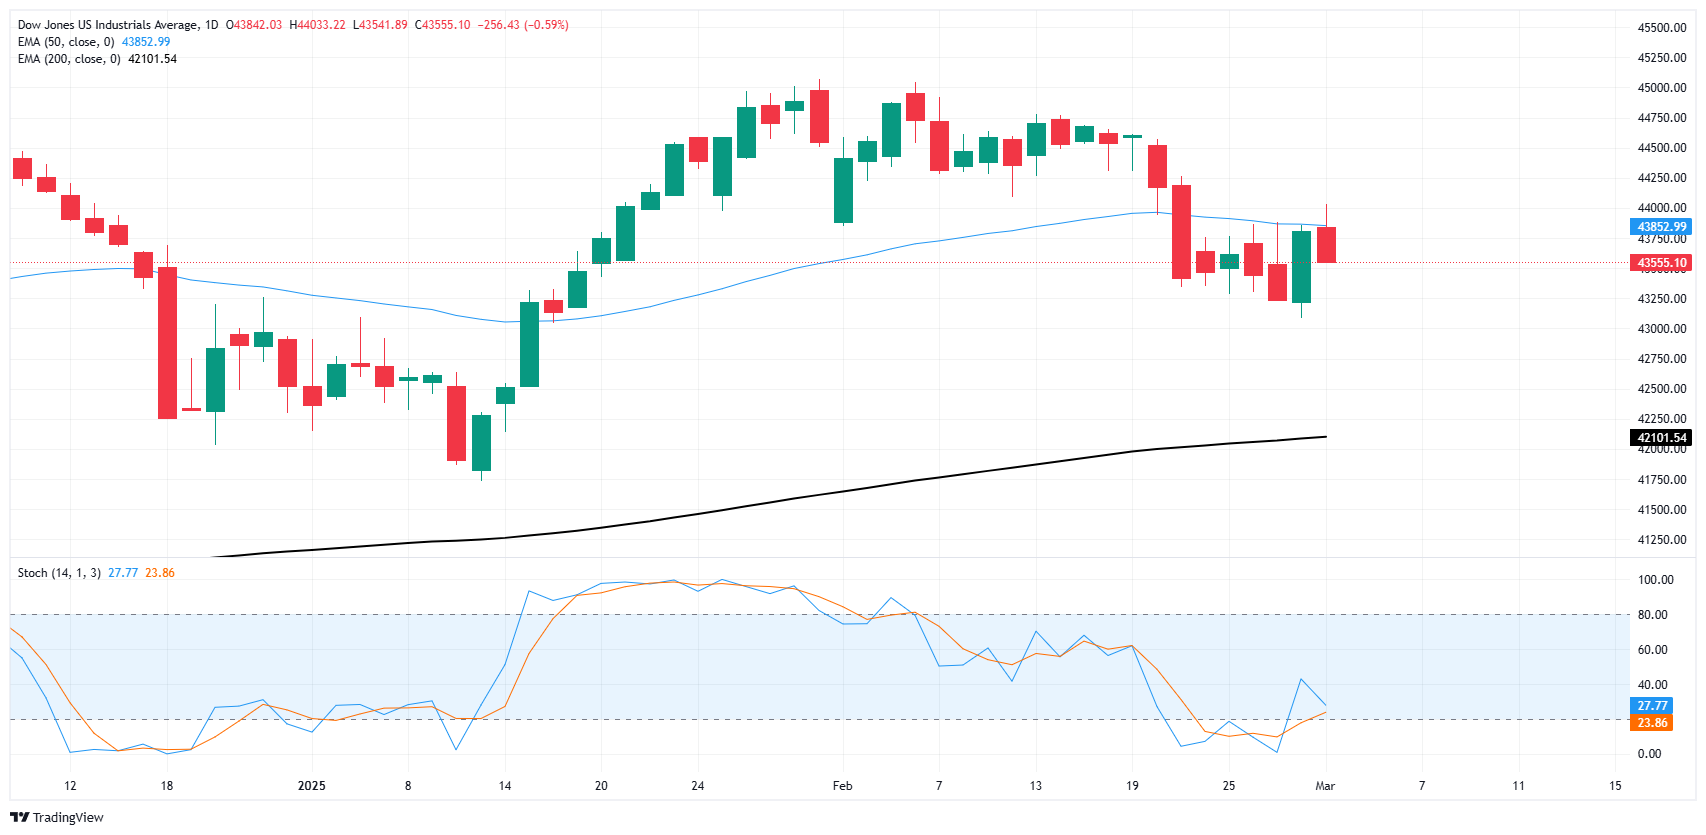
The Dow Jones Industrial Average (DJIA) spun in a worried circle on Monday, opening the gates on a new trading week and holding near the 43,800 level before ongoing investor worries took hold and dragged the DJIA lower by around 270 points for the day. The major equity index continues to churn out a middling pattern near key moving averages as investors await the latest iteration of United States (US) President Donald Trump’s tariff threats. Paradoxically, Trump’s tariffs are claimed to be both a masterful negotiating tactic by the Republican platform runner who doesn’t actually intend to impose import taxes on his own citizens, but also a critically necessary form of revenue generation for the US government that will be getting imposed no matter what. Whichever form the tariffs take tend to depend on who in the Trump administration is talking.
According to President Trump and his staffers, further details on an impending 25% tariff package on Canada and Mexico, as well as yet another 10% levy on Chinese imports, are expected at some point on Tuesday.
PMI figures miss the mark ahead of another NFP Friday
Another Nonfarm Payrolls (NFP) week is on the books, with Friday’s key jobs data looming ahead. Things are off to a soft start after US ISM Purchasing Managers Index (PMI) survey results came in softer than expected. According to a sampling of key business operators, business activity expectations for March shrank slightly, with the ISM Manufacturing PMI falling to 50.3. The economic indicator is still holding above the key 50.0 level that typically separates contraction versus expansion expectations, but the one-month fall from February’s 50.9 accelerated through median market forecasts of a slight trim to 50.5.
US ISM Manufacturing Prices Paid accelerated however, bringing renewed inflation fears back into the picture. The indicator rose to nearly a two-year high as tariff fears continue to squeeze higher price pressures into the market. ISM Prices Paid expectations rose to 62.4 in March, rising from the previous print of 50.9 and blowing through the forecast of 56.2.
Dow Jones news
Most of the Dow Jones is trading into the green on Monday, despite some overall tepid tones from equity markets to kick off the new trading week. Reports are surfacing that Nvidia (NVDA) products have been making their way to China despite US restrictions on Chinese access to US-produced microchips. Singapore is officially probing some of Nvidia’s key customers, including Dell (DELL) and Super Micro Computer (SMCI), who may have been putting Nvidia’s latest chipset, Blackwell, into servers and then shipping them to China in order to subvert export restrictions. Nvidia is down around 5.6%, tumbling below $118 per share.
Dow Jones price forecast
The Dow Jones continues to churn into the 50-day Exponential Moving Average (EMA) at 43,850, and price action is set for further downside explorations after the latest swing low found the 43,200 level. The DJIA is still holding well into bull country on the north side of the 200-day EMA at 42,100, however the ongoing bullish trend is beginning to grow long in the tooth. It has been 14 consecutive trading weeks since the Dow Jones set a new all-time high, and signs of exhaustion are beginning to set in as bidders get used to trading below the 44,000 handle.
Dow Jones daily chart
Dow Jones FAQs
The Dow Jones Industrial Average, one of the oldest stock market indices in the world, is compiled of the 30 most traded stocks in the US. The index is price-weighted rather than weighted by capitalization. It is calculated by summing the prices of the constituent stocks and dividing them by a factor, currently 0.152. The index was founded by Charles Dow, who also founded the Wall Street Journal. In later years it has been criticized for not being broadly representative enough because it only tracks 30 conglomerates, unlike broader indices such as the S&P 500.
Many different factors drive the Dow Jones Industrial Average (DJIA). The aggregate performance of the component companies revealed in quarterly company earnings reports is the main one. US and global macroeconomic data also contributes as it impacts on investor sentiment. The level of interest rates, set by the Federal Reserve (Fed), also influences the DJIA as it affects the cost of credit, on which many corporations are heavily reliant. Therefore, inflation can be a major driver as well as other metrics which impact the Fed decisions.
Dow Theory is a method for identifying the primary trend of the stock market developed by Charles Dow. A key step is to compare the direction of the Dow Jones Industrial Average (DJIA) and the Dow Jones Transportation Average (DJTA) and only follow trends where both are moving in the same direction. Volume is a confirmatory criteria. The theory uses elements of peak and trough analysis. Dow’s theory posits three trend phases: accumulation, when smart money starts buying or selling; public participation, when the wider public joins in; and distribution, when the smart money exits.
There are a number of ways to trade the DJIA. One is to use ETFs which allow investors to trade the DJIA as a single security, rather than having to buy shares in all 30 constituent companies. A leading example is the SPDR Dow Jones Industrial Average ETF (DIA). DJIA futures contracts enable traders to speculate on the future value of the index and Options provide the right, but not the obligation, to buy or sell the index at a predetermined price in the future. Mutual funds enable investors to buy a share of a diversified portfolio of DJIA stocks thus providing exposure to the overall index.
-
18:00
Mexican Peso rebounds as markets await tariff decision
- USD/MXN dips 0.41% to 20.41 ahead of key trade developments.
- Trump’s 25% tariffs on Mexico set to take effect Tuesday, pending final decision.
- Mexico’s business confidence deteriorates, manufacturing contracts for the eighth straight month.
- US economic data mixed with weak ISM PMI fueling growth concerns.
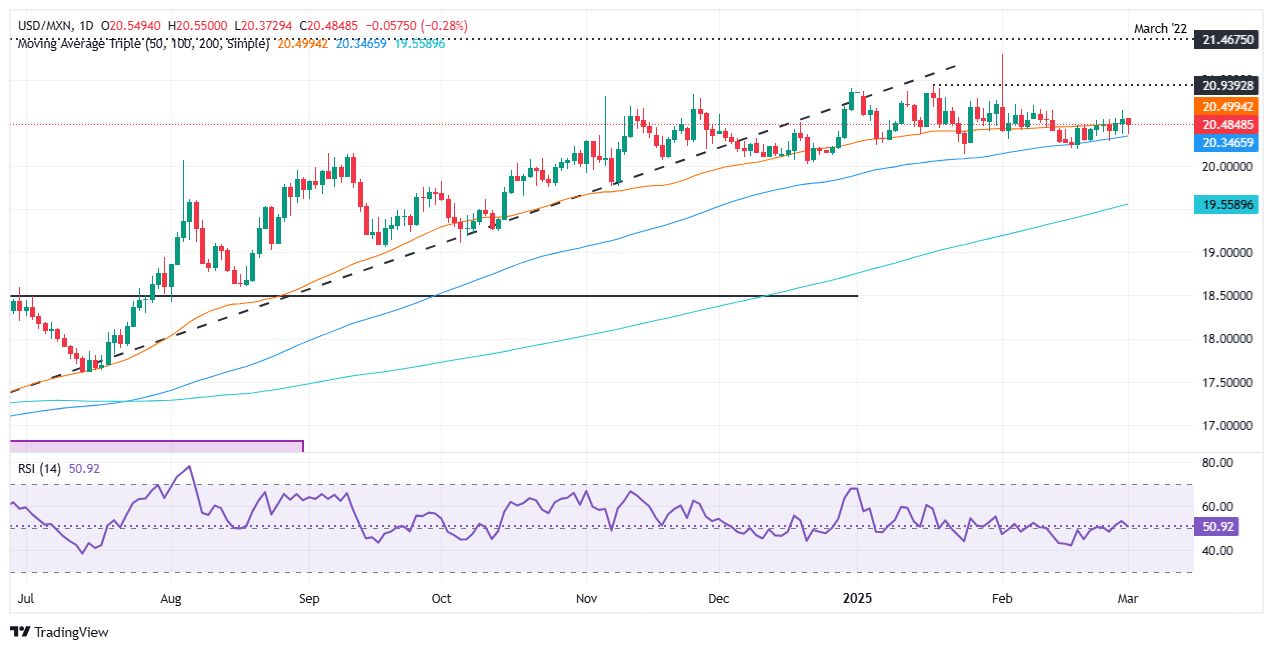
The Mexican Peso recovers some ground against the Greenback on Monday, a day before tariffs of 25% would be applied on Mexican goods imported to the United States (US) as President Donald Trump promised. However, the Peso rises as decent US economic data did little to offset projections that the economy might not grow in Q1 2025, according to the Atlanta Fed’s GDPNow model. The USD/MXN trades at 20.41, down 0.41%.
Over the weekend, the US Commerce Secretary said that tariffs on Mexico and Canada commence on Tuesday but that Trump would determine whether to stick to the planned 25% level. If tariffs proceed as projected, it could prompt traders to seek the security of the US Dollar (USD) and push the USD/MXN higher. Otherwise, the Peso could sustain a relief rally, and the pair could continue to edge lower.
Mexico’s economic data showed that business manufacturing activity contracted for the eight straight month, revealed S&P Global. At the same time, Business Confidence in February continued to witness a deterioration, revealed by the National Statistics Agency (INEGI), underscoring the gloomy economic outlook.
Banco de Mexico (Banxico) private economists’ poll was revealed, and analysts expect growth to remain below 1%, while inflation expectations remain unchanged.
Across the border, Manufacturing PMI data revealed by S&P Global and the Institute for Supply Management (ISM) was mixed. The former expanded compared to January’s figures, while the ISM dipped but remained in expansionary territory.
Daily digest market movers: Mexican Peso rises despite soft economic data
- Mexico’s Manufacturing PMI in February, according to S&P Global, contracted 47.6, down from 49.1. That was due to “demand conditions remaining on a downward path and cashflow pressures intensifying,” said Pollyanna de Lima, Economics Associate Director at S&P Global Market Intelligence.
- Business Confidence in Mexico fell 1.4 points, down from 51.5 to 50.1. Compared to last year, the index plunged 4.9 points, though the index has expanded for the last 25 straight months above the 50 threshold.
- Banxico’s poll showed that Gross Domestic Product (GDP) is expected at 0.81%, down from 1% for 2025. Headline inflation is predicted to end at 3.71%, down from 3.83%, and core Consumer Price Index (CPI) is estimated to end at 3.75%, up from 3.75%.
- Economists estimate the USD/MXN exchange rate to end 2025 at 20.85, down from 20.90, but for 2026 they eye a depreciation of the Peso far beyond the 21.30 figure expected in the January poll.
- The US ISM Manufacturing PMI showed that business activity in February remained steady at 50.3, down from 50.9 and below economists’ estimates of 50.5.
- S&P Global revealed that manufacturing activity in February increased by 52.7, up from 51.2 and exceeding forecasts of 51.6.
USD/MXN technical outlook: Mexican Peso climbs as USD/MXN drops below 20.50
The USD/MXN uptrend remains in place, though the exotic pair has consolidated within the 20.20–20.70 range for the latest 18 days, hinting that buyers are not committed to pushing spot prices higher. Short term, momentum is tilted to the downside as depicted by the Relative Strength Index (RSI) turning bearish.
For a bearish continuation, the USD/MXN must clear the 100-day Simple Moving Average (SMA) at 20.30. Once surpassed, the next stop would be the 20.00 figure ahead of the 200-day SMA at 19.50. On the other hand, if buyers push the exchange rate past 20.50, they must clear the latest peak seen at 20.71 on February 6, before testing the February 3 high at 21.28.
Mexican Peso FAQs
The Mexican Peso (MXN) is the most traded currency among its Latin American peers. Its value is broadly determined by the performance of the Mexican economy, the country’s central bank’s policy, the amount of foreign investment in the country and even the levels of remittances sent by Mexicans who live abroad, particularly in the United States. Geopolitical trends can also move MXN: for example, the process of nearshoring – or the decision by some firms to relocate manufacturing capacity and supply chains closer to their home countries – is also seen as a catalyst for the Mexican currency as the country is considered a key manufacturing hub in the American continent. Another catalyst for MXN is Oil prices as Mexico is a key exporter of the commodity.
The main objective of Mexico’s central bank, also known as Banxico, is to maintain inflation at low and stable levels (at or close to its target of 3%, the midpoint in a tolerance band of between 2% and 4%). To this end, the bank sets an appropriate level of interest rates. When inflation is too high, Banxico will attempt to tame it by raising interest rates, making it more expensive for households and businesses to borrow money, thus cooling demand and the overall economy. Higher interest rates are generally positive for the Mexican Peso (MXN) as they lead to higher yields, making the country a more attractive place for investors. On the contrary, lower interest rates tend to weaken MXN.
Macroeconomic data releases are key to assess the state of the economy and can have an impact on the Mexican Peso (MXN) valuation. A strong Mexican economy, based on high economic growth, low unemployment and high confidence is good for MXN. Not only does it attract more foreign investment but it may encourage the Bank of Mexico (Banxico) to increase interest rates, particularly if this strength comes together with elevated inflation. However, if economic data is weak, MXN is likely to depreciate.
As an emerging-market currency, the Mexican Peso (MXN) tends to strive during risk-on periods, or when investors perceive that broader market risks are low and thus are eager to engage with investments that carry a higher risk. Conversely, MXN tends to weaken at times of market turbulence or economic uncertainty as investors tend to sell higher-risk assets and flee to the more-stable safe havens.
-
15:58
Europe: Brave new world – Standard Chartered
Europe’s ability to defend itself and Ukraine is probably greater than is perceived. But in the short term and in the case of an all-out war with Russia, a US backstop is irreplaceable. Europe likely to continue financial support for Ukraine, whilst ramping up its own defence spending. EUR 500bn extra funding could be needed over five years to boost defence spending to 3.0% of GDP. Growth impact will depend on how the money is raised, where it is spent, and reliance on imports, Standard Chartered's economists note.
Europe to continue supporting Ukraine, whatever it takes
"Initial impressions that the US might impose a ceasefire on essentially all Russian terms, with no consultations with either Europe or Ukraine, have been more nuanced of late, with Washington seemingly more open to European arguments that a peace deal at any costs would endanger the whole international security architecture. However, it posed the question of what would and could Europeans do without any US backing. Europe could do much more to (re)arm itself and Ukraine and act as a credible deterrent to any future Russian aggression. But short-term, in a scenario of an all-out war with Russia, Western Europe would still need the irreplaceable backing of the US."
"Irrespective of how the war unfolds, Europe will likely have to continue providing financial support for Ukraine, whilst also ramping up its own defence spending. We estimate the additional spending costs of increasing defence spending to 3.0% of GDP over the next five years in the order of EUR 500bn. EU states are considering various mechanisms to achieve this, from a relaxing of EU fiscal rules to repurposing recovery funds, as well as possible EU common borrowing."
"We explore how each would work in practice, and their likelihood given political interests. While a major increase in defence spending could have positive implications for growth, any benefit will be limited by how the money is raised (tax increases or spending cuts elsewhere would mitigate the impact), where the money is spent (R&D carries the biggest spillovers), the degree to which countries work together, and to what extent imports are relied upon."
-
15:51
US reciprocal tariffs: What could they look like? – Standard Chartered
US will deliver full reciprocal trade analysis on 1 April; it is likely to focus on 20 key economies initially. Tariff differentials are small, and our estimates of non-tariff barriers do not give the US much leverage. Tariffs could be raised significantly by including VAT rates (heavily disputed as a trade barrier). In addition to China and the EU, Argentina, India, Brazil and UK look vulnerable; but concessions are likely to be negotiated, Standard Chartered's Economists Madhur Jha and Ethan Lester note.
Targeting a high number
"The deadline for US investigations to be completed under the Reciprocal Trade Act is 1 April. There is still uncertainty on the scope and implementation of any resulting tariffs. More recent communications, however, suggest that the Trump administration is focusing on the EU and 20 large major and EM economies in its initial investigations on reciprocal tariffs. Tariff rate differentials with the US tend to be highest for EM, but equalising these differentials is unlikely to meet the US objectives of raising revenues or narrowing trade deficits. To make significant progress on either of these objectives, we think the US will look to target key trading partners like China and the EU."
"This is likely to mean a greater focus on imputing a value to non-tariff barriers (NTBs) and on treating VAT as a trade barrier. Imputing a tariff equivalent (ad-valorem equivalent, or AVE) to NTBs is notoriously difficult. However, we attempt a rough estimate using a joint study by the UN Trade and Development (UNCTAD) and the World Bank as a basis. For simplicity, we assume that the US imposes one average tariff rate on all goods from each country."
"Tariff increases based on NTBs are still small, so the US could focus (controversially) on VAT as a trade barrier. In its review of NTBs in the past few years, the US administration has particularly focused on VAT distortions in China, the EU, Türkiye, Argentina and Russia. Taking tariff differentials, NTBs and VAT together, Argentina, India, Türkiye, Russia, Brazil, the EU and the UK are all vulnerable – we see them facing possible reciprocal tariffs of 20%+. However, some of these economies have already made overtures to the US to gain concessions."
-
15:45
EUR/USD Price Analysis: Bulls regain control, breaking key resistance levels
- EUR/USD surged at the start of the week, posting strong gains and reclaiming higher ground.
- The pair soared past the convergence of the 20-day and 100-day SMA, signaling renewed bullish momentum.
- Resistance is now seen at 1.0520, while support lies at 1.0450, with indicators suggesting further upside potential.
EUR/USD kicked off the week with a solid rally rising past 1.0450, climbing above key technical levels and suggesting that buyers are regaining momentum. The pair decisively broke through the confluence of the 20-day and 100-day Simple Moving Averages (SMA), reinforcing a shift in sentiment. This move comes after last week's struggle around these levels, where sellers had temporarily kept the pair in check.
Technical indicators reflect this resurgence. The Relative Strength Index (RSI) is rising sharply in positive territory, confirming an increase in buying pressure. Meanwhile, the Moving Average Convergence Divergence (MACD) histogram shows decreasing red bars, hinting that while bullish momentum is strengthening, some consolidation could still take place before another push higher.
Looking ahead, immediate resistance is now located at 1.0520, a level that, if breached, could accelerate gains toward 1.0560. On the downside, support is found at 1.0450, which coincides with the recently broken moving averages. A drop below this level would weaken the bullish outlook and bring 1.0400 into focus.
EUR/USD daily chart
-
15:25
GBPUSD rallies on soft US ISM data, falling US yields
- Atlanta Fed GDP Now forecast weakens, fueling recession concerns.
- ISM Manufacturing PMI drops to 50.3 as Trump tariffs dent outlook.
- UK 10-year GILTS yield rises, while US 10-year T-note yield declines.
The Pound Sterling snaps two days of losses and rises over 0.89% amid a weaker US Dollar (DXY) which appreciated on Friday following a weaker than expected Atlanta GDP Now forecast for Q1 2025. At the time of writing, the GBP/USD traded at 1.2694 after hitting a daily low of 1.2577.
Pound rebounds toward 1.2700 as US slowdown fears weigh on USD
Last week’s data suggested the US economy is undergoing an economic slowdown. As of writing, the ISM Manufacturing PMI showed that business activity in February remained steady at 50.3, down from 50.9 and below economists’ estimates of 50.5. According to the ISM poll, the decline in other subcomponents of the PMI were fueled by Trump’s tariffs threats on imported goods.
Meanwhile, S&P Global revealed that manufacturing activity in February expanded by 52.7, up from 51.2 and exceeding forecasts of 51.6.
Across the pond, the economic docket in the United Kingdom remains light, though Bank of England (BoE) Governor Andrew Bailey could set the tone on Wednesday, on his appearance before the Treasury Select Committee.
Another reason from GBP/USD upside, is that the 10-year GILTS yield is pushing higher, while the yield of the US 10-year T-note continued to decline. This sponsored a leg-up in the pair, with buyers setting their sights on the 1.2700 handle.
Up next, the US economic docket will feature a speech by St. Louis Fed President Alberto Musalem.
GBP/USD Price Forecast: Technical outlook
The GBP/USD is neutral to slightly upward biased, but to cement the uptrend buyers must clear the latest cycle peak at 1.2715. If surpassed they will be able to challenge the 200-day Simple Moving Average (SMA) at 1.2785, followed by the 1.2800 mark. On the other hand, further weakness is seen, if the pair slides beneath the 100-day SMA at 1.2631, opening the door to test 1.2600.
British Pound PRICE Today
The table below shows the percentage change of British Pound (GBP) against listed major currencies today. British Pound was the strongest against the US Dollar.
USD EUR GBP JPY CAD AUD NZD CHF USD -1.11% -0.94% -0.21% -0.29% -0.60% -0.51% -0.59% EUR 1.11% 0.06% 0.69% 0.64% 0.41% 0.42% 0.34% GBP 0.94% -0.06% 0.74% 0.59% 0.36% 0.36% 0.28% JPY 0.21% -0.69% -0.74% 0.12% -0.36% -0.27% -0.41% CAD 0.29% -0.64% -0.59% -0.12% -0.17% -0.23% -0.30% AUD 0.60% -0.41% -0.36% 0.36% 0.17% 0.00% -0.08% NZD 0.51% -0.42% -0.36% 0.27% 0.23% -0.00% -0.08% CHF 0.59% -0.34% -0.28% 0.41% 0.30% 0.08% 0.08% The heat map shows percentage changes of major currencies against each other. The base currency is picked from the left column, while the quote currency is picked from the top row. For example, if you pick the British Pound from the left column and move along the horizontal line to the US Dollar, the percentage change displayed in the box will represent GBP (base)/USD (quote).
-
15:01
United States ISM Manufacturing Prices Paid above forecasts (56.2) in February: Actual (62.4)
-
15:00
United States ISM Manufacturing PMI came in at 50.3 below forecasts (50.5) in February
-
15:00
United States ISM Manufacturing New Orders Index down to 48.6 in February from previous 55.1
-
15:00
United States Construction Spending (MoM) below forecasts (0%) in January: Actual (-0.2%)
-
15:00
United States ISM Manufacturing Employment Index dipped from previous 50.3 to 47.6 in February
-
14:47
United States S&P Global Manufacturing PMI above forecasts (51.6) in February: Actual (52.7)
-
14:47
United States S&P Global Manufacturing PMI above expectations (51.6) in February: Actual (52)
-
14:34
USD/CAD slumps to near 1.4400 as investors await Trump’s tariffs plan for Canada
- USD/CAD falls sharply to near 1.4400 as investors look for US President Trump’s tariff plane for Canada, Mexico and China.
- Escalating dovish Fed bets have weighed on the US Dollar.
- Investors await the US ISM Manufacturing PMI, which will be published at 15:00 GMT.
The USD/CAD pair slides to near the key level of 1.4400 in North American trading hours on Monday. The Loonie pair weakens as the US Dollar (USD) underperforms across the board, with investors awaiting United States (US) President Donald Trump’s tariff plan for Canada, Mexico and China.
President Donald Trump is poised to impose tariffs on his North American peers and China on Tuesday as stated in his tweet on Truth.Social on Thursday. Trump said that he will slap 25% tariffs on Canada and Mexico, and additional 10% on China as drugs are still pouring into the economy.
However, US Commerce Secretary Howard Lutnick indicated over the weekend that tariffs by President Donald Trump on Canada and Mexico could be lower than 25%. Such a scenario will be favorable for the Canadian Dollar (CAD).
Erstwhile, escalating Federal Reserve (Fed) dovish bets have also weighed on the US Dollar. According to the CME FedWatch tool, the probability for the Fed to cut interest rates in the June meeting has increased to 74% from 63% a week ago. Fed dovish bets swelled due to a decline in the US Personal Spending data for January.
This week, investors will focus a slew of US economic and the Canadian labor market data.
In today’s session, investors will focus on the US ISM Manufacturing Purchasing Managers’ Index (PMI) data for February, which will be published at 15:00 GMT. The ISM Manufacturing PMI is estimated to have grown at a marginally slower pace to 50.8 from 50.9 in January.
US Dollar FAQs
The US Dollar (USD) is the official currency of the United States of America, and the ‘de facto’ currency of a significant number of other countries where it is found in circulation alongside local notes. It is the most heavily traded currency in the world, accounting for over 88% of all global foreign exchange turnover, or an average of $6.6 trillion in transactions per day, according to data from 2022. Following the second world war, the USD took over from the British Pound as the world’s reserve currency. For most of its history, the US Dollar was backed by Gold, until the Bretton Woods Agreement in 1971 when the Gold Standard went away.
The most important single factor impacting on the value of the US Dollar is monetary policy, which is shaped by the Federal Reserve (Fed). The Fed has two mandates: to achieve price stability (control inflation) and foster full employment. Its primary tool to achieve these two goals is by adjusting interest rates. When prices are rising too quickly and inflation is above the Fed’s 2% target, the Fed will raise rates, which helps the USD value. When inflation falls below 2% or the Unemployment Rate is too high, the Fed may lower interest rates, which weighs on the Greenback.
In extreme situations, the Federal Reserve can also print more Dollars and enact quantitative easing (QE). QE is the process by which the Fed substantially increases the flow of credit in a stuck financial system. It is a non-standard policy measure used when credit has dried up because banks will not lend to each other (out of the fear of counterparty default). It is a last resort when simply lowering interest rates is unlikely to achieve the necessary result. It was the Fed’s weapon of choice to combat the credit crunch that occurred during the Great Financial Crisis in 2008. It involves the Fed printing more Dollars and using them to buy US government bonds predominantly from financial institutions. QE usually leads to a weaker US Dollar.
Quantitative tightening (QT) is the reverse process whereby the Federal Reserve stops buying bonds from financial institutions and does not reinvest the principal from the bonds it holds maturing in new purchases. It is usually positive for the US Dollar.
-
14:30
Canada S&P Global Manufacturing PMI registered at 47.8, below expectations (51.9) in February
-
13:53
AUD/USD jumps to near 0.6230 as US Dollar tumbles, upside remains capped
- AUD/USD gains sharply to near 0.6230 as the US Dollar faces strong selling pressure.
- Fed dovish bets have escalated as US Personal Spending declined in January.
- The Australian Dollar would face selling pressure if Trump imposed additional 10% tariffs on China.
The AUD/USD pair climbs to near 0.6230 in North American trading hours on Monday. The Aussie pair gains as the US Dollar (USD) faces strong selling pressure after comments from United States (US) Commerce Secretary Howard Lutnick indicated that tariffs by President Donald Trump on Canada and Mexico could be lower than 25% as stated earlier.
The US Dollar Index (DXY), which tracks the Greenback’s value against six major currencies, tumbles to near 106.80.
US Dollar PRICE Today
The table below shows the percentage change of US Dollar (USD) against listed major currencies today. US Dollar was the strongest against the Japanese Yen.
USD EUR GBP JPY CAD AUD NZD CHF USD -0.93% -0.84% 0.29% -0.24% -0.40% -0.26% -0.32% EUR 0.93% -0.02% 1.00% 0.50% 0.43% 0.49% 0.43% GBP 0.84% 0.02% 1.13% 0.53% 0.45% 0.51% 0.46% JPY -0.29% -1.00% -1.13% -0.30% -0.63% -0.48% -0.60% CAD 0.24% -0.50% -0.53% 0.30% -0.01% -0.00% -0.07% AUD 0.40% -0.43% -0.45% 0.63% 0.00% 0.07% 0.00% NZD 0.26% -0.49% -0.51% 0.48% 0.00% -0.07% -0.06% CHF 0.32% -0.43% -0.46% 0.60% 0.07% -0.00% 0.06% The heat map shows percentage changes of major currencies against each other. The base currency is picked from the left column, while the quote currency is picked from the top row. For example, if you pick the US Dollar from the left column and move along the horizontal line to the Japanese Yen, the percentage change displayed in the box will represent USD (base)/JPY (quote).
Over the weekend, Howard Lutnick said to Fox News that there are going to be “tariffs on Mexico and Canada on Tuesday” but we are going to leave that for the “President and his team to negotiate”.
Additionally, escalating Federal Reserve (Fed) dovish bets have also weighed on the US Dollar. The probability for the Fed to cut interest rates in the June policy meeting has increased to 74% from 63% a week ago, according to the CME FedWatch tool. Fed dovish bets have swelled due to a decline in the US Personal Spending data for January.
Meanwhile, the upside in the Aussie pair remains capped as Donald Trump is poised to impose additional 10% tariffs on China, alongwith his North American peers. The impact of Trump’s tariffs is also unfavorable for the Australian Dollar (AUD) knowing that Australian exports rely heavily on the Chinese economy.
Going forward, investors will focus on the Reserve Bank of Australia (RBA) minutes for the February meeting, which will be released on Tuesday. In February, the RBA reduced its Official Cash Rate (OCR) by 25 basis points (bps) to 4.10%. This was the first interest rate cut decision by the RBA since November 2020. RBA Governor Michele Bullock guided a cautious stance on further policy-easing as the battle against inflation is not over yet.
Australian Dollar FAQs
One of the most significant factors for the Australian Dollar (AUD) is the level of interest rates set by the Reserve Bank of Australia (RBA). Because Australia is a resource-rich country another key driver is the price of its biggest export, Iron Ore. The health of the Chinese economy, its largest trading partner, is a factor, as well as inflation in Australia, its growth rate and Trade Balance. Market sentiment – whether investors are taking on more risky assets (risk-on) or seeking safe-havens (risk-off) – is also a factor, with risk-on positive for AUD.
The Reserve Bank of Australia (RBA) influences the Australian Dollar (AUD) by setting the level of interest rates that Australian banks can lend to each other. This influences the level of interest rates in the economy as a whole. The main goal of the RBA is to maintain a stable inflation rate of 2-3% by adjusting interest rates up or down. Relatively high interest rates compared to other major central banks support the AUD, and the opposite for relatively low. The RBA can also use quantitative easing and tightening to influence credit conditions, with the former AUD-negative and the latter AUD-positive.
China is Australia’s largest trading partner so the health of the Chinese economy is a major influence on the value of the Australian Dollar (AUD). When the Chinese economy is doing well it purchases more raw materials, goods and services from Australia, lifting demand for the AUD, and pushing up its value. The opposite is the case when the Chinese economy is not growing as fast as expected. Positive or negative surprises in Chinese growth data, therefore, often have a direct impact on the Australian Dollar and its pairs.
Iron Ore is Australia’s largest export, accounting for $118 billion a year according to data from 2021, with China as its primary destination. The price of Iron Ore, therefore, can be a driver of the Australian Dollar. Generally, if the price of Iron Ore rises, AUD also goes up, as aggregate demand for the currency increases. The opposite is the case if the price of Iron Ore falls. Higher Iron Ore prices also tend to result in a greater likelihood of a positive Trade Balance for Australia, which is also positive of the AUD.
The Trade Balance, which is the difference between what a country earns from its exports versus what it pays for its imports, is another factor that can influence the value of the Australian Dollar. If Australia produces highly sought after exports, then its currency will gain in value purely from the surplus demand created from foreign buyers seeking to purchase its exports versus what it spends to purchase imports. Therefore, a positive net Trade Balance strengthens the AUD, with the opposite effect if the Trade Balance is negative.
-
13:16
GBP firmer in line with European peers – Scotiabank
Pound Sterling (GBP) is firmer, in line with its European peers, as Gilt yields perk up on higher spending risks. UK data showed more or less as expected borrowing data for January, Scotiabank's Chief FX Strategist Shaun Osborne notes.
Gilt yields rise on spending outlook
"Revised data for the February Manufacturing PMI improved to a still soft 46.9, from the preliminary 46.4."
"Sterling gains on the session suggest a firm bid from the upper 1.25 zone to regain to the 100-day MA (1.2623). GBP resistance at 1.2720, last week’s high, remains firm resistance amid weak trend momentum, however, and spot will need to overcome this level to extend gains through the upper 1.27s in the short run."
-
13:14
EUR firmer on rising domestic yields – Scotiabank
The EUR has found a solid bid on the back of rising long-term yields as investors consider the potential for heftier government borrowing in Europe to bolster defence spending, Scotiabank's Chief FX Strategist Shaun Osborne notes.
EUR still trades well below FV
"The EUR has found a solid bid on the back of rising long-term yields as investors consider the potential for heftier government borrowing in Europe to bolster defence spending and nudge a higher in short-term yields on the back of stronger than expected preliminary Eurozone inflation for February (at 0.5% M/M and 2.4% Y/Y), Scotiabank's Chief FX Strategist Shaun Osborne notes."
"EZ/US 2Y spreads have narrowed to –194bps, the narrowest since late January. Spot continues to trade quite significantly below our short-term FV estimate (1.0744 today)."
"Solid gains intraday so far suggest firm support for the EUR around the upper 1.03 zone (40-day MA at 1.0393) and the potential for spot gains to extend to the low 1.05s (100-day MA at 1.0512, recent peaks around 1.0530)."
-
13:10
CAD: Markets await US tariff news Tuesday – Scotiabank
The Canadian Dollar (CAD) is little changed over the weekend as investors continue to focus on tariff uncertainty. US Commerce Sec. Lutnick commented Sunday that the president’s thinking on the approach to border tariffs was 'fluid' and noted both Canada and Mexico had made efforts to bolster border controls, Scotiabank's Chief FX Strategist Shaun Osborne notes.
CAD little changed on the day
"He said there will be tariffs Tuesday but exactly what emerges was up to the president. There is perhaps a hint here that the full force of 25% tariffs might not be unleashed tomorrow, given their negative implications of tariffs for the likes of the US auto, steel and textile sectors plus the inevitable bump in US prices at a time when surveys suggest continued concern in the US about inflation."
"Beyond tariffs, Canadian GDP data for Q4 reported last Friday support the idea that the economy was picking up momentum at the end of last year. December industry-level GDP was a bit weaker than expected but preliminary data for January suggest a modest pick up again. Were it not for tariff risks, Canadian swaps would likely not be looking at much, if any, additional easing now."
"Spot tested—and held—noted resistance at 1.4465/75 late Friday and that zone remains important resistance ahead of major resistance at 1.4795/00 after significant daily and weekly reversals formed here in early February. Support is 1.4350/75 and 1.4250."
-
13:08
USD slips as markets ponder tariff risks – Scotiabank
The US Dollar (USD) is trading more defensively at the outset of what may be a decisive week for markets. President Trump’s drugs/border tariffs reprieve for Canada, Mexico and China ends tomorrow and US data reports this week may present further evidence of slowing US growth momentum after last week’s softer-than-expected data (GDP revision, sentiment data and consumer sentiment), Scotiabank's Chief FX Strategist Shaun Osborne notes.
USD eases as investors ponder tariff, growth risks
"Growth concerns, sprinkled with worries about sticky prices, will come into sharper relief this week if the US pushes ahead with tariffs which are all but certain to lift price pressures and chill activity in key industrial sectors. Note that after last week’s data round, the Atlanta Fed’s GDPNow tracking plunged; US data reports this week may add to growth concerns, particularly if weak government hiring is evident in the NFP report Friday."
"On the session so far, European FX has strengthened on expectations of increased defence spending and pressure for a resolution to the Ukraine war. Eurozone CPI data was also a little warmer than expected, lifting short-term yields. Asia FX is underperforming, meanwhile, as the CNY softens on tariff risks. Japan’s vice Finance Minister Mimura—the country’s point person on FX—said that a weak yen could hinder growth in real wages, which officials view as a key ingredient to ensure price and economic trends remain positive."
"Broader USD trends continue to mimic the pattern of trade seen in the early stages of the first Trump presidency; if that pattern extends, the USD may be on the cusp of another lurch lower. US data reports this morning include final manufacturing PMI, Construction Spending and the February ISM Manufacturing data. Mexico releases Remittances data at 10ET. The Fed’s Musalem speaks on the economy and policy outlook at 12.35ET."
-
13:00
Singapore Purchasing Managers Index down to 50.7 in February from previous 50.9
-
13:00
Brazil S&P Global Manufacturing PMI up to 53 in February from previous 50.7
-
12:26
US Dollar edges lower as dust settles over Oval Office spat
- The US Dollar edges lower on Monday after market sentiment improved as European leaders will to guarantee a peace deal in Ukraine.
- Traders will focus on key US manufacturing data on Monday with the ISM and S&P Global PMI release.
- The US Dollar Index (DXY) seems to be looking for nearby support after last week’s surge.
The US Dollar Index (DXY), which tracks the performance of the US Dollar (USD) against six major currencies, edges slightly lower and trades near 107.00 at the time of writing on Monday. Market mood improved after European leaders, including Ukrainian President Volodymyr Zelenskyy, showed a willingness to guarantee a peace deal in Ukraine on Sunday. The plan now needs to be backed by the United States (US).
On the economic data front, the focus will be on the manufacturing sector in the United States. In addition to the S&P Global Purchase Managers Index (PMI) final reading for February, the Institute for Supply Management (ISM) will release its specific manufacturing PMI report. Besides the headline gauge, the Prices Paid and New Orders components could give some insight into inflation and how order books look in the sector after just over a month of US President Trump’s influence.
Daily digest market movers: All about Manufacturing
- At 14:45 GMT, S&P Global releases its Manufacturing PMI final reading for February. Expectations are for a steady 51.6 from the preliminary reading.
- At 15:00 GMT, the ISM will release its report on the Manufacturing sector for February.
- The headline PMI is expected to come in at 50.5 compared to 50.9 in January.
- The Prices Paid subindex is expected to come in at 56.2, coming from 54.9 in January.
- The New Orders component does not have a forecast available and stood at 55.1 in the January reading.
- Equities are in a good mood and are mildly positive at the start of this week.
- The CME Fedwatch Tool projects a 25.4% chance that interest rates will remain at the current range of 4.25%-4.50% in June, with the rest showing a possible rate cut.
- The US 10-year yield trades around 4.25%, further down from last week’s high of 4.574%.
US Dollar Index Technical Analysis: Headlines are the new data
This week could not start with more uncertainty, with many moving parts and ties still loose since Friday’s burst out at the Oval Office. It becomes relatively clear that US data will be seen as being on auto-pilot, while geopolitics will be the main drivers going deeper into 2025. Traders will need to embrace the new regime where one headline could easily snap a nice continuum or trend in any asset, as well as for the US Dollar Index.
On the upside, the 55-day Simple Moving Average (SMA) is the first resistance to watch for any rejection, currently at 107.98. In case the DXY can break above the 108.00 round level, 108.50 is coming back in scope.
On the downside, the 107.00 round level needs to hold as support. Nearby, 106.84 (100-day SMA) and 106.52, as a pivotal level, should act as support and avoid any returns to the lower 106-region.
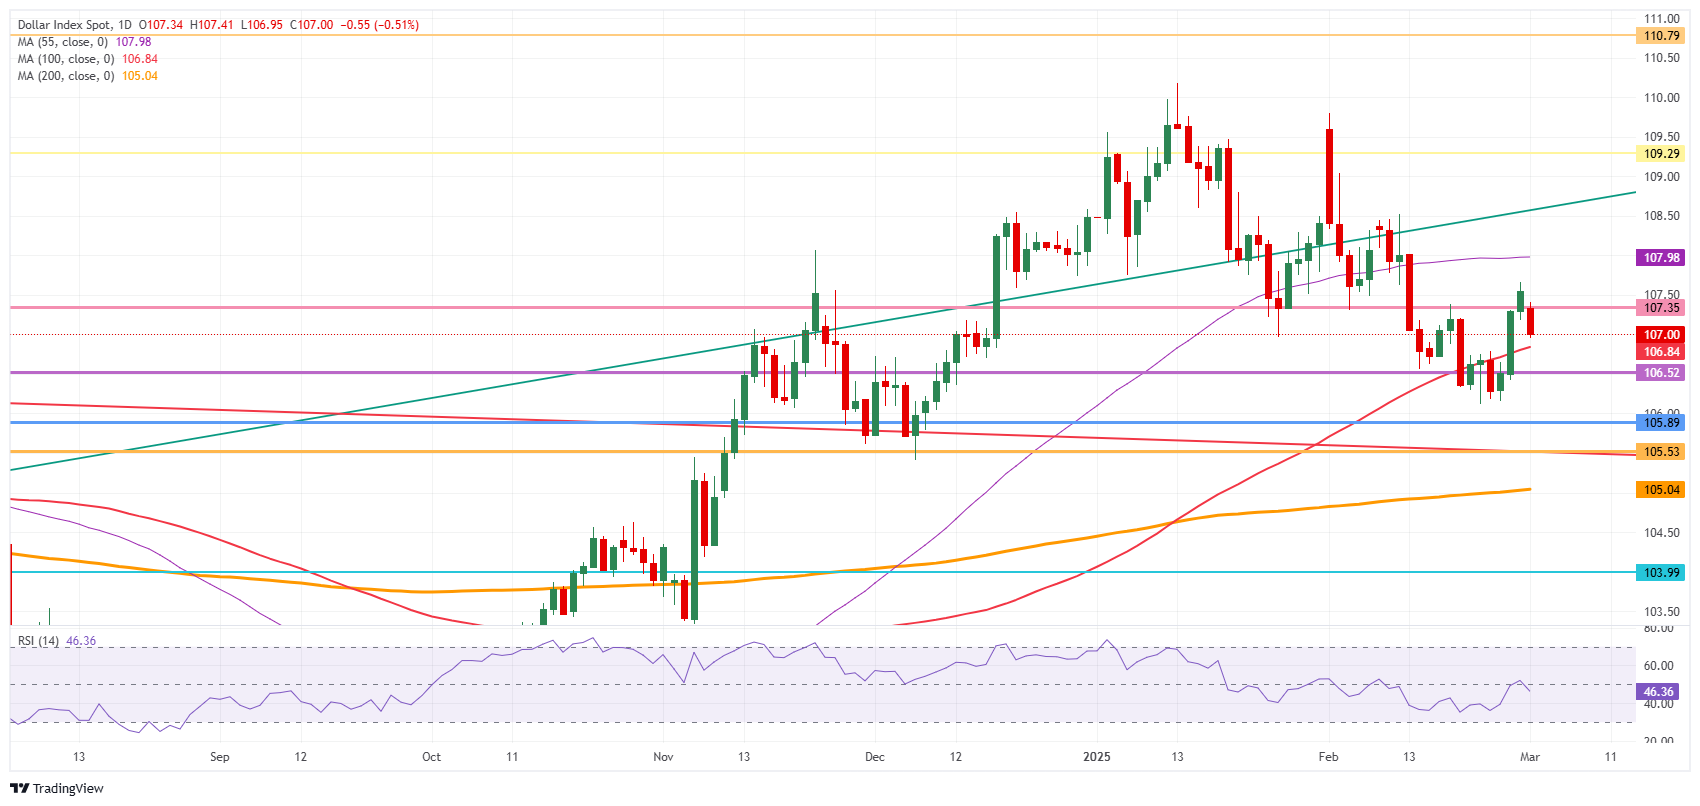
US Dollar Index: Daily Chart
US-China Trade War FAQs
Generally speaking, a trade war is an economic conflict between two or more countries due to extreme protectionism on one end. It implies the creation of trade barriers, such as tariffs, which result in counter-barriers, escalating import costs, and hence the cost of living.
An economic conflict between the United States (US) and China began early in 2018, when President Donald Trump set trade barriers on China, claiming unfair commercial practices and intellectual property theft from the Asian giant. China took retaliatory action, imposing tariffs on multiple US goods, such as automobiles and soybeans. Tensions escalated until the two countries signed the US-China Phase One trade deal in January 2020. The agreement required structural reforms and other changes to China’s economic and trade regime and pretended to restore stability and trust between the two nations. However, the Coronavirus pandemic took the focus out of the conflict. Yet, it is worth mentioning that President Joe Biden, who took office after Trump, kept tariffs in place and even added some additional levies.
The return of Donald Trump to the White House as the 47th US President has sparked a fresh wave of tensions between the two countries. During the 2024 election campaign, Trump pledged to impose 60% tariffs on China once he returned to office, which he did on January 20, 2025. With Trump back, the US-China trade war is meant to resume where it was left, with tit-for-tat policies affecting the global economic landscape amid disruptions in global supply chains, resulting in a reduction in spending, particularly investment, and directly feeding into the Consumer Price Index inflation.
-
12:19
South Africa Total New Vehicle Sales: 47.98 (February) vs 46.4
-
11:46
Silver Price Forecast: XAG/USD strengthens as US Dollar weakens due to increase in Fed dovish bets
- Silver price gains sharply as a decline in US Personal Spending has prompted Fed dovish bets.
- This week, investors will pay close attention to the US NFP data for February.
- US President Trump is set to impose tariffs on his North American peers and China on March 4.
Silver price (XAG/USD) surges an almost 1% to near $31.50 in European trading hours on Monday. The white metal strengthens as an increase in Federal Reserve (Fed) dovish bets has weighed on the US Dollar (USD).
The US Dollar Index (DXY), which tracks the Greenback’s value against six major currencies, resumes its downside after a three-day upside move and slumps to near 107.00.
According to the CME FedWatch tool, there is a 77% chance that the Fed will cut its borrowing rates in June, up from 63% a week ago. In the March and May policy meetings, the Fed is almost certain to keep interest rates steady in the range of 4.25%-4.50%.
Traders have raised bets supporting the Fed to reduce its borrowing rates in June after the United States (US) Personal Spending data declined for the first time in January in two years.
For more cues on the Fed’s monetary policy outlook, investors will focus on a slew of US economic data, notably on the Nonfarm Payrolls (NFP), releasing this week.
Meanwhile, fears of US President Donald Trump’s tariffs on Canada, Mexico, and China have also increased the demand for safe-haven Silver. On March 4, Trump is poised to impose tariffs on these countries for pouring drugs into the US economy.
Silver technical analysis
Silver price recovers to near $31.50 in Monday’s European session. However, the outlook of the Silver price remains bearish as it trades below the 50-day Exponential Moving Average (EMA), which is around $31.80.
The 14-day Relative Strength Index (RSI) falls inside the 40.00-60.00 range, suggesting that the bullish momentum has faded. However, the bullish bias remains intact.
Looking down, the upward-sloping trendline from the August 8 low of $26.45 will act as key support for the Silver price around $30.00. While, the February 14 high of $33.40 will be the key barrier.
Silver daily chart
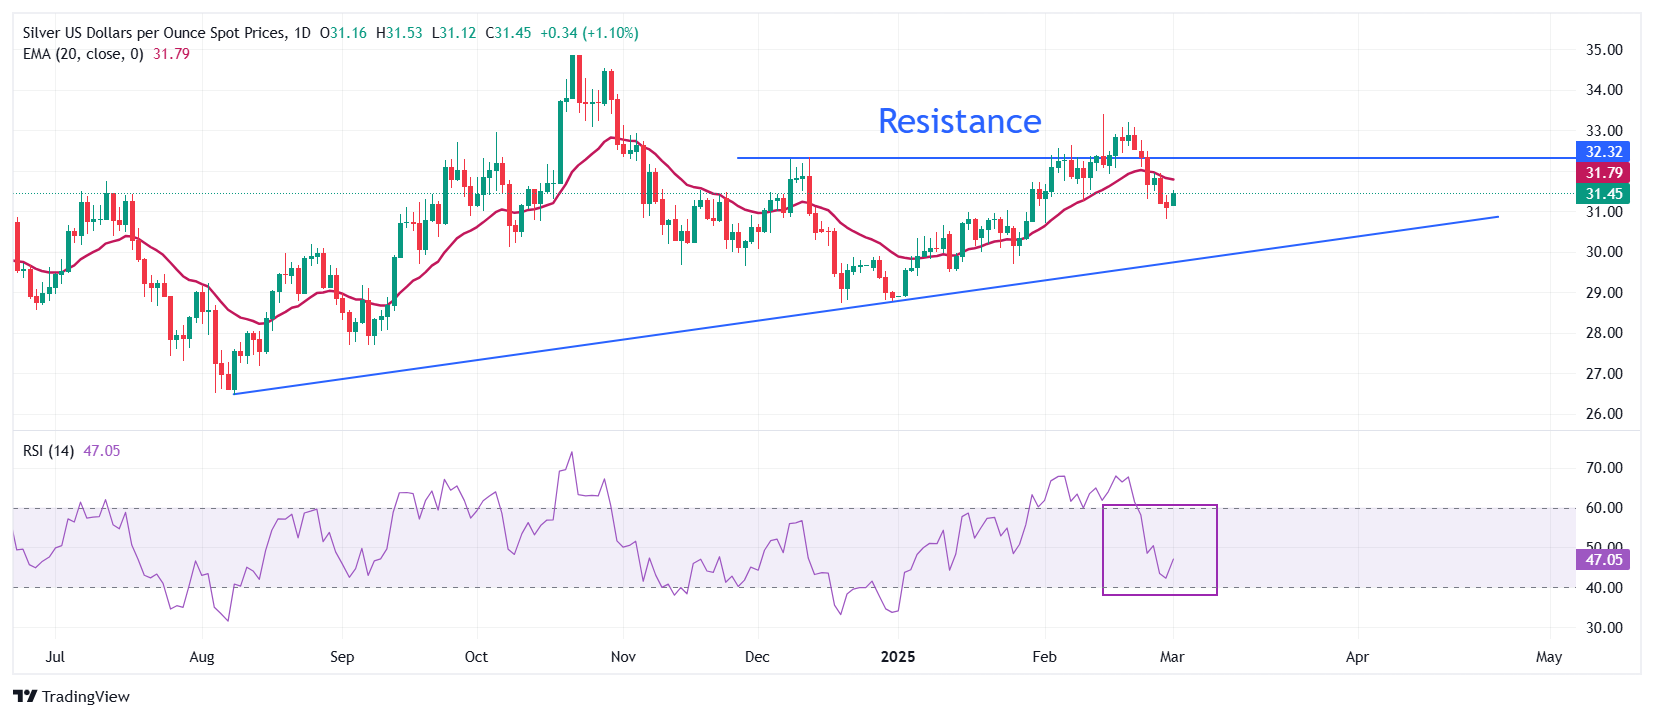
Silver FAQs
Silver is a precious metal highly traded among investors. It has been historically used as a store of value and a medium of exchange. Although less popular than Gold, traders may turn to Silver to diversify their investment portfolio, for its intrinsic value or as a potential hedge during high-inflation periods. Investors can buy physical Silver, in coins or in bars, or trade it through vehicles such as Exchange Traded Funds, which track its price on international markets.
Silver prices can move due to a wide range of factors. Geopolitical instability or fears of a deep recession can make Silver price escalate due to its safe-haven status, although to a lesser extent than Gold's. As a yieldless asset, Silver tends to rise with lower interest rates. Its moves also depend on how the US Dollar (USD) behaves as the asset is priced in dollars (XAG/USD). A strong Dollar tends to keep the price of Silver at bay, whereas a weaker Dollar is likely to propel prices up. Other factors such as investment demand, mining supply – Silver is much more abundant than Gold – and recycling rates can also affect prices.
Silver is widely used in industry, particularly in sectors such as electronics or solar energy, as it has one of the highest electric conductivity of all metals – more than Copper and Gold. A surge in demand can increase prices, while a decline tends to lower them. Dynamics in the US, Chinese and Indian economies can also contribute to price swings: for the US and particularly China, their big industrial sectors use Silver in various processes; in India, consumers’ demand for the precious metal for jewellery also plays a key role in setting prices.
Silver prices tend to follow Gold's moves. When Gold prices rise, Silver typically follows suit, as their status as safe-haven assets is similar. The Gold/Silver ratio, which shows the number of ounces of Silver needed to equal the value of one ounce of Gold, may help to determine the relative valuation between both metals. Some investors may consider a high ratio as an indicator that Silver is undervalued, or Gold is overvalued. On the contrary, a low ratio might suggest that Gold is undervalued relative to Silver.
-
11:24
USD/CNH: Potential for USD to rise to 7.3250 – UOB Group
US Dollar (USD) is likely to trade in a range between 7.2780 and 7.3010. In the longer run, strong advance indicates there is potential for USD to rise to 7.3250, UOB Group's FX analysts Quek Ser Leang and Peter Chia note.
USD is set to rise to 7.3250
24-HOUR VIEW: "USD rose sharply last Thursday. On Friday, we highlighted that 'conditions are deeply overbought, but provided that 7.2770 is not breached, USD could test 7.3100.' Our expectations did not materialise, as USD traded in a 7.2848/7.3015 range, closing largely unchanged at 7.2957 (-0.07%). The current price movements are likely part of a range trading phase. Today, we expect USD to trade between 7.2780 and 7.3010."
1-3 WEEKS VIEW: "We continue to hold the same view as last Friday (28 Feb, spot at 7.2950). As highlighted, the strong advance from last Thursday 'indicates there is potential for USD to rise to 7.3250.' We will maintain the same view as long as 7.2600 (no change in ‘strong support’ level) is intact."
-
11:20
NZD/USD: Fundamental equilibrium is estimated at 0.6600 – BBH
NZD/USD is heavy near 0.5600, BBH FX analysts report.
A higher terms of trade raises the fundamental value of NZD
"New Zealand’s terms of trade index overshot expectations rising 3.1% q/q in Q4 (consensus: 1.4%) vs. 2.5% in Q3 to the highest level since Q2 2022. A higher terms of trade has a positive net wealth effect on the economy and raises the fundamental value of NZD."
"Nonetheless, NZD needs to keep trading at a deep discount to fundamental equilibrium (which we estimate at around 0.6600) to attract foreign investments and recycle the country’s large current account deficit (-6.4% of GDP)."
-
11:16
USD/JPY advance to test 151.20 – UOB Group
Chance for overbought US Dollar (USD) advance to test 151.20 vs Japanese Yen (JPY); a sustained rise above this level is unlikely. In the longer run, downward momentum has faded; current price movements are likely part of a rebound that could potentially reach 151.90, UOB Group's FX analysts Quek Ser Leang and Peter Chia note.
Downward momentum has faded
24-HOUR VIEW: "We did not expect USD to rise sharply to 150.98 last Friday; we were expecting range trading. Although overbought, strong momentum suggests there is a chance for USD to test 151.20. A breach of this resistance is not ruled out, but a sustained rise above this level is unlikely. The major resistance at 151.90 is also unlikely to come into view today. To sustain the overbought momentum, USD must remain above 150.05, with minor support at 150.40."
1-3 WEEKS VIEW: "After maintaining a negative USD view since the middle of Feb (see annotations in the chart below), we cautioned last Friday (28 Feb, spot at 149.60) that 'downward momentum is slowing.' We added, 'if USD breaks above 150.20 (‘strong resistance’ level), it would mean that the weakness has stabilised.' That said, we did not expect the strong rise in USD that sent it to a high of 150.98. Not only has downward momentum faded, but upward momentum has increased somewhat. We view the current price movement as part of a rebound that could potentially reach 151.90. On the downside, should USD breach the ‘strong support’ level, currently at 149.45, it would suggest that it is likely to trade in a range instead of rebounding further."
-
11:13
USD/CNH: China economic activity edges up in February – BBH
USD/CNH is up above 7.3000 and stocks in China are trading on the defensive ahead of new US tariffs tomorrow, BBH FX analysts report.
Growth outlook set to remain unimpressive
"China economic activity edged up in February. The composite PMI increased to a two-month high at 51.1 vs. 50.1 in January as the manufacturing sector unexpectedly returned into growth and services activity ticked-up. The manufacturing PMI rose 0.3 point to 50.2 (consensus: 49.9) and the non-manufacturing PMI matched consensus at 50.4 vs. 50.2 in January. The private sector Caixin manufacturing PMI also improved more than anticipated to a three-month high at 50.8 (consensus: 50.4) vs. 50.1 in January."
"However, the growth outlook will remain unimpressive as long as policymakers fail to address the root cause of weak consumption spending activity: low household income levels, high precautionary savings, and high levels of household debt. China’s annual 'Two Sessions' National People's Congress meeting begins Wednesday. While detailed policy announcements are not expected, the sessions provide a valuable insight into the government’s fiscal and growth objectives."
-
11:08
NZD/USD: More likely to trade in a 0.5585/0.5630 range – UOB Group
Instead of weakening further, New Zealand Dollar (NZD) is more likely to trade in a 0.5585/0.5630 range. In the longer run, room for NZD to continue to weaken; it remains to be seen if 0.5565 is within reach, UOB Group's FX analysts Quek Ser Leang and Peter Chia note.
Room for NZD to continue to weaken
24-HOUR VIEW: "When NZD was at 0.5630 in early Asian trade last Friday, we noted that 'although deeply oversold, NZD could decline further.' However, we held the view that '0.5590 is likely out of reach for now.' NZD weakened more than expected, reaching a low of 0.5587. Conditions remain deeply oversold. This, combined with slowing momentum suggests that instead of weakening further, NZD is more likely to trade in a 0.5585/0.5630 range."
1-3 WEEKS VIEW: "Last Thursday (27 Feb, spot at 0.5700), we highlighted that 'downward momentum is beginning to build, and if NZD breaks and remains below 0.5680, it could trigger a decline to 0.5645.' After NZD dropped sharply, we highlighted last Friday (28 Feb, spot at 0.5630) that 'the price action suggests further NZD weakness, and the level to monitor is 0.5590.' NZD then dropped to 0.5587. While we continue to see room for NZD to weaken, it remains to be seen if the next support level at 0.5565 is within reach. On the upside, a breach of 0.5670 (‘strong resistance’ level was at 0.5685 last Friday) would indicate that NZD is not weakening further."
-
11:04
Oil: Peace deal hopes fade – ING
Uncertainty abounds following last week’s showdown between the US and Ukraine. It’s unclear where the US now stands, making a peace deal seem more distant than a week ago. This is altering energy-market hopes for an easing of sanctions. The shift in expecations is reflected in early morning price action for oil, with Brent up more than 1% at the time of writing. On top of the uncertainty about a Russia-Ukraine peace deal, markets are bracing for US tariffs on Canada, China and Mexico to be imposed on 4 March. China faces an additional 10% tariff, following a similar amount imposed last month, ING's commodity experts Ewa Manthey and Warren Patterson note.
Speculators continue to reduce exposure to the oil market
"Meanwhile, potential tariffs on Canada and Mexico will have great market impact, as these two countries are the largest suppliers of crude oil to the US. In 2024, 62% of US crude imports came from Canada, while 7% originated from Mexico. Tariffs would likely hurt Canadian producers. They have little flexibility to send oil to other countries, given that the bulk of pipeline infrastructure is directed towards the US. Canadian oil producers will likely have to accept larger discounts relative to WTI for their crude oil if tariffs go ahead. Mexico, by contrast, has more flexibility; US tariffs on Mexico will likely see crude redirected to other markets."
"Also in focus this week is China’s Two Sessions. In particular, the Government Work Report, which will unveil China’s 2025 growth target. It’s likely to be kept at 'around 5%,' while Beijing details priorities for fiscal and monetary policy amid growing trade tensions."
"The latest positioning data shows speculators continue to reduce exposure to the oil market as global uncertainty intensifies. Speculators reduced net longs in ICE Brent by 44,677 lots over the last reporting week, leaving them with a net long 220,546 lots. The bulk of this move was driven by longs liquidating positions. A similar move was seen in NYMEX WTI. Speculators sold 35,752 lots, leaving them with a net long of 67,578 lots. Speculators have significantly reduced their net long in WTI in recent weeks, holding their smallest net long in WTI since 2010."
-
11:01
WTI slumps to near $69.00 as Trump prepares to impose additional tariffs on China
- The Oil price slides sharply amid fears of Trump tariffs on China.
- US President Trump is expected to slap 10% additional tariffs on China on March 4.
- European leaders, including Zelenskyy, have agreed to structure Ukraine peace plan.
West Texas Intermediate (WTI), futures on NYMEX, tumbles to near $69.00 in European trading hours on Monday. The Oil price faces strong selling pressure as investors are cautious amid fears that United States (US) President Donald Trump will impose additional 10% tariffs on China for pouring drugs through Canadian and Mexican borders into their economy on March 4.
US President Trump had already slapped the same level of tariffs in the first week of February. More levies on China by the US would diminish the competitiveness of Chinese products in the global economy. Such a scenario would weaken demand for Chinese products, which will weigh on the Oil price, given that China is the largest importer of Oil in the world.
Meanwhile, Caixin Manufacturing Purchasing Managers’ Index (PMI) data for February has come in better than expected. The Manufacturing PMI, which gauges activities in the manufacturing sector, rose at a faster pace to 50.8, from the estimates of 50.3 and 50.1 seen in January. Technically, upbeat Caixin Manufacturing PMI indicates strong demand for Oil and boosts its price. However, investors are weighing more on the Chinese economic outlook.
Apart from Trump’s tariff fears, growing optimism over peace between Russia and Ukraine has also weighed on the Oil price. Over the weekend, United Kingdom (UK) Prime Minister Kier Starmer confirmed that European leaders, including Ukrainian President Volodymyr Zelenskyy, have agreed to structure a peace plan for ending the war in Ukraine, which entered its fourth year in February.
Investors expect a truce between Russia and Ukraine will be followed by Europe and the US revoking sanctions on Russia. Such a scenario would allow Russia to infuse Oil into the global market. An increase in seaborne Oil flows will weaken its price.
WTI Oil FAQs
WTI Oil is a type of Crude Oil sold on international markets. The WTI stands for West Texas Intermediate, one of three major types including Brent and Dubai Crude. WTI is also referred to as “light” and “sweet” because of its relatively low gravity and sulfur content respectively. It is considered a high quality Oil that is easily refined. It is sourced in the United States and distributed via the Cushing hub, which is considered “The Pipeline Crossroads of the World”. It is a benchmark for the Oil market and WTI price is frequently quoted in the media.
Like all assets, supply and demand are the key drivers of WTI Oil price. As such, global growth can be a driver of increased demand and vice versa for weak global growth. Political instability, wars, and sanctions can disrupt supply and impact prices. The decisions of OPEC, a group of major Oil-producing countries, is another key driver of price. The value of the US Dollar influences the price of WTI Crude Oil, since Oil is predominantly traded in US Dollars, thus a weaker US Dollar can make Oil more affordable and vice versa.
The weekly Oil inventory reports published by the American Petroleum Institute (API) and the Energy Information Agency (EIA) impact the price of WTI Oil. Changes in inventories reflect fluctuating supply and demand. If the data shows a drop in inventories it can indicate increased demand, pushing up Oil price. Higher inventories can reflect increased supply, pushing down prices. API’s report is published every Tuesday and EIA’s the day after. Their results are usually similar, falling within 1% of each other 75% of the time. The EIA data is considered more reliable, since it is a government agency.
OPEC (Organization of the Petroleum Exporting Countries) is a group of 12 Oil-producing nations who collectively decide production quotas for member countries at twice-yearly meetings. Their decisions often impact WTI Oil prices. When OPEC decides to lower quotas, it can tighten supply, pushing up Oil prices. When OPEC increases production, it has the opposite effect. OPEC+ refers to an expanded group that includes ten extra non-OPEC members, the most notable of which is Russia.
-
11:00
USD/JPY: Bias to sell rallies in USD/JPY – OCBC
Markets continue to see a confluence of risk factors, including Trump’s tariff threats and dividend seasonality trends that may prove 'noisy' for USD/JPY, OCBC's FX analysts Frances Cheung and Christopher Wong note.
Macro drivers remain intact
"USD/JPY touched a high of 151.02 this morning but was brief as the pair reverted to trade lower. Last at 150.35 levels. Daily momentum is flat while rise in RSI moderated. Bias remains to sell rallies. Resistance at 150.50, 151.50 (38.2% fibo retracement of Sep low to Jan high). Support at 149.20 (50% fibo), 148.80 before 147 (61.8% fibo)."
"That said, macro drivers remain intact. Prospects of wage growth, broadening services inflation and upbeat economic activities in Japan continue to support the BoJ policy normalization while fading US exceptionalism validates our bias for the Fed cut cycle to continue."
"Fed-BoJ policy divergence should underpin broader direction of travel for USD/JPY to the downside. So, maintain bias to sell rallies in USDJ/PY should there be a bounce driven by tariff uncertainty or seasonality trends."
-
10:55
AUD/USD: Expected to trade in a 0.6195/0.6240 range – UOB Group
Australian Dollar (AUD) is expected to trade in a 0.6195/0.6240 range. In the longer run, AUD must break and remain below 0.6190 before a move to 0.6155 can be expected, UOB Group's FX analysts Quek Ser Leang and Peter Chia note.
Below 0.6190, a move to 0.6155 can be expected
24-HOUR VIEW: "Following AUD sharp drop last Thursday, we highlighted on Friday that AUD 'could continue to decline, but the major support at 0.6190 could be just out of reach.' Our view turned out to be correct, as AUD dropped to 0.6192 before rebounding. The rebound in oversold conditions and slowing momentum, indicates that AUD is unlikely to weaken further. Today, we expect AUD to trade in a 0.6195/0.6240 range."
1-3 WEEKS VIEW: "When AUD was at 0.6310 last Thursday, 27 Feb, we highlighted it 'could edge lower, but it must break clearly below 0.6280 before a move to 0.6255 can be expected.' AUD then dropped sharply, and on Friday (28 Feb, spot at 0.6235), we stated, 'further declines seem likely, and the level to monitor is 0.6190.' AUD then dropped to a low of 0.6192. While declines still seem likely, AUD must break and remain below 0.6190 before a move to 0.6155 can be expected. The likelihood of AUD breaking clearly below 0.6190 will remain intact provided that the ‘strong resistance’ at 0.6285 (level was at 0.6305 last Friday) remains intact."
-
10:52
DXY: Paring back earlier gains – OCBC
US Dollar (USD) started the week on a softer footing as risk sentiments regain footing. DXY was last at 107.07, OCBC's FX analysts Frances Cheung and Christopher Wong note.
Consolidation is likely on the day
"European leaders working with Ukraine on a plan to stop the fighting and better PMIs across the region including China, Taiwan, Indonesia and Thailand were some of those drivers."
"Elsewhere, markets remain hopeful: 1/ on expectations that China will deliver support measures to boost domestic demand at its NPC/CPPCC meeting (start on Tue); 2/ Trump may delay tariff implementation timeline (again). The latter can prove 'noisy' for markets."
"If the tariffs are imposed as scheduled, we may see risk-off sentiment returning and USD may jump in response. Daily momentum turned mild bullish but rise in RSI faltered. Consolidation likely. Resistance at 107.30 (21 DMA), 107.80 levels (23.6% fibo). Support at 106.80 (100 DMA), 106.35 (38.2% fibo retracement of Oct low to Jan high)."
-
10:40
More downside risks than upside risks for CAD and MXN – ING
CAD and MXN depreciated at the back end of last week, but are still not pricing 25% tariffs as the baseline, ING’s FX analysts Francesco Pesole notes.
25% tariffs amay be averted
"The FX market saw Mexico as more likely to avert tariffs over Canada a month ago and appears to have a similar feeling now, having penalised the loonie more than the peso in the past week. Today’s events will be inevitably binary for FX, but given that markets are still leaning towards another delay in tariffs, there are more downside risks than upside risks for CAD and MXN today."
"USD/CAD and USD/MXN are currently trading 2.5% and 3.5% off their 3 February highs. We’ll be looking for moves above 1.460 and 21.0 as key indicators of a pessimistic shift in sentiment today. Our base case remains that 25% tariffs will be averted, although we admit it remains a very close call."
-
10:36
GBP/USD: Two-week GBP strength has ended – UOB Group
Pound Sterling (GBP) is expected to trade in a range between 1.2570 and 1.2630. In the longer run, two-week GBP strength has ended; for the time being, it is likely to trade between 1.2520 and 1.2670, UOB Group’s FX analysts Quek Ser Leang and Peter Chia note.
Likely to trade between 1.2520 and 1.2670
24-HOUR VIEW: "After GBP dropped sharply last Thursday, we indicated that 'while the rapid drop could extend, oversold conditions suggest any decline is likely part of a lower 1.2570/1.2640 range.' Although GBP traded in a lower range than expected (1.2560/1.2621), there has been no increase in downward momentum. Today, we continue to expect GBP to trade in a range, likely between 1.2570 and 1.2630."
1-3 WEEKS VIEW: "We highlighted last Friday (28 Feb, spot at 1.2600) that 'the two-week GBP strength has ended.' We also highlighted that 'the current price movements are likely part of a range trading phase, and for the time being, we expect GBP to trade between 1.2520 and 1.2670.' There is no change in our view."
-
10:26
EUR/USD rises as European leaders agree for Ukrainian peace deal
- EUR/USD rebounds from the two-week low as European leaders, including Zelenskyy, show readiness to end the war in Ukraine.
- US President Trump’s tariffs on Canada and Mexico could be lower than 25%.
- Investors await the US Manufacturing PMI data for February, releasing on Monday.
EUR/USD recovers above 1.0400 at the start of the week. The major currency pair rises as the Euro (EUR) outperforms across the board after European leaders, including Ukrainian President Volodymyr Zelenskyy, agreed to prepare a Ukraine peace plan at a high-stakes summit in London over the weekend, along with United Kingdom (UK) Prime Minister Keir Starmer.
Starmer said leaders from France, Ukraine, and other allied nations are ready to outline a structured peace plan to be presented to the US to secure Washington’s security guarantees for Kyiv.
Market participants see the willingness of European leaders to end the war in Ukraine as favorable for the Euro, assuming that a truce between Russia and Ukraine will restore the Eurozone’s supply chain mechanism.
This week, the major highlight for the Euro will be the European Central Bank (ECB) monetary policy meeting, scheduled for Thursday. The ECB is almost certain to cut its Deposit Facility Rate by 25 basis points (bps) to 2.5%. This would be the fifth straight interest rate cut by the ECB. Traders have been increasingly confident about the ECB reducing its borrowing rates again amid fears that US President Donald Trump’s tariff agenda will damage the economic growth of the shared continent. Such a scenario would keep Eurozone inflationary pressures persistently below the ECB’s target of 2%.
Meanwhile, the Eurozone Harmonized Index of Consumer Prices (HICP) inflation data slowed in February. As measured by the HICP, headline inflation grew by 2.4%, faster than estimates of 2.3% but slower than the 2.5% increase seen in January. In the same period, the core HICP - which excludes volatile item prices - decelerated to 2.6%, as expected, from the prior release of 2.7%. Month-on-month, headline, and core HICP rose by 0.5% and 0.6%, respectively.
Daily digest market movers: EUR/USD moves higher as US Dollar corrects
- The recovery in the EUR/USD pair from its over-two-week low of 1.0360 is also driven by some correction in the US Dollar (USD). The US Dollar Index (DXY), which tracks the Greenback’s value against six major currencies, declines to near 107.30 from its two-week high of 107.65 posted on Friday. The Greenback faces pressure as fears of heavy tariffs by US President Donald Trump on Canada and Mexico have diminished.
- Over the weekend, US Commerce Secretary Howard Lutnick confirmed that tariffs on his North American allies are on their way but was unsure whether they would be 25% or less, as President Trump stated on Thursday.
- Lutnick said to Fox News that there are going to be “tariffs on Mexico and Canada on Tuesday”. When asked about the tariff plan details, Lutnick said that they are going to leave that for the “President and his team to negotiate”. Lutnick’s comments diminished investors’ fears that Trump’s tariffs wouldn’t be as fearful as they had anticipated from his tweet on Truth Social, in which President Trump said that he is ready to impose 25% tariffs on Canada and Mexico and an additional 10% on China as drugs are still pouring into the economy through borders.
- On the monetary policy front, the likelihood of the Federal Reserve (Fed) cutting interest rates in the June policy meeting has increased after a decline in Personal Spending data for January. This was the first decline in the consumer spending data since March 2023. There is a 77% chance that the Fed will cut its borrowing rates in June, up from 63% a week ago, according to the CME FedWatch tool.
- This week, investors will focus on a slew of US economic data, including Nonfarm Payrolls (NFP), which will influence market expectations for the Fed’s monetary policy outlook. In Monday’s session, investors will focus on the US ISM and revised S&P Global Manufacturing Purchasing Managers Index (PMI) data for February, which will be published during North American trading hours.
Technical Analysis: EUR/USD bounces back above 1.0400

EUR/USD rebounds from an over two-week low of 1.0360 and trades above 1.0400 in Monday’s European session. However, the near-term outlook of the major currency pair remains bearish as it trades below the 20-day Exponential Moving Average (EMA), which is around 1.0430.
The 14-day Relative Strength Index (RSI) declines toward 40.00. A bearish momentum would activate if the RSI falls below that level.
Looking down, the February 10 low of 1.0285 will act as the major support zone for the pair. Conversely, the February 24 high of 1.0530 will be the key barrier for the Euro bulls.
Euro FAQs
The Euro is the currency for the 19 European Union countries that belong to the Eurozone. It is the second most heavily traded currency in the world behind the US Dollar. In 2022, it accounted for 31% of all foreign exchange transactions, with an average daily turnover of over $2.2 trillion a day. EUR/USD is the most heavily traded currency pair in the world, accounting for an estimated 30% off all transactions, followed by EUR/JPY (4%), EUR/GBP (3%) and EUR/AUD (2%).
The European Central Bank (ECB) in Frankfurt, Germany, is the reserve bank for the Eurozone. The ECB sets interest rates and manages monetary policy. The ECB’s primary mandate is to maintain price stability, which means either controlling inflation or stimulating growth. Its primary tool is the raising or lowering of interest rates. Relatively high interest rates – or the expectation of higher rates – will usually benefit the Euro and vice versa. The ECB Governing Council makes monetary policy decisions at meetings held eight times a year. Decisions are made by heads of the Eurozone national banks and six permanent members, including the President of the ECB, Christine Lagarde.
Eurozone inflation data, measured by the Harmonized Index of Consumer Prices (HICP), is an important econometric for the Euro. If inflation rises more than expected, especially if above the ECB’s 2% target, it obliges the ECB to raise interest rates to bring it back under control. Relatively high interest rates compared to its counterparts will usually benefit the Euro, as it makes the region more attractive as a place for global investors to park their money.
Data releases gauge the health of the economy and can impact on the Euro. Indicators such as GDP, Manufacturing and Services PMIs, employment, and consumer sentiment surveys can all influence the direction of the single currency. A strong economy is good for the Euro. Not only does it attract more foreign investment but it may encourage the ECB to put up interest rates, which will directly strengthen the Euro. Otherwise, if economic data is weak, the Euro is likely to fall. Economic data for the four largest economies in the euro area (Germany, France, Italy and Spain) are especially significant, as they account for 75% of the Eurozone’s economy.
Another significant data release for the Euro is the Trade Balance. This indicator measures the difference between what a country earns from its exports and what it spends on imports over a given period. If a country produces highly sought after exports then its currency will gain in value purely from the extra demand created from foreign buyers seeking to purchase these goods. Therefore, a positive net Trade Balance strengthens a currency and vice versa for a negative balance.
-
10:26
USD: Highly binary outcomes from tariff event – ING
US-Ukraine talks fell through on Friday after a heated exchange in the Oval Office between US President Donald Trump and Ukrainian President Volodymyr Zelenskyy. While the mineral deal is off the table at the moment and the US has taken a step back from brokering a peace deal, markets are not pricing out the chance of a Ukraine-Russia truce. A summit with Zelenskyy and European leaders in London yielded a pledge to end the war, but also recognised the US remains instrumental in bringing Russia to the negotiating table, ING’s FX analysts Francesco Pesole notes.
USD to remain bullish ahead of next month’s round of tariffs
"But the biggest market driver today will be any updates on US tariffs on Mexico and Canada, as 25% duties are due to come into effect tomorrow. Canadian and Mexican officials are attempting to strike another last-minute deal, and US officials have also floated the idea of imposing smaller than 25% tariffs. One possibility is that – alongside increased commitment to fighting illegal drug traffic – Trump will require both countries to replicate US tariffs on China, which may be hiked from 10% to 20%."
"The US calendar will also be watched closely this week, as some soft data recently dented the notion of US exceptionalism and contributed to the dollar’s partial retreat. We expect ISM surveys to reaffirm that the US has started the year on a soft tone, and see some risk that today’s manufacturing index will drop back below 50.0. On Friday, we expect a slightly below-consensus 140k payroll figure, with unemployment inching higher to 4.1%."
"We remain bullish on the USD ahead of next month’s round of tariffs, but if we are right with our baseline calls for a tariff delay and softish US data, this should not be a good week for the greenback."
-
10:23
EUR/USD can continue to decline – UOB Group
Euro (EUR) is likely to trade in a range between 1.0375 and 1.0435 vs US Dollar (USD). In the longer run, EUR could continue to decline; it is currently unclear whether the significant support at 1.0330 is within reach, UOB Group’s FX analysts Quek Ser Leang and Peter Chia note.
Unclear whether the significant support at 1.0330 is within reach
24-HOUR VIEW: "EUR plunged and closed sharply lower by 0.82% last Thursday. On Friday, we indicated that 'the steep decline appears to be excessive, but with no signs of stabilisation just yet, EUR could test the 1.0375 level.' However, we pointed out that 'the significant support at 1.0330 is unlikely to come into view.' EUR subsequently dropped to 1.0359, closing at 1.0375, lower by 0.21%. It traded on a firm note after opening today. Given the deeply oversold conditions, we do not expect EUR to weaken further. Today, it is more likely to trade in a range between 1.0375 and 1.0435."
1-3 WEEKS VIEW: "Last Friday (28 Feb, spot at 1.0395), we revised our view for EUR from positive to negative. We indicated that EUR 'could continue to decline.' We added, 'it is currently unclear whether the major support at 1.0330 is within reach,' and 'to keep the momentum going, EUR must remain below 1.0470 (‘strong resistance’ level).' Our view remains unchanged, but the ‘strong resistance’ level has moved lower to 1.0455 from 1.0470."
-
10:04
GBP: Bailey's testimony in focus this week – ING
The UK data calendar is quiet this week, and the Pound Sterling (GBP) will primarily be driven by external input. The major domestic event is probably the Treasury Committee questioning of Bank of England Governor Andrew Bailey and other MPC members on Wednesday, ING’s FX analysts Francesco Pesole notes.
A decisive break below 1.25 in Cable is possible in the coming weeks
"The February BoE cut was accompanied by a dovish vote split, but data has since pointed to more caution on easing. Fourth-quarter growth, December wages and January CPI all came in stronger than expected, and the risks are that we could see some hawkish adjustment in Bailey’s stance."
"We remain of the view that GBP/USD rallies won’t prove sustainable beyond the very near term as we expect the UK budget event at the end of March to trigger fresh pressure on the pound also by potentially unnerving the fragile gilt market. We expect a decisive break below 1.25 in Cable in the coming weeks, but this week the pair may remain supported."
-
10:01
Eurozone Preliminary HICP inflation eases to 2.4% YoY in February vs. 2.3% expected
The Eurozone Harmonized Index of Consumer Prices (HICP) rose 2.4% year-on-year (YoY) in February after recording a 2.5% growth in January, the official data released by Eurostat showed Monday. The market forecast was for a 2.3% acceleration in the reported period.
The core HICP advanced 2.6% YoY in February, compared with a 2.7% increase in January, meeting the 2.6% market expectations.
On a monthly basis, the bloc’s HICP rose 0.5% in February compared to January’s -0.3%. The core HICP inflation came in at 0.6% month-over-month (MoM) in the same period versus a 0.9% decline in January.
The European Central Bank’s (ECB) inflation target is 2.0%. The old continent’s HICP inflation data significantly impacts the market’s pricing of the ECB's future interest rate cuts.
-
10:01
Eurozone Core Harmonized Index of Consumer Prices (MoM): 0.6% (February) vs -0.9%
-
10:00
Eurozone Harmonized Index of Consumer Prices (MoM) up to 0.5% in February from previous -0.3%
-
10:00
Eurozone Harmonized Index of Consumer Prices (YoY) registered at 2.4% above expectations (2.3%) in February
-
10:00
Eurozone Core Harmonized Index of Consumer Prices (YoY) in line with expectations (2.6%) in February
-
09:48
China: Post-holiday rebound in PMIs provided little relief as more tariff looms – UOB Group
Both China’s official manufacturing and non-manufacturing PMIs picked up in Feb as activities normalized after the Lunar New Year holiday (28 January – 4 February). The official manufacturing PMI returned to expansion (indicated by a reading above 50) while non-manufacturing PMI rose at a faster pace, UOB Group’s economist Ho Woei Chen notes.
February PMIs in expansion but underlying indexes suggest less rosy outlook
"Both China’s official manufacturing and non-manufacturing PMIs picked up in Feb as activities normalized after the Lunar New Year holiday."
"The details showed that the outlook was less rosy than the headline numbers suggested. The rebound in the official manufacturing PMI was led by the large enterprises while outlook for the medium and small sized enterprises contracted at a sharper pace than in Jan. Furthermore, the gain in the non-manufacturing PMI was due to a rebound in the construction index but the services index moderated."
"The near-term concerns center on the escalation of trade frictions with US given increasing headwinds to China’s export engine this year. Markets will also look to the annual 'two sessions' this week for additional stimulus measures to mitigate the downside risks to Chinese economy, particularly on the fiscal side."
-
09:43
EUR: Inflation to favour dovish ECB stance – ING
The euro’s outlook remains tied to developments on US tariffs and on Ukraine peace talks, ING’s FX analysts Francesco Pesole notes.
EUR/USD to move back to 1.050
"EUR/USD took a hit late Friday after the Trump-Zelenskyy incident, but has rebounded since trading resumed on Sunday evening – perhaps on the news that Ukraine remains open to a mineral deal with the US and that the EU is actively trying to bring the US back to the negotiating table with Ukraine."
"Today, the eurozone releases inflation estimates for February after regional prints provided some tentatively dovish signals. Spanish and Italian CPI undershot, German’s inflation was unchanged, but the core measure declined. Consensus is for a deceleration to 2.3% in eurozone headline CPI and to 2.5% in core. We expect this CPI report to endorse a still-dovish tone by the European Central Bank as it delivers a highly anticipated cut this Thursday."
"Still, with markets pricing in three cuts by year-end in the eurozone, the euro’s downside risks ahead of Thursday are limited. In our baseline USD-negative scenario for this week, we can see EUR/USD moving back to 1.050."
-
09:40
EUR/USD: 2-way trades on the cards – OCBC
Euro (EUR) found support as European leaders were seen coming together to offer Ukraine support. EUR was last seen at 1.0416 levels, OCBC's FX analysts Frances Cheung and Christopher Wong note.
Strong CPI print may aid EUR’s recovery
"An emergency security summit was convened on Sunday. UK PM Starmer said UK, France and 'one or two others' would work with Ukraine on a 'plan to stop the fighting.' The broader European Council will meet on Thursday to discuss a €20 billion ($21 billion) military package for Ukraine and steps to boost defense spending, including a potential loosening of fiscal rules."
"Moving away from Ukraine, Trump’s tariff threats remain. He mentioned implementing a 25% tariff on EU although he did not give an effective date. He also stated that the 25% tariff on Canada and Mexico would come into effect on 4 Mar, alongside Chinese imports being slapped with a further 10% tariff. The actual implementation of the tariffs should undermine EUR, but EUR may bounce if there is another pushback."
"Daily momentum is now showing a clear bias while RSI rose. 2-way trades likely. Resistance here at 1.0420 (21DMA, 23.6% fibo), 1.0510 (100 DMA) and 1.0575 (38.2% fibo retracement of Sep high to Jan low). Support at 1.0360/90 (50 DMA), 1.0280 levels. For the week, CPI estimate is in focus today – a strong print may aid EUR’s recovery – before the ECB meeting (Thu). Markets have already priced in 85bps of cut this year. Any hawkish surprise may see dovish expectations pare back and can be supportive of EUR."
-
09:31
United Kingdom M4 Money Supply (YoY) climbed from previous 2.5% to 4.1% in January
-
09:31
United Kingdom Net Lending to Individuals (MoM) came in at £5.9B, above forecasts (£4.7B) in January
-
09:30
United Kingdom M4 Money Supply (MoM) rose from previous 0.1% to 1.3% in January
-
09:30
Silver price today: Silver rises, according to FXStreet data
Silver prices (XAG/USD) rose on Monday, according to FXStreet data. Silver trades at $31.38 per troy ounce, up 0.86% from the $31.11 it cost on Friday.
Silver prices have increased by 8.59% since the beginning of the year.
Unit measure Silver Price Today in USD Troy Ounce 31.38 1 Gram 1.01
The Gold/Silver ratio, which shows the number of ounces of Silver needed to equal the value of one ounce of Gold, stood at 91.49 on Monday, down from 91.77 on Friday.
Silver FAQs
Silver is a precious metal highly traded among investors. It has been historically used as a store of value and a medium of exchange. Although less popular than Gold, traders may turn to Silver to diversify their investment portfolio, for its intrinsic value or as a potential hedge during high-inflation periods. Investors can buy physical Silver, in coins or in bars, or trade it through vehicles such as Exchange Traded Funds, which track its price on international markets.
Silver prices can move due to a wide range of factors. Geopolitical instability or fears of a deep recession can make Silver price escalate due to its safe-haven status, although to a lesser extent than Gold's. As a yieldless asset, Silver tends to rise with lower interest rates. Its moves also depend on how the US Dollar (USD) behaves as the asset is priced in dollars (XAG/USD). A strong Dollar tends to keep the price of Silver at bay, whereas a weaker Dollar is likely to propel prices up. Other factors such as investment demand, mining supply – Silver is much more abundant than Gold – and recycling rates can also affect prices.
Silver is widely used in industry, particularly in sectors such as electronics or solar energy, as it has one of the highest electric conductivity of all metals – more than Copper and Gold. A surge in demand can increase prices, while a decline tends to lower them. Dynamics in the US, Chinese and Indian economies can also contribute to price swings: for the US and particularly China, their big industrial sectors use Silver in various processes; in India, consumers’ demand for the precious metal for jewellery also plays a key role in setting prices.
Silver prices tend to follow Gold's moves. When Gold prices rise, Silver typically follows suit, as their status as safe-haven assets is similar. The Gold/Silver ratio, which shows the number of ounces of Silver needed to equal the value of one ounce of Gold, may help to determine the relative valuation between both metals. Some investors may consider a high ratio as an indicator that Silver is undervalued, or Gold is overvalued. On the contrary, a low ratio might suggest that Gold is undervalued relative to Silver.
(An automation tool was used in creating this post.)
-
09:30
United Kingdom Consumer Credit climbed from previous £1.045B to £1.74B in January
-
09:30
United Kingdom S&P Global/CIPS Manufacturing PMI above expectations (46.4) in February: Actual (46.9)
-
09:30
United Kingdom Mortgage Approvals came in at 66.189K, above forecasts (65.65K) in January
-
09:03
Gold holds steady amid tariffs, Fed rate cut bets, talks on Russia-Ukraine
- Gold does not see a material recovery at the start of the week despite tariffs being set to hit on Tuesday.
- Federal Reserve rate cut bets remain the second biggest driver for higher Gold prices.
- The precious metal holds near the daily Pivot Point and could recover further.
Gold’s price (XAU/USD) holds steady and looks for direction on Monday after an initial surge higher during the Asian session. Although tariffs are set to hit on Tuesday for Mexico and Canada and additional tariffs on China, they are not really triggering another flight into Gold. Traders will need to look for new headlines about tariffs, and there is still the chance that United States (US) President Donald Trump will change his mind.
Meanwhile, traders are still digesting Friday’s turn of events. The spat between Ukraine President Volodymyr Zelenskyy on one side and US President Trump and Vice-President J.D. Vance is still making headlines. The surprise move that took place afterward in London, with the United Kingdom extending several billions in loans to be covered with the frozen Russian assets in Europe, was actually something that President Trump was after. With no rare earth deal in place, the televised spat in the Oval Office, and now London reeling in the agreement on the frozen Russian assets, all bets could be off the table with even possibly the US withdrawing from NATO.
Daily digest market movers: Gold looking for support in headlines
- Ghana’s new central bank chief, Johnson Asiama, has suspended the West African nation’s program of paying for Oil with Gold and said he expects the Ghana cedi (GHC) to stabilize after its volatility of last year, Bloomberg reports..
- The CME Fedwatch tool shows a 77.6% chance of a lower monetary policy rate for the Federal Reserve (Fed) in June, while the odds of keeping it unchanged are 22.4%.
- At 18:00 GMT, Federal Reserve Bank of Richmond President Thomas Barkin delivers a speech, "Inflation Then and Now", in Fayetteville Cumberland Economic Development.
- The US 10-year benchmark rate is currently trading around 4.23% on Monday, a touch higher from its fresh low at 4.19% on Friday.
Technical Analysis: A very long road ahead
It looks like the cat is out of the bag for now. Last week, traders received all the information they needed, and the first new tariffs under the second term from US President Trump are set to kick in on Tuesday. For Bullion to be enabled to make a fresh all-time high, or at least move in that direction, new tariffs will be needed. Besides that, a continuous descent in yields would also help, where both drivers would be enough to see a steep rally in Gold prices again.
The daily Pivot Point at $2,857 is currently providing support to bounce off from and attempt to push Bullion higher. Further up, the daily R1 resistance at $2,882 is the first big level to watch out for and converges with February 14 and 17 lows. In case Gold has enough oomph to break through there, the daily R2 resistance at $2,910 will possibly be the final cap on Monday.
On the downside, the S1 support at $2,835 converges with Friday’s low. That will be vital support for Monday. If Bullion bulls want to avoid another leg lower, that level must hold. Further down, the dailyS2 support at $2,805 should be able to catch any additional downside pressure and will try to avoid a break below $2,800 and $2,790.
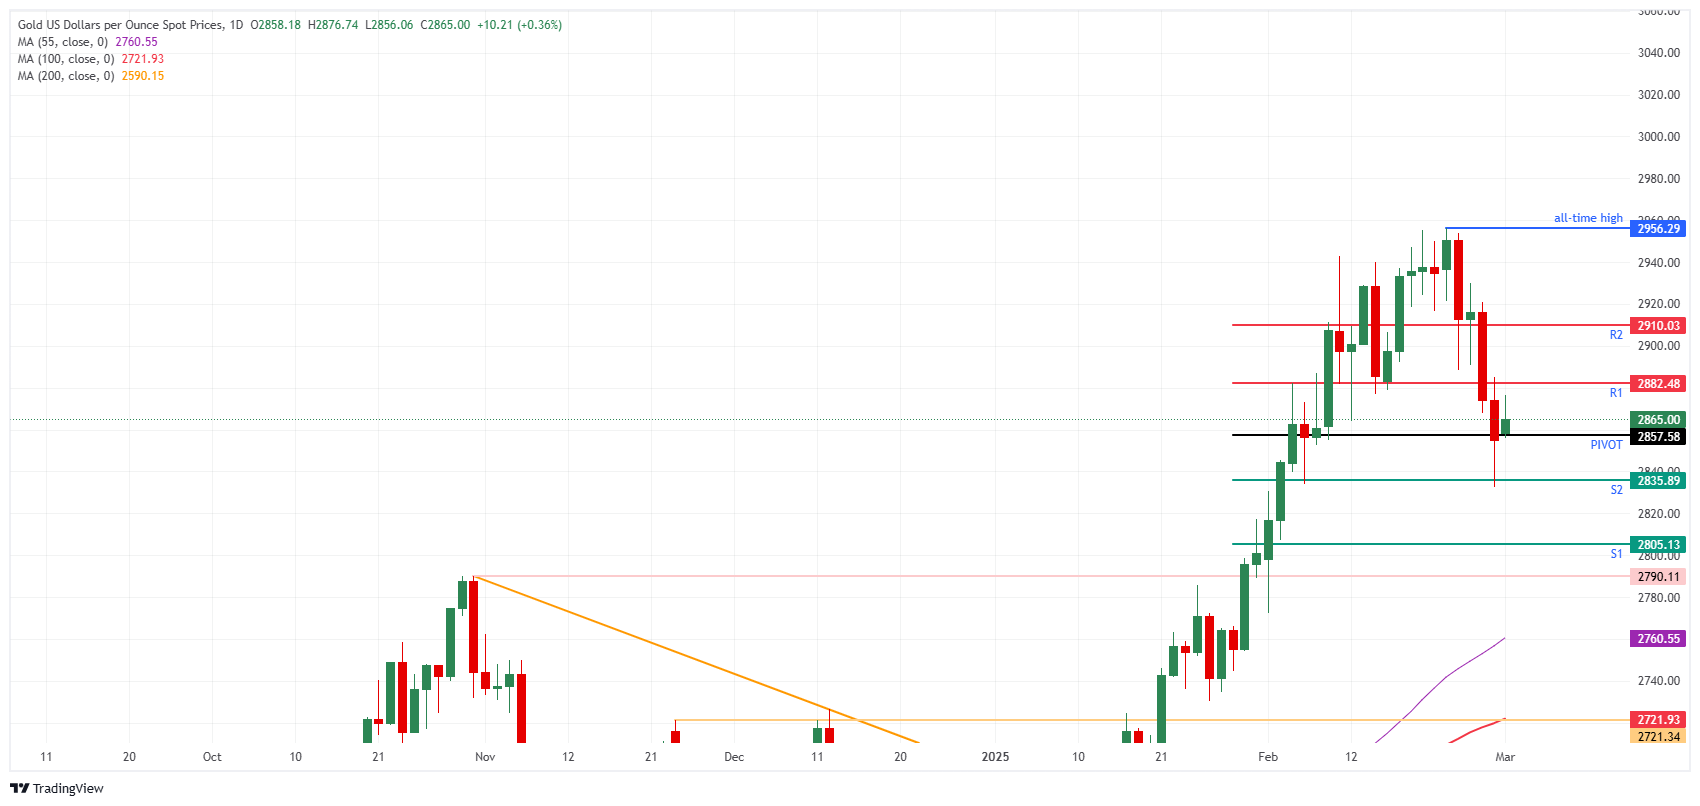
XAU/USD: Daily Chart
Gold FAQs
Gold has played a key role in human’s history as it has been widely used as a store of value and medium of exchange. Currently, apart from its shine and usage for jewelry, the precious metal is widely seen as a safe-haven asset, meaning that it is considered a good investment during turbulent times. Gold is also widely seen as a hedge against inflation and against depreciating currencies as it doesn’t rely on any specific issuer or government.
Central banks are the biggest Gold holders. In their aim to support their currencies in turbulent times, central banks tend to diversify their reserves and buy Gold to improve the perceived strength of the economy and the currency. High Gold reserves can be a source of trust for a country’s solvency. Central banks added 1,136 tonnes of Gold worth around $70 billion to their reserves in 2022, according to data from the World Gold Council. This is the highest yearly purchase since records began. Central banks from emerging economies such as China, India and Turkey are quickly increasing their Gold reserves.
Gold has an inverse correlation with the US Dollar and US Treasuries, which are both major reserve and safe-haven assets. When the Dollar depreciates, Gold tends to rise, enabling investors and central banks to diversify their assets in turbulent times. Gold is also inversely correlated with risk assets. A rally in the stock market tends to weaken Gold price, while sell-offs in riskier markets tend to favor the precious metal.
The price can move due to a wide range of factors. Geopolitical instability or fears of a deep recession can quickly make Gold price escalate due to its safe-haven status. As a yield-less asset, Gold tends to rise with lower interest rates, while higher cost of money usually weighs down on the yellow metal. Still, most moves depend on how the US Dollar (USD) behaves as the asset is priced in dollars (XAU/USD). A strong Dollar tends to keep the price of Gold controlled, whereas a weaker Dollar is likely to push Gold prices up.
-
09:01
NZD/USD Price Forecast: Tests 0.5600 support near lower descending channel limit
- NZD/USD may test the key support at the lower boundary of the descending channel near 0.5570.
- The 14-day Relative Strength Index remains below 50, reinforcing the pair’s bearish outlook.
- The pair could target the initial resistance at the nine-day Exponential Moving Average of 0.5662.
The NZD/USD pair holds ground after registering a six-day losing streak, trading around 0.5600 during European trading hours on Monday. Technical analysis of the daily chart suggests a bearish market bias, as the pair moves downwards within a descending channel pattern.
The 14-day Relative Strength Index (RSI) remains below the 50 level, strengthening the bearish outlook for the pair. Moreover, the NZD/USD pair stays positioned below the nine- and 14-day Exponential Moving Averages (EMAs), indicating weaker short-term momentum.
On the downside, a successful break below the psychological level of 0.5600 would lead the NZD/USD pair to test the crucial support at the lower boundary of the descending channel at 0.5570 level. A break below this support zone could reinforce the bearish bias and put downward pressure on the pair to test the psychological level of 0.5700 level. Further support appears around 0.5516, its lowest level since October 2022, recorded on February 3.
The NZD/USD pair could target the primary barrier at a nine-day EMA of 0.5662, followed by the 50-day EMA at 0.5696, which is aligned with the descending channel’s upper boundary. A break above the channel would weaken the bearish sentiment and support the pair to explore the region the three-month high at 0.5794, reached on January 24.
NZD/USD: Daily Chart
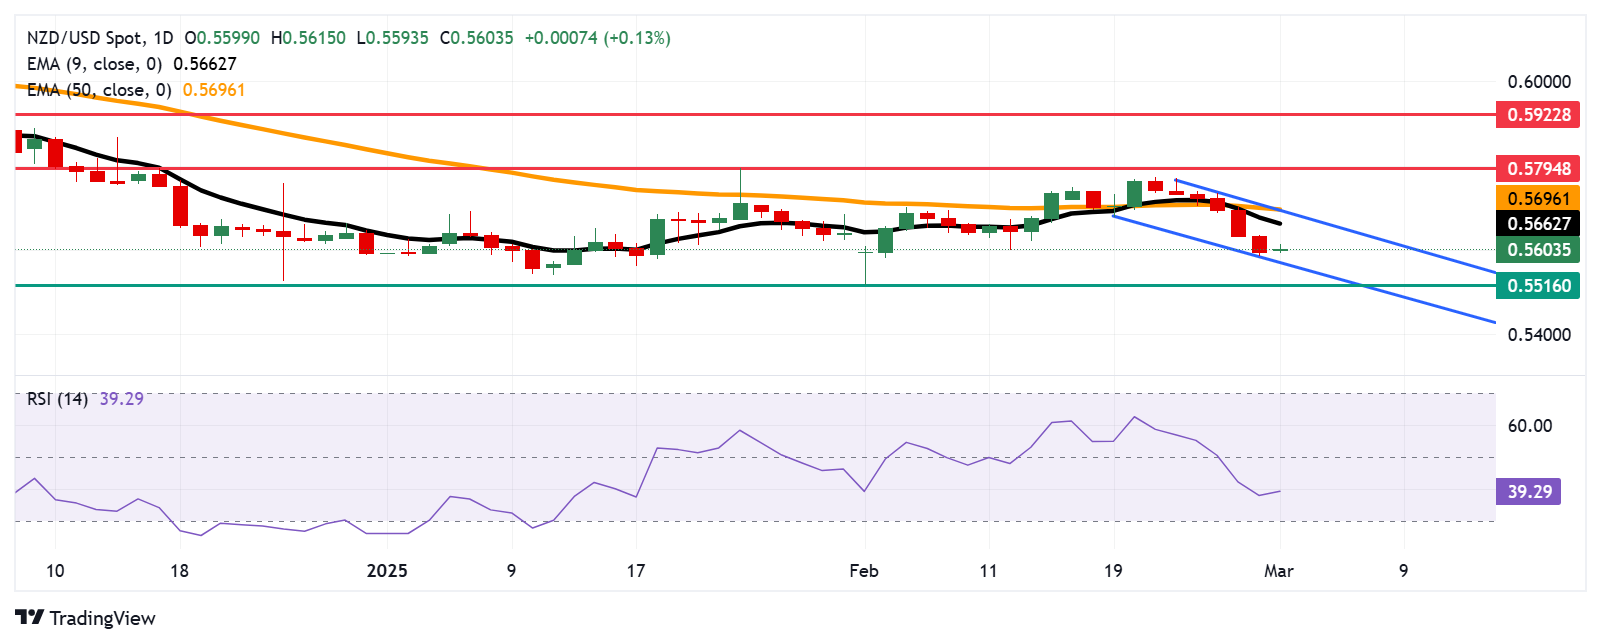
New Zealand Dollar PRICE Today
The table below shows the percentage change of New Zealand Dollar (NZD) against listed major currencies today. New Zealand Dollar was the strongest against the US Dollar.
USD EUR GBP JPY CAD AUD NZD CHF USD -0.26% -0.11% -0.30% -0.08% -0.17% -0.08% -0.18% EUR 0.26% 0.03% -0.25% -0.01% -0.01% -0.01% -0.11% GBP 0.11% -0.03% -0.19% -0.04% -0.04% -0.04% -0.14% JPY 0.30% 0.25% 0.19% 0.44% 0.17% 0.26% 0.11% CAD 0.08% 0.01% 0.04% -0.44% 0.06% -0.00% -0.10% AUD 0.17% 0.01% 0.04% -0.17% -0.06% -0.00% -0.08% NZD 0.08% 0.01% 0.04% -0.26% 0.00% 0.00% -0.10% CHF 0.18% 0.11% 0.14% -0.11% 0.10% 0.08% 0.10% The heat map shows percentage changes of major currencies against each other. The base currency is picked from the left column, while the quote currency is picked from the top row. For example, if you pick the New Zealand Dollar from the left column and move along the horizontal line to the US Dollar, the percentage change displayed in the box will represent NZD (base)/USD (quote).
-
09:00
Eurozone HCOB Manufacturing PMI above expectations (47.3) in February: Actual (47.6)
-
09:00
ISM Manufacturing PMI expected to show modest slowdown in US factory sector in February
- The US ISM Manufacturing PMI is expected to tick a tad lower in February.
- Investors will also follow the ISM Prices index and the Employment index.
- EUR/USD came under pressure and broke below the 1.0400 level.
Anticipation is mounting as the Institute for Supply Management (ISM) gears up to unveil the February United States (US) Manufacturing Purchasing Managers’ Index (PMI) this Monday. This crucial report serves as a vital indicator of the health of the US manufacturing sector, while also offering a window into the broader economic outlook.
Key points to keep in mind:
- PMI benchmarks: A reading above 50.0 signals an expanding manufacturing sector, whereas a value below 50.0 indicates contraction.
- Analyst predictions: Experts are forecasting a February PMI of 50.8, marginally below January’s 50.9. Following this slight downtick, the index is still expected to remain within the expansion zone.
- Economic resilience under pressure: It’s worth noting that while the manufacturing sector showed signs of expansion, the health of the overall economy has been put to the test amid some loss of momentum in key fundamentals in past weeks, pouring cold water over the economic "exceptionalism" of the US.
This report not only reflects the pulse of the manufacturing area but also hints at the evolving narrative of the wider economy.
What to expect from the ISM manufacturing PMI report?
In January, the manufacturing sector continued its upward momentum for the third straight month, fueled by improvements in the ISM Manufacturing PMI. Several key components contributed to this optimistic picture:
New Orders surge: The New Orders Index continued to climb, signaling that manufacturers are receiving an increasing number of orders.
Production rebound: The Production Index bounced back into expansion territory for the first time since April 2024, indicating that factories have ramped up their output.
Rising costs: The Prices Index continued its upward trend in January—the fourth straight month of rising prices—likely reflecting buyers locking in and deploying their pricing strategies for 2025.
Backlog of orders: The numbers dipped slightly—from 45.9 in December to 44.9 in January, marking a 1 percentage point decrease. This continues a trend, marking the 28th month in a row where order backlogs have fallen, with none of the six largest manufacturing sectors seeing an increase in their order books in January 2025.
Employment gain: After contracting for 14 of the past 16 months, the Employment Index rebounded in January, climbing to 50.3 and signaling a return to expansion.
Generally, a PMI reading above 50 percent indicates that the manufacturing sector is growing, while a reading below 50 percent signals contraction. However, even levels above 42.5 percent over time can point to broader economic expansion.
Overall, the strength in manufacturing could boost high-yield assets like stocks, as investors become more optimistic about growth prospects. Meanwhile, the US Dollar (USD) might experience selling pressure as market confidence grows and investors shift toward riskier assets. Additionally, indicators such as rising new orders and easing price pressures are positive signs that could further propel economic expansion.
When will the ISM Manufacturing PMI report be released and how could it affect EUR/USD?
The ISM Manufacturing PMI report is scheduled for release at 15:00 GMT on Monday. Ahead of the data release, EUR/USD accelerated its bearish tone and slipped back to the 1.0380 zone to print new two-week lows, and is showing some difficulty in returning to the area beyond the 1.0400 barrier on a sustained basis.
Pablo Piovano, Senior Analyst at FXStreet, explained that the continued downward trend is likely to steer EUR/USD back toward its 2025 low of 1.0176, which was set on January 13. He mentioned that if this level breaks down further, it could signal a bearish turn, pushing the pair back to the critical parity zone.
Piovano also noted that on the upside, the pair faces a bit of resistance at the 2025 high of 1.0532 recorded on January 27. If the pair manages to break through this barrier, traders might see it surge toward the December 2024 top of 1.0629, especially once the Fibonacci retracement level of the September-January decline at 1.0572 is cleared.
Piovano added that the negative outlook is likely to persist as long as the spot trades below its key 200-day SMA at 1.0729.
He also pointed out that the Relative Strength Index (RSI) dropped to around 47, indicating a pick-up in the bearish stance, while the Average Directional Index (ADX) below 13 suggests that the current trend is weakening.
Economic Indicator
ISM Manufacturing Employment Index
The Institute for Supply Management (ISM) Manufacturing Index shows business conditions in the US manufacturing sector, taking into account expectations for future production, new orders, inventories, employment and deliveries. It is a significant indicator of the overall economic condition in US. The ISM Manufacturing Employment Index represents business sentiment regarding labor market conditions and is considered a strong Non-Farm Payrolls leading indicator. A high reading is seen as positive for the USD, while a low reading is seen as negative.
Read more.Next release: Mon Mar 03, 2025 15:00
Frequency: Monthly
Consensus: -
Previous: 50.3
Source: Institute for Supply Management
GDP FAQs
A country’s Gross Domestic Product (GDP) measures the rate of growth of its economy over a given period of time, usually a quarter. The most reliable figures are those that compare GDP to the previous quarter e.g Q2 of 2023 vs Q1 of 2023, or to the same period in the previous year, e.g Q2 of 2023 vs Q2 of 2022. Annualized quarterly GDP figures extrapolate the growth rate of the quarter as if it were constant for the rest of the year. These can be misleading, however, if temporary shocks impact growth in one quarter but are unlikely to last all year – such as happened in the first quarter of 2020 at the outbreak of the covid pandemic, when growth plummeted.
A higher GDP result is generally positive for a nation’s currency as it reflects a growing economy, which is more likely to produce goods and services that can be exported, as well as attracting higher foreign investment. By the same token, when GDP falls it is usually negative for the currency. When an economy grows people tend to spend more, which leads to inflation. The country’s central bank then has to put up interest rates to combat the inflation with the side effect of attracting more capital inflows from global investors, thus helping the local currency appreciate.
When an economy grows and GDP is rising, people tend to spend more which leads to inflation. The country’s central bank then has to put up interest rates to combat the inflation. Higher interest rates are negative for Gold because they increase the opportunity-cost of holding Gold versus placing the money in a cash deposit account. Therefore, a higher GDP growth rate is usually a bearish factor for Gold price.
-
08:55
Germany HCOB Manufacturing PMI above forecasts (46.1) in February: Actual (46.5)
-
08:50
France HCOB Manufacturing PMI above expectations (45.5) in February: Actual (45.8)
-
08:45
Italy HCOB Manufacturing PMI above expectations (46.6) in February: Actual (47.4)
-
08:38
AUD/JPY falls toward 93.00 due to hawkish sentiment surrounding the BoJ’s policy outlook
- AUD/JPY declines as the Japanese Yen stays strong amid expectations of further interest rate hikes by the BoJ.
- Japan’s Atsushi Mimura noted that both large corporations and small to medium-sized businesses anticipate significant wage increases.
- The Australian Dollar found support following the release of Australia’s TD-MI Inflation Gauge and stronger-than-expected China Manufacturing PMI data.
AUD/JPY depreciates to near 93.00 during European hours on Monday. The currency cross weakens as the Japanese Yen (JPY) remains firm amid expectations that the Bank of Japan (BoJ) will continue raising interest rates. This sentiment is reinforced by a rise in Japan’s 10-year government bond yield, which increased by 3 basis points to 1.4%.
Japan’s Vice Finance Minister for International Affairs, Atsushi Mimura, stated on Monday that not only large firms but also small and medium-sized businesses anticipate strong wage hikes. Despite this, real private consumption in Japan remains below pre-Covid levels, though corporate investment and inbound tourism continue to show strength.
Last week, BoJ Governor Kazuo Ueda cautioned that uncertainty surrounding US President Donald Trump’s potential tariff policies could impact the global economic outlook, requiring careful monetary policy adjustments.
Meanwhile, the Australian Dollar (AUD) found support from positive Chinese economic data. China’s Caixin Manufacturing Purchasing Managers’ Index (PMI) rose to 50.8 in February from 50.1 in January, surpassing market expectations of 50.3. Given China's importance as a key trading partner, this boost in manufacturing activity supported the AUD.
In Australia, TD-MI Inflation Gauge declined by 0.2% month-over-month in February, reversing a 0.1% increase in January. This marked the first drop since last August and followed the Reserve Bank of Australia's (RBA) decision to cut its cash rate by 25 basis points to 4.1% in its first monetary policy meeting of the year, signaling continued easing in inflation. However, on an annual basis, inflation rose by 2.2%, slightly lower than the previous 2.3% increase.
Interest rates FAQs
Interest rates are charged by financial institutions on loans to borrowers and are paid as interest to savers and depositors. They are influenced by base lending rates, which are set by central banks in response to changes in the economy. Central banks normally have a mandate to ensure price stability, which in most cases means targeting a core inflation rate of around 2%. If inflation falls below target the central bank may cut base lending rates, with a view to stimulating lending and boosting the economy. If inflation rises substantially above 2% it normally results in the central bank raising base lending rates in an attempt to lower inflation.
Higher interest rates generally help strengthen a country’s currency as they make it a more attractive place for global investors to park their money.
Higher interest rates overall weigh on the price of Gold because they increase the opportunity cost of holding Gold instead of investing in an interest-bearing asset or placing cash in the bank. If interest rates are high that usually pushes up the price of the US Dollar (USD), and since Gold is priced in Dollars, this has the effect of lowering the price of Gold.
The Fed funds rate is the overnight rate at which US banks lend to each other. It is the oft-quoted headline rate set by the Federal Reserve at its FOMC meetings. It is set as a range, for example 4.75%-5.00%, though the upper limit (in that case 5.00%) is the quoted figure. Market expectations for future Fed funds rate are tracked by the CME FedWatch tool, which shapes how many financial markets behave in anticipation of future Federal Reserve monetary policy decisions.
-
08:30
Switzerland SVME - Purchasing Managers' Index above expectations (48.4) in February: Actual (49.6)
-
08:27
Pound Sterling rebounds against US Dollar amid optimism over Russia-Ukraine truce
- The Pound Sterling rises to near 1.2600 against the US Dollar due to positive developments in the Russia-Ukraine peace truce.
- Fears of US President Trump’s tariffs on Canada, Mexico, and China loom large.
- The BoE is expected to follow a careful and gradual policy-easing approach.
The Pound Sterling (GBP) gains ground against the US Dollar (USD) after a two-day correction and rebounds to near 1.2610 in European trading hours on Monday. The GBP/USD pair bounces back as the risk premium of the US Dollar diminishes on optimism over a peace truce between Russia and Ukraine. The US Dollar Index (DXY), which tracks the Greenback’s value against six major currencies, falls to near 107.25 from an over two-week high of 107.65 posted on Friday.
Over the weekend, United Kingdom (UK) Prime Minister Keir Starmer said European leaders agreed to present a peace plan to Washington. The meeting between European leaders and Starmer was also attended by Ukrainian President Volodymyr Zelenskyy, potentially a big positive step towards ending the three-year-long war in Ukraine. Technically, signs of easing geopolitical tensions diminish the safe-haven appeal of the US Dollar.
However, investors should avoid betting big against the US Dollar due to looming tariff fears. United States (US) President Donald Trump is poised to slap tariffs on Canada, Mexico, and China for failing to restrict the flow of fentanyl into the US.
US Commerce Secretary Howard Lutnick confirmed over the weekend that the President’s plans of imposing tariffs on Canada and Mexico on Tuesday are on. However, his comments indicated that there is room for negotiation over the degree of tariffs.
US President Trump threatened to impose a 25% levy on Canada and Mexico and an additional 10% on China. Trump also slapped 10% tariffs on China in the first week of February.
Daily digest market movers: Pound Sterling trades higher on multiple tailwinds
- At the start of the week, the Pound Sterling trades higher against its major peers, except the Euro, due to a potential Russia-Ukraine peace truce. Additionally, firm expectations that the Bank of England (BoE) will follow a moderate policy-easing cycle and a likely healthy trade deal between the US and the UK have kept the British currency on the frontfoot.
- On Friday, BoE Deputy Governor Dave Ramsden said that the central bank should keep a “careful and gradual” approach to the monetary policy expansion amid uncertainty over the labor market and global trade. Ramsden warned that inflationary pressures are still elevated due to persistent wage growth. “I no longer think that risks to hitting the 2% inflation target sustainably in the medium term are to the downside,” Ramsden said. Meanwhile, trades have fully priced in two interest rate cuts this year.
- The meeting between US President Trump and UK Prime Minister Starmer on Thursday didn’t end with a trade deal, but Trump was confident that an agreement could be made "pretty quickly" where tariffs “wouldn't be necessary".
- This week, investors will pay close attention to a slew of US economic data, notably on the Nonfarm Payrolls (NFP) data for February, which will be released on Friday. The labor market data will influence market expectations for the Federal Reserve’s (Fed) monetary policy outlook. The Fed is expected to keep interest rates steady in the March and May policy meetings, and there is a 77% chance that it will cut them in June, according to the CME FedWatch tool.
- In Monday’s session, investors will focus on the US ISM and revised S&P Global Manufacturing Purchasing Managers Index (PMI) data for February, which will be published during North American trading hours. The ISM Manufacturing PMI is estimated to have grown at a marginally slower pace of 50.8 from 50.9 in January.
Technical Analysis: Pound Sterling finds bids near 20-day EMA
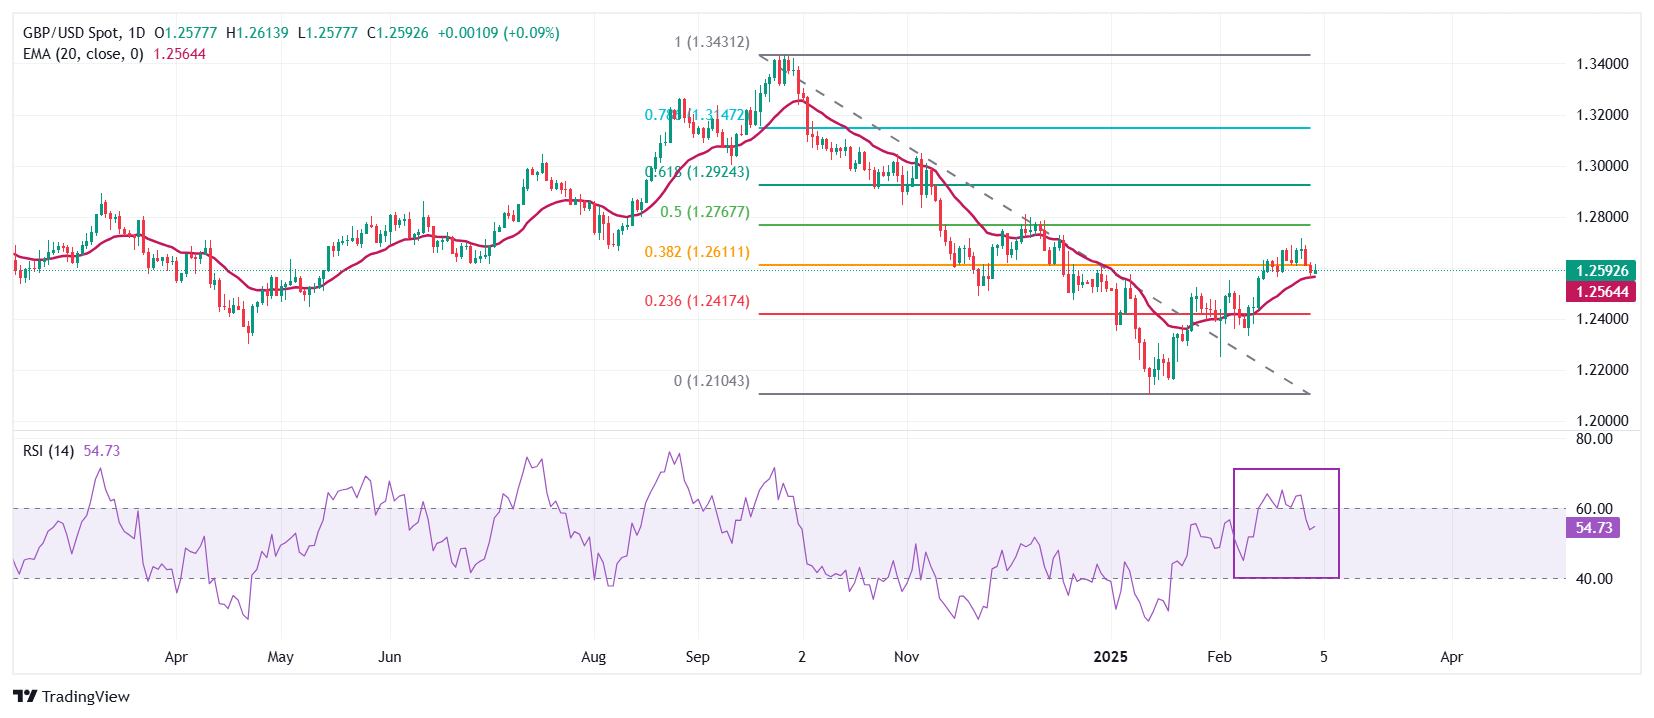
The Pound Sterling movers higher above 1.2600 against the US Dollar on Monday. The GBP/USD pair finds buying interest after a mean-reversion move to the 20-day Exponential Moving Average (EMA) near 1.2560.
The 14-day Relative Strength Index (RSI) falls back within the 40.00-60.00 range, suggesting that the bullish momentum has concluded for now. However, the positive bias remains intact.
Looking down, the February 11 low of 1.2333 will act as a key support zone for the pair. On the upside, the 50% Fibonacci retracement at 1.2765 will act as a key resistance zone.
Pound Sterling FAQs
The Pound Sterling (GBP) is the oldest currency in the world (886 AD) and the official currency of the United Kingdom. It is the fourth most traded unit for foreign exchange (FX) in the world, accounting for 12% of all transactions, averaging $630 billion a day, according to 2022 data. Its key trading pairs are GBP/USD, also known as ‘Cable’, which accounts for 11% of FX, GBP/JPY, or the ‘Dragon’ as it is known by traders (3%), and EUR/GBP (2%). The Pound Sterling is issued by the Bank of England (BoE).
The single most important factor influencing the value of the Pound Sterling is monetary policy decided by the Bank of England. The BoE bases its decisions on whether it has achieved its primary goal of “price stability” – a steady inflation rate of around 2%. Its primary tool for achieving this is the adjustment of interest rates. When inflation is too high, the BoE will try to rein it in by raising interest rates, making it more expensive for people and businesses to access credit. This is generally positive for GBP, as higher interest rates make the UK a more attractive place for global investors to park their money. When inflation falls too low it is a sign economic growth is slowing. In this scenario, the BoE will consider lowering interest rates to cheapen credit so businesses will borrow more to invest in growth-generating projects.
Data releases gauge the health of the economy and can impact the value of the Pound Sterling. Indicators such as GDP, Manufacturing and Services PMIs, and employment can all influence the direction of the GBP. A strong economy is good for Sterling. Not only does it attract more foreign investment but it may encourage the BoE to put up interest rates, which will directly strengthen GBP. Otherwise, if economic data is weak, the Pound Sterling is likely to fall.
Another significant data release for the Pound Sterling is the Trade Balance. This indicator measures the difference between what a country earns from its exports and what it spends on imports over a given period. If a country produces highly sought-after exports, its currency will benefit purely from the extra demand created from foreign buyers seeking to purchase these goods. Therefore, a positive net Trade Balance strengthens a currency and vice versa for a negative balance.
-
08:27
Austria Unemployment down to 347.4K in February from previous 365.7K
-
08:27
Austria Unemployment Rate declined to 8.1% in February from previous 8.6%
-
08:15
Spain HCOB Manufacturing PMI down to 49.7 in February from previous 50.9
-
08:12
Austria Gross Domestic Product (QoQ) registered at -0.4%, below expectations (0%) in 4Q
-
07:58
Japan’s Top FX Diplomat Mimura: Small and medium firms have strong prospects of wage hikes
Atsushi Mimura, Japan’s Vice Finance Minister For International Affairs and top foreign exchange official, said on Monday, “It's not only big firms, also hearing small and medium firms have strong prospects of wage hikes.”
Additional quotes
Real private consumption in Japan is still below pre-Covid levels.
Bright spots in the economy include strong corporate investment, inbound tourism.
Market reaction
USD/JPY is flirting with intraday lows near 150.15, losing 0.75% on the day, as of writing.
-
07:53
Crude Oil price today: WTI price bearish, according to FXStreet data
West Texas Intermediate (WTI) Oil price falls on Wednesday, according to FXStreet data. WTI trades at $69.72 per barrel, down from Tuesday’s close at $69.87.
Brent Oil Exchange Rate (Brent crude) is also shedding ground, trading at $72.89 after its previous daily close at $73.03.
WTI Oil FAQs
WTI Oil is a type of Crude Oil sold on international markets. The WTI stands for West Texas Intermediate, one of three major types including Brent and Dubai Crude. WTI is also referred to as “light” and “sweet” because of its relatively low gravity and sulfur content respectively. It is considered a high quality Oil that is easily refined. It is sourced in the United States and distributed via the Cushing hub, which is considered “The Pipeline Crossroads of the World”. It is a benchmark for the Oil market and WTI price is frequently quoted in the media.
Like all assets, supply and demand are the key drivers of WTI Oil price. As such, global growth can be a driver of increased demand and vice versa for weak global growth. Political instability, wars, and sanctions can disrupt supply and impact prices. The decisions of OPEC, a group of major Oil-producing countries, is another key driver of price. The value of the US Dollar influences the price of WTI Crude Oil, since Oil is predominantly traded in US Dollars, thus a weaker US Dollar can make Oil more affordable and vice versa.
The weekly Oil inventory reports published by the American Petroleum Institute (API) and the Energy Information Agency (EIA) impact the price of WTI Oil. Changes in inventories reflect fluctuating supply and demand. If the data shows a drop in inventories it can indicate increased demand, pushing up Oil price. Higher inventories can reflect increased supply, pushing down prices. API’s report is published every Tuesday and EIA’s the day after. Their results are usually similar, falling within 1% of each other 75% of the time. The EIA data is considered more reliable, since it is a government agency.
OPEC (Organization of the Petroleum Exporting Countries) is a group of 12 Oil-producing nations who collectively decide production quotas for member countries at twice-yearly meetings. Their decisions often impact WTI Oil prices. When OPEC decides to lower quotas, it can tighten supply, pushing up Oil prices. When OPEC increases production, it has the opposite effect. OPEC+ refers to an expanded group that includes ten extra non-OPEC members, the most notable of which is Russia.
(An automation tool was used in creating this post.)
-
07:44
USD/CAD Price Forecast: Pulls back from 1.4450, upside appears as bullish bias strengthens
- USD/CAD could retest the “pullback resistance” near the key psychological level of 1.4450.
- The bullish outlook remains intact, reinforced by the 14-day Relative Strength Index staying above 50.
- The nine-day Exponential Moving Average at 1.4356 may act as the primary support level.
USD/CAD snaps its six-day winning streak, hovering around 1.4440 during Friday’s Asian session. Technical analysis on the daily chart shows the pair holding above the nine- and 14-day Exponential Moving Averages (EMAs), indicating strengthening short-term bullish momentum.
Moreover, the 14-day Relative Strength Index (RSI) remains above 50, signaling a continued bullish sentiment.
The USD/CAD pair is testing the "pullback resistance" near the key psychological level of 1.4450. A decisive breakout above this level could pave the way for a climb toward 1.4793, its highest level since March 2003, reached on February 3.
On the downside, initial support is seen at the nine-day EMA of 1.4356, followed by the 14-day EMA at 1.4334. A break below these levels could dampen short-term momentum, potentially pushing the pair toward the three-month low of 1.4151, recorded on February 14.
A decisive break below the three-month low could drive the USD/CAD pair toward the four-month low of 1.3927, last seen on November 25.
USD/CAD: Daily Chart
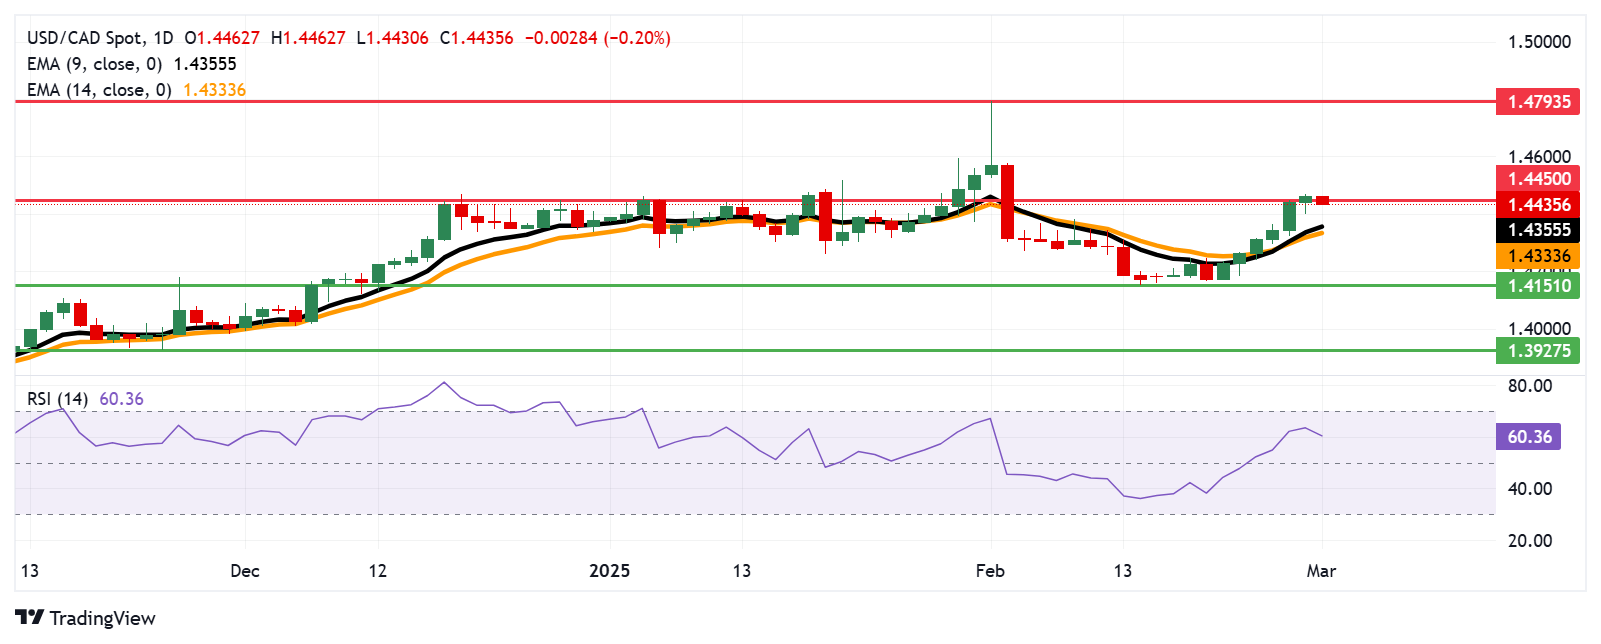
Canadian Dollar PRICE Today
The table below shows the percentage change of Canadian Dollar (CAD) against listed major currencies today. Canadian Dollar was the weakest against the Japanese Yen.
USD EUR GBP JPY CAD AUD NZD CHF USD -0.31% -0.16% -0.09% -0.08% -0.16% -0.05% -0.08% EUR 0.31% 0.03% 0.00% 0.05% 0.05% 0.08% 0.05% GBP 0.16% -0.03% 0.09% 0.06% 0.04% 0.04% 0.01% JPY 0.09% 0.00% -0.09% 0.23% -0.02% 0.09% 0.00% CAD 0.08% -0.05% -0.06% -0.23% 0.07% 0.03% -0.00% AUD 0.16% -0.05% -0.04% 0.02% -0.07% 0.03% -0.00% NZD 0.05% -0.08% -0.04% -0.09% -0.03% -0.03% -0.03% CHF 0.08% -0.05% -0.01% -0.01% 0.00% 0.00% 0.03% The heat map shows percentage changes of major currencies against each other. The base currency is picked from the left column, while the quote currency is picked from the top row. For example, if you pick the Canadian Dollar from the left column and move along the horizontal line to the US Dollar, the percentage change displayed in the box will represent CAD (base)/USD (quote).
-
07:30
Sweden Purchasing Managers Index Manufacturing (MoM): 53.5 (February) vs 52.9
-
07:11
Forex Today: US Dollar retreats to start week, focus remains on geopolitics
Here is what you need to know on Monday, March 3:
The US Dollar (USD) struggles to find demand at the beginning of the week as investors continue to assess the latest geopolitical developments. Preliminary February inflation data from the Eurozone will be featured in the economic calendar on Monday, ahead of the February ISM Manufacturing PMI report from the US.
US Dollar PRICE Today
The table below shows the percentage change of US Dollar (USD) against listed major currencies today. US Dollar was the weakest against the Euro.
USD EUR GBP JPY CAD AUD NZD CHF USD -0.29% -0.17% -0.08% -0.01% -0.16% -0.01% -0.07% EUR 0.29% 0.00% -0.02% 0.11% 0.02% 0.09% 0.04% GBP 0.17% -0.01% 0.08% 0.09% 0.02% 0.09% 0.04% JPY 0.08% 0.02% -0.08% 0.30% -0.02% 0.13% 0.02% CAD 0.01% -0.11% -0.09% -0.30% 0.00% -0.00% -0.05% AUD 0.16% -0.02% -0.02% 0.02% 0.00% 0.07% 0.02% NZD 0.00% -0.09% -0.09% -0.13% 0.00% -0.07% -0.05% CHF 0.07% -0.04% -0.04% -0.02% 0.05% -0.02% 0.05% The heat map shows percentage changes of major currencies against each other. The base currency is picked from the left column, while the quote currency is picked from the top row. For example, if you pick the US Dollar from the left column and move along the horizontal line to the Japanese Yen, the percentage change displayed in the box will represent USD (base)/JPY (quote).
US President Donald Trump's meeting with Ukrainian President Volodymyr Zelenskyy turned into an argument late Friday and Trump cancelled the signing of a minerals deal, which could have paved the way to a Russia-Ukraine ceasefire and possibly a truce deal eventually. Over the weekend, Trump reiterated that they will impose an additional 10% tariff on Chinese imports starting Tuesday, as initially planned. Early Monday, Global Times reported that China is evaluating countermeasures in response to additional US tariffs. After reaching its highest level in two weeks near 107.70 late Friday, the USD Index stays on the back foot below 107.50 on Monday.
During the Asian trading hours, the data from China showed that the Caixin Manufacturing PMI improved to 50.8 in February from 50.1 in January. AUD/USD registered losses for six consecutive trading days and lost more than 2% in the previous week. The pair holds steady above 0.6200 in the European morning on Monday.
The Harmonized Index of Consumer Prices (HICP) in the Euro area is forecast to rise 2.6% on a yearly basis in February. EUR/USD trades modestly higher on the day above 1.0400 to begin the European session on Monday after closing in negative territory for two consecutive weeks.
GBP/USD edged lower on Friday and snapped a three-week winning streak. The pair stays relatively quiet and trades at around 1.2600 on Monday.
USD/CAD gained about 1.7% in the previous week before going into a consolidation phase near 1.4450 on Monday. Trump administration's 25% tariffs on Canadian imports are expected to go into effect on March 4.
USD/JPY holds steady at around 150.50 in the European morning. In the early Asian trading hours on Tuesday, the Japanese economic calendar will feature Unemployment Rate data for January.
Gold lost more than 2.5% and closed a week in negative territory for the first time since late December. XAU/USD clings to modest recovery gains above $2,860 on Monday.
Tariffs FAQs
Tariffs are customs duties levied on certain merchandise imports or a category of products. Tariffs are designed to help local producers and manufacturers be more competitive in the market by providing a price advantage over similar goods that can be imported. Tariffs are widely used as tools of protectionism, along with trade barriers and import quotas.
Although tariffs and taxes both generate government revenue to fund public goods and services, they have several distinctions. Tariffs are prepaid at the port of entry, while taxes are paid at the time of purchase. Taxes are imposed on individual taxpayers and businesses, while tariffs are paid by importers.
There are two schools of thought among economists regarding the usage of tariffs. While some argue that tariffs are necessary to protect domestic industries and address trade imbalances, others see them as a harmful tool that could potentially drive prices higher over the long term and lead to a damaging trade war by encouraging tit-for-tat tariffs.
During the run-up to the presidential election in November 2024, Donald Trump made it clear that he intends to use tariffs to support the US economy and American producers. In 2024, Mexico, China and Canada accounted for 42% of total US imports. In this period, Mexico stood out as the top exporter with $466.6 billion, according to the US Census Bureau. Hence, Trump wants to focus on these three nations when imposing tariffs. He also plans to use the revenue generated through tariffs to lower personal income taxes.
-
07:02
FX option expiries for Mar 3 NY cut
FX option expiries for Mar 3 NY cut at 10:00 Eastern Time via DTCC can be found below.
EUR/USD: EUR amounts
- 1.0245 1.5b
- 1.0470 781m
- 1.0475 945m
GBP/USD: GBP amounts
- 1.2490 524m
- 1.2750 447m
USD/JPY: USD amounts
- 150.79 599m
- 150.80 540m
AUD/USD: AUD amounts
- 0.6145 932m
USD/CAD: USD amounts
- 1.4300 1.8b
- 1.4350 1.2b
- 1.4400 1.8b
- 1.4440 2b
- 1.4570 878m
NZD/USD: NZD amounts
- 0.5565 958m
-
07:01
Turkey Consumer Price Index (YoY) registered at 39.05%, below expectations (39.9%) in February
-
07:00
Turkey Consumer Price Index (MoM) below expectations (2.85%) in February: Actual (2.27%)
-
06:40
US Dollar Price Forecast: Initial support level emerges below 107.00
- The US Dollar Index weakens to near 107.25 in Monday’s early European session.
- The positive outlook of the DXY remains intact above the 100-day EMA, but further consolidation cannot be ruled out.
- The immediate resistance level emerges at 108.45; the first support level is seen at 106.70.
The US Dollar Index (DXY) faces some selling pressure to near 107.25, snapping the three-day winning streak during the early European session on Monday. The rising expectation that the US Federal Reserve (Fed) will cut interest rates by a quarter of a percentage point twice by the end of this year drags the DXY lower.
Technically, the bullish outlook of the DXY remains in play as the index holds above the key 100-day Exponential Moving Average (EMA) on the daily chart. Nonetheless, the 14-day Exponential Moving Average (EMA) hovers around the midline, suggesting that further consolidation cannot be ruled out in the near term.
On the bright side, the immediate resistance level for the US Dollar Index emerges near 108.45, representing the high of February 10 and the upper boundary of the Bollinger Band. Sustained trading above this level could pave the way to 109.80, the high of February 3. The additional upside filter to watch is the 110.00 psychological level.
On the flip side, the 100-day EMA at 106.70 acts as an initial support level for the DXY. A decisive break below the mentioned level could expose the key contention level at 106.00, portraying the round figure and the lower limit of the Bollinger Band. Further south, the next downside stop to watch is 105.41, the low of December 6, 2024.The US Dollar Index (DXY) daily chart
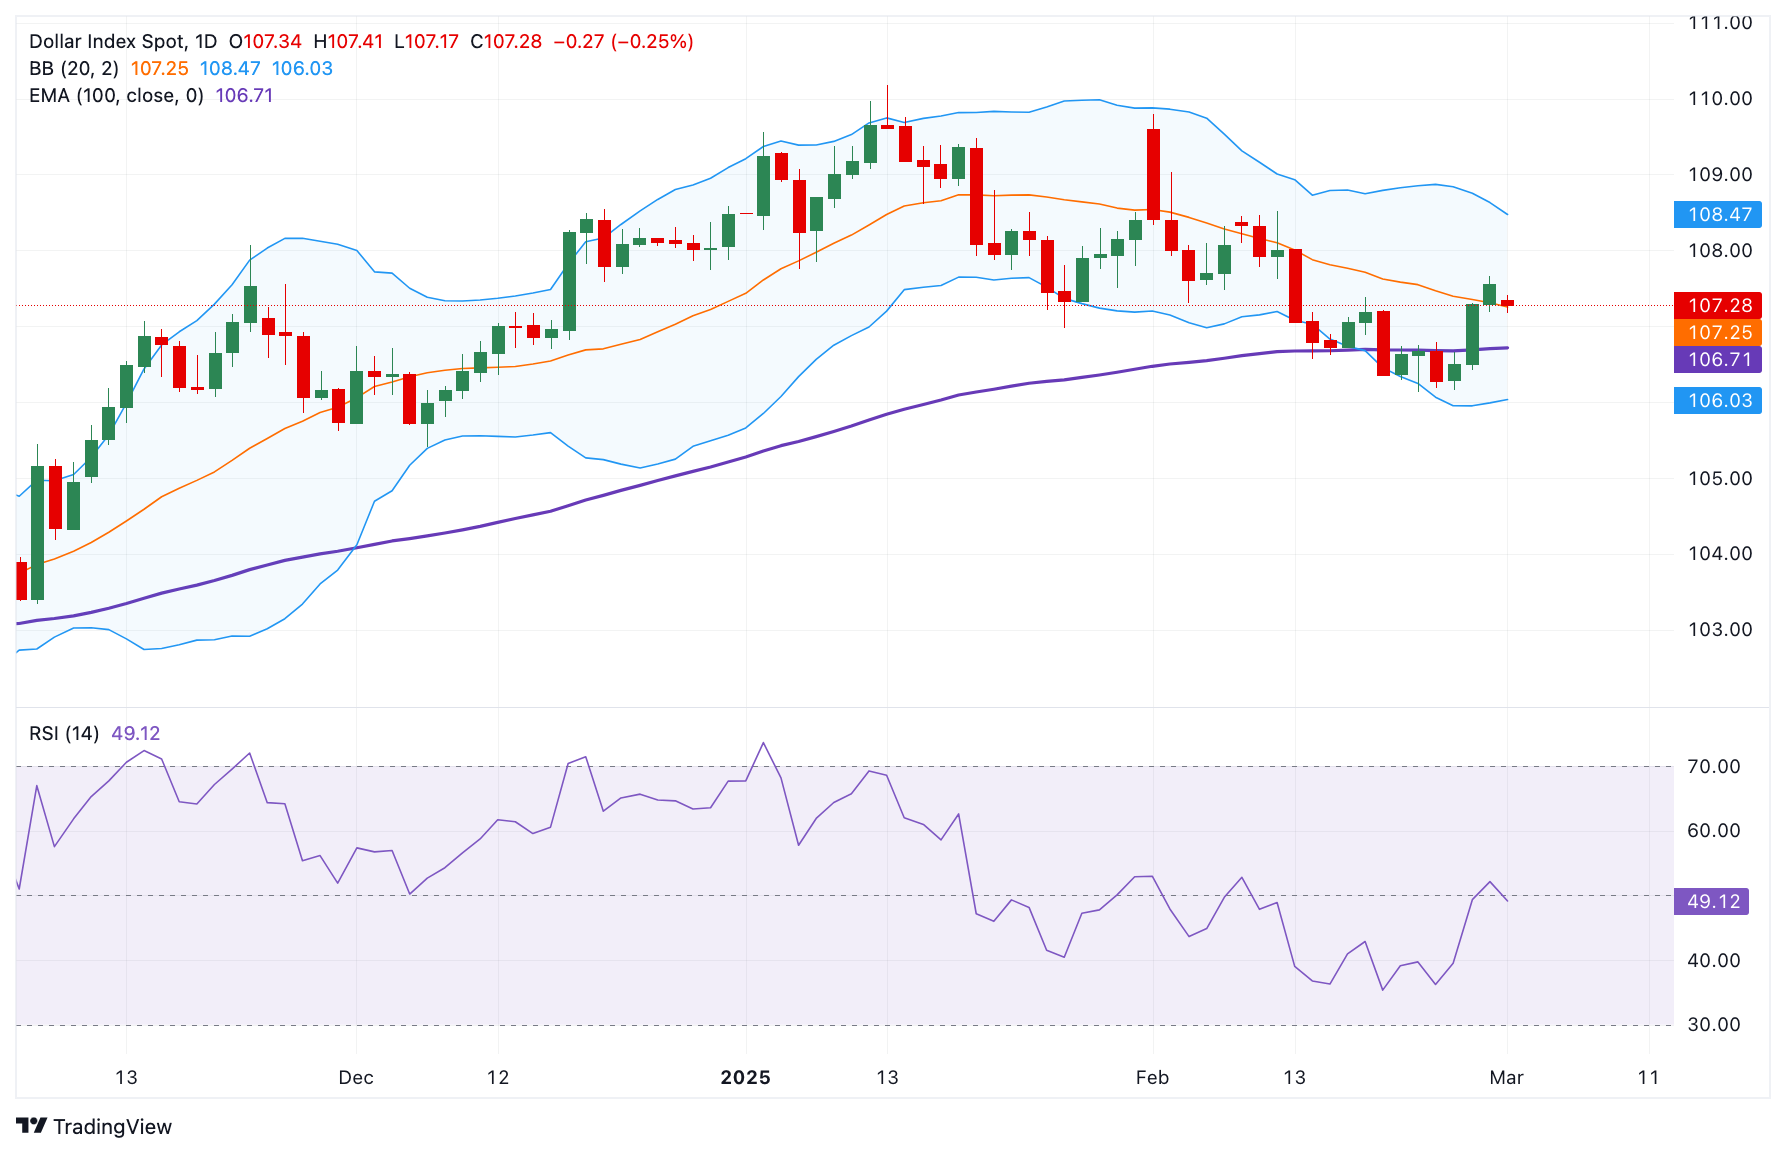
US Dollar FAQs
The US Dollar (USD) is the official currency of the United States of America, and the ‘de facto’ currency of a significant number of other countries where it is found in circulation alongside local notes. It is the most heavily traded currency in the world, accounting for over 88% of all global foreign exchange turnover, or an average of $6.6 trillion in transactions per day, according to data from 2022. Following the second world war, the USD took over from the British Pound as the world’s reserve currency. For most of its history, the US Dollar was backed by Gold, until the Bretton Woods Agreement in 1971 when the Gold Standard went away.
The most important single factor impacting on the value of the US Dollar is monetary policy, which is shaped by the Federal Reserve (Fed). The Fed has two mandates: to achieve price stability (control inflation) and foster full employment. Its primary tool to achieve these two goals is by adjusting interest rates. When prices are rising too quickly and inflation is above the Fed’s 2% target, the Fed will raise rates, which helps the USD value. When inflation falls below 2% or the Unemployment Rate is too high, the Fed may lower interest rates, which weighs on the Greenback.
In extreme situations, the Federal Reserve can also print more Dollars and enact quantitative easing (QE). QE is the process by which the Fed substantially increases the flow of credit in a stuck financial system. It is a non-standard policy measure used when credit has dried up because banks will not lend to each other (out of the fear of counterparty default). It is a last resort when simply lowering interest rates is unlikely to achieve the necessary result. It was the Fed’s weapon of choice to combat the credit crunch that occurred during the Great Financial Crisis in 2008. It involves the Fed printing more Dollars and using them to buy US government bonds predominantly from financial institutions. QE usually leads to a weaker US Dollar.
Quantitative tightening (QT) is the reverse process whereby the Federal Reserve stops buying bonds from financial institutions and does not reinvest the principal from the bonds it holds maturing in new purchases. It is usually positive for the US Dollar.
-
06:00
Netherlands, The Markit Manufacturing PMI increased to 50 in February from previous 48.4
-
06:00
Russia S&P Global Manufacturing PMI down to 50.2 in February from previous 53.1
-
05:55
USD/CHF trades with mild losses below 0.9050 as traders brace for US PMI release
- USD/CHF posts modest losses to around 0.9020 in Monday’s early European session.
- The rising bets of Fed rate cuts weigh on the US Dollar.
- The uncertainty and escalating tension boost safe-haven assets like the Swiss Franc
The USD/CHF pair trades with mild losses near 0.9020 during the early European session on Tuesday. The weaker US Dollar (USD) broadly drags the pair lower. Traders will take more cues from the US ISM Manufacturing PMI report, which is due later on Monday. On Friday, the attention will shift to the US ISM Manufacturing PMI data.
Meanwhile, the US Dollar Index ( DXY), a measure of the value of the USD against a basket of six foreign currencies, weakens to nearly 107.25. Traders continue to price in the chance that the US Federal Reserve (Fed) will cut interest rates by a quarter of a percentage point twice by the end of this year. This, in turn, weighs on the Greenback against the Swiss Franc (CHF).
Additionally, the uncertainty and escalating tension surrounding the Russia and Ukraine conflict could boost the safe-haven demand, benefiting the Swiss Franc (CHF). US President Donald Trump stated on the weekend that Ukrainian President Volodymyr Zelenskyy was disrespectful" and canceled the signing of a minerals deal that would have brought Ukraine closer to resolving its conflict with Russia. Investors will closely monitor the developments surrounding Russia's headlines.Swiss Franc FAQs
The Swiss Franc (CHF) is Switzerland’s official currency. It is among the top ten most traded currencies globally, reaching volumes that well exceed the size of the Swiss economy. Its value is determined by the broad market sentiment, the country’s economic health or action taken by the Swiss National Bank (SNB), among other factors. Between 2011 and 2015, the Swiss Franc was pegged to the Euro (EUR). The peg was abruptly removed, resulting in a more than 20% increase in the Franc’s value, causing a turmoil in markets. Even though the peg isn’t in force anymore, CHF fortunes tend to be highly correlated with the Euro ones due to the high dependency of the Swiss economy on the neighboring Eurozone.
The Swiss Franc (CHF) is considered a safe-haven asset, or a currency that investors tend to buy in times of market stress. This is due to the perceived status of Switzerland in the world: a stable economy, a strong export sector, big central bank reserves or a longstanding political stance towards neutrality in global conflicts make the country’s currency a good choice for investors fleeing from risks. Turbulent times are likely to strengthen CHF value against other currencies that are seen as more risky to invest in.
The Swiss National Bank (SNB) meets four times a year – once every quarter, less than other major central banks – to decide on monetary policy. The bank aims for an annual inflation rate of less than 2%. When inflation is above target or forecasted to be above target in the foreseeable future, the bank will attempt to tame price growth by raising its policy rate. Higher interest rates are generally positive for the Swiss Franc (CHF) as they lead to higher yields, making the country a more attractive place for investors. On the contrary, lower interest rates tend to weaken CHF.
Macroeconomic data releases in Switzerland are key to assessing the state of the economy and can impact the Swiss Franc’s (CHF) valuation. The Swiss economy is broadly stable, but any sudden change in economic growth, inflation, current account or the central bank’s currency reserves have the potential to trigger moves in CHF. Generally, high economic growth, low unemployment and high confidence are good for CHF. Conversely, if economic data points to weakening momentum, CHF is likely to depreciate.
As a small and open economy, Switzerland is heavily dependent on the health of the neighboring Eurozone economies. The broader European Union is Switzerland’s main economic partner and a key political ally, so macroeconomic and monetary policy stability in the Eurozone is essential for Switzerland and, thus, for the Swiss Franc (CHF). With such dependency, some models suggest that the correlation between the fortunes of the Euro (EUR) and the CHF is more than 90%, or close to perfect.
-
05:39
EUR/GBP remains above 0.8250 as France, UK propose a one-month Ukraine truce
- EUR/GBP edges higher after reports that France and the UK have proposed a one-month truce in Ukraine.
- French President Emmanuel Macron stated that the ceasefire aims to halt all air and sea conflicts.
- The British Pound remains supported as the BoE is expected to take a cautious approach to monetary easing.
EUR/GBP pauses its three-day losing streak, hovering around 0.8260 during Monday’s Asian session. The currency cross strengthens as the Euro (EUR) gains traction following reports that France and the United Kingdom (UK) have proposed a one-month truce in Ukraine.
In an interview with France's Le Figaro on Sunday night, French President Emmanuel Macron stated that France and Britain are advocating for a one-month ceasefire in Ukraine to halt all air and sea conflicts, as well as attacks on energy infrastructure. This announcement followed crisis talks in London, where European leaders reaffirmed their support for Kyiv, pledged increased security spending, and discussed forming a coalition to enforce any potential truce.
The Euro also found support from stronger-than-expected February flash Harmonized Index of Consumer Prices (HICP) data from Germany, released on Friday. Despite this higher inflation reading, the European Central Bank (ECB) is still expected to maintain its easing stance in Thursday’s policy meeting. Investors now turn their attention to the Eurozone’s HICP inflation data, set for release later today.
However, EUR/GBP’s upside could be limited as the Pound Sterling (GBP) remains supported by expectations that the Bank of England (BoE) will adopt a more measured approach to monetary easing compared to other major central banks.
Market sentiment suggests the BoE may proceed cautiously due to strong wage growth, with Average Earnings (excluding bonuses) in the three months ending December rising to 5.9%—the highest level since April 2024.
Interest rates FAQs
Interest rates are charged by financial institutions on loans to borrowers and are paid as interest to savers and depositors. They are influenced by base lending rates, which are set by central banks in response to changes in the economy. Central banks normally have a mandate to ensure price stability, which in most cases means targeting a core inflation rate of around 2%. If inflation falls below target the central bank may cut base lending rates, with a view to stimulating lending and boosting the economy. If inflation rises substantially above 2% it normally results in the central bank raising base lending rates in an attempt to lower inflation.
Higher interest rates generally help strengthen a country’s currency as they make it a more attractive place for global investors to park their money.
Higher interest rates overall weigh on the price of Gold because they increase the opportunity cost of holding Gold instead of investing in an interest-bearing asset or placing cash in the bank. If interest rates are high that usually pushes up the price of the US Dollar (USD), and since Gold is priced in Dollars, this has the effect of lowering the price of Gold.
The Fed funds rate is the overnight rate at which US banks lend to each other. It is the oft-quoted headline rate set by the Federal Reserve at its FOMC meetings. It is set as a range, for example 4.75%-5.00%, though the upper limit (in that case 5.00%) is the quoted figure. Market expectations for future Fed funds rate are tracked by the CME FedWatch tool, which shapes how many financial markets behave in anticipation of future Federal Reserve monetary policy decisions.
-
05:31
Netherlands, The Retail Sales (YoY) increased to 5.3% in January from previous 0.1%
-
05:30
Australia RBA Commodity Index SDR (YoY): -8.2% (February) vs -11.9%
-
05:07
EUR/USD Price Forecast: Sticks to gains above 1.0400; could climb further amid weaker USD
- EUR/USD regains positive traction on Monday amid the emergence of some USD selling.
- The technical setup warrants some caution before positioning for further appreciation.
- Acceptance below the 50% Fibo. level would be seen as a key trigger for bearish traders.
The EUR/USD pair attracts fresh buyers at the start of a new week and for now, seems to have snapped a three-day losing streak to over a two-week low, around the 1.0360 area touched on Friday. The momentum lifts spot prices further beyond the 1.0400 mark during the Asian session and is sponsored by a weaker US Dollar (USD).
From a technical perspective, the EUR/USD pair showed some resilience below the 50% Fibonacci retracement level of the rally witnessed in February. The subsequent move above the 38.2% Fibo. level suggests that the pullback from the 1.0525-1.0530 area, or a one-month high touched last week, has run its course. The said area represents the 100-day Simple Moving Average (SMA) and should act as a key pivotal point for short-term traders.
Meanwhile, oscillators on the daily chart are yet to confirm a positive bias and warrant some caution for bullish traders amid worries about US President Donald Trump's tariff plans. Nevertheless, the EUR/USD pair still seems poised to climb further towards the 1.0450 horizontal support breakpoint, now turned resistance, which coincides with the 23.6% Fibo. level. A sustained strength beyond could lift spot prices to the 1.0500 psychological mark.
On the flip side, the 1.0370 area, or the 50% Fibo. level now seems to protect the immediate downside. Some follow-through selling could drag the EUR/USD pair to the 61.8% Fibo. level, around the 1.0330 region, en route to the 1.0300 mark and the 1.0285 support zone. The downfall could extend further towards the February swing low, around the 1.0210 region, before spot prices drop to the 1.0180-1.0175 region, or over a two-year low touched in January.
EUR/USD daily chart
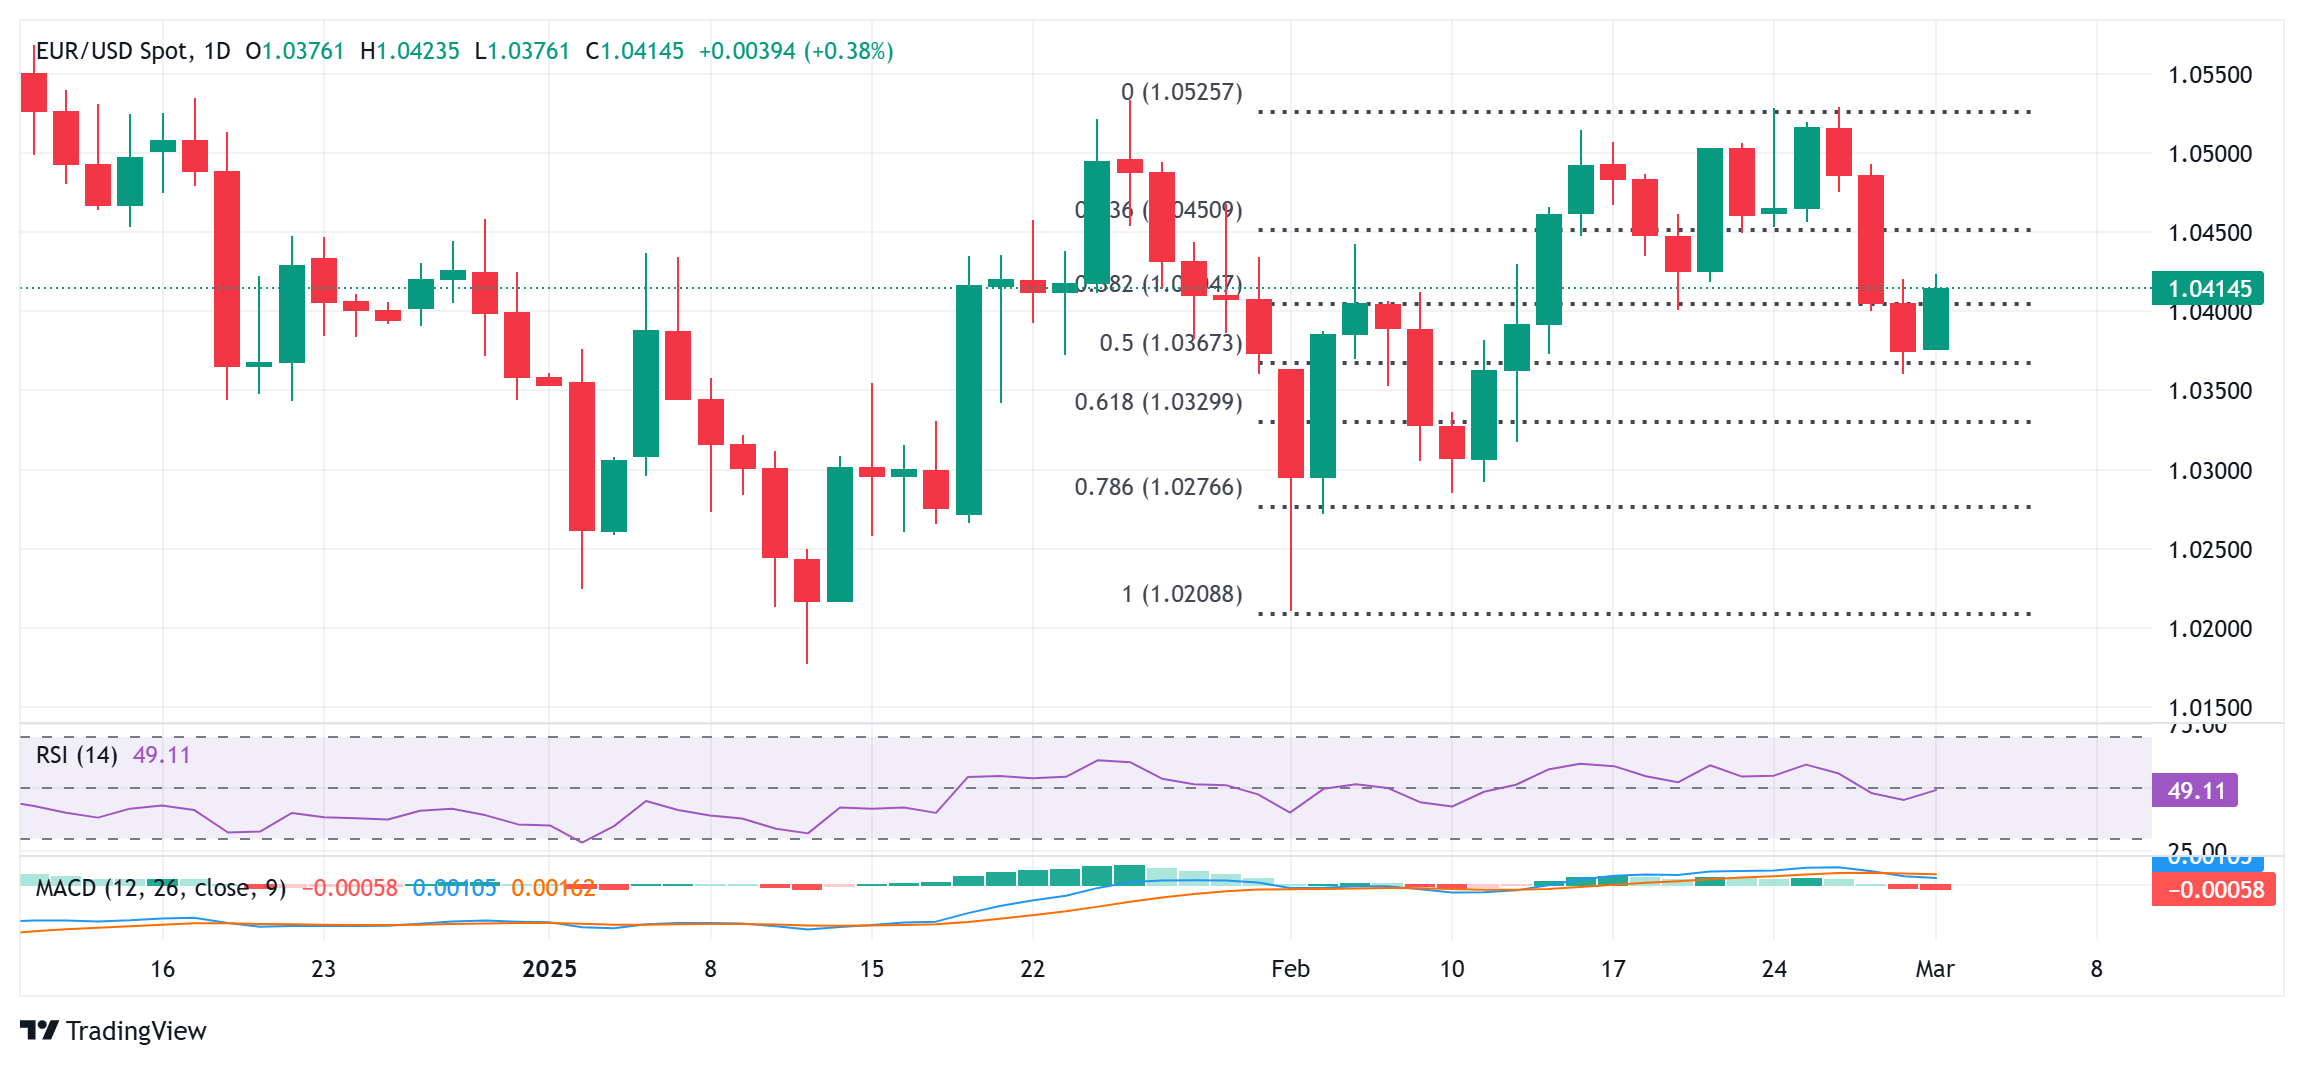
US Dollar PRICE Today
The table below shows the percentage change of US Dollar (USD) against listed major currencies today. US Dollar was the strongest against the Canadian Dollar.
USD EUR GBP JPY CAD AUD NZD CHF USD -0.37% -0.19% -0.11% -0.02% -0.17% -0.04% -0.08% EUR 0.37% 0.08% 0.05% 0.17% 0.10% 0.15% 0.09% GBP 0.19% -0.08% 0.08% 0.09% 0.03% 0.08% 0.02% JPY 0.11% -0.05% -0.08% 0.30% -0.02% 0.11% -0.00% CAD 0.02% -0.17% -0.09% -0.30% 0.00% -0.02% -0.08% AUD 0.17% -0.10% -0.03% 0.02% -0.00% 0.05% -0.01% NZD 0.04% -0.15% -0.08% -0.11% 0.02% -0.05% -0.06% CHF 0.08% -0.09% -0.02% 0.00% 0.08% 0.01% 0.06% The heat map shows percentage changes of major currencies against each other. The base currency is picked from the left column, while the quote currency is picked from the top row. For example, if you pick the US Dollar from the left column and move along the horizontal line to the Japanese Yen, the percentage change displayed in the box will represent USD (base)/JPY (quote).
-
05:00
India HSBC Manufacturing PMI registered at 56.3, below expectations (57.1) in February
-
04:52
EUR/JPY gathers strength above 156.50 ahead of Eurozone HICP inflation data
- EUR/JPY drifts higher to 156.65 in Monday’s early Asian session, up 0.33% on the day,
- Rising expectations that BoJ will raise interest rates further continue to lift the Japanese Yen.
- Investors brace for the preliminary reading of the Eurozone HICP and the US ISM Manufacturing PMI report.
The EUR/JPY cross edges higher to 156.65 during the Asian trading hours on Monday. The Euro (EUR) attracts some buyers after the report that France and the UK proposed a one-month Ukraine truce. Traders await the preliminary reading of the Eurozone Harmonized Index of Consumer Prices (HICP) in February and the US ISM Manufacturing PMI, which are due later on Monday.
Late Sunday, French President Emmanuel Macron said that France and Britain are proposing a one-month truce in Ukraine to stop all air and sea conflict and attacks on energy infrastructure. This action came after the crisis discussions in London, when European leaders pledged to spend more on security and assemble a coalition to defend any truce in Ukraine.
On the other hand, the recent Japanese data showed solid economic growth and sticky inflation, which reaffirmed bets that the Bank of Japan (BoJ) will hike rates further and continue to lend support to the Japanese Yen. (JPY) The Jibun Bank Japan Manufacturing Purchasing Managers’ Index (PMI) came in at 50.8 in February versus a 48.9 flash reading and marking the softest contraction in three months.Euro FAQs
The Euro is the currency for the 19 European Union countries that belong to the Eurozone. It is the second most heavily traded currency in the world behind the US Dollar. In 2022, it accounted for 31% of all foreign exchange transactions, with an average daily turnover of over $2.2 trillion a day. EUR/USD is the most heavily traded currency pair in the world, accounting for an estimated 30% off all transactions, followed by EUR/JPY (4%), EUR/GBP (3%) and EUR/AUD (2%).
The European Central Bank (ECB) in Frankfurt, Germany, is the reserve bank for the Eurozone. The ECB sets interest rates and manages monetary policy. The ECB’s primary mandate is to maintain price stability, which means either controlling inflation or stimulating growth. Its primary tool is the raising or lowering of interest rates. Relatively high interest rates – or the expectation of higher rates – will usually benefit the Euro and vice versa. The ECB Governing Council makes monetary policy decisions at meetings held eight times a year. Decisions are made by heads of the Eurozone national banks and six permanent members, including the President of the ECB, Christine Lagarde.
Eurozone inflation data, measured by the Harmonized Index of Consumer Prices (HICP), is an important econometric for the Euro. If inflation rises more than expected, especially if above the ECB’s 2% target, it obliges the ECB to raise interest rates to bring it back under control. Relatively high interest rates compared to its counterparts will usually benefit the Euro, as it makes the region more attractive as a place for global investors to park their money.
Data releases gauge the health of the economy and can impact on the Euro. Indicators such as GDP, Manufacturing and Services PMIs, employment, and consumer sentiment surveys can all influence the direction of the single currency. A strong economy is good for the Euro. Not only does it attract more foreign investment but it may encourage the ECB to put up interest rates, which will directly strengthen the Euro. Otherwise, if economic data is weak, the Euro is likely to fall. Economic data for the four largest economies in the euro area (Germany, France, Italy and Spain) are especially significant, as they account for 75% of the Eurozone’s economy.
Another significant data release for the Euro is the Trade Balance. This indicator measures the difference between what a country earns from its exports and what it spends on imports over a given period. If a country produces highly sought after exports then its currency will gain in value purely from the extra demand created from foreign buyers seeking to purchase these goods. Therefore, a positive net Trade Balance strengthens a currency and vice versa for a negative balance.
-
04:44
Silver Price Forecast: XAG/USD holds ground above $31.00 amid increased safe-haven demand
- Silver prices benefit from safe-haven demand amid concerns over US President Donald Trump’s tariff policies.
- An additional 10% US tariff on Chinese imports is set to take effect on Tuesday.
- The weaker US Dollar makes dollar-denominated Silver more affordable for holders of other currencies, attracting increased buying interest.
Silver price (XAG/USD) rebounds after two consecutive days of losses, trading around $31.30 per troy ounce during Asian market hours on Monday. The precious metal benefits from safe-haven demand amid concerns over US President Donald Trump’s tariff policies.
Over the weekend, Trump announced an additional 10% tariff on Chinese imports, effective Tuesday, following a similar 10% tariff imposed last month. Additionally, on Thursday, he stated via Truth Social that 25% tariffs on Canadian and Mexican goods will take effect on March 4.
In response, China is considering countermeasures, potentially including both tariff and non-tariff restrictions. US agricultural and food products are expected to be key targets, with possible non-tariff actions such as increased regulatory scrutiny, customs delays, and other trade barriers.
Meanwhile, geopolitical tensions intensified as a dispute arose between President Trump and Ukrainian leader Volodymyr Zelenskyy during peace negotiations. Zelenskyy was expected to sign an agreement granting the US expanded access to Ukraine's rare earth minerals and hold a joint press conference. However, the plan was abandoned following a heated exchange between the leaders in front of the media.
The weaker US Dollar (USD) is also providing support for Silver, making it more affordable for holders of other currencies. The US Dollar Index (DXY), which tracks the USD against six major currencies, hovers around 107.30 at the time of writing.
Additionally, the latest US Personal Consumption Expenditures (PCE) inflation data has helped ease concerns over inflationary spikes, boosting expectations for Federal Reserve (Fed) interest rate cuts. This has further enhanced Silver’s appeal as a non-yielding asset.
January’s PCE report aligned with market expectations, with the monthly headline PCE holding steady at 0.3%. Core PCE edged up to 0.3% from December’s 0.2%, while the annual headline PCE stood at 2.6%, slightly above forecasts but unchanged from December. Core PCE eased to 2.6%, down from a revised 2.9% in December.
Silver FAQs
Silver is a precious metal highly traded among investors. It has been historically used as a store of value and a medium of exchange. Although less popular than Gold, traders may turn to Silver to diversify their investment portfolio, for its intrinsic value or as a potential hedge during high-inflation periods. Investors can buy physical Silver, in coins or in bars, or trade it through vehicles such as Exchange Traded Funds, which track its price on international markets.
Silver prices can move due to a wide range of factors. Geopolitical instability or fears of a deep recession can make Silver price escalate due to its safe-haven status, although to a lesser extent than Gold's. As a yieldless asset, Silver tends to rise with lower interest rates. Its moves also depend on how the US Dollar (USD) behaves as the asset is priced in dollars (XAG/USD). A strong Dollar tends to keep the price of Silver at bay, whereas a weaker Dollar is likely to propel prices up. Other factors such as investment demand, mining supply – Silver is much more abundant than Gold – and recycling rates can also affect prices.
Silver is widely used in industry, particularly in sectors such as electronics or solar energy, as it has one of the highest electric conductivity of all metals – more than Copper and Gold. A surge in demand can increase prices, while a decline tends to lower them. Dynamics in the US, Chinese and Indian economies can also contribute to price swings: for the US and particularly China, their big industrial sectors use Silver in various processes; in India, consumers’ demand for the precious metal for jewellery also plays a key role in setting prices.
Silver prices tend to follow Gold's moves. When Gold prices rise, Silver typically follows suit, as their status as safe-haven assets is similar. The Gold/Silver ratio, which shows the number of ounces of Silver needed to equal the value of one ounce of Gold, may help to determine the relative valuation between both metals. Some investors may consider a high ratio as an indicator that Silver is undervalued, or Gold is overvalued. On the contrary, a low ratio might suggest that Gold is undervalued relative to Silver.
-
04:38
Gold price trades with mild positive bias; lacks bullish conviction
- Gold price gained some positive traction on Monday amid modest US Dollar weakness.
- Bets that the Fed will cut rates again undermine the USD and benefit the XAU/USD pair.
- Concerns about Trump’s tariff plans and a global trade war also support the commodity.
Gold price (XAU/USD) kicks off the new week on a positive note and recovers further from over a three-week low, around the $2,833-2,832 region touched on Friday. Despite Friday's in-line US inflation data, traders continue to price in the possibility that the Federal Reserve (Fed) will cut interest rates by a quarter of a percentage point twice by the end of this year. This, along with the emergence of fresh selling around the US Dollar (USD), lends support to the non-yielding yellow metal.
Apart from this, concerns about the potential economic fallout from US President Donald Trump's tariff plans and geopolitical risk turn out to be other factors underpinning the safe-haven Gold price. However, the lack of follow-through buying warrants some caution before confirming that the XAU/USD's recent corrective pullback from the all-time peak has run its course. Traders might also opt to wait for this week's release of important US macro data scheduled for the beginning of a new month.
Gold price is underpinned by bets for more Fed rate cuts and a weaker USD
- The US Bureau of Economic Analysis reported on Friday that the Personal Consumption Expenditures (PCE) Price Index rose 0.3% in January and increased 2.5% over the past twelve months, down slightly from 2.6% in December.
- Adding to this, the core PCE Price Index, which excludes volatile food and energy prices, gained 0.3% last month and climbed 2.6% on a yearly basis in January, marking a notable deceleration from 2.9% in the previous month.
- The report further revealed that US consumer spending unexpectedly dropped 0.2% last month, marking the first decline since March 2023 and the biggest decrease in nearly four years, fueling worries about the US growth outlook.
- According to the CME Group's FedWatch Tool, market participants are pricing in the possibility that the Federal Reserve will resume cutting interest rates at the June policy meeting and lower borrowing costs again in September.
- This comes on top of worries that US President Donald Trump's trade tariffs would undermine consumer spending and fail to assist the US Dollar to capitalize on a three-day-old recovery move from over a two-month low.
- Trump confirmed that he will impose tariffs on Canada and Mexico starting Tuesday and announced plans to double the 10% universal tariff on imports from China, raising the risk of a global trade war and benefiting the safe-haven Gold price.
- Traders now look to the US ISM Manufacturing PMI for some impetus later this Monday. Apart from this, other key US macro releases, including the Nonfarm Payrolls report on Friday, should influence the near-term USD trajectory.
Gold price technical setup warrants caution before placing fresh bullish bets
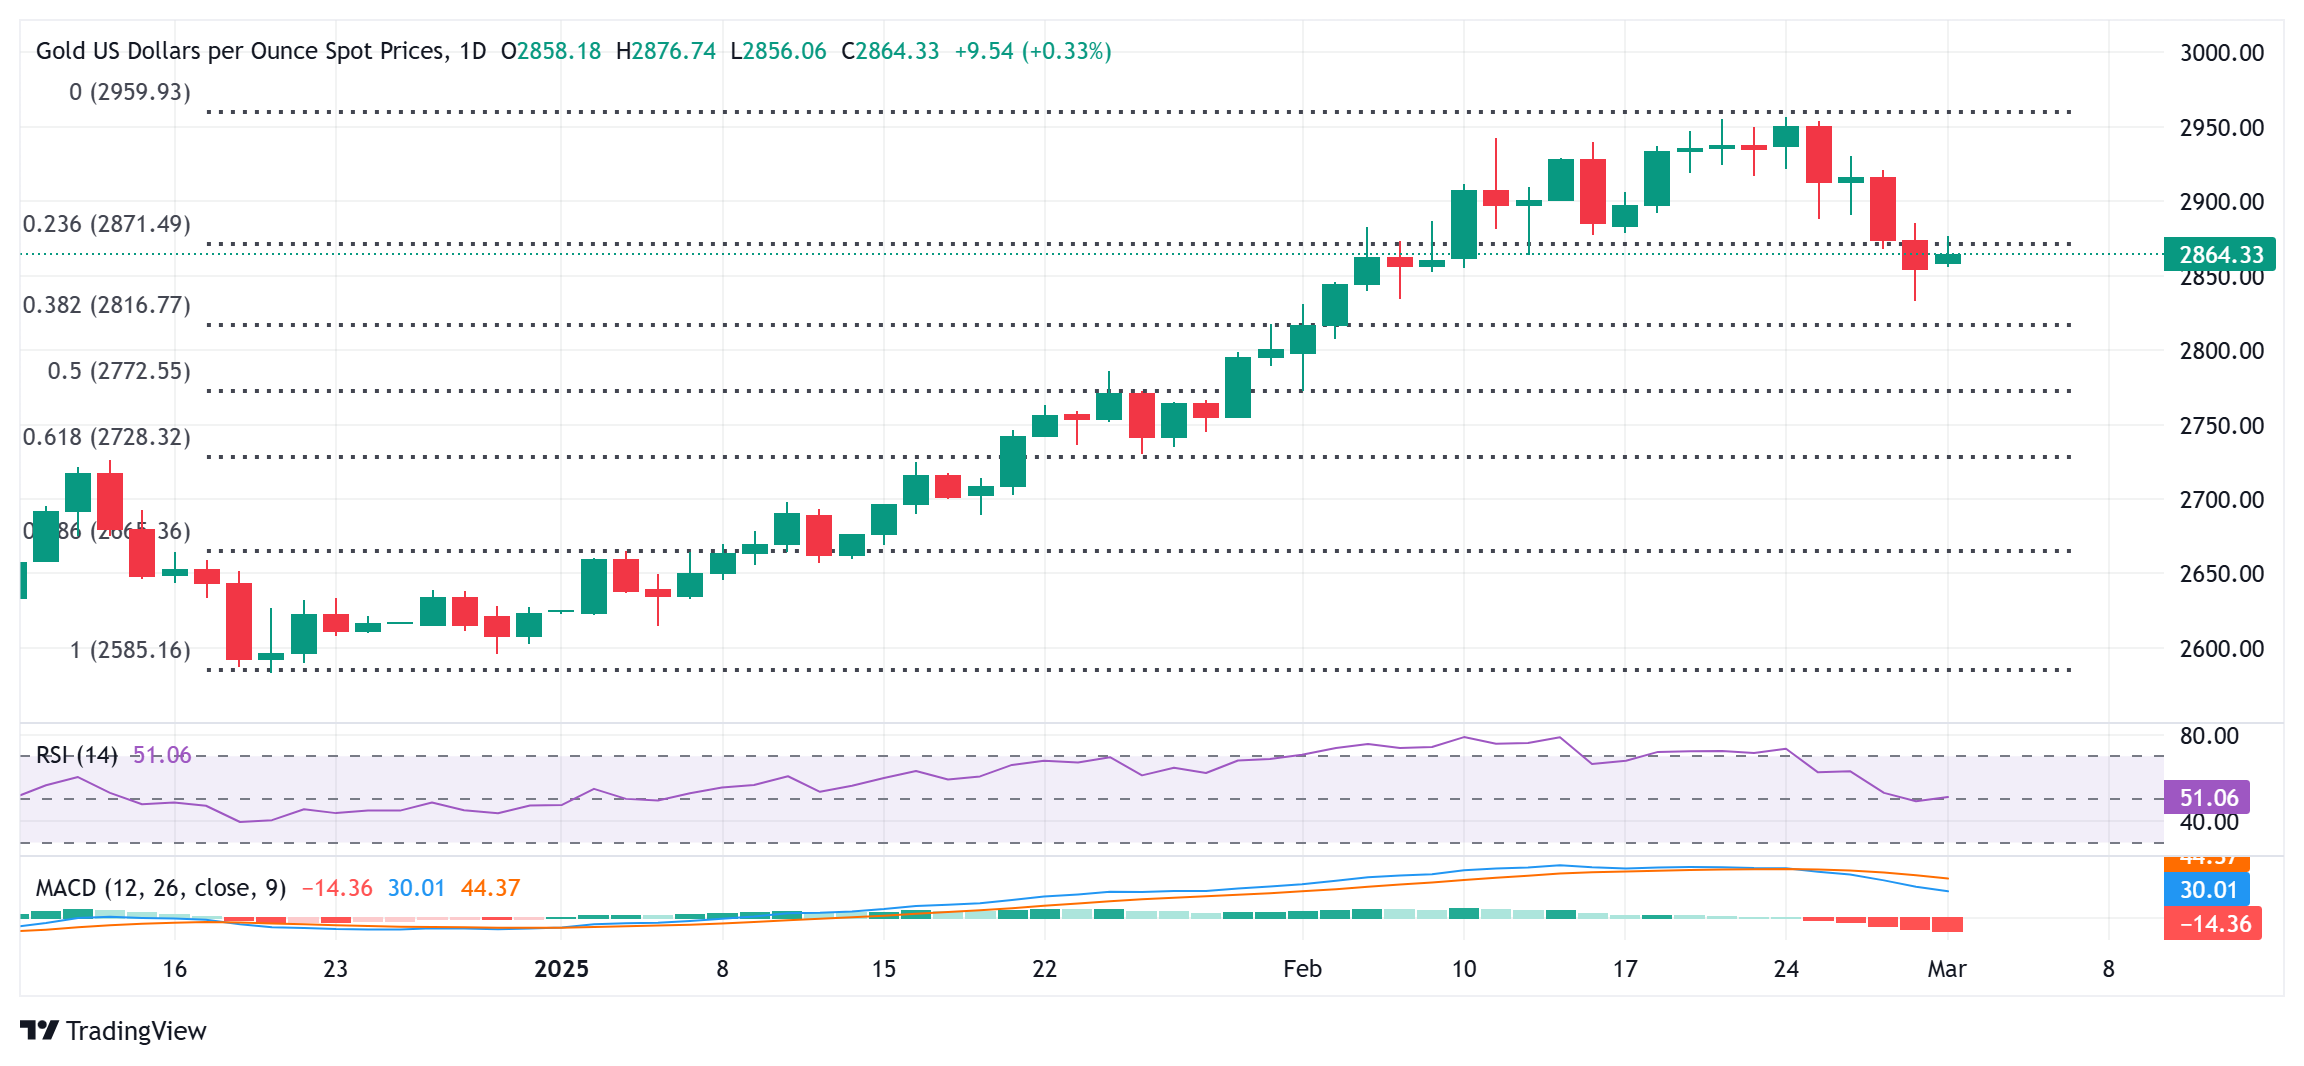
From a technical perspective, last week's breakdown below the 23.6% Fibonacci retracement level of the December-February rally was seen as a key trigger for sellers. Moreover, oscillators on the daily chart have just started gaining negative traction, and back prospects for an extension of the corrective pullback from the all-time peak.
Hence, any subsequent move up might still be seen as a selling opportunity and remain capped near the $2,885 region. This is closely followed by the $2,900 mark, above which the Gold price could climb to the $2,934 intermediate hurdle en route to the record high, around the $2,956 region.
On the flip side, Friday's swing low, around the $2,833-2,832 zone, now seems to protect the immediate downside, below which the Gold price could fall to 38.2% Fibo. level, around the $2,815-2,810 region. Some follow-through selling below the $2,800 mark would suggest that the commodity has topped out and could pave the way for deeper losses.
Gold FAQs
Gold has played a key role in human’s history as it has been widely used as a store of value and medium of exchange. Currently, apart from its shine and usage for jewelry, the precious metal is widely seen as a safe-haven asset, meaning that it is considered a good investment during turbulent times. Gold is also widely seen as a hedge against inflation and against depreciating currencies as it doesn’t rely on any specific issuer or government.
Central banks are the biggest Gold holders. In their aim to support their currencies in turbulent times, central banks tend to diversify their reserves and buy Gold to improve the perceived strength of the economy and the currency. High Gold reserves can be a source of trust for a country’s solvency. Central banks added 1,136 tonnes of Gold worth around $70 billion to their reserves in 2022, according to data from the World Gold Council. This is the highest yearly purchase since records began. Central banks from emerging economies such as China, India and Turkey are quickly increasing their Gold reserves.
Gold has an inverse correlation with the US Dollar and US Treasuries, which are both major reserve and safe-haven assets. When the Dollar depreciates, Gold tends to rise, enabling investors and central banks to diversify their assets in turbulent times. Gold is also inversely correlated with risk assets. A rally in the stock market tends to weaken Gold price, while sell-offs in riskier markets tend to favor the precious metal.
The price can move due to a wide range of factors. Geopolitical instability or fears of a deep recession can quickly make Gold price escalate due to its safe-haven status. As a yield-less asset, Gold tends to rise with lower interest rates, while higher cost of money usually weighs down on the yellow metal. Still, most moves depend on how the US Dollar (USD) behaves as the asset is priced in dollars (XAU/USD). A strong Dollar tends to keep the price of Gold controlled, whereas a weaker Dollar is likely to push Gold prices up.
-
04:36
India Gold price today: Gold rises, according to FXStreet data
Gold prices rose in India on Monday, according to data compiled by FXStreet.
The price for Gold stood at 8,045.15 Indian Rupees (INR) per gram, up compared with the INR 8,014.58 it cost on Friday.
The price for Gold increased to INR 93,838.03 per tola from INR 93,480.45 per tola on friday.
Unit measure Gold Price in INR 1 Gram 8,045.15 10 Grams 80,452.06 Tola 93,838.03 Troy Ounce 250,232.30 FXStreet calculates Gold prices in India by adapting international prices (USD/INR) to the local currency and measurement units. Prices are updated daily based on the market rates taken at the time of publication. Prices are just for reference and local rates could diverge slightly.
Gold FAQs
Gold has played a key role in human’s history as it has been widely used as a store of value and medium of exchange. Currently, apart from its shine and usage for jewelry, the precious metal is widely seen as a safe-haven asset, meaning that it is considered a good investment during turbulent times. Gold is also widely seen as a hedge against inflation and against depreciating currencies as it doesn’t rely on any specific issuer or government.
Central banks are the biggest Gold holders. In their aim to support their currencies in turbulent times, central banks tend to diversify their reserves and buy Gold to improve the perceived strength of the economy and the currency. High Gold reserves can be a source of trust for a country’s solvency. Central banks added 1,136 tonnes of Gold worth around $70 billion to their reserves in 2022, according to data from the World Gold Council. This is the highest yearly purchase since records began. Central banks from emerging economies such as China, India and Turkey are quickly increasing their Gold reserves.
Gold has an inverse correlation with the US Dollar and US Treasuries, which are both major reserve and safe-haven assets. When the Dollar depreciates, Gold tends to rise, enabling investors and central banks to diversify their assets in turbulent times. Gold is also inversely correlated with risk assets. A rally in the stock market tends to weaken Gold price, while sell-offs in riskier markets tend to favor the precious metal.
The price can move due to a wide range of factors. Geopolitical instability or fears of a deep recession can quickly make Gold price escalate due to its safe-haven status. As a yield-less asset, Gold tends to rise with lower interest rates, while higher cost of money usually weighs down on the yellow metal. Still, most moves depend on how the US Dollar (USD) behaves as the asset is priced in dollars (XAU/USD). A strong Dollar tends to keep the price of Gold controlled, whereas a weaker Dollar is likely to push Gold prices up.
(An automation tool was used in creating this post.)
-
04:17
Indonesia Core Inflation (YoY) registered at 2.48% above expectations (2.45%) in February
-
04:05
China evaluating countermeasures in response to Trump's March 4 tariffs – Global Times
Global Times reported on Monday, citing sources familiar with the matter, that China is evaluating countermeasures in response to the additional 10% tariffs the United States (US) will impose on March 4.
Key takeaways
The measures will likely include a combination of tariffs and non-tariff restrictions, with US agricultural and food products expected to be among the primary targets.
Non-tariff measures could involve stricter regulatory scrutiny, customs delays, or other restrictions on US exports to China.
Market reaction
At the time of writing, AUD/USD is off the highs, trading at around 0.6220, up 0.09% on the day.
US-China Trade War FAQs
Generally speaking, a trade war is an economic conflict between two or more countries due to extreme protectionism on one end. It implies the creation of trade barriers, such as tariffs, which result in counter-barriers, escalating import costs, and hence the cost of living.
An economic conflict between the United States (US) and China began early in 2018, when President Donald Trump set trade barriers on China, claiming unfair commercial practices and intellectual property theft from the Asian giant. China took retaliatory action, imposing tariffs on multiple US goods, such as automobiles and soybeans. Tensions escalated until the two countries signed the US-China Phase One trade deal in January 2020. The agreement required structural reforms and other changes to China’s economic and trade regime and pretended to restore stability and trust between the two nations. However, the Coronavirus pandemic took the focus out of the conflict. Yet, it is worth mentioning that President Joe Biden, who took office after Trump, kept tariffs in place and even added some additional levies.
The return of Donald Trump to the White House as the 47th US President has sparked a fresh wave of tensions between the two countries. During the 2024 election campaign, Trump pledged to impose 60% tariffs on China once he returned to office, which he did on January 20, 2025. With Trump back, the US-China trade war is meant to resume where it was left, with tit-for-tat policies affecting the global economic landscape amid disruptions in global supply chains, resulting in a reduction in spending, particularly investment, and directly feeding into the Consumer Price Index inflation.
-
04:05
NZD/USD hovers around 0.5600 after trimming recent gains
- NZD/USD rose as recent PCE inflation data eased concerns over unexpected US inflation spikes.
- The NZD receives support from stronger China's Caixin Manufacturing PMI, which rose to 50.8 in February from 50.1 prior.
- President Trump’s additional 10% tariff on Chinese imports is set to take effect on Tuesday.
NZD/USD halted its six-day losing streak, trading around 0.5600 during the Asian hours on Monday. The pair gains value as the US Dollar (USD) weakens following the release of January’s Personal Consumption Expenditures (PCE) inflation data on Friday. The report met expectations, easing concerns about unexpected inflation spikes in the US.
The US Dollar Index (DXY), which measures the USD against six major currencies, loses ground after three consecutive sessions of gains, hovering around 107.30 at the time of writing. However, downside pressure on the Greenback may be limited as US Treasury yields rise, with the 2-year and 10-year Treasury yields currently at 4.01% and 4.23%, respectively.
Meanwhile, the New Zealand Dollar (NZD) gains support following recent economic data from China, a key trading partner. Data released Monday showed China's Caixin Manufacturing Purchasing Managers' Index (PMI) rose to 50.8 in February from 50.1 in January, surpassing market expectations of 50.3.
On Saturday, official data revealed that the NBS Manufacturing PMI improved to 50.2 in February from 49.1, beating the forecast of 49.9. The NBS Non-Manufacturing PMI also climbed to 50.4 from 50.2, exceeding the expected 50.3.
However, the NZD's upside may be capped by rising global trade tensions. Over the weekend, US President Donald Trump announced an additional 10% tariff on Chinese imports starting Tuesday, adding to last month’s 10% tariff. On Thursday, Trump stated on Truth Social that 25% tariffs on Canadian and Mexican goods will take effect on March 4.
New Zealand Dollar FAQs
The New Zealand Dollar (NZD), also known as the Kiwi, is a well-known traded currency among investors. Its value is broadly determined by the health of the New Zealand economy and the country’s central bank policy. Still, there are some unique particularities that also can make NZD move. The performance of the Chinese economy tends to move the Kiwi because China is New Zealand’s biggest trading partner. Bad news for the Chinese economy likely means less New Zealand exports to the country, hitting the economy and thus its currency. Another factor moving NZD is dairy prices as the dairy industry is New Zealand’s main export. High dairy prices boost export income, contributing positively to the economy and thus to the NZD.
The Reserve Bank of New Zealand (RBNZ) aims to achieve and maintain an inflation rate between 1% and 3% over the medium term, with a focus to keep it near the 2% mid-point. To this end, the bank sets an appropriate level of interest rates. When inflation is too high, the RBNZ will increase interest rates to cool the economy, but the move will also make bond yields higher, increasing investors’ appeal to invest in the country and thus boosting NZD. On the contrary, lower interest rates tend to weaken NZD. The so-called rate differential, or how rates in New Zealand are or are expected to be compared to the ones set by the US Federal Reserve, can also play a key role in moving the NZD/USD pair.
Macroeconomic data releases in New Zealand are key to assess the state of the economy and can impact the New Zealand Dollar’s (NZD) valuation. A strong economy, based on high economic growth, low unemployment and high confidence is good for NZD. High economic growth attracts foreign investment and may encourage the Reserve Bank of New Zealand to increase interest rates, if this economic strength comes together with elevated inflation. Conversely, if economic data is weak, NZD is likely to depreciate.
The New Zealand Dollar (NZD) tends to strengthen during risk-on periods, or when investors perceive that broader market risks are low and are optimistic about growth. This tends to lead to a more favorable outlook for commodities and so-called ‘commodity currencies’ such as the Kiwi. Conversely, NZD tends to weaken at times of market turbulence or economic uncertainty as investors tend to sell higher-risk assets and flee to the more-stable safe havens.
-
04:05
Indonesia Inflation (MoM) came in at -0.48%, below expectations (0.02%) in February
-
03:03
WTI holds gains above $70.00 due to rising concerns over Russia-Ukraine peace deal
- WTI gains ground as supply concerns grow following a heated argument between Trump and Zelenskiy.
- The deal of US-Ukraine's rare earth minerals was abandoned after a heated exchange between the two leaders.
- Turkey aims for the Iraq-Turkey oil pipeline to operate at full capacity once flows resume through Ceyhan.
West Texas Intermediate (WTI) Oil price recovered its recent losses registered in the previous session, trading around $70.10 per barrel during the Asian hours on Monday. Crude Oil prices rise as tensions escalated between US President Donald Trump and Ukrainian leader Volodymyr Zelenskyy during peace deal negotiations, which added concerns about the Russia-Ukraine conflict.
Ukrainian leader Zelenskyy was expected to sign an agreement granting the US greater access to Ukraine's rare earth minerals and participate in a joint press conference, but the plan was abandoned after a heated exchange between the leaders in front of the media. Following the confrontation, in which Trump openly expressed his disdain, top advisers asked Zelenskyy to leave the White House.
However, the upside of Oil prices could be restrained amid rising fears of weaker global demand following escalating US-China trade tensions. Over the weekend, US President Donald Trump announced an additional 10% tariff on Chinese imports starting Tuesday, adding to the 10% tariff imposed last month. On Thursday, Trump stated on Truth Social that 25% tariffs on Canadian and Mexican goods will take effect on March 4.
According to a Reuters report, Turkish Energy Minister Alparslan Bayraktar said, according to the state-owned Anadolu news agency on Sunday, that Turkey wants the Iraq-Turkey Oil pipeline to run at full capacity once operations resume through Ceyhan.
However, on Friday, eight international Oil companies operating in Iraq's Kurdistan region stated they would not restart Oil exports through Ceyhan, despite Baghdad's announcement that the resumption was imminent.
WTI Oil FAQs
WTI Oil is a type of Crude Oil sold on international markets. The WTI stands for West Texas Intermediate, one of three major types including Brent and Dubai Crude. WTI is also referred to as “light” and “sweet” because of its relatively low gravity and sulfur content respectively. It is considered a high quality Oil that is easily refined. It is sourced in the United States and distributed via the Cushing hub, which is considered “The Pipeline Crossroads of the World”. It is a benchmark for the Oil market and WTI price is frequently quoted in the media.
Like all assets, supply and demand are the key drivers of WTI Oil price. As such, global growth can be a driver of increased demand and vice versa for weak global growth. Political instability, wars, and sanctions can disrupt supply and impact prices. The decisions of OPEC, a group of major Oil-producing countries, is another key driver of price. The value of the US Dollar influences the price of WTI Crude Oil, since Oil is predominantly traded in US Dollars, thus a weaker US Dollar can make Oil more affordable and vice versa.
The weekly Oil inventory reports published by the American Petroleum Institute (API) and the Energy Information Agency (EIA) impact the price of WTI Oil. Changes in inventories reflect fluctuating supply and demand. If the data shows a drop in inventories it can indicate increased demand, pushing up Oil price. Higher inventories can reflect increased supply, pushing down prices. API’s report is published every Tuesday and EIA’s the day after. Their results are usually similar, falling within 1% of each other 75% of the time. The EIA data is considered more reliable, since it is a government agency.
OPEC (Organization of the Petroleum Exporting Countries) is a group of 12 Oil-producing nations who collectively decide production quotas for member countries at twice-yearly meetings. Their decisions often impact WTI Oil prices. When OPEC decides to lower quotas, it can tighten supply, pushing up Oil prices. When OPEC increases production, it has the opposite effect. OPEC+ refers to an expanded group that includes ten extra non-OPEC members, the most notable of which is Russia.
-
03:01
Japanese Yen reverses intraday dip against USD amid divergent BoJ-Fed expectations
- The Japanese Yen regains positive traction after touching over a one-week low against USD.
- Bets that the BoJ will raise interest rates further continue to act as a tailwind for the JPY.
- Expectations for further policy easing by the Fed undermine the USD and weigh on USD/JPY.
The Japanese Yen (JPY) touches a one-week low, around the 151.00 mark against its American counterpart during the Asian session on Monday, though the downside remains limited amid hawkish Bank of Japan (BoJ) expectations. In fact, investors have been pricing in the possibility of more interest rate hikes by the BoJ, which pushed the yield on the benchmark 10-year Japanese government bond (JGB) to its highest level since November 2009. Apart from this, the emergence of some US Dollar (USD) selling acts as a headwind for the USD/JPY pair.
Meanwhile, BoJ Governor Kazuo Ueda warned last week that the uncertainty about US President Donald Trump's tariff plans and their impact on the global economic outlook require vigilance in setting monetary policy. This, in turn, is holding back the JPY bulls from placing fresh bets and lending some support to the USD/JPY pair. Traders also seem reluctant and opt to wait for this week's important US macro releases scheduled at the beginning of a new month, starting with the ISM Manufacturing PMI later during the North American session this Monday.
Japanese Yen draws support from hawkish BoJ expectations and modest USD weakness
- The recent data from Japan showed solid economic growth and sticky inflation, which reaffirmed bets that the Bank of Japan will hike rates further and continue to lend support to the Japanese Yen.
- Japanese media reported that the BoJ could face pressure to hike interest rates from the US if the White House concludes that the JPY weakness is linked to the central bank's monetary policy.
- The au Jibun Bank Japan Manufacturing Purchasing Managers’ Index (PMI) was finalized at 49.0 for February, slightly higher than the 48.9 flash reading and marking the softest contraction in three months.
- US President Donald Trump confirmed his plans to impose tariffs on Canada and Mexico starting Tuesday and announced plans to double the 10% universal tariff on imports from China.
- The US Dollar struggles to capitalize on Friday's strong move up to over a one-week high touched in reaction to the crucial US inflation data and further exerts pressure on the USD/JPY pair.
- A report published by the US Bureau of Economic Analysis showed that the Personal Consumption Expenditures (PCE) Price Index edged lower to 2.5% in January from 2.6% previous.
- Adding to this, the core PCE Price Index, which excludes volatile food and energy prices, increased 2.6% on a yearly basis during the reported month, down from 2.9% in December.
- Investors have been pricing in the possibility that the Federal Reserve would resume cutting short-term borrowing costs in June and see another interest rate cut in September.
- Traders now look forward to the release of the US ISM Manufacturing PMI for some impetus later this Monday, though the focus remains on the US Nonfarm Payrolls on Friday.
USD/JPY faces rejection near 151.00 support-turned-resistance; seems vulnerable
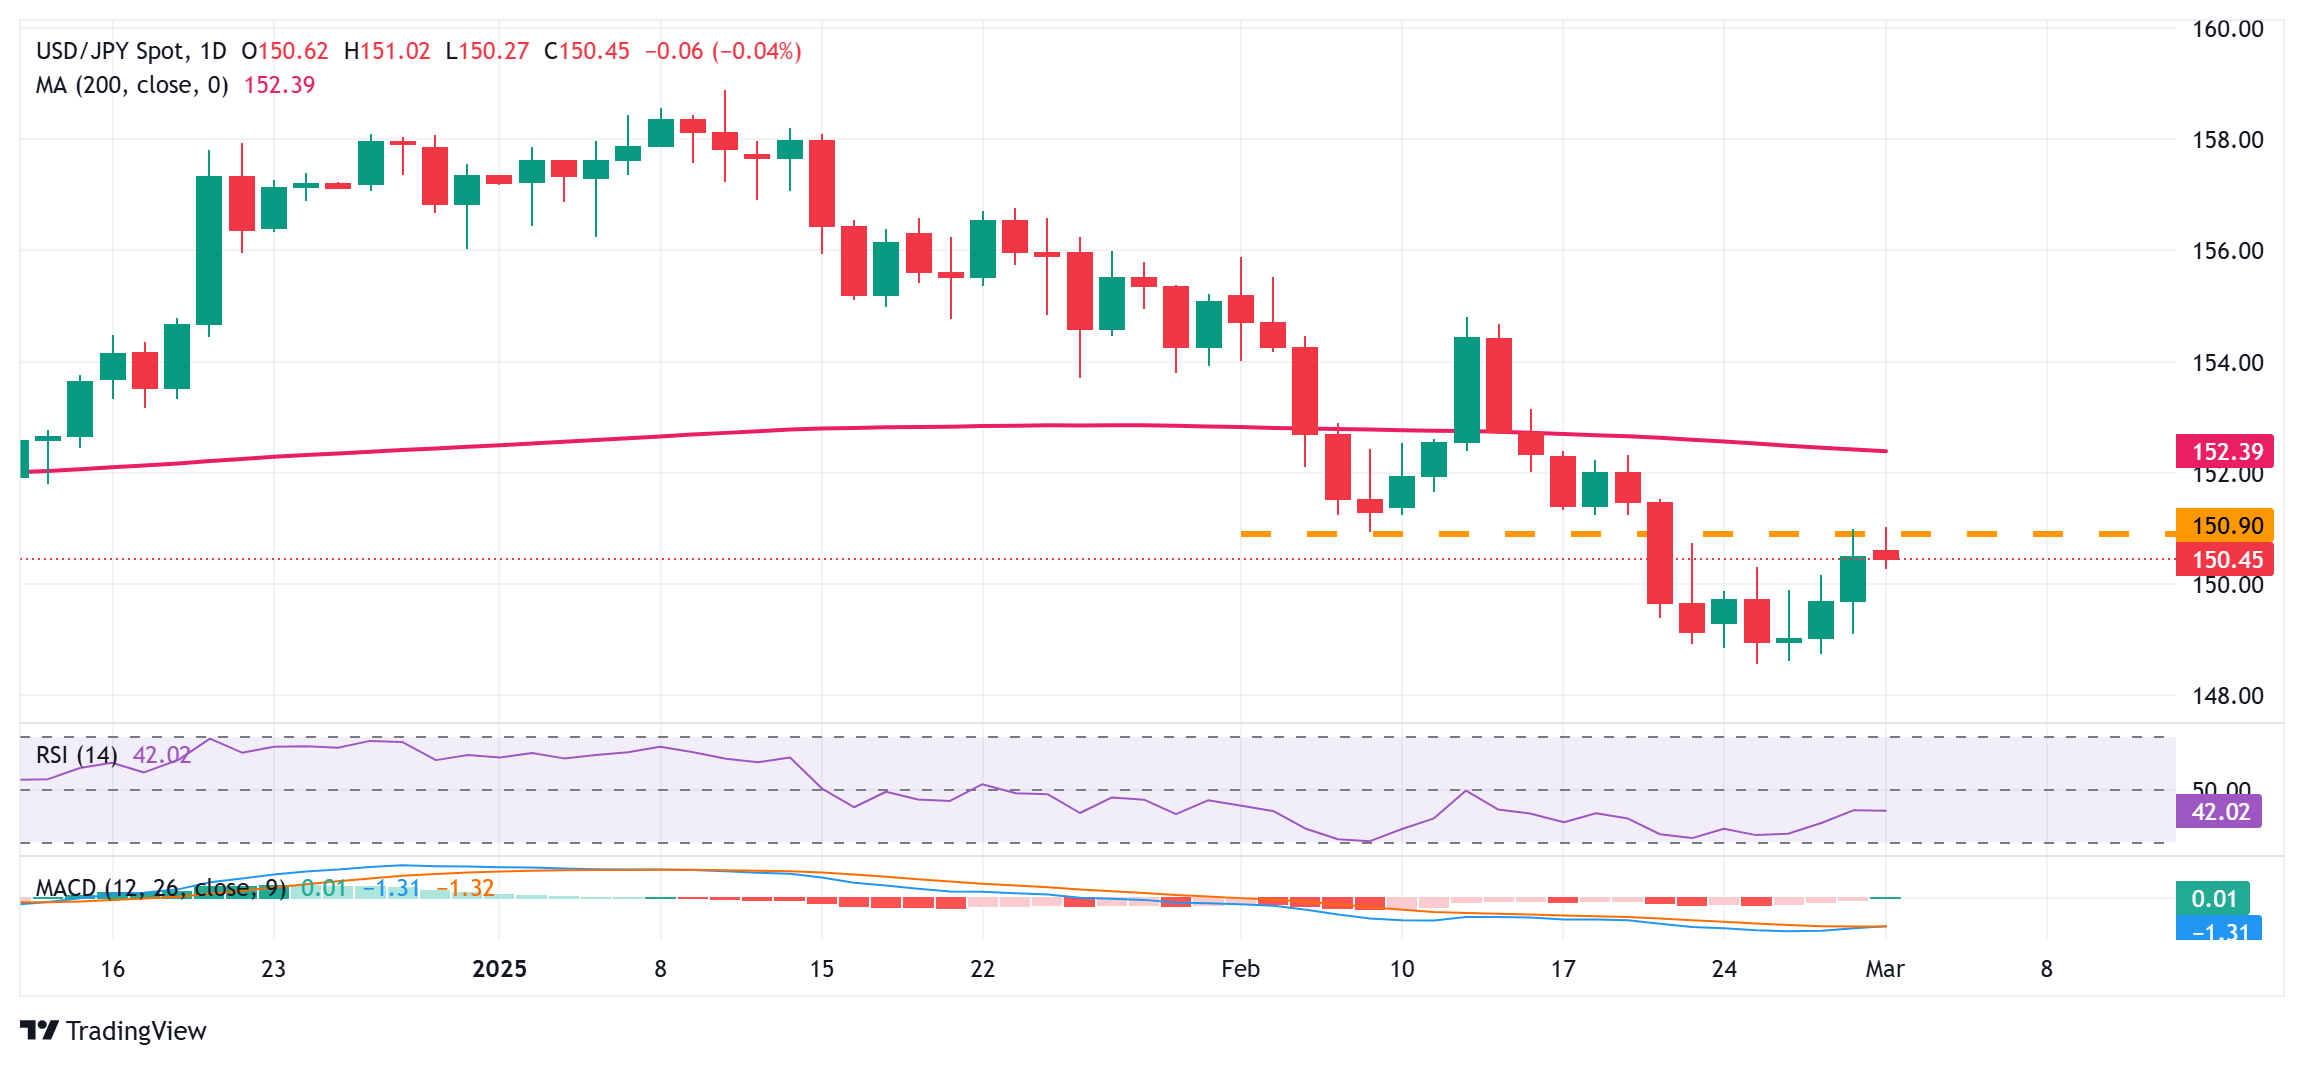
From a technical perspective, the USD/JPY pair stalls last week's recovery move from its lowest level since October 2024 near the 151.00 horizontal support breakpoint, now turned hurdle. Furthermore, oscillators on the daily chart – though they have been recovering from lower levels – are still holding in negative territory. This, in turn, suggests that the path of least resistance for spot prices remains to the downside. Hence, a subsequent fall, back toward the 150.00 psychological mark, looks like a distinct possibility. Some follow-through selling below the 149.80-149.75 region will be seen as a fresh trigger for bearish traders and drag the pair back toward the 149.00 mark en route to the 148.60-148.55 area, or the multi-month low.
However, a sustained strength beyond the 151.00 mark could trigger a short-covering rally and lift the USD/JPY pair beyond the 151.70-151.75 intermediate resistance, towards the 152.00 round figure. The momentum could extend further towards the very important 200-day Simple Moving Average (SMA), currently pegged near the 152.40 region. The latter should act as a key pivotal point, which if cleared decisively will suggest that spot prices have bottomed out and pave the way for a further near-term appreciating move.
Japanese Yen FAQs
The Japanese Yen (JPY) is one of the world’s most traded currencies. Its value is broadly determined by the performance of the Japanese economy, but more specifically by the Bank of Japan’s policy, the differential between Japanese and US bond yields, or risk sentiment among traders, among other factors.
One of the Bank of Japan’s mandates is currency control, so its moves are key for the Yen. The BoJ has directly intervened in currency markets sometimes, generally to lower the value of the Yen, although it refrains from doing it often due to political concerns of its main trading partners. The BoJ ultra-loose monetary policy between 2013 and 2024 caused the Yen to depreciate against its main currency peers due to an increasing policy divergence between the Bank of Japan and other main central banks. More recently, the gradually unwinding of this ultra-loose policy has given some support to the Yen.
Over the last decade, the BoJ’s stance of sticking to ultra-loose monetary policy has led to a widening policy divergence with other central banks, particularly with the US Federal Reserve. This supported a widening of the differential between the 10-year US and Japanese bonds, which favored the US Dollar against the Japanese Yen. The BoJ decision in 2024 to gradually abandon the ultra-loose policy, coupled with interest-rate cuts in other major central banks, is narrowing this differential.
The Japanese Yen is often seen as a safe-haven investment. This means that in times of market stress, investors are more likely to put their money in the Japanese currency due to its supposed reliability and stability. Turbulent times are likely to strengthen the Yen’s value against other currencies seen as more risky to invest in.
-
02:50
USD/INR weakens ahead of Indian, US PMI releases
- The Indian Rupee gains traction in Monday’s Asian session.
- Foreign exchange intervention from the RBI might help limit the INR’s losses.
- India’s HSBC Manufacturing PMI and US ISM Manufacturing PMI will take center stage later on Monday.
The Indian Rupee (INR) gathers strength on Monday. The potential intervention from the Reserve Bank of India (RBI) could provide some support to the local currency. On the other hand, the latest tariff rounds from US President Donald Trump on Canada, Mexico, and potentially China could boost the US Dollar (USD) and exert some selling pressure on the INR. Additionally, a recovery in crude oil prices could drag the Indian Rupee lower as India is the world's third-largest oil consumer.
Looking ahead, traders will keep an eye on India’s HSBC Manufacturing Purchasing Managers Index (PMI) for February, which will be published later on Monday. On the US docket, the ISM Manufacturing PMI will be released.Indian Rupee rebounds despite Trump’s tariff threats
- "Markets continue to live with the uncertainty and whiplash of the multitude of tariff proposals in the pipeline," said MUFG Bank.
- India’s real Gross Domestic Product (GDP) grew 6.2% YoY in the fourth quarter (Q4) of 2024, compared to a 5.6% growth (revised from 5.4%) recorded in the previous quarter, according to data released by the National Statistical Office (NSO) on Friday. This figure came in weaker than the 6.3% expected.
- The US Personal Consumption Expenditures (PCE) Price Index increased 0.3% in January, in line with expectations, the US Bureau of Economic Analysis showed on Friday.
- The US PCE Price Index climbed 2.5% YoY in January, compared to 2.6% in December. The core PCE Price Index, which excludes volatile food and energy prices, climbed 2.6% YoY in January, down from 2.9% in December. Both figures came in line with the market consensus.
USD/INR sticks to positive bias in the longer term
The Indian Rupee trades in negative territory. The bullish outlook of the USD/INR pair prevails, with the price being well-supported above the key 100-day Exponential Moving Average (EMA) on the daily timeframe. Further upside looks favorable as the 14-day Relative Strength Index (RSI) is located above the midline near 63.75.
The first upside barrier for USD/INR emerges at 87.53, the high of February 28. A bullish candlestick breaking above this level could lift the pair to an all-time high near 88.00 then 88.50.
On the flip side, the initial support level for the pair is seen in the 87.05-87.00 zone, representing the low of February 27 and the round mark. A breach of the mentioned level could drag USD/INR to the next bearish targets at 86.48, the low of February 21, followed by 86.14, the low of January 27.Indian Rupee FAQs
The Indian Rupee (INR) is one of the most sensitive currencies to external factors. The price of Crude Oil (the country is highly dependent on imported Oil), the value of the US Dollar – most trade is conducted in USD – and the level of foreign investment, are all influential. Direct intervention by the Reserve Bank of India (RBI) in FX markets to keep the exchange rate stable, as well as the level of interest rates set by the RBI, are further major influencing factors on the Rupee.
The Reserve Bank of India (RBI) actively intervenes in forex markets to maintain a stable exchange rate, to help facilitate trade. In addition, the RBI tries to maintain the inflation rate at its 4% target by adjusting interest rates. Higher interest rates usually strengthen the Rupee. This is due to the role of the ‘carry trade’ in which investors borrow in countries with lower interest rates so as to place their money in countries’ offering relatively higher interest rates and profit from the difference.
Macroeconomic factors that influence the value of the Rupee include inflation, interest rates, the economic growth rate (GDP), the balance of trade, and inflows from foreign investment. A higher growth rate can lead to more overseas investment, pushing up demand for the Rupee. A less negative balance of trade will eventually lead to a stronger Rupee. Higher interest rates, especially real rates (interest rates less inflation) are also positive for the Rupee. A risk-on environment can lead to greater inflows of Foreign Direct and Indirect Investment (FDI and FII), which also benefit the Rupee.
Higher inflation, particularly, if it is comparatively higher than India’s peers, is generally negative for the currency as it reflects devaluation through oversupply. Inflation also increases the cost of exports, leading to more Rupees being sold to purchase foreign imports, which is Rupee-negative. At the same time, higher inflation usually leads to the Reserve Bank of India (RBI) raising interest rates and this can be positive for the Rupee, due to increased demand from international investors. The opposite effect is true of lower inflation.
-
02:18
French President Macron: France, UK propose one-month Ukraine truce – Le Figaro
In an interview with France's Le Figaro newspaper late Sunday, French President Emmanuel Macron said that France and Britain are proposing a one-month truce in Ukraine to stop all air and sea conflict and attacks on energy infrastructure.
This came after the crisis talks held in London, in which European leaders closed ranks in support of Kyiv, pledging to spend more on security and assemble a coalition to defend any truce in Ukraine.
On Friday, US President Donald Trump blasted Ukraine’s Volodymyr Zelensky at a live White House news conference. Trump’s row with Zelensky raised fresh questions over the US commitment to Ukraine and The North Atlantic Treaty Organization (NATO).
Market reaction
The Euro remains on the front foot following these headlines, driving EUR/USD 0.44% higher on the day to near 1.0420, as of writing.
-
02:13
Australian Dollar holds gains following China Manufacturing PMI data
- The Australian Dollar gains ground following the TD-MI Inflation Gauge, and China Manufacturing PMI data released on Monday.
- China's Caixin Manufacturing PMI increased to 50.8 in February from January’s 50.1.
- The US Dollar struggles as US PCE inflation data aligns with expectations, easing concerns over unexpected US inflation spikes.
The Australian Dollar (AUD) halted its six-day losing streak on Monday, buoyed by a weaker US Dollar (USD) following the release of January’s Personal Consumption Expenditures (PCE) inflation data on Friday. The report aligned with expectations, easing fears of unexpected inflation spikes in the US.
Australia’s TD-MI Inflation Gauge fell by 0.2% month-over-month in February, reversing a 0.1% rise in January. This marked the first decline since last August and followed the Reserve Bank of Australia's (RBA) decision to cut its cash rate by 25 basis points to 4.1% during its first monetary policy meeting of the year, reflecting a continued slowdown in underlying inflation. However, on an annual basis, the gauge rose by 2.2%, slightly below the previous 2.3% increase.
The AUD also receives upward support from upbeat Chinese economic data. China's Caixin Manufacturing Purchasing Managers' Index (PMI) rose to 50.8 in February from January’s 50.1, exceeding market expectations of 50.3. Given China’s role as a key trading partner for Australia, the stronger PMI reading provided a boost to the Australian Dollar.
However, the AUD’s upside could be limited by escalating US-China trade tensions. Over the weekend, US President Donald Trump announced an additional 10% tariff on Chinese imports starting Tuesday, adding to the 10% tariff imposed last month. On Thursday, Trump stated on Truth Social that 25% tariffs on Canadian and Mexican goods will take effect on March 4.
Australian Dollar appreciates as concerns over unexpected US inflation ease
- The US Dollar Index (DXY), which tracks the USD against six major currencies, weakens after three consecutive sessions of gains, hovering around 107.30 at the time of writing. The downside of the Greenback could be limited as US Treasury yields improve, with 2-year and 10-year Treasury yields currently standing at 4.02% and 4.24%, respectively.
- The US PCE inflation report met expectations, with the monthly headline PCE holding steady at 0.3%. Core PCE rose slightly to 0.3% from December’s 0.2%, while the annual headline PCE stood at 2.6%, slightly exceeding projections but unchanged from December’s figure. Core PCE eased to 2.6%, down from a revised 2.9% in December.
- Tensions escalated between US President Donald Trump and Ukrainian leader Volodymyr Zelenskyy during peace deal negotiations. Zelenskyy was expected to sign an agreement granting the US greater access to Ukraine's rare earth minerals and participate in a joint press conference, but the plan was abandoned after a heated exchange between the leaders in front of the media. Following the confrontation, in which Trump openly expressed his disdain, top advisers asked Zelenskyy to leave the White House.
- President Trump signed a memorandum on Friday instructing the Committee on Foreign Investment in the United States (CFIUS) to limit Chinese investments in strategic sectors. Reuters cited a White House official saying that the national security memorandum seeks to encourage foreign investment while safeguarding US national security interests from potential threats posed by foreign adversaries like China.
- The S&P Global Australia Manufacturing Purchasing Managers Index (PMI) was revised down to 50.4 in February from an initial estimate of 50.6 but remained above January's 50.2. This marked the second consecutive month of improvement in manufacturing conditions and the strongest growth since February 2023.
- China’s NBS Manufacturing PMI improved to 50.2 in February versus 49.1 prior. This figure came in stronger than the 49.9 expected. Meanwhile, the NBS Non-Manufacturing PMI climbed to 50.4 in February from 50.2 in January, beating the estimation of 50.3.
- According to a Wall Street Journal report on the Australian Dollar’s outlook from the Commonwealth Bank of Australia (CBA), heightened trade war risks driven by Trump have become a major concern. China’s response to these trade threats will be a key factor shaping the future performance of the AUD.
Australian Dollar tests 0.6200 support amid prevailing bearish bias
The AUD/USD pair is trading around 0.6220 on Monday. The daily chart analysis suggests that the pair remains under pressure, trading below the nine- and 14-day Exponential Moving Averages (EMAs), indicating weakening short-term momentum. Additionally, the 14-day Relative Strength Index (RSI) remains below 50, reinforcing the bearish outlook.
On the downside, the AUD/USD pair is currently testing key support at the psychological level of 0.6200. A break below this level could drive the price toward 0.6087, its lowest point since April 2020, recorded on February 3.
The initial resistance is seen at the nine-day EMA of 0.6280, followed by the 14-day EMA at 0.6290. A decisive break above these levels could strengthen short-term momentum, potentially leading the pair to retest the three-month high of 0.6408, reached on February 21.
AUD/USD: Daily Chart
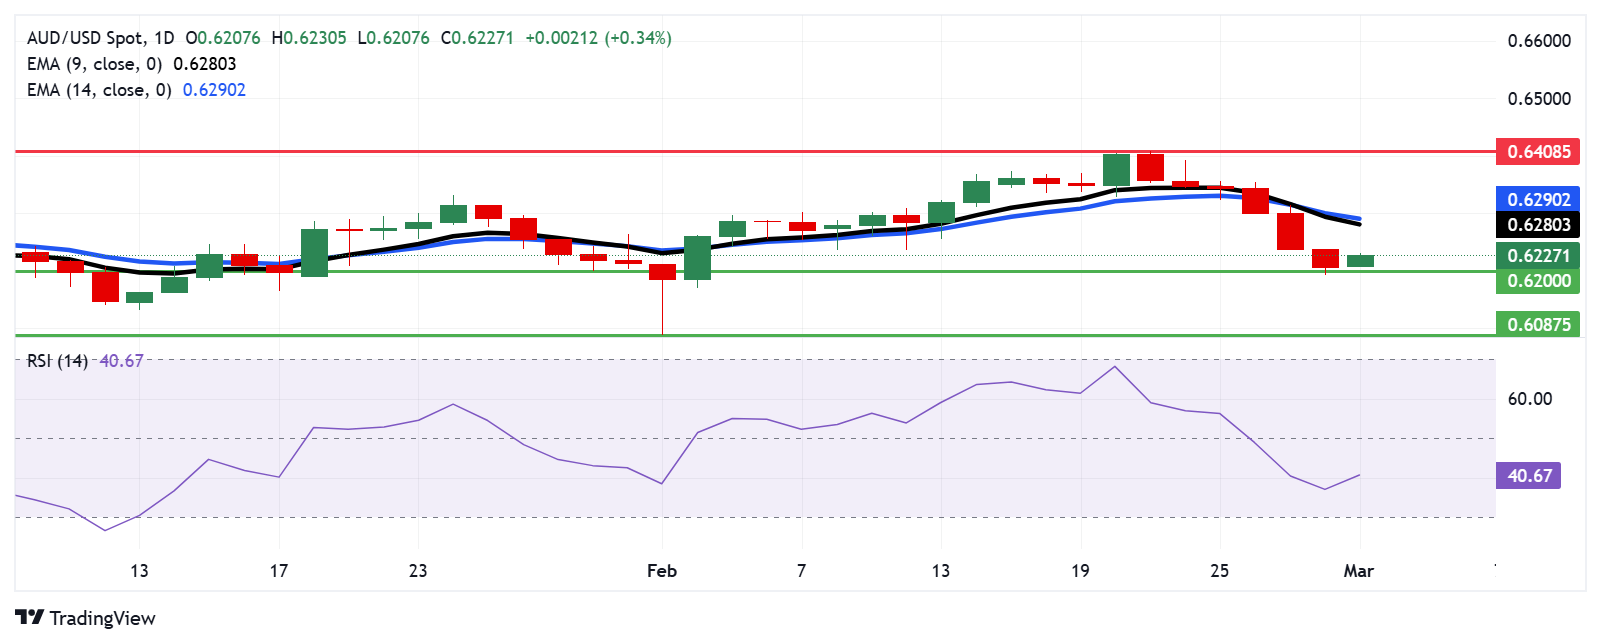
Australian Dollar PRICE Today
The table below shows the percentage change of Australian Dollar (AUD) against listed major currencies today. Australian Dollar was the strongest against the US Dollar.
USD EUR GBP JPY CAD AUD NZD CHF USD -0.44% -0.27% -0.15% -0.10% -0.35% -0.21% -0.12% EUR 0.44% 0.06% 0.06% 0.15% -0.01% 0.04% 0.14% GBP 0.27% -0.06% 0.13% 0.09% -0.07% -0.02% 0.08% JPY 0.15% -0.06% -0.13% 0.26% -0.15% -0.02% 0.03% CAD 0.10% -0.15% -0.09% -0.26% -0.09% -0.11% -0.01% AUD 0.35% 0.01% 0.07% 0.15% 0.09% 0.05% 0.15% NZD 0.21% -0.04% 0.02% 0.02% 0.11% -0.05% 0.10% CHF 0.12% -0.14% -0.08% -0.03% 0.00% -0.15% -0.10% The heat map shows percentage changes of major currencies against each other. The base currency is picked from the left column, while the quote currency is picked from the top row. For example, if you pick the Australian Dollar from the left column and move along the horizontal line to the US Dollar, the percentage change displayed in the box will represent AUD (base)/USD (quote).
Economic Indicator
Caixin Manufacturing PMI
The Caixin Manufacturing Purchasing Managers Index (PMI), released on a monthly basis by Caixin Insight Group and S&P Global, is a leading indicator gauging business activity in China’s manufacturing sector. The data is derived from surveys of senior executives at both private-sector and state-owned companies. Survey responses reflect the change, if any, in the current month compared to the previous month and can anticipate changing trends in official data series such as Gross Domestic Product (GDP), industrial production, employment and inflation.The index varies between 0 and 100, with levels of 50.0 signaling no change over the previous month. A reading above 50 indicates that the manufacturing economy is generally expanding, a bullish sign for the Renminbi (CNY). Meanwhile, a reading below 50 signals that activity among goods producers is generally declining, which is seen as bearish for CNY.
Read more.Last release: Mon Mar 03, 2025 01:45
Frequency: Monthly
Actual: 50.8
Consensus: 50.3
Previous: 50.1
Source: IHS Markit
-
01:45
China's Caixin Manufacturing PMI jumps to 50.8 in February vs. 50.3 expected
China's Caixin Manufacturing Purchasing Managers' Index (PMI) jumped to 50.8 in February from January’s 50.1, the latest data showed on Monday.
The markets expected a 50.3 readout in the reported month.
Key highlights (via Caixin)
Fastest rises in output and new orders for three months.
Noticeably milder drop in employment signalled.
Confidence in output strengthens again.
“Both supply and demand grew, with the gauges for output and total new orders remaining in expansionary territory for the 16th and fifth consecutive months, respectively, both reaching their highest levels in three months,” said Wang Zhe, an economist at Caixin Insight Group.
AUD/USD reaction to China’s PMI data
The upbeat Chinese Manufacturing PMI keeps the the Aussie Dollar afloat, as AUD/USD holds higher ground near 0.6230 at the time of writing, up 0.23% on the day.
Australian Dollar FAQs
One of the most significant factors for the Australian Dollar (AUD) is the level of interest rates set by the Reserve Bank of Australia (RBA). Because Australia is a resource-rich country another key driver is the price of its biggest export, Iron Ore. The health of the Chinese economy, its largest trading partner, is a factor, as well as inflation in Australia, its growth rate and Trade Balance. Market sentiment – whether investors are taking on more risky assets (risk-on) or seeking safe-havens (risk-off) – is also a factor, with risk-on positive for AUD.
The Reserve Bank of Australia (RBA) influences the Australian Dollar (AUD) by setting the level of interest rates that Australian banks can lend to each other. This influences the level of interest rates in the economy as a whole. The main goal of the RBA is to maintain a stable inflation rate of 2-3% by adjusting interest rates up or down. Relatively high interest rates compared to other major central banks support the AUD, and the opposite for relatively low. The RBA can also use quantitative easing and tightening to influence credit conditions, with the former AUD-negative and the latter AUD-positive.
China is Australia’s largest trading partner so the health of the Chinese economy is a major influence on the value of the Australian Dollar (AUD). When the Chinese economy is doing well it purchases more raw materials, goods and services from Australia, lifting demand for the AUD, and pushing up its value. The opposite is the case when the Chinese economy is not growing as fast as expected. Positive or negative surprises in Chinese growth data, therefore, often have a direct impact on the Australian Dollar and its pairs.
Iron Ore is Australia’s largest export, accounting for $118 billion a year according to data from 2021, with China as its primary destination. The price of Iron Ore, therefore, can be a driver of the Australian Dollar. Generally, if the price of Iron Ore rises, AUD also goes up, as aggregate demand for the currency increases. The opposite is the case if the price of Iron Ore falls. Higher Iron Ore prices also tend to result in a greater likelihood of a positive Trade Balance for Australia, which is also positive of the AUD.
The Trade Balance, which is the difference between what a country earns from its exports versus what it pays for its imports, is another factor that can influence the value of the Australian Dollar. If Australia produces highly sought after exports, then its currency will gain in value purely from the surplus demand created from foreign buyers seeking to purchase its exports versus what it spends to purchase imports. Therefore, a positive net Trade Balance strengthens the AUD, with the opposite effect if the Trade Balance is negative.
-
01:45
China Caixin Manufacturing PMI above expectations (50.3) in February: Actual (50.8)
-
01:38
USD/CAD holds below 1.4450 on softer US Dollar, investors await US PMI release
- USD/CAD softens to near 1.4440 in Monday’s early Asian session.
- Canada's Q4 GDP grew by 2.6% on an annualized basis, stronger than expected.
- Trump will set exact levels for Mexico, Canada tariffs coming Tuesday.
The USD/CAD pair weakens to around 1.4440 during the early Asian session on Monday. The stronger-than-expected Canadian economic growth and the recovery in crude oil prices support the Loonie. The US February ISM Manufacturing Purchasing Managers Index (PMI) will take center stage later on Monday.
Data released by Statistics Canada on Friday showed that Canada's Gross Domestic Product (GDP) in the fourth quarter (Q4) expanded by 2.6% on an annualized basis, beating the estimation of 1.9%. "The Canadian economy has certainly faced some headwinds but it exited 2024 in a stronger position than believed," said Adam Button, chief currency analyst at ForexLive.
Meanwhile, a rise in crude oil prices underpins the commodity-linked Canadian Dollar (CAD). It’s worth noting that Canada is the largest oil exporter to the United States (US), and higher crude oil prices tend to have a positive impact on the CAD value.
On the other hand, US President Donald Trump said on Thursday that he intended to move forward with threatened 25% tariffs on imports from Canada and Mexico, which are set to come into effect on Tuesday. Traders will closely monitor the developments surrounding further Trump’s tariff policies. Any signs of trade tensions could lift the Greenback against the CAD in the near term.Canadian Dollar FAQs
The key factors driving the Canadian Dollar (CAD) are the level of interest rates set by the Bank of Canada (BoC), the price of Oil, Canada’s largest export, the health of its economy, inflation and the Trade Balance, which is the difference between the value of Canada’s exports versus its imports. Other factors include market sentiment – whether investors are taking on more risky assets (risk-on) or seeking safe-havens (risk-off) – with risk-on being CAD-positive. As its largest trading partner, the health of the US economy is also a key factor influencing the Canadian Dollar.
The Bank of Canada (BoC) has a significant influence on the Canadian Dollar by setting the level of interest rates that banks can lend to one another. This influences the level of interest rates for everyone. The main goal of the BoC is to maintain inflation at 1-3% by adjusting interest rates up or down. Relatively higher interest rates tend to be positive for the CAD. The Bank of Canada can also use quantitative easing and tightening to influence credit conditions, with the former CAD-negative and the latter CAD-positive.
The price of Oil is a key factor impacting the value of the Canadian Dollar. Petroleum is Canada’s biggest export, so Oil price tends to have an immediate impact on the CAD value. Generally, if Oil price rises CAD also goes up, as aggregate demand for the currency increases. The opposite is the case if the price of Oil falls. Higher Oil prices also tend to result in a greater likelihood of a positive Trade Balance, which is also supportive of the CAD.
While inflation had always traditionally been thought of as a negative factor for a currency since it lowers the value of money, the opposite has actually been the case in modern times with the relaxation of cross-border capital controls. Higher inflation tends to lead central banks to put up interest rates which attracts more capital inflows from global investors seeking a lucrative place to keep their money. This increases demand for the local currency, which in Canada’s case is the Canadian Dollar.
Macroeconomic data releases gauge the health of the economy and can have an impact on the Canadian Dollar. Indicators such as GDP, Manufacturing and Services PMIs, employment, and consumer sentiment surveys can all influence the direction of the CAD. A strong economy is good for the Canadian Dollar. Not only does it attract more foreign investment but it may encourage the Bank of Canada to put up interest rates, leading to a stronger currency. If economic data is weak, however, the CAD is likely to fall.
-
01:15
PBOC sets USD/CNY reference rate at 7.1745 vs. 7.1738 previous
On Monday, the People’s Bank of China (PBOC) set the USD/CNY central rate for the trading session ahead at 7.1745 as compared to Friday's fix of 7.1738 and 7.2857 Reuters estimates.
PBOC FAQs
The primary monetary policy objectives of the People's Bank of China (PBoC) are to safeguard price stability, including exchange rate stability, and promote economic growth. China’s central bank also aims to implement financial reforms, such as opening and developing the financial market.
The PBoC is owned by the state of the People's Republic of China (PRC), so it is not considered an autonomous institution. The Chinese Communist Party (CCP) Committee Secretary, nominated by the Chairman of the State Council, has a key influence on the PBoC’s management and direction, not the governor. However, Mr. Pan Gongsheng currently holds both of these posts.
Unlike the Western economies, the PBoC uses a broader set of monetary policy instruments to achieve its objectives. The primary tools include a seven-day Reverse Repo Rate (RRR), Medium-term Lending Facility (MLF), foreign exchange interventions and Reserve Requirement Ratio (RRR). However, The Loan Prime Rate (LPR) is China’s benchmark interest rate. Changes to the LPR directly influence the rates that need to be paid in the market for loans and mortgages and the interest paid on savings. By changing the LPR, China’s central bank can also influence the exchange rates of the Chinese Renminbi.
Yes, China has 19 private banks – a small fraction of the financial system. The largest private banks are digital lenders WeBank and MYbank, which are backed by tech giants Tencent and Ant Group, per The Straits Times. In 2014, China allowed domestic lenders fully capitalized by private funds to operate in the state-dominated financial sector.
-
01:02
Ireland Purchasing Manager Index Manufacturing climbed from previous 51.3 to 51.9 in February
-
01:00
EUR/USD rises above 1.0400 ahead of Eurozone HICP inflation data
- EUR/USD gains as the latest US PCE inflation data aligns with expectations, easing concerns over unexpected US inflation spikes.
- A slight increase in US Treasury yields could help limit the downside of the US dollar.
- Traders look to the Eurozone HICP inflation data for further direction ahead of Thursday’s ECB policy decision.
EUR/USD pauses its three-day losing streak, trading around 1.0410 during Asian hours on Monday. The pair’s recovery is driven by a weaker US Dollar (USD) following the release of January’s Personal Consumption Expenditures (PCE) inflation data on Friday, which aligned with forecasts and eased concerns about unexpected inflation spikes in the United States (US).
The US PCE inflation report met expectations, with the monthly headline PCE holding steady at 0.3%. Core PCE rose slightly to 0.3% from December’s 0.2%, while the annual headline PCE stood at 2.6%, slightly exceeding projections but unchanged from December’s figure. Core PCE eased to 2.6%, down from a revised 2.9% in December.
The US Dollar Index (DXY), which tracks the USD against six major currencies, weakens after three consecutive sessions of gains, hovering around 107.30 at the time of writing. However, the downside of the Greenback could be limited as US Treasury yields improve, with 2-year and 10-year Treasury yields currently standing at 4.02% and 4.24%, respectively.
Meanwhile, escalating US-China trade tensions could support safe-haven flows into the US Dollar, potentially capping EUR/USD’s gains. Over the weekend, US President Donald Trump announced an additional 10% tariff on Chinese imports starting Tuesday, adding to the initial 10% rate imposed last month. On Thursday, Trump also stated on Truth Social that 25% tariffs on Canadian and Mexican goods will take effect on March 4.
The Euro (EUR) gains strength against its peers following stronger-than-expected February flash Harmonized Index of Consumer Prices (HICP) data from Germany, released on Friday. Despite the hotter inflation report, the European Central Bank (ECB) is expected to continue easing monetary policy in its meeting on Thursday. Investors now await the Eurozone’s HICP inflation data, set to be released later in the day.
Euro FAQs
The Euro is the currency for the 19 European Union countries that belong to the Eurozone. It is the second most heavily traded currency in the world behind the US Dollar. In 2022, it accounted for 31% of all foreign exchange transactions, with an average daily turnover of over $2.2 trillion a day. EUR/USD is the most heavily traded currency pair in the world, accounting for an estimated 30% off all transactions, followed by EUR/JPY (4%), EUR/GBP (3%) and EUR/AUD (2%).
The European Central Bank (ECB) in Frankfurt, Germany, is the reserve bank for the Eurozone. The ECB sets interest rates and manages monetary policy. The ECB’s primary mandate is to maintain price stability, which means either controlling inflation or stimulating growth. Its primary tool is the raising or lowering of interest rates. Relatively high interest rates – or the expectation of higher rates – will usually benefit the Euro and vice versa. The ECB Governing Council makes monetary policy decisions at meetings held eight times a year. Decisions are made by heads of the Eurozone national banks and six permanent members, including the President of the ECB, Christine Lagarde.
Eurozone inflation data, measured by the Harmonized Index of Consumer Prices (HICP), is an important econometric for the Euro. If inflation rises more than expected, especially if above the ECB’s 2% target, it obliges the ECB to raise interest rates to bring it back under control. Relatively high interest rates compared to its counterparts will usually benefit the Euro, as it makes the region more attractive as a place for global investors to park their money.
Data releases gauge the health of the economy and can impact on the Euro. Indicators such as GDP, Manufacturing and Services PMIs, employment, and consumer sentiment surveys can all influence the direction of the single currency. A strong economy is good for the Euro. Not only does it attract more foreign investment but it may encourage the ECB to put up interest rates, which will directly strengthen the Euro. Otherwise, if economic data is weak, the Euro is likely to fall. Economic data for the four largest economies in the euro area (Germany, France, Italy and Spain) are especially significant, as they account for 75% of the Eurozone’s economy.
Another significant data release for the Euro is the Trade Balance. This indicator measures the difference between what a country earns from its exports and what it spends on imports over a given period. If a country produces highly sought after exports then its currency will gain in value purely from the extra demand created from foreign buyers seeking to purchase these goods. Therefore, a positive net Trade Balance strengthens a currency and vice versa for a negative balance.
-
00:58
GBP/USD retakes 1.2600 amid modest USD weakness; upside potential seems limited
- GBP/USD regains positive traction on Monday amid the emergence of some USD selling.
- Expectations for a less aggressive BoE rate cut underpin the GBP and remain supportive.
- Bets for an extended pause on rates by the Fed could limit USD losses and cap the major.
The GBP/USD pair attracts some dip-buyers during the Asian session on Monday and now seems to have stalled its retracement slide from levels beyond the 1.2700 mark, or over a two-month peak touched last week. The intraday move up lifts spot prices back above the 1.2600 round figure in the last hour and is sponsored by a modest US Dollar (USD) weakness.
The growing pessimism over the outlook for the US economy, along with bets for further policy easing by the Federal Reserve (Fed), fails to assist the buck to capitalize on a three-day-old recovery from over a two-month low. In fact, the USD Index (DXY), which tracks the Greenback against a basket of currencies, kicks off the new week on a weaker note and has now reversed a major part of Friday's move up to over a one-week high.
The British Pound (GBP), on the other hand, continues with its relative outperformance amid expectations for a less aggressive policy easing by the Bank of England (BoE). That said, concerns about US President Donald Trump's reciprocal tariffs and their impact on the UK economy might hold back the GBP bulls from placing fresh bets. Furthermore, geopolitical risks could limit deeper USD losses and cap gains for the GBP/USD pair.
Meanwhile, signs that the disinflation process in the US has stalled bolstered the case for the Fed to adopt a wait-and-see approach to future interest rate cuts could also act as a tailwind for the USD. This might further contribute to keeping a lid on the GBP/USD pair and warrants some caution before positioning for the resumption of the recent uptrend from sub-1.2100 levels, or the year-to-date trough touched on January 13.
Traders now look forward to important US macro data scheduled at the beginning of a new month, starting with the release of the ISM Manufacturing PMI, for some meaningful impetus. The focus, however, will be on the closely-watched US monthly employment details on Friday. The popularly known Nonfarm Payrolls (NFP) would drive expectations about the Fed's rate-cut path and drive the USD demand in the near term.
US Dollar PRICE Today
The table below shows the percentage change of US Dollar (USD) against listed major currencies today. US Dollar was the strongest against the Japanese Yen.
USD EUR GBP JPY CAD AUD NZD CHF USD -0.34% -0.22% 0.02% -0.07% -0.22% -0.14% -0.09% EUR 0.34% 0.00% 0.13% 0.09% 0.02% 0.01% 0.08% GBP 0.22% -0.01% 0.23% 0.08% 0.00% 0.00% 0.07% JPY -0.02% -0.13% -0.23% 0.14% -0.19% -0.11% -0.10% CAD 0.07% -0.09% -0.08% -0.14% -0.00% -0.07% -0.01% AUD 0.22% -0.02% -0.01% 0.19% 0.00% -0.01% 0.05% NZD 0.14% -0.01% -0.00% 0.11% 0.07% 0.00% 0.06% CHF 0.09% -0.08% -0.07% 0.10% 0.01% -0.05% -0.06% The heat map shows percentage changes of major currencies against each other. The base currency is picked from the left column, while the quote currency is picked from the top row. For example, if you pick the US Dollar from the left column and move along the horizontal line to the Japanese Yen, the percentage change displayed in the box will represent USD (base)/JPY (quote).
-
00:41
Gold Price Forecast: XAU/USD drifts higher above $2,850 amid the cautious mood
- Gold price edges higher to $2,870 in Monday’s early Asian session.
- The uncertainty and global tensions could boost the safe-haven flows, benefiting the Gold price.
- US PCE inflation for January came in with the expectation.
Gold price (XAU/USD) attracts some buyers to around $2,870 during the early Asian session on Monday. The uncertainty and ongoing Russia and Ukraine conflicts continue to underpin the precious metal. Traders will keep an eye on the US February ISM Manufacturing Purchasing Managers Index (PMI), which is due later on Monday.
According to the state RIA news agency, an oil refinery in the Russian city of Ufa has caught fire. The regional branch of Russia's emergency ministry reported that residents in nearby areas face no danger from the blaze. However, the cause of the fire is yet to be determined.
Over the weekend, US President Donald Trump on Friday criticized Ukrainian President Volodymyr Zelenskyy for being "disrespectful" and canceled the signing of a minerals deal that would have brought Ukraine closer to resolving its conflict with Russia. Investors will closely monitor the developments surrounding Russia's headlines. Any signs of escalating tensions could boost the Gold price, a traditional safe-haven asset.
On the other hand, the renewed US Dollar (USD) demand might cap the upside for the yellow metal. US inflation data came in line with expectations, suggesting the US Federal Reserve (Fed) might adopt a cautious stance on further rate cuts.
The US Personal Consumption Expenditures (PCE) Price Index climbed 2.5% YoY in January, compared to 2.6% in December, the US Bureau of Economic Analysis reported on Friday. Meanwhile, the core PCE Price Index, which excludes volatile food and energy prices, climbed 2.6% on a yearly basis in January, down from 2.9% in December. Both figures came in line with market expectations.Gold FAQs
Gold has played a key role in human’s history as it has been widely used as a store of value and medium of exchange. Currently, apart from its shine and usage for jewelry, the precious metal is widely seen as a safe-haven asset, meaning that it is considered a good investment during turbulent times. Gold is also widely seen as a hedge against inflation and against depreciating currencies as it doesn’t rely on any specific issuer or government.
Central banks are the biggest Gold holders. In their aim to support their currencies in turbulent times, central banks tend to diversify their reserves and buy Gold to improve the perceived strength of the economy and the currency. High Gold reserves can be a source of trust for a country’s solvency. Central banks added 1,136 tonnes of Gold worth around $70 billion to their reserves in 2022, according to data from the World Gold Council. This is the highest yearly purchase since records began. Central banks from emerging economies such as China, India and Turkey are quickly increasing their Gold reserves.
Gold has an inverse correlation with the US Dollar and US Treasuries, which are both major reserve and safe-haven assets. When the Dollar depreciates, Gold tends to rise, enabling investors and central banks to diversify their assets in turbulent times. Gold is also inversely correlated with risk assets. A rally in the stock market tends to weaken Gold price, while sell-offs in riskier markets tend to favor the precious metal.
The price can move due to a wide range of factors. Geopolitical instability or fears of a deep recession can quickly make Gold price escalate due to its safe-haven status. As a yield-less asset, Gold tends to rise with lower interest rates, while higher cost of money usually weighs down on the yellow metal. Still, most moves depend on how the US Dollar (USD) behaves as the asset is priced in dollars (XAU/USD). A strong Dollar tends to keep the price of Gold controlled, whereas a weaker Dollar is likely to push Gold prices up.
-
00:31
Australia ANZ Job Advertisements down to -1.4% in February from previous 0.2%
-
00:31
Australia ANZ Job Advertisements down to -1.4% in February from previous 0.2%
-
00:30
Australia Company Gross Operating Profits (QoQ) came in at 5.9%, above expectations (1.5%) in 4Q
-
00:30
Australia Company Gross Operating Profits (QoQ) came in at 5.9%, above expectations (1.5%) in 4Q
-
00:30
Japan Jibun Bank Manufacturing PMI came in at 49, above expectations (48.9) in February
-
00:30
Japan Jibun Bank Manufacturing PMI came in at 49, above expectations (48.9) in February
-
00:17
Blaze erupts at Ufa oil refinery amid explosion reports
An oil refinery in the Russian city of Ufa was on fire, according to the state RIA news agency. The regional branch of Russia's emergency ministry reported that residents in nearby areas face no danger from the blaze, per Reuters.
"There is no threat to residents of nearby areas," said RIA.
The cause of the fire is yet to be determined. Several Russian Telegram channels, including the SHOT news channel, reported the fire followed an explosion at the refinery.Market reaction
At the time of writing, the Gold price (XAU/USD) is trading around $2,870, up 0.58% on the day.
Risk sentiment FAQs
In the world of financial jargon the two widely used terms “risk-on” and “risk off'' refer to the level of risk that investors are willing to stomach during the period referenced. In a “risk-on” market, investors are optimistic about the future and more willing to buy risky assets. In a “risk-off” market investors start to ‘play it safe’ because they are worried about the future, and therefore buy less risky assets that are more certain of bringing a return, even if it is relatively modest.
Typically, during periods of “risk-on”, stock markets will rise, most commodities – except Gold – will also gain in value, since they benefit from a positive growth outlook. The currencies of nations that are heavy commodity exporters strengthen because of increased demand, and Cryptocurrencies rise. In a “risk-off” market, Bonds go up – especially major government Bonds – Gold shines, and safe-haven currencies such as the Japanese Yen, Swiss Franc and US Dollar all benefit.
The Australian Dollar (AUD), the Canadian Dollar (CAD), the New Zealand Dollar (NZD) and minor FX like the Ruble (RUB) and the South African Rand (ZAR), all tend to rise in markets that are “risk-on”. This is because the economies of these currencies are heavily reliant on commodity exports for growth, and commodities tend to rise in price during risk-on periods. This is because investors foresee greater demand for raw materials in the future due to heightened economic activity.
The major currencies that tend to rise during periods of “risk-off” are the US Dollar (USD), the Japanese Yen (JPY) and the Swiss Franc (CHF). The US Dollar, because it is the world’s reserve currency, and because in times of crisis investors buy US government debt, which is seen as safe because the largest economy in the world is unlikely to default. The Yen, from increased demand for Japanese government bonds, because a high proportion are held by domestic investors who are unlikely to dump them – even in a crisis. The Swiss Franc, because strict Swiss banking laws offer investors enhanced capital protection.
-
00:15
Currencies. Daily history for Friday, February 28, 2025
Pare Closed Change, % AUDUSD 0.62037 -0.49 EURJPY 156.151 0.28 EURUSD 1.03714 -0.26 GBPJPY 189.41 0.39 GBPUSD 1.25805 -0.14 NZDUSD 0.55946 -0.62 USDCAD 1.44649 0.19 USDCHF 0.90298 0.4 USDJPY 150.557 0.52 -
00:02
Australia TD-MI Inflation Gauge (YoY) fell from previous 2.3% to 2.2% in February
-
00:01
Australia TD-MI Inflation Gauge (MoM) dipped from previous 0.1% to -0.2% in February
-