Notícias do Mercado
-
23:53
Japan Money Supply M2+CD (YoY) came in at 2.9% below forecasts (3.3%) in December
-
23:50
Japan Foreign Investment in Japan Stocks climbed from previous ¥-265.1B to ¥-199.1B in December 30
-
23:50
Japan Foreign Bond Investment: ¥566.8B (December 30) vs ¥-459.5B
-
23:38
EUR/JPY Price Analysis: Juggles around 140.00 after a vertical sell-off
- The formation of Double Top amid less buying interest led to a sheer fall in the Euro bulls.
- EUR/JPY is hovering around the critical support at 140.00 and an absence of follow-up buying indicates the Japanese Yen’s strength.
- A bear cross, represented by the 20 and 50-EMAs, adds to the downside filters.
The EUR/JPY pair is displaying back-and-forth moves in a narrow range of 140.00-140.40 in the early Asian session. The cross has turned sideways after a perpendicular downside move amid escalating chatters that the Bank of Japan (BoJ) is aiming to exit from its decade-long ultra-loose monetary policy.
After expanding the range of 10-year Japan Government Bonds (JGBs)’s yields TO +-50 basis points (bps), the BOJ is reviewing the side-effects of easy policy, which indicates that Japanese officials are looking to change their monetary policy approach in parallel with Western nations.
EUR/JPY witnessed a steep fall after failing to extend gains above the horizontal resistance placed from December 28 high around 142.94 amid the absence of sheer buying interest while refreshing a two-week high. This led to the formation of a Double Top chart pattern on an hourly scale, which indicates a bearish reversal.
The asset has dropped to near the demand zone around 140.00 and the unavailability of a follow-up recovery indicates weakness in the Euro bulls.
A bear cross, represented by the 20-and 50-period Exponential Moving Averages (EMAs) at around 142.00, adds to the downside filters.
Meanwhile, the Relative Strength Index (RSI) (14) has slipped into the bearish range of 20.00-40.00, which indicates more weakness ahead.
EUR/JPY may display more weakness if it drops below the crucial support of 140.00, which will drag the asset towards December 20 low at 138.80 followed by January 3 low at 137.39.
On the flip side, a breakout above the Double Top chart pattern around 143.00 will drive the cross towards December 20 high at 145.84. A breach above the latter will expose the asset for more upside towards December 15 high at 146.71.
EUR/JPY hourly chart
-638091634203879056.png)
-
23:36
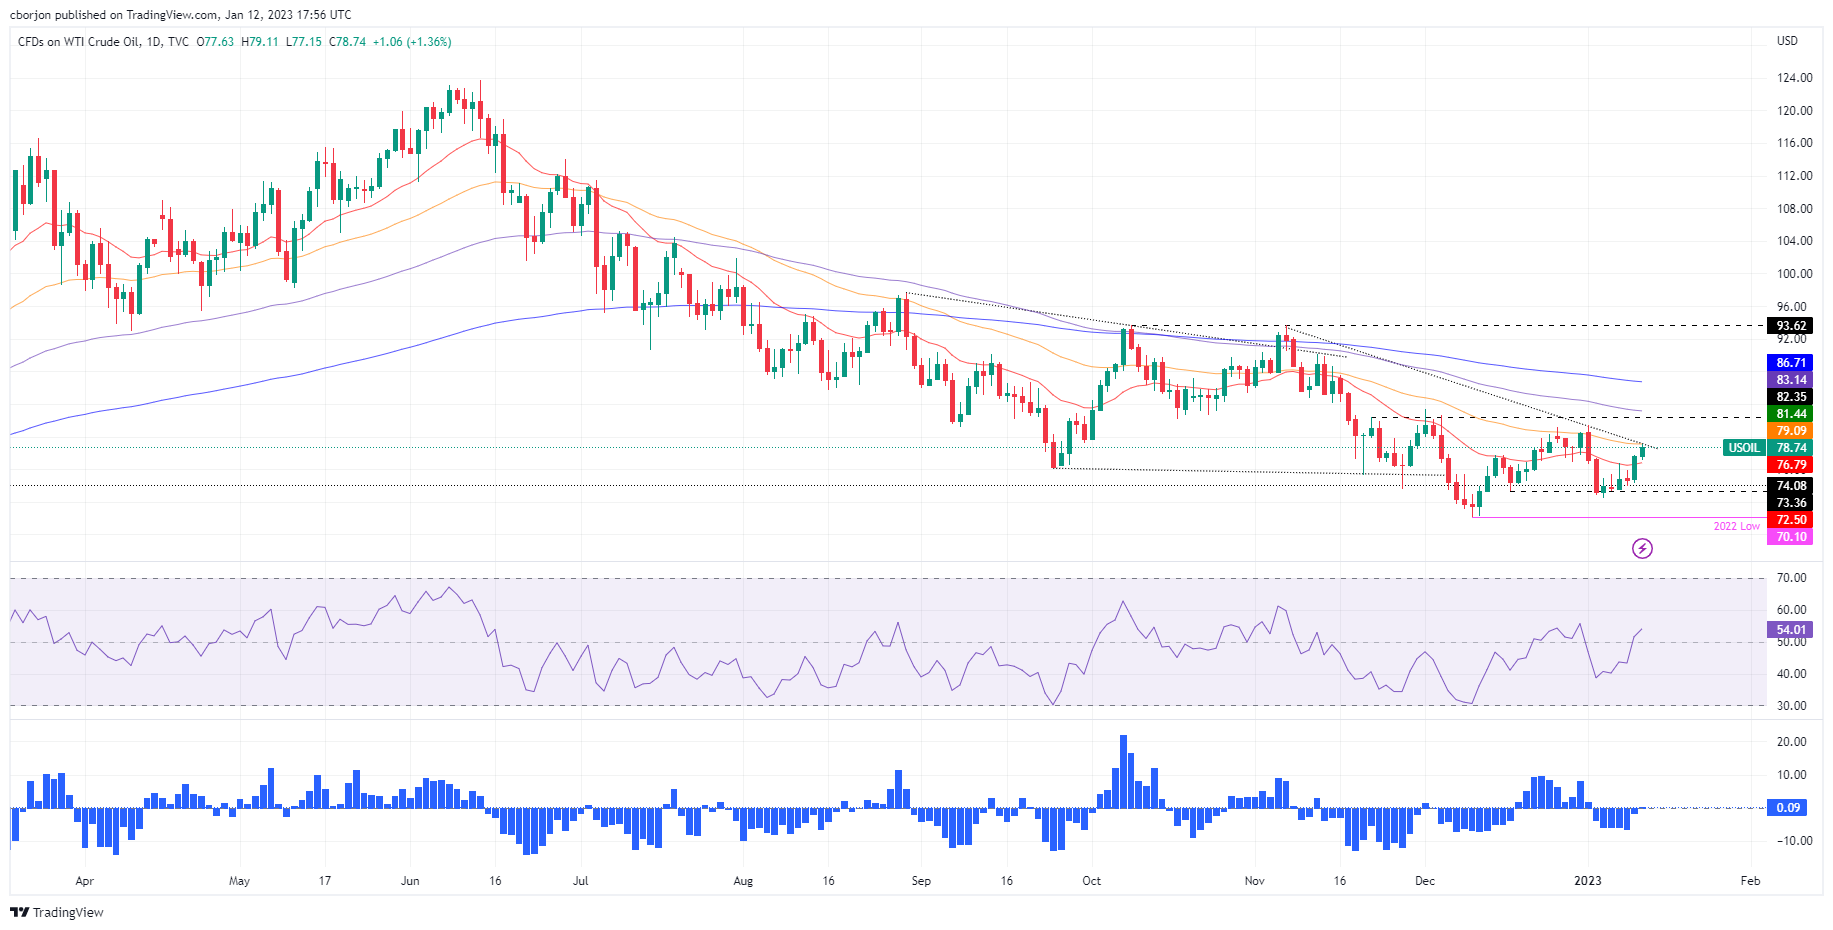
WTI Price Analysis: Bearish Doji probes Oil buyers around $78.50
- WTI struggles to extend four-day uptrend around weekly top.
- Gravestone Doji joins overbought RSI to probe energy bulls.
- Three-week-old horizontal support zone, 200-SMA challenge bears.
- Bulls could aim for $81.10 during further upside.
WTI crude oil seesaws around $78.50 as energy bulls take a breather after a four-day winning streak. That said, the black gold’s latest weakness, or inability to rise further, could be linked to a bearish candlestick formation on the four-hour chart, as well as the overbought RSI (14).
That said, the Gravestone Doji candlestick at the weekly top teases WTI sellers to revisit the $77.00-76.90 support zone comprising multiple lows marked since December 20. However, the 200-SMA level surrounding $76.75 could challenge the commodity’s further downside.
In a case where the quote remains bearish past $76.75, multiple hurdles around $75.00 could test the oil bears before highlighting an upward-sloping support line from December 09, close to $73.35 at the latest.
Alternatively, WTI crude oil prices need to cross the immediate top of $79.35 to defy the downside bias posed by the bearish candlestick.
However, a three-week-old horizontal region surrounding $80.95-81.10 could challenge the oil buyers afterward.
It’s worth noting, however, that the WTI crude oil’s run-up beyond $81.10 will need validation from the monthly high surrounding $81.55 to aim for the previous month’s peak of $83.30.
To sum up, WTI crude oil is likely to witness a pullback but the bears have a bumpy road ahead before retaking control.
WTI: Four-hour chart
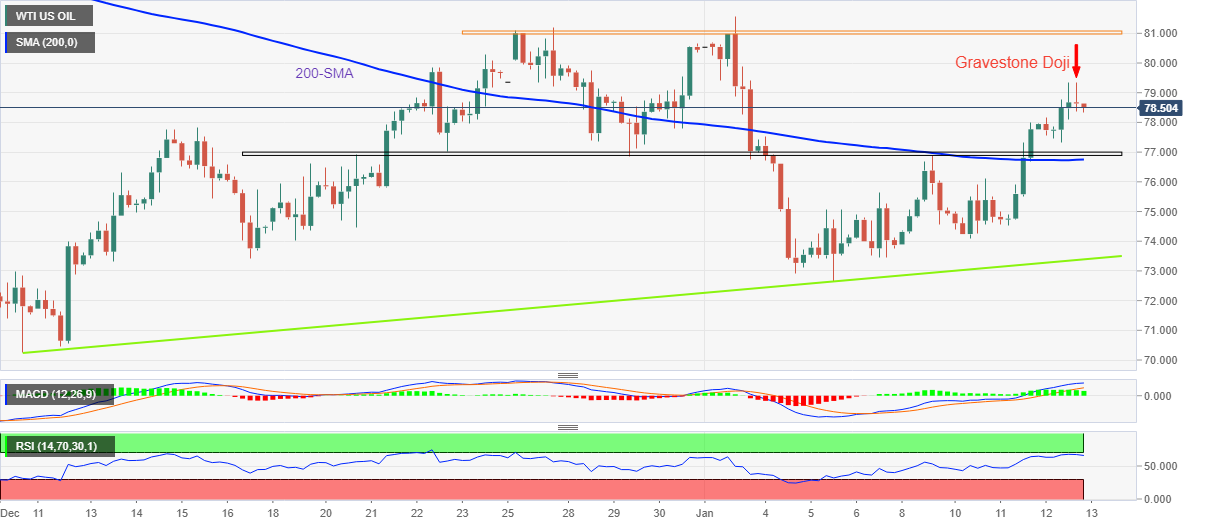
Trend: Pullback expected
-
23:18
NZD/USD fades US inflation-inspired gains below 0.6400 ahead of China trade data
- NZD/USD retreats from one-month high even as market sentiment remains firmers.
- Softer US inflation fuelled calls for slower rate hikes even as Fed policymakers tried to defend restrictive monetary policy.
- Expectations of easy RBNZ move seem to weigh on Kiwi pair amid light calendar at home.
- China trade numbers for December, preliminary readings of US Michigan CSI for January eyed for fresh impulse.
NZD/USD prints mild losses around 0.6390-85 as it consolidates the US inflation-led gains during a sluggish Asian session on early Friday. In doing so, the Kiwi pair also portrays the traders’ anxiety ahead of China’s trade numbers for December and the first prints of the US Michigan Consumer Sentiment Index (CSI) for January.
It’s worth noting that the softer US Consumer Price Index (CPI) for December propelled expectations of easy rate hikes and drowned the US Dollar the previous day. However, the recent chatters that the Fed’s easy move could also push the Reserve Bank of New Zealand (RBNZ) to retreat from hawkish bias seemed to have weighed on the NZD/USD prices.
That said, the US CPI matched 6.5% YoY forecasts for December, versus 7.1% prior. More importantly, CPI ex Food & Energy also proved the market consensus of 5.7% YoY figure right, compared to 6.0% previous readings. It’s worth noting that the CPI MoM marked the first negative figure since June 2020 while marking a -0.1% figure for the stated month, versus 0.0% forecast and 0.1% prior.
After the CPI announcements, the Fed Fund Futures tied to the policy rate implied a nearly 100% chance of a 0.25% Fed rate hike in February while the odds favoring a 50 bps rate hike in the said month slumped to 8.0%.
It should be noted that Federal Reserve Bank of Philadelphia President Patrick Harker was the first to flag easy rate hikes after the US CPI and weighed on the US Dollar. On the same line, Richmond Federal Reserve President Thomas Barkin mentioned that it "makes sense" to steer more deliberately as the Fed works to bring inflation down. However, St. Louis Federal Reserve leader James Bullard also said that the most likely scenario is inflation remaining above 2%, so the policy rate will need to be higher for longer.
Amid these plays, Wall Street managed to close in the green while the US 10-year and two-year Treasury bond yields refreshed monthly lows. It should be noted that the S&P 500 Futures print mild gains while the US 10-year Treasury yields remain pressured around 3.44% at the latest.
Given the lack of major data/events at home, NZD/USD may remain sidelined ahead of the key statistics from China and the US. Should the scheduled figures manage to impress policy hawks in Beijing and Washington, the Kiwi pair could extend the latest weakness.
Technical analysis
Although a two-week-old ascending trend line restricts the immediate upside of the NZD/USD pair around 0.6440, sellers need validation from the 21-DMA level of 0.6333 to take entries.
-
23:10
EUR/GBP struggles to sustain above 0.8880 as focus shifts to UK economic data
- EUR/GBP is facing pressure in printing fresh highs above 0.8880 ahead of UK economic data.
- A further slowdown in UK economic activities might trim inflation projections.
- ECB Villeroy sees the central bank reaching to terminal rate by the summer.
The EUR/GBP pair is facing barriers in shifting its auction profile above the critical resistance of 0.8880 in the early Tokyo session. The cross is likely to remain on tenterhooks as investors have shifted their focus toward the release of the United Kingdom economic data, which is scheduled for Friday.
The cross is demonstrating signs of exhaustion in the upside trend, however, it would be early to call it a bearish reversal as will require approvals from more filters.
On the economic docket front, UK’s annual Industrial Production and Manufacturing Production (Nov) are expected to contract by 3.0% and 4.8% respectively. Apart from them, monthly Gross Domestic Product (GDP) is expected to contract by 0.3%. Overall weakness in UK production activities is likely to add to the already economic contraction, which will also impact inflation projections. A drop in inflation projections might delight the Bank of England (BOE) ahead.
Meanwhile, economists at MUFG Bank expect that the UK economy will be more stable this year. A note from the bank stated that we may have reached “peak pessimism” for the UK and the Pound. Much greater political stability this year than last is one factor here and we can very likely assume that PM Sunak will bring greater credibility after the turmoil of 2022. “Another consequence of having Rishi Sunak at No. 10 is the prospect of better relations with the EU and with that a possible deal to break the deadlock regarding the Northern Ireland Protocol.”
On the Eurozone front, European Central Bank (ECB)'s governing council member and French central bank governor Francois Villeroy de Galhau said on Wednesday, the central bank should aim to reach the terminal rate by the summer. He further added that the ECB needs to be pragmatic about the pace of rate hikes.
-
22:54
AUD/JPY Price Analysis: Licks its wounds above 89.85-75 demand zone
- AUD/JPY stabilizes around key support zone after falling the most in three weeks.
- 100-SMA, multiple levels marked in one week carve out 89.85-75 as important support.
- Clear break of 50-SMA, bearish MACD signals favor sellers.
- 50% Fibonacci retracement level guards immediate upside, bulls could regain confidence on breaking 91.00.
AUD/JPY pares the biggest daily loss in three weeks around 90.20 after failing to break the key 89.85-75 support zone the previous day. Even so, the cross-currency pair remains on the bear’s radar during early Friday in Asia.
That said, a downside break of the 50-SMA and the bearish MACD signals keep the quote as the bear’s favorite despite the latest consolidation.
However, a convergence of the 100-SMA and an eight-day-long horizontal support zone, around 89.85-75, appears a tough nut to crack for the AUD/JPY bears before they can extend the ruling.
Also acting as a downside filter is December 22, 2022, low near 89.30 and the 89.00 round figure.
Following that, the monthly low 87.41 and the previous month’s bottom surrounding 87.00 will be in the spotlight.
Alternatively, the 50% Fibonacci retracement level of the pair’s December 13-20 downturn, near 90.20, guards the immediate upside of the AUD/JPY before highlighting the 50-SMA hurdle of 90.35.
Even if the quote manages to stay beyond 90.35, the 61.8% Fibonacci retracement, also known as the “Golden ratio”, could challenge the AUD/JPY bulls around 90.95. It should be noted that the pair buyers may seek confirmation from the 91.00 threshold.
AUD/JPY: Four-hour chart
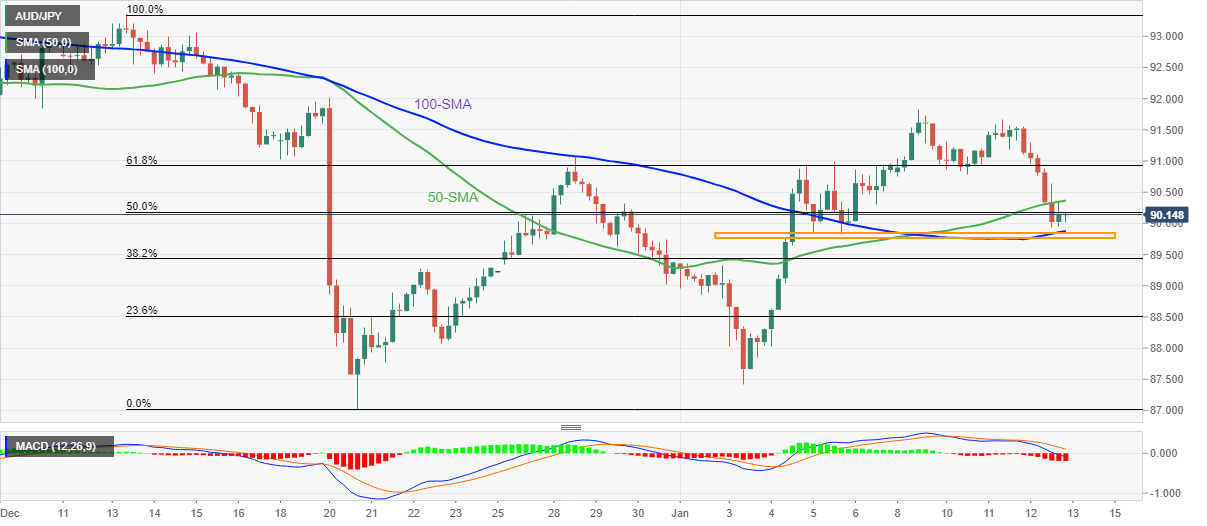
Trend: Further downside expected
-
22:50
IMF's Georgieva: BoJ pursuing appropriate review of monetary policy but should keep it accommodative
International Monetary Fund (IMF) Managing Director Kristalina Georgieva crossed wires, via Reuters, during early Friday morning in Asia while suggesting an accommodative policy stand for the Bank of Japan (BOJ). IMF leader also said, “The IMF is not expected to downgrade its forecast for 2.7% growth in 2023.”
Additional comments
Not expecting to downgrade October forecast for 2.7% global growth in 2023.
Inflation remains stubborn and central banks must continue to press for price stability.
Downside risk of spiking oil prices did not materialize, labor markets remain vibrant.
Expects global economy to 'bottom out' toward end of 2023, early 2024, barring unexpected surprises.
Important for China to 'stay the course' in reversing earlier zero-covid policy.
Biggest risk to 2023 outlook is possible spilllover from Russia's war in Ukraine, social unrest.
IMF's projection for 4.4% growth in china depends on transition away from zero-covid policy.
Any US Recession would be mild, China to become net contributor to global economy by mid-year.
FX implications
The news should help put a floor under the USD/JPY prices after the US inflation-led slump. That said, the Yen pair was last seen licking its wounds around 129.35, up 0.11% intraday by the press time.
-
22:42
USD/CHF Price Analysis: Drops below 0.9300, extends its losses beneath the 20-DMA
- USD/CHF seesawed in a 100-pip range but finished Thursday’s session with losses of 0.44%.
- The USD/CHF remains downward biased, but it needs to drop below 0.9200 to challenge the 0.9167 YTD low.
- It would turn bullish above the 20-day EMA nearby 0.9300.
After attempting to clear 0.9300, the USD/CHF resumed its downtrend due to the release of a softer inflation report in the United States (US), which spurred a repricing for a less aggressive Federal Reserve (Fed); consequently, the US Dollar weakened. Therefore, the USD/CHF erased its earlier gains and dived beneath 0.9280 as the Asian session began. At the time of writing, the USD/CHF is almost unchanged, around 0.9270.
USD/CHF Price Analysis: Technical outlook
Following the release of the US CPI, the USD/CHF seesawed in the 0.9265/0.9360 range before stabilizing around 0.9270, 30 pips below the 20-day Exponential Moving Average (EMA) at 0.9294. Oscillators like the Relative Strength Index (RSI) pointing downwards and the Rate of Change (RoC) almost flat suggests sellers are gathering momentum. However, to further extend its downtrend, USD/CHF bears need to decisively break below 0.9265 to aim towards the 0.9200 mark and wall of support.
On the other hand, if USD/CHF buyers reclaim the 20-day EMA, that will immediately expose 0.9300, followed by the current week’s high of 0.9360, on its way north to 0.9400.
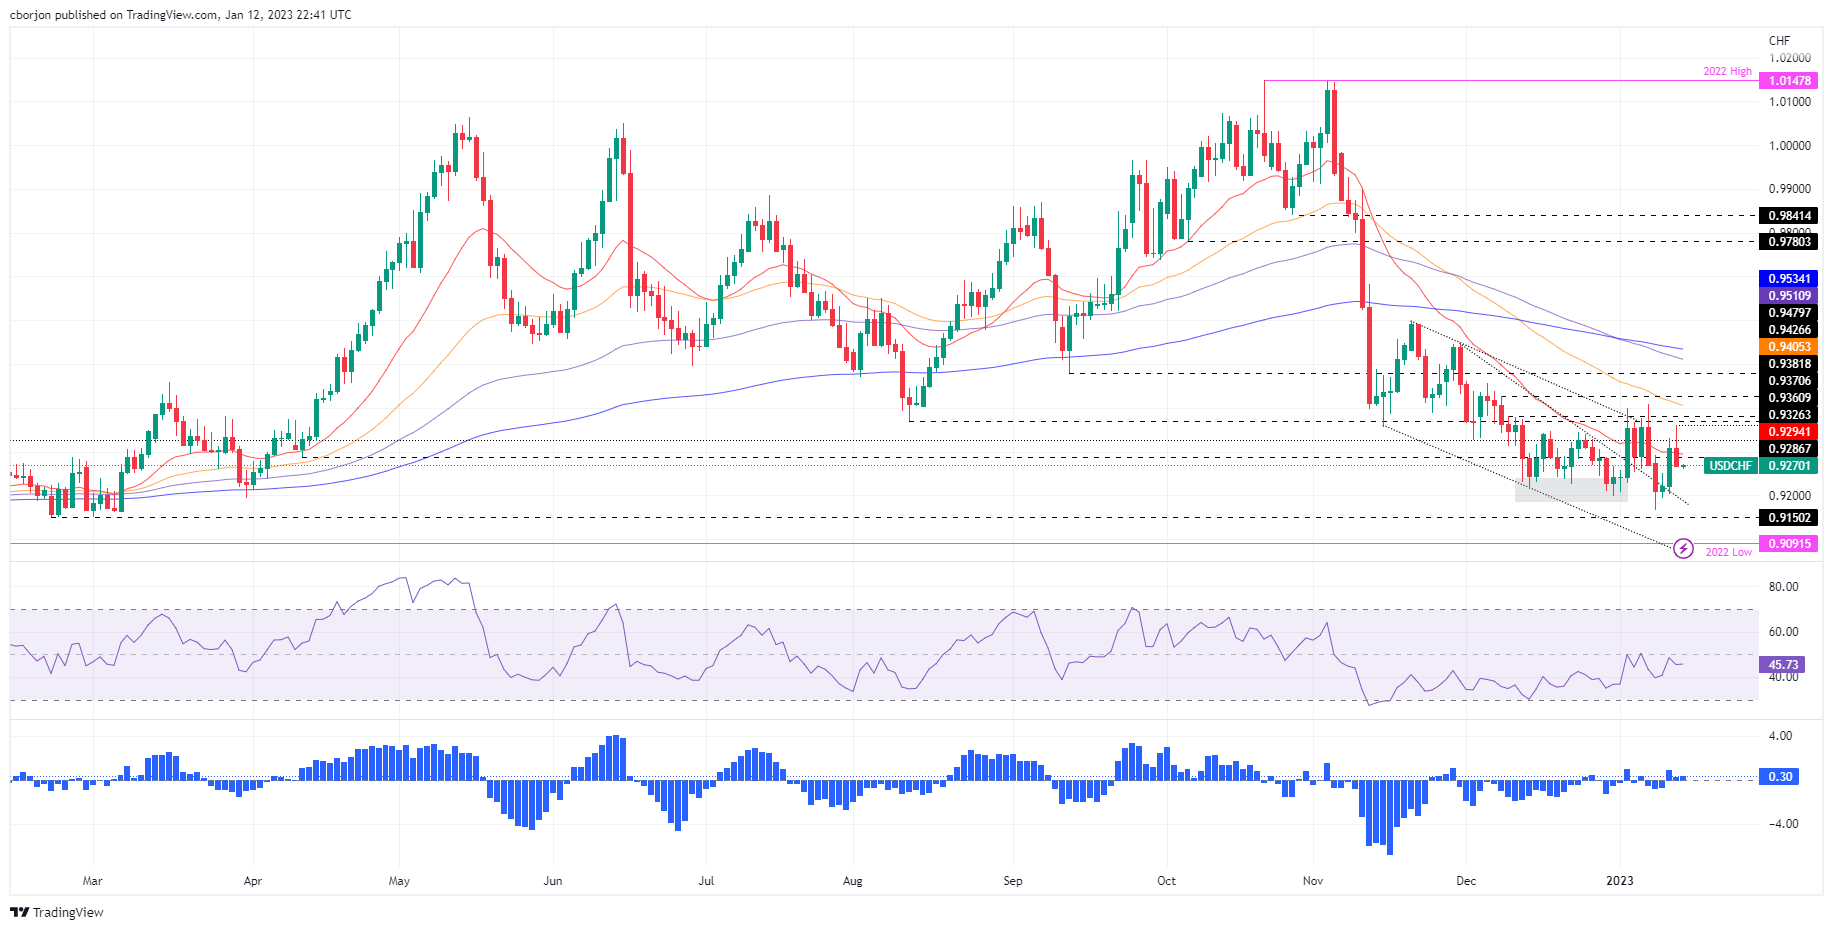
USD/CHF Key Technical Levels
-
22:41
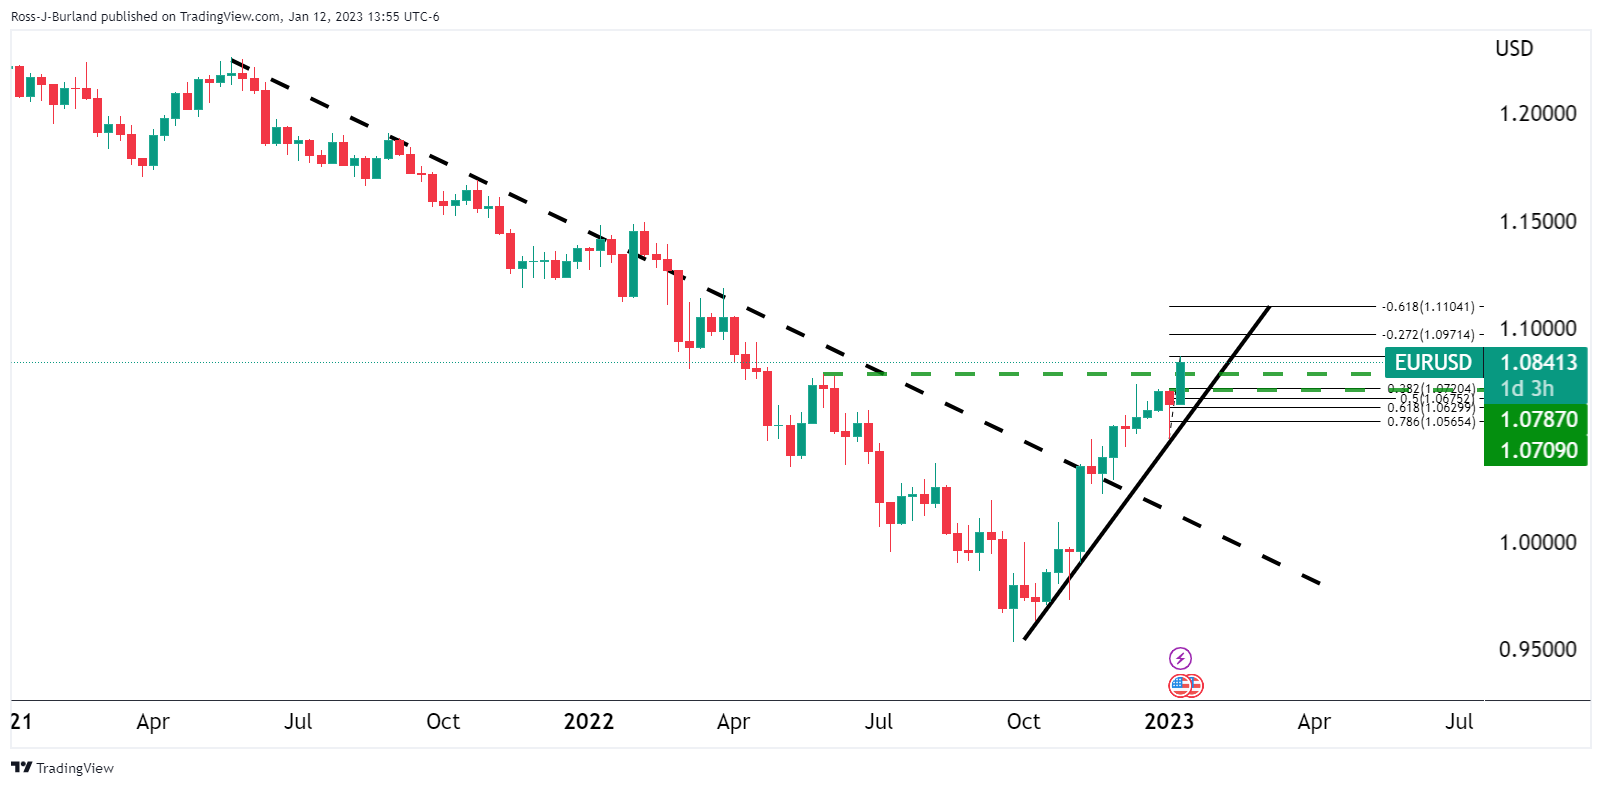
EUR/USD Price Analysis: Marches towards 50% Fibo retracement around 1.0950
- EUR/USD is looking to recapture a 50% Fibo retracement at 1.0946 amid an upbeat market mood.
- The 10-period EMA is acting as a major cushion for the Euro bulls.
- Bullish momentum seems triggered as the RSI (14) has shifted into the 60.00-80.00 range.
The EUR/USD pair has turned sideways after failing to extend its upside journey above the immediate resistance of 1.0860 in the early Tokyo session. The major currency pair is likely to display a rangebound profile as a bumper rally is generally followed by a lackluster performance.
Investors’ risk appetite has improved dramatically after the United States inflation was trimmed in line with the consensus. This led to the end of the third consecutive bullish trading session of the S&P500 as it is highly likely that the Federal Reserve (Fed) will not continue higher interest rates for longer than expected. The US Dollar refreshed a seven-month low at 102.86.
EUR/USD is marching toward the 50% Fibonacci retracement (placed from the 8 January 2021 high at 1.2349 to the 30 September 2022 low at 0.9536) at 1.0946 on a weekly chart. The 10-period Exponential Moving Average (EMA) at 1.0544 has acted as a major support for the Euro bulls. Also, advancing 20-EMA at 1.0400 indicates that the upside bias is solid.
The Relative Strength Index (RSI) (14) has shifted into the bullish range of 60.00-80.00 after a long period of time, which indicates that bullish momentum is active now.
For further upside, EUR/USD needs to surpass Thursday’s high at 1.0869, which will drive the major currency pair towards April 21 high at 1.0936 followed by the psychological resistance at 1.1000.
On the flip side, a breakdown of the January 10 low at 1.0712 will drag the asset toward January 4 high at 1.0635. A slippage below the latter will expose the asset for more downside toward January 3 low at 1.0519.
EUR/USD weekly chart
-638091600582309715.png)
-
22:30
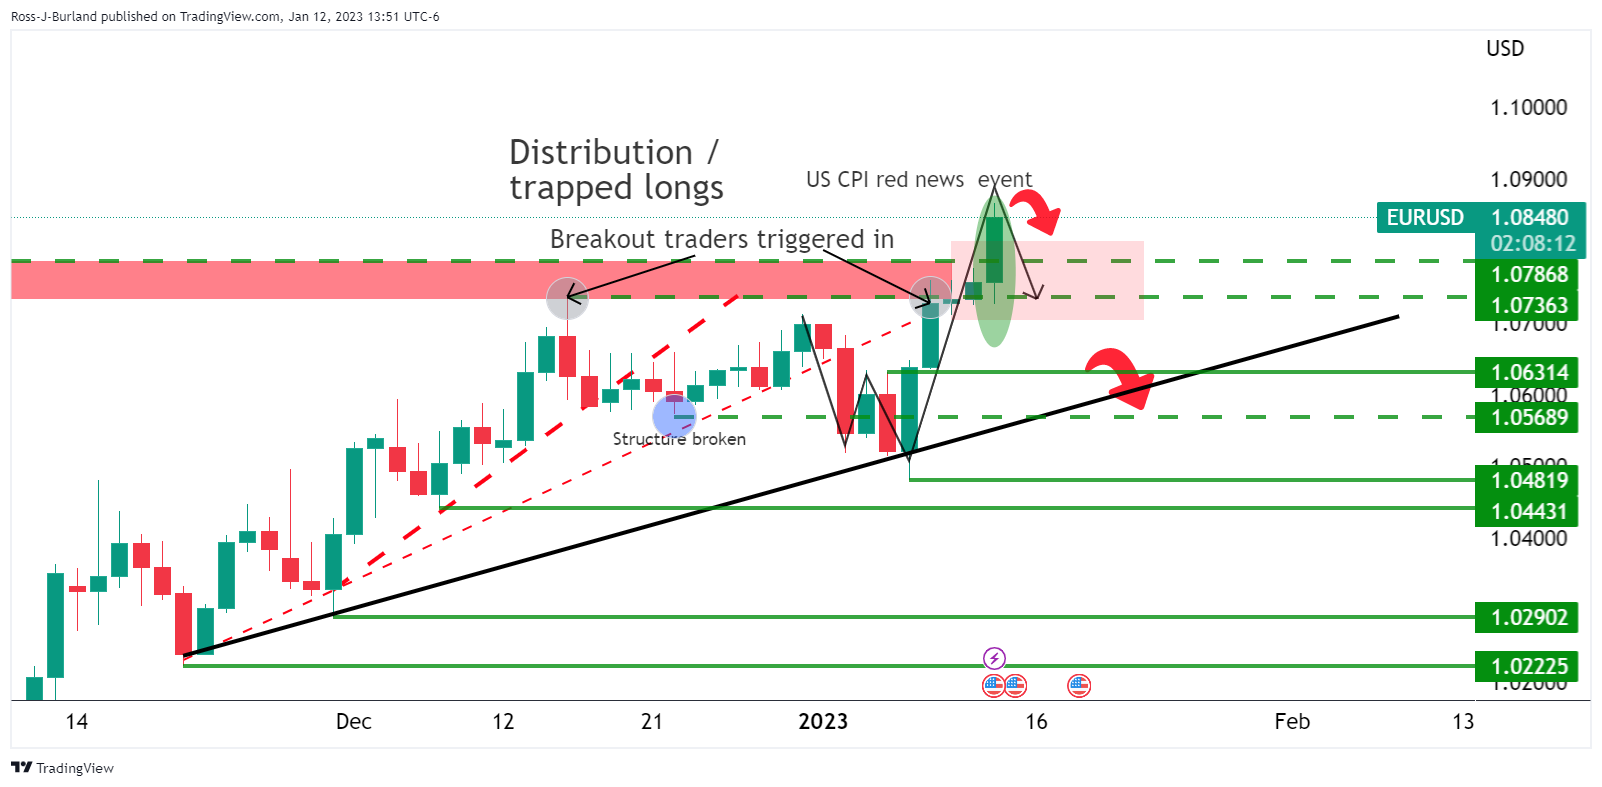
Gold Price Forecast: XAU/USD bulls move into a trap after Consumer Price Index rally?
- Gold price moves into fresh bull cycle highs on the Consumer Price Index.
- Federal Reserve speakers have come out with mixed comments.
- Some analysts argue that the market is underestimating the risks of a higher for longer Federal Reserve interest rate path.
Gold price rallied on Thursday following the Consumer Price Index, CPI, data that came in as expected on th2e whole. The US Dollar fell heavily and is licking its wounds into Friday's early Asian trade down at weekly lows. At the time of writing, Gold price is trading at $1,897.00 and higher by some 1.15%. Gold price rallied from a low of $,1873.91 to a high of $1,901.67.
Gold price rallies on United States Consumer Price Index
The year-over-year Consumer Price Index, CPI, print landed at 6.5% or 0.6 of a percentage point cooler than the November number. The one exception was a positive surprise. On a monthly basis, the headline number actually decreased by a nominal 0.1% instead of remaining unchanged, as analysts expected. The data has raised the bar for a higher pace of rate hikes by the Federal Reserve (Fed) and this was bolstered by less aggressive Federal Reserve speakers such as Philly-Fed’s Patrick Harker who said he favours hikes of 25bp going forward. A weaker US Dollar as a result of a less hawkish Fed saw investor appetite for the precious metal rise.
Federal Reserve speaker comments after Consumer Price Index
However, St. Louis Federal Reserve leader James Bullard, following today's Consumer Price Index, stated that the most likely scenario is inflation remaining above 2%, so the policy rate will need to be higher for longer. Richmond Federal Reserve President Thomas Barkin said the last three months' inflation prints have been a "step in the right direction," but cautioned that while the average has dropped the median has stayed high.
Moreover, analysts at Brown Brothers Harriman argued that ''core Personal Consumption Expenditures, PCE, has largely been in a 4.5-5.5% range since November 2021 and we think the Fed needs to see further improvement before even contemplating any sort of pivot.''
''WIRP suggests a 25 bp hike February 1 is fully priced in, with nearly 30% odds of a larger 50 bp move. Another 25 bp hike March 22 is fully priced in, while one last 25 bp hike in the second quarter is nearly 45% priced in that would take the Fed Funds rate ceiling up to 5.25%. However, the swaps market continues to price in an easing cycle by year-end and we just don’t see that happening.''
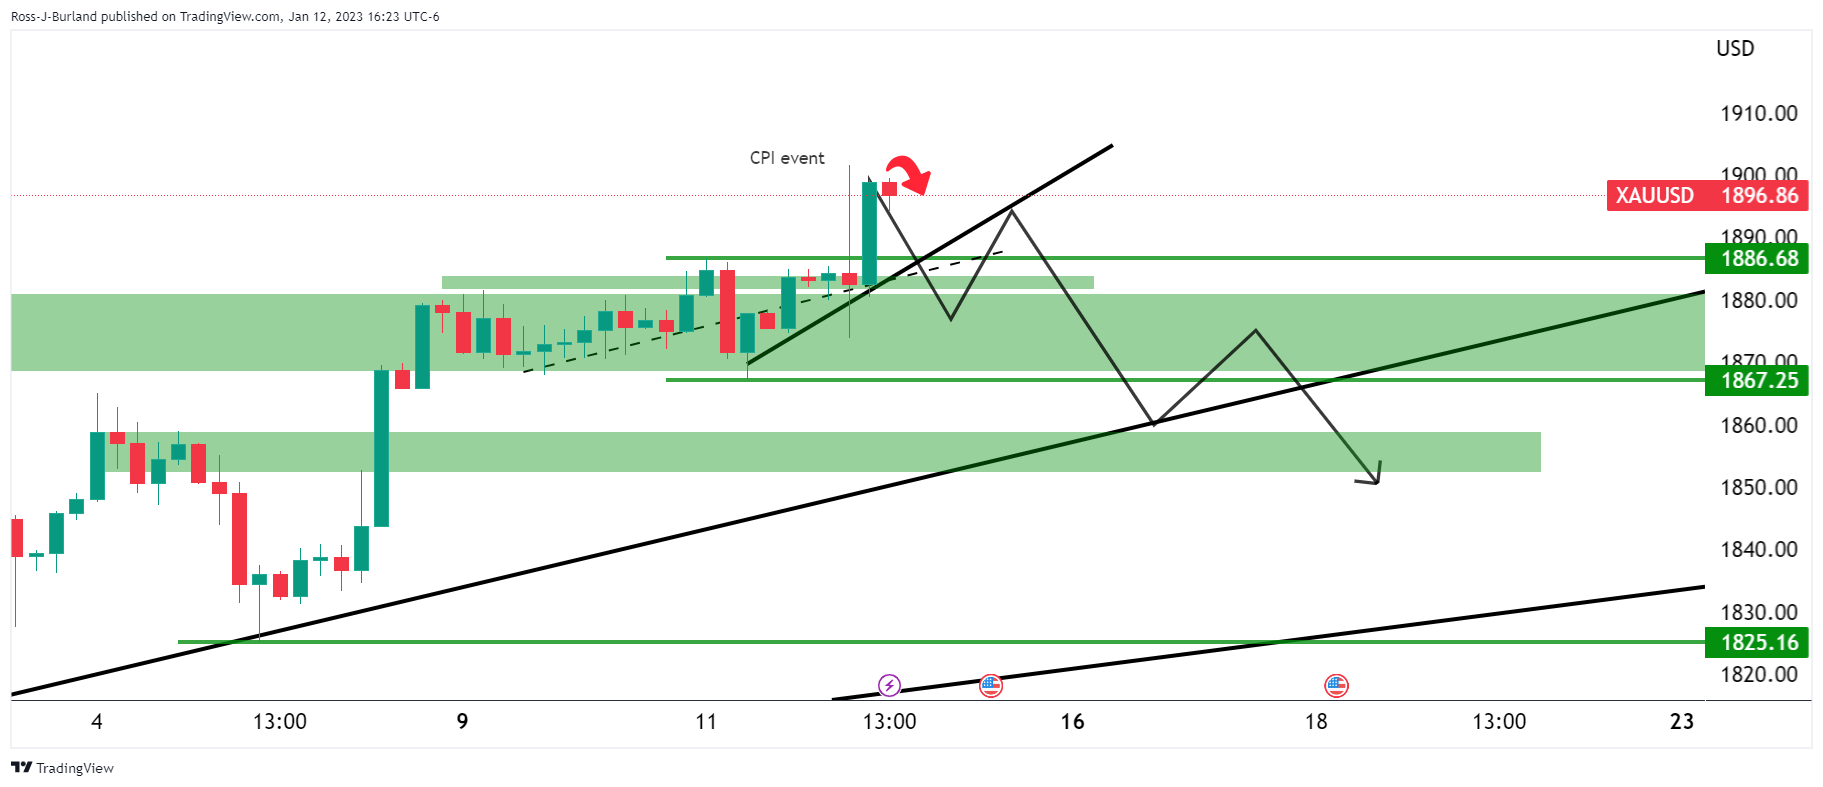
Gold price technical analysis
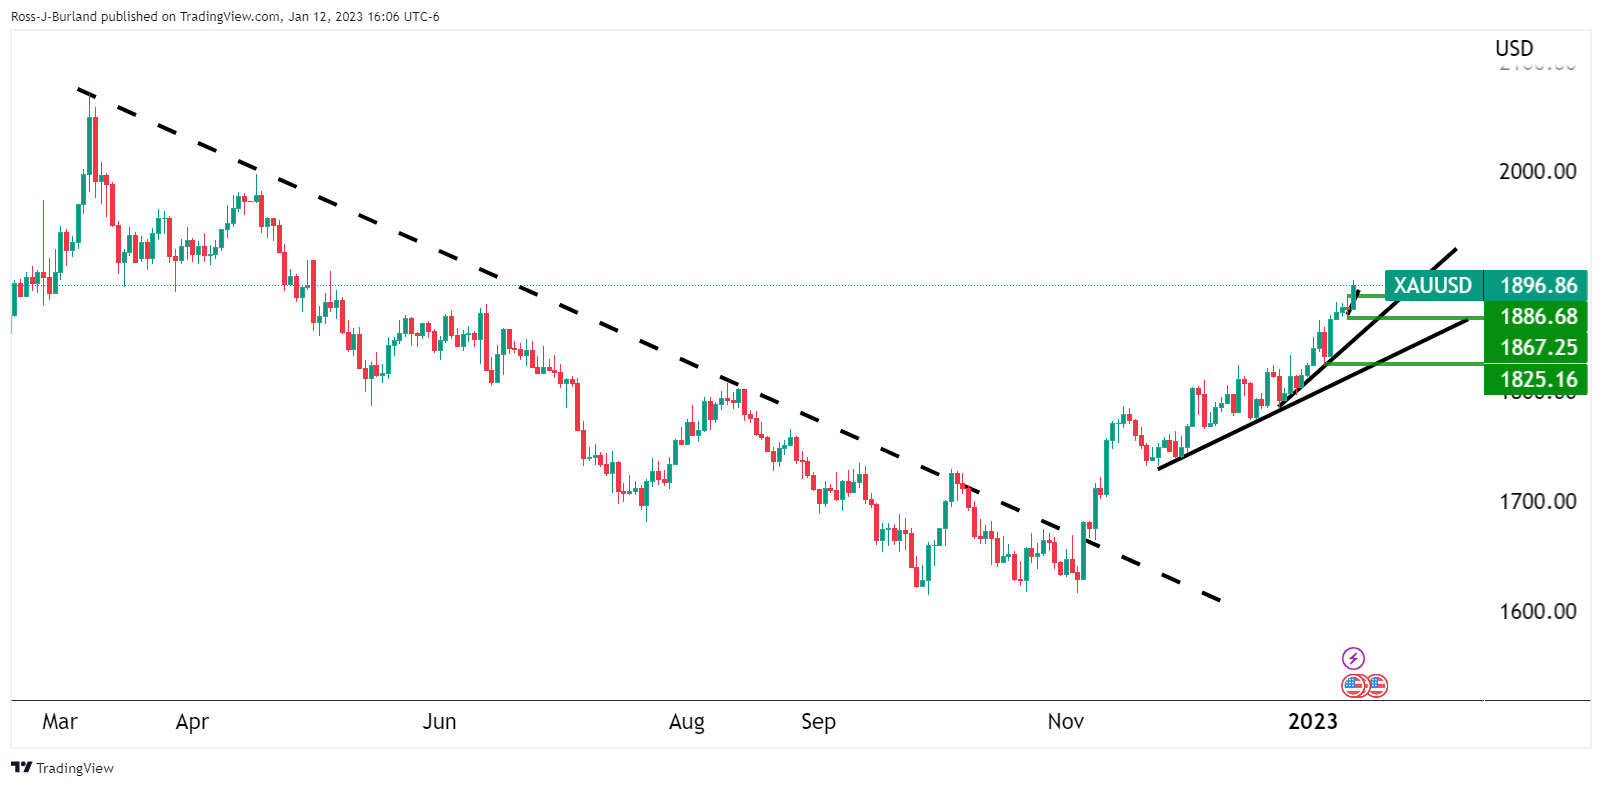
The immediate bearish outlook for Gold price as illustrated in the prior day's analysis was invalidated leading into the Consumer Price Index event:
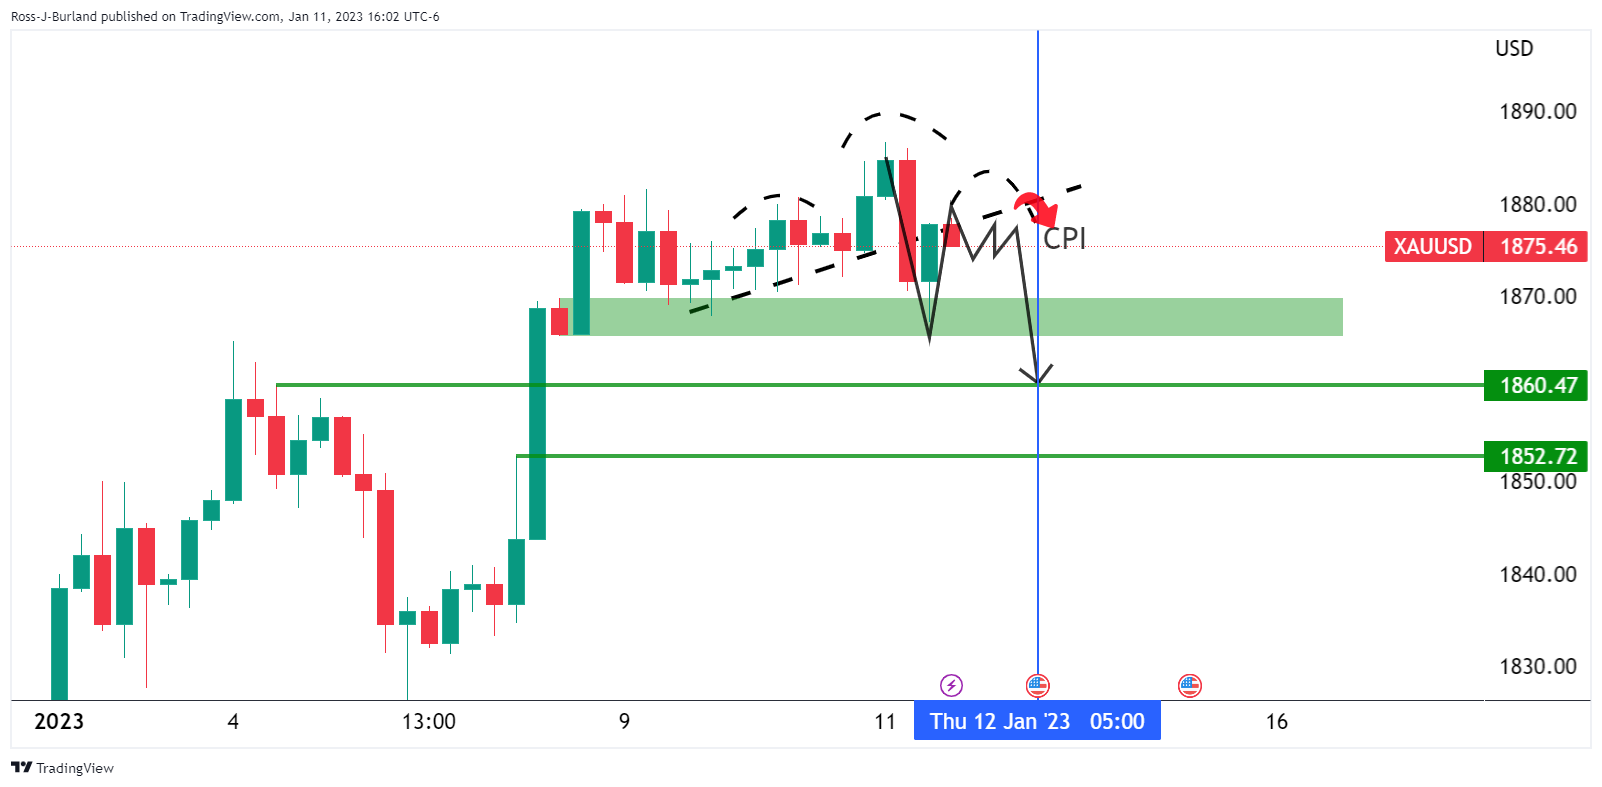
Instead, we got a burst through the head of the head and shoulders as follows:
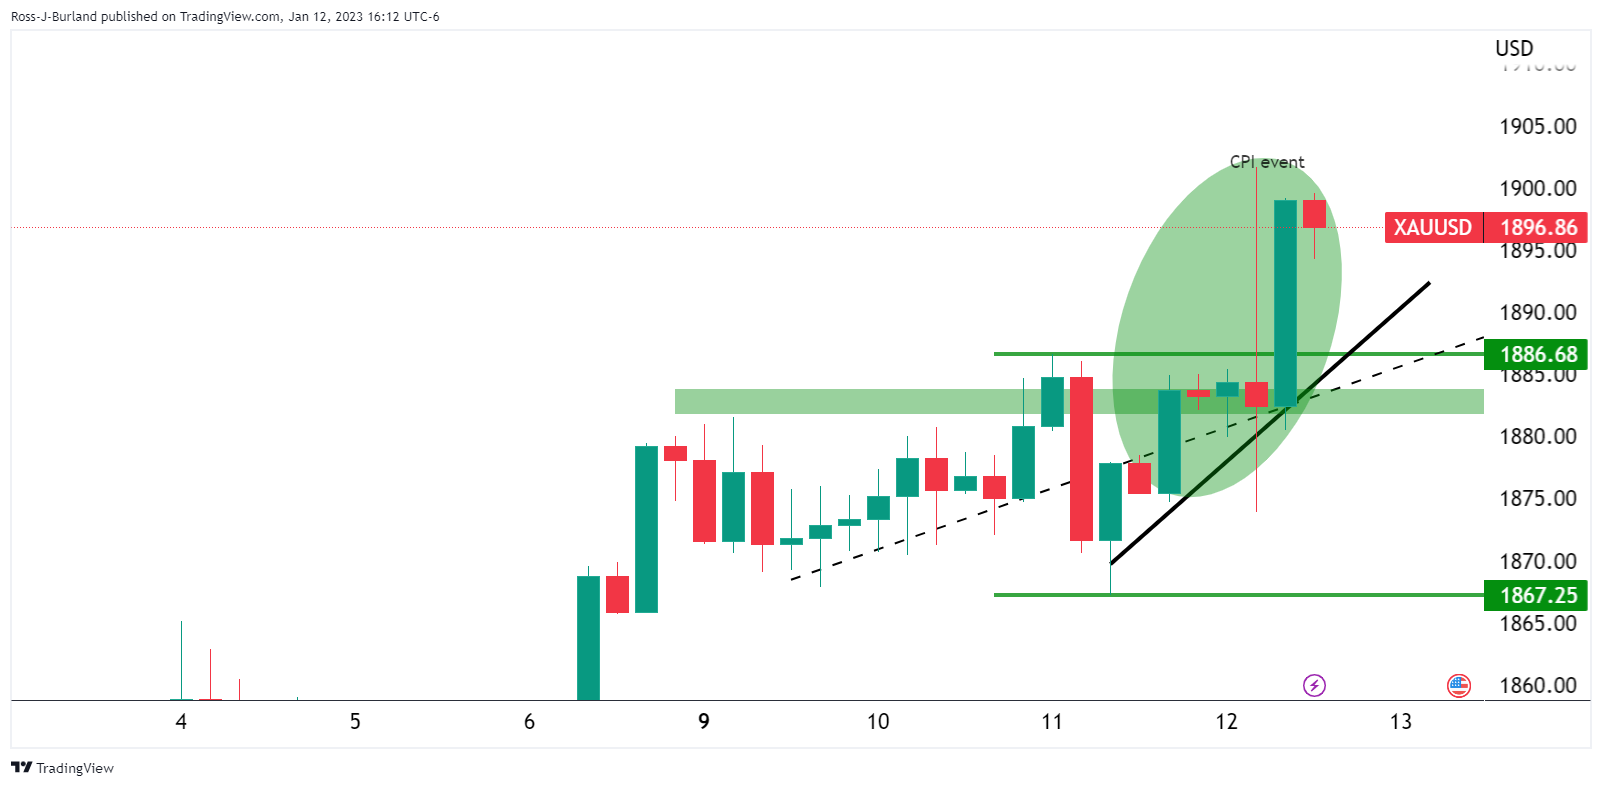
However, what is important to note is that Gold price breakout traders are triggered as follows:
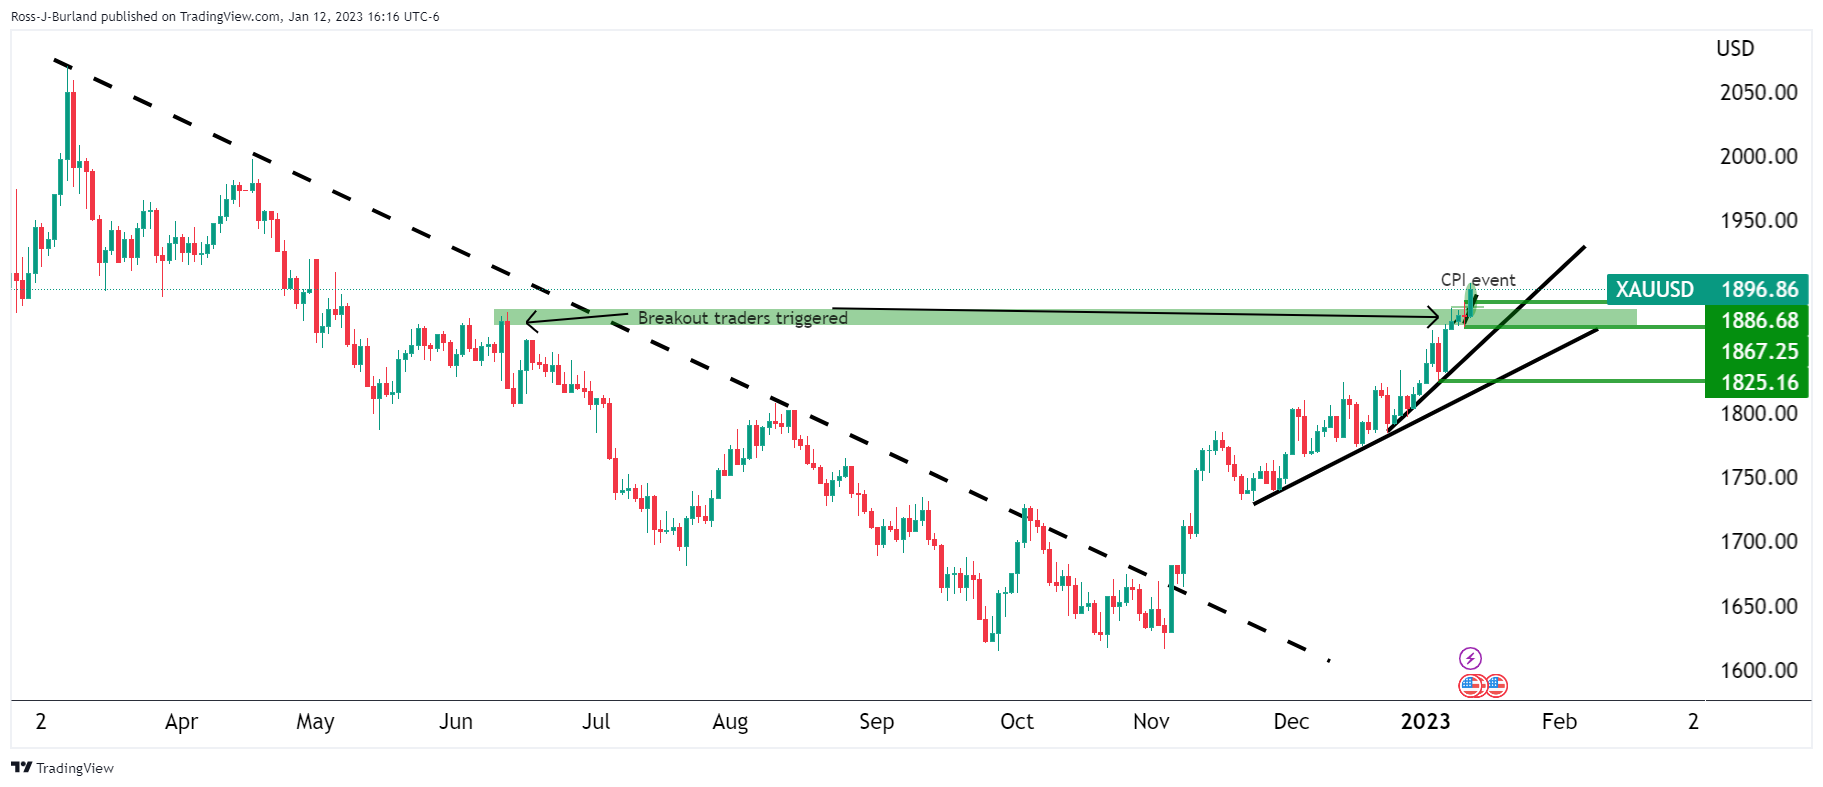
Gold price is now treading water above the summer 2022 highs of near $1,880. This will have added to net longs in the market and therefore, a rebalancing of shorts would be expected to emerge over the coming days. This leaves scope for a significant correction, trapping longs on the wrong side of the market:
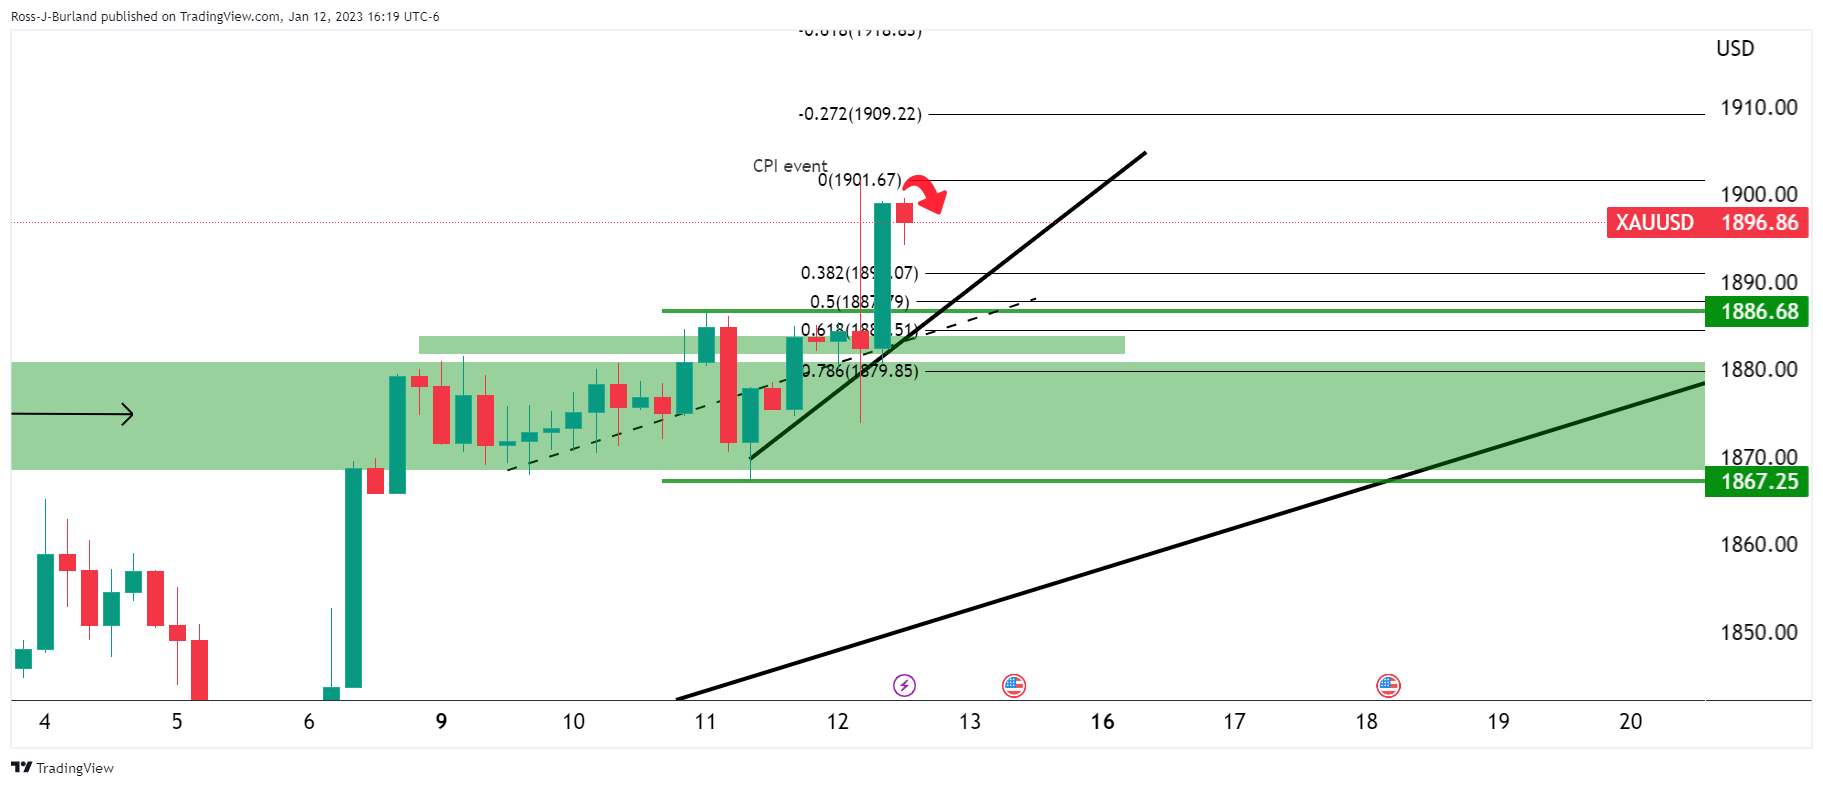
On the 4-hour chart, Gold price is already decelerating on the bid and a 50% mean reversion could be on the cards for the coming sessions to test back below $1,890. This will pressure the Gold price micro-supporting trendline. A break of the trendline will open significant downside risks towards a test of $1,870 and the more dominant trendline:
-
22:21
USD/CAD steadies around multi-day low under 1.3400 amid US inflation-led blow to USD, firmer Oil price
- USD/CAD holds lower ground after dropping to seven-week low.
- Downbeat US CPI fuelled talks of Fed’s policy pivot and weighed on the US Dollar.
- WTI crude oil cheered softer USD, hopes of more energy demand.
- Risk catalysts, China trade balance and US Michigan CSI are important to watch for fresh impulse.
USD/CAD bears are taking a breather at the lowest levels in almost two months around 1.3365, following the biggest daily slump in a week, as traders seek more clues to extend the US inflation-led south-run. That said, the Loonie pair dropped heavily after the US Consumer Price Index (CPI) fuelled expectations of a softer Fed rate hike in December and drowned the US Dollar, which in turn allowed the WTI crude oil to print a four-day uptrend and refresh weekly top.
On Thursday, US Consumer Price Index (CPI) matched 6.5% YoY forecasts for December, versus 7.1% prior. More importantly, CPI ex Food & Energy also proved the market consensus of 5.7% YoY figure right, compared to 6.0% previous readings. It’s worth noting that the CPI MoM marked the first negative figure since June 2020 while marking a -0.1% figure for the stated month, versus 0.0% forecast and 0.1% prior.
Following the inflation readings, Futures tied to the Fed policy rate implied a nearly 100% chance of a 0.25% Fed rate hike in February while the odds favoring a 50 bps rate hike in the said month slumped to 8.0%.
The same should have allowed Federal Reserve Bank of Philadelphia President Patrick Harker to mention that it was time for future Fed rate hikes to shift to 25 basis points increments. Further, St. Louis Federal Reserve leader James Bullard also said that the most likely scenario is inflation remaining above 2%, so the policy rate will need to be higher for longer. Recently, Richmond Federal Reserve President Thomas Barkin mentioned that it "makes sense" to steer more deliberately as the Fed works to bring inflation down.
As a result, the US Dollar Index (DXY) dropped the most in a week to refresh the seven-week low.
On the other hand, WTI crude oil renewed its weekly high around $79.35 before ending Thursday near $78.50. Even so, the black gold managed to print a four-day winning streak as broad-based US Dollar weakness joined the recent optimism surrounding China that suggests higher energy demand from the world’s biggest commodity user. It should be noted that Canada’s reliance on crude oil exports as the major earner make the Canadian Dollar (CAD) susceptible to Oil prices.
Against this backdrop, Wall Street managed to close in the green while the US 10-year and two-year Treasury bond yields refreshed monthly lows.
Looking forward, China trade numbers for December can offer immediate directions to the USD/CAD pair ahead of the preliminary readings of the US Michigan Consumer Sentiment Index (CSI) for January. Also important will be the news surrounding China and Fed moves.
Technical analysis
Sustained trading below the 100-day EMA, around 1.3430 by the press time, joins bearish MACD signals and downbeat RSI line to keep USD/CAD bears hopeful of visiting November 2022 low near 1.3230.
-
22:07
AUD/USD aims to test 0.7000 as US Inflation softens
- AUD/USD is aiming to kiss the psychological resistance of 0.7000 amid a decline in US CPI data.
- Lower gasoline and used car prices have softened the United States price index.
- Rising Australian inflation might compel the RBA to sound hawkish in its February monetary policy meeting.
The AUD/USD pair is struggling to extend its upside journey above the critical resistance of 0.6980 in the Asian session. The Aussie asset is expected to surpass the 0.6980 hurdle amid the risk appetite theme and may recapture the psychological resistance of 0.7000 ahead.
S&P500 ended on a positive note and recorded three consecutive bullish trading sessions on hopes of further deceleration in the pace of interest rate hikes by the Federal Reserve (Fed) after softening of United States Consumer Price Index (CPI) data. The 10-year US Treasury yields weighed down heavily to near 3.4% as US inflation trimmed in line with expectations.
The US Dollar Index (DXY) renewed its seven-month low at 102.86 as lower US inflation claims that the Fed is in the right direction and effectively fighting against stubborn inflation. Thanks to the lower gasoline prices and prices of used cars, which led to a meaningful fall in the price index. It is highly likely that the Fed will now consider further hiking will smaller rates, which might also provide a cushion to the slowdown in economic activities.
On the Aussie front, rising inflation is still causing worry for the Reserve Bank of Australia (RBA). Monthly inflation (Nov) climbed to 7.3% and retail demand has remained strong, which might force RBA Governor Philip Lowe to sound hawkish in its upcoming monetary policy scheduled in February.
Meanwhile, the recovery in Chinese economic growth after the reopening of the economy is providing strength to the Australian Dollar. It is worth noting that Australia is a leading trading partner of China and a recovery in Chinese economic prospects will also support the Australian Dollar.
-
21:42
GBP/USD Price Analysis: Bounces around the 20/200-DMAs, back above 1.2200
- GBP/USD reclaimed two daily moving averages, the confluence of the 20 and 200-day EMAs.
- A daily close of the GBP/USD above the 200-day EMA could open the door for further gains.
- Otherwise, the GBP/USD would be exposed to selling pressure, which might tumble to the 50-day EMA.
The GBP/USD soars above 1.2200, snapping two-consecutive days of losses, and gains 0.48%, as Wall Street finished Thursday’s session in the green. Therefore, the GBP/USD is trading at 1.2215, above its opening price, after hitting a daily low of 1.2084.
GBP/USD Price Analysis: Technical outlook
Thursday’s session witnessed the GBP/USD bouncing off the confluence of the 20 and 200-day Exponential Moving Averages (EMA) around 1.2095/1.2109, late in the New York session. Although a break of the 200-day EMA is supposed to shift the bias of an asset, at least three daily closes would cement the previously mentioned. Also, as long as the GBP/USD stays below last month’s high of 1.2443, the major would be exposed to some selling pressure.
Oscillators like the Relative Strength Index (RSI) remain in bullish territory, poised for further upside, while the Rate of Change (RoC) confirms volatility levels remain depressed.
If the GBP/USD would resume its uptrend, firstly needs to clear the 1.2300 figure. Once done, the next test would be the 1.2400. As an alternate scenario, if the GBP/USD dives below the 20-day EMA at 1.2094, that will put in play the 50-day EMA at 1.1987, but firstly, sellers will need to reclaim 1.2000.

GBP/USD Key Technical Levels
-
21:07
NZD/USD bulls take on 0.64 territories after US CPI event
- NZD/USD bulls move in on the countrterndline and 0.64 the figiure.
- US CPI sends the US Dollar lower, supporting risk appetite and NZD.
NZD/USD is ending the day some 0.5% higher after rallying from a low of 0.6304 to a high of 0.6417 on the day where sellers came in and faded the move back to test below 0.64 the figure. The US Dollar fell on the back of the Consumer Price Index data that came in as expected on the whole.
The data have helped cement expectations for a 25bp Fed hike next month, and the resulting drop in US bond yields has weighed on the greenback. The year-over-year CPI print landed at 6.5% or 0.6 of a percentage point cooler than the November number. The one exception was a positive surprise. On a monthly basis, the headline number actually decreased by a nominal 0.1% instead of remaining unchanged, as analysts expected.
''While this latest Kiwi rally is logical in that context, NZ policy expectations are fading too as markets ask can the Reserve Bank of New Zealand deliver another 75bp in February if the Fed only delivers 25bp, which may create NZD headwinds,'' analysts at ANZ Bank explained. ''It’s all part and parcel of what could be a messy year of non-synchronised global cycle turning points.''
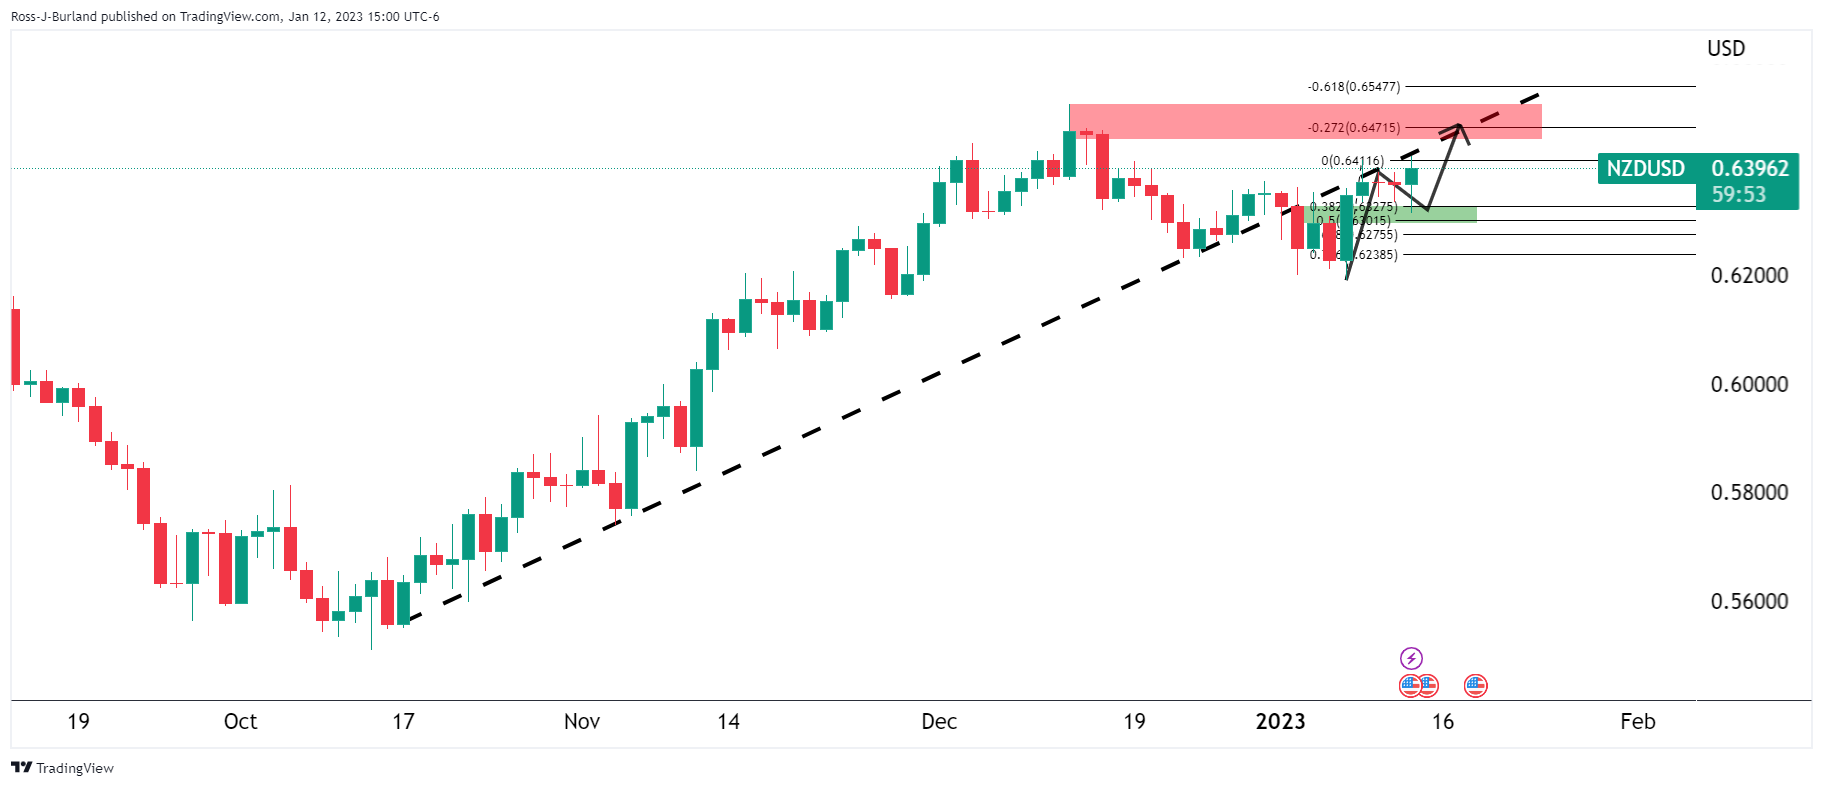
NZD/USD technical analysis
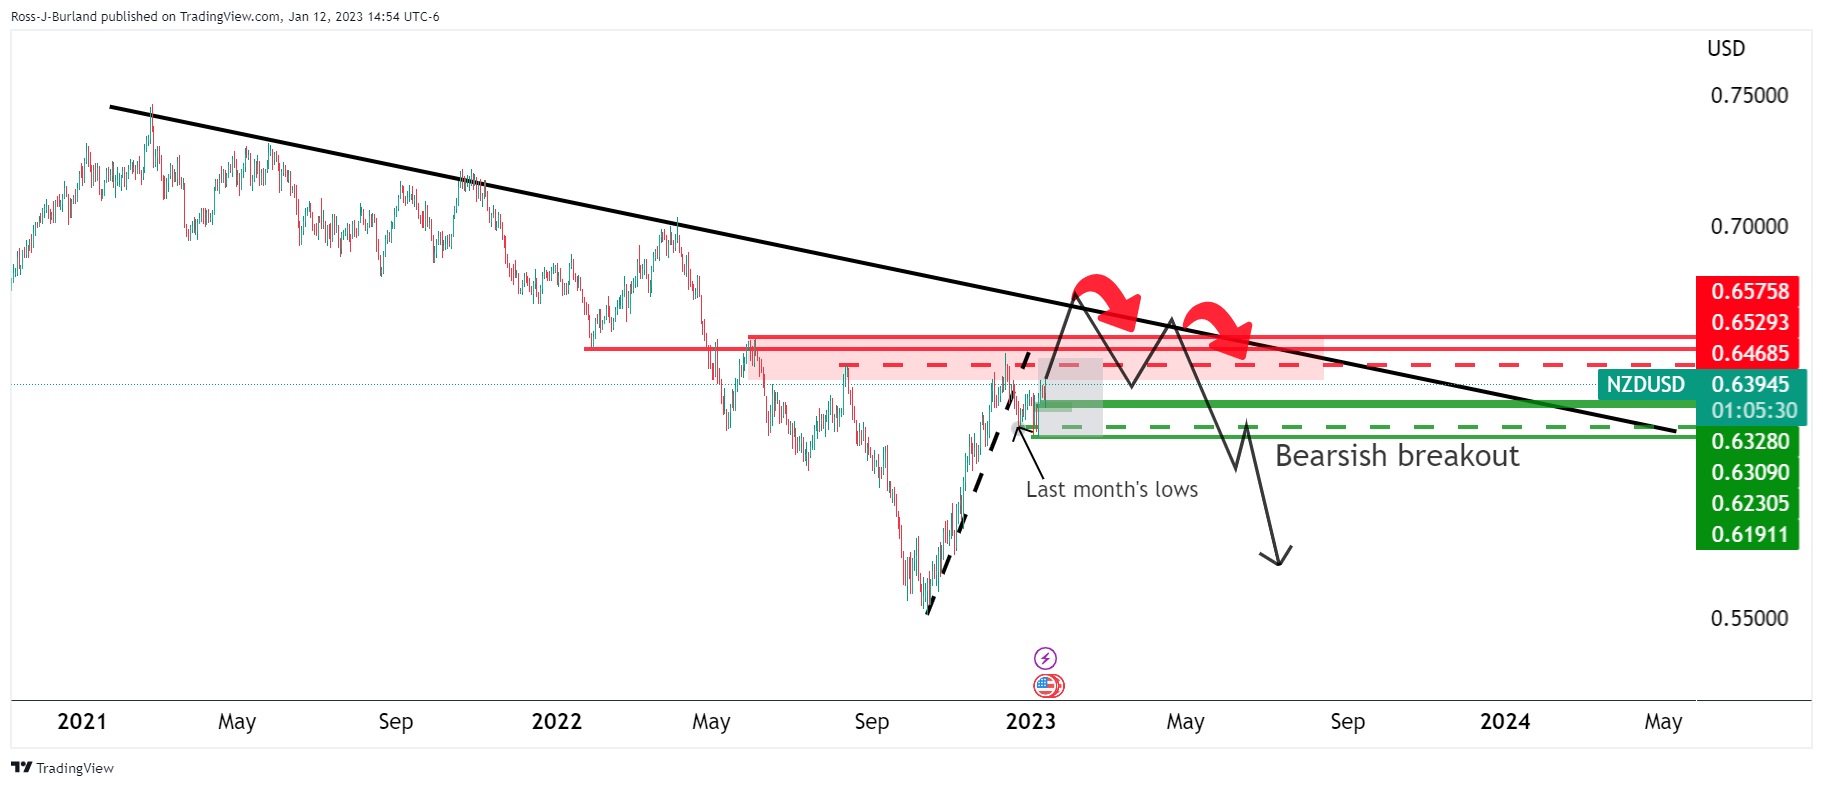
The price pulled in breakout traders on the move below last month;'s lows that are now being squeezed and moving out of their shorts. This leaves scope for a continuation to the upside with the trendline and horizontal resistances eyed. However, the bears could be encouraged to move in data discount and 0.6190 guards against a bearish breakout.
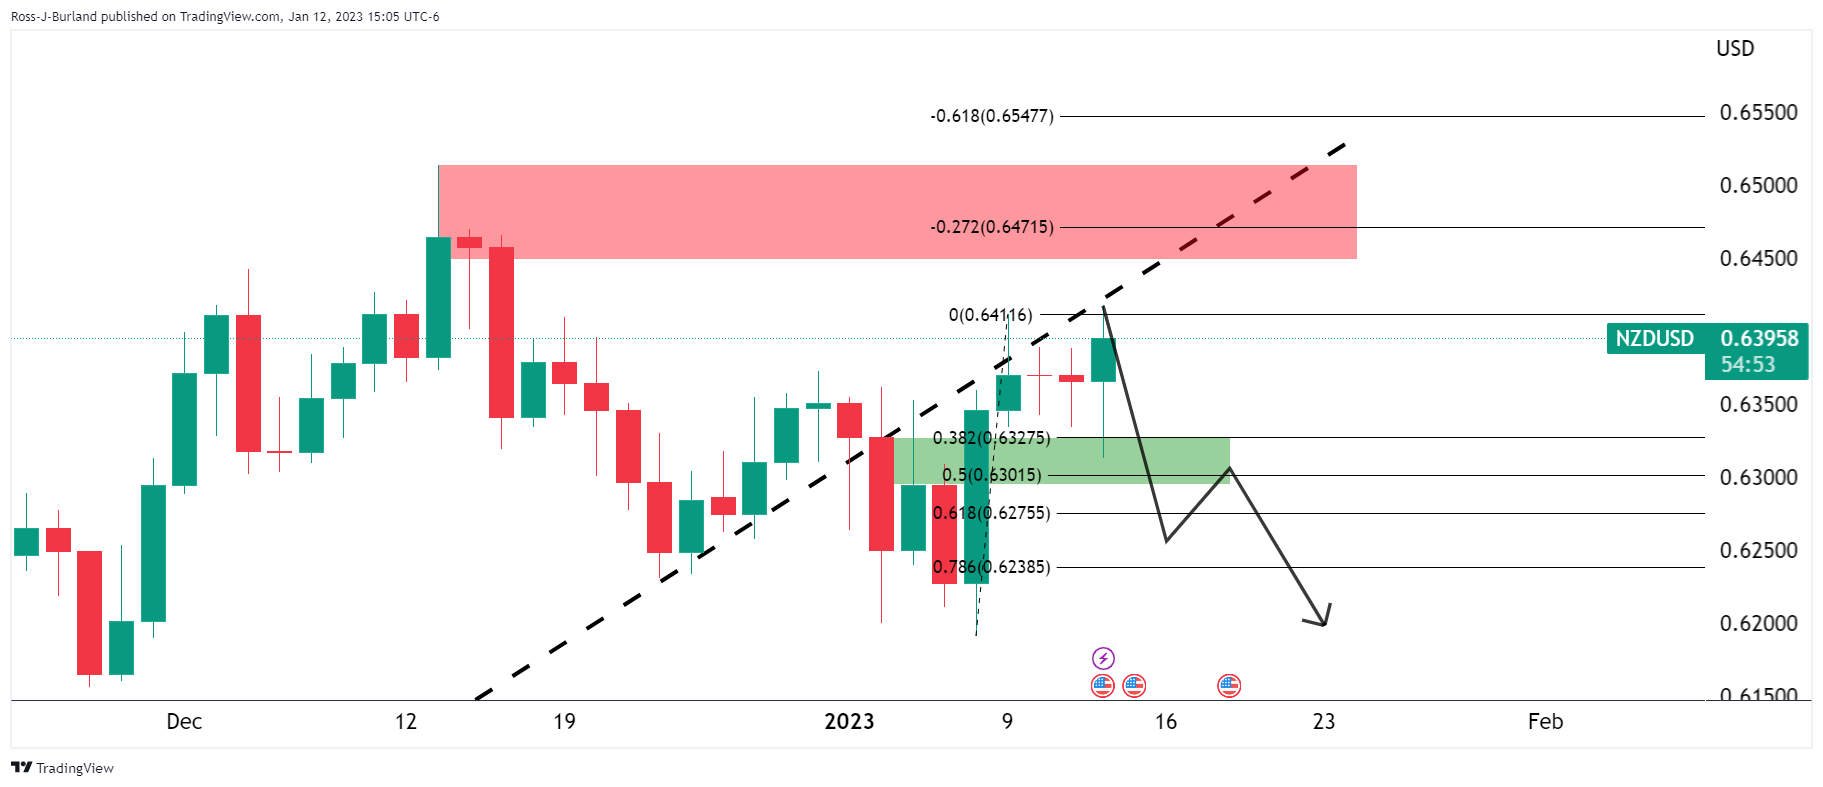
Nearer term, the price is supported by a 38.2% ratio and the neckline of the W-formation and the bulls eye the prior highs near 0.6470 and 0.6500 targets:

However, should the countertrend line resist and the CPI data prove to be only a temporary distraction from what some analysts argue a far more hawkish reality at the Fed, then a break of 0.6300 could be a significant bearish development for the weeks ahead:
Analysts at Brown Brothers Harriman argued that ''core PCE has largely been in a 4.5-5.5% range since November 2021 and we think the Fed needs to see further improvement before even contemplating any sort of pivot.''
''WIRP suggests a 25 bp hike February 1 is fully priced in, with nearly 30% odds of a larger 50 bp move. Another 25 bp hike March 22 is fully priced in, while one last 25 bp hike in Q2 is nearly 45% priced in that would take the Fed Funds rate ceiling up to 5.25%. However, the swaps market continues to price in an easing cycle by year-end and we just don’t see that happening.''
-
21:00
South Korea Export Price Growth (YoY) below expectations (5.6%) in December: Actual (3.1%)
-
21:00
South Korea Import Price Growth (YoY) registered at 9.1% above expectations (8.9%) in December
-
20:27
Argentina Consumer Price Index (MoM) climbed from previous 4.9% to 5.3% in December
-
20:25
United States 30-Year Bond Auction up to 3.585% from previous 3.513%
-
20:25
United States 4-Week Bill Auction increased to 4.37% from previous 4.1%
-
20:03
EUR/USD prints fresh bull cycle highs, on course for 5-day rally
- EUR/USD bulls take on fresh bull cycle highs but bears are lurking.
- US CPI weakened the outlook for the US Dollar but a cohort of Fed speakers remain hawkish.
- Breakout traders could be feeling the heat of a sizeable correction in the coming sessions.
EUR/USD has popped to a fresh bull high following the day's Consumer Price Index data that inspired a breakout in the US Dollar to the downside. At the time of writing, EUR/USD is up by some 0.8% at the time of writing. The Single Currency has rallied from a low of 1.0726 to a high of 1.0867 so far.
Consumer Price Index data came in as expected on the whole, besides the one exception on a monthly basis in the headline number. The year-over-year CPI print landed at 6.5% or 0.6 of a percentage point cooler than the November number. The one exception was a positive surprise. On a monthly basis, the headline number actually decreased by a nominal 0.1% instead of remaining unchanged, as analysts expected.
However, St. Louis Federal Reserve leader James Bullard, following today's Consumer Price Index, stated that the most likely scenario is inflation remaining above 2%, so the policy rate will need to be higher for longer. Richmond Federal Reserve President Thomas Barkin said the last three months' inflation prints have been a "step in the right direction," but cautioned that while the average has dropped the median has stayed high.
EUR/USD correction on the cards?
While the move in the US Dollar has been strong, there are prospects of a correction and that spells danger for the in-the-money-EUR/USD longs. After all, today's data does not mean monetary policy can stop tightening just yet. Following the release of the latest inflation data, Philadelphia Fed President Patrick Harker said the central bank [Federal Reserve] should lift rates at 0.25% increments. The next Federal Reserve Rate announcement occurs on February 1. ''Several Federal Reserve officials have indicated they would like to see rates slightly above 5.0% which indicates a further three 25bp lifts,'' analysts at ANZ Bank noted.
Analysts at TD Securities said that they continue to think that the market is too optimistic on the pace of the decline in inflation, although they argued that ''an on-consensus print does not change the bigger picture narrative of a USD struggle. We are at a different point of the Fed and inflation cycle that makes USD upside a fade.''
On the other side of the spectrum, analysts at Brown Brothers Harriman argued that ''core PCE has largely been in a 4.5-5.5% range since November 2021 and we think the Fed needs to see further improvement before even contemplating any sort of pivot.''
''WIRP suggests a 25 bp hike February 1 is fully priced in, with nearly 30% odds of a larger 50 bp move. Another 25 bp hike March 22 is fully priced in, while one last 25 bp hike in Q2 is nearly 45% priced in that would take the Fed Funds rate ceiling up to 5.25%. However, the swaps market continues to price in an easing cycle by year-end and we just don’t see that happening.''
EUR/USD technical analysis
Breakout traders are triggered in and while there is scope for the upside, a correction could be on the cards that will tap into the in-the-money-longs and potentially ignite a capitulation of the bulls.
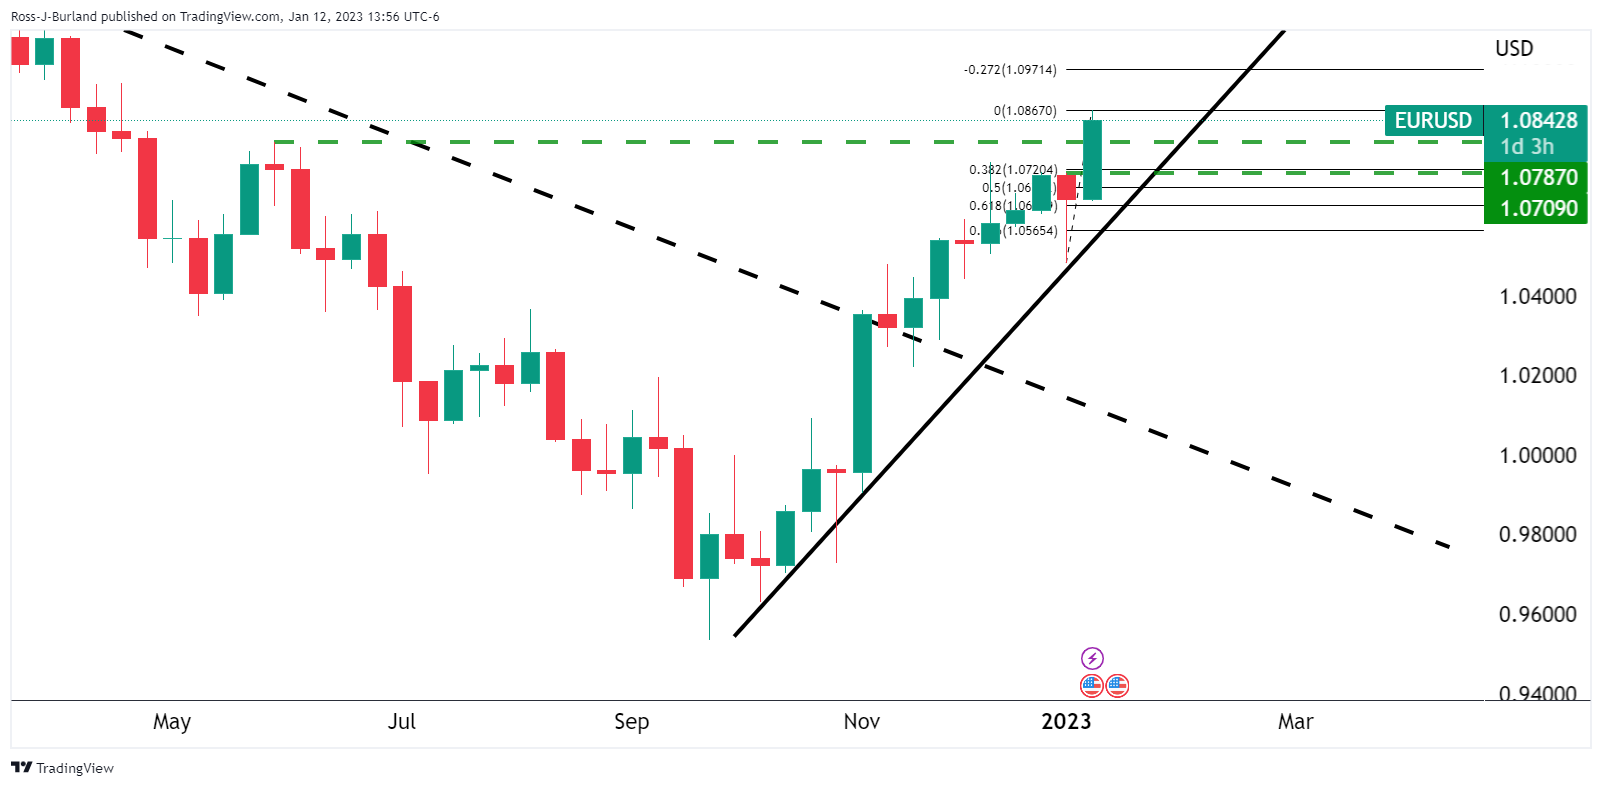
This puts the downside thesis into play as follows:
The W-formation, while overextended, is still within the parameters of being bearish and that puts the 1.0720s in focus for the meanwhile. A break there opens risk to the trendline support further ahead.
-
19:49
Forex Today: US Dollar collapses amid Fed seen hiking rates by 25 bps from now on
What you need to take care of on Friday, January 13:
Financial markets spent the first half of the day extending their previous consolidative phase, finally exploding with the release of the United States Consumer Price Index (CPI). The US CPI rose at an annual pace of 6.5% as expected in December, while core price pressures were up by 5.7%, in line with the market forecast. On a monthly basis, inflation contracted 0.1%, while the core reading met expectations, up 0.3%.
Signs of easing price pressures in the world’s largest economy coupled with comments from US Federal Reserve officials.
The first one was US Federal Reserve Bank of Philadelphia President Patrick Harker, saying that “the worst of the inflation spike is likely past now,” adding that the time of super-sized rate hikes has passed, and it’s time to switch to 25 basis points (bps) increments. The Greenback sunk with his comments as Wall Street soared, although volatility dominated the American session.
Then, St. Louis Federal Reserve leader James Bullard spoke and noted that the most likely scenario is inflation remaining above 2%, so the policy rate will need to be higher for longer. Finally, Richmond Federal Reserve President Thomas Barkin said that it "makes sense" to steer more deliberately as the Fed works to bring inflation down.
Market ignored other positive news, but were there to support the optimism. During Asian trading hours, the Bank of Japan (BoJ) announced it would investigate the consequences of its ultra-easy policy. Market players read it as a potential shift in the central banks’ monetary policy. Additionally, China re-started imports from Australian coal, after banning them in the early stages of the COVID-19 pandemic. Later in the day, market talks suggested the United Kingdom and the Euro Zone will start talks to end the Brexit clash and reach a final deal.
The EUR/USD pair trades around 1.0840, while GBP/USD stands at 1.2210, not far below fresh multi-month highs. Commodity-linked currencies also rallied, with AUD/USD now changing hands at 0.6970 and the USD/CAD pair down to 1.3350. Finally, USD/JPY hovers around 129.30, after bottoming at a fresh multi-month low of 128.86.
Spot gold flirted with the $1,900 level, ending the day at around $1,896 a troy ounce. Crude oil prices were also up, with WTI settling at $78.70 a barrel.
Crypto crimes hit eye-popping numbers, $20 billion worth of cryptocurrencies lost to hacks and exploits
Like this article? Help us with some feedback by answering this survey:
Rate this content -
19:29
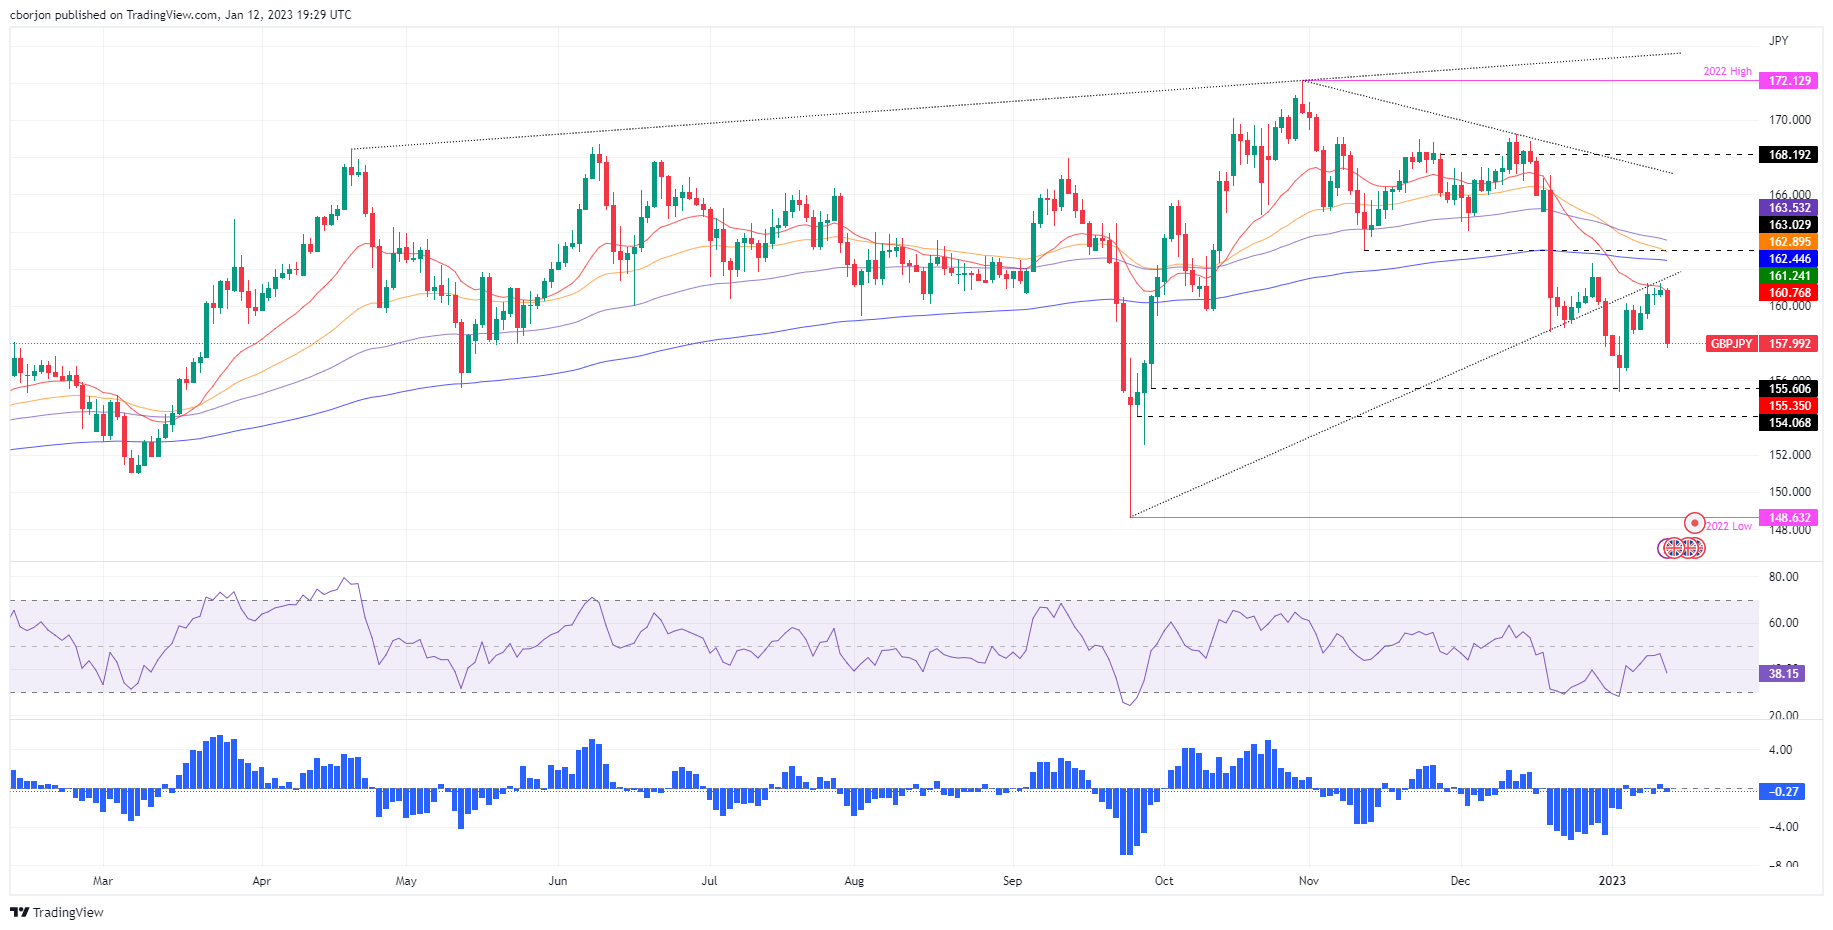
GBPJPY Price Analysis: Rejected around 161.00, nosedives towards 158.00
- GBP/JPY collapsed at the confluence of two resistance levels, around 161.00.
- GBP/JPY Price Analysis Remains downward biased, and it could test 155.00 once it reclaims the YTD low of 155.35.
The GBP/JPY dropped to fresh weekly lows of 157.72 after a cooler-than-expected US inflation report, which spurred safe-haven flows in the FX space amidst an upbeat market sentiment. From a technical perspective, the GBP/JPY stalled around the 20-day Exponential Moving Average (EMA) at 160.75 and dropped some 300 pips. The GBP/JPY is trading at around 158.00
GBP/JPY Price Analysis: Technical outlook
From a daily chart perspective, the GBP/JPY remains downward biased. After registering four days of successive days trading with gains, a fundamental news catalyst and solid resistance at the 20-day EMA around 160.75 triggered a fall. Oscillators like the Relative Strength Index (RSI) at bearish territory and continuing to aim lower support a possible test of YTD lows of 155.36. Also, the Rate of Change (RoC) shows that volatility has not picked up yet, which could refrain traders from opening new shorts positions in the GBP/JPY pair.
However, if the GBP/JPY continued to fall, its next support would be 157.00. A breach of the latter will expose the January 4 daily low of 156.49, followed by the YTD low of 155.35, and then the September 22 low of 152.54.
On the flip side, the GBP/JPY first resistance would be the January 4 daily high of 160.16, followed by the 20-day EMA at 160.76, and then the current week’s high of 161.21.
GBP/JPY Key Technical Levels
-
19:00
United States Monthly Budget Statement came in at $-85B below forecasts ($-70B) in December
-
18:35
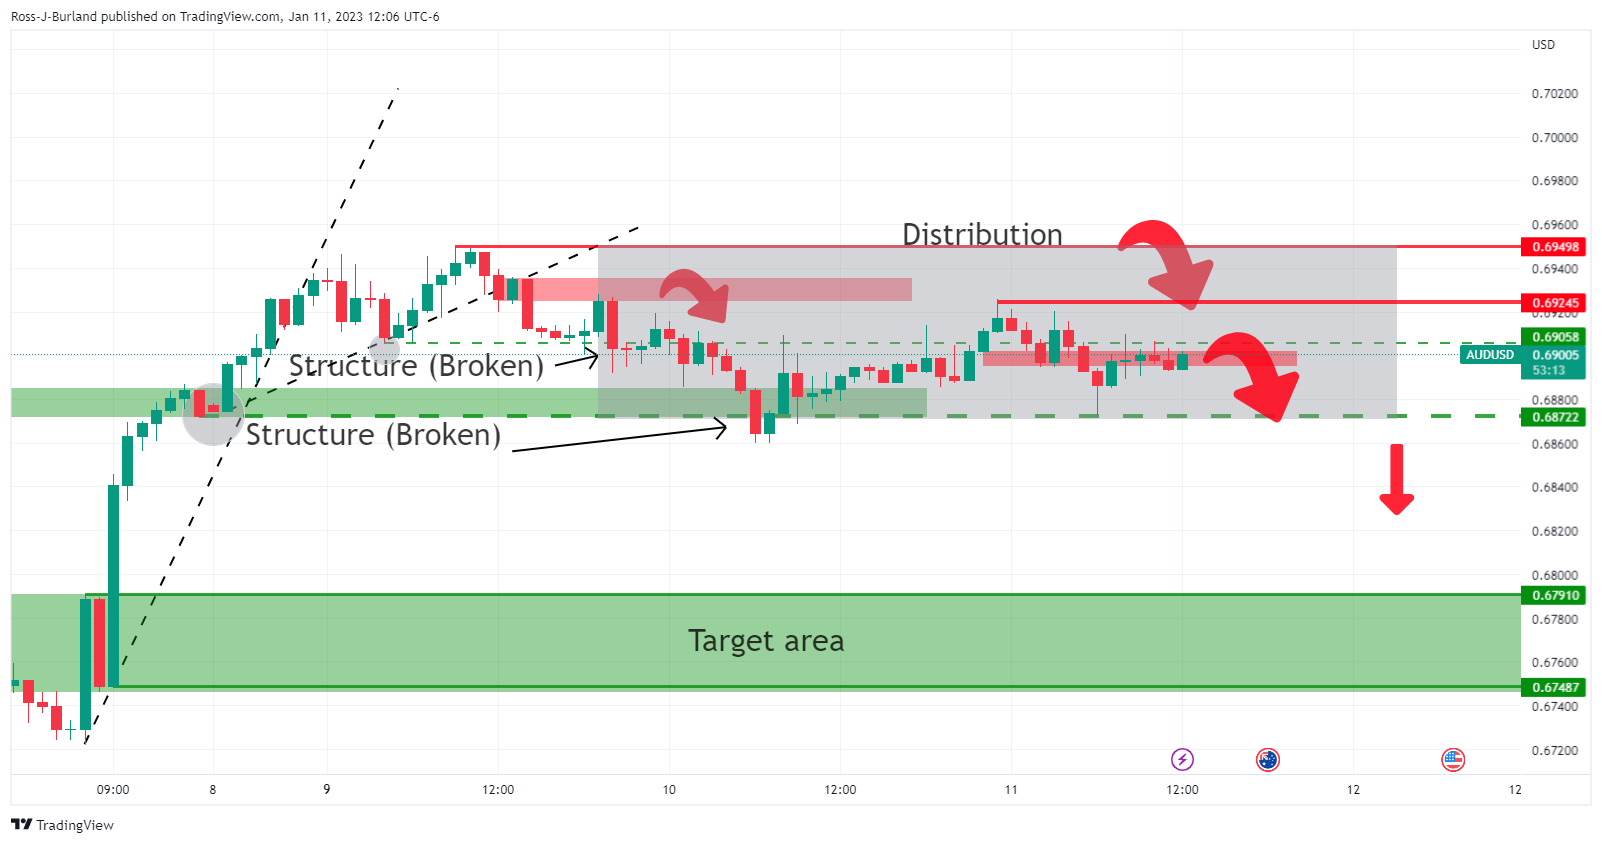
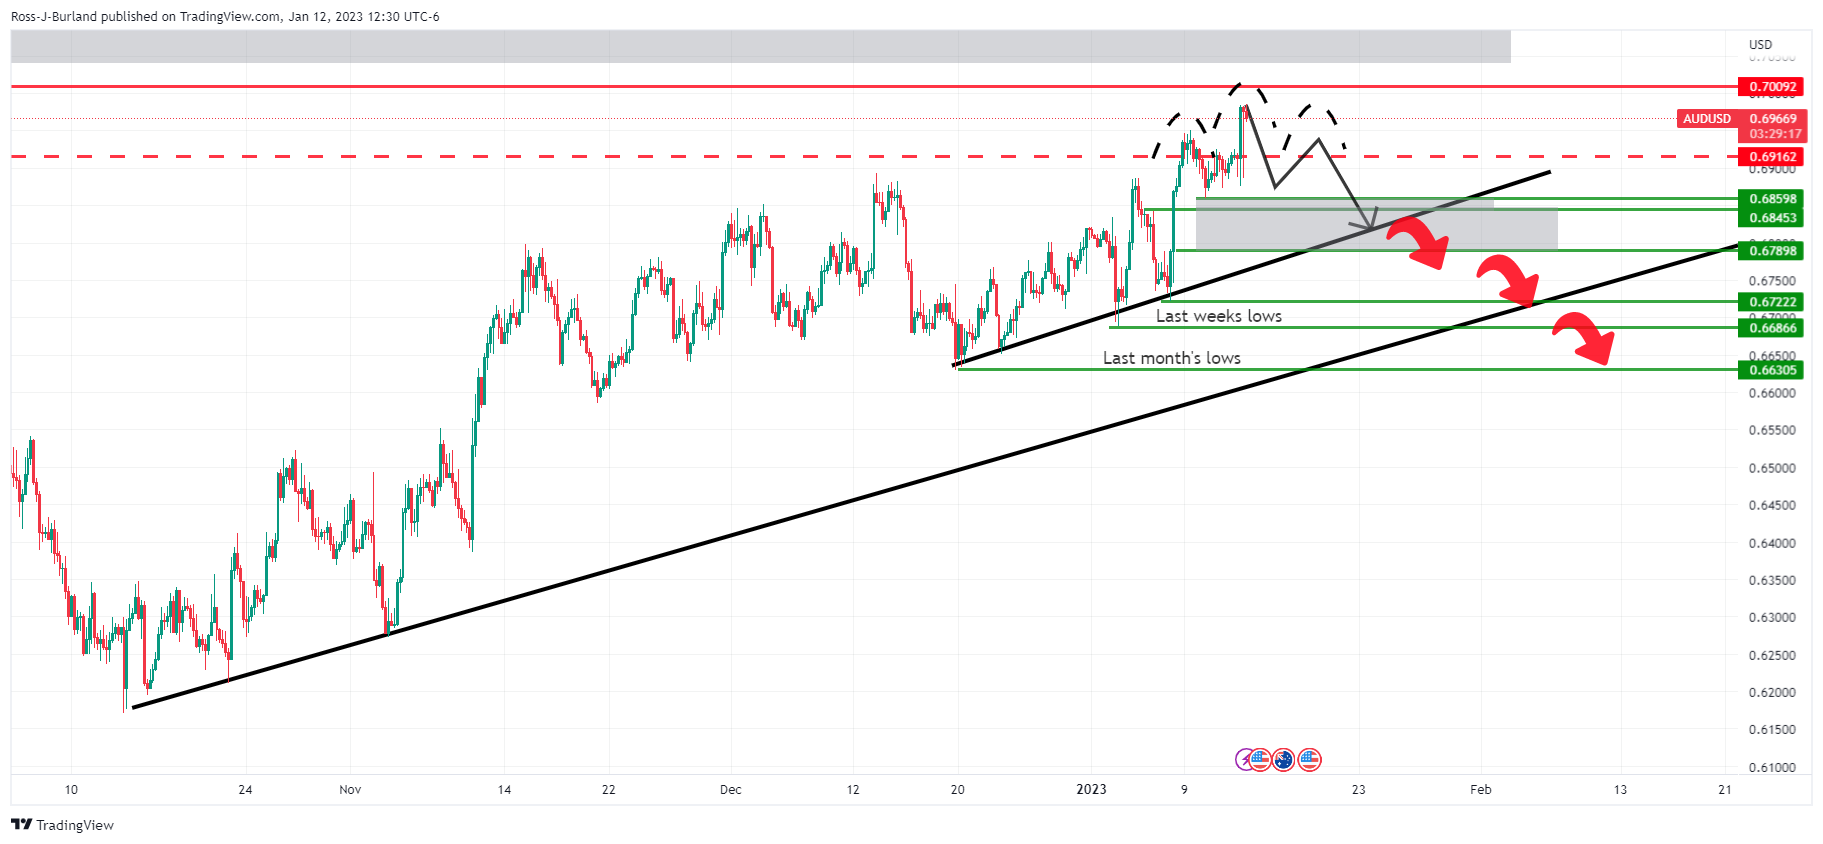
AUD/USD Price Analysis: Distribution and spring set, or bullish continuation?
- AUD/USD breakout traders target 0.70 the figure and above.
- Failures to hold in 0.7000 could lead to the capitulation of the bulls.
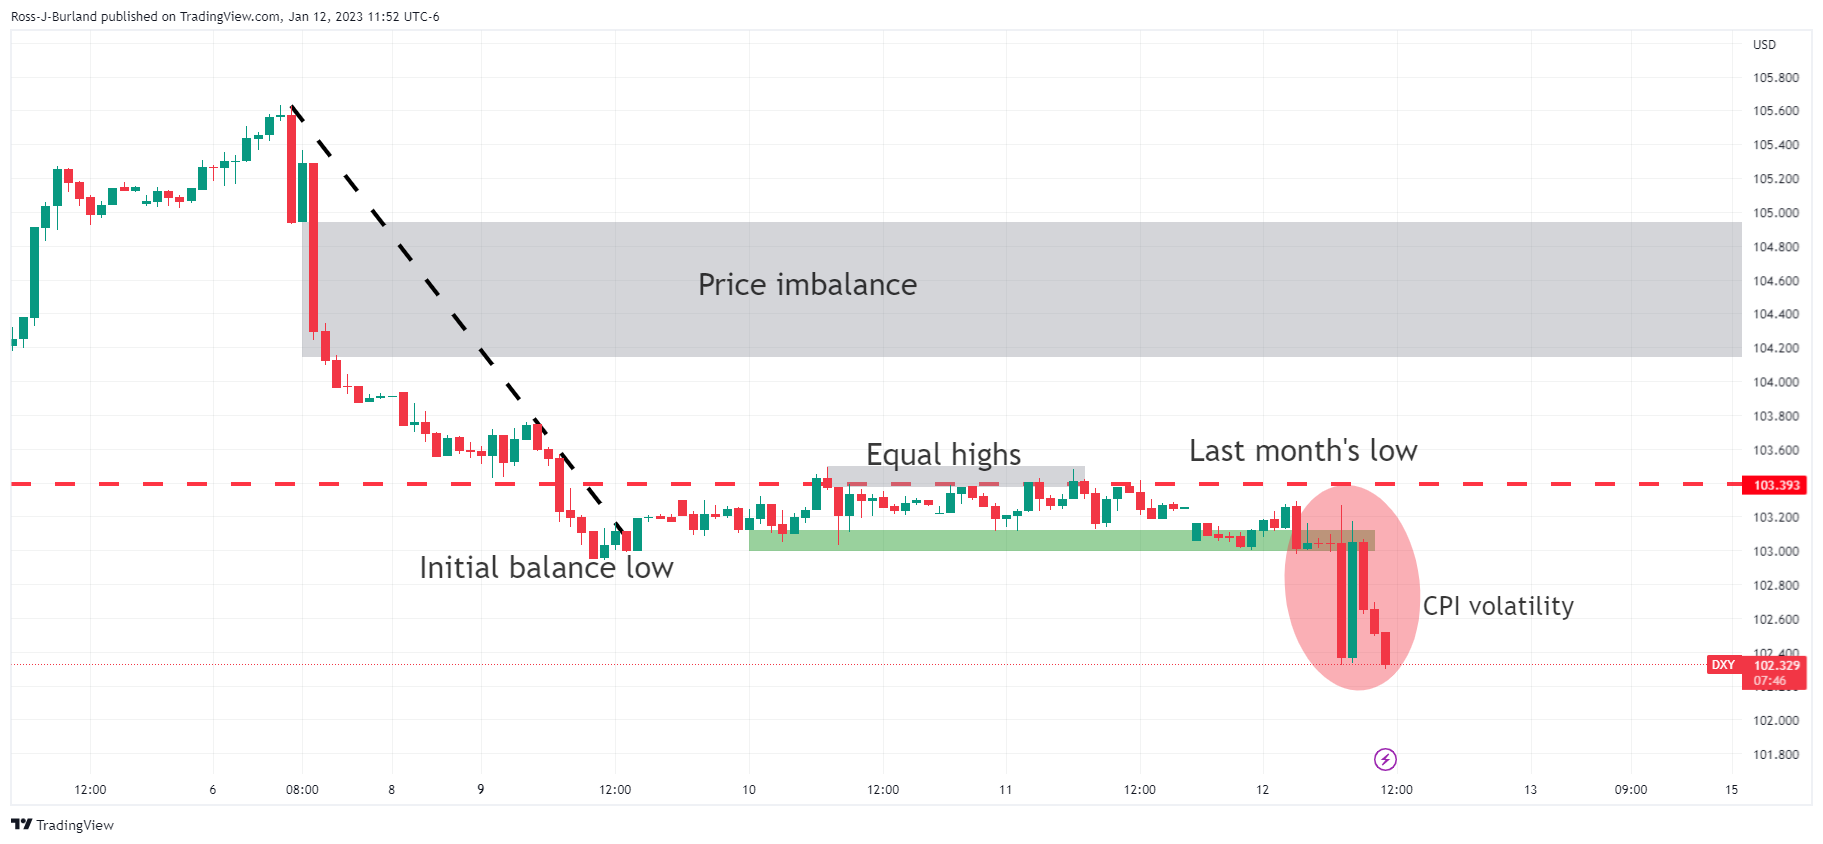
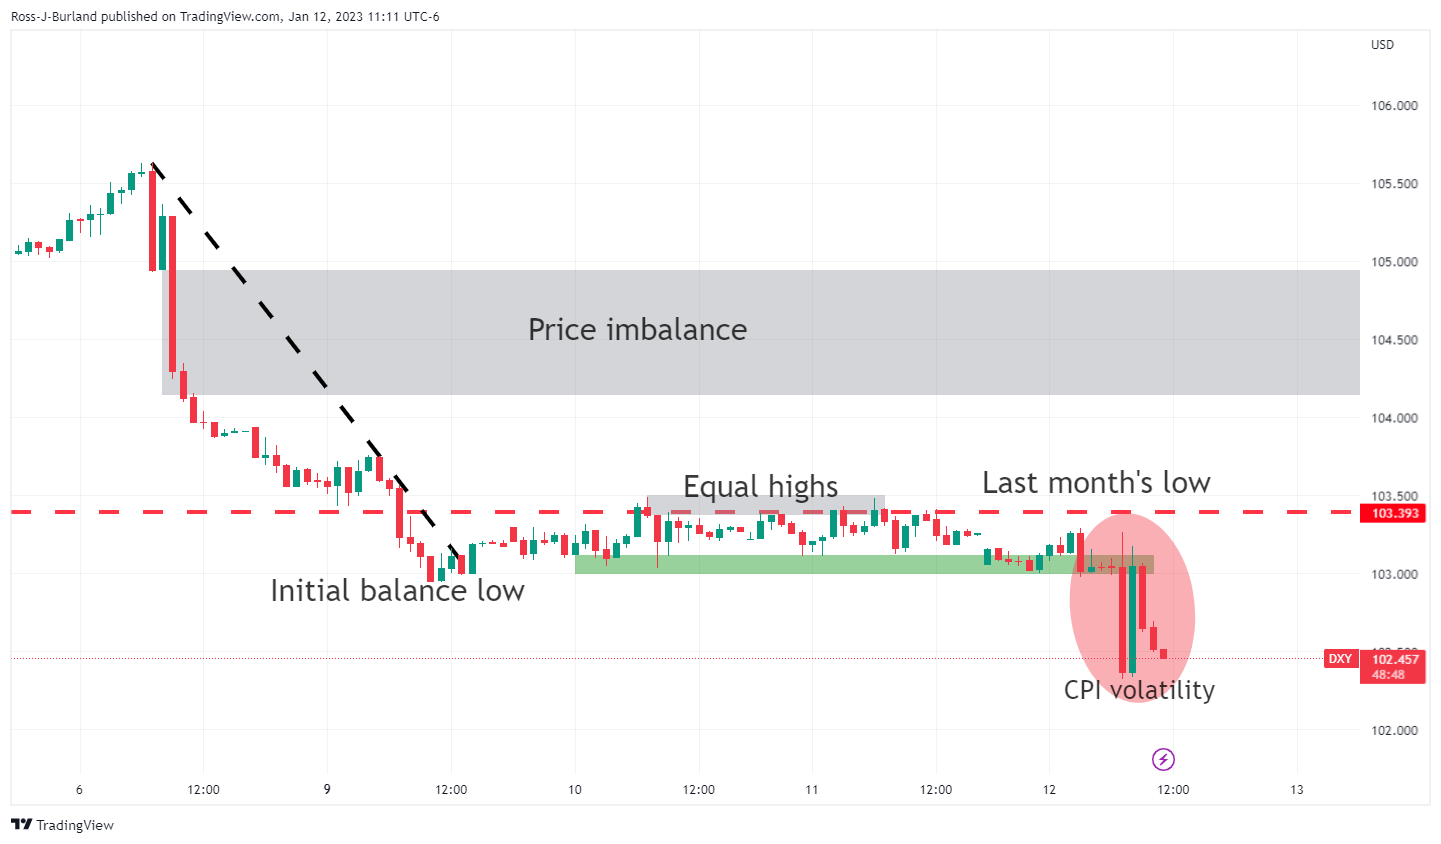
As per the prior analysis, AUD/USD Price Analysis: Distribution could be playing out into US CPI critical event, a thesis for the downside was illustrated leading up to the US Consumer Price Index event for a three-day set-up that had the downside-eyed should the bears crack the critical 0.68070 support structure and DXY move through key 103.00 and on to test the 103.50 equal highs.
AUD/USD prior analysis
It was stated that a move higher in the greenback would cement the bearish themes for a run towards 0.6750:
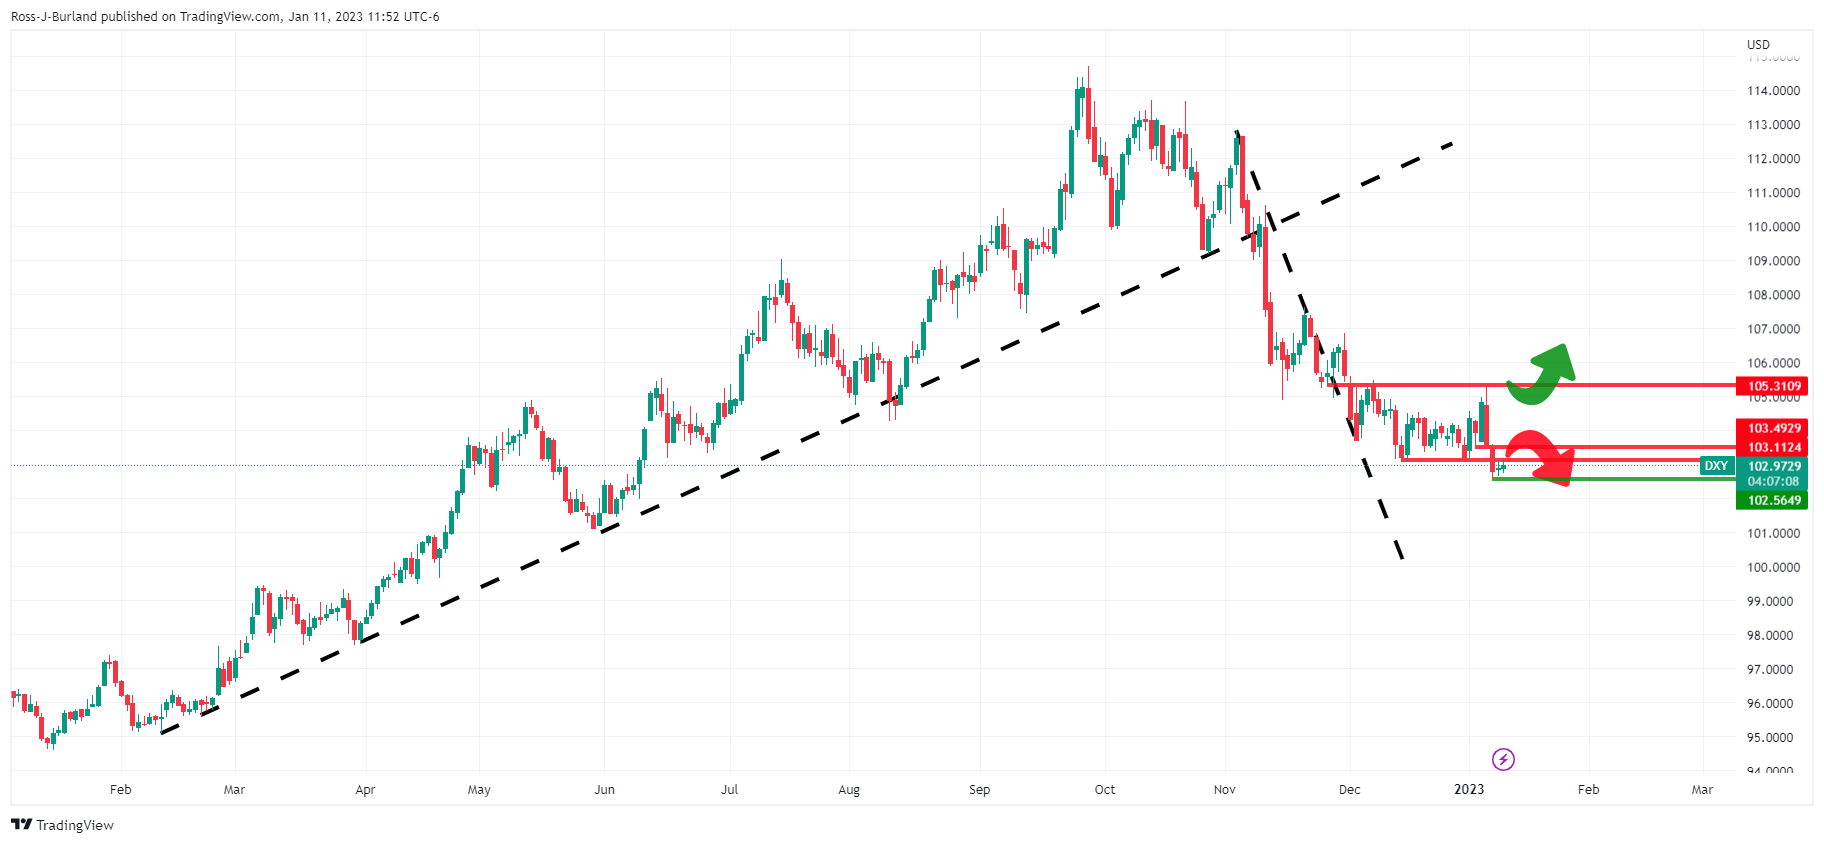
However, it was also warned that while the US Dollar's decline had been decelerating after moving to the backside of the bearish trendline, while below 105.31, the dominant bias was bearish:
AUD/USD and DXY update
The question now is whether or not what we are seeing is a bearish continuation in the greenback and bullish in AUD, or, from a technical perspective and applying the Wycoff / smart money concepts onto the charts, if this move today is the 'spring' and part of a wider schematic.
Looking at the AUD/USD schematic, while there is scope for a test of 0.7000, a valid case for the downside can also be made given the net length in the market vs.shorts. A pairing back of in-the-money-longs could be envisaged resulting in a retest to the trendline support as follows:
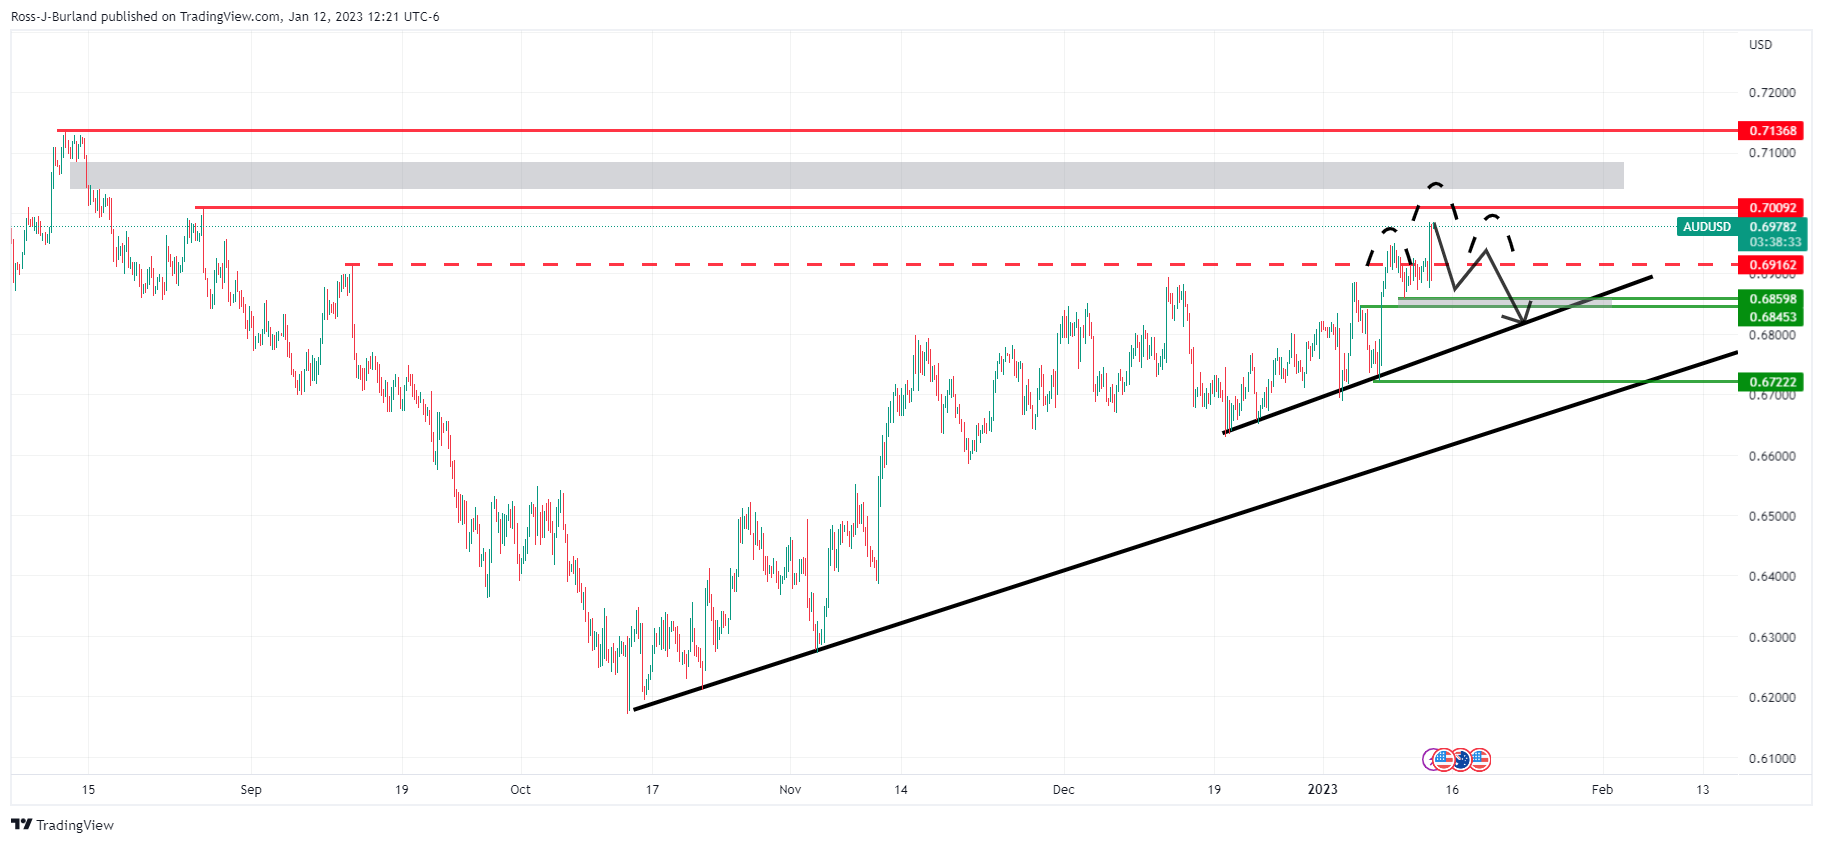
(AUD/USD H4 charts)
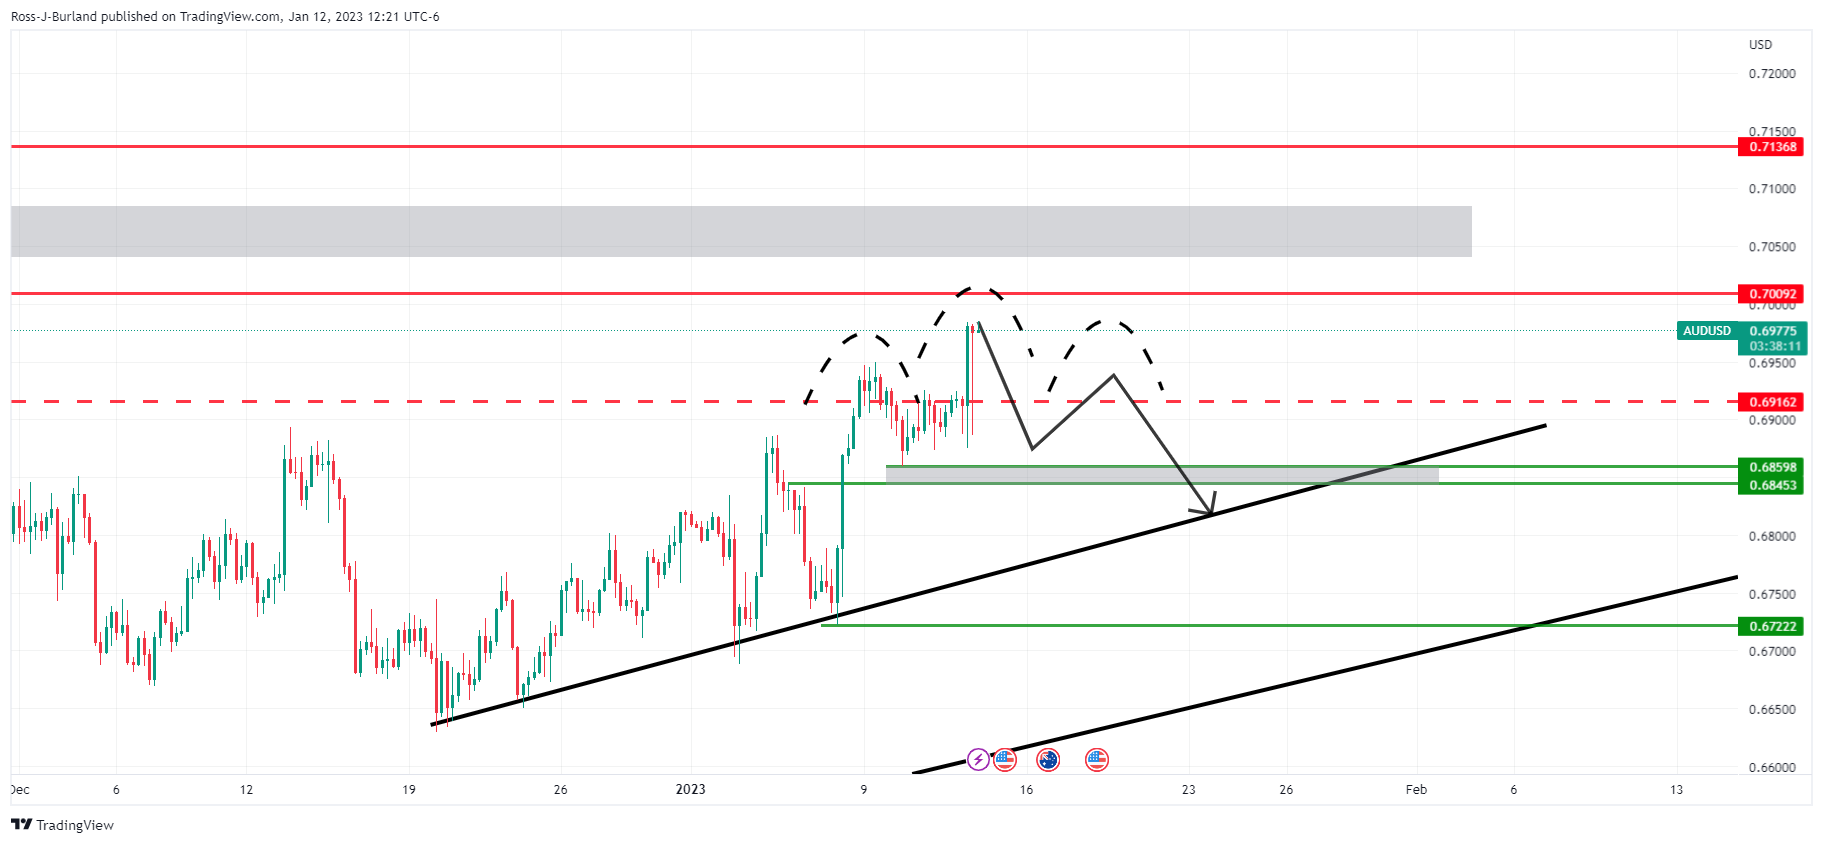
If this were the case, then the CPI volatility could be argued as being the spring of the distribution schematic:
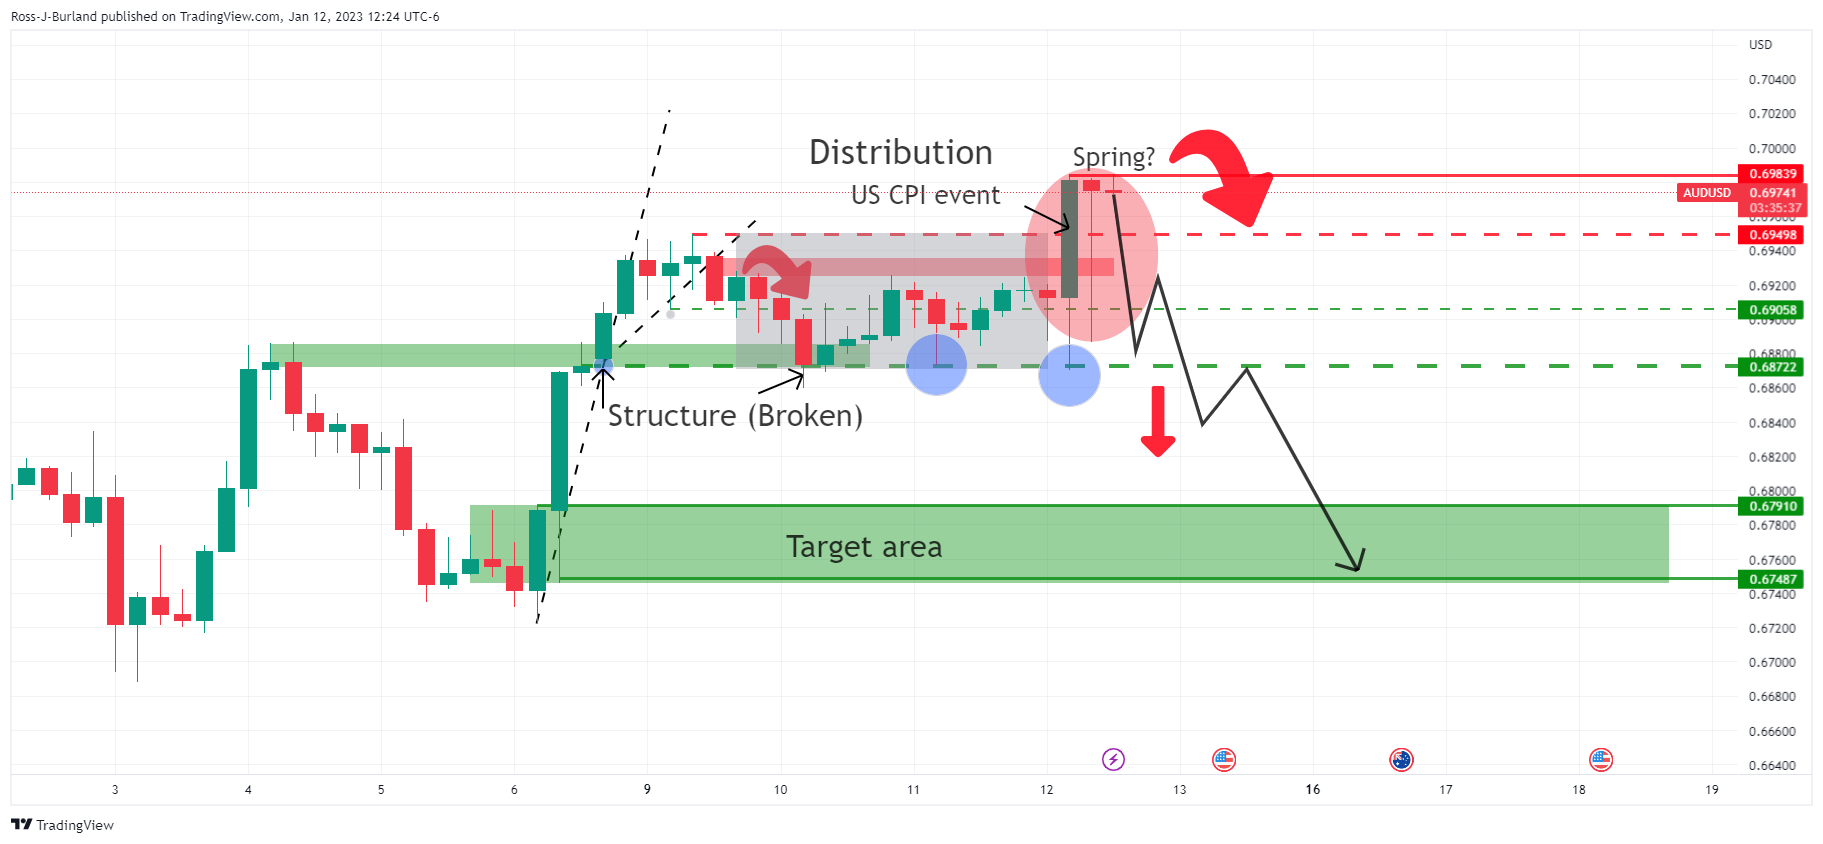
The trapped higher time frame breakout traders would be squeezed, forced to cut positions and adding to a fast capitulation of the bulls and leading to a downside breakout below 0.6870 key structure.
Such a move could even see a continuation towards last week's lows:
-
17:59
Bank of England's Mann: Underlying UK inflation dynamic looks pretty robust
Bank of England policymaker Catherine Mann said on Thursday that the underlying UK inflation dynamic looks pretty robust.
More to come...
-
17:57
WTI climbs but stalls at $79.00 amidst a soft US Dollar after US inflation data
- WTI got bolstered by a soft US Dollar, though it struggled to break above solid resistance.
- The deceleration in US Consumer Price Index (CPI) and expectations for a Fed pivot can underpin WTI prices.
- WTI Price Analysis: Faces a wall of resistance around $79.00.
Western Texas Intermediate (WTI), the US crude oil benchmark, advanced 0.98% on Thursday and extended its gains to two consecutive days, though it is clashing around technical indicators after releasing crucial US inflation data. At the time of writing, WTI is trading at around $78.40 per barrel.
The US Consumer Price Index (CPI) for December dipped 0.1%, as reported by the Department of Labor (DoL), suggesting that the US Federal Reserve (Fed) could slow down the pace of rate increases, a headwind for the greenback. Therefore, oil prices increased, as a weaker US Dollar would benefit crude buyers.
Another factor that bolstered WTI is China’s reopening after authorities removed Covid-19 zero-tolerance policies.
Sources cited by Reuters commented that a soft landing in the US and maybe worldwide, combined with China’s economic rebound, could make for a much better year than feared by most street analysts. Hence, oil demand could rise, and WTI prices would remain elevated unless the output is increased.
Oil traders are also bracing for an additional curb on Russian oil supply, as sanctions over its invasion of Ukraine are pending to begin. The EU ban on importing petroleum products from Russia will start on February 5, and according to the US EIA office, “it could be more disruptive than the EU ban on importing crude oil from Russia.”
WTI Price Analysis: Technical outlook
From a daily chart perspective, WTI is neutral to downward biased, albeit extending its gains to almost $4 in the last couple of days. WTI’s inability to crack the confluence of a two-month-old downslope trendline and the 50-day Exponential Moving Average (EMA) around $79.00 could exacerbate a retracement, at least to the 20-day EMA at $76.79. However, if WTI breaks above the former, it can rally toward $80.00. On the flip side, once it clears $78.00, that could pave the way toward the $76.00 figure.
-
17:54
Fed's Barkin: Cautions that while the average CPI has dropped the median has stayed high
Richmond Federal Reserve President Thomas Barkin said on Thursday, that it "makes sense" to steer more deliberately as the Fed works to bring inflation down.
His comments are coming through following today's Consumer Price Index data that came in as expected on the whole, besides the one exception on a monthly basis in the headline number.
''The last three months' inflation prints have been a "step in the right direction," he said. But he cautions that while the average has dropped the median has stayed high.
US Dollar update
The US Dollar is falling to the lowest levels for several months and is printing a fresh low for the session following the CPI event.
-
17:12
Fed's Bullard: Policy rate will need to be higher for longer
St. Louis Federal Reserve leader James Bullard, following today's Consumer Price Index data that came in as expected on the whole, besides the one exception on a monthly basis in the headline number, stated that the most likely scenario is inflation remaining above 2%, so the policy rate will need to be higher for longer.
Key comments
Looks like we had above-trend rate of economic growth in Q4 2022.
US households still remain flush.
That should support consumption spending this year.
Better global prospects this year than just a few weeks ago.
Global growth prospects have brightened in last few weeks.
Hard to see how unemployment is going to go up; labor market is strong.
Inflation remains extremely high even after today's CPI data.
It is still well above fed's target but it is moderating.
Fed's policy has kept inflation expectations under control.
I expect inflation to move down as we go forward; our policy has been the right one.
Fed needs to avoid repeat of the 1970s, must maintain rates at high enough levels to make sure inflation moves down.
Something north of 5% lowest level fed could use to credibly restrict inflation.
My preference is that if we are shooting for north of 5%, should get there as soon as possible.
Tactics aren't that don't matter that much in macro terms though.
Possibly too much optimism inflation will come easily back to 2%.
Core cpi has moderated but not as much as headline figure.
Dallas mean measure gives indication of how hard it will be to get inflation down to 2% in a reasonable time frame.
Today's cpi data was encouraging though that we are heading in right direction.
Most likely scenario is inflation number will remain above 2% and so policy rate will need to be higher for longer
We are really moving into an era of higher norminal interest rates for quite a while moving forward to get inflation back to target.
Measures of financial stress remain at relatively low levels.
Recession risks has receded some over the last 3 months.
Prospects for a soft landing have improved.
We will have to stay higher for longer to avoid repeat of 1970s.
I like frontloading policy.
I don't see purpose in dragging things out.
Direct correlations between money growth and inflation not strong enough to rely on.
However is a good, indicative sign.US Dollar update
The US Dollar has dropped on the back of the CPI data. The year-over-year CPI print landed at 6.5% or 0.6 of a percentage point cooler than the November number. The one exception was a positive surprise. On a monthly basis, the headline number actually decreased by a nominal 0.1% instead of remaining unchanged, as analysts expected.
-
16:53
Fed: Even if FOMC delivers a downshift, it will continue tightening past the February meeting – Wells Fargo
The inflation numbers released on Thursday in the US increased expectations that the Federal Reserve will shift from 50 basis points rate hikes to 25 bps hikes. Analysts at Wells Fargo warn that despite the fact that inflation has clearly slowed from its pace earlier in 2022, they doubt the FOMC is ready to declare mission accomplished.
A trend, but not mission accomplished
“Headline inflation has fallen by 2.6 percentage points since June, and the annualized run rate over the past three months is just 1.8%, demonstrating further slowing is still to come in the year-ago change. Additional progress should be made in the coming months as goods inflation remains soft and the lagged effect of slower housing cost growth eventually flows through to the CPI data. As a result, the days of 75 bps rate hikes from the FOMC appear to be well in the rearview mirror.”
“While Fed officials have acknowledged the recent progress and should welcome this report, like us, they remain skeptical that inflation will easily settle back down to 2% past the correction in goods and housing. The increasingly compelling evidence of slowing inflation brought by today's report ups the chance that the FOMC will hike the fed funds rate by just 25 bps at its next meeting, but with the trend in inflation still above target, we expect that even if the FOMC delivers a downshift in pace, it will continue tightening past its next meeting.”
-
16:45
US: December CPI should give the Fed confidence to downshift to a 25bp hike – ABN Amro
Data released on Thursday in the US confirmed a slowdown in inflation, with the annual CPI rate falling to 6.5%, the lowest level since October 2021. Bill Diviney, Sr. Economist at ABN – AMRO points out that falling inflation paves way for a 25bp Federal Reserve interest rate hike, instead of a 50 bps hike.
Key quotes:
“The fall was driven largely by further pass-through from lower oil prices to petrol prices, but continued falls in used car prices, and weak medical services inflation, were also a drag. Shelter inflation, and other components of services inflation in contrast remained elevated, as expected.”
“Inflation continues to trend lower in line with our base case, and this should give the Fed the confidence to further downshift to a 25bp hike when the FOMC next meets in early February. In the near term, we expect a renewed drag on headline inflation from falling utility gas prices – reflecting the mild winter and falling wholesale gas prices.”
“For core inflation, while annual inflation should continue to decline, we may see some near term pickup in m/m price growth, as a significant drag in recent months has come from falling wholesale prices for used cars, which for now looks to have stabilized.”
-
16:40
USD/CAD dives below the confluence of the 20-DMA and 1.3400 after soft US CPI
- USD/CAD drops towards fresh seven-week lows around 1.3340s after US CPI data.
- US CPI was lower than expected, while Initial Jobless Claims continued to show a robust labor market.
- The US Dollar continued to weaken across the board, dropping to 6.5-month lows.
USD/CAD erases some of its losses spurred by a cooler-than-expected US inflation report that dragged the major towards its current weekly low of 1.3347, though it has recovered some ground at the time of typing. Hence, the USD/CAD is trading at 1.3397, below its opening price by 0.34%.
USD/CAD extended its downtrend to four consecutive days
US equities wobbled following the release of US inflation data. The US Bureau of Labor Statistics (BLS) revealed the Consumer Price Index (CPI) for December ticked lower at -0.1% MoM, below estimates of 0%, while annually based dropped to 6.5% from November’s 7.1%. The so-called core CPI, which excludes volatile items like food and energy, was aligned with estimates of 0.3% MoM, while year-over-year data dipped to 5.7% YoY, below the 6% foreseen.
After the headline crossed newswires, the US Dollar (USD) tumbled across the board due to growing speculations that the Federal Reserve further slowdown the pace of interest rate hikes. Therefore, the USD/CAD dived toward its daily/weekly low at 1.3350
At the same time, the Bureau of Labor Statistics (BLS) revealed that Initial Jobless Claims for the last week came softer at 205K, less than the 215K petitions expected by analysts, showing the labor market resilience.
Elsewhere, Philadelphia’s Fed President Patrick Harker said that 25 bps would be appropriate going forward after the release of the US CPI report. Harker commented that the time for super-size rate hikes has passed and expects a few more rate increases this year.
USD/CAD Key Technical Levels
-
16:38
USD/MXN Price Analysis: Mexican Peso hits fresh multi-year highs, starts looking at 18.50
- US Dollar extends slide versus Emerging Market currencies.
- Mexican Peso is at the highest level since February 2020.
- USD/MXN to remain under pressure below 18.90, despite oversold readings.
The USD/MXN is falling for the seventh time out of the last eight trading days and trades at the lowest level since February 2020, under 19.00. The pair bottomed at 18.81, before rebounding modestly.
A weaker US Dollar pushed USD/MXN further lower. Technicals also played a role in sending it to the downside. The pair was able to consolidate under the strong support (now resistance) area of 19.00/05.
Technical indicators, like the RSI below 30, are indicating oversold conditions. Despite that, the signs point to further losses. The next support area is seen at 18.75 and then comes the 2020 low near 18.50. A rebound, while contained under 19.15, should not change the current bearish bias for USD/MXN.
USD/MXN daily chart
-638091376749819412.png)
-
16:10
Silver Price Analysis: XAG/USD rejected again from above $24.00
- US Dollar tumbles and then soars after US CPI numbers.
- Volatile session across financial markets, US stocks back in positive ground.
- XAG/USD trims daily gains after being unable to hold above $24.00
Silver prices soared after the release of US inflation data but then pulled back amid a recovery of the US Dollar. XAG/USD peaked at $24.17, the highest level in a week and then pulled back all the way down to the $23.60 zone. It is hovering around $23.75, positive for the day but off highs.
The US Consumer Price Index fell in December 0.1% and the annual rate slowed to 6.5% from 7.1%, reaching the lowest level since October 2021. The number came in line with expectations and contribute to anchor expectations for shift in Federal Reserve rate hike to 25 basis points increments.
US yields tumbled after the report boosting Gold prices that helped also Silver. Following Wall Street’s opening bell market sentiment deteriorated and yields rebounded, triggering a retreat in XAU/USD and XAG/USD.
Silver prices again were rejected from above $24.00. A consolidation above that area could open the doors to further gains. The next resistance is at $24.20 followed by $24.55 (Jan 3 high).
Initial support emerges at the 20-day Simple Moving Average (SMA), near $23.60; below an uptrend line emerges around $23.35. A break below $23.30 could trigger a bearish acceleration, exposing $23.00.
Silver 4-hour chart
-638091365728549139.png)
-
16:00
AUD to be well supported this year on the back of Australian economy resilience – Rabobank
Australia will steer clear of recession in the foreseeable future, in the view of economists at Rabobank. Thus, the Aussie is expected to be resilient this year.
GBP/AUD to drop under 1.70 over coming months
“We expect the AUD to be well supported this year on the back of a relatively good growth outlook and have been targeted a move by GBP/AUD below 1.70 on a 12-month view. However, Australian/Chinese relations are likely to remain a dicey subject.”
“While the Australian economy is expected to slow overall this year, recessionary risks appear low. This should increase the resilience of the AUD and provide insulation against headwinds implied by forecasts of a slowdown in global growth.”
“Weaker global growth is traditionally a bearish factor for the AUD given its links with commodity prices. That said, we view the AUD as less likely to be swayed by speculative flows given that Australian no longer had a current account deficit and given that the narrowing of interest rates spreads between Australian and US interest rates.”
-
15:32
EUR/CHF could extend its advance back to levels between 1.02 and 1.04 – MUFG
EUR/CHF climbs back above parity. Economists at MUFG Bank believe that the pair could climb as high as 1.04.
SNB is becoming more tolerant of a weaker CHF
“The SNB has confirmed that it has been intervening to support the Franc recently to prevent a sharper move lower from reinforcing upside inflation risks. Yesterday’s move higher could then encourage speculation that the SNB is becoming less concerned by upside inflation risks and more tolerant of a weaker CHF.”
“The favourable growth developments should encourage the ECB to keep tightening policy at a faster pace at upcoming policy meetings when we expect the policy rate to reach 3.00% by the end of Q1. It leaves room for EUR/CHF to extend its advance back to levels recorded in the 1H of last year when it was trading between 1.0200 and 1.0400.”
-
15:30
United States EIA Natural Gas Storage Change registered at 11B above expectations (-13B) in January 6
-
15:06
GBP/USD turns negative from four-week highs as Dollar erases US CPI losses
- US Dollar tumbles after CPI data, trims losses after Wall Street opening bell.
- Inflation confirms slowdown in the US, Fed’s Harker expects 25 bps hikes now.
- GBP/USD reveres sharply, drops below 1.2100.
On a volatile session for FX, the US Dollar has reversed sharply during the last hour and turned positive across the board. The GBP/USD peaked after the release of US inflation data at 1.2244, the highest level in four weeks and as of writing, it is trading below 1.2100, at the lowest since Monday.
Dollar tumbles then soars
Inflation data triggered a decline of the US Dollar that then recovered as equity prices in Wall Street dropped following the opening bell. The US Consumer Price Index fell in December 0.1% and the annual rate slowed to 6.5% from 7.1%, reaching the lowest level since October 2021.
Following the inflation numbers, Patrick Harker, President of the Federal Reserve Bank of Philadelphia, said it was time for future Fed rate hikes to shift to 25 basis points increments. His comments added fuel to the decline of the greenback as US yields sank.
Equity prices in Wall Street turned negative after the opening. The deterioration in market sentiment was accompanied by a rebound in US yields. The US Dollar reversed its course and rose sharply, erasing all US CPI-losses.
The GBP/USD is struggling to hold above 1.2100 as markets continue to digest CPI numbers and the Dollar keeps looking for a direction. The Pound also weakened during the last hour versus the Euro, with EUR/GBP surging to 0.8890, the highest level since late September.
Technical levels
-
15:05
S&P 500 Index: Break above 4020 to open up 4218 – SocGen
S&P 500 has carved out a higher trough at 3765 as compared to the one in October at 3490. A break past 4020 could open up additional gains towards the 4128 mark, economists at Société Générale report.
First support aligns at 3875
“Multi month trend line at 4020 is first potential hurdle. Overcoming this can lead to an extended rebound towards 4120 and perhaps even towards the bearish gap last August near 4218.”
“Upper end of recent consolidation at 3875 is first support.”
-
15:03
USD/JPY tumbles after the release of US CPI, down at 130.40s
- US inflation cools down, sending the US Dollar tumbling across the board.
- Claims for unemployment in the US were less than estimates, portraying a robust labor market.
- Fed’s Harker: Time for the Fed to rate increases at a smaller size.
The USD/JPY snaps two days of gains and stumbles more than 200 pips on Thursday, following the release of US inflation data, which cooled down, while claims were lower than estimates. Hence, the USD/JPY is trading at 130.44.
The US Department of Labor revealed that headline inflation, also known as the Consumer Price Index (CPI) for December, decelerated as expected to 6.5% YoY from 7.1% in November. Meanwhile, the month-over-month data showed inflation reading at -0.1%, lower than the 0% estimated. In the meantime, excluding volatile items inflation data, so-called core CPI came at 5.7% YoY, below the 6% foreseen.
Once data was released, the USD/JPY dropped sharply, as data justified US Federal Reserve (Fed) downshift to 25 bps rate hikes as the Fed scrambles to curb high inflation. At the same time, the Bureau of Labor Statistics (BLS) revealed that Initial Jobless Claims for the last week came softer at 205K, less than the 215K petitions expected by analysts, showing the labor market resilience.
Aside from this, Philadelphia’s Fed President Patrick Harker said that 25 bps would be appropriate going forward after the release of the US CPI report. Harker commented that the time for super-size rate hikes has passed and expects a few more rate increases this year.
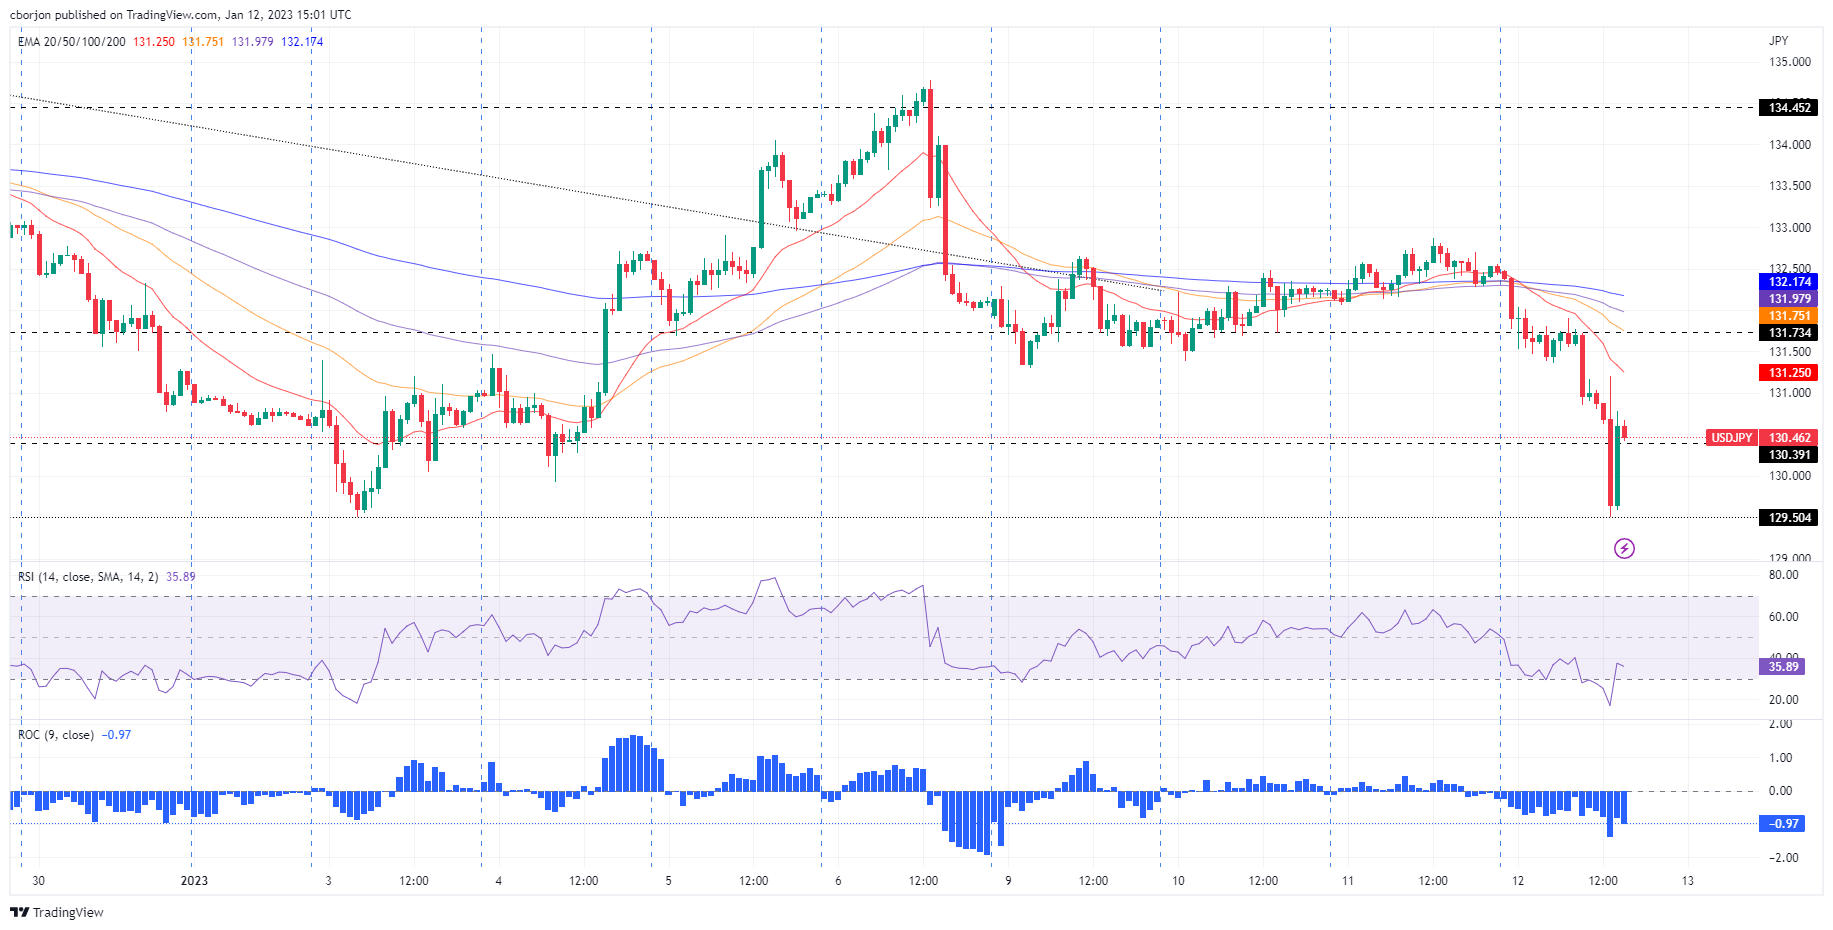
USD/JPY Price Analysis: Technical outlook
The USD/JPY 1-hour chart portrays the pair’s reaction to US data. On the release, it tested the YTD low of 129.50, though it resumed to the upside, but readings at the Relative Strength Index (RSI) and the Rate of Change (RoC), confirm that sellers are in charge. Hence, the USD/JPY might resume its downtrend.
The USD/JPY key support levels lie at 130.00, followed by the January 12 low of 129.49. On the flip side, the USD/JPY first resistance level is 131.00, followed by the 20-EMA at 131.26.
-
14:56
USD Index looks weaker, drops to 7-month lows near 102.30
- The index drops well south of the 103.00 mark on Thursday.
- US disinflation remained well in place in December.
- US yields extend the decline post-US CPI.
The USD Index (DXY), which measured the greenback vs. a bundle of its main rival currencies, gathers extra downside pressure and revisits the 102.30 region for the first time since early April.
USD Index breaches 103.00 on US inflation
The index exacerbates its decline after US inflation figures extended the decline in December. In fact, the headline CPI rose 6.5% over the last twelve months and the Core CPI rose 5.7% from a year earlier, clinching the sixth consecutive monthly pullback.
The dollar derives extra selling pressure from the initial drop in US yields, although the belly and the long end of the curve manage to trim part of that knee-jerk so far.
Another month with lower inflation figures reinforces investors’ perception of an imminent pivot in the Fed’s tightening cycle, which also morphed into increasing bets of a 25 bps rate hike at the February 1 event.
Additional results in the US calendar saw weekly Claims increase by 205K in the week to January 7, bettering initial estimates and sustaining the view of a (still) healthy labour market.
What to look for around USD
The dollar remains under pressure and looks to rebound from post-US CPI lows in multi-month lows in the 102.35/30 band.
Another soft prints from US inflation figures in December prop up the idea of a probable pivot in the Fed’s policy in the next months, which also comes in contrast to the hawkish message from the latest FOMC Minutes and recent rate-setters, all pointing to the need to remain within a restrictive stance for longer, at the time when the likelihood any interest rate reduction in the current year remains near zero.
On the latter, the tight labour market and the resilience of the economy are also seen supportive of the firm message from the Federal Reserve and its hiking cycle.
Key events in the US this week: Inflation Rate, Initial Jobless Claims, Monthly Budget Statement (Thursday) – Flash Michigan Consumer Sentiment (Friday).
Eminent issues on the back boiler: Hard/soft/softish? landing of the US economy. Prospects for further rate hikes by the Federal Reserve vs. speculation of a recession in the next months. Fed’s pivot. Geopolitical effervescence vs. Russia and China. US-China trade conflict.
USD Index relevant levels
Now, the index is retreating 0.10% at 103.15 and the breach of 102.32 (monthly low January 9) would open the door to 101.29 (monthly low May 30) and finally 100.00 (psychological level). On the other hand, the next up barrier comes at 105.63 (monthly high January 6) followed by 106.38 (200-day SMA) and then 107.19 (weekly high November 30).
-
14:47
USD/JPY: Stability through H1, scope for modest Yen gains in H2 – Scotiabank
The Japanese Yen was one of the worst performing major currencies overall last year. Economists at Scotiabank forecast USD/JPY at 130 by the end of 2023.
Break below 129.50 could open up 121.45
“Our forecast for USD/JPY is consistent with the current Bloomberg consensus estimate for 2023 (130 in Q4) and the trend we expect to unfold reflects the broader outlook we have for the USD against the JPY’s major currency peers. In other words, stability close to current levels through H1, with scope for modest JPY gains developing through H2 as the Fed take its foot off the monetary brakes.”
“The long-term charts highlight 134.80/00 as resistance and 138.00/10 as major resistance above that point.”
“Support is 129.50, with a drop to 127.25 (50% Fibonacci retracement of the 2021/22 rally) or possibly 121.45 (61.8% retracement) below there.”
-
14:16
Gold Price Forecast: Too early to fade the XAU/USD rally – TDS
Gold jumps to a fresh eight-month high following the release of the US consumer inflation figures. In the TD Securities strategists' view, it is too early to fade the rally.
Too early to fade Gold?
“Price action in Gold continues to trade consistently with a strengthening uptrend, whereas our tracking of positioning for the top ten traders in China also continues to highlight an uninterrupted accumulation of Gold.”
“Further, the bar is low for price action to spark a subsequent CTA buying program. We still don't see signs that the underlying bid is abating, but will look for continued buying activity following Chinese New Year celebrations as the first milestone to single-out the cause behind these massive purchases.”
“Gold may well be overbought, but price action and its underlying drivers still suggest that it is too early to fade the rally.”
-
13:52
EUR/USD advances through 1.0800 post US CPI
- EUR/USD picks up extra pace and leaves behind 1.0800.
- The dollar drops to multi-month lows when tracked by the DXY.
- US inflation figures extended the decline in December.
EUR/USD sees its upside accelerated to levels last seen back in late April 2022 north of 1.0800 the figure on Thursday.
EUR/USD rose to 9-month peaks above 1.0800
EUR/USD advances for the fifth consecutive session to trade in levels past the 1.0800 barrier on the back of the increasing selling pressure in the dollar, particularly exacerbated following the release of US inflation figures during December.
On the latter, the headline CPI rose at an annualized 6.5% in December and 5.7% YoY when it comes to the Core CPI, which excludes food and energy costs. Headline consumer prices therefore retreat for the sixth consecutive month so far and add to the rising perception of Fed’s pivot in the not-so-distant future.
Additional releases in the US calendar saw Initial Jobless Claims rise 205K in the week to January 7, surpassing consensus.
In the wake of the publication of the US CPI, the probability of a 25 bps rate hike at the next Fed event climbed to 82% according to CME Group’s FedWatch Tool.
What to look for around EUR
EUR/USD finally breaks above the key 1.0800 barrier to print new 9-month peaks on Thursday.
Price action around the European currency continues to closely follow dollar dynamics, as well as the impact of the energy crisis on the region and the Fed-ECB divergence.
Back to the euro area, the increasing speculation of a potential recession in the bloc emerges as an important domestic headwind facing the euro in the short-term horizon.
Key events in the euro area this week: France final Inflation Rate, Germany Full Year GDP Growth, MEU Balance of Trade/Industrial Production (Friday).
Eminent issues on the back boiler: Continuation of the ECB hiking cycle vs. increasing recession risks. Impact of the war in Ukraine and the protracted energy crisis on the region’s growth prospects and inflation outlook. Risks of inflation becoming entrenched.
EUR/USD levels to watch
So far, the pair is advancing 0.43% at 1.0803 and faces the next up barrier at 1.0815 (monthly high January 12) followed by 1.0900 (round level) and finally 1.0936 (weekly high April 21 2022). On the other hand, the breach of 1.0481 (monthly low January 6) would target 1.0443 (weekly low December 7) en route to 1.0424 (55-day SMA).
-
13:50
Germany Current Account n.s.a. registered at €16.9B above expectations (€4.7B) in November
-
13:48
Fed's Harker: Time for future Fed rate hikes to shift to 25 bps increments
Federal Reserve Bank of Philadelphia President Patrick Harker said on Thursday that it was time for future Fed rate hikes to shift to 25 basis points increments, as reported by Reuters.
Additional takeaways
"Fed is likely to raise rates a few more times in 2023."
"Not seeing a recession but GDP should slow to 1% this year."
"Time of super-sized rate hikes has passed."
"Once hikes end, Fed will need to hold steady for a bit."
"Core inflation is likely to moderate to 3.5% in 2023, hit Fed 2% target in 2025."
"Worst of inflation surge is now likely over."
"Labor market remains in excellent shape."
"Unemployment to fall back to 4% after rising this year."
"Unemployment likely to tick up to 4.5% this year from current 3.5%."
"Concerned about commercial real estate."
Market reaction
The US Dollar stays under constant selling pressure following these remarks and the US Dollar Index was last seen losing 0.6% on the day at 102.66.
-
13:46
Gold Price Forecast: XAU/USD jumps to $1,900 neighbourhood, fresh multi-month top post-US CPI
- Gold price touches a fresh multi-month high following the release of the US inflation figures.
- The crucial US CPI report cements bets for smaller Fed rate hikes and boosts the XAU/USD.
- The risk-on impulse might hold back bulls from placing fresh bets and cap gains for the metal.
Gold price reverses an early North American session dip to the $1,873 area and jumps to a fresh eight-month high following the release of the US consumer inflation figures. The XAU/USD is currently placed just below the $1,900 mark, up over 1.0% for the day, and seems poised to appreciate further.
The US Dollar bounces off a seven-month low in reaction to mostly in-line US Consumer Price Index (CPI) data, which, in turn, acts as a headwind for the dollar-denominated Gold price. The US Bureau of Labor Statistics reported that the headline US CPI declined 0.1% in December as compared to estimates for a flat reading. The yearly rate, however, matched expectations and decelerated to 6.3% from 7.1% in November. Furthermore, core inflation, which excludes food and energy prices, edge up by 0.3% in December and fell to 5.7% on yearly basis from 6.0% in November.
The mixed data, meanwhile, reaffirms market expectations for a less aggressive policy tightening by the Federal Reserve (Fed) and keeps the US Treasury bond yields depressed. In fact, the yield on the benchmark 10-year US Treasury note languishes near a multi-week low amid rising bets for smaller Fed rate hikes going further. This, in turn, caps the attempted USD recovery and provides a fresh lift to the non-yielding Gold price. That said, a generally positive tone around the equity markets might turn out to be the only factor capping gains for the safe-haven XAU/USD.
Nevertheless, the fundamental backdrop remains tilted firmly in favour of bullish traders. The positive outlook is reinforced by the emergence of some dip-buying in the last hour. This, in turn, supports prospects for a further near-term appreciating move for the Gold price, though it will be prudent to wait for a sustained strength beyond the $1,900 mark before placing fresh bullish bets.
Technical levels to watch
-
13:44
US: Weekly Initial Jobless Claims decline to 205K vs. 215K expected
- Initial Jobless Claims in the US decreased by 1,000 in the first week of 2023.
- US Dollar Index stays deep in negative territory below 103.00.
There were 205,000 initial jobless claims in the week ending January 7, the weekly data published by the US Department of Labor (DOL) showed on Thursday. This print followed the previous week's print of 206,000 and came in better than the market expectation of 215,000.
Further details of the publication revealed that the advance seasonally adjusted insured unemployment rate was 1.1% and the 4-week moving average was 212,500, a decrease of 1,750 from the previous week's revised average.
"The advance number for seasonally adjusted insured unemployment during the week ending December 31 was 1,634,000, a decrease of 63,000 from the previous week's revised level," the DOL noted.
Market reaction
The US Dollar Index stays deep in negative territory below 103.00 after this data but the US Dollar weakness seems to have been caused by the soft inflation data rather than jobless claims.
-
13:32
United States Initial Jobless Claims came in at 205K, below expectations (215K) in January 6
-
13:31
United States Continuing Jobless Claims came in at 1.634M, below expectations (1.705M) in December 30
-
13:31
United States Consumer Price Index Core s.a climbed from previous 300.07 to 300.97 in December
-
13:30
United States Consumer Price Index ex Food & Energy (MoM) meets forecasts (0.3%) in December
-
13:30
United States Consumer Price Index ex Food & Energy (YoY) meets expectations (5.7%) in December
-
13:30
Breaking: US annual CPI inflation drops to 6.5% in December as expected
The US Bureau of Labor Statistics reported on Thursday that inflation in the US, as measured by the Consumer Price Index (CPI), declined to 6.5% on a yearly basis in December from 7.1% in November. This reading came in line with the market expectation. On a monthly basis, the CPI declined by 0.1% following November's increase of 0.1%.
Further details of the publication revealed that the Core CPI, which excludes volatile food and energy prices, edged lower to 5.7% on a yearly basis from 6% as expected. Finally, Core CPI rose by 0.3% on a monthly basis.
Follow our live coverage of the market reaction to US inflation data.
Market reaction
The US Dollar Index edged slightly higher with the initial reaction but seems to be having a difficult time gathering recovery momentum. As of writing, the index was down 0.2% on the day at 103.05.
-
13:30
United States Consumer Price Index n.s.a (MoM) registered at 296.797 above expectations (296.701) in December
-
13:30
United States Consumer Price Index (MoM) below expectations (0%) in December: Actual (-0.1%)
-
13:30
United States Initial Jobless Claims 4-week average down to 212.5K in January 6 from previous 213.75K
-
13:30
United States Consumer Price Index (YoY) in line with forecasts (6.5%) in December
-
13:14
EUR/USD: Building pressure for an extension of the rally to the 1.10 area – Scotiabank
On Wednesday, EUR/USD touched its highest level in nearly eight months at 1.0777. Economists at Scotiabank expect the pair to extend its race higher toward the 1.10 region.
Intraday price action is leaning potentially bearish
“Spot gains continue to pressure the mid-1.07 zone – key retracement resistance – which suggests building pressure for an extension of the EUR rally to the 1.10+ area.”
“Intraday price action is leaning potentially bearish, however, with the early European peak at 1.0775 marking a small outside range session on the six-hour chart.”
“We think the EUR will need to trade well below 1.07 to negate solid, underlying bull moment from a short-term point of view, however.”
-
13:03
NZD/USD remains on the defensive around mid-0.6300s ahead of US consumer inflation
- NZD/USD comes under some selling pressure on Thursday, though lacks follow-through.
- Bets for smaller Fed rate hikes, sliding US bond yields weigh on the USD and lend support.
- Investors also seem reluctant to place aggressive bets ahead of the crucial US CPI report.
The NZD/USD pair edges lower on Thursday and remains on the defensive through the mid-European session, through lack follow-through selling. The pair is currently placed around the mid-0.6300s as traders keenly await the release of the latest US consumer inflation figures.
The crucial US CPI report will influence the Federal Reserve's rate-hiking path, which, in turn, will drive the US Dollar demand and provide a fresh directional impetus to the NZD/USD pair. The market anxiety ahead of the key macro data benefits the greenback's relative safe-haven status and is seen undermining the risk-sensitive Kiwi.
That said, rising bets for smaller Fed rate hikes, along with a positive risk tone, weigh on the USD and help limit the downside for the NZD/USD pair. Market players seem convinced that the US central bank will soften its hawkish stance amid initial signs of easing inflationary pressure, which is evident from sliding US Treasury bond yields.
In fact, the yield on the benchmark 10-year US Treasury note languishes near a multi-week low and keeps the USD depressed near a seven-month low touched earlier this week. This makes it prudent to wait for strong follow-through selling before confirming that the NZD/USD pair has topped out in the near term and positioning for any meaningful corrective slide.
Technical levels to watch
-
13:00
Russia Central Bank Reserves $: $577.5B vs previous $581.7B
-
12:53
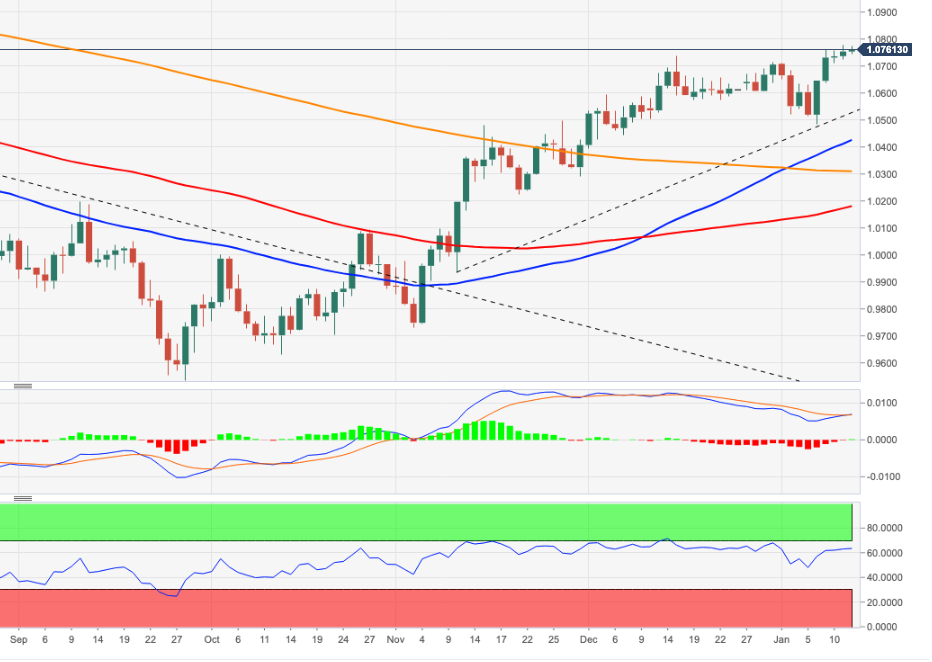
EUR/USD Price Analysis: Bullish bias unchanged above 1.0540
- EUR/USD remains bid near the 1.0780 region on Thursday.
- Extra gains likely above the immediate support line near 1.0540.
EUR/USD seems to have met solid resistance in the area of recent peaks around 1.0780.
In case bulls remain in control, the breakout of the January high at 1.0776 (January 11) could put the May 2022 top at 1.0786 (May 30) back on the radar ahead of the round level at 1.0800.
While above the short-term support line near 1.0540, the pair should maintain its bullish outlook.
In the longer run, the constructive view remains unchanged while above the 200-day SMA at 1.0308.
EUR/USD daily chart
-
12:43
USD/CAD retreats from weekly high, holds above 1.3400 ahead of US consumer inflation
- USD/CAD surrenders its modest intraday gains and is pressured by a combination of factors.
- Rising oil prices underpin the Loonie and exert some pressure amid sustained USD selling.
- Investors now look forward to the crucial US CPI report before placing fresh directional bets.
The USD/CAD pair struggles to capitalize on its modest intraday gains and attracts some sellers in the vicinity of mid-1.3400s, or a fresh weekly high touched earlier this Thursday. The pair slides to the lower end of its daily trading range, though manages to hold above the 1.3400 mark heading into the North American session.
Crude oil prices scale higher for the second successive day amid the latest optimism over China's pivot away from its zero-COVID policy, which is expected to boost fuel demand. This, in turn, underpins the commodity-linked Loonie, which, along with the prevalent US Dollar selling bias, acts as a headwind for the USD/CAD pair.
In fact, the USD Index, which measures the greenback's performance against a basket of currencies, languishes near a seven-month low amid rising bets for a less aggressive policy tightening by the Fed. Investors now seem convinced that the Fed will soften its hawkish stance amid initial signs of easing inflationary pressures.
The prospects for smaller Fed rate hikes going forward keep the US Treasury bond yields depressed near a multi-week low and continue to weigh on the greenback. Apart from this, a generally positive tone around the equity markets and a strong pickup in demand for the JPY contribute to driving flows away from the safe-haven buck.
Market participants now look forward to the release of the US consumer inflation figures, which will play a key role in influencing the Fed's rate hike path. This, in turn, should drive the USD demand. Apart from this, oil price dynamics will be looked upon for some meaningful trading opportunities around the USD/CAD pair.
Technical levels to watch
-
12:43
USD/CAD: Losses through 1.3410/20 should see the drift lower resume – Scotiabank
USD/CAD’s price action remains in consolidation mode, with potentially USD-negative implications, economists at Scotiabank report.
Short-term resistance aligns around 1.3450
“A small, bear flag/triangle pattern may be developing – effectively a continuation pattern after the USD’s sharp fall last week.”
“Price action shows firm, short-term resistance around 1.3450, the top of the pattern.”
“Pressure on the low end of the range is developing and losses through 1.3410/20 should see the USD drift lower resume.”
“Trends across a range of variables have been more CAD-positive than not and the CAD is trading well below where our fair value model suggests fundamental equilibrium is – 1.3249. This should limit scope for USD gains.”
-
12:18
GBP/USD: Short-term headwinds for the Pound to cap any gains after US CPI – Scotiabank
GBP/USD consolidates below 1.22. The Pound may struggle to benefit from Dollar weakness after US inflation data, according to economists at Scotiabank.
More strike action announced
“More strike action was announced today, adding to ongoing industrial action in the health and transport sectors. Meanwhile, easing energy prices have pushed peak BoE pricing to 4.41%, down from a recent high above 4.75%. These factors may slow GBP gains versus the softer USD in the event of more Dollar weakness after US inflation data.”
“Spot looks well-supported near 1.21 on the short-term charts but momentum is weak and we think Cable will need to trade either above 1.2210 or below 1.21 to establish a stronger sense of short-term direction.”
“Longer-term price signals tilt risks towards a topside move.”
See – US CPI Preview: Forecasts from 10 major banks, price pressures to ease further
-
12:11
USD Index Price Analysis: Further losses remain on the cards
- The index remains under pressure near the 103.00 zone.
- A deeper decline appears likely on a breach of the 102.90 area.
Price action around the dollar remains subdued and prompts DXY to put the 103.00 support to the test on Thursday.
If the offered stance intensifies, then the index could challenge the so far January low at 102.94 (January 9) in the near term, while a convincing breakdown of this level carries the potential to spark a retracement to, initially, the May 2022 low around 101.30 (May 30) ahead of the psychological 100.00 level.
In the meantime, while below the 200-day SMA at 106.38 the outlook for the index should remain tilted to the negative side.
DXY daily chart
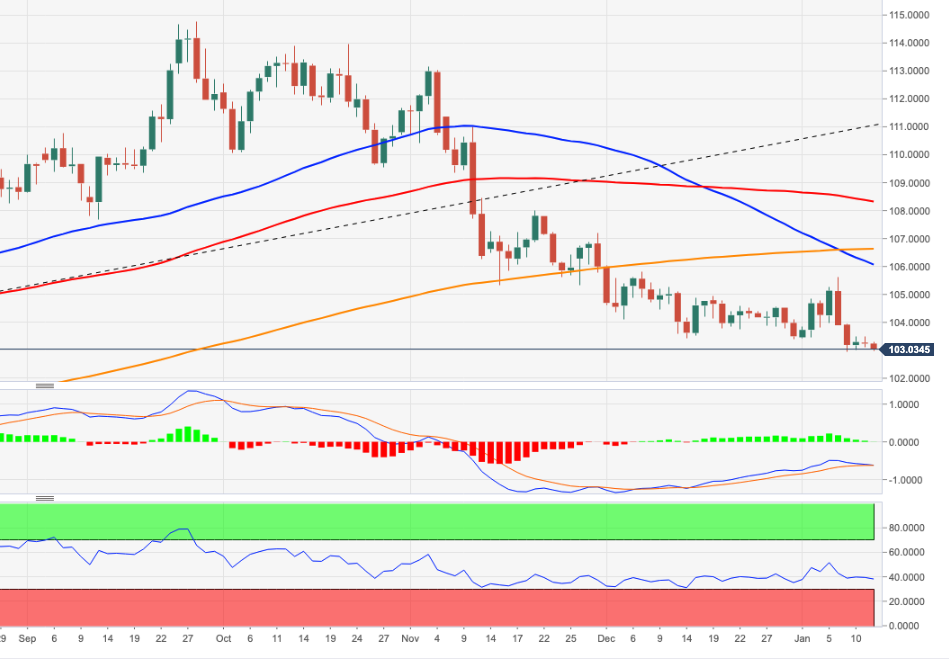
-
12:11
When is the US consumer inflation (CPI report) and how could it affect EUR/USD?
US CPI Overview
Thursday's US economic docket highlights the release of the critical US consumer inflation figures for December, scheduled later during the early North American session at 13:30 GMT. On a monthly basis, the headline CPI is anticipated to remain flat during the reported month as compared to a modest 0.4% rise in November. The yearly rate, meanwhile, is expected to decelerate sharply to 6.5% in December from the 7.1% previous. Furthermore, core inflation, which excludes food and energy prices, is projected to edge up by 0.3% in December and fall to 5.7% on yearly basis from 6.0% in November.
Analysts at RBC Economics offer a brief preview of the crucial macro data and write: “We expect YoY US consumer price growth to slow significantly in December to 6.3% from 7.1% in November. The steep decline in headline price growth is largely thanks to a significant drop in energy prices. We expect ‘core’ (excluding food & energy products) price growth to slow to 5.6% YoY in December from 6.0% in October. Further signs of declining price growth would support further slowing in the pace of hikes from the Fed. We continue to expect 50 bps of additional hikes to the Fed funds target range in Q1 before a pause at a terminal rate of 4.75% to 5.0%.”
How Could it Affect EUR/USD?
Ahead of the key release, growing acceptance that the Fed will soften its hawkish stance and slow the pace of its policy tightening keep the US Dollar depressed near a multi-month low. A softer-than-expected US CPI print will reinforce market expectations and prompt fresh selling around the buck. This, in turn, will allow the EUR/USD pair to capitalize on its recent strong bullish momentum.
That said, surprisingly stronger US consumer inflation figures will lift bets for a more hawkish Fed and push the US Treasury bond yields higher, along with the US Dollar. The immediate market reaction, however, is likely to remain limited amid the recent hawkish rhetoric from several ECB policymakers, which might continue to underpin the Euro and lend support to the EUR/USD pair.
Eren Sengezer offers a brief technical outlook for the EUR/USD pair and outlines important technical levels: “Following this week's action so far, static resistance seems to have formed at 1.0770. Above that level, 1.0800 (psychological level, static level) and 1.0840 (static level) could be seen as next bullish targets.”
“On the downside, 1.0730 (static level, 20-period Simple Moving Average (SMA)) aligns as initial support before 1.0700 (psychological level, static level) and 1.0650 (50-period SMA, 100-period SMA), ” Eren adds further.
Key Notes
• US CPI Preview: Forecasts from 10 major banks, price pressures to ease further
• US December CPI Preview: EUR/USD and USD/JPY are pairs to watch
• EUR/USD Forecast: Euro to target new multi-month highs on soft US CPI
About the US CPI
The Consumer Price Index released by the US Bureau of Labor Statistics is a measure of price movements by the comparison between the retail prices of a representative shopping basket of goods and services. The purchasing power of the USD is dragged down by inflation. The CPI is a key indicator to measure inflation and changes in purchasing trends. Generally speaking, a high reading is seen as positive (or bullish) for the USD, while a low reading is seen as negative (or Bearish).
-
12:10
EUR/USD: Weak US CPI to fuel more gains – Scotiabank
EUR/USD holds gains above 1.0750 as markets position for weak US data. Thus, economists at Scotiabank expect the pair to extend its advance.
ECB rate hikes to support EUR
“Policymakers (Rehn, de Cos) continue to suggest that ‘significant’ rate hikes are appropriate in the months ahead which will backstop the EUR.”
“Short-term spot trends reflect positioning ahead of US CPI data amid expectations of weak data and more pressure on the USD.”
“Spot is establishing a foothold above the 1.0750 area which should be a platform for more gains – if the CPI is as weak as markets expect.”
See – US CPI Preview: Forecasts from 10 major banks, price pressures to ease further
-
12:01
India Manufacturing Output up to 6.1% in November from previous -5.6%
-
12:01
India Industrial Output came in at 7.1%, above forecasts (2.6%) in November
-
12:01
India Cumulative Industrial Output increased to 5.5% in November from previous 5.3%
-
11:42
EUR/JPY Price Analysis: Upside remains capped by the 143.00 zone
- EUR/JPY corrects sharply lower and breaks below 141.00.
- The 143.00 area (high December 28) remains a tough hurdle for bulls.
EUR/JPY markedly reverses four consecutive daily advances and slips back below the 141.00 mark after being rejected from the vicinity of 143.00 on Wednesday.
Despite the ongoing knee-jerk, further upside remains favoured in the near term. Against that, the immediate up barrier appears at the weekly high at 142.93 (December 28), which appears reinforced by the vicinity of the 100-day SMA, today at 143.09.
The outlook for EUR/JPY should remain positive while above the 200-day SMA at 140.65.
EUR/JPY daily chart
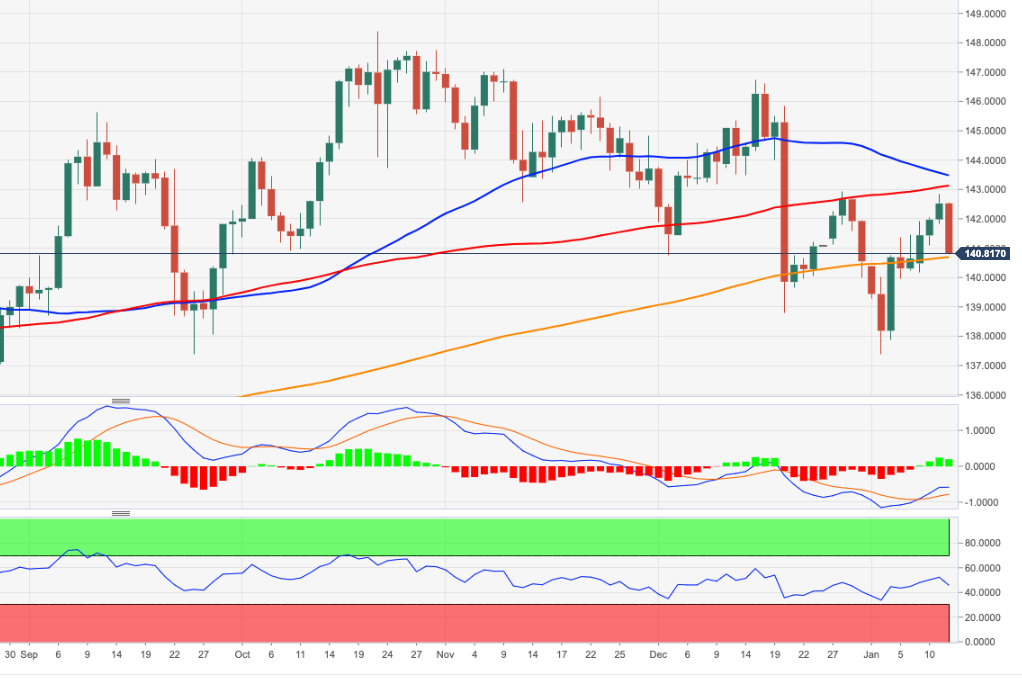
-
11:40
India M3 Money Supply registered at 8.7%, below expectations (8.9%) in December 30
-
11:40
Does a jump in EUR/CHF point to a break above 1.08 in EUR/USD? – SocGen
EUR/CHF vaults parity for the first time since July. Does EUR/CHF point to a break higher in EUR/USD? Kit Juckes, Chief Global FX Strategist at Société Générale, pens his view.
Which came first, the chicken or the Swiss franc?
“EUR/CHF has tended to track EUR/USD in recent years, and by and large, it’s been EUR/USD which leads, not the other way around. But the EUR/CHF low on September 26 came two days before the EUR/USD low last year, and I wonder whether Franc’s fall points to another push higher in EUR/USD (a break of 1.08 could trigger an acceleration).”
“US Core CPI inflation probably needs to come in below the consensus forecast of 5.7% (from 6% last month) to give the Euro wings.”
See – US CPI Preview: Forecasts from 10 major banks, price pressures to ease further
-
11:07
US CPI: Significant upside surprise to provide more support for the USD – MUFG
Will US Consumer Price Index (CPI) report disrupt USD weakening trend? A significant upside surprise is needed to support the greenback, according to economists at MUFG Bank.
Fed expected to further step down the pace of hikes to 25 bps at the next meeting
“The report is expected to provide further confirmation that inflation pressures continue to ease with headline inflation expected to fall by -0.1% MoM and core inflation to increase at the softer pace recorded over the previous two months at around +0.3% MoM.”
“Ahead of the US CPI report, market participants are confident that the Fed will further step down the pace of hikes to 25 bps at the next FOMC meeting and for the terminal policy rate to remain below 5.00%. It would take a significant upside inflation surprise today to materially alter those expectations and prevent the USD from continuing to correct lower at the start of this year.”
“We suspect that a significant upside surprise today would provide more support for the US Dollar as it would make it harder for the market to continue looking through recent hawkish Fed rhetoric.”
See – US CPI Preview: Forecasts from 10 major banks, price pressures to ease further
-
10:59
GBP/USD: Golden cross formed, risk modestly skewed to the upside – OCBC
The GBP/USD pair is currently trading around the mid-1.2100s. Economists at OCBC Bank keep a mild bullish bias on Cable.
Golden cross
“Golden cross formed, with the 50-Day Moving Average (DMA) cutting 200DMA to the upside. Risk modestly skewed to the upside.”
“Resistance is seen at 1.2220 levels.”
“Support at 1.2085 (21DMA), 1.2050 (50% fibo retracement of 2022 high to low), 1.2020 (50, 200DMAs).”
See:
- GBP/USD: Consolidation ahead of another push higher – Scotiabank
- US CPI Preview: Forecasts from 10 major banks, price pressures to ease further
-
10:36
USD/JPY slides to over one-week low, struggles near 131.00 mark ahead of US CPI
- USD/JPY drops to over a one-week low on Thursday and is pressured by a combination of factors.
- Reports that the BoJ will review the effects of its ultra-loose policy provides a strong lift to the JPY.
- Rising bets for smaller Fed rate hikes keep the US bond yields depressed and undermine the USD.
- Traders now look forward to the crucial US CPI report for some meaningful directional impetus.
The USD/JPY pair comes under heavy selling pressure on Thursday and continues losing ground through the first half of the European session. The downward trajectory drags spot prices to over a one-week low in the last hour, with bears now awaiting a sustained break below the 131.00 round-figure mark.
The Japanese Yen strengthens across the board amid reports that the Bank of Japan (BoJ) will review the side effects of its ultra-loose monetary policy at the next policy meeting on January 17-18. Further details showed that policymakers may take additional steps to correct distortions in the yield curve. This comes on the back of the BoJ's surprise tweak in December and fuels speculation for an eventual tightening later this year. This, along with the prevalent US Dollar selling bias, drags the USD/JPY pair lower.
The USD Index, which measures the greenback's performance against a basket of currencies, languishes near a seven-month low touched earlier this week amid rising bets for smaller Fed rate hikes. The bets were lifted by last week's mixed US monthly jobs report (NFP), which showed a slowdown in wage growth during December. The data pointed to easing inflationary pressure, which could allow the US central bank to soften its hawkish stance. This keeps the US Treasury bond yields depressed and weighs on the USD.
With the latest leg down, the USD/JPY pair confirms a breakdown through a three-day-old trading range and seems vulnerable to sliding further. Traders, however, might be reluctant to place aggressive bearish bets and prefer to wait for the latest US consumer inflation figures. The crucial US CPI report is due for release later during the early North American session and will play a key role in influencing the Fed's rate hike path. This, in turn, will drive the USD demand and provide a fresh directional impetus to the major.
Technical levels to watch
-
10:34
EUR/CHF: Trend higher may remain in place – ING
EUR/CHF yesterday broke above 1.00. Economists at ING had been forecasting a lower EUR/CHF this year and now they will have to revise up the forecast.
Race higher may stall in the 1.0070/1.0100 area
“Given that it looks like the Dollar will stay offered for the time being and the ECB looks unlikely to relent on its hawkishness, this trend to a higher EUR/CHF may remain in place. However, we doubt the SNB would want to see a big rally this early and the move may stall in the 1.0070/1.0100 area.”
“We had thought EUR/CHF could trade to 0.95 this summer, but it looks like we will have to revise up those forecasts.”
-
10:10
Gold Price Forecast: XAU/USD sits near multi-month top, around $1,885 ahead of US CPI
- Gold price catches fresh bids on Thursday and climbs back closer to a multi-month peak.
- Bets for less aggressive Federal Reserve continues to lend some support to the XAU/USD.
- Sliding US Treasury bond yields weighs on the US Dollar and provides an additional boost.
- The market focus remains glued to the consumer inflation figures from the United States.
Gold price attracts some dip-buying on Thursday and steadily climbs back closer to an eight-month high touched the previous day.
Smaller rate hikes by Federal Reserve benefit Gold price
Currently placed around the $1,885 area, the Gold price seems poised to appreciate further amid hopes for a less aggressive policy tightening by the Federal Reserve (Fed). Investors seem convinced that the Fed will soften its hawkish stance and pause the current rate-hiking cycle amid initial signs of easing inflationary pressures. Hence, the market focus will remain glued to the release of the latest consumer inflation figures from the United States (US), due later during the early North American session.
Sliding Treasury bond yields, weaker US Dollar boost Gold price
In the meantime, rising bets for smaller Fed rate hikes going forward keep the US Treasury bond yields depressed and continues to lend some support to the non-yielding Gold price. In fact, the yield on the benchmark 10-year US Treasury note languishes near a multi-week low and weighs on the US Dollar (USD). This is seen as another factor acting as a tailwind for the US Dollar-denominated XAU/USD and supports prospects for additional gains. Traders, however, might prefer to wait on the sidelines ahead of the key data risk.
Focus remains on consumer inflation figures from the United States
The crucial US CPI report will influence the Fed's near-term policy outlook. Officials, meanwhile, had indicated that they remain committed to combat high inflation and that rates could remain elevated for longer, or until there is clear evidence that consumer prices are falling. Hence, a stronger US CPI print will lift bets for a more hawkish Fed and push the buck higher. Conversely, a softer reading should pave the way for additional USD losses. Nevertheless, the data will provide a fresh directional impetus to Gold price.
Gold price technical outlook
From a technical perspective, the stage seems all set for a move towards reclaiming the $1,900 round-figure mark for the first time since May 2022. Some follow-through buying will be seen as a fresh trigger for bullish traders and open the doors for a further near-term appreciating move. On the flip side, any meaningful corrective slide now seems to find decent support near the $1,865-$1,860 strong resistance breakpoint. Sustained weakness below might prompt some technical selling and drag the Gold price to the $1,835-$1,833 horizontal support.
Key levels to watch
-
10:04
BoJ’s review of side effects could provide the decisive directional impulse for JPY – Commerzbank
USD/JPY is trading below the 132 mark again after reports that the Bank of Japan was planning to review the side effects of massive monetary easing. This is very relevant, in the view of Esther Reichelt, FX Analyst at Commerzbank.
BoJ review of monetary policy side effects
“The FX market obviously interprets today's announcement as making an end to ultra-expansionary monetary policy in Japan marginally more likely. While this is not a compelling conclusion from the announcement alone, it is likely to increase the focus on the news flow out of Japan.”
“The exact nature of the assessment of side effects promises more clarity about the motivation behind the yield target adjustment and could provide the decisive directional impulse for JPY exchange rates.”
-
10:04
Thailand: Auspicious prospects for GDP and THB – UOB
Economist at UOB Group Enrico Tanuwidjaja gives his views on the Thailand economy.
Key Takeaways
“Following stronger than expected 3Q22 GDP growth of 4.5% y/y, there are reasons to be optimistic in the few quarters to follow amidst consistently higher tourist arrivals that spur domestic consumption and spending.”
“More recently, earlier than expected China’s reopening has brewed more optimism ahead for the tourism-reliant Thai economy. In particular, we are likely to see continuous improvement in its services exports and consequently a stronger THB this year.”
“We expect a better and stronger recovery of the Thai economy in 4Q 22 (expecting growth circa 3.5-4.2% y/y range). Coupled with less aggressive BOT tightening of monetary policy compared to the other regional central banks to continue lending support towards growth recovery, we believe that the Thai economy is likely to be on the sweet spot of experiencing strong growth recovery and appreciating THB without slowing the pace of growth materially. Our 2022 GDP growth forecast remains at 3.2% and we forecast for it to accelerate to 3.7% this year and nearing 4% in 2024.”
-
10:00
Greece Consumer Price Index (YoY) declined to 7.2% in December from previous 8.5%
-
10:00
Greece Consumer Price Index - Harmonized (YoY): 7.6% (December) vs previous 8.8%
-
09:55
Spain 3-y Bond Auction increased to 2.81% from previous 2.35%
-
09:43
USD/CNH risks further weakness near term – UOB
Further selling pressure appears likely in USD/CNH in the next weeks, note UOB Group’s Economist Lee Sue Ann and Market Strategist Quek Ser Leang.
Key Quotes
24-hour view: “Yesterday, we expected USD to ‘trade sideways within a range of 6.7690/6.8000’. USD subsequently rose to a high of 6.7975, dropped to 6.7629 before closing at 6.7676 (-0.28%). Downward momentum is beginning to build and the risk for USD today is to the downside. While a break of the major support at 6.7500 would not be surprising, the next support at 6.7000 is unlikely to come into view. On the upside, a breach of 6.7920 (minor resistance is at 6.7800) would indicate that the current downward pressure has eased.”
Next 1-3 weeks: “There is not much to add to our update from Tuesday (10 Jan, spot at 6.7850). As highlighted, USD is likely to continue to weaken and a break of 6.7500 will shift the focus to 6.7000. Overall, only a breach of 6.8250 (‘strong resistance’ level was at 6.8350 yesterday) would indicate that the USD weakness that started last week has ended.”
-
09:33
US December CPI to determine whether risk rally continues – ING
Today sees the release of the December US Consumer Price Index (CPI). The last two soft releases were the foundation for the fourth quarter rally in risk assets and today's release should determine whether this year's rally – and the decline in the Dollar – continue, economists at ING report.
CPI to press play/pause on the rally
“A number in line with consensus probably allows the risk rally to continue.”
Expectations of a Fed easing cycle in the second half of the year, China reopening and lower energy prices are all encouraging this reallocation towards risk and should today's CPI number oblige, DXY could make a move towards the 102 area.”
“Any upside surprise in the number could see DXY bounce to the 104.00/104.25 area, but we doubt it would completely spell the end for the better risk/softer Dollar environment.”
See – US CPI Preview: Forecasts from 10 major banks, price pressures to ease further
-
09:09
Debate about the SARB’s autonomy is causing pressure on ZAR – Commerzbank
The Rand has come under pressure since the start of the week. Debates about a South African central bank’s change of mandate are pounding the ZAR, economists at Commerzbank report.
Debates about a change of the SARB mandate
“The plans of the governing party ANC are causing uncertainty amongst ZAR investors. They fear for the central bank’s autonomy.”
“It is possible that Rand will catch up in the current market environment if this issue drops off the market’s radar again. However, investors are likely to keep their eyes on the subject medium-term.”
-
09:09
GBP/USD consolidates in a range around mid-1.2100s, focus remains glued to US CPI
- GBP/USD struggles to gain any meaningful traction and remains confined in a range.
- Recession fears undermine the GBP and cap the upside amid a modest USD uptick.
- Bets for smaller Fed rate hikes act as a headwind for the USD and help limit losses.
- Traders also seem reluctant to place aggressive bets ahead of the key US CPI report.
The GBP/USD pair seesaws between tepid gains/minor losses through the first half of the European session on Thursday and is currently trading around mid-1.2100s, nearly unchanged for the day.
A bleak outlook for the UK economy has been fueling speculations that the Bank of England (BoE) is nearing the end of the current rate-hiking cycle and undermines the British Pound. Apart from this, a softer risk tone extends some support to the safe-haven US Dollar and contributes to capping the upside for the GBP/USD pair.
Investors turn cautious ahead of Thursday's release of the US consumer inflation data, which will influence the Fed's rate hike path. The Fed policymakers have indicated that they remain committed to combat high inflation and that rates could remain elevated for longer until there is clear evidence that consumer prices are falling.
In the meantime, a slowdown in the US wage growth pointed to easing inflationary pressure and lifted bets for smaller rate hikes by the Fed. Investors now seem convinced that the Fed will soften its hawkish stance, which leads to a further decline in the US Treasury bond yields. This acts as a headwind for the USD and lends support to the GBP/USD pair.
The mixed fundamental backdrop warrants some caution for aggressive traders and positioning for a firm intraday direction around the GBP/USD pair. Even from a technical perspective, the recent breakout through the very important 200-day SMA makes it prudent to wait for strong follow-through selling before confirming a near-term top.
Technical levels to watch
-
09:09
India's Gold imports plunge 79% in December 2022 – Reuters
Citing two government sources, Reuters reported on Thursday, India's Gold imports in December plunged 79% from a year earlier.
Additional takeaways
“Gold imports hit the lowest level in at least two decades for the month as a rally in local prices near record high dampened demand.”
“India imported 20 tonnes in December, down from 95 tonnes a year ago.”
“In value terms, December imports plunged to $1.18 billion from $4.73 billion a year ago.”
‘India's gold imports in 2022 dropped to 706 tonnes from 1,068 tonnes a year ago.”
India is the world’s second-largest Gold consumer after China
Market reaction
After hitting the highest level in eight months at $1,885, Gold price has entered a phase of upside consolidation, awaiting the critical US CPI data. At the time of writing, Gold price is trading at $1,882, adding 0.32% on the day.
-
09:00
EUR/USD faces some selling pressure near 1.0780, focus on US inflation
- EUR/USD seems to have met some initial hurdle near 1.0780.
- The dollar remains side-lined and US yields trade in a mixed note.
- US inflation figures will take centre stage later in the NA session.
The upside momentum in EUR/USD now appears to have entered an impasse following recent peaks around 1.0780.
EUR/USD stays cautious ahead of US data
EUR/USD alternates gains with losses and struggles to extend the multi-session positive streak on Thursday, as market participants remain prudent prior to the publication of the US inflation figures for the month of December.
The CPI results are expected to shed more light on the probability of a Fed’s pivot in its current normalization process, while expectations of a 25 bps rate hike at the Fed’s next event on February 1 looks the most likely scenario according to CME Group’s FedWatch Tool.
In the euro docket, Germany will publish its Current Account figures, while weekly Initial Jobless Claims will complete the US calendar later on Thursday.
What to look for around EUR
EUR/US’s strong rebound faces an initial and decent resistance near the 1.0780 region so far.
In the meantime, the European currency is expected to closely follow dollar dynamics, the impact of the energy crisis on the region and the Fed-ECB divergence.
Back to the euro area, the increasing speculation of a potential recession in the bloc emerges as an important domestic headwind facing the euro in the short-term horizon.
Key events in the euro area this week: France final Inflation Rate, Germany Full Year GDP Growth, MEU Balance of Trade/Industrial Production (Friday).
Eminent issues on the back boiler: Continuation of the ECB hiking cycle vs. increasing recession risks. Impact of the war in Ukraine and the protracted energy crisis on the region’s growth prospects and inflation outlook. Risks of inflation becoming entrenched.
EUR/USD levels to watch
So far, the pair is retreating 0.08% at 1.0747 and the breach of 1.0481 (monthly low January 6) would target 1.0443 (weekly low December 7) en route to 1.0424 (55-day SMA). On the upside, the next hurdle comes at 1.0776 (monthly high January 11) followed by 1.0786 (monthly high May 30 2022) and finally 1.0800 (round level).
-
08:46
EUR/USD: Direction of travel looks towards the 1.09 area – ING
EUR/USD has touched its highest level in nearly eight months at 1.0777. Economists at ING expect the pair to extend its mover higher towards 1.09.
1.0660/1.0700 might well contain any downside
“We are still seeing eurozone equity outperformance, which must be providing the Euro with some good support.”
“Assuming no upside surprises in CPI, the EUR/USD direction of travel looks towards the 1.09 area.”
“1.0660/1.0700 might well contain any downside today.”
See – US CPI Preview: Forecasts from 10 major banks, price pressures to ease further
-
08:44
USD/JPY sticks to the consolidative range so far – UOB
According to UOB Group’s Economist Lee Sue Ann and Market Strategist Quek Ser Leang, USD/JPY should maintain the 130.50-134.50 range for the time being.
Key Quotes
24-hour view: “We highlighted yesterday that ‘Flat momentum indicators suggest further sideways trading, likely between 131.60 and 132.75’. USD subsequently traded within a narrower range of 132.05/132.87 but it opened on a soft note in early Asian trade. Downward momentum is beginning to build and USD is likely head lower. However, a sustained decline below 131.30 appears unlikely (next support is at 130.50). Resistance is at 132.30, a breach of 132.70 would indicate the build-up in downward momentum has fizzled out.”
Next 1-3 weeks: “There is not much to add to our update from Monday (09 Jan, spot at 132.10). As highlighted, after the sharp drop last Friday, USD is likely to trade within a broad range of 130.50 and 134.50 instead of rebounding further.”
-
08:41
China’s Commerce Ministry: Rising global recession risks exert greatest pressure on foreign trade
China's Commerce Ministry said in a statement on Thursday, “the rising risk of a global recession and the continued slowdown in external demand growth is the greatest pressure on the growth of foreign trade.”
“China expects the size of 2022 exports and imports to be record high,” the Ministry said.
Market reaction
In reaction to these above comments and a broad-based US Dollar recovery, AUD/USD is down 0.06% on the day at 0.6894.
-
08:40
Natural Gas Futures: Extra gains likely
Considering advanced prints from CME Group for natural gas futures markets, open interest prolonged the uptrend for yet another session on Wednesday, this time by around 8.1K contracts. In the same direction, volume went up by around 44.7K contracts, setting aside the previous daily drop.
Natural Gas looks at another test of $4.00
Prices of the natural gas bounced of the $3.50 region and ended Wednesday’s session with decent gains. The bounce was in tandem with increasing open interest and volume and thus paves the way for the continuation, at least in the very near term, of the recovery and with the initial hurdle at the $4.00 mark per MMBtu.
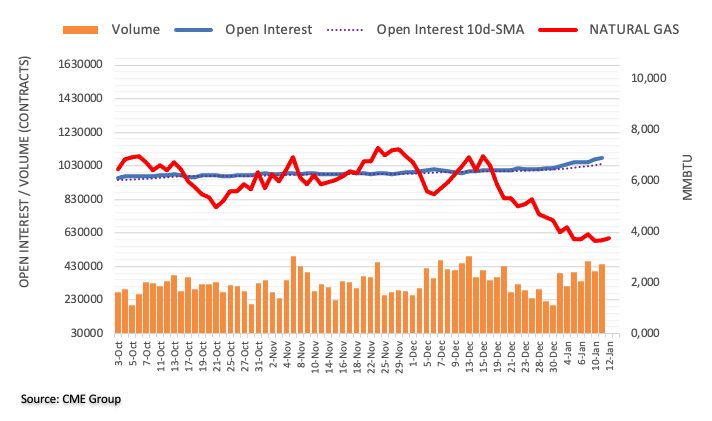
-
08:33
NZD/USD: Risks now shifted to the upside – UOB
NZD/USD could see its upside gather extra pace on a breakout of the 0.6410 level, comment UOB Group’s Economist Lee Sue Ann and Market Strategist Quek Ser Leang.
Key Quotes
24-hour view: “We expected NZD to ‘trade sideways between 0.6340 and 0.6405’ yesterday. NZD subsequently traded within a range of 0.6335/0.6381 before closing largely unchanged at 0.6367 (-0.05%). Flat momentum indicators suggest NZD could continue to trade sideways, likely between 0.6340 and 0.6405.”
Next 1-3 weeks: “On Monday (09 Jan, spot at 0.6350), we highlighted that while the risk for NZD has shifted to the upside, it must clear the major resistance at 0.6410 before further gains are likely. The upside risk will remain in place as long as NZD stays above 0.6320 (‘strong support’ level was at 0.6300 yesterday). Looking ahead, the next resistance level above 0.6410 is at 0.6445, followed by 0.6515.”
-
08:26
AUD/USD refreshes daily low, slides below 0.6900 amid softer risk tone ahead of US CPI
- AUD/USD surrenders modest intraday gains and retreats below the 0.6900 mark in the last hour.
- The cautious market mood lends some support to the safe-haven buck and acts as a headwind.
- Bets for an additional RBA rate hike in February should limit losses ahead of the key US CPI.
The AUD/USD pair struggles to capitalize on its modest intraday gains and fails near the 0.6925-0.6930 supply zone for the third straight day on Thursday. Spot prices retreat below the 0.6900 mark during the early part of the European session and refresh the daily low in the last hour, though the downside seems limited.
The Australian Dollar might draw support from rising bets for an additional interest rate hike by the Reserve Bank of Australia (RBA) in February, bolstered by Wednesday's hotter domestic inflation data. In fact, the Australian Bureau of Statistics reported that the headline Consumer Price Index (CPI) re-accelerated to the 7.3% YoY rate - a 32-year-high - in November from the 6.9% in the previous month. Apart from this, subdued US Dollar price action could act as a tailwind for the AUD/USD pair, at least for the time being.
The USD Index, which measures the greenback's performance against a basket of currencies, languishes near a multi-month low amid diminishing odds for a more aggressive tightening by the Fed. A slowdown in the US wage growth was seen as the initial sign of easing inflationary pressures, which could allow the US central bank to soften its hawkish stance. This leads to a further decline in the US Treasury bond yields and weighs on the buck. That said, the cautious mood helps limit any further losses for the safe-haven USD.
The anxiety ahead of Thursday's release of the latest US consumer inflation figures tempers investors' appetite for perceived riskier assets. This is evident from a softer tone around the equity markets, which is seen benefitting the greenback's relative safe-haven status and capping the upside for the risk-sensitive Aussie. Hence, the focus remains on the crucial US CPI report, due later during the early North American session.
Technical levels to watch
-
08:12
US CPI could entail notable USD fluctuations in an unsettled market – Commerzbank
The wait is over! Today the US inflation data for December will be published. The Dollar could see notable fluctuations in an unsettled market, according to economists at Commerzbank.
Future inflation developments seem uncertain
“It is quite possible that in case of the data remaining within the framework of the expectations or slightly below, everyone will feel confirmed in their view: The market sees the scenario of falling interest rates in the second half to be confirmed and trades the Dollar generally lower. The Fed acknowledges a fall in the rate of inflation but does not see this as a reason to consider the inflation pressure to really be falling on a sustainable basis and remains cautious.”
“However, there is another possibility; and that is that inflation will continue to be a black box. The reasonably stable development of market expectations might therefore disguise the high underlying uncertainty about the future inflation outlook.”
“Hard facts such as today’s inflation data always entail the hope that significant insight might be gained – and thus the risk of more notable fluctuations in market expectations and the Dollar in an unsettled market.”
See – US CPI Preview: Forecasts from 10 major banks, price pressures to ease further
-
07:59
USD/JPY: Benign US data print could send the pair back to this year's low at 129.50 – ING
USD/JPY came under modest bearish pressure early Thursday and declined below 132.00. The pair could plunge to 129.50 on mild US data, economists at ING report.
Any upside should be limited to the 132.60/133.00
“The FX options market prices a 1.3% range for USD/JPY today, where a benign US data print could send USD/JPY back to this year's low at 129.50.”
“Next week's BoJ meeting means that any upside should be limited to the 132.60/133.00 area.”
See – US CPI Preview: Forecasts from 10 major banks, price pressures to ease further
-
07:54
Crude Oil Futures: Rebound could extend further near term
CME Group’s flash data for crude oil futures markets noted traders added nearly 22K contracts to their open interest positions on Wednesday, extending the multi-week uptrend for yet another session. In the same line, volume rose for the third session in a row, now by around 141.6K contracts.
WTI faces the next hurdle at $81.44
Prices of the WTI rose markedly on Wednesday amidst increasing open interest and volume, opening the door to the continuation of the recovery in the very near term. Against that, the next target of note comes at the January high at $81.44 per barrel recorded on January 3.
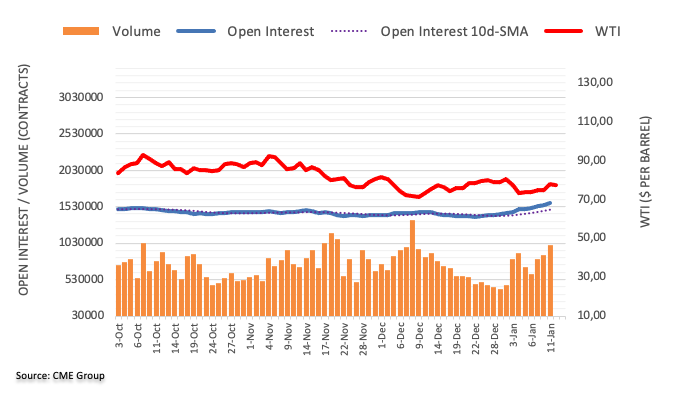
-
07:49
GBP/USD: A test of 1.2330 emerges on the horizon – UOB
UOB Group’s Economist Lee Sue Ann and Market Strategist Quek Ser Leang suggest GBP/USD could accelerate its gains and revisit 1.2330 in the short term.
Key Quotes
24-hour view: “Yesterday, we highlighted that ‘the price actions appear to be consolidative’ and we expected GBP to ‘trade sideways within a range of 1.2100/1.2200’. Our view for sideways trading turned out to be correct as GBP traded between 1.2102 and 1.2176 before closing little changed at 1.2151 (+0.01%). While GBP may continue to trade sideways today, a breach of the 1.2200 resistance could potentially lead to a sharp rise to 1.2270. Support is at 1.2100, followed by a strong level at 1.2050.”
Next 1-3 weeks: “There is not much to add to our update from two days ago (10 Jan, spot at 1.2180). As highlighted, after the sharp advance in GBP earlier this week, the odds of GBP breaking the resistance at 1.2270 have increased. The GBP strength is intact as long as it does not break the ‘strong support’ at 1.2050 (level was at 1.2030 yesterday).”
-
07:47
Euro to benefit from the ECB's pronounced hawkish determination – Commerzbank
The Euro was able to appreciate particularly significantly against the Swiss Franc yesterday, but also against the Swedish Krona. Economists at Commerzbank expect the shared currency to thrive amid attractive ECB monetary policy.
Euro as a European outperformer
“The many hawkish comments across the typical dove and hawk camps within the ECB seem to have made a difference. If the ECB stands by its comments, its immediate monetary policy direction is likely to be quite attractive.”
“Between ‘possibly not quite determined enough’ and ‘“already foreseeably successful’ the ECB is currently occupying a sweet spot by European comparison, in which the Euro is able to benefit from the ECB's pronounced hawkish determination.”
-
07:43
USD/CAD climbs back closer to mid-1.3400s, weekly high ahead of US inflation data
- USD/CAD attracts fresh buying on Thursday, though the upside potential seems limited.
- A modest downtick in oil prices undermines the Loonie and lends support to the major.
- Smaller Fed rate hike bets weigh on the USD and could cap gains ahead of the US CPI.
The USD/CAD pair regains positive traction on Thursday and steadily climbs to the top end of its weekly range, closer to mid-1.3400s during the early European session. The intraday move up, however, lacks bullish conviction and is more likely to remain capped ahead of the release of the latest US consumer inflation figures.
In the meantime, a modest pullback in crude oil prices from over a one-week high touched on Wednesday undermines the commodity-linked Loonie and lends some support to the USD/CAD pair. Despite the recent optimism led by China's pivot away from its zero-COVID policy, worries that a deeper global economic downturn will hurt demand act as a headwind for the black liquid. That said, subdued US Dollar price action might hold back traders from placing aggressive bullish bets around the major and keep a lid on any further gains.
In fact, the USD Index, which measures the greenback's performance against a basket of currencies, languishes near a seven-month low amid the prospects for smaller rate hikes by the Fed. Investors now seem convinced that the US central bank will soften its hawkish stance amid signs of easing inflation. This is evident from a further decline in the US Treasury bond yields and continues to weigh on the greenback. Traders, however, might prefer to wait for the crucial US CPI report before determining the near-term trajectory.
The Fed policymakers have indicated that they remain committed to combat high inflation and that rates could remain elevated for longer, or until there is clear evidence that consumer prices are falling. Hence, a stronger US CPI print will lift bets for a more hawkish Fed and push the USD higher, allowing the USD/CAD pair to build on this week's recovery from its lowest level since November 25. Conversely, a softer reading will set the stage for an extension of the recent rejection slide from the 1.3700 round-figure mark.
Technical levels to watch
-
07:39
USD strength caused by Core CPI prints in the 0.3-0.4% MoM range to fade – Credit Suisse
How to trade the December US Consumer Price Index (CPI) data release? Here is the Credit Suisse’s cheat sheet.
The hitchhiker’s guide to trading US Dec CPI data
“Core CPI prints of 0.2% MoM or lower should solidify expectations of a 25 bps hike at the 1 Feb FOMC, causing the weak USD trend to likely extend further.”
“Readings between 0.3% and 0.4% MoM might initially be seen as disappointing relative to market-implied expectations, but likely will not change the overall narrative, especially in FX where USD topside is still trading at a small premium: we would be inclined to fade resulting USD strength.”
“Readings above 0.4% MoM on the other hand would call for more caution and represent an important tail risk to our near-term bearish USD view set.”
“A print of 0.6% MoM or higher would likely lead to a turbulent repricing in Fed policy expectations, a weak reversal in risk appetite and generalized USD strength in all pairs.”
See – US CPI Preview: Forecasts from 10 major banks, price pressures to ease further
-
07:35
Gold Futures: Some consolidation could emerge near term
Open interest in gold futures markets rose for the fourth consecutive session on Wednesday, this time by around 4.1K contracts according to preliminary readings from CME Group. Volume followed suit and went up by around 77.2K contracts, resuming he upside after Wednesday’s pullback.
Gold appears consolidative below $2000
Wednesday’s inconclusive price action in gold was accompanied by rising open interest and volume and is supportive of the resurgence of some consolidative range in the very near term. in the meantime, the $2000 mark per ounce troy remains the big magnet for bulls for the time being.
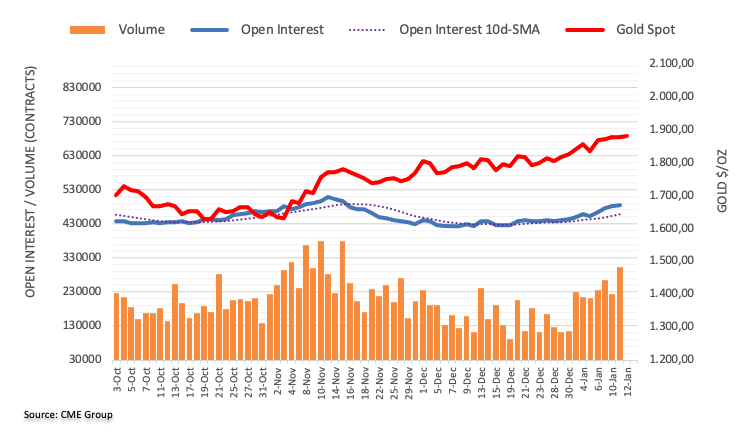
-
07:34
BoK Preview: Forecasts from five major banks, the end of the hiking cycle?
The Bank of Korea (BoK) will hold its Monetary Policy Committee (MPC) meeting on Friday, January 13 at 01:00 GMT and as we get closer to the release time, here are the expectations as forecast by the economists and researchers of five major banks.
BoK is expected to hike rates by 25 basis points to 3.5%. At the last policy meeting on November 24, the bank hiked rates by 25 bps to 3.25%.
Standard Chartered
“We expect the BoK to hike rates by 25 bps. We expect the BoK to continue hiking the base rate on inflation concerns despite slowing growth momentum. As of now, we think the BoK will prioritise CPI inflation concerns over growth concerns, maintaining its hawkish stance.”
TDS
“We think the BoK is nearing its terminal rate as growth concerns take hold, with exports contracting for the trade-reliant nation. While Dec’s headline inflation still remains above the BoK 2% target at 5% YoY, inflation has cooled rapidly from the highs in Jul'22. The BoK may opt to stick with an elevated policy rate of 3.5% for longer rather than continuing to hike rates.”
SocGen
“The BoK is expected to hike rates by 25 bps to 3.50% at its policy meeting on 13 January, which is likely to mark the end of its rate-hike cycle. We have reduced our terminal policy rate forecast from 3.75% to 3.50%. The data continue to indicate weak economic activity and peaking inflation. The concerns surrounding financial stability have persisted due to high corporate leverage and housing market weakness, which would be bearish for growth outlook. Meanwhile, a further decline in the USD/KRW exchange rate reduces the pressure on the BoK to follow the Fed’s tightening cycle.”
ANZ
“We expect the BoK to conclude its current rate hike cycle with a 25 bps increase this Friday, which will take the policy rate to 3.50%. Nonetheless, the odds that the central bank will stand pat have also risen.”
ING
“We maintain our minority view that the BoK will likely stand pat this time. Since the last meeting, both inflation and inflation expectations decelerated quite meaningfully while the Korean Won stabilised under the 1300 level despite a widening yield gap between the US and Korea. The BoK is expected to use the rate hike card more carefully as there is little room left to raise interest rates in this cycle given sluggish exports and economic activity. However, given the recent rise in gasoline and power prices, upside risks remain high and thus the BoK should retain a hawkish tilt despite the pause.”
-
07:28
EUR/USD: Further gains could retest 1.0785 near term – UOB
In the opinion of UOB Group’s Economist Lee Sue Ann and Market Strategist Quek Ser Leang, extra upside in EUR/USD is expected to clear the 1.0785 level in the next few weeks.
Key Quotes
24-hour view: “We expected EUR to ‘trade between 1.0700 and 1.0760’ yesterday. However, EUR edged to a high of 1.0776 before closing at 1.0755 (+0.20%). Upward momentum has improved a tad and EUR is likely to trade with an upward bias. That said, it remains to be seen if EUR can maintain a foothold above the major resistance at 1.0785 (there is another resistance at 1.0820). Support is at 1.0735, followed by 1.0700.”
Next 1-3 weeks: “Our update from Tuesday (10 Jan, spot at 1.0730) still stands. As highlighted, the ease with which EUR took out 1.0735 earlier this week suggests it is likely to take a crack at another strong resistance at 1.0785. The upside risk is intact as long as EUR stays above 1.0665 (‘strong support’ level was at 1.0650 yesterday). Looking ahead, a sustained breach of 1.0785 will shift the focus to 1.0900.”
-
07:22
Forex Today: US Dollar looks vulnerable as focus shifts to December CPI data
Here is what you need to know on Thursday, January 12:
Financial markets stay relatively quiet early Thursday as investors gear up for December inflation data from the US. The US Dollar Index continues to move up and down in a tight range slightly above 103.00, the benchmark 10-year US Treasury bond yield holds above 3.5% following Wednesday's decline and US stock index futures trade flat. The US economic docket will also feature the weekly Initial Jobless Claims and there won't be any high-impact data releases from the Eurozone.
US CPI Preview: Forecasts from 10 major banks, price pressures to ease further.
Wall Street's main indexes registered strong gains for the second straight day on Wednesday and made it difficult for the US Dollar to stay resilient against its major rivals during the American trading hours. On a yearly basis, the Consumer Price Index (CPI) in the US is forecast to 6.5% in December from 7.1% in November. The Core CPI, which excludes volatile food and energy prices, is expected to edge lower to 5.7% from 6%.
Meanwhile, the data from China showed that the annual CPI rose to 1.8% in December from 1.6% as expected. Nevertheless, the Shanghai Composite Index remains on track to end the day virtually unchanged.
Hawkish comments from European Central Bank (ECB) officials helped the Euro gather strength on Wednesday and EUR/USD pair touched its highest level in nearly eight months at 1.0777 before retreating toward 1.0750 early Thursday. ECB Governing Council member Olli Rehn said that rates will have to rise significantly in the next couple of meetings to dampen inflation. Similarly, ECB policymaker Pablo Hernandez de Cos noted that they will need to continue to hike rates at a steady pace to protect themselves against the risk of a persistent upward shift in inflation expectation.
US December CPI Preview: EUR/USD and USD/JPY are pairs to watch.
GBP/USD struggled to make a decisive move in either direction and closed flat at around 1.2150 on Wednesday. The pair was last seen moving sideways near that level.
USD/JPY came under modest bearish pressure early Thursday and declined below 132.00. Japanese media Yomiuri reported earlier in the day that the Bank of Japan was planning to review the side effects of massive monetary easing in next week's policy meeting.
Gold price continued to edge higher on Wednesday and reached its highest level since early May at $1,887. With the 10-year US T-bond yield holding steady in the early European morning, XAU/USD stays quiet slightly above $1,880.
Bitcoin extended its rebound and gained nearly 3% on Wednesday, closing the fifth straight day in positive territory. BTC/USD preserves its bullish momentum and trades near $18,200 early Thursday, already gaining more than 1%. Similarly, Ethereum rose 4% on Wednesday and climbed to its highest level in two months at $1,418 on Thursday before retreating toward $1,400.
-
07:16
USD Index puts 103.00 to the test ahead of US CPI
- The index extends the decline and challenges 103.00.
- US inflation figures is expected to have retreated further in December.
- US yields trade slightly on the defensive on Thursday.
The greenback, when tracked by the USD Index (DXY), adds to Wednesday’s tepid losses and pokes with the 103.00 neighbourhood on Thursday.
USD Index looks at US CPI
The index drops for the second session in a row on Thursday and probes the 103.00 support on the back of the generalized flat sentiment in the global assets.
Indeed, prudence prevails among market participants ahead of the release of crucial US inflation figures for the month of December..
These results have grown in importance in past sessions, particularly after the release of the US labour market report on January 6, amidst increasing speculation of a potential pivot in the Fed’s monetary tightening.
Other than the publication of the CPI, weekly Initial Claims are also due as usual along with the Monthly Budget Statement.
What to look for around USD
The dollar remains under pressure and trades in a side-lined fashion near the 103.00 yardstick amidst investors’ prudence and ahead of US CPI due later in the session.
The mixed results from the US Nonfarm Payrolls for the month of December (Friday) seem to have reignited the idea of a probable pivot in the Fed’s policy in the next months, which comes in contrast to the message from the latest FOMC Minutes, where the Committee advocated the need to remain within a restrictive stance for longer, at the time when it ruled out any interest rate reduction for the current year.
Furthermore, the tight labour market, still elevated inflation and the resilient economy are also seen supportive of the firm message from the Federal Reserve and its hiking cycle.
Key events in the US this week: Inflation Rate, Initial Jobless Claims, Monthly Budget Statement (Thursday) – Flash Michigan Consumer Sentiment (Friday).
Eminent issues on the back boiler: Hard/soft/softish? landing of the US economy. Prospects for further rate hikes by the Federal Reserve vs. speculation of a recession in the next months. Fed’s pivot. Geopolitical effervescence vs. Russia and China. US-China trade conflict.
USD Index relevant levels
Now, the index is retreating 0.03% at 103.22 and the breach of 102.94 (monthly low January 9) would open the door to 101.29 (monthly low May 30) and finally 100.00 (psychological level). On the other hand, the next up barrier comes at 105.63 (monthly high January 6) followed by 106.38 (200-day SMA) and then 107.19 (weekly high November 30).
-
07:14
Silver Price Analysis: XAG/USD clings to intraday gains, $24.00 holds the key for bulls
- Silver attracts fresh buying in the vicinity of support marked by the 200-SMA on the 4-hour chart.
- The recent two-way price moves warrant some caution before placing aggressive directional bets.
- Bulls might wait for a sustained move beyond the $24.00 mark before positioning for further gains.
Silver regains some positive traction on Thursday and for now, seems to have snapped a three-day losing streak to the weekly low touched the previous day. The white metal maintains its bid tone through the early European session and is currently placed near the daily high, around the $23.60-$23.65 region.
From a technical perspective, the overnight pullback from the vicinity of the weekly high stalls near the 200-period SMA on the 4-hour chart. The said support, currently around the $23.20 region, should now act as a pivotal point and help determine the next leg of a directional move. Given that the XAG/USD has been struggling to find acceptance above the $24.00 mark, a convincing break below will be seen as a fresh trigger for bearish traders.
That said, oscillators on the daily chart - though have been losing traction - are still holding in the positive territory. This makes it prudent to wait for some follow-through selling below the $23.00 round figure before positioning for a further near-term depreciating move. The XAG/USD might then accelerate the fall towards the $22.60-$22.55 region before eventually dropping to the next relevant support near the $22.10-$22.00 horizontal zone.
On the flip side, any further positive move might confront a stiff hurdle near the weekly top, around the $24.00-$24.10 region. A sustained strength beyond could lift the XAG/USD towards the multi-month high, around the $24.50-$24.55 region touched last week. Some follow-through buying should pave the way for a move towards reclaiming the $25.00 psychological mark.
Silver 4-hour chart
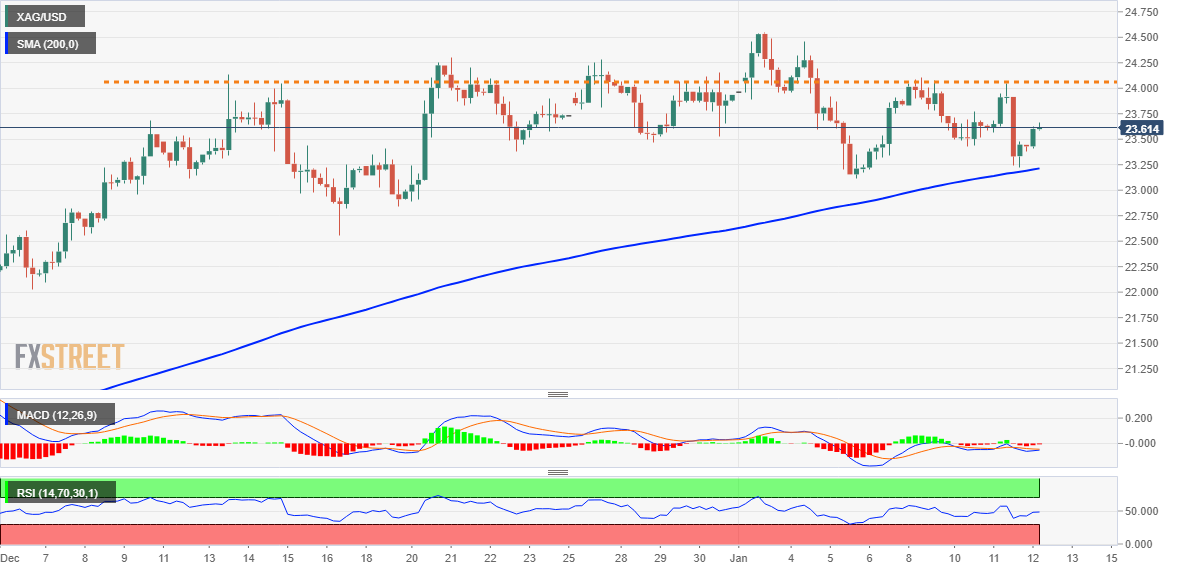
Key levels to watch
-
07:00
EUR/USD Price Analysis: Pullback remains elusive beyond 1.0710 support
- EUR/USD retreats from intraday high as bulls take a breather ahead of the key US CPI.
- 50-HMA, two-week-old horizontal support restrict short-term downside.
- Firmer RSI (14) signals limited acceptance to bearish bias.
EUR/USD depicts the market’s cautious mood heading into Thursday’s European session as it eases from an intraday high to 1.0760 by the press time. Even so, the major currency pair remains firmer for the fifth consecutive day as traders await the US Consumer Price Index (CPI) data for December.
That said, the quote’s latest pullback could be linked to its inability in crossing the fortnight-long ascending resistance line, around 1.0780 by the press time.
The lower highs on the RSI (14) also favor the recent pullback in the EUR/USD. However, the momentum indicators remain well above the 50 mark and suggest limited favor to the heavy downside.
Against this backdrop, the EUR/USD sellers approach the 50-HMA support surrounding 1.0745. Though, the quote’s weakness past 1.0745 remains limited as multiple levels marked since December 30 restrict the quote’s further downside around 1.0710.
In a case where EUR/USD breaks the 1.0710 support, a quick drop toward the tops marked late last week, near 1.0635 appears more likely.
Meanwhile, recovery moves need to cross the aforementioned ascending resistance line, close to 1.0780, to restore the bullish bias. Even so, the high marked during May 2022 and the March 2022 low, respectively near 1.0785 and 1.0805, could challenge the EUR/USD buyers.
Following that, a run-up towards the 1.1000 psychological magnet can’t be ruled out.
EUR/USD: Hourly chart
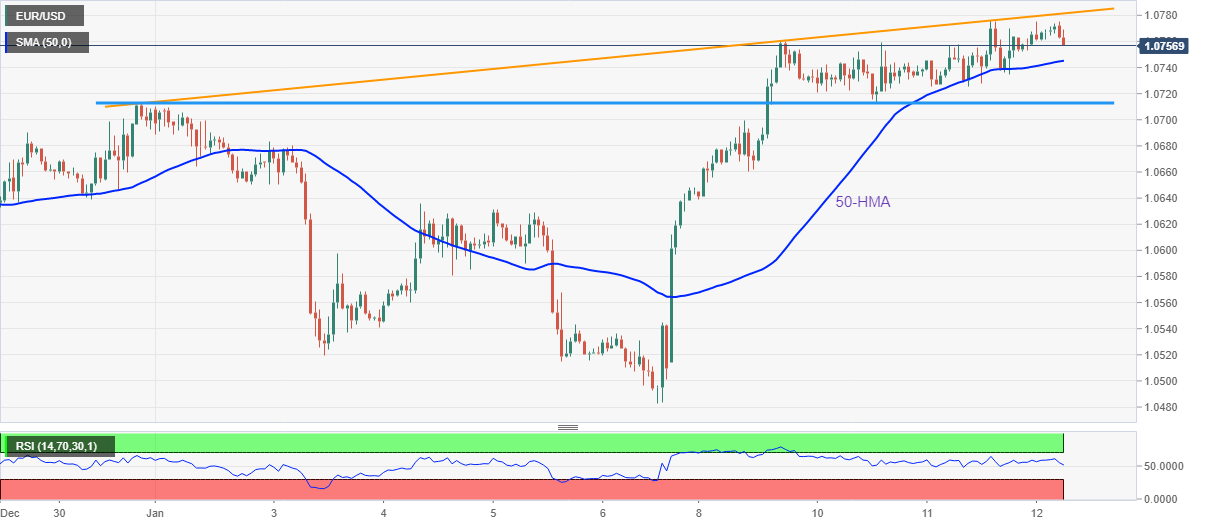
Trend: Bullish
-
07:00
Gold Price Forecast: XAU/USD keeps sight on $1,900 as bulls fight back control
Gold price is seeing fresh demand early Thursday as XAU/USD bulls refuse to give up, FXStreet’s Dhwani Mehta reports.
Favorable daily technical setup
“Acceptance above the $1,880 level remains elusive. Daily closing above the latter is needed to extend the uptrend, with bulls eyeing a sustained move above the $1,900 mark. The next upside target is seen toward May 2022 high at $1,910.”
“On the flip side, rejection above the $1,880 level could reinforce the downside toward Friday’s low at $1,865. Further down, the $1,850 psychological level will be the level to beat for Gold sellers.”
See – Gold Price Forecast: XAU/USD to see a meaningful long-term break higher above $2,070/75 – Credit Suisse
-
06:50
FX option expiries for Jan 12 NY cut
FX option expiries for Jan 12 NY cut at 10:00 Eastern Time, via DTCC, can be found below.
- USD/JPY: USD amounts
- 130.00 381m
USD/CAD: USD amounts
- 1.2900 1.8b
- 1.3650 1.3b
- 1.4000 775m
-
06:44
BoJ Osaka Branch Manager: Important for FX rates to move stably reflecting fundamentals
The Bank of Japan (BoJ) Osaka Branch Manager Hirohide Koguchi made some comments on the exchange rate value in a news conference on Thursday.
Key quotes
“Important for FX rates to move stably reflecting fundamentals.”
“Weak yen has helped boost big manufacturers' profits, support inbound tourism.”
“Yen has bounced back up but remains below levels at outset of 2022, overseas tourists returning to Japan as country re-opens borders.“
“Tourists from China not rising much so far, but those from Europe, US and Southeast Asia clearly increasing in Kansai Western Japan region.”
Related reads
- BoJ raises economic view for four of Japan's nine regions
- BoJ to review side effects of its massive monetary easing at its policy meetings next week – Yomiuri
-
06:26
US CPI: Data in line or below forecasts could seal a 25bps Feb Fed rate hike – NAB
Economists at National Australia Bank (NAB) offer a sneak peek at what they expect from Thursday’s United States Consumer Price Index (CPI) data due at 13:30 GMT.
Key quotes
“US CPI tonight was always going to be the week’s banner event and nothing so far this week has diminished the significance of it, especially with several Fed officials in recent days openly talking of the February 1 FOMC decision being between either 25bps or 50bps.”
“Which side of expectations CPI falls could well be crucial to this debate.”
“Consensus is for headline CPI to fall to 6.5% from 7.1%, and for the core (ex-food and energy) measure to 5.7% from 6.0%.”
“Data in line with or lower this would likely see markets lift their current comfort level with 25bps rather than 50bps.”
-
06:20
Gold Price Forecast: XAU/USD bulls cheer softer DXY above $1,870 support, US inflation eyed
- Gold price remain firmer around the highest levels since May 2022.
- Resistance-turned-support from mid-November, upbeat China CPI put a floor under XAU/USD price.
- Downbeat market consensus for US CPI, Fed’s hesitance keeps Gold buyers hopeful.
Gold price (XAU/USD) clings to mild gains around $1,885 as expectations for softer US inflation underpin cautious optimism during early Thursday. As a result, the US Dollar keeps the recent bearish bias while tracking downbeat US Treasury yields.
That said, the US 10-year Treasury yields dropped two basis points (bps) to 3.53% while the US two-year bond coupons also traced the 10-year counterpart and print mild losses at around 4.21% at the latest.
Not only the downbeat yields but mildly bid US stock futures and dovish comments from Federal Reserve Bank of Boston President Susan Collins also weigh on the US Dollar. With this, the US Dollar Index (DXY) prints mild losses around 103.10 as bears poke the lowest levels marked since early June, tested earlier in the last week.
Furthermore, the risk-positive headlines from China’s National Development and Reform Commission (NDRC) and China’s firmer Consumer Price Index (CPI) for December add strength to the Gold buying.
It’s worth observing that market forecasts of softer US CPI data for December, expected 6.5% YoY versus 7.1% prior, also favor the XAU/USD buyers. That said, the Core CPI, namely the CPI ex Food & Energy, will be observed closely for clear directions and is expected to be 5.7% versus 6.0% prior.
Gold price technical analysis
Gold price ignores the previous bearish Doji candlestick to remain firmer above the resistance line from mid-November, around $1,868 by the press time.
The yellow metal also pays little to the overbought RSI conditions, which in turn suggests that the XAU/USD buyers are running out of steam. Additionally, an area comprising lows marked during March 2022 around $1,890-95 and the $1,900 threshold also stands tall to challenge the Gold’s upside momentum.
As a result, the quote’s north-run appears limited unless it crosses the $1,900 threshold, a break of which could quickly propel it towards a late March 2022 swing high near $1,966 before highlighting the $2,000 psychological magnet for the XAU/USD bulls.
Alternatively, a downside break of the $1,870 support line, the previous resistance, could quickly drag the metal toward the one-month-old horizontal support near $1,822.
Following that, the 50-DMA and the 200-DMA could challenge the Gold sellers around $1,787 and $1,777 in that order.
Gold price: Daily chart
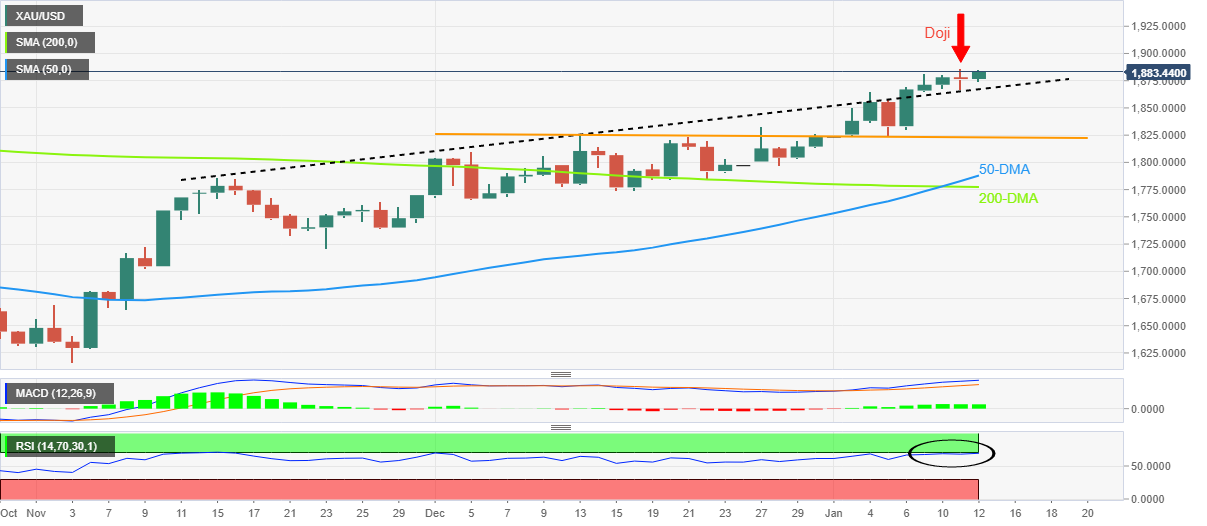
Trend: Limited upside expected
-
06:06
USD/JPY refreshes day’s low around 131.40 as street sees further softening of US Inflation
- USD/JPY has refreshed its day’s low at 131.40 as odds for further US inflation softening soar.
- Federal Reserve might look to tweak its monetary policy projections if US inflation continues its downside spree.
- The Bank of Japan is firmly considering an exit from its secular long ultra-loose monetary policy.
- USD/JPY is hovering near the lower portion of the inventory adjustment phase.
USD/JPY has witnessed a steep fall and has refreshed its day’s low at 131.40 as the Bank of Japan (BoJ) is considering an exit from its decade-long ultra-loose monetary policy. The asset is witnessing immense selling pressure in the early European session and is expected to extend its downside journey as the US Dollar index (DXY) is declining gradually toward the crucial support around 102.50.
The USD Index is continuously declining since opening amid an improvement in investors’ risk appetite. Also, S&P500 futures have recovered their marginal loss reported in early Asia and are trading positively, portraying a cheerful market mood. The alpha generated by the US government bonds has dropped as the street is expecting further softening of United States inflation ahead. The 10-year US Treasury yields have dropped to 3.52%.
Lower gasoline prices favor further US inflation softening
Safe-haven assets have lost their traction as investors are expecting further softening of the United States Consumer Price Index (CPI) data, which is scheduled for Thursday. Analysts at Wells Fargo expect another sizable decline in energy prices to weigh on the headline and offset further gains in food and core services prices. But the drop in prices should also be helped along by another decline in core goods, led once again by used autos.
According to the NBF’s consensus, headline prices are decreasing 0.1% MoM and the year-on-year rate should come down from 7.1% to 6.7%. The Core index, meanwhile, may have continued to be supported by rising rent prices and advanced 0.3% on a monthly basis. This would translate into a two-tick decline of the 12-month rate to 5.8%.”
Fed could revise monetary policy projections if inflation softens
Escalating odds for a deceleration in the United States' inflationary pressures are expected to compel the Federal Reserve (Fed) to revise its viewpoint about the likely monetary policy action in its February meeting. Federal Reserve chair Jerome Powell and his teammates might look for trimming the size of interest rates further if inflation continues its deceleration spree and also to provide support to the slowing economic activities in the United States economy.
San Francisco Fed President Mary Daly told the Wall Street Journal (WSJ) she would pay close attention to the Consumer Price Index (CPI) data and that both options of 25- and 50-basis points (bps) hikes are open for February monetary policy meeting. A consideration of a 25 bps rate hike for the February meeting when the Federal Reserve has already trimmed its pace of hiking interest rates in December is conveying that Fed policymakers are delighted with the pressure of indicators showing a deceleration in inflationary pressures.
Chatters over exit from the loose monetary policy by the BoJ escalates
Odds for an exit from the decade-long ultra-loose monetary policy by the Bank of Japan accelerate after the announcement that the central bank will review the side effects of massive monetary policy easing at its policy meeting next week, as reported by Yomiuri. “BoJ reviews due to skewed interest rates in markets even after last month's tweak in a bond yield control policy,” adds Yomiuri per Reuters.
After a tweak in 10-year Japan Government Bonds (JGBs)’s yields by stretching its range to +- 50 basis points (bps), consideration of exit from ultra-loose monetary policy is sending hawkish signals from the Bank of Japan. Recent development in wage growth and retail demand has already pushed Japanese inflation comfortably above its 2% target.
USD/JPY technical outlook
-638091002769382824.png)
USD/JPY is hovering around the lower portion of the inventory adjustment phase formed on an hourly scale. The formation of inventory adjustment after a vertical downside move terms inventory distribution, which might result in further weakness in the asset.
The major is hovering below the 200-period Exponential Moving Average (EMA) at 132.32, which indicates that the long-term trend is bearish. Also, the bear cross, represented by the 20 and 50-EMAs at 132.24, adds to the downside filters.
Also, the Relative Strength Index (RSI) (14) has shifted into the bearish range of 20.00-40.00, which indicates that the downside momentum has been triggered.
-
05:39
GBP/JPY Price Analysis: Bears jump back from 160.80 resistance confluence
- GBP/JPY drops the most in a week while reversing from the key hurdle.
- Convergence of 21-DMA, fortnight-long descending trend line guards immediate upside.
- 61.8% Fibonacci retracement level lures bears, 164.30 appears strong resistance.
GBP/JPY stands on the slippery ground as it renews its intraday low near 159.90 during early Thursday morning in London. In doing so, the cross-currency pair prints the first daily loss in five while declining the most in a week.
That said, the pair buyers’ inability to cross the 21-DMA and a two-week-old descending trend line, around 160.80, triggered the quote’s U-turn.
Also adding strength to the downside bias is the looming bear cross between the 50-DMA and the 100-DMA and the former pierces off the latter from above.
With this, the GBP/JPY price is declining towards the last Thursday’s swing low, around 158.50, before directing the bears to the 61.8% Fibonacci retracement level of the September-October upside of the pair, near 157.70.
In a case where the quote remains bearish past 157.70, a downwards-loping support line from December 20, near 153.25, will be important to watch.
On the flip side, the 50% Fibonacci retracement near 160.50 could act as immediate resistance before the 160.80 key hurdle mentioned previously.
It’s worth noting, however, that the GBP/JPY bulls remain off guard unless the quote stays below the 164.30 resistance confluence, encompassing the 50-DMA and 100-DMA.
Overall, GBP/JPY is likely to decline further even if it manages to cross the nearby resistance.
GBP/JPY: Daily chart
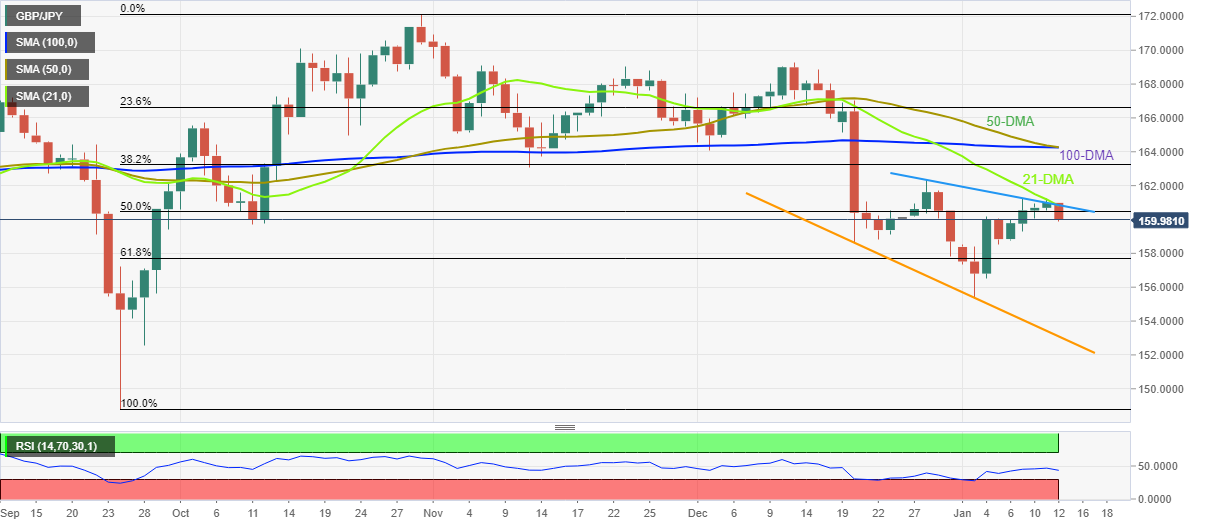
Trend: Bearish
-
05:21
EUR/JPY plummets below 142.00 as BOJ chatters push back ECB hawks
- EUR/JPY stands on slippery grounds as it snaps four-day uptrend.
- Upbeat BOJ economic assessment favors previous hawkish calls to exit easy money policy.
- ECB policymakers back further rate hikes to ward off the inflation risks.
EUR/JPY takes offers to refresh the intraday low near 141.50 heading into Thursday’s European session. In doing so, the cross-currency pair fails to justify the hawkish bias among the European Central Bank (ECB) policymakers as talks of the Bank of Japan’s (BOJ) exit from the easy money policy gain momentum.
Recently, the BOJ raised its economic assessment for four of the country's nine regions in a quarterly report. In doing so, the Japanese central bank maintained its assessment of the remaining five regions. "Many regions saw their economies pick up, or pick up moderately," the BOJ said in the quarterly report.
Given the firmer economic assessments, calls for the BOJ’s push for restrictive monetary policy, after tweaking the Yield Curve Control (YCC) in the last meeting, gain major attention and favor the EUR/JPY bears. Earlier in Asia, Japanese media Yomiuri stated that the BOJ will review the side effects of its massive monetary easing at its policy meetings next week.
On the other hand, ECB policymaker Robert Holzmann stated that rates will have to rise significantly further to reach levels that are sufficiently restrictive to ensure a timely return of inflation to target. On the same line, the ECB Governing Council member and French central bank governor Francois Villeroy de Galhau said, “ECB should aim to reach the terminal rate by the summer.” Furthermore, ECB member Olli Rehn said that rates in the Euro Zone will still have to rise significantly in the next couple of meetings and reach restrictive levels to dampen inflation.
Amid these plays, the yields remain downbeat but the stock futures are cautiously optimistic as traders await this week’s key catalyst, namely the US Consumer Price Index (CPI) for December.
Technical analysis
A clear downside break of the one-week-old ascending trend line, now resistance around 142.35, directs EUR/JPY towards the 200-DMA level surrounding 140.70.
-
05:12
BOJ raises economic view for four of Japan's nine regions
In its quarterly report, the Bank of Japan (BoJ) raised its economic assessment for four out of Japan’s nine regions.
Additional takeaways
BoJ raises economic assessment for 3 of Japan's 9 regions.
BoJ maintains economic assessment for 5 of Japan's 9 regions.
Many Japan regions saw their economies pick up or pick up moderately.
-
05:02
Japan Eco Watchers Survey: Outlook up to 47 in December from previous 45.1
-
05:01
Japan Eco Watchers Survey: Current: 47.9 (December) vs previous 48.1
-
04:57
AUD/USD grinds higher past 0.6900 on cautious optimism ahead of US inflation
- AUD/USD picks up bids to print two-day uptrend, mildly bid of late.
- Upbeat Aussie trade data joins mixed China inflation to put a floor under the prices.
- Softer US Treasury bond yields, Fed’s hesitance and downbeat market consensus for US CPI favor bulls.
AUD/USD clings to mild gains around 0.6920, despite lacking follow-through, amid slightly positive market sentiment during early Thursday. In doing so, the Aussie pair cheers the early-day economics from Australia and China, as well as hopes of softer US inflation, amid a cautious mood ahead of the key US Consumer Price Index (CPI) for December.
That said, Australia’s Trade Balance improved to 13,201M in November versus 10,500M market forecasts and 12,217 previous readings. Further details suggest that the Imports reprint 1.0% contraction while the Exports improved to 0.0% versus -1.0% prior during the stated month.
On the other hand, China’s headline CPI YoY grew 1.8% YoY in December versus 1.8% expected and 1.6% prior whereas the Producer Price Index (PPI) marked -0.7% figures compared to -1.3% previous readings and -0.1% market forecasts.
Elsewhere, risk-positive headlines from China’s National Development and Reform Commission (NDRC) also seemed to have put a floor under the AUD/USD prices, due to Aussie-Sino ties. “China has a solid basis to keep prices stable in 2023,” said NDRC earlier on Thursday.
Additionally, Federal Reserve Bank of Boston President Susan Collins’ support for smaller rate increases and market forecasts of a softer US CPI data for December, expected 6.5% YoY versus 7.1% prior, also favor the AUD/USD buyers. That said, the Core CPI, namely the CPI ex Food & Energy, will be observed closely for clear directions and is expected to be 5.7% versus 6.0% prior.
Technical analysis
AUD/USD pair’s ability to defend the previous week’s upside break of the 200-DMA and a downward-sloping trend line from June, respectively around 0.6830 and 0.6815, keeps the buyers hopeful of crossing a two-month-old ascending resistance line, around 0.6960 at the latest.
-
04:48
Asian Stock Market: Demonstrates caution ahead of US Inflation, oil eyes auction above $78.00
- Asian stocks are displaying anxiety as investors await US inflation for fresh impetus.
- Weaker-than-projected China’s PPI data may impact equities on expectations of lower operating margins.
- Oil prices are looking to extend gains above $78.00 on expectations of recovery in China’s growth.
Markets in the Asian domain have turned cautious as investors are awaiting the release of the United States inflation data for fresh cues. This has turned the potential assets sideways as investors are avoiding getting caught in volatile moves before the release. The US Dollar Index (DXY) is facing barricades around 102.80 while S&P500 futures are displaying a subdued performance after two back-to-back bullish trading sessions.
At the press time, Japan’s Nikkei225 trades almost flat, ChinaA50 drops 0.17%, Hang Seng eased 0.12%, and Nifty50 slips 0.20%.
Chinese stocks have also been impacted after the release of the mixed Consumer Price Index (CPI) data. The annual CPI figure has remained in line with the expectations at 1.8% and higher than the former release of 1.6%. While, the price index at the factory gate has dropped sharply, signaling less bargaining power from producers. The Producer Price Index (PPI) has shrunk by 0.7% vs. the expectation of 0.1% contraction. A decline in PPI numbers I expected to impact Chinese equities ahead as lower prices are likely to impact their operating margins.
Meanwhile, Japanese markets are likely to display wild gyrations as the Bank of Japan (BoJ) will review the side-effects of secular period ultra-loose monetary policy managed by the central bank. Japanese officials are considering shifting the paradigm of their monetary policy approach as an exit to easy monetary policy may provide support to the Japanese yen for a longer period.
On the oil front, oil prices are aiming to accelerate gains further above $78.00 amid optimism over a recovery in China’s economic growth led by the reopening of the economy and heavy bets on further softening of the US inflation.
-
04:30
GBP/USD Price Analysis: Potentially bullish above 1.2110 as Doji forms off 200-day EMA
- GBP/USD grinds near intraday high, snaps two-day losing streak.
- Bullish candlestick formation, sustained bounce off key moving average favor buyers.
- Sellers remain off the table unless witnessing fresh monthly low.
GBP/USD justifies the previous day’s bullish candlestick formation above the 200-day Exponential Moving Average (EMA) as it prints the first daily gains in three. That said, the Cable pair portrays mild gains near 1.2165 heading into Thursday’s London open.
That said, the quote bounced off the 200-day EMA on Wednesday and marked a Doji candlestick to signal a reversal of the previous downside. Adding strength to the upside bias was the impending bull cross on the MACD indicator.
As a result, the GBP/USD buyers are well-set to poke the 1.2200 threshold comprising a three-week-old descending resistance line.
It’s worth noting, however, that the Cable pair’s strength past 1.2200 will need validation from the monthly high and the December 19, 2022 peak, respectively around 1.2210 and 1.2245, could act as the last defences of the bears before challenging the previous monthly peak of 1.2446.
Meanwhile, GBP/USD sellers may refrain from taking any positions unless the quote stays beyond the 200-day EMA level of 1.2110.
Following that, the 1.2000 psychological magnet and the monthly low of 1.1841 could entertain the bears.
In a case where the GBP/USD prices remain weak past 1.1841, the odds of witnessing a slump towards the late October swing high near 1.1645 can’t be ruled out.
GBP/USD: Daily chart

Trend: Further upside expected
-
04:11
USD/CAD struggles to surpass 1.3440, traces footprints of USD Index ahead of US Inflation
- USD/CAD is facing hurdles in surpassing the 1.3440 resistance amid lackluster trading activities.
- The Lonnie asset is following the footprints of the US Dollar Index, which has turned sideways ahead of US inflation.
- The street is expecting further softening of the US price index led by declining gasoline prices.
The USD/CAD pair is displaying a sideways auction in a 1.3404-1.3440 range in the Asian session. The Loonie asset is unable to find any direction as investors have restricted themselves from building potential positions till the release of the United States inflation data. Also, the major is following the footprints of the US Dollar Index (DXY).
The US Dollar Index has shifted its auction profile below 102.80 as investors are surrendering the safe-haven assets amid rising expectations for further softening of the Consumer Price Index (CPI). The USD Index is weighing down by the rising demand for US Treasury bonds. This has led to a fall in the 10-year US Treasury yields to 3.52%. Meanwhile, the risk profile still seems positive as the S&P500 futures are showing a marginal fall after two back-to-back bullish trading sessions.
It is highly likely that the release of the US inflation data will result in a power-pack action in the FX domain. Considering the consensus, the US, inflation is clearly on the retreat. From its peak of 9.1% in June, the YoY rate most recently fell to 7.1% in November. For December, we forecast a further decline to 6.4%. Used car prices are likely to have fallen by almost 3% in December from November, as reported by Commerzbank. Also, the Core inflation rate to decrease from 6.0% to 5.6%.
Further softening of the US price index will force the Federal Reserve (Fed) to pen down its monetary policy blueprint again, which will release in the first week of February. It might force Fed chair Jerome Powell to look for a smaller interest rate hike in their long-time fight against stubborn inflation.
On the oil front, oil prices have soared vertically to near $78.00 as the Chinese economy is reopening at a sheer pace of scale. This has led to an upward revision of Gross Domestic Product (GDP) projections for the Chinese economy. It is worth noting that Canada is a leading exporter of oil to the United States and higher oil prices might support the Canadian Dollar.
-
04:07
USD/INR Price News: Indian Rupee stays defensive near 81.60 as markets await US CPI
- USD/INR seesaws near five-week low as bears take a breather after six-day downtrend.
- Upbeat Oil prices, unimpressive details from India join mixed China inflation to keep buyers hopeful.
- Markets brace for softer US inflation but a surprise can’t be ruled out.
USD/INR treads water around 81.65 as bears run out of steam after six-day dominance. In doing so, the Indian Rupee (INR) pair trades near the lowest level since early December while printing minor gains for the first time in over a week.
The quote’s latest consolidation could be linked to the traders’ anticipation of softer US Consumer Price Index (CPI) data for December, as well as hopes of softer rate hikes and policy pivot in 2023.
The reason could be linked to the recently mixed US data and the downbeat comments from the Federal Reserve (Fed) officials. On Wednesday, Boston Fed President Susan Collins backed the smaller rate increases while stating that she leans at this stage to a 25 bps hike. The policy, however, also mentioned that it is very data-dependent. Earlier in the week, Fed Chair Jerome Powell hesitated in conveying monetary policy outlook and raised hopes of a policy pivot. It’s worth noting that downbeat United States activity numbers and sluggish wage growth join softer prints of the NFIB Business Optimism Index for December and mixed Wholesale Inventories for November of late.
On the other hand, the WTI crude oil jumped the most in two months the previous day amid hopes of more energy demand from China, mildly offered near $77.80 by the press time. That said, the black gold’s latest pullback could also be linked to the high inventory build as Reuters quotes the US Energy Information Administration (EIA) saying that crude inventories jumped by 19.0 million barrels last week, the third biggest weekly gain ever and the most since stocks rose by a record 21.6 million barrels in Feb 2021.
Elsewhere, China’s headline CPI YoY grew 1.8% YoY versus 1.8% expected and 1.6% prior whereas the Producer Price Index (PPI) marked -0.7% figures compared to -1.3% previous readings and -0.1% market forecasts. It should be noted that China’s total reopening and early signals of heavy holiday shopping join the chatters that the People’s Bank of China (PBOC) will adhere to rate cuts in 2023 to spread the Beijing-inspired optimism and put a floor under USD/INR prices.
Moving ahead, USD/INR traders should pay attention to US CPI details, more importantly to the US CPI ex Food & Energy, amid downbeat expectations and the Fed policymakers’ hesitance in being hawkish. Should the actual outcome arrive as weak, the USD/INR pair may drop further toward 81.00.
Technical analysis
A daily closing below five-month-old ascending support line, now resistance around 81.75, keeps USD/INR buyers hopeful of witnessing further declines.
-
03:40
Gold Price Forecast: XAU/USD eyes $1,900 and US CPI on renewed upside – Confluence Detector
- Gold price looks north, as US Dollar licks its wounds amid sluggish Treasury yields.
- Markets turn cautious amid expectations of a softer US CPI report.
- Gold bulls stay hopeful whilst above critical $1,825 support, eye $1,850 again.
Gold price is holding near eight-month highs, as bulls seek another to take on the $1,900 barrier ahead of the all-important US Consumer Price Index (CPI) data release. The US Dollar remains vulnerable amid expectations of a softer US CPI print, which ramp up bets for a dovish Federal Reserve (Fed) pivot later this year. Markets are pricing the Fed to slow its pace of tightening amid cooling inflation and a tight labor market, with about an 80% probability of a 25 basis points (bps) rate hike seen at the start of the next month. Gold price is also benefiting from the underperformance in the US Treasury bond yields across the curve. Despite the latest hawkish commentary from the Fed officials, investors refuse to give up on hopes that the Fed will turn dovish on its policy stance. Besides, risk trends will also play a pivotal role in the Gold price action in the day ahead.
Also read: US December CPI Preview: EUR/USD and USD/JPY are pairs to watch
Gold Price: Key levels to watch
The Technical Confluence Detector shows that the gold price is gathering pace to scale the critical resistance at around $1,885-$1,886, where the pivot point one-day R1 and Bollinger Band one-day Upper merge.
A fresh upswing could be triggered on a firm break above the latter, opening doors toward the pivot point one-day R2 at $1,896. Further up, the $1,900 threshold could be put to test should Gold bulls flex their muscles. That level is the convergence of the pivot point one-week R2 and Fibonacci 161.8% one-day.
Alternatively, a dense cluster of healthy support levels is aligned between $1,879-$1,875, which could guard against the downside in Gold price. At that demand area, the Fibonacci 38.2% one-day, pivot point one-month R2 and SMA10 four-hour intersect.
The next downside target is seen at the previous week’s high of $1,870, below which Gold sellers will target the previous day’s low at $1,867.
Here is how it looks on the tool
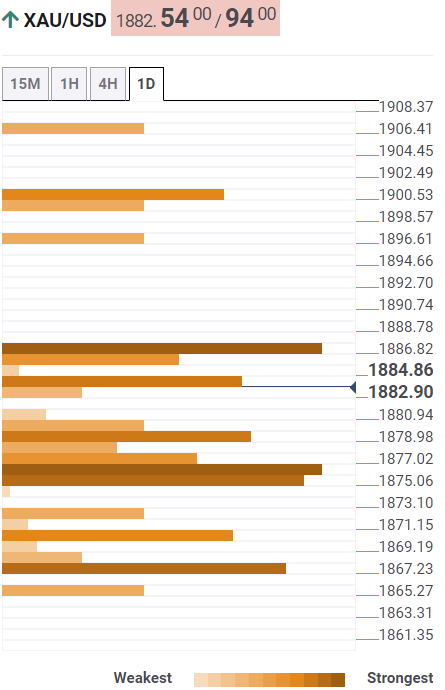
About Technical Confluences Detector
The TCD (Technical Confluences Detector) is a tool to locate and point out those price levels where there is a congestion of indicators, moving averages, Fibonacci levels, Pivot Points, etc. If you are a short-term trader, you will find entry points for counter-trend strategies and hunt a few points at a time. If you are a medium-to-long-term trader, this tool will allow you to know in advance the price levels where a medium-to-long-term trend may stop and rest, where to unwind positions, or where to increase your position size.
-
03:32
EUR/GBP Price Analysis: Turns sideways around 0.8850 post correction from three-month high
- EUR/GBP is facing barricades while crossing the 0.8878-0.8882 hurdle.
- The 20-EMA at 0.8853 is providing support to the Euro bulls.
- A slippage of the RSI (14) into the 40.00-60.00 range indicates a loss in the upside momentum.
The EUR/GBP pair is displaying back-and-forth moves around 0.8850 in the Asian session. The asset corrected after printing a fresh three-month high at 0.8885 on Wednesday. For the past eight trading sessions, the cross is struggling to extend upside above the critical resistance of 0.8880 comfortably.
The cross is expected to display a power-pack action after the release of the United Kingdom manufacturing activities data that comprises Manufacturing Production, Industrial Production, and Gross Domestic Product (GDP) data, which is scheduled for Friday.
On an hourly scale, EUR/GBP has sensed barricades while attempting to cross the supply zone placed in a narrow range of 0.8878-0.8882. After a corrective move, the 20-period Exponential Moving Average (EMA) at 0.8853 is providing support to the Euro bulls. Upward-sloping 50-EMA at 0.8844 adds to the upside filters.
The Relative Strength Index (RSI) (14) has slipped into the 40.00-60.00 range after failing to sustain into the bullish range of 60.00-80.00, which indicates a loss in the upside momentum.
For a fresh upside, the cross needs to overstep a three-month high at 0.8885, which will drive the asset towards September 29 high at 0.8979, followed by the psychological resistance at 0.9000.
On the flip side, a slippage below January 9 low at 0.8767 will drag the asset toward November 18 high at 0.8739. A downside move below the latter will further push the cross lower to December 19 low at 0.8690.
EUR/GBP hourly chart
-638090910724323678.png)
-
03:04
EUR/USD clings to mild gains below 1.0800 as ECB hawks battle with Fed doves ahead of US inflation
- EUR/USD prints five-day uptrend as bulls keep the reins at the highest levels since mid-2022.
- ECB policymakers continue suggesting needs for higher rates but Fed talks appear to lose hawkish bias of late.
- Risk-on mood, hopes of softer US inflation adds strength to upside momentum.
EUR/USD holds onto bullish bias around the 1.0770-80 region, the highest since May 2022, as markets await the all-important US inflation data on early Thursday.
That said, downbeat expectations from the US Consumer Price Index (CPI) for December join recently dovish comments from the Fed policymakers to keep the pair buyers hopeful ahead of the release. Adding strength to the upside bias are the hawkish comments from the European Central Bank (ECB) policymakers.
On Wednesday, ECB policymaker Robert Holzmann stated that rates will have to rise significantly further to reach levels that are sufficiently restrictive to ensure a timely return of inflation to target. On the same line, the ECB Governing Council member and French central bank governor Francois Villeroy de Galhau said, “ECB should aim to reach the terminal rate by the summer.” Furthermore, ECB member Olli Rehn said that rates in the Euro Zone will still have to rise significantly in the next couple of meetings and reach restrictive levels to dampen inflation.
On the other hand, Federal Reserve Bank of Boston President Susan Collins backed the smaller rate increases while stating that she leans at this stage to a 25 bps hike. The policy, however, also mentioned that it is very data-dependent. Earlier in the week, Fed Chair Jerome Powell hesitated in conveying monetary policy outlook and raised hopes of a policy pivot.
It should be noted that China’s total reopening and early signals of heavy holiday shopping join the chatters that the People’s Bank of China (PBOC) will adhere to rate cuts in 2023 to spread the Beijing-inspired optimism and exert downside pressure on the US Dollar.
Also weighing on the greenback could be the downbeat Treasury bond yields as the US 10-year Treasury yields dropped two basis points (bps) to 3.53% while the US two-year bond coupons also traced the 10-year counterpart and print mild losses at around 4.21% at the latest.
Looking forward, a light calendar ahead of the US CPI data can keep the EUR/USD pair firmer without much noise. However, a surprisingly strong print of US inflation data could justify the Federal Reserve’s (Fed) hesitance in letting the doves in and can trigger the much-awaited pullback of the major currency pair.
Technical analysis
A successful break of a descending trend line from December 15, 2022, around 1.0685 by the press time, joins the looming bull cross on the MACD to keep buyers hopeful. However, the RSI (14) line is near the overbought conditions and suggests limited upside room for the pair. That said, the May 2022 peak of 1.0786 and the March 2022 bottom surrounding 1.0805 become crucial resistances to watch during the EUR/USD pair’s further upside.
-
02:53
US Q1 2023 GDP raised to 0.5% vs. 0% – Barclays
The Barclays Research Team raised its forecasts for US Gross Domestic Product (GDP) for the first quarter of 2023, in its latest client note.
Key quotes
“US GDP for the first quarter raised to a 0.5% expansion, from its original estimate of zero growth.”
“Barclays’ new forecast was a decline from its estimate of a fourth-quarter rise of 2.0% last year.”
“Payroll gains are likely to drop from an average of 241,000 per month in the fourth quarter to 100,000 per month in the first quarter of 2023.“
“Fed will cut the target fed funds rate to between 4.5% and 4.75% at the end of 2023, and continue it lower through next year, hitting 3.0% to 3.25% by the end of 2024.”
-
02:44
AUD/JPY Price Analysis: Reverses from four-month-old resistance amid looming bear cross
- AUD/JPY snaps four-day winning streak, stays pressured around intraday low of late.
- Descending trend line from September 2022 challenges buyers.
- Impending bearish moving average crossover keeps sellers hopeful despite bullish MACD signals.
AUD/JPY takes a U-turn from the short-term key resistance line while snapping four-day uptrend during early Thursday, down 0.45% intraday near 91.10 by the press time. In doing so, the cross-currency pair also teases a bearish moving average crossover on the daily chart.
That said, the 100-DMA knocks the 200-DMA from above and suggests the AUD/JPY pair’s further downside. However, a daily closing of the 100-DMA beneath the 200-DMA becomes necessary to confirm the bearish signal.
Following that, October 2022 low near 90.85 and the 90.00 round figure could lure the pair sellers.
However, a three-week-old ascending support line near 87.70 and the previous monthly low near the 87.00 round figure could challenge the bears afterward.
Meanwhile, recovery moves must provide a daily close beyond the descending resistance line from September, close to 91.60, to convince AUD/JPY buyers.
Even so, a convergence of the aforementioned key moving averages, around 93.20-30 by the press time, appears a tough nut to crack for the bulls.
In a case where AUD/JPY remains firmer past 93.30, the odds of witnessing a run-up towards the October 2022 peak surrounding 95.75 can’t be ruled out.
Overall, AUD/JPY is likely to witness further downside unless the quote crosses the 91.60 hurdle.
AUD/JPY: Daily chart
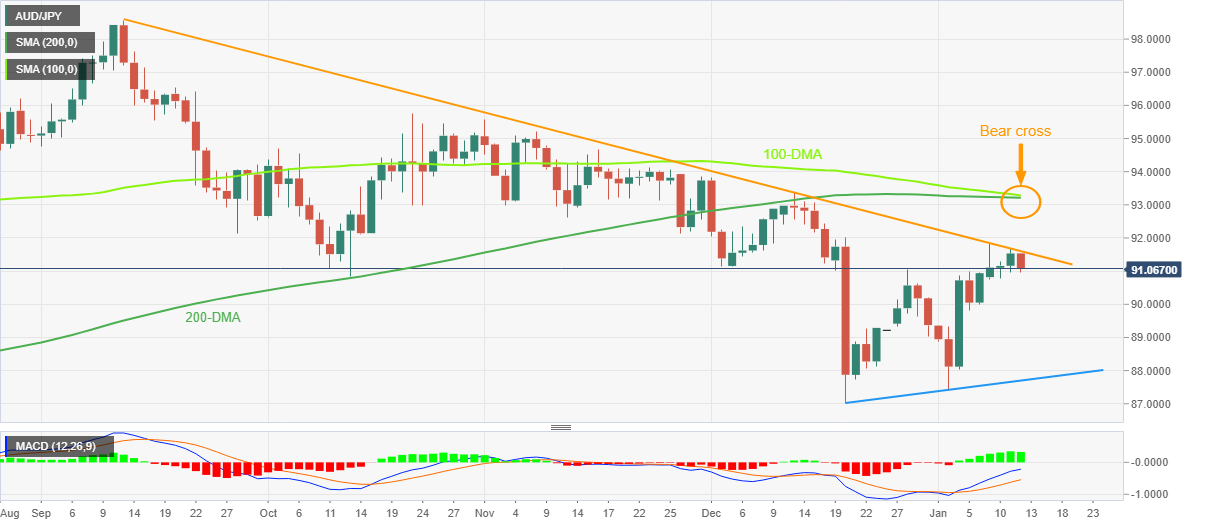
Trend: Further downside expected
-
02:22
NDRC: China is confident in its ability to keep prices stable
Despite an uptick in China’s Consumer Price Index (CPI) in December, the country’s state planner, the National Development and Reform Commission (NDRC), said on Thursday that “China is confident in its ability to keep prices stable.”
Additional quotes
“China has a solid basis to keep prices stable in 2023.”
“In 2023, imported inflation pressure will remain in China.”
Market reaction
AUD/USD is unfazed by the above comments, keeping its range at around 0.6915, up 0.24% on the day.
-
02:16
S&P 500 Futures portray pre-data anxiety as markets await US inflation, bond yields remain depressed
- Market sentiment remains dicey amid cautious mood ahead of the key data.
- S&P 500 Futures struggle to track Wall Street’s gains at one-month high.
- US 10-year, two-year Treasury bond yields extend previous day’s losses.
- Expectations of softer US inflation keep optimists hopeful even as Fed policymakers defend rate hikes.
Bulls and bears jostle in the markets ahead of Thursday’s all-important US inflation data. Adding strength to the market’s indecision could be the recently mixed China Consumer Price Index (CPI) and Producer Price Index (PPI) figures for December, as well as a light calendar elsewhere.
While portraying the mood, S&P 500 Futures struggled for clear directions at the monthly high of 3,991 whereas the US 10-year Treasury yields dropped two basis points (bps) to 3.53% by the press time. It’s worth noting that the US two-year bond coupons also traced the 10-year counterpart and print mild losses at around 4.21% at the latest.
That said, China’s headline CPI matched 1.8% YoY forecasts versus 1.6% prior whereas the Producer Price Index (PPI) marked -0.7% figures compared to -1.3% previous readings and -0.1% market consensus.
Elsewhere, Federal Reserve Bank of Boston President Susan Collins backed the smaller rate increases while stating that she leans at this stage to a 25 bps hike. The policy, however, also mentioned that it is very data-dependent. Earlier in the week, Fed Chair Jerome Powell hesitated in conveying monetary policy outlook and raised hopes of a policy pivot.
On a different page, China’s total reopening and early signals of heavy holiday shopping join the chatters that the People’s Bank of China (PBOC) will adhere to rate cuts in 2023 to spread the Beijing-inspired optimism.
Amid these plays, the US Dollar Index (DXY) remains pressured around 103.10, down 0.13% intraday, whereas WTI crude oil remains indecisive around $77.70 after rising the most in two months the previous day.
Looking forward, market players may witness lackluster moves ahead of the US inflation data. However, expectations of a softer outcome and recently mixed comments from the Fed policymakers raise fears of a wild move in case the actual outcome disappoints.
Also read: US December CPI Preview: EUR/USD and USD/JPY are pairs to watch
-
02:14
US CPI Preview: Softer print to send stocks higher – JP Morgan
Analysts at JP Morgan offer various scenarios for the United States Consumer Price Index (CPI) data due on Thursday and its market impact.
Key quotes
“Investors are largely defensively positioned ... any evidence that the Federal Reserve’s inflation-fighting campaign is working will spark a rush to unwind bearish positions.”
“This should aid the nascent bear rally, but we remain cautious as long as the Fed remains active with its tightening cycle.”
“Our scenario analysis is skewed bullishly based upon positioning that could cause an overreaction via short-covering on a dovish print.”
“A repricing of expectations for a pause in the tightening cycle at the Fed’s March meeting seems likely only if CPI prints below 4.5% to 5%.”
“If the CPI is higher than 6.6%, it is expected to hit risky assets with bond yields rising along the curve.”
“A reading above 6.8% threatens to shock investors with what the team calls “a tail event.”
-
01:59
NZD/USD whipsaws around 0.6370 despite firmer China CPI, focus on US inflation
- NZD/USD struggles for clear directions after two-day downtrend.
- China CPI matches upbeat expectations, PPI drops below forecasts in December.
- New Zealand Building Permits rallied in November and favored bulls ahead of key data.
- Hopes of softer US inflation rekindle policy pivot talks but Fed hawks resist stepping back.
NZD/USD dribbles around 0.6360-70 as bulls and bears jostle ahead of the key US inflation data. Adding strength to the Kiwi pair traders' indecision are the recent mixed signs from China’s Consumer Price Index (CPI) and Producer Price Index (PPI) data for December, flashed early Thursday.
China’s headline CPI YoY grew 1.8% YoY versus 1.8% expected and 1.6% prior whereas the Producer Price Index (PPI) marked -0.7% figures compared to -1.3% previous readings and -0.1% market forecasts. Earlier in the day, New Zealand’s Building Permits for November rallied 7% MoM versus -0.1% market forecasts and -10.7% prior slump.
It’s worth noting that the Fed policymakers’ hesitance in praising the market’s dovish bias contrasts with the cautious mood ahead of the key US inflation data to challenge the NZD/USD traders. However, China-linked optimism and upbeat housing figures at home put a floor under the prices.
Federal Reserve Bank of Boston President Susan Collins backed the smaller rate increases while stating that she leans at this stage to a 25 bps hike. The policy, however, also mentioned that it is very data-dependent. Alternatively, China’s total reopening and early signals of heavy holiday shopping join the chatters that the People’s Bank of China (PBOC) will adhere to rate cuts in 2023 to spread the Beijing-inspired optimism.
Against this backdrop, US equities were on the front foot and yields were down while the S&P 500 Futures and the US 10-year Treasury bond yields remain indecision by the press time.
Given the market’s indecision ahead of the US CPI data, the NZD/USD traders may witness further lackluster moves before the inflation release. That said, expectations of softer US inflation keep traders on the edge as the US data has a history of disappointing market forecasts, especially when they’re too important.
Also read: US December CPI Preview: EUR/USD and USD/JPY are pairs to watch
Technical analysis
NZD/USD buyers remain hopeful as the pair defends Friday’s upside break of the one-month-old descending resistance line, now support, as well as the 200-SMA, respectively around 0.6295 and 0.6335. However, a convergence of the weekly descending trend line joins the 61.8% Fibonacci retracement level of the pair’s December-January downturn, around 0.6390, appears a tough nut to crack for the bulls.
-
01:57
USD/JPY Price Analysis: Bears testing bull's commitments at 131.50 ahead of US CPI
- USD/JPY levels to watch are now 131.50s support and 131.383 swing lows.
- Should the bears take control below 131.00 the bullish bias will turn negative.
USD/JPY is down some 0.5% on the day following the Bank of Japan headlines: BoJ to review side effects of its massive monetary easing at its policy meetings next week – Yomiuri.
Meanwhile, the technical outlook is mixed given the sudden drop in the price but so long as the bulls hold off the bears at around 131.50, then the bias is tilted to the upside. There is room for further declines for which the bulls will still be in the runnings for poll position into the US Consumer Price Index later today, but they could well capitulate on pressures below 131.38 recent lows.
USD/JPY technical analysis
Meanwhile, as per the prior analysis, USD/JPY Price Analysis: Consolidation into US CPI, bulls on the prowl, the price remains inverse daily head and shoulders and there could be a reversal on the cards.
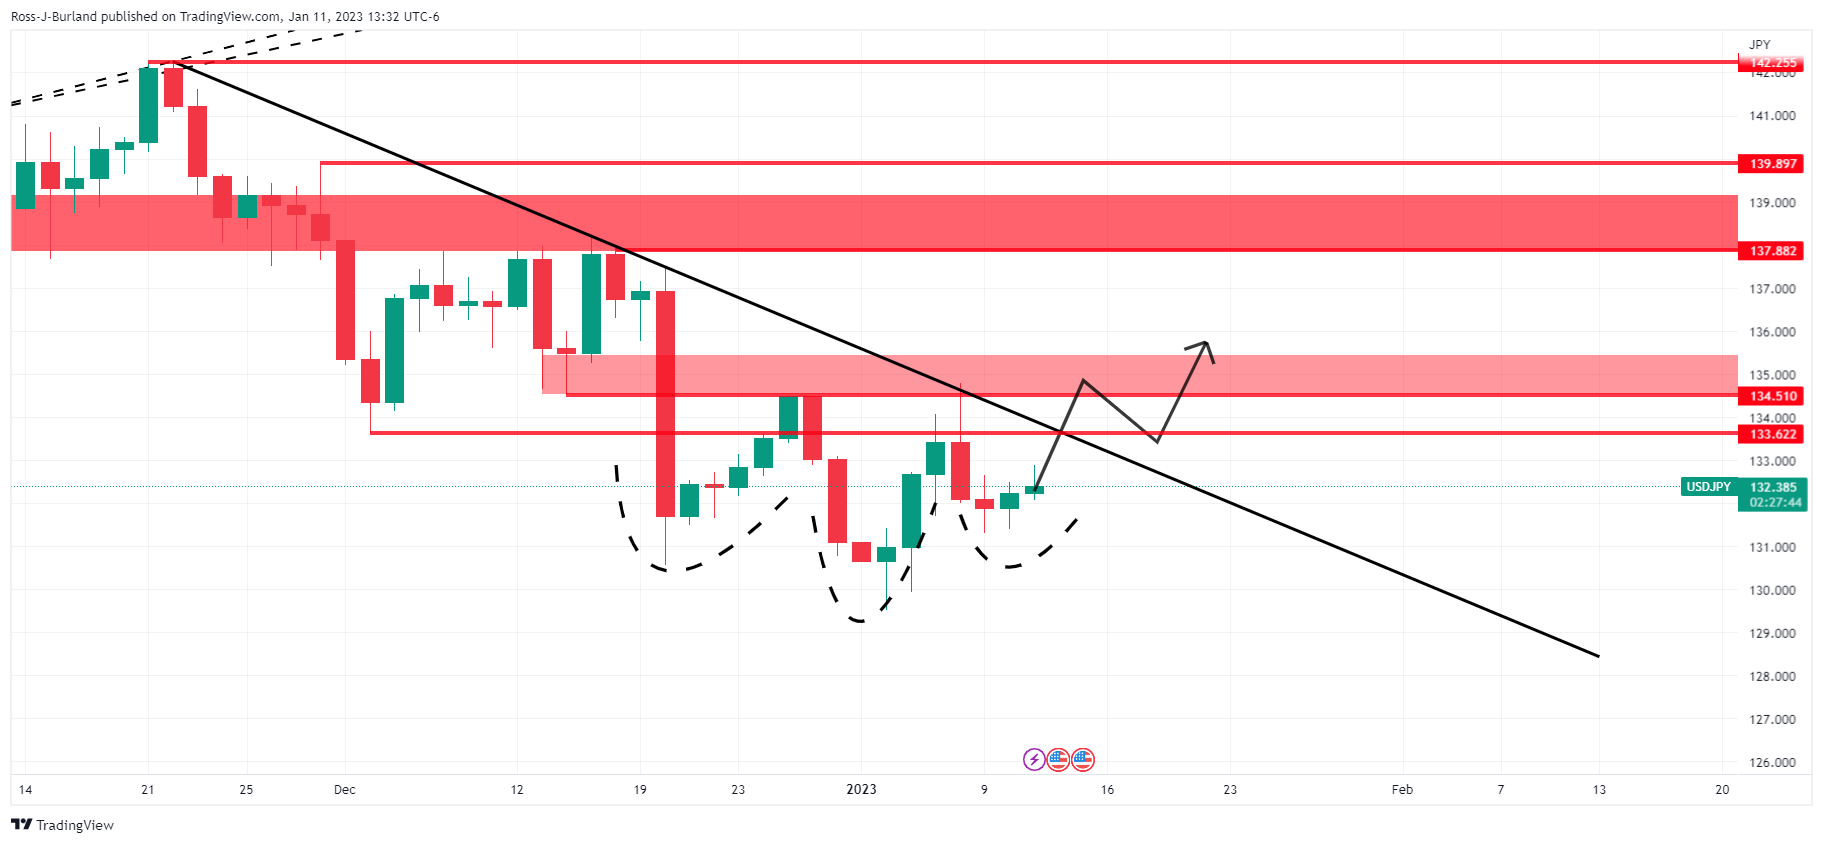
USD/JPY update, daily and H1 charts:
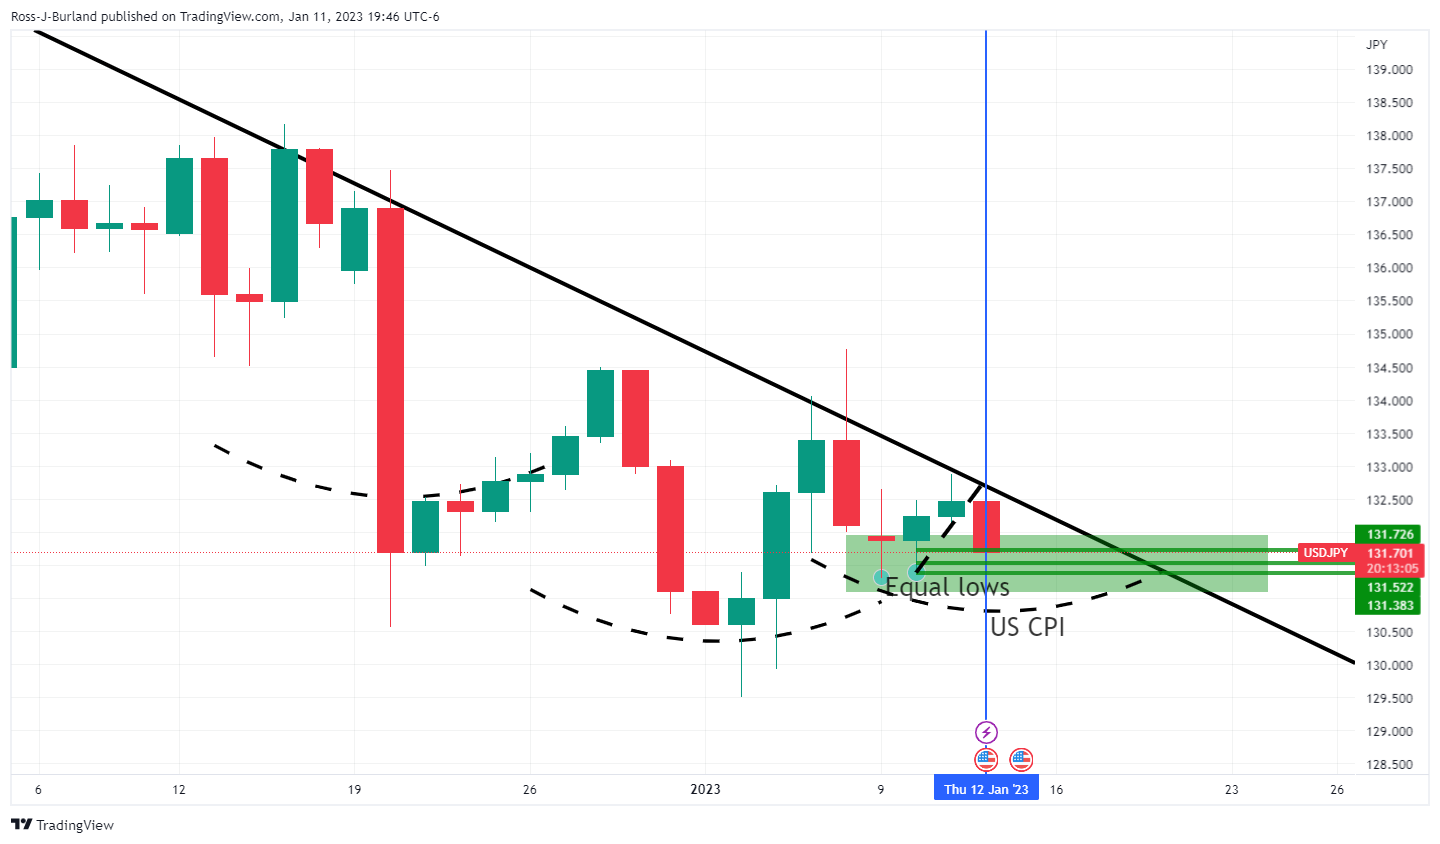
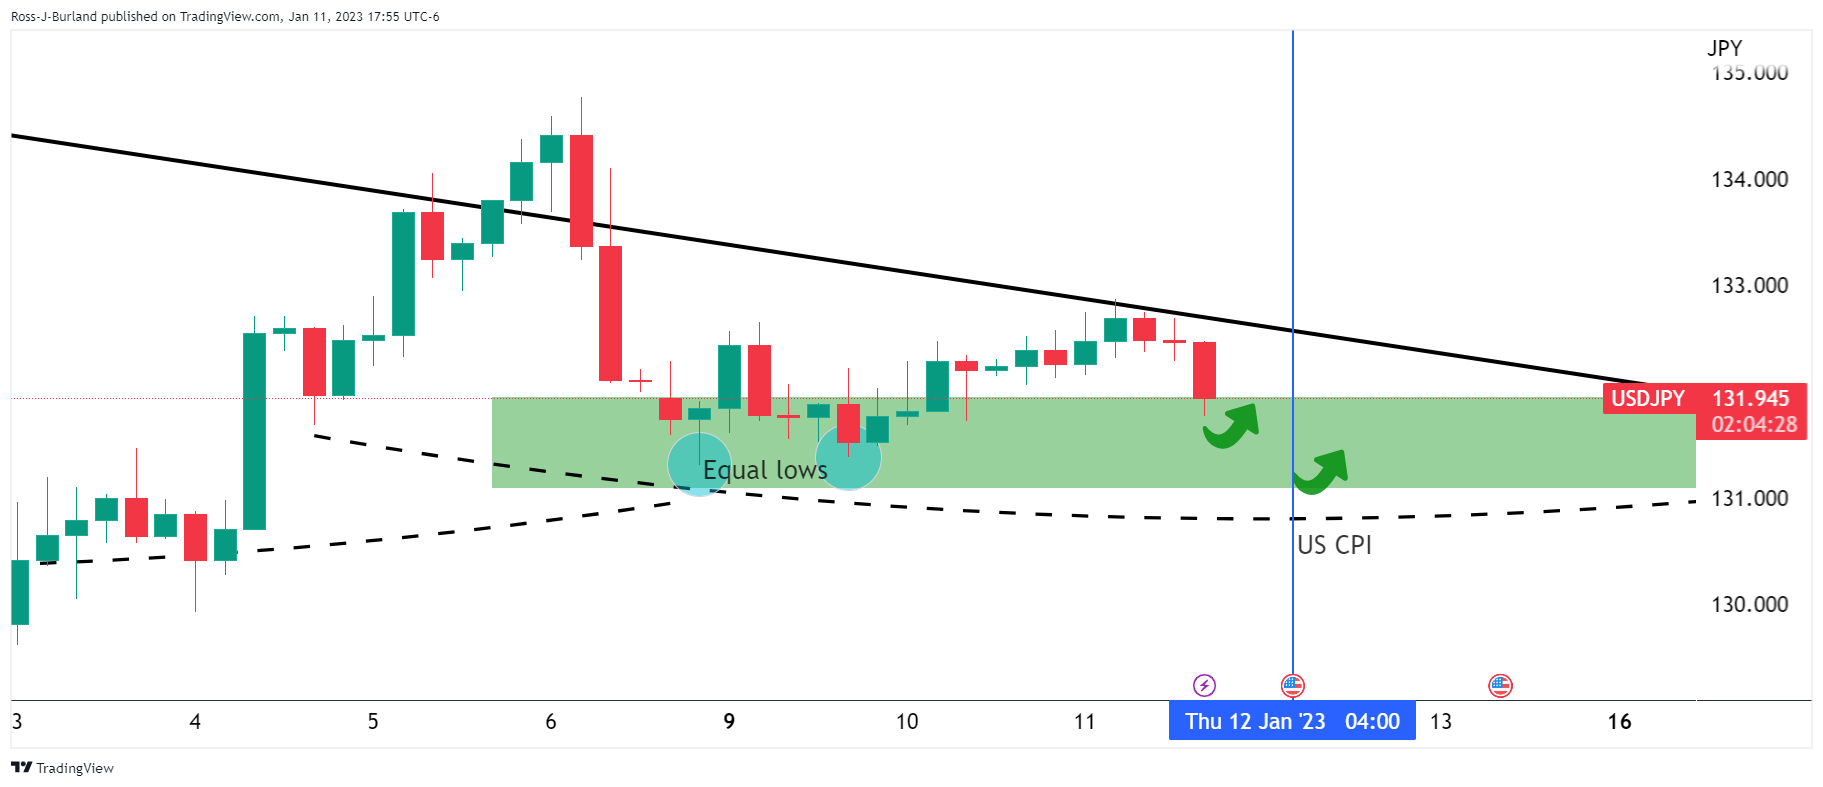
As we head over to the US CPI event, the levels to watch are now 131.50s support and 131.383 swing lows. There will be orders below these levels that could be traded before the reversal. With that being said, should the bears take control below 131.00 the bullish bias will turn negative.
-
01:46
USD/CNH extends recovery to near 6.7700 despite mix signals from China’s inflation
- USD/CNH has picked strength amid a sheer contraction in China’s factory gate price index by 0.7%.
- The upbeat market mood is weighing on the US Treasury yields.
- A decline in energy prices may result in further softening in the US inflation.
The USD/CNH pair has recovered after dropping to near 6.7550 in the Asian session. The asset has sensed demand and has extended recovery to near 6.7700 despite China’s National Bureau of Statistics (NBS) having reported mixed Consumer Price Index (CPI) data for December.
The annual CPI figure has remained in line with the expectations at 1.8% and higher than the former release of 1.6%. While, the price index at the factory gate has dropped sharply, signaling less bargaining power from producers. The Producer Price Index (PPI) has shrunk by 0.7% vs. the expectation of 0.1% contraction.
The sheer pace adopted by the Chinese administration in reopening the economy after a stretched lockdown period to combat the Covid-19 pandemic has brought a sense of optimism among market participants. The street is expected a vertical recovery in economic prospects and international trade.
Analysts at Morgan Stanley raised their forecast for China’s Gross Domestic Product (GDP) this year to above 5.0%. They further added that "If policy can remove barriers to the housing/property sectors and recovery from COVID zero then China's economic recovery should solidify starting in Q2 of this year."
Meanwhile, higher investors’ risk appetite led by string recovery in S&P500 futures this week is showing strength in risk-sensitive assets. The 10-year US Treasury yields have been weighed down by the upbeat market mood to 3.55%. The US Dollar Index (DXY) has faced barricades around 102.80 and has tilted towards the south ahead of United States inflation data.
Analysts at Wells Fargo expect another sizable decline in energy prices to weigh on the headline and offset further gains in food and core services prices. But the drop in prices should also be helped along by another decline in core goods, led once again by used autos.
-
01:35
China Consumer Price Index and China Producer Price Index fail to move the needle in AUD/USD
The China Consumer Price Index and the China Producer Price Index that are released by the National Bureau of Statistics of China have been released as follows:
- China CPI YoY Dec: 1.8% (est 1.8%, prev 1.6%).
- For the MoM: 0.0%
- China Producer Price Index YoY Dec: -0.7% (est -0.1%, prev -1.3%).
- For MoM: -0.5%.
AUD/USD update
The outcomes have failed to move the needle in AUD/USD which sits at 0.6918 in quiet pre-US CPI event markets.
On Wednesday, however, AUD/USD rallied on the knee-jerk to the Aussie data dump as follows:
-
Aussie data dump (Nov): Data comes in hot and sends AUD higher
The move was faded above 0.6900 and bears moved in at the high of 0.6925 in choppy conditions as the markets get set for the US Consumer Price Index.
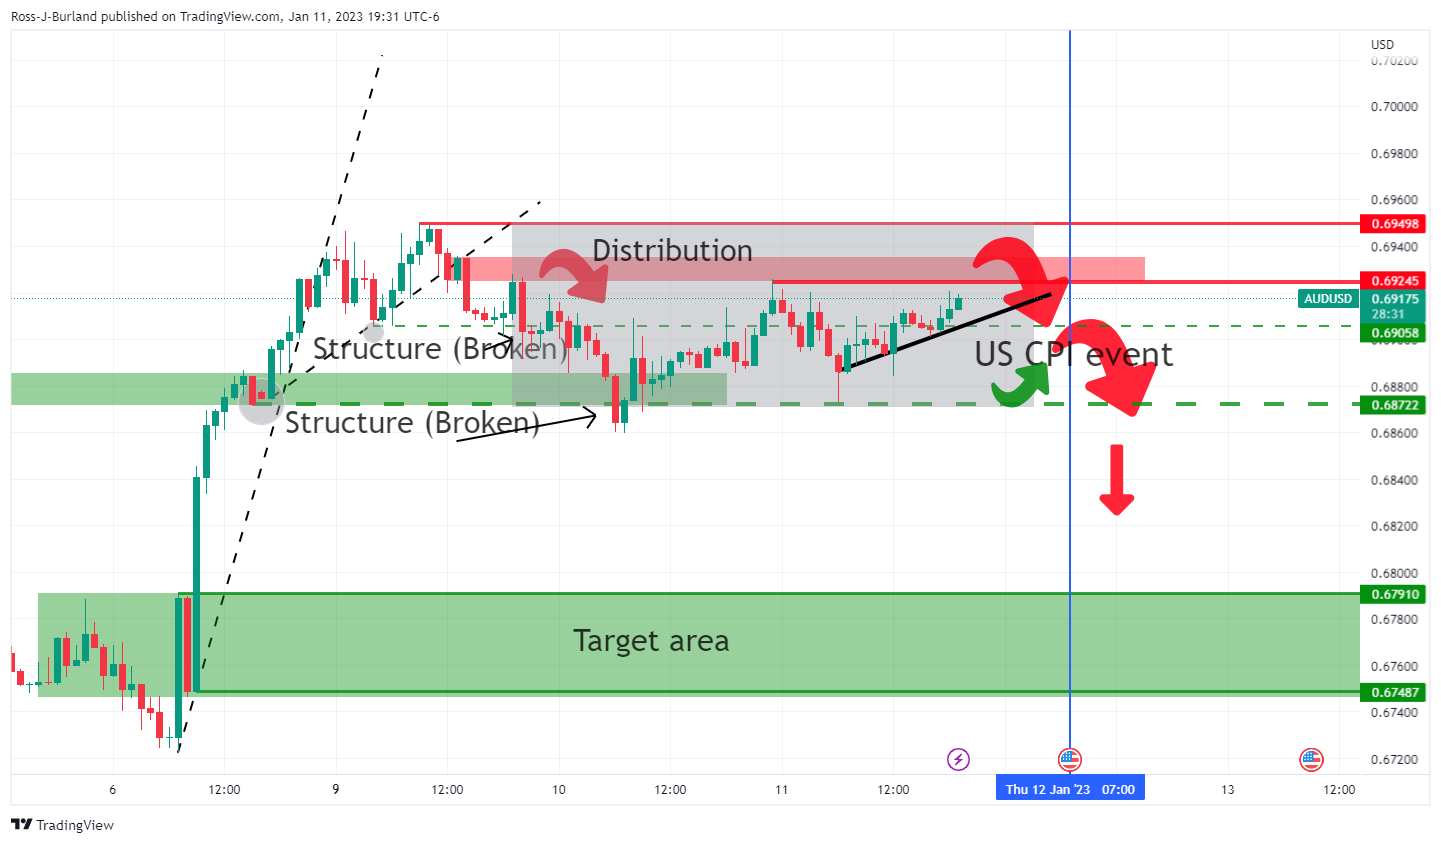
The analysis above assumes that distribution could be playing out into US CPI critical event.
While below 0.6950, the bias is to the downside for the near term. A break of 0.6870 will open the risk of a move into the 0.6800 figure and the targetted area between 0.6791 and 0.6748.
About China CPI
The Consumer Price Index is released by the National Bureau of Statistics of China. It is a measure of retail price variations within a representative basket of goods and services. The result is a comprehensive summary of the results extracted from the urban consumer price index and rural consumer price index. The purchasing power of the CNY is dragged down by inflation. The CPI is a key indicator to measure inflation and changes in purchasing trends. A substantial consumer price index increase would indicate that inflation has become a destabilizing factor in the economy, potentially prompting The People’s Bank of China to tighten monetary policy and fiscal policy risk. Generally speaking, a high reading is seen as positive (or bullish) for the CNY, while a low reading is seen as negative (or Bearish) for the CNY.
-
01:33
AUD/USD Price Analysis: Bulls keep 0.6960 on radar despite mixed China inflation
- AUD/USD grinds higher even as China CPI improved but PPI eased for December.
- Successful trading above 200-DMA, previous resistance line from June favor bulls.
- Two-month-old ascending trend line lures buyers amid bullish MACD signals.
AUD/USD seesaws around the intraday high near 0.6925 even as China prints mixed inflation data for December during early Thursday. In doing so, the Aussie pair extends the previous day’s gains while staying firmer around the highest levels since late August 2022, marked earlier in the week.
That said, China’s headline Consumer Price Index (CPI) YoY grew 1.8% YoY versus 1.8% expected and 1.6% prior whereas the Producer Price Index (PPI) marked -0.7% figures compared to -1.3% previous readings and -0.1% market forecasts.
In addition to the mostly firmer data from Australia’s biggest customer China, the AUD/USD pair’s ability to defend the previous week’s upside break of the 200-DMA and a downward-sloping trend line from June, respectively around 0.6830 and 0.6815, also favor the bulls.
Additionally, keeping the AUD/USD pair on the buyer’s radar are the bullish MACD signals.
As a result, the Aussie pair is well-set to poke a two-month-old ascending resistance line, around 0.6960 at the latest. However, the late August 2022 top surrounding the 0.7000 psychological magnet could challenge the AUD/USD bulls afterward.
Alternatively, AUD/USD downside remains elusive beyond the 0.6815 level comprising the previous resistance line.
Following that, the monthly low of 0.6687 and June 2022 bottom close to 0.6680 could lure the AUD/USD bears before the previous monthly trough surrounding 0.6630.
AUD/USD: Daily chart
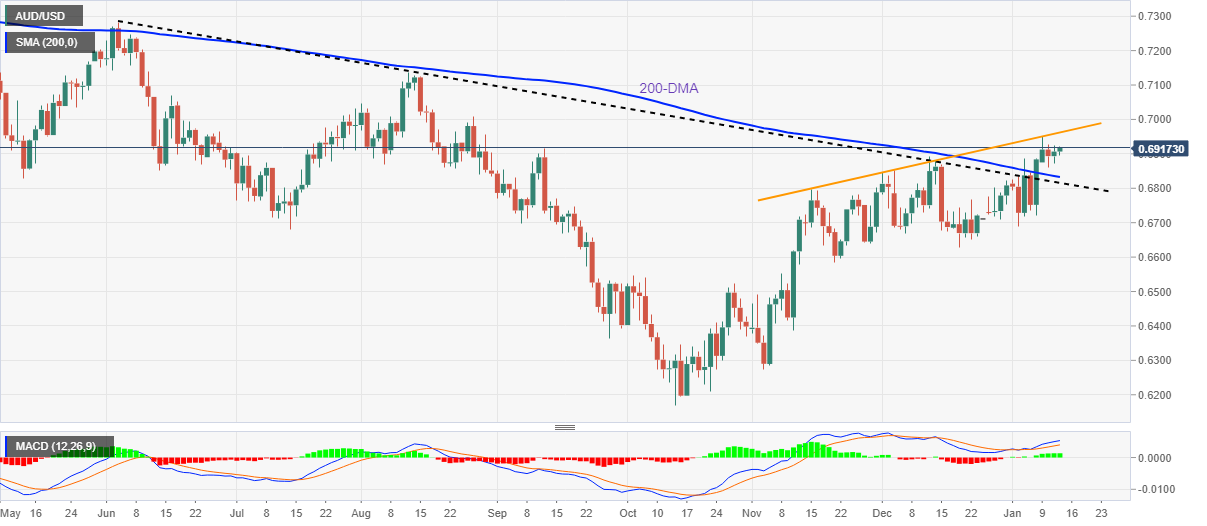
Trend: Further upside expected
-
01:31
China Consumer Price Index (MoM) above forecasts (-0.1%) in December: Actual (0%)
-
01:31
China Producer Price Index (YoY) came in at -0.7% below forecasts (-0.1%) in December
-
01:30
China Consumer Price Index (YoY) meets forecasts (1.8%) in December
-
01:25
USD/CNY fix: 6.7680 vs. the last close of 6.7650
In recent trade today, the People’s Bank of China (PBOC) set the yuan (CNY) at 6.7680 vs. the last close of 6.7650.
About the fix
China maintains strict control of the yuan’s rate on the mainland.
The onshore yuan (CNY) differs from the offshore one (CNH) in trading restrictions, this last one is not as tightly controlled.
Each morning, the People’s Bank of China (PBOC) sets a so-called daily midpoint fix, based on the yuan’s previous day's closing level and quotations taken from the inter-bank dealer.
-
01:23
GBP/USD sits tight in anticipation of US CPI event
- GBP/USD bears are eyeing a move to test key structure.
- US CPI event is key for forex space that is currently treading water.
GBP/USD has been stuck in a tight pre-US Consumer Price Index red calendar event range in Asia of between 1.2132 and 1.2165. The bears have been in control for the most part within a choppy phase of consolidation below the initial balance highs for the week above 1.2200.
The forex space is reading water into the US CPI event later today with investors hoping for a clearer picture of where interest rates in the United States are headed. Fed Chair Jerome Powell did not give any policy clues during a panel discussion in Stockholm on Tuesday, but we did hear from other Federal Reserve speakers, with Boston's Susan Collins going against the grain with dovish remarks reported by the New York Times on Wednesday.
Collins was reported saying that she was leaning toward a quarter-point move at the central bank’s February 1 meeting. "I think 25 or 50 would be reasonable; I'd lean at this stage to 25, but it's very data-dependent," Collins said in an interview with The New York Times. Earlier in the week, we heard from more hawkish speakers. Atlanta Federal Reserve bank president Raphael Bostic said on Monday that it is ''fair to say that the Fed is willing to overshoot.'' San Francisco Federal Reserve Bank President Mary Daly is dropping important comments in live questions and answers with the Wall Street Journal.
US CPI eyed
As for the CPI event, analysts at TD Securities explained that they are looking for the core Consumer Price Index to have edged higher on a monthly basis in December, ''closing out the year on a relatively stronger footing,'' they said.
''Indeed, we forecast a firm 0.3% MoM increase, as services inflation likely gained momentum. In terms of the headline, we expect the Consumer Price Index inflation to register a slight decline on an unrounded basis in December, but rounded up to flat MoM, as energy prices offered large relief again. Our MoM projections imply that headline and core CPI inflation likely lost speed on a YoY basis in December.''
GBP/USD technical analysis
As per the prior analysis, GBP/USD Price Analysis: 1.2100 under pressure ahead of key US CPI event, 1.2170, 1.2150 and 1.2113 (daily W-formation neckline target area) areas were meanwhile key structure target levels that have either given out or are being tested, guarding against a full-on capitulation of the bulls and bears taking over towards the 1.1900 target area:
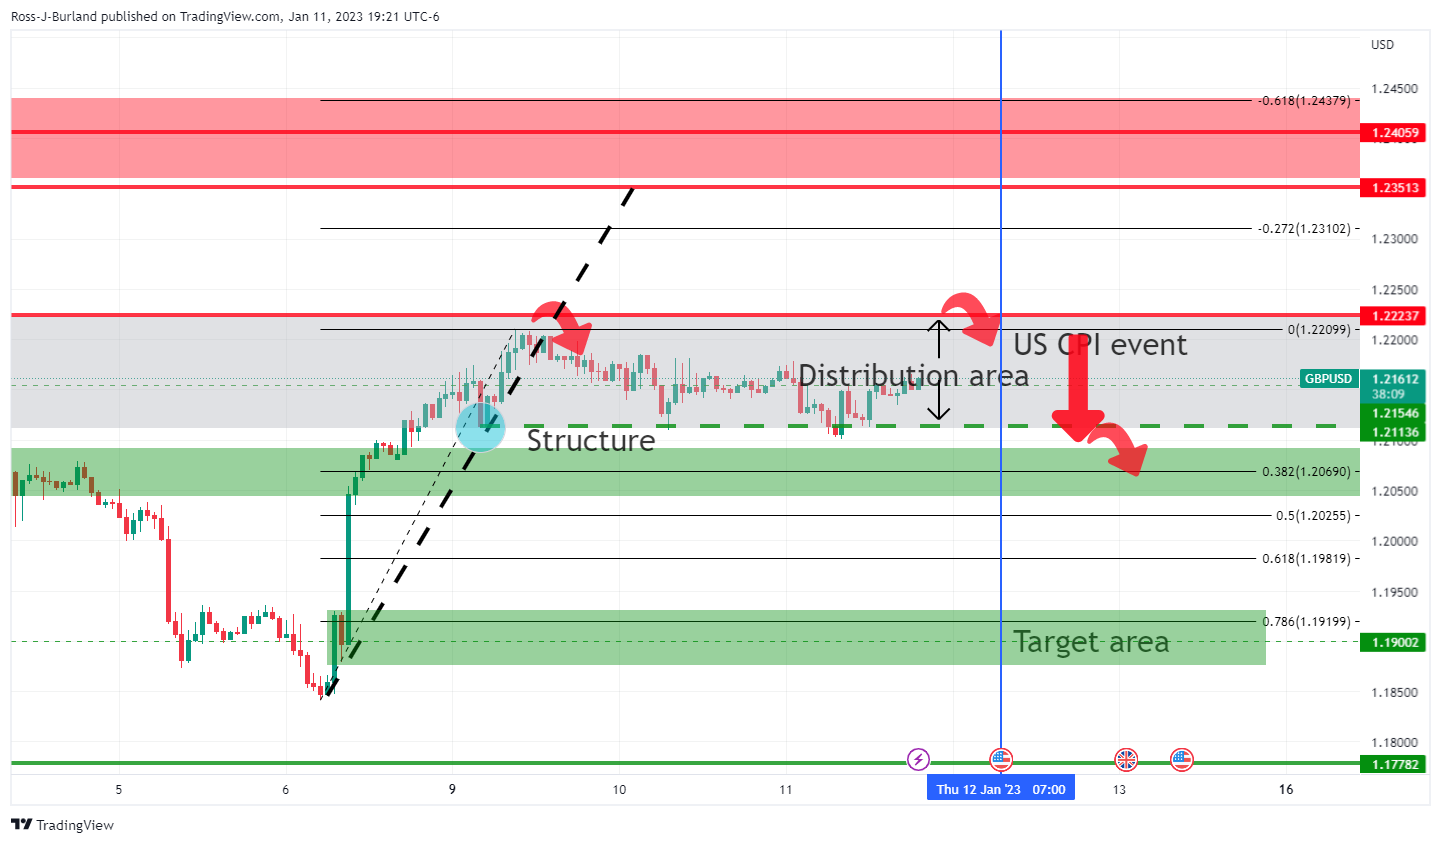
-
01:17
Gold Price Forecast: XAU/USD marches towards $1,880 as US Inflation hogs limelight
- Gold price is marching towards $1,880.00 as the US Dollar Index is struggling to find support.
- The 10-year US Treasury yields have weighed down to 3.55% amid an upbeat market mood.
- The headline US CPI is seen declining to 6.7% led by lower gasoline prices.
Gold price (XAU/USD) is aiming to extend its recovery to near the critical resistance at $1,880.00 in the Asian session. The precious metal recovered sharply in the late New York session after dropping to near $1,867.50 amid its rangebound behavior ahead of the release of the United States inflation data.
S&P500 futures are displaying a subdued performance in Asia, however, the overall risk profile is significantly positive. The alpha generated by 10-year US Treasury bonds has surrendered its recovery move amid optimism, on a broader note, and has slipped to near 3.55%. Meanwhile, the US Dollar Index (DXY) has slipped further to near 102.75 as the street is expecting a further slowdown in the Consumer Price Index (CPI).
Analysts at NBF, see headline prices decreasing 0.1% MoM and the year-on-year rate should come down from 7.1% to 6.7%. The food component likely remained relatively strong, but this increase should have been more than compensated by lower gasoline prices. The Core index, meanwhile, may have continued to be supported by rising rent prices and advanced 0.3% on a monthly basis. This would translate into a two-tick decline of the 12-month rate to 5.8%.”
From a risk-on mood to an economic slowdown and lower consensus for the United States Consumer Price Index (CPI), none of the catalysts is showing signs of recovery in the US Dollar Index after the carnage. A decline in the US inflation figures might force the Federal Reserve (Fed) to revise its monetary policy projections for CY2023 and beyond.
Gold technical analysis
Gold price is struggling to find direction and is oscillating in a $1,868.30-1,885.85 range from the past four trading sessions. The upside bias is still solid as the 50-and 200-period Exponential Moving Averages (EMAs) at $1,875.41 and $1,854.89 respectively are sloping north, which adds to the upside filters.
Meanwhile, the Relative Strength Index (RSI) (14) is oscillating in a 40.00-60.00 range, which indicates a consolidation ahead.
Gold hourly chart
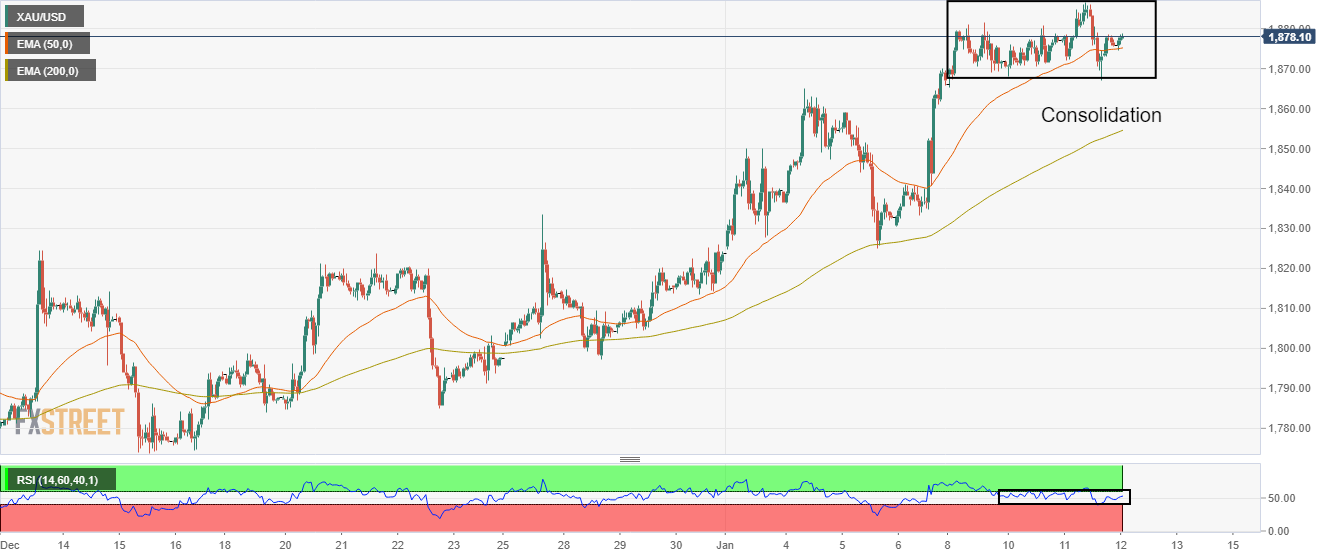
-
01:12
USD/CAD struggles around 1.3430 as Oil bulls run out of steam, US inflation eyed
- USD/CAD lacks clear directions amid softer US Dollar, lackluster Oil price.
- Mixed sentiment, cautious mood ahead of US CPI restrict Loonie pair’s moves.
- Upbeat US inflation data appears necessary to defend bulls.
USD/CAD clings to 1.3430 while keeping the previous day’s inaction as markets turn cautious ahead of the key US Consumer Price Index (CPI) data for December. In doing so, the Loonie pair struggles to cheer the downbeat US Dollar Index (DXY) as prices of Canada’s main export item, WTI crude oil, fail to extend the latest run-up.
That said, the DXY holds lower grounds near 103.10-15 while portraying the failures to bounce off a seven-month low marked earlier in the week. The US Dollar Index weakness could be linked to the recently downbeat comments from the Federal Reserve (Fed) officials, as well as risk-positive headlines from China.
On Wednesday, Federal Reserve’s Boston President Susan Collins backed the smaller rate increases while stating that she leans at this stage to a 25 bps hike. The policy, however, also mentioned that it is very data-dependent. Furthermore, China’s total reopening and early signals of heavy holiday shopping join the chatters that the People’s Bank of China (PBOC) will adhere to rate cuts in 2023 to spread the Beijing-inspired optimism.
It should be noted that WTI crude oil remains indecisive around $78.00 after rising the most in two months the previous day. The black gold cheered broad US Dollar weakness, hopes of more energy demand from China. It’s worth noting that a heavy increase in the oil inventories, as signaled by the US Energy Information Administration (EIA) data, failed to weigh on the black gold. “The US Energy Information Administration (EIA) said crude inventories jumped by 19.0 million barrels last week, the third biggest weekly gain ever and the most since stocks rose by a record 21.6 million barrels in Feb 2021,” reported Reuters.
Amid these plays, US equities were on the front foot and yields were down while the S&P 500 Futures and the US 10-year Treasury bond yields remain indecision by the press time.
Looking forward, USD/CAD traders should pay attention to the US CPI ex Food & Energy for December, expected 5.7% versus 6.0% prior, for clear directions.
Technical analysis
Wednesday’s Doji candlestick joins the USD/CAD pair’s inability to cross the 100-day Exponential Moving Average (EMA), around 1.3430 by the press time, to signal the quote’s further downside.
-
00:46
EUR/USD Price Analysis: Bulls keep the reins ahead of US inflation
- EUR/USD stays firmer around seven-month high, approaching mid-2022 top.
- Nearly overbought RSI challenges buyers as they brace for key hurdles.
- Looming bull cross on MACD, clear upside break of one-month-old descending trend line favor bulls.
- EUR/USD buyers can aim for ascending trend line from mid-November on crossing 1.0805.
EUR/USD bulls take a breather around the highest levels since June 2022, marked the previous day, as they brace for the key US Consumer Price Index (CPI) data for December during early Thursday. In doing so, the major currency pair prints mild gains around 1.0775 by the press time.
A successful break of a descending trend line from December 15, 2022, around 1.0685 by the press time, joins the looming bull cross on the MACD to keep buyers hopeful. However, the RSI (14) line is near the overbought conditions and suggests limited upside room for the pair.
As a result, the May 2022 peak of 1.0786 appears a major challenge for the EUR/USD bulls, a break of which will highlight the March 2022 bottom surrounding 1.0805 as the next key hurdle for the upside momentum.
In a case where the EUR/USD pair manage to remain firmer past 1.0805, the odds of witnessing a run-up towards a two-month-old ascending resistance line, close to 1.0965 at the latest, can’t be ruled out.
On the flip side, pullback moves may initially aim for a December 2022 high of 1.0736 before resting on the resistance-turned-support line near 1.0685.
In a case where EUR/USD remains bearish past 1.0685, a downward trajectory towards the monthly low of 1.0483 can be witnessed.
EUR/USD: Daily chart
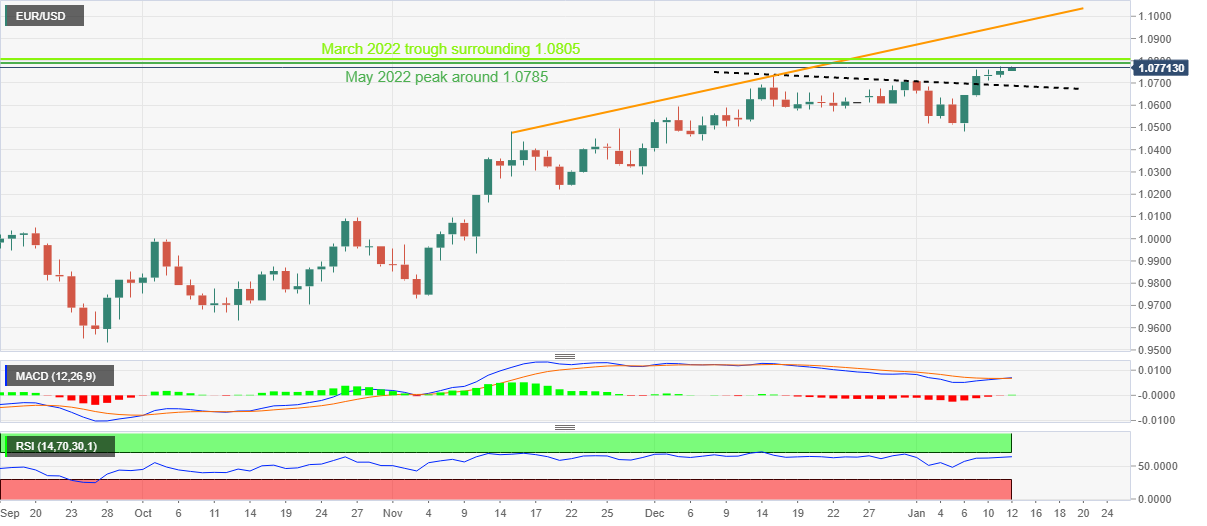
Trend: Limited upside expected
-
00:42
AUD/USD climbs above 0.6920 on upbeat Australian Trade Balance data
- AUD/USD has picked strength and has scaled above 0.6920 after the release of solid Aussie Trade Balance data.
- Only a surprise rise in US inflation could provide a cushion to the US Dollar Index.
- The Australian Dollar may display power-pack action after the release of China’s inflation data.
The AUD/USD pair has climbed above 0.6920 as the Australian Bureau of Statistics has reported stronger-than-projected monthly Trade Balance (Nov) data. The economic data has jumped to 13,201M vs. the consensus of 10,500M and the former release of 12,217M.
Earlier, the Aussie asset displayed topsy-turvy moves as investors are restricting themselves from building significant positions before the release of the United States Consumer Price Index (CPI) data.
S&P500 futures are showing marginal selling pressure after back-to-back firmer bullish sessions, portraying anxiety among investors ahead of the US inflation data. The US Dollar Index (DXY) continued its struggle around 103.00 amid weak trading activity. Meanwhile, the 10-year US Treasury yields have shown a recovery move and have rebounded above 3.56%.
Analysts at RBC Economics expect annual United States consumer price growth to slow significantly in December to 6.3% from 7.1%, recorded in November. The steep decline in headline price growth is largely thanks to a significant drop in energy prices. They expect ‘core’ (excluding food & energy products) price growth to slow to 5.6% YoY in December from 6.0% in October.
The US Dollar Index has witnessed carnage in the past few weeks and only a surprise rise in inflation figures could provide a cushion ahead. On a broader note, analysts at Wells Fargo see inflation declining to 2.2% YoY by year-end.
Going forward, the Australian Dollar will witness action after the release of China’s CPI data. According to the estimates, annual CPI (Dec) is set to improve to 1.8% from the former release of 1.6%. While the monthly figure may contract by 0.1% against the prior release of -0.2%. Also, the Producer Price Index (PPI) could contract by 0.1%.
-
00:36
Aussie Trade Balance supports AUD/USD, but US CPI eyed
The trade balance released by the Australian Bureau of Statistics has been released as follows:
- Australia November balance goods/svcs A$+13,201 mln, s/adj (Reuters poll: A$+10,500 mln).
- November goods/services exports 0 pct MoM, seasonally adjusted.
- November goods/services imports -1 pct MoM, seasonally adjusted.
- In seasonally adjusted terms, the balance on goods and services was a surplus of $13,201m in November 2022, an increase of $458m on the surplus in October 2022.
The data seems to have supported AUD/USD following a series of positive data from the prior session. AUD/USD is up 0.22% to a session high of 0.6920 so far.
However, eyes are on the US Consumer Price Index:
Investors eye the US December inflation report, which is expected to show US prices rose by an annualized 6.5%. This is lower than November's 7.1% pace. Investors are monitoring the Consumer Price Index closely as the expectations are that if it were to continue to decelerate, so too will the Federal Reserve's pace of rate hikes. Analysts at TD Securities explained that they are looking for the core Consumer Price Index to have edged higher on a monthly basis in December, ''closing out the year on a relatively stronger footing,'' they said.
''Indeed, we forecast a firm 0.3% MoM increase, as services inflation likely gained momentum. In terms of the headline, we expect the Consumer Price Index inflation to register a slight decline on an unrounded basis in December, but rounded up to flat MoM, as energy prices offered large relief again. Our MoM projections imply that headline and core CPI inflation likely lost speed on a YoY basis in December.''
About the Aussie Trade Balance
The trade balance released by the Australian Bureau of Statistics is the difference in the value of its imports and exports of Australian goods. Export data can give an important reflection of Australian growth, while imports provide an indication of domestic demand. Trade Balance gives an early indication of the net export performance. If a steady demand in exchange for Australian exports is seen, that would turn into a positive growth in the trade balance, and that should be positive for the AUD.
-
00:30
Australia Imports (MoM) remains at -1% in November
-
00:30
Australia Trade Balance (MoM) registered at 13201M above expectations (10500M) in November
-
00:30
Australia Exports (MoM) increased to 0% in November from previous -1%
-
00:21
US Dollar Index: DXY bears attack 103.00 on hopes of softer United States inflation
- US Dollar Index remains depressed for the second consecutive day around seven-month low.
- Dovish comments from Federal Reserve officials, mixed United States data rekindle hopes of policy pivot and weigh on DXY.
- Risk-on mood, hawkish comments from European Central Bank (ECB) policymakers also exert downside pressure on US Dollar Index.
- Expectations of a softer US Consumer Price Index favor DXY bears.
US Dollar Index (DXY) holds lower grounds near 103.10-15 as traders keenly await the United States Consumer Price Index (CPI) data during early Thursday. In doing so, the US Dollar’s gauge versus the six major currencies justifies the recently downbeat comments from the Federal Reserve (Fed) officials, as well as risk-positive headlines from China, not to forget previously softer US data.
Federal Reserve officials favor US Dollar Index bears
Although the Federal Reserve (Fed) policymakers refrained from providing any clear bearish signals, their hesitance in openly conveying the hawkish bias push traders towards expecting a softer interest rate hike and policy pivot in 2023. The same weigh on the US Dollar Index after the greenback’s gauge cheered the Fed’s hawkish moves in the last year.
That said, Federal Reserve’s Boston representative Susan Collins reiterated her support for the smaller rate increases. The policymaker said that she leans at this stage to a 25 bps hike. However, she also mentioned that it is very data-dependent. Previously, Fed Chair Jerome Powell's comments at Riksbank's International Symposium on Central Bank Independence couldn’t offer further clarity on the US central bank’s monetary policy outlook and raised dovish expectations.
On the contrary, the European Central Bank (ECB) officials have been too hawkish of late, which in turn allows the Euro to remain firmer and shift funds from the US Dollar. Among the ECB hawks, Robert Holzmann, Francois Villeroy de Galhau and Olli Rehn were the latest ones to propel the bloc’s currency and weigh on the DXY.
United States data hasn’t been too helpful to DXY
Having witnessed downbeat United States activity numbers and sluggish wage growth last Friday, the recent second-tier figures have also been mixed and exerted downside pressure on the US Dollar Index. On Tuesday, the US NFIB Business Optimism Index for December dropped to the lowest levels since 2013 if ignoring multiple jitters during the global Covid wave. Further, US Wholesale Inventories also remained unchanged with 1.0% growth for November.
US Treasury bond yields, China news weighs on US Dollar Index
Apart from what’s already stated above, downbeat US Treasury yields and the risk-positive headlines surrounding China also favor the US Dollar Index bears, mainly due to the greenback’s haven appeal. That said, That said, the US 10-year Treasury yields dropped nearly eight basis points (bps) 3.54% while Wall Street closed in the green. Further, China’s total reopening and early signals of heavy holiday shopping join the chatters that the People’s Bank of China (PBOC) will adhere to rate cuts in 2023 to spread the Beijing-inspired optimism.
United States Inflation is the key
Moving on, DXY traders should pay attention to the Consumer Price Index (CPI) details for December for clear directions. Market forecasts suggest the headline CPI to ease to 6.5% YoY versus 7.1% prior while the Core CPI, namely the CPI ex Food & Energy, is likely to drop to 5.% YoY versus 6.0% prior. It should be noted that the talks of the Fed’s policy pivot could gain momentum if the US inflation numbers are softer.
Also read: US December CPI Preview: EUR/USD and USD/JPY are pairs to watch
US Dollar Index technical analysis
US Dollar Index retreats from a one-month-old previous support line, as well as the 21-bar Simple Moving Average (SMA), while bracing for the weekly loss.
In doing so, the DXY fades the week-start bounce off the 102.94 level, which initially took clues from the oversold conditions of the Relative Strength Index (RSI) line, placed at 14.
That said, the sluggish signals from the Moving Average Convergence and Divergence (MACD) signals hint at the US Dollar Index traders’ indecision.
However, failure to keep the earlier corrective bounce and a U-turn from the aforementioned key hurdles, namely the ascending trend line from mid-December and the 21-SMA, keeps the DXY bears hopeful of witnessing a fresh multi-month low, currently around 102.95.
In that case, the 61.8% Fibonacci Expansion (FE) level of the DXY’s moves between November 21 and January 06, around 102.85, gains major attention.
Following that, a southward trajectory towards the 102.00 round figure and a May 2022 low of 101.30 can’t be ruled out.
On the contrary, 21-SMA restricts immediate recovery moves of the US Dollar Index to around 103.35 ahead of the support-turned-resistance line, near 103.45.
Should the DXY buyers manage to cross 103.45, multiple hurdles around 104.00 and 104.60-65 can challenge the upside momentum before highlighting the monthly top of 105.62.
Overall, the US Dollar Index is likely to remain bearish but the downside room appears limited.
DXY: Four-hour chart

Trend: Further downside expected
-
00:19
WTI Price Analysis: Aims to extend rally above $78.00
- The oil prices have displayed a vertical run-up amid optimism over China’s reopening for international travelers.
- A Symmetrical Triangle formation is indicating a volatility contraction on a broader note.
- The RSI (14) has entered into the bullish range of 60.00-80.00, which might result in the activation of bullish momentum.
West Texas Intermediate (WTI), futures on NYMEX, are facing barricades in a stretching rally above the immediate hurdle of $78.00 in the early Asian session. Earlier, the black gold displayed a solid north-side move after supposing the critical resistance at around $77.00 as China reopened its economy for international travel, which has forced think tanks for an upward revision of oil demand projections.
Meanwhile, the US Dollar Index (DXY) is continuously demonstrating topsy-turvy moves around 103.00 ahead of the release of the United States Consumer Price Index (CPI) data, which will release on Thursday.
On a four-hour scale, the oil price is auctioning in a Symmetrical Triangle chart pattern that indicates volatility contraction. An explosion of the aforementioned chart pattern results in wider ticks and heavy volume. The upward-sloping trendline of the chart pattern is placed from December 9 low at $70.27. While the downward-sloping trendline is plotted from December 1 high at $83.30.
The 20-and 50-period Exponential Moving Averages (EMAs) are on the verge of delivering a bull cross.
Meanwhile, the Relative Strength Index (RSI) (14) has entered into the bullish range of 60.00-80.00, which might result in the activation of bullish momentum.
Usually, a perpendicular run-up is followed by a corrective move, therefore it will be optimal to place a long entry around the immediate support, which is January 9 high at $76.90. This will drive the asset toward Wednesday’s high of around $78.00, followed by January 3 high at $81.56.
Alternatively, a break below January 5 low at $72.64 will drag the oil price toward December 9 low at $70.27. The asset would be exposed for more downside to near 14 December 2021 low at $69.32 after surrendering the support at December 9 low at $70.27.
WTI four-hour chart
-638090794995479872.png)
-
00:15
Currencies. Daily history for Wednesday, January 11, 2023
Pare Closed Change, % AUDUSD 0.69059 0.22 EURJPY 142.526 0.55 EURUSD 1.07562 0.22 GBPJPY 160.978 0.3 GBPUSD 1.2149 -0 NZDUSD 0.63663 0.05 USDCAD 1.34248 0 USDCHF 0.93126 1.01 USDJPY 132.505 0.32 -
00:10
USD/JPY drops on Bank of Japan headlines
- USD/JPY bears move in on BoJ headlines ahead of US CPI event.
- US Dollar posied technical bullish and USD/JPY also, while above 131.00.
USD/JPY has dropped heavily into the Tokyo open and is down some 0.4%. The pair fell from a 132.48 high to a low of 131.76 before stabilising. Japanese media Yomiuri came out with the news suggesting another hawkish move by the Bank of Japan (BoJ) during its next week’s monetary policy meeting.
The announcement signalled that the Japanese central bank is up for reviewing the side effects of massive monetary easing in the monetary policy meeting next week. “BoJ reviews due to skewed interest rates in markets even after last month's tweak in bond yield control policy,” adds Yomiuri per Reuters.
All eyes on US CPI
This comes ahead of today's US December inflation report, which is expected to show US prices rose by an annualized 6.5%. This is lower than November's 7.1% pace. Investors are monitoring the Consumer Price Index closely as the expectations are that if it were to continue to decelerate, so too will the Federal Reserve's pace of rate hikes.
In this regard, analysts at TD Securities explained that they are looking for the core Consumer Price Index to have edged higher on a monthly basis in December, ''closing out the year on a relatively stronger footing,'' they said.
''Indeed, we forecast a firm 0.3% MoM increase, as services inflation likely gained momentum. In terms of the headline, we expect the Consumer Price Index inflation to register a slight decline on an unrounded basis in December, but rounded up to flat MoM, as energy prices offered large relief again. Our MoM projections imply that headline and core CPI inflation likely lost speed on a YoY basis in December.''
USD/JPY technical analysis
Meanwhile, as per the prior analysis, USD/JPY Price Analysis: Consolidation into US CPI, bulls on the prowl, the price remains inverse daily head and shoulders and there could be a reversal on the cards.
USD/JPY prior analysis:
USD/JPY update:
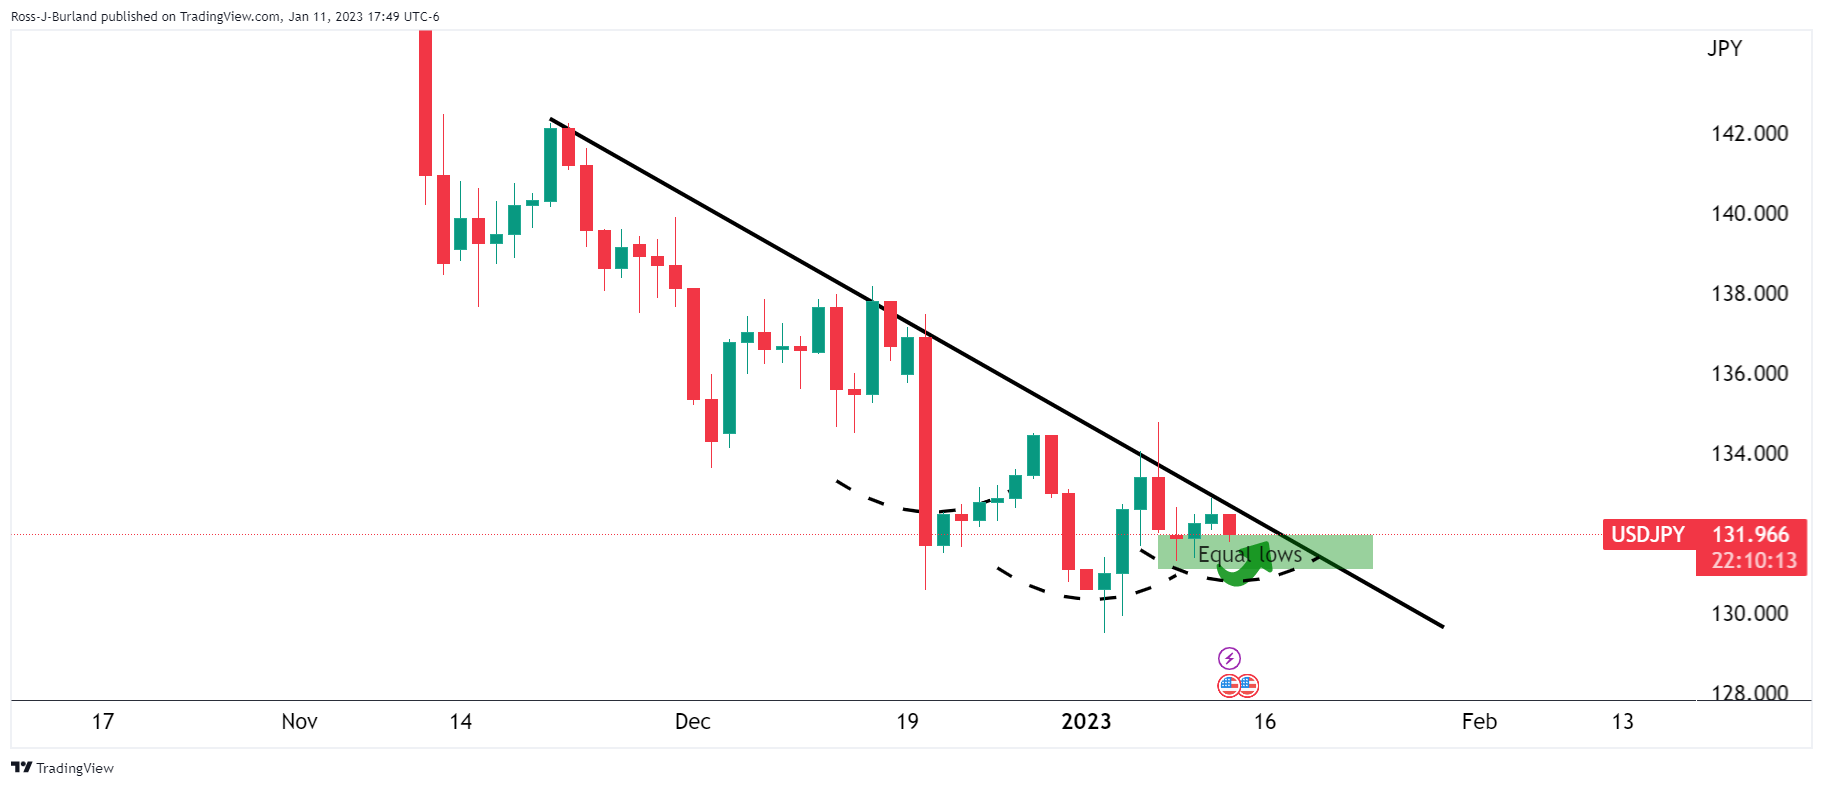
On the 4-hour chart, we see the equal lows more clearly and on the hourly chart even more so...
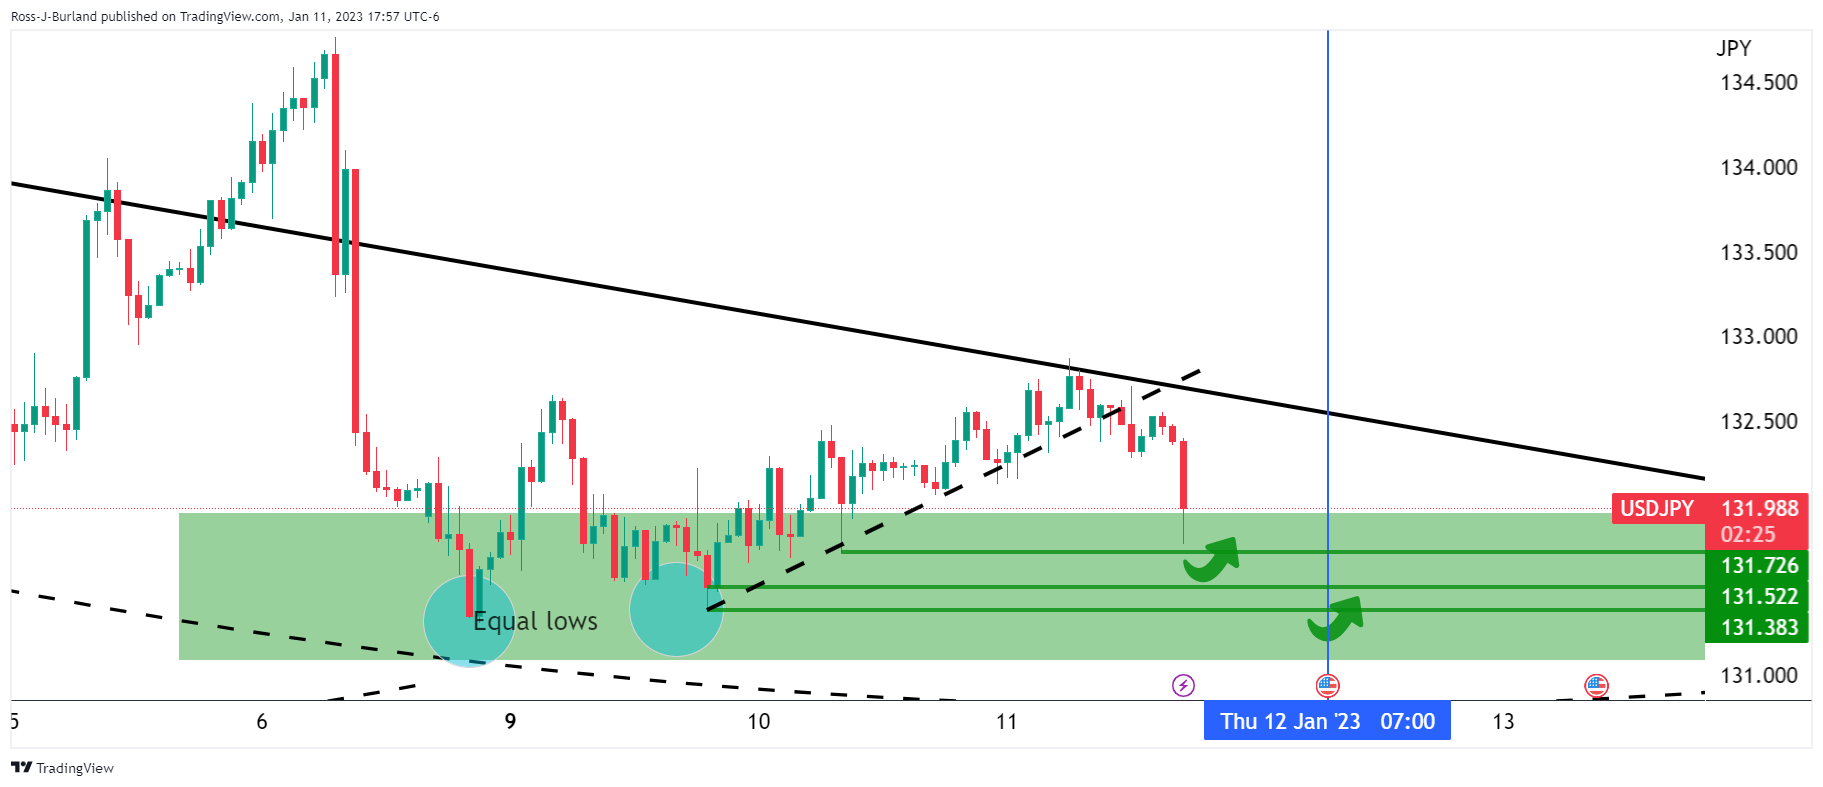
As we head over to the US CPI event, the levels to watch are the 131.70s, 131.50s and 131.383 swing lows. There will be orders below these levels that could be traded before the reversal. With that being said, should the bears take control below 131.00 the bullish bias will flip bearish.
On the other hand, looking at the US Dollar, an M-formation is in play:
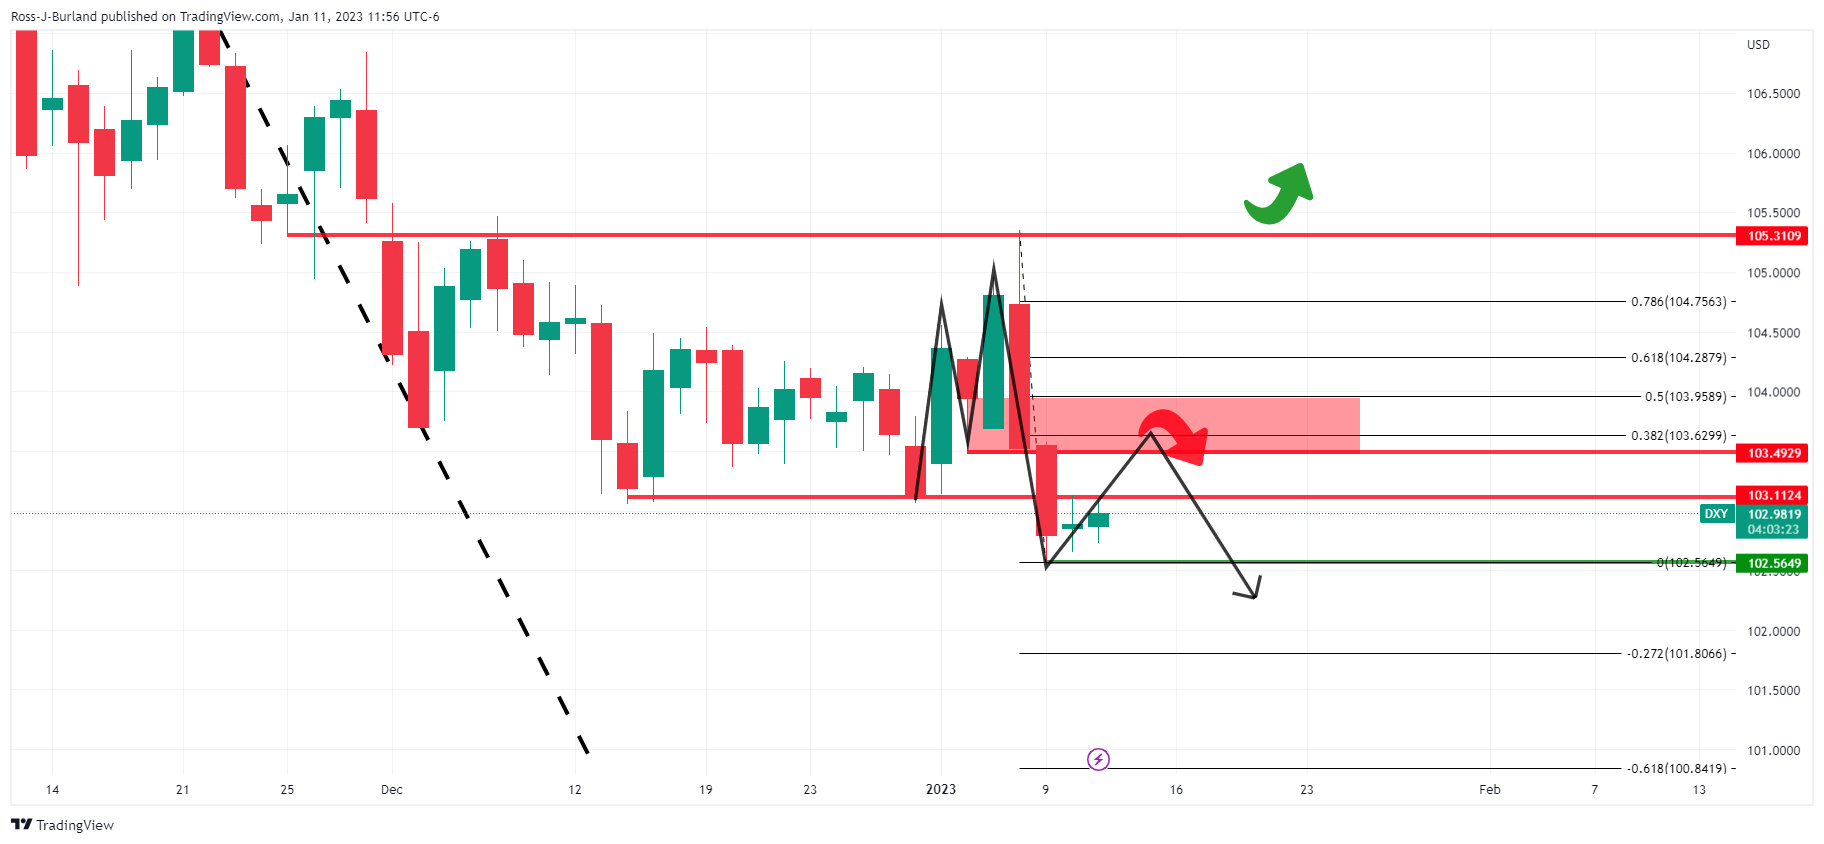
The M-formation is a reversion pattern and the price would be expected to move in for the restest of the resistance structures and neckline of the pattern between 103.50 and 104.00. Such a move would align with a 38.2% Fibonacci retracement and a 50% mean reversion at the extreme and be bullish for USD/JPY, playing into the head and shoulders thesis in the pair.
-