Notícias do Mercado
-
23:51
US Commerce Secretary Lutnick says Trump has a plan to balance the budget
US Commerce Secretary Howard Lutnick said late Thursday that the administration will try to balance the budget during the President Donald Trump term.
Key quotes
During President Trump's term, we will try to balance the budget.
We want it to take three years to balance the budget.
When President balances the budget, Trump has suggested he wants to waive taxes for those earning under $150,000. It's aspirational.
No taxes on tips, overtime, or Social Security.Market reaction
At the time of press, the US Dollar Index was down 0.01% on the day at 103.83.
Tariffs FAQs
Tariffs are customs duties levied on certain merchandise imports or a category of products. Tariffs are designed to help local producers and manufacturers be more competitive in the market by providing a price advantage over similar goods that can be imported. Tariffs are widely used as tools of protectionism, along with trade barriers and import quotas.
Although tariffs and taxes both generate government revenue to fund public goods and services, they have several distinctions. Tariffs are prepaid at the port of entry, while taxes are paid at the time of purchase. Taxes are imposed on individual taxpayers and businesses, while tariffs are paid by importers.
There are two schools of thought among economists regarding the usage of tariffs. While some argue that tariffs are necessary to protect domestic industries and address trade imbalances, others see them as a harmful tool that could potentially drive prices higher over the long term and lead to a damaging trade war by encouraging tit-for-tat tariffs.
During the run-up to the presidential election in November 2024, Donald Trump made it clear that he intends to use tariffs to support the US economy and American producers. In 2024, Mexico, China and Canada accounted for 42% of total US imports. In this period, Mexico stood out as the top exporter with $466.6 billion, according to the US Census Bureau. Hence, Trump wants to focus on these three nations when imposing tariffs. He also plans to use the revenue generated through tariffs to lower personal income taxes.
-
23:45
EUR/USD eases as Trump turns tariff threats to Europe
- EUR/USD fell back 0.3% on Thursday as Europe gets added to Trump’s tariff list.
- Trump plans more tariffs on targeted EU goods after Europe retaliated against steel tariffs.
- US consumer sentiment and inflation expectations dominate Friday’s data docket.
EUR/USD trimmed a bit more of its recent gains on Thursday, falling back around one-third of one percent as Europe gears up for a protracted back-and-forth on trade tariffs with US President Donald Trump. The Trump administration kicked off a global 25% import tax on all steel and aluminum that crosses the border into the US, sparking a wave of retaliatory tariffs from most of the US’s (formerly) closest trading partners. The EU has announced a set of tariffs on key, targeted US products, specifically Harley Davidson motorcycles and US distilled whisky, prompting an irate outburst from President Trump on Thursday.
US President Trump wants to tariff EU wine, reiterates interest in Greenland
Donald Trump threatened to impose a steep 200% tariff on all European wines and champagne via his social media account during Thursday’s early US session, sparking widespread market concerns that the Trump administration is barreling towards a disastrous outcome to its ham-handed trade policies that don’t entirely seem to serve a function or purpose. Now, the US markets pivot to Friday’s consumer confidence and inflation expectations readings, which come at a time when the average US consumer is growing increasingly concerned about the rhetoric leaking out of both the White House and Donald Trump’s social media accounts.
German Harmonized Index of Consumer Prices (HICP) inflation figures from February are due early Friday, however the final, non-preliminary figure is entirely unlikely to turn many heads. Coming up on Friday, the US data docket will close out a relatively packed week with the University of Michigan (UoM) Consumer Sentiment Index as well as UoM’s Consumer Inflation Expectations. Both figures are likely to see some negative influence from President Trump’s tariff tirades, and median market forecasts see the sentiment index declining to 63.1 for March, down from February’s 64.7. At the last print, the average consumer respondent expected 5-year inflation to clock in around 3.5%, implying inflation expectations remain entrenched well above the Federal Reserve’s (Fed) 2% target.
EUR/USD price forecast
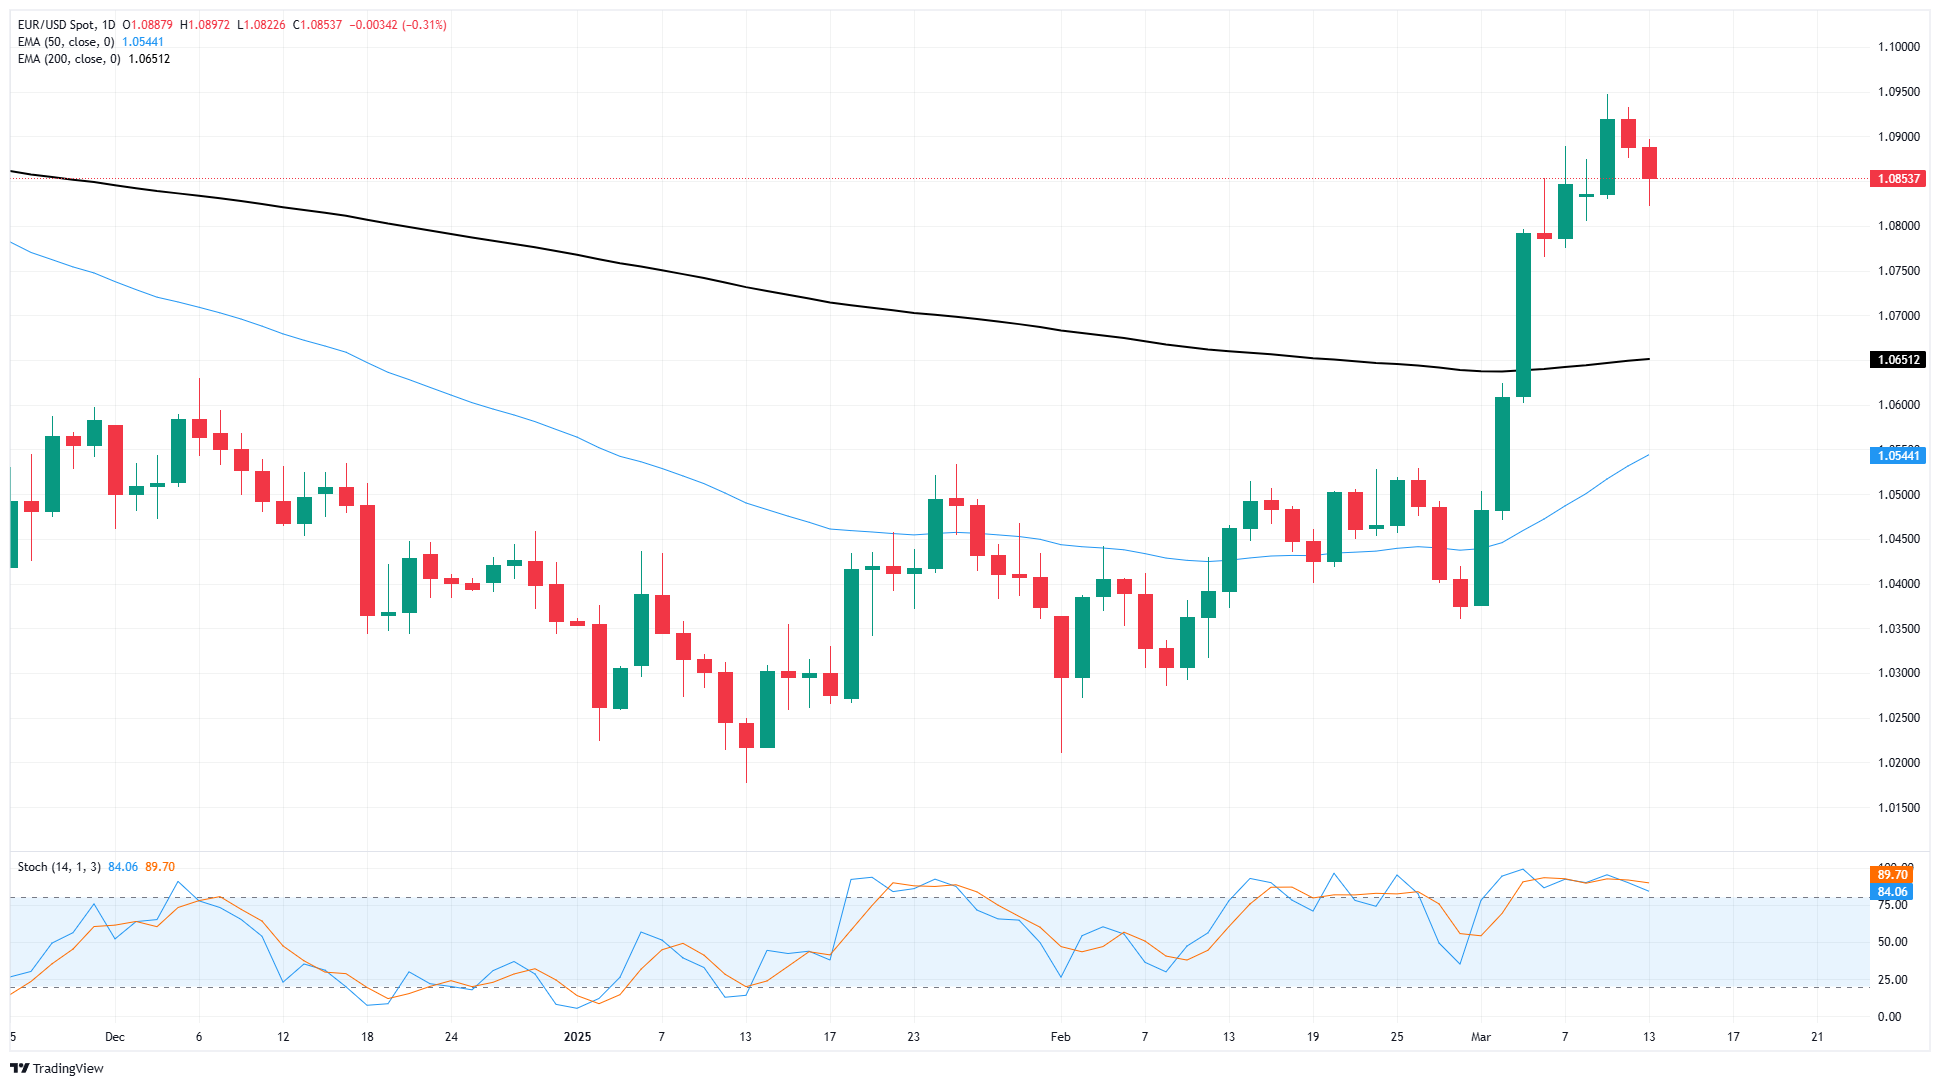
EUR/USD looks like its recent bull run is now over, confirming a technical retreat back below 1.0900 just as quickly as it jumped the major handle in the first place. However, Fiber has climbed nearly 7.6% bottom-to-top from the last major swing low near 1.0175, with bulls easily snapping the 200-day Exponential Moving Average (EMA) in the process.
EUR/USD is now running aground of technical resistance from the 1.0900 handle, a technical region that flummoxed Euro bulls the last time around back in October and November of last year.
EUR/USD daily chart
Euro FAQs
The Euro is the currency for the 19 European Union countries that belong to the Eurozone. It is the second most heavily traded currency in the world behind the US Dollar. In 2022, it accounted for 31% of all foreign exchange transactions, with an average daily turnover of over $2.2 trillion a day. EUR/USD is the most heavily traded currency pair in the world, accounting for an estimated 30% off all transactions, followed by EUR/JPY (4%), EUR/GBP (3%) and EUR/AUD (2%).
The European Central Bank (ECB) in Frankfurt, Germany, is the reserve bank for the Eurozone. The ECB sets interest rates and manages monetary policy. The ECB’s primary mandate is to maintain price stability, which means either controlling inflation or stimulating growth. Its primary tool is the raising or lowering of interest rates. Relatively high interest rates – or the expectation of higher rates – will usually benefit the Euro and vice versa. The ECB Governing Council makes monetary policy decisions at meetings held eight times a year. Decisions are made by heads of the Eurozone national banks and six permanent members, including the President of the ECB, Christine Lagarde.
Eurozone inflation data, measured by the Harmonized Index of Consumer Prices (HICP), is an important econometric for the Euro. If inflation rises more than expected, especially if above the ECB’s 2% target, it obliges the ECB to raise interest rates to bring it back under control. Relatively high interest rates compared to its counterparts will usually benefit the Euro, as it makes the region more attractive as a place for global investors to park their money.
Data releases gauge the health of the economy and can impact on the Euro. Indicators such as GDP, Manufacturing and Services PMIs, employment, and consumer sentiment surveys can all influence the direction of the single currency. A strong economy is good for the Euro. Not only does it attract more foreign investment but it may encourage the ECB to put up interest rates, which will directly strengthen the Euro. Otherwise, if economic data is weak, the Euro is likely to fall. Economic data for the four largest economies in the euro area (Germany, France, Italy and Spain) are especially significant, as they account for 75% of the Eurozone’s economy.
Another significant data release for the Euro is the Trade Balance. This indicator measures the difference between what a country earns from its exports and what it spends on imports over a given period. If a country produces highly sought after exports then its currency will gain in value purely from the extra demand created from foreign buyers seeking to purchase these goods. Therefore, a positive net Trade Balance strengthens a currency and vice versa for a negative balance.
-
23:22
USD/JPY Price forecast: Struggles at 148.00, drops on risk aversion
- USD/JPY starts Friday steady near 147.90 following Thursday’s 0.30% drop, pressured by unresolved US trade tensions.
- Pair fails to capitalize on recent bullish ‘tweezers bottom’ pattern near YTD lows, remaining vulnerable below key Tenkan-sen resistance.
- Break below immediate support at 146.54 could spark deeper selling; reclaiming 148.00 may pave way toward 149.79 resistance.
The USD/JPY begins Frida’s Asian session on a higher note, following Thursday’s losses of 0.305, that pushed the exchange rate to close at 147.81 daily. At the time of writing, the pair trades at 147.91, virtually unchanged, as traders continued to digest US President Donald Trump's tariff rhetoric.
USD/JPY Price Forecast: Technical outlook
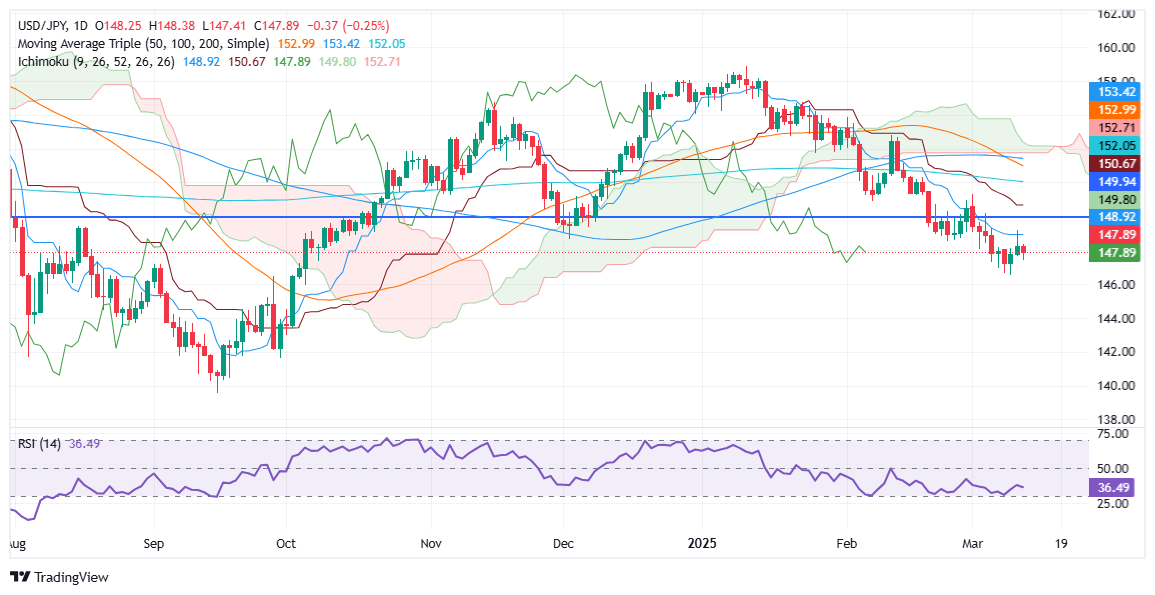
Even though the USD/JPY formed a ‘tweezers bottom’ two candle chart pattern near the year-to-date (YTD) low of 146.54, two days ago, the pair failed to decisively clear the Tenkan-sen at 148.97, which opened the door for a retracement.
Consequently, the USD/JPY fell beneath 148.00 and continued to drop, aligned with the overall market. If the pair falls below the latter, the next support would be the March 11 swing low of 146.54.
Conversely, if USD/JPY climbs above 148.00 a rally towards testing the Senkou Span A at 149.79 is on the cards.
USDJPY Price Chart: Technical outlook
Japanese Yen FAQs
The Japanese Yen (JPY) is one of the world’s most traded currencies. Its value is broadly determined by the performance of the Japanese economy, but more specifically by the Bank of Japan’s policy, the differential between Japanese and US bond yields, or risk sentiment among traders, among other factors.
One of the Bank of Japan’s mandates is currency control, so its moves are key for the Yen. The BoJ has directly intervened in currency markets sometimes, generally to lower the value of the Yen, although it refrains from doing it often due to political concerns of its main trading partners. The BoJ ultra-loose monetary policy between 2013 and 2024 caused the Yen to depreciate against its main currency peers due to an increasing policy divergence between the Bank of Japan and other main central banks. More recently, the gradually unwinding of this ultra-loose policy has given some support to the Yen.
Over the last decade, the BoJ’s stance of sticking to ultra-loose monetary policy has led to a widening policy divergence with other central banks, particularly with the US Federal Reserve. This supported a widening of the differential between the 10-year US and Japanese bonds, which favored the US Dollar against the Japanese Yen. The BoJ decision in 2024 to gradually abandon the ultra-loose policy, coupled with interest-rate cuts in other major central banks, is narrowing this differential.
The Japanese Yen is often seen as a safe-haven investment. This means that in times of market stress, investors are more likely to put their money in the Japanese currency due to its supposed reliability and stability. Turbulent times are likely to strengthen the Yen’s value against other currencies seen as more risky to invest in.
-
23:20
Canada Finance Minister: We agree to maintain dialogue
Canada's Finance Minister Dominic LeBlanc said on Friday tariffs are harmful to both the United States and Canada, adding that moving forward with dialogue is crucial.
Key quotes
It was a long discussion.
Tariffs are harmful on both sides of the border.
There is a chance for a reset here.
There is a mutual understanding that there is an impact on both sides of the border.
Moving forward with dialogue is crucial.
The US side understands.
We talked about making North America more competitive.
We talked about a reset with a new Prime Minister tomorrow.
We changed the channel in my view in looking at opportunities and competition in North America.
Market reaction
At the time of writing, the USD/CAD pair is trading 0.09% lower on the day to trade at 1.4428.
Tariffs FAQs
Tariffs are customs duties levied on certain merchandise imports or a category of products. Tariffs are designed to help local producers and manufacturers be more competitive in the market by providing a price advantage over similar goods that can be imported. Tariffs are widely used as tools of protectionism, along with trade barriers and import quotas.
Although tariffs and taxes both generate government revenue to fund public goods and services, they have several distinctions. Tariffs are prepaid at the port of entry, while taxes are paid at the time of purchase. Taxes are imposed on individual taxpayers and businesses, while tariffs are paid by importers.
There are two schools of thought among economists regarding the usage of tariffs. While some argue that tariffs are necessary to protect domestic industries and address trade imbalances, others see them as a harmful tool that could potentially drive prices higher over the long term and lead to a damaging trade war by encouraging tit-for-tat tariffs.
During the run-up to the presidential election in November 2024, Donald Trump made it clear that he intends to use tariffs to support the US economy and American producers. In 2024, Mexico, China and Canada accounted for 42% of total US imports. In this period, Mexico stood out as the top exporter with $466.6 billion, according to the US Census Bureau. Hence, Trump wants to focus on these three nations when imposing tariffs. He also plans to use the revenue generated through tariffs to lower personal income taxes.
-
23:02
USD/CAD holds below 1.4450 amid trade uncertainty
- USD/CAD softens to around 1.4430 in Thursday’s late American session.
- US annual PPI inflation declined to 3.2% in February, softer than expected.
- Canada's Finance Minister said the country agreed to maintain dialogue.
The USD/CAD pair weakens to near 1.4430 during the late American session on Thursday, pressured by lower US yields. However, lower crude oil prices might weigh on the commodity-linked Loonie and help limit the pair’s losses. The preliminary Michigan Consumer Sentiment will take center stage on Friday.
The concerns about slowing growth in the US economy from US President Donald Trump's administration's trade policies could exert some selling pressure on the Greenback. Data released by the US Bureau of Labor Statistics on Thursday showed that the US Producer Price Index (PPI) rose 3.2% on a yearly basis in February, compared to the 3.7% increase recorded in January. This figure came in below the market expectation of 3.3%.
Meanwhile, the annual core PPI rose 3.4% in February versus 3.8% in January. On a monthly basis, the PPI was unchanged, while the core PPI declined by 0.1%.Canada's Finance Minister Dominic LeBlanc said on Friday tariffs are harmful to both the United States and Canada, adding that moving forward with dialogue is crucial. Traders will closely monitor the developments surrounding Trump’s tariff policy. Any signs of an escalating trade war could undermine the Canadian Dollar (CAD) against the USD.
On Wednesday, the Bank of Canada (BoC) cut its benchmark interest rate by 25 basis points (bps), bringing it down to 2.75%. This was the BoC’s seventh consecutive interest rate cut. A move that comes just hours after US President Donald Trump issued new steel and aluminum tariffs against Canada.
BoC governor Tiff Macklem said during the press conference that the central bank would "proceed carefully with any further changes," needing to assess both the upward pressures on inflation from higher costs in a trade war and the downward pressures from weaker demand.
Meanwhile, a decline in crude oil prices on the back of steady tariff concerns could weigh on the commodity-linked Canadian Dollar (CAD). It’s worth noting that Canada is the largest oil exporter to the United States (US), and lower crude oil prices tend to have a negative impact on the CAD value.Canadian Dollar FAQs
The key factors driving the Canadian Dollar (CAD) are the level of interest rates set by the Bank of Canada (BoC), the price of Oil, Canada’s largest export, the health of its economy, inflation and the Trade Balance, which is the difference between the value of Canada’s exports versus its imports. Other factors include market sentiment – whether investors are taking on more risky assets (risk-on) or seeking safe-havens (risk-off) – with risk-on being CAD-positive. As its largest trading partner, the health of the US economy is also a key factor influencing the Canadian Dollar.
The Bank of Canada (BoC) has a significant influence on the Canadian Dollar by setting the level of interest rates that banks can lend to one another. This influences the level of interest rates for everyone. The main goal of the BoC is to maintain inflation at 1-3% by adjusting interest rates up or down. Relatively higher interest rates tend to be positive for the CAD. The Bank of Canada can also use quantitative easing and tightening to influence credit conditions, with the former CAD-negative and the latter CAD-positive.
The price of Oil is a key factor impacting the value of the Canadian Dollar. Petroleum is Canada’s biggest export, so Oil price tends to have an immediate impact on the CAD value. Generally, if Oil price rises CAD also goes up, as aggregate demand for the currency increases. The opposite is the case if the price of Oil falls. Higher Oil prices also tend to result in a greater likelihood of a positive Trade Balance, which is also supportive of the CAD.
While inflation had always traditionally been thought of as a negative factor for a currency since it lowers the value of money, the opposite has actually been the case in modern times with the relaxation of cross-border capital controls. Higher inflation tends to lead central banks to put up interest rates which attracts more capital inflows from global investors seeking a lucrative place to keep their money. This increases demand for the local currency, which in Canada’s case is the Canadian Dollar.
Macroeconomic data releases gauge the health of the economy and can have an impact on the Canadian Dollar. Indicators such as GDP, Manufacturing and Services PMIs, employment, and consumer sentiment surveys can all influence the direction of the CAD. A strong economy is good for the Canadian Dollar. Not only does it attract more foreign investment but it may encourage the Bank of Canada to put up interest rates, leading to a stronger currency. If economic data is weak, however, the CAD is likely to fall.
-
22:50
GBP/USD holds steady as markets look elsewhere
- GBP/USD continues to churn near the 1.3000 handle.
- UK data remains strictly low-tier this week as markets focus on geopolitics.
- US inflation data teased lower price pressures, but trade war rhetorics rattles sentiment.
GBP/USD churned chart paper for a second day in a row, holding steady just south of the 1.3000 handle as Cable traders take a breather and watch market headlines broadly sail past the Pound Sterling. US Producer Price Index (PPI) business-level inflation eased faster than expected in February. However, markets never got the chance to experience any joy from the easing inflation figures as US President Donald Trump continues his campaign to spark a global trade war between the US and everybody else. Despite the ongoing geopolitical headlines, Cable markets remain relatively untouched by tariff talk as the UK skates by unnoticed.
US President Trump wants to tariff EU wine, reiterates interest in Greenland
Coming up on Friday, the US data docket will close out a relatively packed week with the University of Michigan (UoM) Consumer Sentiment Index as well as UoM’s Consumer Inflation Expectations. Both figures are likely to see some negative influence from President Trump’s tariff tirades, and median market forecasts see the sentiment index declining to 63.1 for March, down from February’s 64.7. At the last print, the average consumer respondent expected 5-year inflation to clock in around 3.5%, implying inflation expectations remain entrenched well above the Federal Reserve’s (Fed) 2% target.
UK Gross Domestic Product (GDP) growth figures are slated for release during the early Friday market session. However, the monthly figure is unlikely to spark much volatility, as it's backdated to January and any shifts in the UK’s growth model are likely already priced in.
GBP/USD price forecast
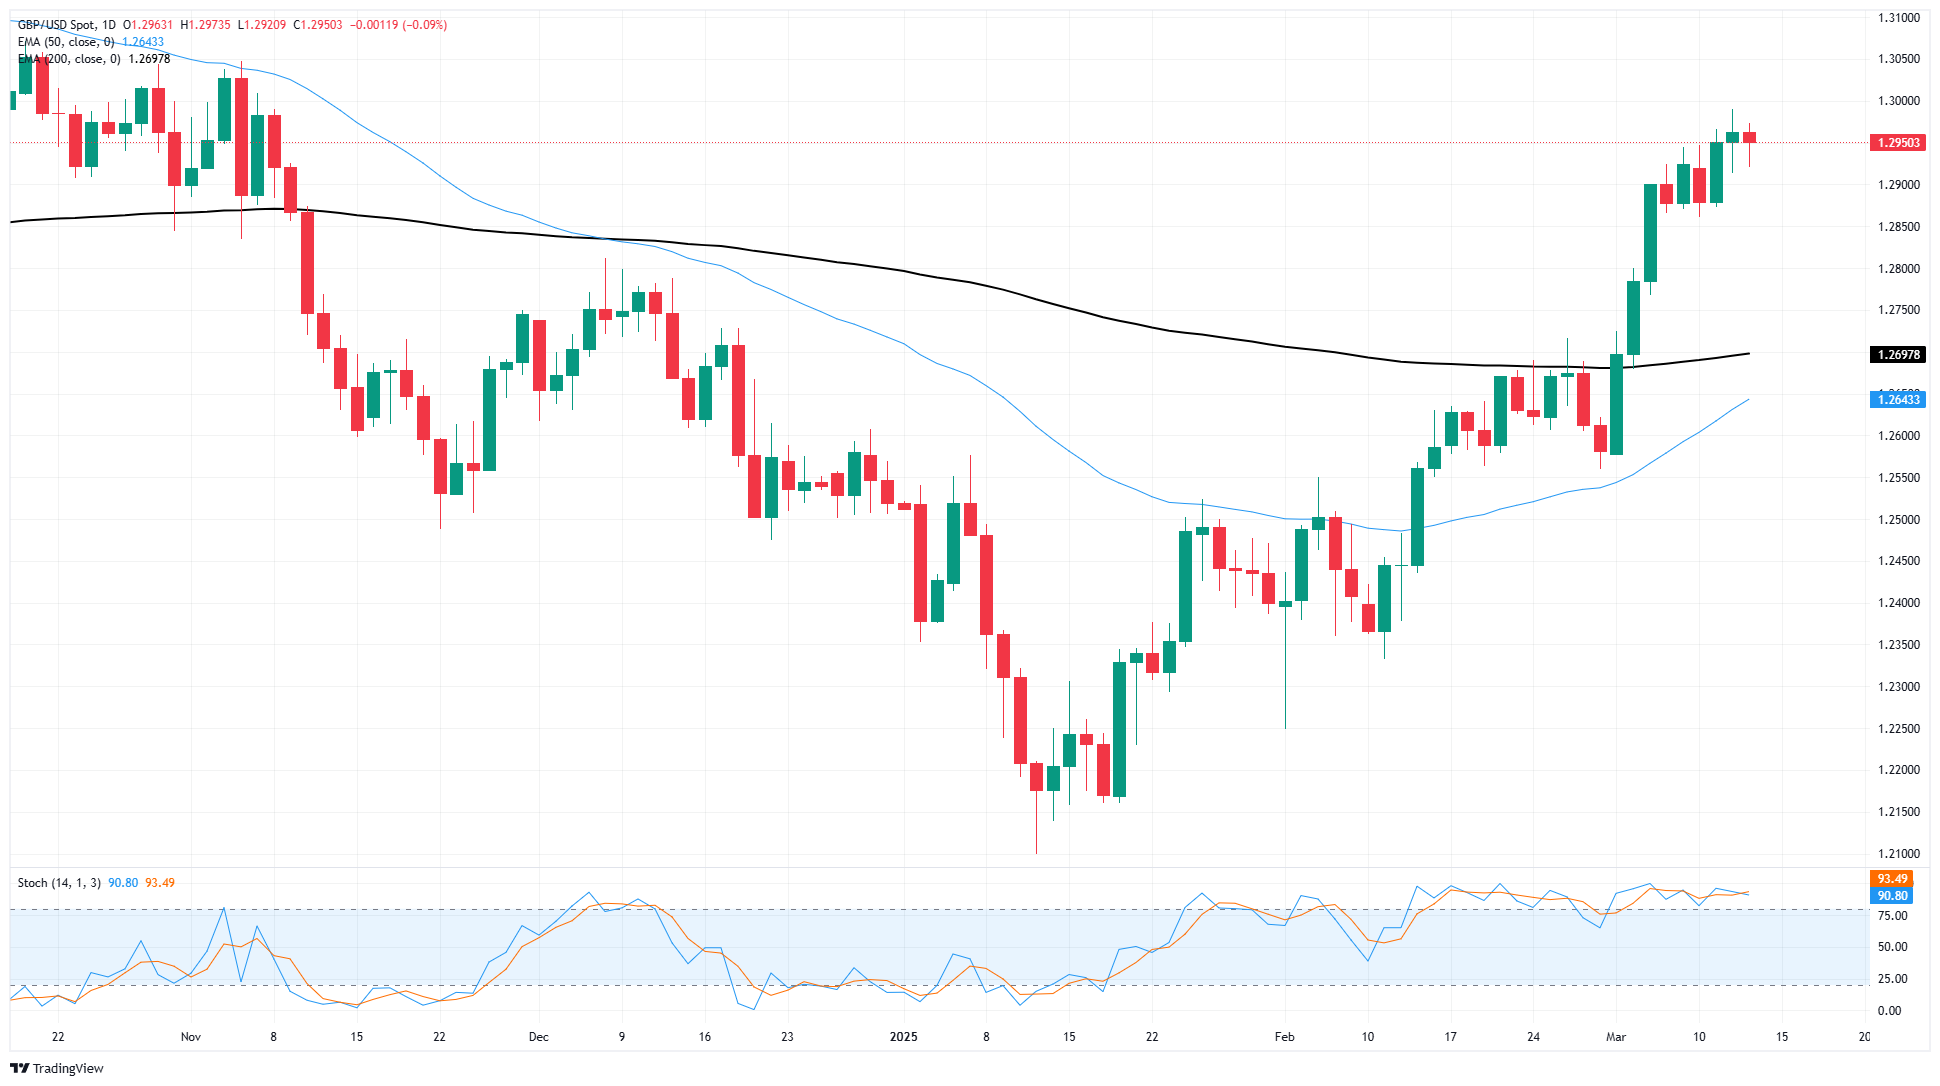
The GBP/USD pair is experiencing its second consecutive week of gains, approaching new 18-week highs close to 1.2950. The significant 1.3000 resistance level may limit any additional upward movement, as this key level was previously a notable consolidation point in October and November of 2024.
Currently, demand is strong among buyers, but technical indicators have remained in overbought territory since January, suggesting a potential reversal could happen soon.
GBP/USD daily chart
Pound Sterling FAQs
The Pound Sterling (GBP) is the oldest currency in the world (886 AD) and the official currency of the United Kingdom. It is the fourth most traded unit for foreign exchange (FX) in the world, accounting for 12% of all transactions, averaging $630 billion a day, according to 2022 data. Its key trading pairs are GBP/USD, also known as ‘Cable’, which accounts for 11% of FX, GBP/JPY, or the ‘Dragon’ as it is known by traders (3%), and EUR/GBP (2%). The Pound Sterling is issued by the Bank of England (BoE).
The single most important factor influencing the value of the Pound Sterling is monetary policy decided by the Bank of England. The BoE bases its decisions on whether it has achieved its primary goal of “price stability” – a steady inflation rate of around 2%. Its primary tool for achieving this is the adjustment of interest rates. When inflation is too high, the BoE will try to rein it in by raising interest rates, making it more expensive for people and businesses to access credit. This is generally positive for GBP, as higher interest rates make the UK a more attractive place for global investors to park their money. When inflation falls too low it is a sign economic growth is slowing. In this scenario, the BoE will consider lowering interest rates to cheapen credit so businesses will borrow more to invest in growth-generating projects.
Data releases gauge the health of the economy and can impact the value of the Pound Sterling. Indicators such as GDP, Manufacturing and Services PMIs, and employment can all influence the direction of the GBP. A strong economy is good for Sterling. Not only does it attract more foreign investment but it may encourage the BoE to put up interest rates, which will directly strengthen GBP. Otherwise, if economic data is weak, the Pound Sterling is likely to fall.
Another significant data release for the Pound Sterling is the Trade Balance. This indicator measures the difference between what a country earns from its exports and what it spends on imports over a given period. If a country produces highly sought-after exports, its currency will benefit purely from the extra demand created from foreign buyers seeking to purchase these goods. Therefore, a positive net Trade Balance strengthens a currency and vice versa for a negative balance.
-
21:34
AUD/JPY Price Analysis: Bears take control but pair holds above 92.00
- AUD/JPY was seen trading around the 92.80 zone ahead of the Asian session, pulling back after two consecutive days of gains.
- Despite the decline, the pair remains above the 92.00 threshold, with technical indicators still in negative territory.
- Sideways trading could persist above 92.00 as the market awaits fresh momentum, with resistance at 93.50 and support at 92.00.
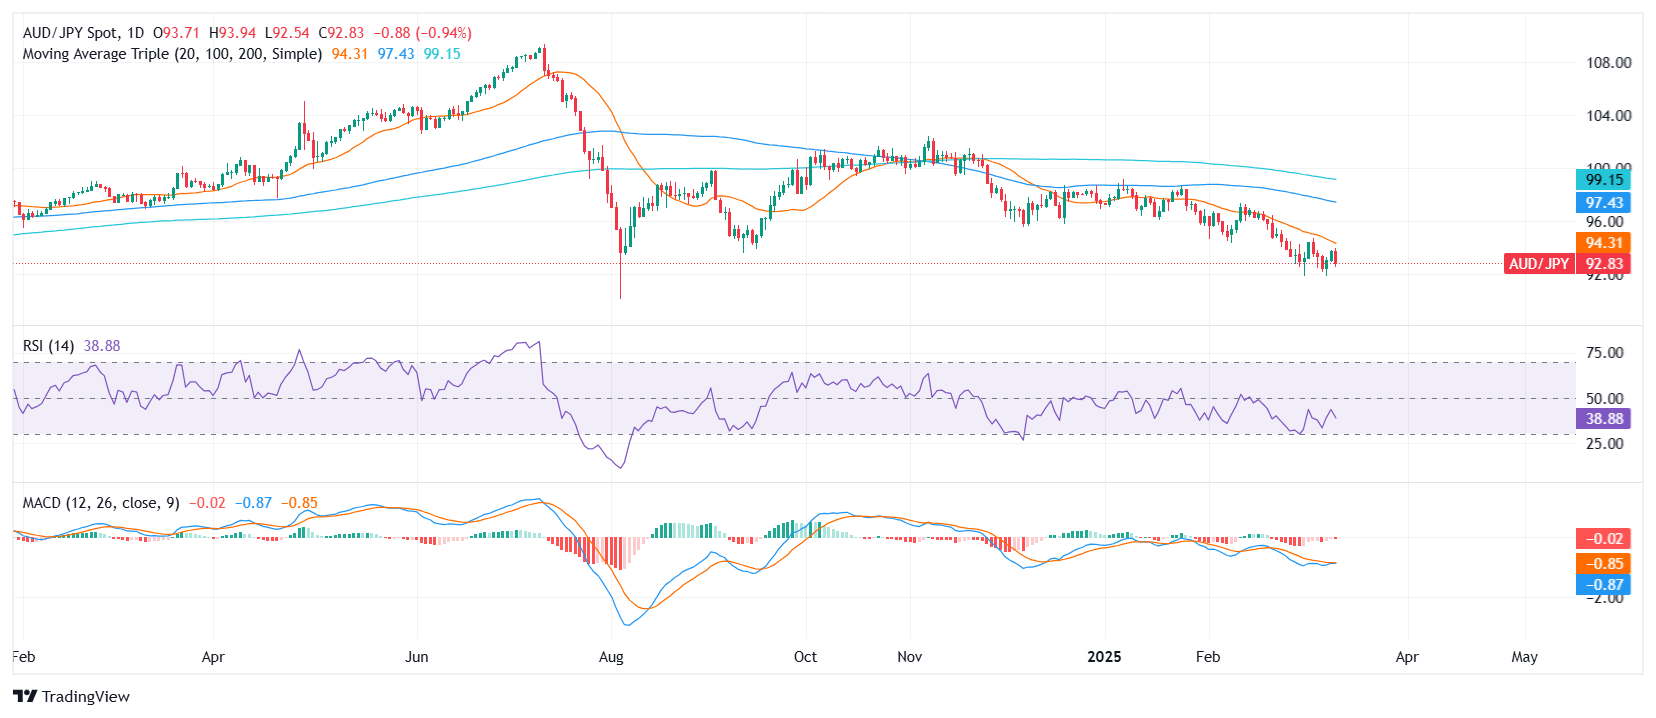
AUD/JPY fell on Thursday ahead of the Asian session, reversing some of the gains from earlier in the week. The pair dropped toward the 92.80 area, reflecting renewed bearish momentum after a brief period of buying pressure. While sellers regained control, the pair remains above the key 92.00 threshold, suggesting that a period of consolidation might be ahead.
Looking at technical indicators, the Relative Strength Index (RSI) is declining sharply within the negative zone, indicating weakening bullish strength. Meanwhile, the Moving Average Convergence Divergence (MACD) is printing decreasing red bars, reinforcing the view that downside pressure persists. However, the pair still trades within a broader range, limiting immediate downside risks.
For now, support remains firm at 92.00, a level that has provided a strong floor in recent sessions. A break below could accelerate bearish momentum toward 91.50. On the upside, resistance is seen around 93.50, where sellers have consistently stepped in. If AUD/JPY remains above 92.00, the pair could trade sideways in the near term before finding a clearer directional bias.
AUD/JPY daily chart
-
21:30
New Zealand Business NZ PMI increased to 53.9 in February from previous 51.4
-
21:03
AUD/USD slumps on US Dollar’s strong recovery despite soft PPI data
- The AUD/USD tumbles on Thursday as the US Dollar strengthens amid renewed trade policy concerns.
- Trump’s tariff threats fuel risk aversion, overshadowing softer-than-expected US inflation data.
- US PPI data signals weaker inflation, but investors remain focused on escalating trade tensions.
- Technical indicators suggest further downside with AUD/USD losing key support levels.
The AUD/USD tumbles to near 0.6280 as the US Dollar outperforms on the Trump administration’s tariff agenda. The pair faced sharp selling pressure on Thursday as renewed fears of a global economic slowdown triggered a flight to the US Dollar.
Investors largely ignored softer US CPI and PPI data for February, instead focusing on US President Donald Trump’s aggressive trade stance. His renewed commitment to "America First" policies stoked fears of retaliatory measures, weighing on risk-sensitive assets like the Australian Dollar.
Daily digest market movers: Australian Dollar under pressure as trade fears escalate
- The US Dollar Index (DXY) rebounded sharply, reaching 104.00 after recovering from a four-month low of 103.20. The Greenback gained as traders turned to safe-haven assets amid heightened concerns over trade policy.
- Trump reiterated his protectionist stance, stating that the US does not have “Free Trade” but “Stupid Trade” in a Truth Social post. His comments reinforced expectations of further tariffs on key trading partners.
- New tariffs on European imports further rattled markets. Trump confirmed retaliatory duties on 26 billion Euros worth of Eurozone goods after the EU imposed countermeasures against the 25% universal import duty the US placed on steel and aluminum.
- US inflation data was softer than expected but failed to weaken the US Dollar. The Producer Price Index (PPI) fell to 0.0% in February, well below the 0.3% estimate, while core PPI contracted by 0.1%. Despite weak inflation figures, markets focused on rising geopolitical and trade risks.
- The Australian Dollar struggled amid deteriorating risk sentiment. The currency, which closely reflects Chinese economic performance, faced headwinds as the US maintained 20% tariffs on Chinese imports, raising fears of a further slowdown in Australia’s key trading partner.
- Markets are also monitoring diplomatic developments as US officials visit Russia to discuss a potential ceasefire agreement with Ukraine. However, geopolitical tensions remain elevated, adding further support to the US Dollar.
- Looking ahead, traders will closely watch Australia’s labor market report, due March 20, for insights into the Reserve Bank of Australia’s (RBA) potential policy direction.
AUD/USD Technical Analysis: Downside pressure intensifies as key support breaks
The AUD/USD dropped on Thursday, moving toward the 0.6280 region during the American session, as selling momentum intensified. The pair struggled to find support with trade risks and a stronger US Dollar keeping pressure on the Aussie.
The Moving Average Convergence Divergence (MACD) indicator continues to print flat red bars, signaling fading momentum but maintaining a bearish bias. Meanwhile, the Relative Strength Index (RSI) has dropped to 48, declining sharply into negative territory, reflecting growing downside risks.The pair has lost its 20-day Simple Moving Average (SMA), confirming a deteriorating technical outlook. Further downside could target the 0.6250 region, where stronger demand might emerge. On the upside, resistance is seen around 0.6320, but a break above this level would be needed to shift sentiment toward recovery.
Australian Dollar FAQs
One of the most significant factors for the Australian Dollar (AUD) is the level of interest rates set by the Reserve Bank of Australia (RBA). Because Australia is a resource-rich country another key driver is the price of its biggest export, Iron Ore. The health of the Chinese economy, its largest trading partner, is a factor, as well as inflation in Australia, its growth rate and Trade Balance. Market sentiment – whether investors are taking on more risky assets (risk-on) or seeking safe-havens (risk-off) – is also a factor, with risk-on positive for AUD.
The Reserve Bank of Australia (RBA) influences the Australian Dollar (AUD) by setting the level of interest rates that Australian banks can lend to each other. This influences the level of interest rates in the economy as a whole. The main goal of the RBA is to maintain a stable inflation rate of 2-3% by adjusting interest rates up or down. Relatively high interest rates compared to other major central banks support the AUD, and the opposite for relatively low. The RBA can also use quantitative easing and tightening to influence credit conditions, with the former AUD-negative and the latter AUD-positive.
China is Australia’s largest trading partner so the health of the Chinese economy is a major influence on the value of the Australian Dollar (AUD). When the Chinese economy is doing well it purchases more raw materials, goods and services from Australia, lifting demand for the AUD, and pushing up its value. The opposite is the case when the Chinese economy is not growing as fast as expected. Positive or negative surprises in Chinese growth data, therefore, often have a direct impact on the Australian Dollar and its pairs.
Iron Ore is Australia’s largest export, accounting for $118 billion a year according to data from 2021, with China as its primary destination. The price of Iron Ore, therefore, can be a driver of the Australian Dollar. Generally, if the price of Iron Ore rises, AUD also goes up, as aggregate demand for the currency increases. The opposite is the case if the price of Iron Ore falls. Higher Iron Ore prices also tend to result in a greater likelihood of a positive Trade Balance for Australia, which is also positive of the AUD.
The Trade Balance, which is the difference between what a country earns from its exports versus what it pays for its imports, is another factor that can influence the value of the Australian Dollar. If Australia produces highly sought after exports, then its currency will gain in value purely from the surplus demand created from foreign buyers seeking to purchase its exports versus what it spends to purchase imports. Therefore, a positive net Trade Balance strengthens the AUD, with the opposite effect if the Trade Balance is negative.
-
21:00
South Korea Import Price Growth (YoY) declined to 4.6% in February from previous 6.6%
-
21:00
South Korea Export Price Growth (YoY) declined to 6.3% in February from previous 8.5%
-
20:56
Gold price hit all-time high near $3,000 as trade tensions rock markets
- Gold soars 1.70% to a fresh record of $2,985, driven by uncertainty over US trade policies.
- Mixed signals from Trump administration officials on trade-induced recession fears fuel investor rush into Gold and Japanese Yen.
- Markets focus shifts to the Fed policy decision next week, with rates expected unchanged but crucial hints from new economic projections.
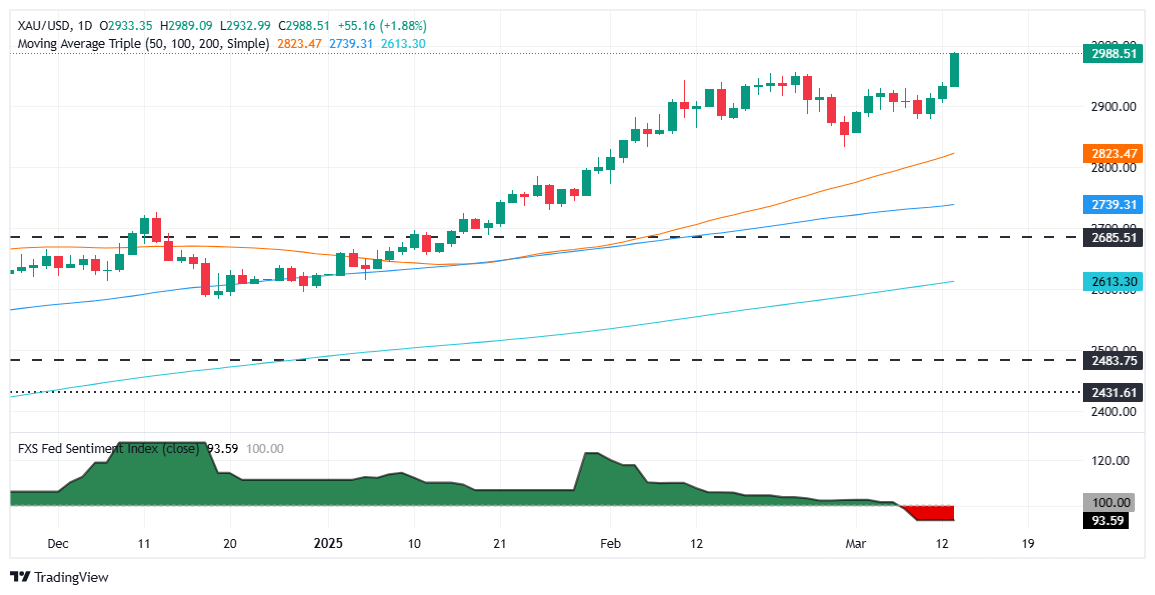
Gold prices skyrocketed on Thursday, with the yellow metal reaching a new record high of $2,989 yet poised to extend the trend towards the $3,000 figure. Uncertainty about the United States' (US) trade policies and increasing odds the Federal Reserve (Fed) would lower interest rates underpin the precious metal. XAU/USD trades at $2,988, up 1.86%.
The yellow metal’s advance is set to continue as US President Donald Trump embarks on a trade war with US allies and adversaries, as he tries to reduce the trade deficit. Fluctuations of imposing and removing duties on imports keep money flocking to Gold’s safe-haven appeal.
Recently, some US officials have not seemed worried about Wall Street’s reaction to Trump’s administration's trade policies. US Treasury Secretary Scott Bessent said that his comments last Friday about a “detox period” did not mean a recession was necessary. In contrast, US Commerce Secretary Howard Lutnick said a recession would be “worth it” to implement the current administration’s policies.
This was a green light for investors, who continued the sell-off in US equities and bought safe-haven assets like Gold and the Japanese Yen (JPY).
Meanwhile, data remains in the backseat, overshadowed by tariffs. Earlier, the US Bureau of Labor Statistics (BLS) revealed that inflation on the producer’s side was mainly unchanged, with a slight decline. At the same time, the number of Americans filing for unemployment benefits last week dipped, revealed the BLS.
Ahead this week, traders eye the University of Michigan (UoM) Consumer Sentiment for March. However, their radar is focused on the Federal Reserve (Fed) monetary policy decision next week. The Fed is expected to keep rates unchanged, update its economic projections, and dictate policy paths using the infamous “dot plot.”
Daily digest market movers: Gold price soars unfazed by a strong US Dollar
- The US 10-year Treasury bond yield erases yesterday’s gains, dropping four and a half basis points to 4.270%.
- US real yields, as measured by the US 10-year Treasury Inflation-Protected Securities (TIPS) yield that correlates inversely to Gold prices, climb one basis point to 1.99%.
- The US Dollar Index (DXY), which tracks the Greenback’s value against six currencies, recovers 0.27% to 103.85.
- The US Producer Price Index (PPI) for February came in softer than expected, rising 3.2% YoY, below the 3.3% forecast and down from 3.7% in January.
- Core PPI, which excludes volatile components, increased 3.4% YoY, falling short of the 3.5% estimate and easing from 3.6% in the prior month.
- Despite recent cooler-than-expected inflation data, economists caution that tariffs on US imports could lead to a renewed inflationary uptick in the coming months.
- Meanwhile, Initial Jobless Claims for the week ending March 8 edged down to 220K, beating forecasts of 225K and improving from the 222K reported previously.
- On Wednesday, 25% US tariffs on steel and aluminum took effect at midnight as US President Donald Trump is battling to reduce the trade deficit by applying duties on imports.
- Money market futures traders had been priced in 74 basis points of easing by the Federal Reserve (Fed) toward the end of the year.
- The Atlanta Fed GDPNow model predicts the first quarter of 2025 at -2.4 %, which would be the first negative print since the COVID-19 pandemic.
XAU/USD technical outlook: Gold price surges toward $3,000
Bullion prices are trading at all-time highs of $2,989 after clearing the previous year-to-date (YTD) high on February 20 at $2,954. Momentum remains exceptionally bullish, with the Relative Strength Index (RSI) slope aiming higher, but with room before turning overbought. With that said, Gold’s next resistance would be $3,000. A breach of the latter would expose $3,050 followed by the $3,100 mark.
Conversely, if XAU/USD drops below $2,950, the next support would be $2,900 ahead of $2,850. The following support will be a February 28 low of $2,832.
Gold FAQs
Gold has played a key role in human’s history as it has been widely used as a store of value and medium of exchange. Currently, apart from its shine and usage for jewelry, the precious metal is widely seen as a safe-haven asset, meaning that it is considered a good investment during turbulent times. Gold is also widely seen as a hedge against inflation and against depreciating currencies as it doesn’t rely on any specific issuer or government.
Central banks are the biggest Gold holders. In their aim to support their currencies in turbulent times, central banks tend to diversify their reserves and buy Gold to improve the perceived strength of the economy and the currency. High Gold reserves can be a source of trust for a country’s solvency. Central banks added 1,136 tonnes of Gold worth around $70 billion to their reserves in 2022, according to data from the World Gold Council. This is the highest yearly purchase since records began. Central banks from emerging economies such as China, India and Turkey are quickly increasing their Gold reserves.
Gold has an inverse correlation with the US Dollar and US Treasuries, which are both major reserve and safe-haven assets. When the Dollar depreciates, Gold tends to rise, enabling investors and central banks to diversify their assets in turbulent times. Gold is also inversely correlated with risk assets. A rally in the stock market tends to weaken Gold price, while sell-offs in riskier markets tend to favor the precious metal.
The price can move due to a wide range of factors. Geopolitical instability or fears of a deep recession can quickly make Gold price escalate due to its safe-haven status. As a yield-less asset, Gold tends to rise with lower interest rates, while higher cost of money usually weighs down on the yellow metal. Still, most moves depend on how the US Dollar (USD) behaves as the asset is priced in dollars (XAU/USD). A strong Dollar tends to keep the price of Gold controlled, whereas a weaker Dollar is likely to push Gold prices up.
-
20:21
Ukraine President Volodymyr Zelenskyy: Putin is preparing to reject peace deal
President of Ukraine Volodymyr Zelenskyy noted on Thursday that his administration believes that Russian President Vladimir Putin is gearing up to reject a ceasefire proposal that has been closely managed by United States (US) President Donald Trump in recent weeks.
According to President Zelenskyy, Russia's Putin is "scared" to state his ceasefire rejection directly to President Trump and is instead exploring delay tactics to find a structural reason to back away from the deal after spending weeks pushing for it.
The timing of the comments bodes poorly for Trump's administration, which is desperate to broker a deal in the Ukraine-Russia conflict so that President Trump can add it to his list of self-perceived accolades. An envoy of US delegates is meeting with Russian officials in Moscow on Thursday, attempting to smooth over Russia's flexible and frequently-changing demands for a Ukraine ceasefire deal.
-
19:13
US Dollar rebounds after PPI and jobless claims data
- DXY climbs after better-than-expected jobless claims data.
- PPI figures come in softer, raising concerns about weakening demand.
- Markets await updates on US diplomatic talks in Russia over Ukraine ceasefire.
- Trump threatens 200% tariffs on European wines and champagnes.
The US Dollar (USD) bounced back on Thursday, reclaiming the 104.00 level as traders reacted to softer-than-expected Producer Price Index (PPI) data and positive jobless claims figures. The US Dollar Index (DXY) initially jumped following the data release but later pared gains as investors weighed the implications of slowing inflation and potential demand concerns. Meanwhile, United States (US) diplomats arrived in Russia for ceasefire talks over Ukraine, and President Donald Trump escalated trade tensions by threatening a 200% tariff on European wines and champagnes.
Daily digest market movers: Mixed economic signals, geopolitical tensions rise
- The US weekly jobless claims report showed initial claims at 220,000, lower than the expected 225,000. Continuing claims dropped to 1.87 million, below the forecast of 1.90 million.
- The February Producer Price Index (PPI) came in weaker than expected, with the headline monthly figure at 0.0% vs. 0.3% expected, and the core PPI contracting by 0.1%.
- On a yearly basis, the headline PPI eased to 3.2%, below the projected 3.3%, while the core PPI declined to 3.4% from 3.6%.
- Markets initially viewed the softer inflation data as positive for the US dollar, but gains were quickly reversed as traders interpreted weaker PPI figures as a sign of softening demand.
- US stocks moved lower after PPI data, with sentiment further pressured by Trump's latest trade threats targeting European imports.
- The CME FedWatch tool indicates that markets widely expect the Fed to maintain rates in the March 19 meeting, while rate cut probabilities for May and June continue to rise.
DXY technical outlook: Oversold bounce meets resistance
The US dollar index (DXY) recovered from recent multi-month lows, climbing back above 104.00 as traders reassessed oversold conditions. Relative Strength Index (RSI) and Moving Average Convergence Divergence (MACD) indicate a short-term correction, though selling pressure remains dominant after last week’s sharp decline. Key resistance stands near 104.50, while support rests at 103.50, with further downside possible if sellers regain control.
Inflation FAQs
Inflation measures the rise in the price of a representative basket of goods and services. Headline inflation is usually expressed as a percentage change on a month-on-month (MoM) and year-on-year (YoY) basis. Core inflation excludes more volatile elements such as food and fuel which can fluctuate because of geopolitical and seasonal factors. Core inflation is the figure economists focus on and is the level targeted by central banks, which are mandated to keep inflation at a manageable level, usually around 2%.
The Consumer Price Index (CPI) measures the change in prices of a basket of goods and services over a period of time. It is usually expressed as a percentage change on a month-on-month (MoM) and year-on-year (YoY) basis. Core CPI is the figure targeted by central banks as it excludes volatile food and fuel inputs. When Core CPI rises above 2% it usually results in higher interest rates and vice versa when it falls below 2%. Since higher interest rates are positive for a currency, higher inflation usually results in a stronger currency. The opposite is true when inflation falls.
Although it may seem counter-intuitive, high inflation in a country pushes up the value of its currency and vice versa for lower inflation. This is because the central bank will normally raise interest rates to combat the higher inflation, which attract more global capital inflows from investors looking for a lucrative place to park their money.
Formerly, Gold was the asset investors turned to in times of high inflation because it preserved its value, and whilst investors will often still buy Gold for its safe-haven properties in times of extreme market turmoil, this is not the case most of the time. This is because when inflation is high, central banks will put up interest rates to combat it. Higher interest rates are negative for Gold because they increase the opportunity-cost of holding Gold vis-a-vis an interest-bearing asset or placing the money in a cash deposit account. On the flipside, lower inflation tends to be positive for Gold as it brings interest rates down, making the bright metal a more viable investment alternative.
-
18:42
Forex Today: Tariffs, German inflation, and UK GDP gather attention
The Greenback extended its recovery from recent lows, adding to Wednesday’s uptick amid the move lower in yields and intense concerns surrounding the prospects of a global trade war.
Here is what you need to know on Friday, March 14:
The US Dollar Index (DXY) rose to three-day highs and regained the 104.00 barrier helped by higher US yields. The preliminary Michigan Consumer Sentiment takes centre stage across the Atlantic.
EUR/USD extended its correction from recent multi-month tops, receding to three-day lows in the 1.0825-1.0820 band. Germany will be at the centre of the debate with the releases of the final Inflation Rate and Wholesale Prices. In addition, the ECB’s Cipollone is due to speak.
GBP/USD set aside two daily advances in a row and retreated to the low-1.2900s on the back of further recovery in the US Dollar. An interesting UK calendar will feature GDP figures, Industrial and Manufacturing Production, Goods Trade Balance results, Construction Output, and the NIESR Monthly GDP Tracker.
USD/JPY halted its weekly recovery on the back of the resurgence of the appreciation in the Japanese yen, limiting the pair’s upside to the 148.40 zone. Next on tap in Japan will be the Balance of Trade readings and Machinery Orders, all expected on March 19.
Sellers regained the upper hand and forced AUD/USD to resume its downtrend, slipping back to the 0.6270 zone amid further gains in the Greenback. The next key data release will be the labour market report on March 20.
WTI prices resumed their downward bias and eroded two consecutive daily advances on the back of steady tariff concerns and the stronger Dollar.
Prices of Gold added to the weekly rebound and surged to all-time highs past the $2,980 mark per troy ounce. Silver prices gathered extra steam and came close to the $34.00 mark per ounce, levels last traded in late October.
-
18:17
Mexican Peso surges as traders bet on Fed rate cuts
- Mexican Peso appreciates as USD/MXN dives toward 20.00 amid Fed easing expectations.
- Weak Mexican Industrial Production data was overshadowed by improved risk appetite, boosting MXN against the softer Greenback.
- US-Mexico tariff tensions intensify; Mexican officials confirm ongoing discussions ahead of critical April 2 tariff deadline.
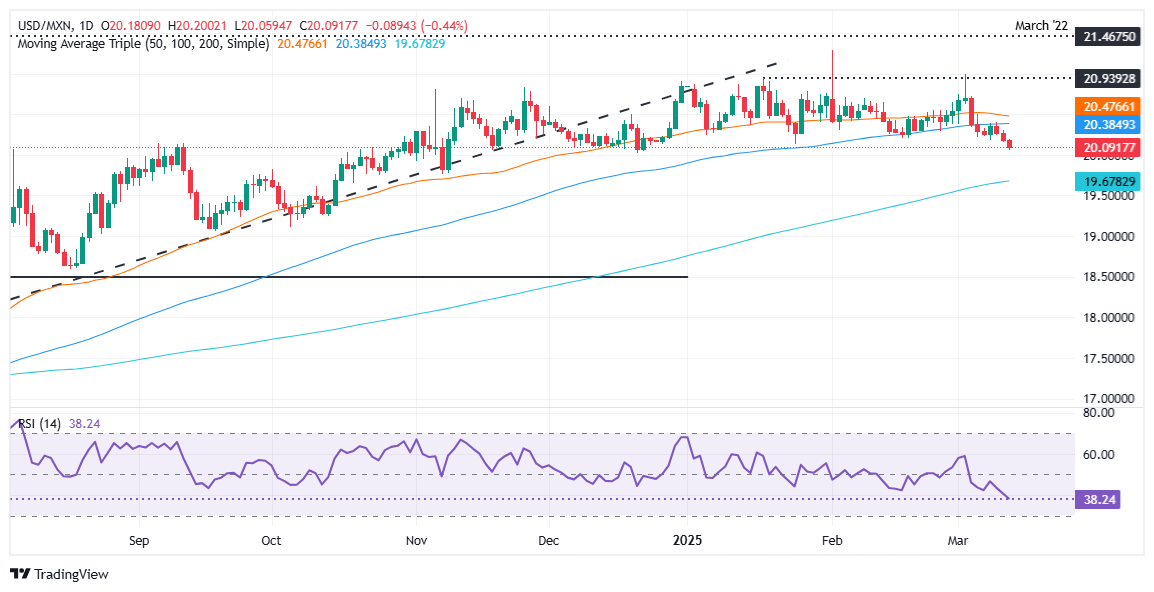
The Mexican Peso (MXN) is rallying sharply against the US Dollar (USD) on Thursday as traders seem confident that the Federal Reserve (Fed) could lower interest rates thrice in 2025. Positive inflation and jobs reports in the United States (US) pushed traders to price in additional easing, which weighed on the US Dollar. USD/MXN trades at 20.08, down 0.44%.
Data from Mexico was worse than expected as Industrial Production in January fell. Nevertheless, a mild improvement in risk appetite keeps the Emerging Market (EM) currency appreciating as the Greenback continues to pare earlier losses.
Meanwhile, Mexican Economy Minister Marcelo Ebrard said the Mexican and US governments were having intensive talks over threats to impose a 25% tariff on all goods from its No. 1 trade partner by April 2.
On Wednesday, Mexican Finance Minister Edgar Amador Zamora said the national economy is expanding but shows signs of slowing down linked to trade tensions with the US.
Across the border, US data revealed that factory gate inflation was unchanged primarily, dipping some tenths though Goldman Sachs revealed that some of the measures of inflation used to calculate the Fed’s preferred inflation gauge, the Core Personal Consumption Expenditures (PCE) Price Index, could underpin the latter.
Based on CPI and PPI, the US investment bank revealed that February’s Core PCE estimates rose by 0.29%, corresponding to a 2.7% YoY reading.
Other data showed the labor market remains solid, though most economic data continue to be subdued amid US President Donald Trump's trade rhetoric.
Daily digest market movers: Mexican Peso unfazed by dismal Industrial Production data
- Mexico's Industrial Production fell -0.4% MoM in January, below forecasts for a 0.2% expansion. In the twelve months to January, production plunged -2.9% YoY, missed an improvement to -1.8%, worse than December’s -2.7 fall.
- The economy in Mexico is slowing down sharply, as projected by private analysts polled by Banco de Mexico (Banxico), with them expecting growth at 0.81%. The evolution of the disinflation process and a stagnant economy push Banxico to lower borrowing costs at the upcoming March 27 meeting.
- The February US Producer Price Index (PPI) came in softer than expected, rising 3.2% YoY, below the 3.3% forecast and down from 3.7% in the previous month.
- Core PPI, which excludes volatile items, increased 3.4% YoY, missing estimates of 3.5% and easing from 3.6% in January.
- Despite recent cooler-than-expected inflation reports, economists warn that tariffs on US imports could trigger a renewed inflationary uptick in the coming months.
- Meanwhile, Initial Jobless Claims for the week ending March 8 declined slightly to 220K, beating expectations of 225K and improving from the previous 222K reading.
- Money market futures traders had been priced in 74 basis points of easing by the Federal Reserve (Fed) toward the end of the year.
- A Reuters poll showed that 70 out of 74 economists say the risk of recession has risen in the US, Canada and Mexico.
- In the boiler room, trade disputes between the US and Mexico remain front and center. If the countries reach an agreement, it could pave the way for a recovery of the Mexican currency. Otherwise, further USD/MXN upside is seen as US tariffs could trigger a recession in Mexico.
USD/MXN technical outlook: Mexican Peso surges as USD/MXN tumbles below 20.10
USD/MXN shifted from neutral to downward biased, with sellers eyeing a test of the psychological 20.00 figure. A breach of the latter will pave the way to test the 200-day Simple Moving Average (SMA) at 19.63 before dropping to 20.50. On the flip side, a clear break above 20.20 could keep the exotic pair trapped once again within the 20.20 – 20.50 range before buyers can challenge the 20.99 March 4 peak.
Mexican Peso FAQs
The Mexican Peso (MXN) is the most traded currency among its Latin American peers. Its value is broadly determined by the performance of the Mexican economy, the country’s central bank’s policy, the amount of foreign investment in the country and even the levels of remittances sent by Mexicans who live abroad, particularly in the United States. Geopolitical trends can also move MXN: for example, the process of nearshoring – or the decision by some firms to relocate manufacturing capacity and supply chains closer to their home countries – is also seen as a catalyst for the Mexican currency as the country is considered a key manufacturing hub in the American continent. Another catalyst for MXN is Oil prices as Mexico is a key exporter of the commodity.
The main objective of Mexico’s central bank, also known as Banxico, is to maintain inflation at low and stable levels (at or close to its target of 3%, the midpoint in a tolerance band of between 2% and 4%). To this end, the bank sets an appropriate level of interest rates. When inflation is too high, Banxico will attempt to tame it by raising interest rates, making it more expensive for households and businesses to borrow money, thus cooling demand and the overall economy. Higher interest rates are generally positive for the Mexican Peso (MXN) as they lead to higher yields, making the country a more attractive place for investors. On the contrary, lower interest rates tend to weaken MXN.
Macroeconomic data releases are key to assess the state of the economy and can have an impact on the Mexican Peso (MXN) valuation. A strong Mexican economy, based on high economic growth, low unemployment and high confidence is good for MXN. Not only does it attract more foreign investment but it may encourage the Bank of Mexico (Banxico) to increase interest rates, particularly if this strength comes together with elevated inflation. However, if economic data is weak, MXN is likely to depreciate.
As an emerging-market currency, the Mexican Peso (MXN) tends to strive during risk-on periods, or when investors perceive that broader market risks are low and thus are eager to engage with investments that carry a higher risk. Conversely, MXN tends to weaken at times of market turbulence or economic uncertainty as investors tend to sell higher-risk assets and flee to the more-stable safe havens.
-
17:34
Dow Jones Industrial Average backslides despite flat PPI inflation as trade war ramps up
- The Dow Jones shed 600 points on Thursday, falling 1.45%.
- US PPI inflation hit a soft patch, further easing fears of an inflation reignition.
- Despite easing price pressures, equities still took a hit as Trump threatens more tariffs.
The Dow Jones Industrial Average (DJIA) fell some 600 points on Thursday, declining nearly one and one-half of a percent after United States (US) President Donald Trump and his administration ramped up their trade war rhetoric. President Trump pivoted to threatening new tariffs on targeted goods from the European Union after his tactic of trying to strong-arm Canada into making trade concessions went nowhere earlier this week.
The US Producer Price Index (PPI) cooled faster than expected in February, with core PPI inflation easing to 3.4% YoY versus the expected print of 3.5% and January’s 3.6%. Headline PPI inflation also chilled, falling to 3.2% on an annualized basis compared to the forecast of 3.3%, however January’s headline PPI print was revised higher to 3.7% as revisions continue to be a thorn in the side of preliminary data watchers.

Despite a general easing in this week’s batch of inflation data, the odds of another rate cut from the Federal Reserve (Fed) next week look slim. Inflation metrics are still running well above the Fed’s 2% annual target, and according to the CME’s FedWatch Tool, rate markets are pricing in functionally 100% odds of the Fed holding rates steady after its rate call meeting next week. Rate traders expect the Fed’s next move on rates to be in June, if not later.
US President Donald Trump hit the ground running on Thursday, vowing to impose a stiff 200% tariff on European wines if the EU doesn’t back off from its 50% tariff on US-produced whisky, which was imposed as a retaliatory measure against the US’s global 25% steel and aluminum tariff that went into effect this week. President Trump attempted to strong-arm his Canadian neighbors into not retaliating against his steel import fees.
However, those measures largely fizzled and resulted in no concessions from Canada, and now the Trump administration is shifting its tit-for-tat tariff strategy on Europe. Donald Trump also returned to musing about ‘taking’ Greenland from Denmark as the US president revisits talking points from his campaign trail.
Dow Jones news
A large majority of the stocks listed on the Dow Jones fell back on Thursday, with two-thirds of the index’s securities slipping into the red. Verizon (VZ) rebounded 2.5% to above $43 per share as the telecoms giant recovers from a rout earlier this week. Salesforce (CRM) and Home Depot (HD) both fell over 4%, falling to $271 per share and below $350 per share, respectively. Tech stocks and building suppliers are growing increasingly uneasy in the face of the Trump administration’s trade policies.
Dow Jones price forecast
Losses are beginning to accumulate on the Dow Jones Industrial Average chart, dragging the major equity index into correction territory with the Dow Jones down 2,000 points on the week. The DJIA has shed nearly 10% from last November’s record highs just north of 45,000, and price action is back below the 41,000 handle for the first time in 6 months.
Dow Jones daily chart

Dow Jones FAQs
The Dow Jones Industrial Average, one of the oldest stock market indices in the world, is compiled of the 30 most traded stocks in the US. The index is price-weighted rather than weighted by capitalization. It is calculated by summing the prices of the constituent stocks and dividing them by a factor, currently 0.152. The index was founded by Charles Dow, who also founded the Wall Street Journal. In later years it has been criticized for not being broadly representative enough because it only tracks 30 conglomerates, unlike broader indices such as the S&P 500.
Many different factors drive the Dow Jones Industrial Average (DJIA). The aggregate performance of the component companies revealed in quarterly company earnings reports is the main one. US and global macroeconomic data also contributes as it impacts on investor sentiment. The level of interest rates, set by the Federal Reserve (Fed), also influences the DJIA as it affects the cost of credit, on which many corporations are heavily reliant. Therefore, inflation can be a major driver as well as other metrics which impact the Fed decisions.
Dow Theory is a method for identifying the primary trend of the stock market developed by Charles Dow. A key step is to compare the direction of the Dow Jones Industrial Average (DJIA) and the Dow Jones Transportation Average (DJTA) and only follow trends where both are moving in the same direction. Volume is a confirmatory criteria. The theory uses elements of peak and trough analysis. Dow’s theory posits three trend phases: accumulation, when smart money starts buying or selling; public participation, when the wider public joins in; and distribution, when the smart money exits.
There are a number of ways to trade the DJIA. One is to use ETFs which allow investors to trade the DJIA as a single security, rather than having to buy shares in all 30 constituent companies. A leading example is the SPDR Dow Jones Industrial Average ETF (DIA). DJIA futures contracts enable traders to speculate on the future value of the index and Options provide the right, but not the obligation, to buy or sell the index at a predetermined price in the future. Mutual funds enable investors to buy a share of a diversified portfolio of DJIA stocks thus providing exposure to the overall index.
-
17:03
United States 30-Year Bond Auction down to 4.623% from previous 4.748%
-
15:43
EUR/USD Price Analysis: Buyers take a breather as consolidation phase begins
- EUR/USD was seen trading around the 1.0850 area after the European session, correcting lower after a strong rally.
- Overbought conditions led to a pullback, with the pair possibly consolidating between 1.0800-1.0850 before resuming its uptrend.
EUR/USD retreated after reaching fresh highs, trading near the 1.0850 zone on Thursday after the European session. Following a strong bullish run, buyers appear to be taking a pause, allowing the pair to cool off and digest recent gains. This pullback comes as traders assess whether the next leg higher is imminent or if further consolidation is needed.
From a technical standpoint, the Relative Strength Index (RSI) has pulled back sharply but remains near overbought levels, suggesting that the recent correction is part of a broader consolidation rather than a trend reversal. Meanwhile, the Moving Average Convergence Divergence (MACD) histogram is printing flat green bars, signaling that bullish momentum has stalled but is not yet reversing.
The key support zone stands between 1.0800 and 1.0850, where buyers could step back in to defend the uptrend. On the upside, resistance is located around 1.0900, with a break above potentially reigniting bullish momentum. If the pair holds within the current range, consolidation may continue before another attempt at higher levels.
EUR/USD daily chart

-
15:42
US Treasury Secretary Bessent: Maybe inflation is getting under control.
US Treasury Secretary Scott Bessent his the wires on Thursday, touching on a variety of subjects during an interview on CNBC's "Squawk on the Street" segment, shrugging off a multi-week decline in US equity indexes as "recent volatility".
Key highlights
We are focused on the real economy.
The aim is long-term gains for markets and the American people.
I am not concerned about a little volitity over three weeks.
We are focused over the medium and long-term.
A US government shutdown would be disruptive.
Regarding Trump's threatened 200% tariff on EU alcohol: I am not sure why one or two items from one or two trading blocks is a big deal.
Aside from metals and likely autos, everything else is up for grabs for tariff negotiations.
If trading partners want to ratchet things up, surplus countries will take the biggest hit.
Companies are generally supportive of transition away from government spending.
I am confident Trump tax bill is on track.
Detox is not a euphemism for recession.
We are trying to get tax bill done and controlling expenses.
Regarding the US dollar weakening: A lot was priced in, it is natural to see an adjustment.
We are hoping to get to a tax bill in the coming weeks.
We've had a big unwind in the markets.
I blame democrats for the potential shutdown.
We want to protect strategic industries and jobs.
-
15:32
US President Trump shifts tariff focus on EU, vows steep import fees on EU wine
After flubbing his planned doubling of tariffs on Canada, which saw Canada poised to lash back with stiff increases in the cost of energy exported from the province of Ontario to the US, US President Donald Trump is shifting his tariff focus to the European Union, but maintaining the same playbook.
Donald Trump's brief standoff against Canada saw the US's neighbor to the north make zero concessions. Canada is now on pace to impose a strategic package of tariffs against key US goods in retaliation for the US's steel and import tariffs that went into effect this week, and trade terms under the USMCA trade agreement remain unchanged. Now, President Trump is looking to strong-arm the European Union, which imposed its own retaliatory tariffs on US whisky products in response to the US administration's steel tariffs.
Donald Trump threatened via social media post early Thursday that he would seek to impose his 200% tariff on European wines and champagne. Donald Trump then resumed posting on his Truth Social account, again declaring that eggs, Crude Oil, and interest rates were all "down", while also trying to rebrand the US's "Free Trade" as "Stupid Trade" (sic).
Key quotes
US to shortly place 200% tariff on EU wine.
If the EU tariff is not removed immediately, the US will retaliate.
Egg prices are down, oil down, interest rates are down.
The US doesn't have Free Trade. We have "Stupid Trade." The Entire World is ripping us off.
Canada needs America, America does not need Canada.
-
15:32
United States 4-Week Bill Auction down to 4.225% from previous 4.23%
-
15:31
GBP/USD holds steady near 1.2950 as traders brace for UK GDP data
- GBP/USD remains near 1.2950, cautiously, after US PPI data came slightly below expectations at 3.2% YoY.
- US jobless claims fell to 220K, highlighting labor market resilience despite mixed inflation outlook from recent tariffs.
- Traders anticipate UK GDP report Friday; expected slowdown to 0.1% MoM.
The Pound Sterling stayed firm at nearly 1.2950 against the Greenback on Thursday following the release of economic data from the United States (US). Inflation and jobs figures came in mixed but signaled that the economy remains solid. The GBP/USD trades at 1.2948, down 0.07%.
Mixed US economic signals keep Sterling rangebound; upcoming UK growth report eyed as next catalyst
Data from the US showed that prices paid by producers were mainly aligned with estimates. The US Bureau of Labor Statistics (BLS) revealed that the Producer Price Index (PPI) in February came softer than the 3.3% expected at 3.2% YoY, down from the prior month’s 3.7%. Excluding volatile items, the so-called Core PPI increased by 3.4% YoY, beneath estimates of 3.5% and down from 3.6%.
Even though the latest US inflation reports were cooler than foreseen, tariffs imposed on imports to the US can spark a reacceleration of inflation, with economists estimating that prices will begin to rise in the months ahead.
Other data showed that Initial Jobless Claims for the week ending March 8 dipped from 222K to 220K, below forecasts of 225K.
Across the pond, traders are eyeing the release of Gross Domestic Product (GDP) figures on Friday. The 3-month rollover is estimated at 0.3%, up from 0.1% in the previous report. GDP in January is expected to dip from 0.4% to 0.1% MoM.
In the US, investors would digest the University of Michigan (UoM) Consumer Sentiment report for March.
GBP/USD Price Forecast: Technical outlook
The GBP/USD continues to trade sideways, unable to clear below/above the 1.2900 – 1.2950 range for the last two days. The Relative Strength Index (RSI) is near overbought territory yet almost flat. Therefore, traders are awaiting a fresh catalyst to drive the pair outside of the previously mentioned range.
A bullish continuation would happen once GBP/USD clears 1.2950, opening the door to challenge 1.3000. On the other hand, a drop beneath 1.2900 would clear the path to test the current week’s low of 1.2860, ahead of the 200-day Simple Moving Average (SMA) at 1.2791.

British Pound PRICE Today
The table below shows the percentage change of British Pound (GBP) against listed major currencies today. British Pound was the strongest against the Australian Dollar.
USD EUR GBP JPY CAD AUD NZD CHF USD 0.28% 0.16% -0.28% 0.20% 0.48% 0.37% 0.28% EUR -0.28% -0.12% -0.58% -0.10% 0.20% 0.11% -0.00% GBP -0.16% 0.12% -0.46% 0.03% 0.32% 0.23% 0.15% JPY 0.28% 0.58% 0.46% 0.46% 0.76% 0.66% 0.61% CAD -0.20% 0.10% -0.03% -0.46% 0.30% 0.19% 0.11% AUD -0.48% -0.20% -0.32% -0.76% -0.30% -0.08% -0.20% NZD -0.37% -0.11% -0.23% -0.66% -0.19% 0.08% -0.05% CHF -0.28% 0.00% -0.15% -0.61% -0.11% 0.20% 0.05% The heat map shows percentage changes of major currencies against each other. The base currency is picked from the left column, while the quote currency is picked from the top row. For example, if you pick the British Pound from the left column and move along the horizontal line to the US Dollar, the percentage change displayed in the box will represent GBP (base)/USD (quote).
-
14:46
Breaking: Gold reaches record high at $2,966 post US data
Gold price rallies sharply on Thursday and clears the previous record high of $2,954 despite high US Treasury bond yields and a strong US Dollar. At the time of writing, the XAU/USD clears the $2,960 mark, and reached an all time-high of $2960 a troy ounce.
Developing story...
Gold FAQs
Gold has played a key role in human’s history as it has been widely used as a store of value and medium of exchange. Currently, apart from its shine and usage for jewelry, the precious metal is widely seen as a safe-haven asset, meaning that it is considered a good investment during turbulent times. Gold is also widely seen as a hedge against inflation and against depreciating currencies as it doesn’t rely on any specific issuer or government.
Central banks are the biggest Gold holders. In their aim to support their currencies in turbulent times, central banks tend to diversify their reserves and buy Gold to improve the perceived strength of the economy and the currency. High Gold reserves can be a source of trust for a country’s solvency. Central banks added 1,136 tonnes of Gold worth around $70 billion to their reserves in 2022, according to data from the World Gold Council. This is the highest yearly purchase since records began. Central banks from emerging economies such as China, India and Turkey are quickly increasing their Gold reserves.
Gold has an inverse correlation with the US Dollar and US Treasuries, which are both major reserve and safe-haven assets. When the Dollar depreciates, Gold tends to rise, enabling investors and central banks to diversify their assets in turbulent times. Gold is also inversely correlated with risk assets. A rally in the stock market tends to weaken Gold price, while sell-offs in riskier markets tend to favor the precious metal.
The price can move due to a wide range of factors. Geopolitical instability or fears of a deep recession can quickly make Gold price escalate due to its safe-haven status. As a yield-less asset, Gold tends to rise with lower interest rates, while higher cost of money usually weighs down on the yellow metal. Still, most moves depend on how the US Dollar (USD) behaves as the asset is priced in dollars (XAU/USD). A strong Dollar tends to keep the price of Gold controlled, whereas a weaker Dollar is likely to push Gold prices up.
-
14:30
United States EIA Natural Gas Storage Change came in at -62B below forecasts (-50B) in March 7
-
14:21
AUD/USD slumps to near 0.6280 on US Dollar’s strong recovery
- AUD/USD tumbles to near 0.6280 as the US Dollar outperforms on Trump’s tariff agenda.
- Trump’s America First policy has prompted global economic risks.
- Soft US CPI and PPI data for February failed to weigh on the US Dollar.
The AUD/USD pair falls sharply to near 0.6280 in North American trading hours on Thursday. The Aussie pair faces a sharp selling pressure as the US Dollar (USD) outperforms amid cautious market mood. Financial market participants have turned to safe-haven bets amid fears that United States (US) President Donald Trump’s “America First” policies will result in a global economic slowdown.
The US Dollar Index (DXY), which tracks the Greenback’s value against six major currencies, jumps to near 104.00, after bouncing back from the four-month low of 103.20 posted on Tuesday.
US President Trump reiterates tariff threats from his post on Truth.Social, “The US doesn't have Free Trade. We have "Stupid Trade." The Entire World is ripping us off.”
On Wednesday, Trump also confirmed retaliatory tariffs on Eurozone on their counter-tariffs on 26 billion Euros (EUR) worth of goods against 25% universal import duty by the US on steel and aluminum.
Meanwhile, investors ignore soft US Consumer Price Index (CPI) and Producer Price Index (PPI) data for February amid the storm of Trump’s tariff agenda. The US headline and core PPI rose at a slower-than-expected pace of 3.2% and 3.4%, respectively, in 12 months to February. Month-on-month headline PPI remained flat while the core figure deflated by 0.1%. Soft US inflation data boosts Federal Reserve (Fed) dovish bets.
On the Aussie front, dismal market sentiment has dampened the Australian Dollar’s (AUD) appeal. The outlook of the Aussie Dollar is also uncertain as the US has imposed 20% tariffs on China. The AUD acts as a mirror of Chinese economic growth, given Australia’s strong reliance on exports to China.
US-China Trade War FAQs
Generally speaking, a trade war is an economic conflict between two or more countries due to extreme protectionism on one end. It implies the creation of trade barriers, such as tariffs, which result in counter-barriers, escalating import costs, and hence the cost of living.
An economic conflict between the United States (US) and China began early in 2018, when President Donald Trump set trade barriers on China, claiming unfair commercial practices and intellectual property theft from the Asian giant. China took retaliatory action, imposing tariffs on multiple US goods, such as automobiles and soybeans. Tensions escalated until the two countries signed the US-China Phase One trade deal in January 2020. The agreement required structural reforms and other changes to China’s economic and trade regime and pretended to restore stability and trust between the two nations. However, the Coronavirus pandemic took the focus out of the conflict. Yet, it is worth mentioning that President Joe Biden, who took office after Trump, kept tariffs in place and even added some additional levies.
The return of Donald Trump to the White House as the 47th US President has sparked a fresh wave of tensions between the two countries. During the 2024 election campaign, Trump pledged to impose 60% tariffs on China once he returned to office, which he did on January 20, 2025. With Trump back, the US-China trade war is meant to resume where it was left, with tit-for-tat policies affecting the global economic landscape amid disruptions in global supply chains, resulting in a reduction in spending, particularly investment, and directly feeding into the Consumer Price Index inflation.
-
13:42
GBP tracks broader USD tone – Scotiabank
The Pound Sterling (GBP) continues to track the broader trend in the USD, absent any major fundamental developments at home, Scotiabank's Chief FX Strategist Shaun Osborne notes.
GBP regains some ground versus EUR
"The RICS House Price Index dropped to a lower than expected 11 in February (vs. 20 forecast); the RICS puts the blame on rising uncertainty and weaker confidence, with recent tax increases and slow progress on cutting rates weighing on sentiment."
"The BoE’s cautious easing approach is supportive for the GBP, however, and may help the GBP regain a little ground on the EUR, with the cross showing signs of steadying around the 0.8450 area after sharp, early March gains."
"A mild loss for the GBP leaves spot trading well within yesterday’s range which stretched GBP gains to just under 1.30— the highest since early November. Trends remain GBP-supportive on the short– and medium-term charts and the GBP should find support on minor dips ahead of 1.2910 support. Resistance is 1.30 ahead of a push on to 1.3125/50."
-
13:39
EUR drifts as spreads widen slightly – Scotiabank
The Euro (EUR) is little changed on the day and continues to consolidate recent gains, Scotiabank's Chief FX Strategist Shaun Osborne notes.
Bullish trend remains intact
"Short-term spreads have corrected a little, helping trim the EUR rally but differentials remain broadly supportive. January Eurozone Industrial Production was flat in the January month, versus expectations of a 0.8% m/m drop. December output was revised up to (a still weak) 1.5% decline."
"EURUSD continues to consolidate. Spot losses are extending for a second day and testing support in the upper 1.08s but the broader, technical undertone remains constructive and dips to the low/mid 1.08 area should remain supported. Key short-term support is 1.0805. Resistance is 1.0950 and 1.10."
-
13:37
CAD resilient despite tariff threats and BoC cut – Scotiabank
The Canadian Dollar (CAD) navigated metals tariffs and the BoC rate cut with relative ease yesterday, Scotiabank's Chief FX Strategist Shaun Osborne notes.
USD looks highly overvalued
"The Bank would not—could not—provide much clarity around the outlook for policy, given the uncertainties for growth and inflation that this trade war will generate. Macklem stressed that the Bank did not want to see first round price increases (from tariffs) having a knock-on effect on other prices. Markets pared a few bps from easing expectations over the balance of the year but were still discounting roughly 45bps of additional cuts through December at the close last night."
"Overall, the CAD looks relatively resilient. The recent narrowing in US/Canada term spreads is providing some anchoring for the CAD despite headwinds from tariffs. In fact, USDCAD is trading two standard deviations above our FV estimate (1.4095), with the USD the most overvalued since 2022 this week. Stretched valuation tilts risks towards a push under the mid-1.43 area at least in the short run."
"Spot trends are tilting a little more bearish for the USD after early week gains were capped in the low 1.45 zone. USD losses yesterday add to the USD-negative look of short-term price action and the picture of strong resistance developing in the low/mid 1.45 area now. USD support sits at 1.4350 still and while the USD looks technically prone to more losses, it continues to enjoy solid, bull momentum on the intraday and daily oscillator studies. That may mean that CAD gains through the 1.4350 zone may be grinding and perhaps limited to the mid/upper 1.42s."
-
13:33
USD regains some ground – Scotiabank
The USD is tracking a little higher so far today but markets appear to be idling as investors await data and developments. Dollar gains are marginal in broad terms but more significant gains have been notched up against the high beta/commodity currencies—AUD, NZD, SEK, NOK—following mixed equity market returns in Asia and flat to mildly weaker trends in US equity futures, Scotiabank's Chief FX Strategist Shaun Osborne notes.
Underlying trends remain bearish
"Investors remain concerned that US reciprocal tariff action due in April may further disrupt risk appetite. Yesterday’s US CPI data brought some mixed news on prices. Headline and core rates of inflation came in lower than forecast. But some of the dampening effects on inflation (lower airfares) may not be reflected in the PCE data and airfare weakness may be a further sign of softer consumer demand."
"While the DXY has picked up a little ground, gains are limited and the market may only be developing a mild technical correction within the confines of what appears to be a still-developing downtrend. Trend momentum signals are aligning bearishly for the index across the short-, medium– and long-term studies which is typically a sign that countertrend rallies or rebounds will be limited in terms of scale and duration."
"Typically, therefore, these sorts of rebounds would be an opportunity to reload or add to short positioning. DXY resistance sits at 103.70, near current levels, and 104.00/05. Recent CFTC data has reflected a reduction in net USD long positioning but investors remain generally long USDs. Other data suggests that active traders have not reduced USD exposure all that much, however."
-
13:00
Russia Central Bank Reserves $ up to $639.1B from previous $632.4B
-
12:48
Silver Price Forecast: XAG/USD sees upside above $33.40 on soft US PPI and CPI, Trump tariff fears
- Silver price aims to break above the key resistance of $33.40 due to multiple tailwinds.
- The US CPI and PPI cooled down at a faster-than-expected pace in February.
- The tariff policy of US President Trump has strengthened safe-haven bets.
Silver price (XAG/USD) trades close to near the monthly high of $33.40 in North American trading hours on Thursday. The white metal strengthens as cooling United States (US) consumer and producer inflationary pressures pave the way for the Federal Reserve (Fed) to cut interest rates in the June policy meeting.
The US Producer Price Index (PPI) report showed that the headline and core producer inflation decelerated at a faster-than-expected pace to 3.2% and 3.4%, respectively, in 12 months to February. Month-on-month headline PPI remained flat while the core figure deflated by 0.1%.
On Wednesday, the US headline and core Consumer Price Index (CPI) rose by 2.8% and 3.1%, respectively, in February slower than their estimates and their prior releases.
Last week, Fed Chair Jerome Powell stated that the restrictive monetary policy stance won’t long last “if the labor market unexpectedly weakens or inflation falls more than expected”. The scenario of lower interest rates by the Fed bodes well for non-yielding assets, such as Silver.
On the global front, escalating economic risks due to US President Donald Trump’s tariff agenda have also improved the safe-haven demand of the Silver price. On Wednesday, Trump confirmed that he will respond to counter-tariffs from the European Union (EU). Such a scenario would result in the EU-US trade war, which will diminish the risk appetite of investors significantly.
The cautious market sentiment has also increased the safe-haven demand of the US Dollar (USD) but US economic risks and soft CPI report have capped its upside. The US Dollar Index (DXY), which tracks the Greenback’s value against six major currencies, rises to near 103.80 from its four-month low of 103.20, which it posted on Tuesday.
Silver technical analysis
Silver price trades near the horizontal border of the Ascending Triangle chart pattern on a daily timeframe, which is placed from the February 14 high of $33.40. The upward-sloping border is placed from the December 31 low of $28.78. The above-mentioned chart pattern indicates indecisiveness among market participants.
The 20-day Exponential Moving Average (EMA) near $32.30, continues to support the Silver price.
The 14-day Relative Strength Index (RSI) climbs above 60.00. A bullish momentum would trigger if the RSI sustains above that level.
Looking down, the psychological level of $30.00 will act as key support for the Silver price. While, the October 22 high of $34.87 will be the major barrier.
Silver daily chart
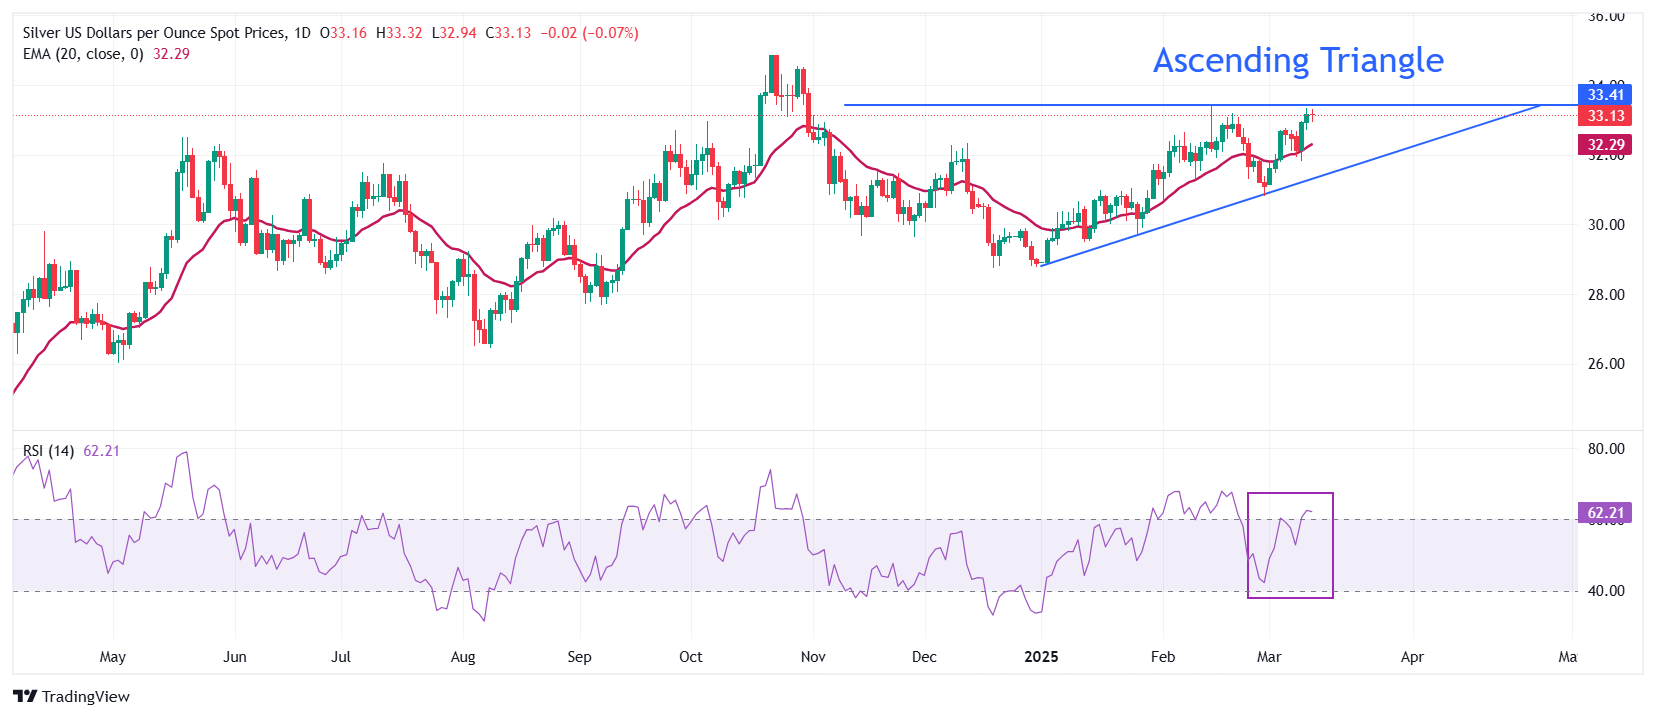
Silver FAQs
Silver is a precious metal highly traded among investors. It has been historically used as a store of value and a medium of exchange. Although less popular than Gold, traders may turn to Silver to diversify their investment portfolio, for its intrinsic value or as a potential hedge during high-inflation periods. Investors can buy physical Silver, in coins or in bars, or trade it through vehicles such as Exchange Traded Funds, which track its price on international markets.
Silver prices can move due to a wide range of factors. Geopolitical instability or fears of a deep recession can make Silver price escalate due to its safe-haven status, although to a lesser extent than Gold's. As a yieldless asset, Silver tends to rise with lower interest rates. Its moves also depend on how the US Dollar (USD) behaves as the asset is priced in dollars (XAG/USD). A strong Dollar tends to keep the price of Silver at bay, whereas a weaker Dollar is likely to propel prices up. Other factors such as investment demand, mining supply – Silver is much more abundant than Gold – and recycling rates can also affect prices.
Silver is widely used in industry, particularly in sectors such as electronics or solar energy, as it has one of the highest electric conductivity of all metals – more than Copper and Gold. A surge in demand can increase prices, while a decline tends to lower them. Dynamics in the US, Chinese and Indian economies can also contribute to price swings: for the US and particularly China, their big industrial sectors use Silver in various processes; in India, consumers’ demand for the precious metal for jewellery also plays a key role in setting prices.
Silver prices tend to follow Gold's moves. When Gold prices rise, Silver typically follows suit, as their status as safe-haven assets is similar. The Gold/Silver ratio, which shows the number of ounces of Silver needed to equal the value of one ounce of Gold, may help to determine the relative valuation between both metals. Some investors may consider a high ratio as an indicator that Silver is undervalued, or Gold is overvalued. On the contrary, a low ratio might suggest that Gold is undervalued relative to Silver.
-
12:35
US annual PPI inflation declines to 3.2% in February vs. 3.3% expected
- Producer inflation in the US softened in February.
- US Dollar Index stays in positive territory above 103.50.
The Producer Price Index (PPI) for final demand in the US rose 3.2% on a yearly basis in February, the data published by the US Bureau of Labor Statistics showed on Thursday. This reading followed the 3.7% increase recorded in January and came in below the market expectation of 3.3%.
The annual core PPI rose 3.4% in the same period, down from 3.8% in January. On a monthly basis, the PPI was unchanged, while the core PPI declined by 0.1%.
Market reaction
The US Dollar Index showed no immediate reaction to these data and was last seen rising 0.25% on the day at 103.80.
-
12:34
US: Initial Jobless Claims fell to 220K last week
- Initial Jobless Claims fell below consensus to 220K.
- Continuing Jobless Claims dropped to 1.870M.
US citizens filing new applications for unemployment insurance decreased to 220K for the week ending March 8, as reported by the US Department of Labor (DOL) on Thursday. This print missed initial estimates and was lower than the previous week's revised tally of 222K (revised from 221K).
The report also highlighted a seasonally adjusted insured unemployment rate of 1.2%, while the four-week moving average rose by 1.5K to 226K from the prior week’s revised average.
Moreover, Continuing Jobless Claims went down by 27K to reach 1.870M for the week ending March 1.
Market reaction
The Greenback manages to extend Wednesday’s bounce and prompts the US Dollar Index (DXY) to approach the key 104.00 barrier accompanied by further upside impulse in US yields across the board.
-
12:30
United States Continuing Jobless Claims came in at 1.87M below forecasts (1.9M) in February 28
-
12:30
United States Producer Price Index (MoM) below expectations (0.3%) in February: Actual (0%)
-
12:30
United States Producer Price Index ex Food & Energy (YoY) below expectations (3.5%) in February: Actual (3.4%)
-
12:30
Canada Building Permits (MoM) came in at -3.2%, above expectations (-4.8%) in January
-
12:30
United States Producer Price Index ex Food & Energy (MoM) below forecasts (0.3%) in February: Actual (-0.1%)
-
12:30
United States Initial Jobless Claims below expectations (225K) in March 7: Actual (220K)
-
12:30
United States Producer Price Index (YoY) came in at 3.2% below forecasts (3.3%) in February
-
12:30
United States Initial Jobless Claims 4-week average rose from previous 224.25K to 226K in March 7
-
12:02
US Dollar in choppy mode ahead of PPI and Jobless Claims data
- The US Dollar trades broadly flat as investors assess where to take the Greenback next.
- Traders brace for the US PPI and weekly Jobless Claims data releases.
- The US Dollar Index holds above the 103.50 area after bouncing off a pivotal level.
The US Dollar Index (DXY), which tracks the performance of the US Dollar (USD) against six major currencies, trades broadly flat on Thursday, above 103.70 at the time of writing. Markets await comments from US diplomats visiting Russia to convene over a ceasefire deal, which already bears the green light from Ukraine. Russia has issued its demands and changes to the proposal before US negotiators arrive in the country.
On the economic front, a bulk load of data is set to be released today at 12:30 GMT. Besides the weekly US Initial Jobless Claims, the US Producer Price Index (PPI) data for February is set to be released as well. Markets anticipate another soft print in the producer’s inflation reading after the softer-than-expected US Consumer Price Index (CPI) released on Wednesday.
Daily digest market movers: Wednesday’s moves explained
- Markets are seeing US yields surge to a five-day high at 4.33% after hitting 4.15% earlier this week. The move is fueled by an outflow of position from US bonds and into US equities. Yields are inversely correlated with US bond prices, so if US bond prices drop, US yields surge, supporting a stronger US Dollar.
- At 12:30 GMT, weekly US Jobless Claims and US Producer Price Index (PPI) for February are due:
- Initial Jobless Claims for the week ending March 7 are expected to surge to 225,000, coming from 221,000. The Continuing Jobless Claims are set to surge as well to 1.900 million, up from the previous 1.897 million.
- The monthly headline Producer Price Index for February should increase by 0.3% from 0.4%. The monthly core PPI should grow steadily at 0.3%.
- The yearly headline PPI should fall towards 3.3%, from 3.5%. The yearly core PPI reading, excluding food and energy, is expected to soften a touch by 3.5% from 3.6%.
- Equities are seeing another upbeat day in Europe with the main indices up over 0.5% on the day. US futures are starting to turn positive towards the US opening bell.
- The CME Fedwatch Tool projects a 97.0% chance for no interest rate changes in the upcoming Fed meeting on March 19. The chances of a rate cut at the May 7 meeting stand at 28.1% and 76.9% at June’s meeting.
- The US 10-year yield trades around 4.33%, off its near five-month low of 4.10% printed on March 4 and at a five-day high.
US Dollar Index Technical Analysis: Does it make sense?
The US Dollar Index (DXY) is getting some support from rising US yields after a softer US CPI report for February was released on Wednesday, opening the door for the Federal Reserve (Fed) to cut interest rates further in 2025. It all does sound contradictory, but those are the mechanics of how markets work, bringing tension with the Fed possibly cutting rates later this year while US yields are heading higher. Once the impact of US President Donald Trump’s tariffs on US inflation is clear, the direction for the US Dollar Index will become clear as well.
Upside risk is a rejection at 104.00 that could result in more downturn. If bulls can avoid that, look for a large sprint higher towards the 105.00 round level, with the 200-day Simple Moving Average (SMA) at 105.02. Once broken through that zone, a string of pivotal levels, such as 105.53 and 105.89, will present as caps.
On the downside, the 103.00 round level could be considered a bearish target in case US yields roll off again, with even 101.90 not unthinkable if markets further capitulate on their long-term US Dollar holdings.
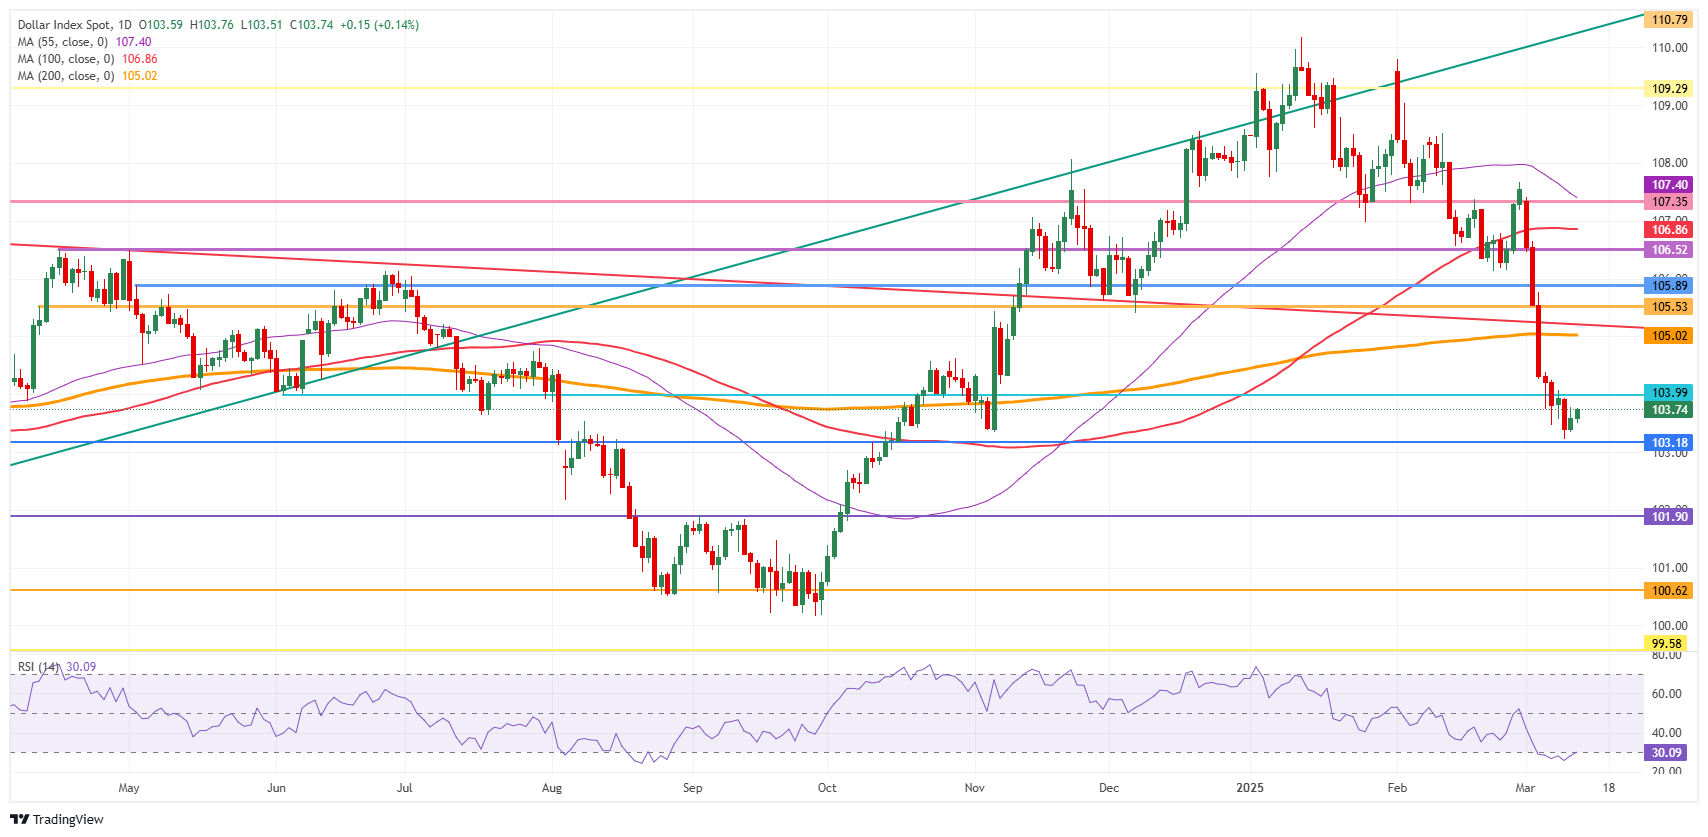
US Dollar Index: Daily Chart
US-China Trade War FAQs
Generally speaking, a trade war is an economic conflict between two or more countries due to extreme protectionism on one end. It implies the creation of trade barriers, such as tariffs, which result in counter-barriers, escalating import costs, and hence the cost of living.
An economic conflict between the United States (US) and China began early in 2018, when President Donald Trump set trade barriers on China, claiming unfair commercial practices and intellectual property theft from the Asian giant. China took retaliatory action, imposing tariffs on multiple US goods, such as automobiles and soybeans. Tensions escalated until the two countries signed the US-China Phase One trade deal in January 2020. The agreement required structural reforms and other changes to China’s economic and trade regime and pretended to restore stability and trust between the two nations. However, the Coronavirus pandemic took the focus out of the conflict. Yet, it is worth mentioning that President Joe Biden, who took office after Trump, kept tariffs in place and even added some additional levies.
The return of Donald Trump to the White House as the 47th US President has sparked a fresh wave of tensions between the two countries. During the 2024 election campaign, Trump pledged to impose 60% tariffs on China once he returned to office, which he did on January 20, 2025. With Trump back, the US-China trade war is meant to resume where it was left, with tit-for-tat policies affecting the global economic landscape amid disruptions in global supply chains, resulting in a reduction in spending, particularly investment, and directly feeding into the Consumer Price Index inflation.
-
12:00
Mexico Industrial Output (YoY) came in at -2.9% below forecasts (-1.8%) in January
-
11:17
Trump 2.0 and ASEAN: Potential tariff exposure – Standard Chartered
Unlike Trump 1.0, ASEAN now faces increasing risk of direct effects of tariffs under Trump 2.0. ASEAN can be exposed to product-specific tariffs, and the impact may be mitigated by universal nature, Standard Chartered's economists Edward Lee and Jonathan Koh report.
Tariff exposure can be a relative comparison
"Tariffs have been a central theme of President Trump’s election campaign. Since his inauguration, threats have been made but implementation has been delayed, raising expectations for negotiated solutions. Markets remain watchful amid uncertainty over execution and timing. We analysed the impact on GDP growth from the threats of universal tariffs on specific products – pharmaceuticals, lumber, iron and steel, copper, aluminium, semiconductors and automobiles. We found that Singapore, Malaysia and Vietnam will likely be the most negatively impacted should these tariffs go into effect. Tariffs on steel and aluminium have already been implemented, with Vietnam and the Philippines negatively affected; however, the hit to growth is likely to be marginal."
"Compared to Trump 1.0, where US-led tariffs were primarily focused on China, Trump 2.0 tariffs are broader. Under Trump 2.0, ASEAN will still face the indirect effects of US-led tariffs, with another 20% tariff already imposed on China. While there may be benefits from reallocation of production and exports for ASEAN, the region also faces more direct product-specific and reciprocal (details are scant here) tariffs this time around. While the direct effects will be negative, the universal nature of product-specific tariffs may lower the demand elasticity of US imports with respect to tariffs. In addition, we think the region is likely to be of secondary importance on tariff application compared to bigger economies such as China."
-
11:09
USD/CAD to trend down towards the 1.41 level in the short-term – Danske Bank
As widely expected, BoC delivered a 25bp rate cut, bringing its policy rate to 2.75%, Danske Bank's FX analysts Kristoffer Kjær Lomholt and Filip Andersson report.
Potential easing of US tariffs can act as a CAD-positive
"The meeting was rather uneventful, with the BoC naturally focusing strongly on the uncertainty and impact related to a trade war with the US, resulting in a limited market reaction. The BoC also released survey data, indicating that threats of new tariffs and uncertainty about the trade war are already taking their toll on consumer and business confidence."
"Governor Macklem cautioned that 'monetary policy cannot offset the impacts of a trade war', warning that the severity of new US tariffs on Canada will hinge on their magnitude and duration."
"We continue to expect USD/CAD to trend down towards the 1.41 level in the short-term amid a backdrop of current short-stretched CAD positioning and further USD weakening, while a potential easing of US tariffs imposed on Canada would act as a CAD-positive."
-
11:06
RBNZ: Turning the page or rewriting the script? – Standard Chartered
Adrian Orr’s resignation has no effect on near-term policy but raises longer-term uncertainty. Further regulatory easing is on the table, with restrictive capital rules under potential government review. Regulatory policy shifts could impact rate differentials and capital flows via banking capital requirements. The New Zealand rates curve may steepen as policy shifts emerge, Standard Chartered's economists Bader Al Sarraf and Nicholas Chia report.
Change of guard
"Adrian Orr’s resignation as governor of the Reserve Bank of New Zealand (RBNZ) three years before the end of his second term comes at a time when monetary policy, financial regulation and macroeconomic conditions remain key concerns. Deputy Governor Christian Hawkesby will be acting governor until 31 March, after which a temporary replacement will serve for up to six months."
"Since 1988, all RBNZ governors have been appointed externally, suggesting that an outsider may again be favoured. However, the names being flagged in local media include both internal and external candidates."
"Orr’s successor could influence New Zealand’s monetary policy trajectory, despite the RBNZ’s tradition of consensus-driven decision-making. A more hawkish governor could advocate for a slower pace of rate cuts, prioritising financial stability, while a dovish appointment could push for more aggressive easing to support growth. In our view, the next governor is likely to be a pragmatist, balancing policy flexibility with financial stability rather than steering the central bank in a sharply different direction."
-
11:03
EUR/USD: A leg higher may occur if Russia agrees to the truce terms – Danske Bank
EUR/USD remains around the 1.09 mark. Yesterday's US February CPI print came in softer than expected, with both headline and core at 0.2% m/m, below consensus, Danske Bank's FX analysts Kristoffer Kjær Lomholt and Filip Andersson report.
Risks are still tilted to the upside
"Notably, broader core services inflation cooled after January's uptick - a welcome sign for the Fed. While core goods and health care inflation ran slightly hot, overall inflation momentum looks encouraging. The much-awaited speech by President Lagarde's speech at the ECB Watchers conference did not provide any signals on what to expect at the April meeting."
"Today, the focus shifts to US February PPI and weekly jobless claims. We see EUR/USD consolidating around current levels in the near term, with risks still tilted to the upside. However, we increasingly believe that US pessimism appears overstretched."
"Markets had largely priced in a Ukraine-Russia peace deal, and while a small additional leg higher in EUR/USD may occur if and when Russia agrees to the truce terms. With US tariffs being rolled out, the key risk is that if upcoming data fails to validate market pessimism on the US economy, the USD could rebound quickly."
-
11:01
Ireland HICP (MoM) above forecasts (0.7%) in February: Actual (0.8%)
-
11:01
Ireland HICP (YoY) above forecasts (1.3%) in February: Actual (1.4%)
-
11:01
Ireland Consumer Price Index (MoM) climbed from previous -0.7% to 0.9% in February
-
11:01
Ireland Consumer Price Index (YoY): 1.8% (February) vs previous 1.9%
-
11:00
South Africa Manufacturing Production Index (YoY) fell from previous -1.2% to -3.3% in January
-
10:59
EUR/SEK: Recent pivot high of 11.20 is likely to be a resistance – Société Générale
EUR/SEK broke below the lower limit of a multi-month triangle resulting in a steep decline, Société Générale's FX analysts note.
Daily MACD is now within deep negative territory
"A descending trend line drawn parallel to the upper band of the formation at 10.84/10.78, which is also a projection for the decline could be a potential support zone. Daily MACD is now within deep negative territory highlighting a stretched down move. Defence of 10.84/10.78 could result in a short-term rebound. Recent pivot high of 11.20 is likely to be a resistance."
-
10:51
USD/CAD: BOC cuts the policy 25bps to 2.75% – BBH
The Bank of Canada (BOC) delivered on expectations yesterday and cut the policy 25bps to 2.75%. The BOC warned that the pervasive uncertainty created by continuously changing US tariff threats is restraining consumers’ spending intentions and businesses’ plans to hire and invest, BBH FX analysts report.
BOC to bring down the policy rate below neutral settings
"As such, unless the trade dispute is fully resolved, the BOC will likely bring down the policy rate below neutral settings which is a drag on CAD. The BOC’s neutral range estimate is between 2.25% to 3.25%. The April Monetary Policy Report will include an update to that estimate. Markets imply an additional 75bps of easing over the next 12 months and the policy rate to bottom at 2.00%."
"BOC Governor Tiff Macklem confirmed there was no consideration for a 50bps rate cut. Instead, Macklem’s opening statement stressed 'Governing Council will proceed carefully with any further changes to our policy rate given the need to assess both the upward pressures on inflation from higher costs and the downward pressures from weaker demand'."
-
10:45
USD/CAD trades cautiously near 1.4360 despite US Dollar gets temporary relief
- USD/CAD struggles to gain ground even though the US Dollar steadies on US President Trump's tariff agenda.
- The BoC cut its key borrowing rates by 25 bps to 2.75% on Wednesday.
- Trump tariffs have prompted Canadian economic risks.
The USD/CAD pair trades with caution around 1.4360 in Thursday’s European session. The Loonie pair faces mild pressure even though the US Dollar has gotten temporary relief after refreshing the four-month low, indicating some strength in the Canadian Dollar (CAD).
Canadian Dollar PRICE Today
The table below shows the percentage change of Canadian Dollar (CAD) against listed major currencies today. Canadian Dollar was the strongest against the New Zealand Dollar.
USD EUR GBP JPY CAD AUD NZD CHF USD 0.15% 0.07% -0.03% 0.05% 0.48% 0.50% 0.09% EUR -0.15% -0.08% -0.15% -0.12% 0.33% 0.37% -0.07% GBP -0.07% 0.08% -0.10% -0.04% 0.41% 0.45% 0.04% JPY 0.03% 0.15% 0.10% 0.05% 0.50% 0.53% 0.14% CAD -0.05% 0.12% 0.04% -0.05% 0.46% 0.48% 0.07% AUD -0.48% -0.33% -0.41% -0.50% -0.46% 0.04% -0.35% NZD -0.50% -0.37% -0.45% -0.53% -0.48% -0.04% -0.37% CHF -0.09% 0.07% -0.04% -0.14% -0.07% 0.35% 0.37% The heat map shows percentage changes of major currencies against each other. The base currency is picked from the left column, while the quote currency is picked from the top row. For example, if you pick the Canadian Dollar from the left column and move along the horizontal line to the US Dollar, the percentage change displayed in the box will represent CAD (base)/USD (quote).
The CAD gained sharply after the Bank of Canada (BoC) reduced interest rates by 25 basis points (bps) to 2.75% on Wednesday. The BoC was already expected to ease the monetary policy further as Canadian inflation has remained well below the 2% target in the November-January period.
For fresh cues on inflation, investors will focus on the Consumer Price Index (CPI) data for February, which will be published on Tuesday.
The comments from BoC Governor Tiff Macklem indicated that central bank monetary policy has reached to the neutral level, which neither restrict nor stimulate domestic growth. “Our estimate of neutral is centred on 2.75%,” Macklem said in the press conference.
The BoC warned that heightened “trade tensions” could disrupt “job market recovery”, increase “increase inflationary pressures and curb growth” and guided a moderate growth in the January-March period as trade conflict weighs on “sentiment and activity”.
Meanwhile, the US Dollar Index (DXY), which gauges the Greenback’s value against six major currencies, strives to gain ground after posting a fresh four-month low around 103.20. The USD Index steadies as the market sentiment turns cautious after United States (US) President Donald Trump threatened to respond to counter tariffs proposed by the European Commission (EC).
In Thursday’s session, investors will focus on the US Producer Price Index (PPI) data for February, which will be published at 12:30 GMT.
Canadian Dollar FAQs
The key factors driving the Canadian Dollar (CAD) are the level of interest rates set by the Bank of Canada (BoC), the price of Oil, Canada’s largest export, the health of its economy, inflation and the Trade Balance, which is the difference between the value of Canada’s exports versus its imports. Other factors include market sentiment – whether investors are taking on more risky assets (risk-on) or seeking safe-havens (risk-off) – with risk-on being CAD-positive. As its largest trading partner, the health of the US economy is also a key factor influencing the Canadian Dollar.
The Bank of Canada (BoC) has a significant influence on the Canadian Dollar by setting the level of interest rates that banks can lend to one another. This influences the level of interest rates for everyone. The main goal of the BoC is to maintain inflation at 1-3% by adjusting interest rates up or down. Relatively higher interest rates tend to be positive for the CAD. The Bank of Canada can also use quantitative easing and tightening to influence credit conditions, with the former CAD-negative and the latter CAD-positive.
The price of Oil is a key factor impacting the value of the Canadian Dollar. Petroleum is Canada’s biggest export, so Oil price tends to have an immediate impact on the CAD value. Generally, if Oil price rises CAD also goes up, as aggregate demand for the currency increases. The opposite is the case if the price of Oil falls. Higher Oil prices also tend to result in a greater likelihood of a positive Trade Balance, which is also supportive of the CAD.
While inflation had always traditionally been thought of as a negative factor for a currency since it lowers the value of money, the opposite has actually been the case in modern times with the relaxation of cross-border capital controls. Higher inflation tends to lead central banks to put up interest rates which attracts more capital inflows from global investors seeking a lucrative place to keep their money. This increases demand for the local currency, which in Canada’s case is the Canadian Dollar.
Macroeconomic data releases gauge the health of the economy and can have an impact on the Canadian Dollar. Indicators such as GDP, Manufacturing and Services PMIs, employment, and consumer sentiment surveys can all influence the direction of the CAD. A strong economy is good for the Canadian Dollar. Not only does it attract more foreign investment but it may encourage the Bank of Canada to put up interest rates, leading to a stronger currency. If economic data is weak, however, the CAD is likely to fall.
-
10:39
USD/CNH: Expected to trade in a range between 7.2230 and 7.2520 – UOB Group
US Dollar (USD) is expected to trade in a range between 7.2230 and 7.2520. In the longer run, while there has been no significant increase in momentum, USD could potentially drop to 7.2000, UOB Group's FX analysts Quek Ser Leang and Peter Chia note.
USD could potentially drop to 7.2000
24-HOUR VIEW: "After USD dropped sharply two days ago, we highlighted the following yesterday, when USD was at 7.2330: 'The sharp drop appears to be overdone, and while USD could recover today, as long as 7.2500 is not breached, there is potential for further downside toward 7.2200 before stabilization can be expected. The major support at 7.2000 is unlikely to come into view today.' The subsequent price movements did not quite turn out as we expected. USD dropped briefly to 7.2158, rebounded to 7.2500 and then closed at 7.2390. The weakness has stabilized, and today, we expect
USD to trade in a range 7.2230 between 7.2520."
1-3 WEEKS VIEW: "After holding a negative USD view since late last week, we indicated yesterday (12 Mar, spot at 7.2330) that 'while there has been no significant increase in downward momentum, USD could potentially drop to 7.2000.' We will continue to hold the same view, provided that the ‘strong resistance’ at 7.2650 (no change in level) is not breached." -
10:32
JPY: BOJ is unlikely to tighten the policy by more than is currently priced – BBH
JPY is outperforming in line with a recovery in 10-year JGB yields above 1.50%, BBH FX analysts report.
Swaps market continues to imply less than 50bps of rate hikes
"Bank of Japan (BOJ) Governor Kazuo Ueda warned that 'the size of the BOJ's monetary base, balance sheet and current account balance is somewhat too big'. The comments are in line with the BOJ’s plan to shrink its holdings of JGBs in half to ¥3 trillion by Q1 2026."
"Ueda also signaled that the bar is high for the bank to dial-up the pace of rate hikes. Ueda reiterated he expects real wages and consumer spending to improve but also cautioned that Japan’s inflationary trend that removes temporary factors is still below the BOJ’s 2% inflation target."
"As such, the BOJ is unlikely to tighten the policy by more than is currently priced which is a headwind for JPY. The swaps market continues to imply less than 50bps of rate hikes over the next twelve months."
-
10:15
Gold edges higher as Trump challenges EU on tariffs
- Gold benefits from tailwinds and rallies on the back of tariff headlines.
- US yields tick up after a drop in inflation triggers flight to equities.
- Traders have to deal with changes in trade wars and knee-jerk reactions.
Gold’s price (XAU/USD) is back on its way to new all-time highs after the United States (US) Consumer Price Index (CPI) data came in softer than expected on Wednesday, which triggered a sigh of relief in US markets with odds for a recession or stagflation being trimmed. This in turn caused an outflow in US bonds and an inflow in US equities, with the sell-off in bonds sparking a boost in yields. The precious metal trades around $2,950 at the time of writing on Thursday.
Meanwhile, traders are still trying to oversee the amount of geopolitical headlines taking place. US President Donald Trump commented on Wednesday that the US will impose reciprocal tariffs on Europe coming into effect on April 2. On the other hand, US diplomats are on their way to Russia to negotiate a ceasefire deal that already got support from Ukraine and bears US military support for the country.
Daily digest market movers: Sigh short-lived
- US Consumer Price Index figures for February rose at the slowest pace in four months, and traders are fully pricing in another quarter-point interest-rate cut by the Federal Reserve in June’s meeting. Lower borrowing costs tend to benefit Gold, as the precious metal doesn’t pay interest, Bloomberg reports.
- Gold is set to push to a record above $3,100 in the second quarter of 2025 on rising economic uncertainty due to US President Donald Trump’s tariff policies, according to BNP Paribas SA, Reuters reports.
- A worsening US budget outlook is signaling inflation could increase, which would benefit Gold as a hedge, according to Macquarie Bank, which calls for a $3,500 level by the third quarter of 2025, Bloomberg reports.
- The CME Fedwatch Tool sees a 97.0% chance for no interest rate changes in the upcoming Fed meeting on March 19. The chances of a rate cut at the May 7 meeting currently stand at 39.5%.
Technical Analysis: Gold pushing higher
Gold is currently knocking on the door of the intraday R1 resistance level at $2,947 at the time of writing on Thursday. The move comes in a bit contradictory, seeing that US yields rallied higher on Wednesday after a softer US CPI release. The move can be explained by the fact that equities saw inflows from the outflow in US bonds, which pushed yields higher. The sigh of relief is quickly fading on Thursday, with markets focusing again on tariffs, Ukraine, and a possible recession or stagflation in the US.
Gold is heading to $2,950, roughly coinciding with the R1 resistance at $2,947. Once through there, the intraday R2 resistance at $2,961 comes into focus, meaning that the previous all-time high of $2,956 is broken.
On the downside, the daily Pivot Point stands at $2,927. In case that level breaks, look at the S1 support around $2,913. Further down, the S2 support stands at $2,892, though the $2,900 big figure should be strong enough to catch any corrections.
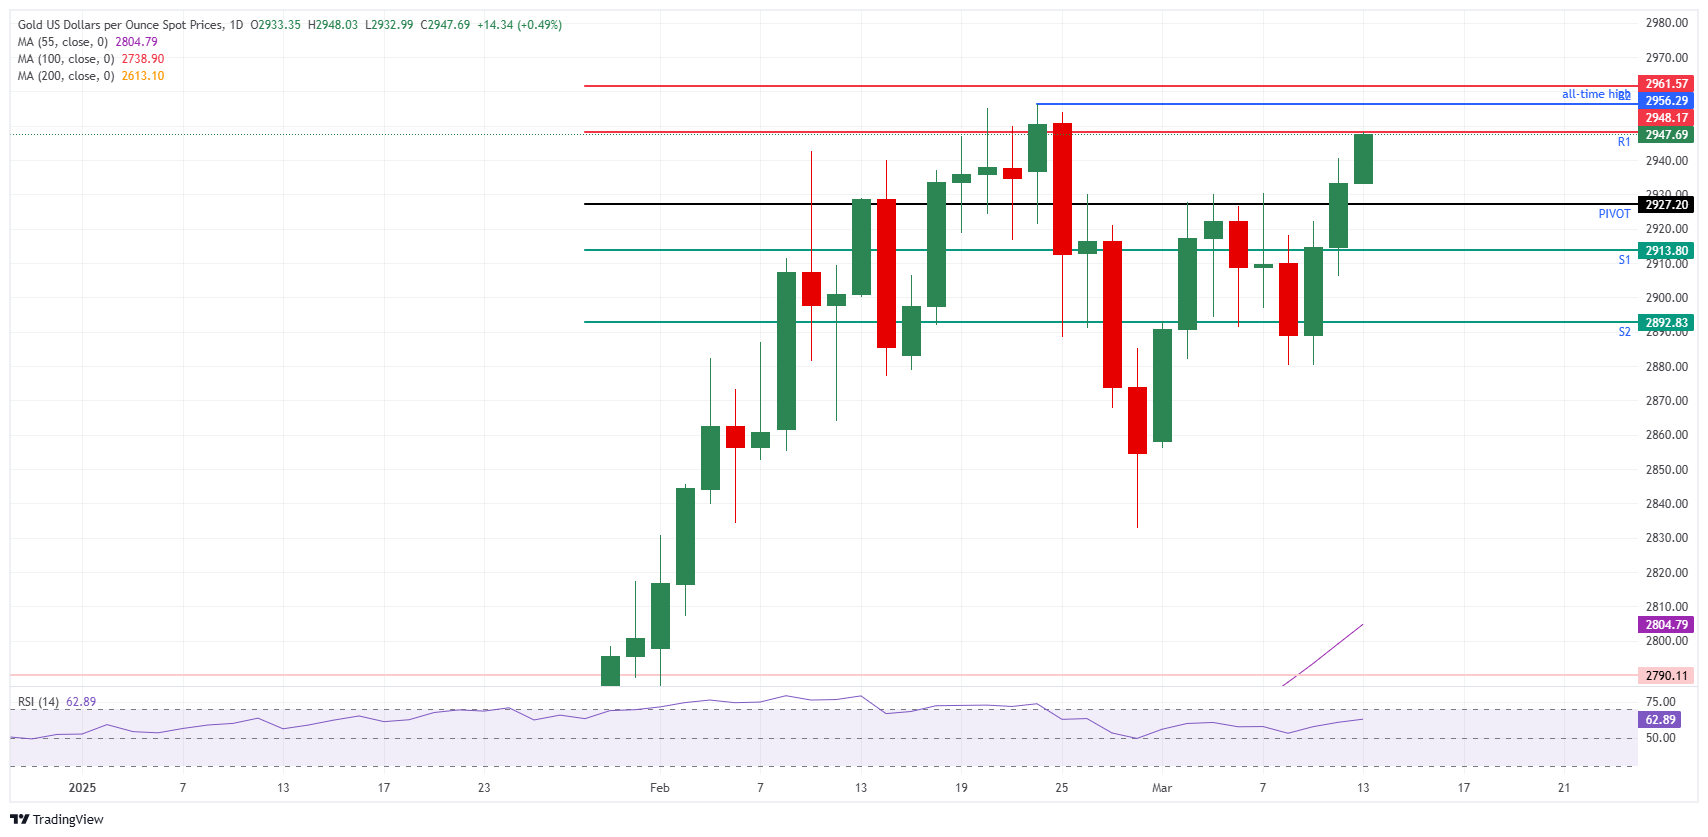
XAU/USD: Daily Chart
Gold FAQs
Gold has played a key role in human’s history as it has been widely used as a store of value and medium of exchange. Currently, apart from its shine and usage for jewelry, the precious metal is widely seen as a safe-haven asset, meaning that it is considered a good investment during turbulent times. Gold is also widely seen as a hedge against inflation and against depreciating currencies as it doesn’t rely on any specific issuer or government.
Central banks are the biggest Gold holders. In their aim to support their currencies in turbulent times, central banks tend to diversify their reserves and buy Gold to improve the perceived strength of the economy and the currency. High Gold reserves can be a source of trust for a country’s solvency. Central banks added 1,136 tonnes of Gold worth around $70 billion to their reserves in 2022, according to data from the World Gold Council. This is the highest yearly purchase since records began. Central banks from emerging economies such as China, India and Turkey are quickly increasing their Gold reserves.
Gold has an inverse correlation with the US Dollar and US Treasuries, which are both major reserve and safe-haven assets. When the Dollar depreciates, Gold tends to rise, enabling investors and central banks to diversify their assets in turbulent times. Gold is also inversely correlated with risk assets. A rally in the stock market tends to weaken Gold price, while sell-offs in riskier markets tend to favor the precious metal.
The price can move due to a wide range of factors. Geopolitical instability or fears of a deep recession can quickly make Gold price escalate due to its safe-haven status. As a yield-less asset, Gold tends to rise with lower interest rates, while higher cost of money usually weighs down on the yellow metal. Still, most moves depend on how the US Dollar (USD) behaves as the asset is priced in dollars (XAU/USD). A strong Dollar tends to keep the price of Gold controlled, whereas a weaker Dollar is likely to push Gold prices up.
-
10:07
USD/JPY: Likely to trade in a range between 147.60 and 148.90 – UOB Group
US Dollar (USD) is likely to trade in a range between 147.60 and 148.90 vs Japanese Yen (JPY). In the longer run, downward momentum has largely faded; USD is expected to trade in a range between 146.50 and 149.50, UOB Group's FX analysts Quek Ser Leang and Peter Chia note.
Downward momentum has largely faded
24-HOUR VIEW: "USD rebounded to a high of 148.11 two days ago. Yesterday, when USD was at 148.00, we were of the view that it 'could continue to rebound, but it does not seem to have enough momentum to break above 148.80.' The anticipated rebound exceeded our expectations as USD popped to a high of 149.19 in NY session, pulling back sharply to close at 148.25 (+0.32%). The pullback in slowing momentum indicates USD is unlikely to rise further. Today, it is more likely to trade in a range between 147.60 and 148.90."
1-3 WEEKS VIEW: "Yesterday (12 Mar, spot at 148.00), we revised our view to neutral, indicating that 'downward momentum has largely faded.' We expected USD to 'trade in a range between 146.50 and 149.50.' Our view remains unchanged."
-
10:05
EUR/USD corrects slightly amid fears of potential EU-US trade war
- EUR/USD falls slightly to near 1.0860 as investors turn cautious over the EU-US trade relationship outlook.
- US President Trump threatens to respond to EU’s proposed counter-tariffs.
- Investors await the meeting of German leaders on a debt restructuring plan.
EUR/USD corrects to near 1.0860 in European trading hours on Thursday. The major currency pair drops as the Euro (EUR) faces slight pressure on fresh escalation in potential tariff war between the European Union (EU) and the United States (US).
On Wednesday, US President Donald Trump said that he will respond to counter-tariffs proposed by the EU on 26 billion Euro worth of US goods. Trump’s comments came just before the meeting with Irish Prime Minister Micheál Martin, after which he said that “there’s a massive deficit that we have with Ireland and with other countries” and added he will impose reciprocal tariffs on them for taking advantage of the US.
During the European trading hours on Wednesday, European Commission (EC) President Ursula von der Leyen launched 'swift and proportionate countermeasures' on US imports in the EU in response to steel tariffs. Trump announced a 25% tariff blanket on imports of steel and aluminum, which has come into effect on Thursday.
The trade war between the shared continent and the US will impact heavily on the German economy, knowing that it is the largest exporter of the Eurozone to the US. In European trading hours on Thursday, the European Central Bank (ECB) policymaker and Bundesbank President Joachim Nagel warned that US trade tariffs on the European Union (EU) could push “Germany into recession this year” in an interview with BBC News.
Meanwhile, trades are also cautious ahead of the meeting of German leaders to discuss the debt restructuring to boost defense spending and stimulate economic growth. German debt reforms are expected to get cleared in the lower house of Parliament on Tuesday as Franziska Brantner-led-German Green Party agreed to negotiate with likely next Chancellor Friedrich Merz and Social Democratic Party’s (SDP) co-leader Lars Klingbei.
The Euro has outperformed lately as investors expect the German debt restructuring plan will be inflationary for the economy. Such a scenario would force traders to pare European Central Bank (ECB) dovish bets.
Daily digest market movers: EUR/USD ticks lower as US Dollar steadies despite cooling US inflation
- The US Dollar strives to gain ground as US President Trump’s tariff fears have lifted demand for safe-haven assets. The US Dollar Index (DXY), which tracks the Greenback’s value against six major currencies, gains marginally to near 103.65 but is still in sight of its four-month low of 103.20.
- The upside in the Greenback remains capped as US inflationary pressures have cooled down faster than expected in February. In the 12 months to February, the US headline and core CPI decelerated to 2.8% and 3.1%, respectively. Month-on-month headline and core CPI grew by 0.2%, slower than estimates of 0.3%. Signs of taming inflationary pressures bode poorly for the US Dollar as they force traders to raise bets supporting the Federal Reserve (Fed) to ease monetary policy. According to the CME FedWatch tool, there is a 78% chance that the Fed will cut interest rates in the June meeting.
- Going forward, the next major trigger for the US Dollar will be the two-day Fed’s monetary policy meeting on March 18-19. The central bank is almost certain to keep interest rates steady in the range of 4.25%-4.50%. Investors will pay close attention to the Fed’s guidance on inflation and the economic outlook under the leadership of Donald Trump.
- In Thursday’s session, investors will focus on the US Producer Price Index (PPI) data for February, which will be published at 12:30 GMT.
Technical Analysis: EUR/USD drops from five-month high of 1.0950
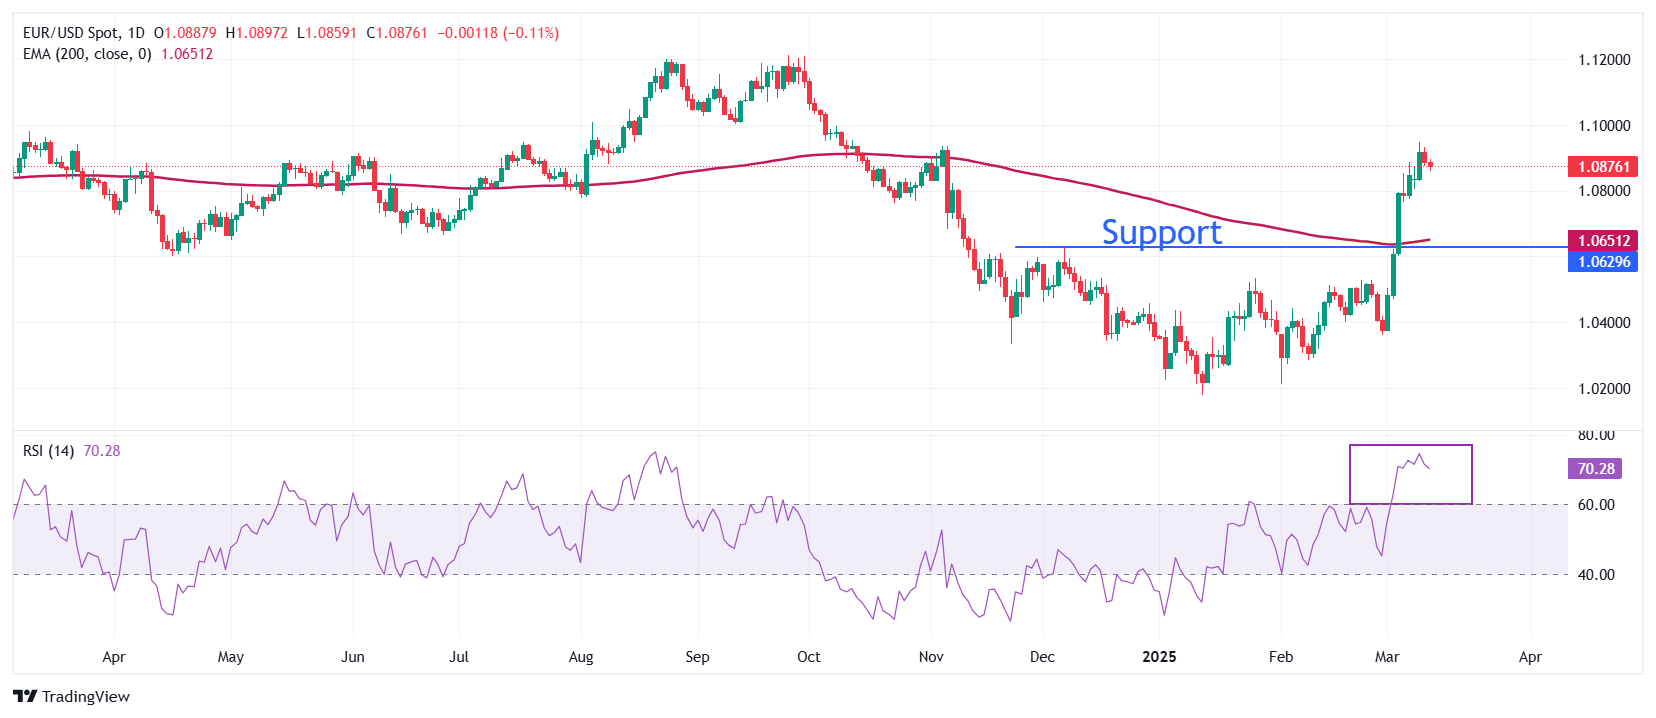
EUR/USD drops to near 1.0860 on Thursday, extending correction after posting a fresh five-month high near 1.0950 on Tuesday. The pair strengthened after a decisive breakout above the December 6 high of 1.0630 on March 5. The long-term outlook of the major currency pair is bullish as it holds above the 200-day Exponential Moving Average (EMA), which trades around 1.0650.
The 14-day Relative Strength Index (RSI) wobbles near 75.00, suggesting a strong bullish momentum.
Looking down, the December 6 high of 1.0630 will act as the major support zone for the pair. Conversely, the psychological level of 1.1000 will be a key barrier for the Euro bulls.
Euro FAQs
The Euro is the currency for the 19 European Union countries that belong to the Eurozone. It is the second most heavily traded currency in the world behind the US Dollar. In 2022, it accounted for 31% of all foreign exchange transactions, with an average daily turnover of over $2.2 trillion a day. EUR/USD is the most heavily traded currency pair in the world, accounting for an estimated 30% off all transactions, followed by EUR/JPY (4%), EUR/GBP (3%) and EUR/AUD (2%).
The European Central Bank (ECB) in Frankfurt, Germany, is the reserve bank for the Eurozone. The ECB sets interest rates and manages monetary policy. The ECB’s primary mandate is to maintain price stability, which means either controlling inflation or stimulating growth. Its primary tool is the raising or lowering of interest rates. Relatively high interest rates – or the expectation of higher rates – will usually benefit the Euro and vice versa. The ECB Governing Council makes monetary policy decisions at meetings held eight times a year. Decisions are made by heads of the Eurozone national banks and six permanent members, including the President of the ECB, Christine Lagarde.
Eurozone inflation data, measured by the Harmonized Index of Consumer Prices (HICP), is an important econometric for the Euro. If inflation rises more than expected, especially if above the ECB’s 2% target, it obliges the ECB to raise interest rates to bring it back under control. Relatively high interest rates compared to its counterparts will usually benefit the Euro, as it makes the region more attractive as a place for global investors to park their money.
Data releases gauge the health of the economy and can impact on the Euro. Indicators such as GDP, Manufacturing and Services PMIs, employment, and consumer sentiment surveys can all influence the direction of the single currency. A strong economy is good for the Euro. Not only does it attract more foreign investment but it may encourage the ECB to put up interest rates, which will directly strengthen the Euro. Otherwise, if economic data is weak, the Euro is likely to fall. Economic data for the four largest economies in the euro area (Germany, France, Italy and Spain) are especially significant, as they account for 75% of the Eurozone’s economy.
Another significant data release for the Euro is the Trade Balance. This indicator measures the difference between what a country earns from its exports and what it spends on imports over a given period. If a country produces highly sought after exports then its currency will gain in value purely from the extra demand created from foreign buyers seeking to purchase these goods. Therefore, a positive net Trade Balance strengthens a currency and vice versa for a negative balance.
-
10:03
Eurozone Industrial Production jumps 0.8% MoM in January vs. 0.6% expected
Eurozone’s industrial sector activity rebounded more than expected in January, the latest data published by Eurostat showed on Thursday.
Industrial output in the old continent rose 0.8% month-over-month (MoM) in January, compared to the expected increase of 0.6% and -0.4% reported in December.
Annually, Eurozone Industrial Production showed no growth in the same period, compared to December’s -1.5%. Data exceeded the market forecast of -0.9%.
EUR/USD reaction to the Eurozone Industrial Production data
Eurozone industrial figures failed to impress the Euro, as EUR/USD stays 0.06% weaker on the day at 1.0880, as of writing.
Euro PRICE Today
The table below shows the percentage change of Euro (EUR) against listed major currencies today. Euro was the weakest against the Japanese Yen.
USD EUR GBP JPY CAD AUD NZD CHF USD 0.05% 0.02% -0.07% -0.01% 0.48% 0.47% -0.01% EUR -0.05% -0.02% -0.13% -0.07% 0.44% 0.45% -0.06% GBP -0.02% 0.02% -0.10% -0.05% 0.46% 0.47% -0.01% JPY 0.07% 0.13% 0.10% 0.03% 0.56% 0.55% 0.10% CAD 0.01% 0.07% 0.05% -0.03% 0.52% 0.50% 0.03% AUD -0.48% -0.44% -0.46% -0.56% -0.52% 0.00% -0.45% NZD -0.47% -0.45% -0.47% -0.55% -0.50% -0.01% -0.44% CHF 0.01% 0.06% 0.01% -0.10% -0.03% 0.45% 0.44% The heat map shows percentage changes of major currencies against each other. The base currency is picked from the left column, while the quote currency is picked from the top row. For example, if you pick the Euro from the left column and move along the horizontal line to the US Dollar, the percentage change displayed in the box will represent EUR (base)/USD (quote).
(This story was corrected on March 13 at 10:24 GMT to say that the Industrial Production reading was revised to -1.5% in December, not -1.4%.)
-
10:01
Eurozone Industrial Production w.d.a. (YoY) registered at 0% above expectations (-0.9%) in January
-
10:01
Eurozone Industrial Production s.a. (MoM) registered at 0.8% above expectations (0.6%) in January
-
09:59
Gas traders cut their net longs in natural gas – ING
In natural gas, investment funds continued to cut their net long in the Title Transfer Facility (TTF) over the last week, ING's commodity experts Ewa Manthey and Warren Patterson note.
Investment funds have the smallest net long held since May 2024
"In natural gas, investment funds continued to cut their net long in the Title Transfer Facility (TTF) over the last week, selling 48.1TWh, leaving them with a net long of 126.7TWh. That’s the smallest net long held since May 2024."
"The move over the last week was driven by fresh shorts entering the market, rather than longs liquidating."
-
09:58
ECB’s Rehn: EU should aim at negotiated solutions for US tariffs
European Central Bank (ECB) policymaker Olli Rehn commented on US tariffs and the central bank's independence on Thursday.
Rehn said he ”can only hope the Trump administration can respect central bank independence.”
He further noted that the European Union (EU) should aim at negotiated solutions for US tariffs, encouraging the Trump administration to avoid these unnecessary, harmful tariffs.”
Earlier in the week, the ECB policymaker said, “US tariffs could cut global output by more than 0.5% this year and the next.”
-
09:56
NZD/USD can rise and test 0.5760 – UOB Group
Provided that 0.5700 holds, New Zealand Dollar (NZD) could rise and test 0.5760 vs US Dollar (USD); the major resistance at 0.5775 is unlikely to come into view. In the longer run, there has been no further increase in upward momentum; a break of 0.5660 would mean that the recovery is not reaching 0.5775, UOB Group's FX analysts Quek Ser Leang and Peter Chia note.
Major resistance at 0.5775 is unlikely to come into view
24-HOUR VIEW: "Following Tuesday’s price action, we indicated yesterday (Wednesday) that 'momentum indicators are turning neutral,' and we expected NZD to 'trade in a 0.5675/0.5735 range.' However, after dipping to 0.5698, NZD rose to a high of 0.5742. Despite advancing, NZD has not gained much momentum. That said, provided 0.5700 (minor support is at 0.5715) holds, NZD could rise and test the 0.5760 level. The major resistance at 0.5775 is unlikely to come into view."
1-3 WEEKS VIEW: "We highlighted on Tuesday (11 Mar, spot at 0.5695) that the recent price action did not result 'in any increase in momentum,' and a break of 0.5660 (‘strong support’ level) would mean that the recovery is not reaching 0.5775.” Since then, NZD has traded mostly sideways, and our view remains unchanged."
-
09:48
Oil: Kazakhstan oil production surges – ING
Oil prices strengthened yesterday with ICE Brent seeing its biggest gain since the end of February, settling 2% up on the day, taking it back above US$70/bbl. A lower-than-expected increase in US crude oil inventories supported the market, while better-than-expected US consumer price inflation data also helped sentiment, ING's commodity experts Ewa Manthey and Warren Patterson note.
OPEC remains fairly bullish on demand
"Energy Information Administration (EIA) data shows that US commercial crude oil inventories increased by 1.45m barrels over the last week. That’s less than the roughly 2m barrel build the market was expecting – and below the 4.2m barrel increase the American Petroleum Institute (API) reported the previous day. Refiners increased operating rates over the week, with crude oil inputs increasing by 321k b/d. Yet despite stronger refinery activity, refined product stocks declined."
"OPEC’s latest monthly oil market report, released yesterday, left both demand and supply estimates unchanged for 2025 and 2026. OPEC continues to forecast that 2025 oil demand will grow by 1.45m b/d year on year, while demand grows at 1.43m b/d next year. OPEC remains fairly bullish on demand, with their numbers above both the EIA and the International Energy Agency (IEA)."
"Meanwhile, OPEC production grew by 154k b/d MoM to 26.86m b/d in February. Nigeria and Iran were the key drivers behind this supply growth. Looking at broader OPEC+, supply grew by 363k b/d. Kazakh output surged by 198k b/d to 1.77m b/d, well above its production target of 1.47m b/d. Kazakhstan has said it will cut output in the future to compensate for this overproduction."
-
09:43
PBOC: Will cut interest rates and RRR at a proper time
The People's Bank of China (PBOC) said on Thursday that they “will cut interest rates and Reserve Requirement Ratio (RRR) at a proper time.”
Additional takeaways
Will keep liquidity ample.
Will guide social financing cost to lower.
Will strenghthen expectation guidance, maintain yuan exchange rate basically stable at a reasonable and balanced level.
Market reaction
At the time of writing, AUD/USD is down 0.55% on the day, trading at 0.6285.
PBOC FAQs
The primary monetary policy objectives of the People's Bank of China (PBoC) are to safeguard price stability, including exchange rate stability, and promote economic growth. China’s central bank also aims to implement financial reforms, such as opening and developing the financial market.
The PBoC is owned by the state of the People's Republic of China (PRC), so it is not considered an autonomous institution. The Chinese Communist Party (CCP) Committee Secretary, nominated by the Chairman of the State Council, has a key influence on the PBoC’s management and direction, not the governor. However, Mr. Pan Gongsheng currently holds both of these posts.
Unlike the Western economies, the PBoC uses a broader set of monetary policy instruments to achieve its objectives. The primary tools include a seven-day Reverse Repo Rate (RRR), Medium-term Lending Facility (MLF), foreign exchange interventions and Reserve Requirement Ratio (RRR). However, The Loan Prime Rate (LPR) is China’s benchmark interest rate. Changes to the LPR directly influence the rates that need to be paid in the market for loans and mortgages and the interest paid on savings. By changing the LPR, China’s central bank can also influence the exchange rates of the Chinese Renminbi.
Yes, China has 19 private banks – a small fraction of the financial system. The largest private banks are digital lenders WeBank and MYbank, which are backed by tech giants Tencent and Ant Group, per The Straits Times. In 2014, China allowed domestic lenders fully capitalized by private funds to operate in the state-dominated financial sector.
-
09:33
AUD/USD is facing mild upward pressure – UOB Group
Australian Dollar (AUD) is facing mild upward pressure vs US Dollar (USD); it is likely to edge higher but is unlikely to threaten the major resistance at 0.6355. In the longer run, slightly firm underlying tone suggests AUD is likely to trade in a higher range of 0.6245/0.6385, UOB Group's FX analysts Quek Ser Leang and Peter Chia note.
AUD is likely to trade in a higher range of 0.6245/0.6385
24-HOUR VIEW: "We expected AUD to 'trade in a 0.6255/0.6320 range' yesterday. AUD then traded between 0.6277 and 0.6330. The price movements have resulted in a slight increase in momentum. Today, we expect AUD to edge higher, but as momentum is not strong, any advance is unlikely to threaten the major resistance at 0.6355. Support is at 0.6305; a breach of 0.6285 would indicate the current mild upward pressure has faded."
1-3 WEEKS VIEW: "Our latest narrative was from Tuesday (11 Mar, spot at 0.6280), wherein 'The current price movements are likely part of a range trading phase between 0.6215 and 0.6355.' Although the price action over the past couple of days has resulted in a slight increase in upward momentum, it is not enough to indicate a sustained advance. We continue to expect AUD to trade in a range, but the slightly firm underlying tone suggests a higher range of 0.6245/0.6385."
-
09:30
Silver price today: Silver falls, according to FXStreet data
Silver prices (XAG/USD) fell on Thursday, according to FXStreet data. Silver trades at $33.02 per troy ounce, down 0.42% from the $33.16 it cost on Wednesday.
Silver prices have increased by 14.28% since the beginning of the year.
Unit measure Silver Price Today in USD Troy Ounce 33.02 1 Gram 1.06
The Gold/Silver ratio, which shows the number of ounces of Silver needed to equal the value of one ounce of Gold, stood at 89.14 on Thursday, up from 88.47 on Wednesday.
Silver FAQs
Silver is a precious metal highly traded among investors. It has been historically used as a store of value and a medium of exchange. Although less popular than Gold, traders may turn to Silver to diversify their investment portfolio, for its intrinsic value or as a potential hedge during high-inflation periods. Investors can buy physical Silver, in coins or in bars, or trade it through vehicles such as Exchange Traded Funds, which track its price on international markets.
Silver prices can move due to a wide range of factors. Geopolitical instability or fears of a deep recession can make Silver price escalate due to its safe-haven status, although to a lesser extent than Gold's. As a yieldless asset, Silver tends to rise with lower interest rates. Its moves also depend on how the US Dollar (USD) behaves as the asset is priced in dollars (XAG/USD). A strong Dollar tends to keep the price of Silver at bay, whereas a weaker Dollar is likely to propel prices up. Other factors such as investment demand, mining supply – Silver is much more abundant than Gold – and recycling rates can also affect prices.
Silver is widely used in industry, particularly in sectors such as electronics or solar energy, as it has one of the highest electric conductivity of all metals – more than Copper and Gold. A surge in demand can increase prices, while a decline tends to lower them. Dynamics in the US, Chinese and Indian economies can also contribute to price swings: for the US and particularly China, their big industrial sectors use Silver in various processes; in India, consumers’ demand for the precious metal for jewellery also plays a key role in setting prices.
Silver prices tend to follow Gold's moves. When Gold prices rise, Silver typically follows suit, as their status as safe-haven assets is similar. The Gold/Silver ratio, which shows the number of ounces of Silver needed to equal the value of one ounce of Gold, may help to determine the relative valuation between both metals. Some investors may consider a high ratio as an indicator that Silver is undervalued, or Gold is overvalued. On the contrary, a low ratio might suggest that Gold is undervalued relative to Silver.
(An automation tool was used in creating this post.)
-
09:15
IEA: Global oil supply could exceed demand by around 600,000 bpd this year.
In its monthly oil market report published on Thursday, the International Energy Agency (IEA) said that “global oil supply could exceed demand by around 600,000 barrels per day (bpd) this year.
Additional takeaways
2025 world oil demand growth forecast seen at 1.03 million bpd (previously 1.10 mil bpd).
The surplus could widen further by 400,000 bpd if OPEC+ extends the unwinding of its output cuts..
US forecast to be the largest source of supply growth in 2025.
Global oil supply rose by 240,000 b/d in February on month.
US tariffs will act as barriers to global trade, economic growth in 2025.
OPEC+ might add 40,000 bpd to the market in April instead of 138,000 bpd.
IEA raises 2025 non-OPEC+ supply growth estimate to 1.5 millon bpd from 1.4 million bpd.
-
09:00
AUD/JPY Price Forecast: Seems vulnerable near 93.00; bears might aim to challenge YTD low
- AUD/JPY struggles to build on a two-day-old recovery momentum from a multi-month trough.
- BoJ rate hike bets and rising trade tensions benefit the safe-haven JPY and weigh on spot prices.
- The US-China trade war supports prospects for further losses amid a bearish technical setup.
The AUD/JPY cross attracts fresh selling in the vicinity of the 94.00 mark, or the weekly top touched earlier this Thursday, and extends its steady intraday descent through the first half of the European session. Spot prices slide below the 93.00 mark in the last hour and for now, seem to have stalled a two-day-old recovery from the lowest level since August 2024 touched on Tuesday.
Against the backdrop of bets that the Bank of Japan (BoJ) will hike interest rates again, concerns about the potential economic fallout from US President Donald Trump's aggressive tariff policies boost demand for the safe-haven Japanese Yen (JPY). Apart from this, the risk of a further escalation of trade war between the US and China – the world's two largest economies – weighs on the Australian Dollar (AUD) and exerts additional pressure on the AUD/JPY cross.
From a technical perspective, the recent repeated failures near the 50-day Simple Moving Average (SMA) and bearish oscillators on the daily chart suggest that the path of least resistance for spot prices remains to the downside. Hence, some follow-through weakness towards the 93.50 intermediate support, en route to the 92.00 mark and the 91.80 area or a multi-month low, looks like a distinct possibility amid bets that the Reserve Bank of Australia (RBA) will cut rates further.
On the flip side, any meaningful recovery now seems to confront immediate resistance near the 93.70 region. This is followed by the weekly top, around the 94.00 mark, which if cleared decisively should pave the way for a further near-term appreciation. The AUD/JPY cross might then aim to surpass the monthly peak, around the 94.70-94.75 area, and reclaim the 95.00 psychological mark before climbing further towards the 96.00 neighborhood, or the 50-day SMA barrier.
The latter should act as a key pivotal point, which if cleared decisively might shift the near-term bias in favor of bullish traders and suggest that the AUD/JPY cross has formed a near-term bottom. This, in turn, would set the stage for a move towards the 96.65 intermediate resistance en route to the 97.00 round figure, the 97.75-97.80 region, and the 98.00 mark.
AUD/JPY daily chart
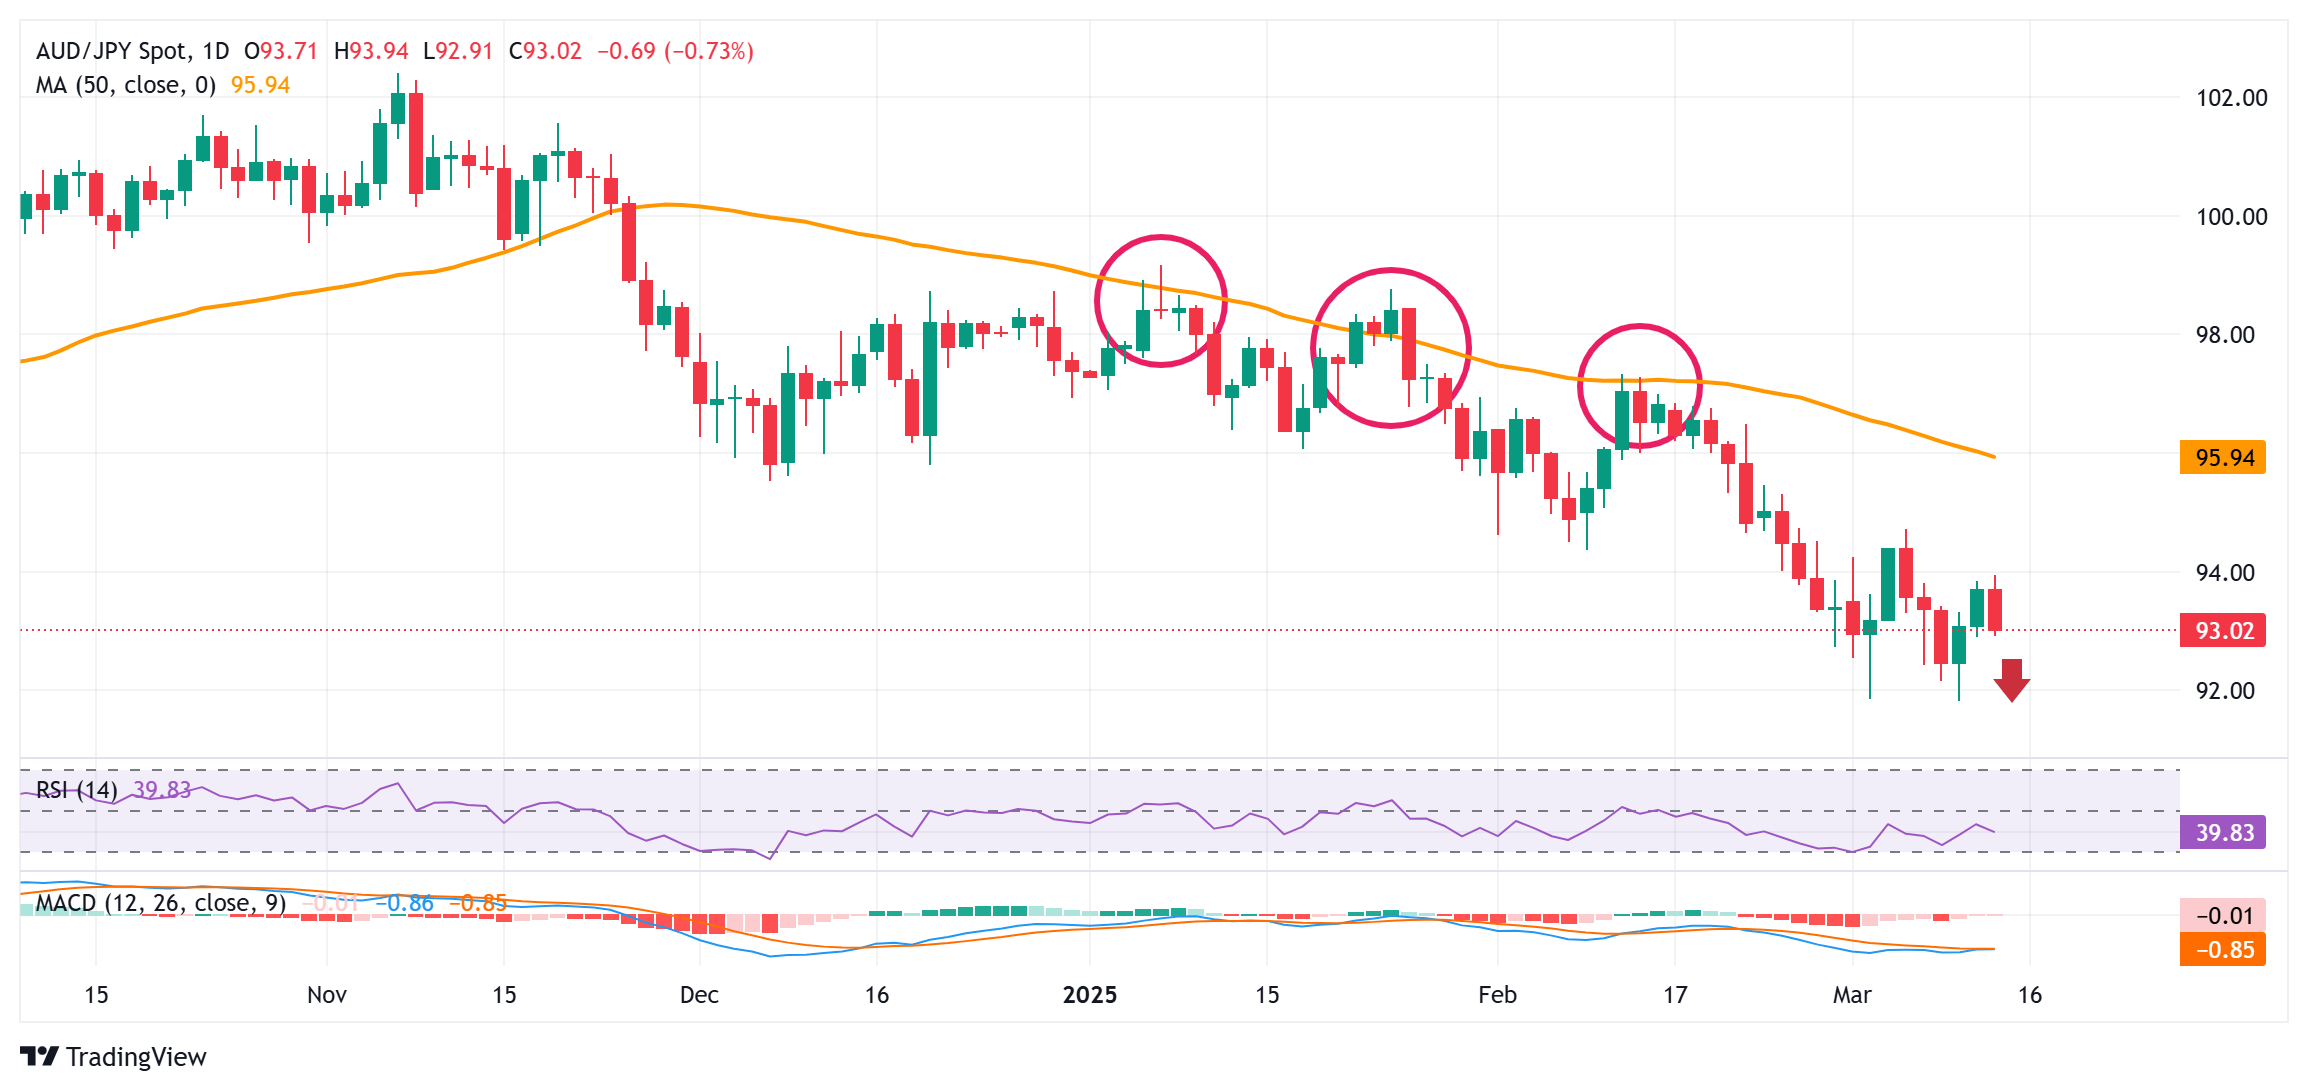
US-China Trade War FAQs
Generally speaking, a trade war is an economic conflict between two or more countries due to extreme protectionism on one end. It implies the creation of trade barriers, such as tariffs, which result in counter-barriers, escalating import costs, and hence the cost of living.
An economic conflict between the United States (US) and China began early in 2018, when President Donald Trump set trade barriers on China, claiming unfair commercial practices and intellectual property theft from the Asian giant. China took retaliatory action, imposing tariffs on multiple US goods, such as automobiles and soybeans. Tensions escalated until the two countries signed the US-China Phase One trade deal in January 2020. The agreement required structural reforms and other changes to China’s economic and trade regime and pretended to restore stability and trust between the two nations. However, the Coronavirus pandemic took the focus out of the conflict. Yet, it is worth mentioning that President Joe Biden, who took office after Trump, kept tariffs in place and even added some additional levies.
The return of Donald Trump to the White House as the 47th US President has sparked a fresh wave of tensions between the two countries. During the 2024 election campaign, Trump pledged to impose 60% tariffs on China once he returned to office, which he did on January 20, 2025. With Trump back, the US-China trade war is meant to resume where it was left, with tit-for-tat policies affecting the global economic landscape amid disruptions in global supply chains, resulting in a reduction in spending, particularly investment, and directly feeding into the Consumer Price Index inflation.
-
08:58
GBP: Downside risks ahead of Budget event – ING
ING's UK economist has published a note on the potential reset in UK-EU relationships and implications for British finances. The conclusion is that while rejoining the single market (or tightening economic ties) would have a beneficial growth effect, that is unlikely to unlock much fiscal headroom. That’s because the OBR’s projection adjustment would likely be spread over multiple years, ING's FX analyst Francesco Pesole notes.
GBP/USD can temporarily rise above 1.3000
"We still look with some concern at the upcoming 26 March Budget event in the UK, which runs the risk of unnerving a gilt market already hit by EU-bond spillover. We see downside risks for sterling ahead of the risk event."
"Before then, the UK releases GDP figures for January tomorrow and jobs numbers for February next Thursday, a few hours before the Bank of England rate announcement. That should be a hold (markets pricing in only a 5% chance of a cut), but given expectations for a cut either in May or June, some sort of dovish indication will be required to maintain current pricing in the Sonia curve."
"Anyway, we retain a bearish bias on GBP/USD, although near-term noise linked to the US macro outlook might still bring the pair temporarily above 1.3000."
-
08:53
GBP/USD to test 1.3000 in the near term – UOB Group
Chance for Pound Sterling (GBP) to test 1.3000 vs US Dollar (USD); a clear break above this level seems unlikely. In the longer run, to continue to rise, GBP must break and remain above 1.3000, UOB Group's FX analysts Quek Ser Leang and Peter Chia note.
To continue to rise, GBP must break and remain above 1.3000
24-HOUR VIEW: "When GBP was at 1.2940 yesterday, we indicated that 'while conditions are overbought, GBP may have just enough momentum to test the key resistance at 1.2975 before the risk of a pullback increases.' We added, 'The next resistance at 1.3000 is unlikely to come under threat,' and 'support levels are at 1.2920 and 1.2900.' Our view was not wrong, as after dipping to 1.2914, GBP rose and reached a high of 1.2990. GBP closed at 1.2960, higher by 0.10%. Conditions remain overbought, but today, there is a chance for GBP to test 1.3000. A clear break above this level seems unlikely. On the downside, a breach of 1.2915 (minor support is at 1.2940) would indicate that the current upward pressure has eased."
1-3 WEEKS VIEW: "Two days ago, GBP rose to 1.2966. Yesterday (12 Mar, spot at 1.2940), we noted that 'there has been no further increase in momentum.' We highlighted the following: 'The uptrend appears to be ready to consolidate or pause, and a break below 1.2855 (‘strong support’ level) would indicate that the current upward momentum has eased. Looking ahead, should GBP break above 1.2975, there is another major resistance at 1.3000.' While GBP subsequently rose to 1.2990, upward momentum only increased slightly. To continue to rise, GBP must break and remain above 1.3000. The chance of GBP breaking clearly above 1.3000, although not high, will remain intact as long as 1.2880 (‘strong support’ level was at 1.2855 yesterday) is not breached. Looking ahead, the next level to watch above 1.3000 is at 1.3050."
-
08:53
NZD/USD Price Forecast: Tests nine-day EMA support near 0.5700 with a consolidation phase
- NZD/USD could challenge the upper trendline of the rectangle at 0.5780, followed by the three-month high of 0.5794.
- The bearish rectangle pattern indicates a potential downward breakout after a consolidation phase.
- Immediate support is found at the nine-day EMA of 0.5705, aligned with the 50-day EMA at 0.5699.
NZD/USD pulls back from its gains over the past two sessions, trading near 0.5710 during European trading hours on Thursday. Technical analysis of the daily chart suggests a potential downward breakout following a consolidation phase, as the pair moves within a bearish rectangle pattern. This formation indicates that sellers maintain control, while buyers temporarily support the price within a defined range before the next decline.
The nine-day and 50-day Exponential Moving Average (EMA) align together, signaling a period of equilibrium in the market where short-term and medium-term trends are converging. However, the 9-day EMA breaks above the 50-day EMA, signaling a bullish momentum shift. Additionally, the 14-day Relative Strength Index (RSI) remains above the 50 mark, suggesting that bullish bias is in play.
On the upside, the NZD/USD pair may test the upper trendline of the rectangle at 0.5780, followed by the three-month high of 0.5794, reached on January 24. A decisive break above this key resistance zone could strengthen bullish momentum, potentially driving the pair toward the four-month high of 0.5922, recorded in December 2024.
The immediate support is located at the nine-day EMA of 0.5705, aligned with the 50-day EMA at 0.5699. A decisive break below these levels could weaken both short- and medium-term momentum, applying downward pressure on the NZD/USD pair. This could lead to a test of the psychological support at 0.5600, followed by the lower trendline of the rectangle near 0.5516—the lowest level since October 2022, recorded on February 3.
NZD/USD: Daily Chart
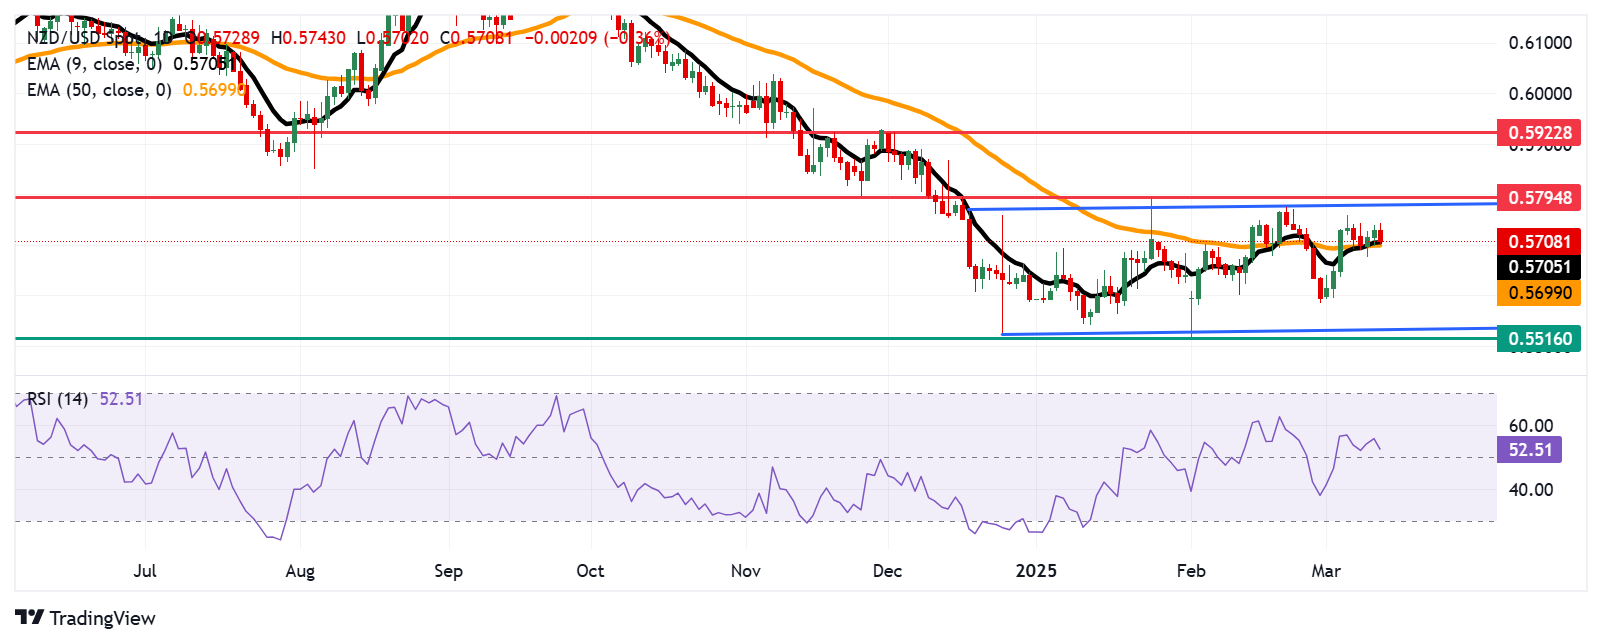
New Zealand Dollar PRICE Today
The table below shows the percentage change of New Zealand Dollar (NZD) against listed major currencies today. New Zealand Dollar was the weakest against the Japanese Yen.
USD EUR GBP JPY CAD AUD NZD CHF USD 0.10% 0.06% -0.31% 0.12% 0.43% 0.36% -0.10% EUR -0.10% -0.03% -0.39% 0.00% 0.32% 0.29% -0.20% GBP -0.06% 0.03% -0.38% 0.04% 0.36% 0.32% -0.14% JPY 0.31% 0.39% 0.38% 0.41% 0.74% 0.67% 0.24% CAD -0.12% -0.01% -0.04% -0.41% 0.33% 0.27% -0.19% AUD -0.43% -0.32% -0.36% -0.74% -0.33% -0.04% -0.48% NZD -0.36% -0.29% -0.32% -0.67% -0.27% 0.04% -0.42% CHF 0.10% 0.20% 0.14% -0.24% 0.19% 0.48% 0.42% The heat map shows percentage changes of major currencies against each other. The base currency is picked from the left column, while the quote currency is picked from the top row. For example, if you pick the New Zealand Dollar from the left column and move along the horizontal line to the US Dollar, the percentage change displayed in the box will represent NZD (base)/USD (quote).
-
08:51
Crude oil price today: WTI price bullish at European opening
West Texas Intermediate (WTI) Oil price advances on Thursday, early in the European session. WTI trades at $67.55 per barrel, up from Wednesday’s close at $67.44. Brent Oil Exchange Rate (Brent crude) is also up, advancing from the $70.69 price posted on Wednesday, and trading at $70.81.
WTI Oil FAQs
WTI Oil is a type of Crude Oil sold on international markets. The WTI stands for West Texas Intermediate, one of three major types including Brent and Dubai Crude. WTI is also referred to as “light” and “sweet” because of its relatively low gravity and sulfur content respectively. It is considered a high quality Oil that is easily refined. It is sourced in the United States and distributed via the Cushing hub, which is considered “The Pipeline Crossroads of the World”. It is a benchmark for the Oil market and WTI price is frequently quoted in the media.
Like all assets, supply and demand are the key drivers of WTI Oil price. As such, global growth can be a driver of increased demand and vice versa for weak global growth. Political instability, wars, and sanctions can disrupt supply and impact prices. The decisions of OPEC, a group of major Oil-producing countries, is another key driver of price. The value of the US Dollar influences the price of WTI Crude Oil, since Oil is predominantly traded in US Dollars, thus a weaker US Dollar can make Oil more affordable and vice versa.
The weekly Oil inventory reports published by the American Petroleum Institute (API) and the Energy Information Agency (EIA) impact the price of WTI Oil. Changes in inventories reflect fluctuating supply and demand. If the data shows a drop in inventories it can indicate increased demand, pushing up Oil price. Higher inventories can reflect increased supply, pushing down prices. API’s report is published every Tuesday and EIA’s the day after. Their results are usually similar, falling within 1% of each other 75% of the time. The EIA data is considered more reliable, since it is a government agency.
OPEC (Organization of the Petroleum Exporting Countries) is a group of 12 Oil-producing nations who collectively decide production quotas for member countries at twice-yearly meetings. Their decisions often impact WTI Oil prices. When OPEC decides to lower quotas, it can tighten supply, pushing up Oil prices. When OPEC increases production, it has the opposite effect. OPEC+ refers to an expanded group that includes ten extra non-OPEC members, the most notable of which is Russia.
Disclaimer: West Texas Intermediate (WTI) and Brent oil prices mentioned above are based on FXStreet data feed for Contracts for Differences (CFDs).
(An automation tool was used in creating this post.)
-
08:48
USD: Risk sentiment softer again today – ING
The bond market had a counterintuitive reaction to yesterday’s cooler-than-expected core CPI data (0.2% MoM), with the Fed’s terminal rate pricing inching higher and Treasuries soft across the curve. This could mirror some reluctance to buy into the deflationary story before the tariff impact has started to show, ING's FX analyst Francesco Pesole notes.
Upside risks for the greenback
"The US Dollar (USD) followed UST yields higher but is still losing against most G10 peers since the start of the week. The canonical negative USD-equity market correlation has dwindled in the past weeks as US stocks are trading closely in line with US activity sentiment. Again, the key is whether more equity declines are a US-only matter or followed by European stocks. Futures point to the latter today, so the dollar may not face much idiosyncratic pressure."
"The main event in the US calendar today is the release of PPI data for February. Many core PPI components feed into the Fed-preferred core PCE, so markets will be quite attentive. Still, following yesterday’s unusual reaction to CPI data, we are not sure a cooler print today would trigger a dollar correction. Consensus is for a 0.3% MoM core PPI print, but expectations may have shifted to a slightly lower figure after yesterday’s CPI."
"Anyway, what seems to be weighing on sentiment this morning is the higher risk of a US government shutdown after Senate Democrats said they would block the bill to avert a government shutdown. The proposed alternative is an interim funding plan until 11 April: that would simply postpone a key risk for markets, hence the negative reaction in stock futures. Moving on, it is probably a USD-negative development given the current tight correlation between the US economic outlook and the dollar. We don’t have a high conviction directional call for the dollar today. A stabilization might be on the cards for now; in the coming weeks, we still see upside risks for the greenback."
-
08:43
EUR/USD: Further range trading seems likely – UOB Group
Further Euro (EUR) range trading seems likely; slightly softened underlying tone suggests a lower range of 1.0850/1.0920. In the longer run, technical target at 1.0945 exceeded; deeply overbought conditions suggest while further gains are possible, the potential for additional upside may be limited, UOB Group's FX analysts Quek Ser Leang and Peter Chia note.
Deeply overbought conditions suggest while further gains are possible
24-HOUR VIEW: "EUR surged and reached a high of 1.0947 on Tuesday. Yesterday (Wednesday), we indicated the following: 'The advance is deeply overbought, and negative momentum divergence is tentatively forming. To put it another way, further sustained rise in EUR seems unlikely. Today, EUR is more likely to consolidate its gains and trade in a 1.0870/1.0950 range.' USD subsequently traded in a narrower range than expected (1.0873/1.0930). Further range trading seems likely, even though the slightly softened underlying tone suggests a lower range of 1.0850/1.0920."
1-3 WEEKS VIEW: "After EUR soared and exceeded our technical target at 1.0945 two days ago, we highlighted yesterday (12 Mar, spot at 1.0915) that 'While the uptrend remains intact for now, it is worth noting that conditions are very deeply overbought.' We also highlighted that 'This suggests that while further gains are possible, the potential for additional upside may be limited.' Our update remains valid. On the downside, a breach of 1.0820 (‘strong support’ level was at 1.0805 yesterday) would indicate the start of a consolidation or pullback."
-
08:38
EUR: Still lots of positives in the price – ING
After inching back below 1.090, the next leg higher for the euro may need to wait for Russia to officially agree on the 30-day truce with Ukraine. Still, that may not be a major or long-lasting bullish driver for the euro, as a peace deal is already largely in the price, and the terms of the truce would need to be weighed against longer-term implications for Ukraine and the EU, ING's FX analyst Francesco Pesole notes.
Decline to 1.080 is more likely
"On the macro side, we’ll look at industrial production figures for January in the eurozone today, which should not move markets. There is also some interest in tracking ECB members’ remarks following last week’s cut. Yesterday, ECB President Christine Lagarde said that global trade events will make it 'impossible' for the ECB to constantly guarantee 2% inflation. That probably opens the question of whether an overhaul of the ECB’s inflation target is due: in practice, this is already being interpreted in a rather flexible way, and only plans of a fiscal boost in Germany have averted rates to be cut to or below 2%, in our view."
"Speaking of which, markets remain on the lookout for an official multi-party agreement on defence and infrastructure spending in Germany. A couple of days ago, the Green party said it expected a deal with Chancellor-to-be Friedrich Merz by the end of the week. Once that is announced, we could see a tick higher in the euro, although markets are already almost fully pricing it in."
"Our view for the remainder of March remains that a decline to 1.080 is more likely than another rally to 1.10 in EUR/USD."
-
08:29
Palladium price today: Rare metals down at the start of the European session
Platinum Group Metals (PGMs) trade with a negative tone at the beginning of Thursday, according to FXStreet data. Palladium (XPD) changes hands at $947.55 a troy ounce, with the XPD/USD pair easing from its previous close at $956.05.
In the meantime, Platinum (XPT) trades at $977.00 against the United States Dollar (USD) early in the European session, also under pressure after the XPT/USD pair settled at $987.75 at the previous close.
Palladium FAQs
Palladium is a rare and valuable precious metal with strong industrial demand, particularly in the automotive sector. It is widely used in catalytic converters to reduce vehicle emissions, making it essential for global environmental regulations. Investors also see palladium as a store of value, similar to gold and silver, and a potential hedge against inflation. Given its supply constraints and high demand, palladium often attracts traders looking for price volatility and profit opportunities.
In trading, palladium (XPD/USD) is considered both an industrial and a precious metal. It is traded on major commodity exchanges like the New York Mercantile Exchange (NYMEX) and the London Platinum and Palladium Market (LPPM). Traders speculate on palladium prices through futures contracts, exchange-traded funds (ETFs), and spot markets. Since palladium supply is concentrated in a few countries, particularly Russia and South Africa, geopolitical and mining disruptions can lead to significant price swings, making it an attractive asset for short-term traders and long-term investors alike.
Palladium has historically been less expensive than gold, but in recent years, it has traded at a premium due to rising demand and tight supply. Prices fluctuate based on market conditions, but palladium has, at times, outperformed gold due to its critical role in the automotive industry. However, as markets shift and industrial demand changes, the price relationship between the two metals can vary.
Palladium prices are influenced by several factors, including industrial demand, supply constraints, and macroeconomic conditions. The automotive industry is the biggest driver of demand, as stricter emissions regulations increase the need for palladium-based catalytic converters. Supply is heavily dependent on mining output from Russia and South Africa, making the metal vulnerable to geopolitical risks and supply chain disruptions. Additionally, broader market trends, such as the strength of the US dollar, interest rates, and economic growth, can impact palladium prices, as they do with other precious metals.
Platinum Group Metals (PGMs) prices mentioned above are based on the FXStreet data feed for Contracts for Differences (CFDs).
(An automation tool was used in creating this post.)
-
08:16
EUR/GBP falls below 0.8400 as Euro struggles amid market jitters
- EUR/GBP declines as the Euro struggles after Trump threatened additional tariffs in response to EU's retaliatory measures against the US.
- Investor caution persists as the Greens party’s Brantner refrains from committing to support Germany’s plans for increased borrowing.
- The UK RICS Housing Price Balance fell to 11% in February, marking its second consecutive decline.
EUR/GBP continues its losing streak for the second straight day, trading near 0.8390 during European hours on Thursday. The currency cross remains under pressure as the Euro (EUR) struggles amid deteriorating market sentiment following US President Donald Trump’s additional tariff threats in response to the European Union’s (EU) retaliatory measures against the United States (US).
Investor caution persists as Germany’s plans for increased state borrowing face fresh obstacles. On Wednesday, Franziska Brantner, co-leader of the Greens party, refrained from committing to a deal, while the far-left party filed another legal challenge.
Meanwhile, election winner Friedrich Merz is pushing to implement debt reforms and create a €500 billion ($545 billion) infrastructure fund before the current parliament dissolves. However, the success of these initiatives depends on securing support from the Greens and overcoming potential legal challenges, according to Reuters.
Adding to concerns, European Central Bank (ECB) policymaker and Bundesbank President Joachim Nagel warned in a BBC interview on Thursday that US trade tariffs on the EU could drive Germany into recession this year.
UK Prime Minister Keir Starmer remains optimistic that Britain can avoid US tariffs on steel and aluminum, advocating for a "pragmatic approach" in negotiations while keeping all options open. Unlike the EU, which has swiftly retaliated against the tariffs, the UK has reaffirmed its commitment to trade discussions with Washington.
Meanwhile, the UK’s 10-year gilt yield surged to 4.68%, the highest level in two months, as expectations mounted that the Bank of England (BoE) will maintain elevated interest rates for an extended period. Traders now anticipate only a 52 basis point (bps) rate cut in 2025, scaling back previous forecasts for more aggressive easing. Investors will be closely watching Friday’s UK monthly GDP data for January, which could offer further insights into the country’s economic outlook.
Tariffs FAQs
Tariffs are customs duties levied on certain merchandise imports or a category of products. Tariffs are designed to help local producers and manufacturers be more competitive in the market by providing a price advantage over similar goods that can be imported. Tariffs are widely used as tools of protectionism, along with trade barriers and import quotas.
Although tariffs and taxes both generate government revenue to fund public goods and services, they have several distinctions. Tariffs are prepaid at the port of entry, while taxes are paid at the time of purchase. Taxes are imposed on individual taxpayers and businesses, while tariffs are paid by importers.
There are two schools of thought among economists regarding the usage of tariffs. While some argue that tariffs are necessary to protect domestic industries and address trade imbalances, others see them as a harmful tool that could potentially drive prices higher over the long term and lead to a damaging trade war by encouraging tit-for-tat tariffs.
During the run-up to the presidential election in November 2024, Donald Trump made it clear that he intends to use tariffs to support the US economy and American producers. In 2024, Mexico, China and Canada accounted for 42% of total US imports. In this period, Mexico stood out as the top exporter with $466.6 billion, according to the US Census Bureau. Hence, Trump wants to focus on these three nations when imposing tariffs. He also plans to use the revenue generated through tariffs to lower personal income taxes.
-
08:07
Pound Sterling consolidates around 1.2950 against US Dollar on Trump tariff fears
- The Pound Sterling trades sideways around 1.2950 against the US Dollar as investors gauge the consequences of US President Trump’s tariff policies.
- US CPI inflation cools down more than expected in February, US PPI data eyed.
- The BoE is expected to keep interest rates steady next week.
The Pound Sterling (GBP) turns sideways around 1.2950 against the US Dollar (USD) on Thursday after posting a fresh four-month high near 1.2990 the previous day. The GBP/USD pair consolidates as the US Dollar steadies after declining for two weeks, while investors weigh the consequences of United States (US) President Donald Trump’s tariff agenda over cooling inflationary pressures and US economic growth. The US Dollar Index (DXY), which tracks the Greenback’s value against six major currencies, gains slightly to near 103.65, marginally higher from an over four-month low of 103.20 reached on Tuesday.
On Wednesday, US President Trump threatened to announce retaliatory tariffs on the European Union (EU) after the 27-nation bloc warned to impose counter-tariffs on goods imported from the US worth 26 billion Euros (EUR). The shared continent vowed to impose counter-surcharges on the US as Trump’s decision to levy 25% tariffs on imports of steel and aluminum across the globe went into effect.
Fears of a potential EU-US trade war have offered a temporary cushion to the US Dollar. However, softer-than-expected US Consumer Price Index (CPI) data for February is expected to keep the upside in the Greenback limited. The US CPI report showed on Wednesday that the headline and core inflation decelerated at a faster-than-expected pace to 2.8% and 3.1%, respectively. This scenario is unfavorable for the US Dollar as cooling price pressures boost Federal Reserve (Fed) dovish bets.
For more cues on inflation, investors will focus on the US Producer Price Index (PPI) data for February, which will be published at 12:30 GMT. Economists expect the headline PPI to have risen by 3.3% year-over-year, slower than the 3.5% increase in January. In the same period, the core PPI – which excludes volatile food and energy prices – is expected to grow steadily by 3.6%.
Daily digest market movers: Pound Sterling trades with caution amid dismal market mood
- The Pound Sterling trades cautiously as Donald Trump's tariff measures have dampened the appeal of risk-sensitive assets. Market participants expect Trump’s ‘America First’ policies will lead to high inflation and a global economic slowdown. This has increased the demand for safe-haven assets.
- On the domestic front, investors await the United Kingdom's (UK) monthly Gross Domestic Product (GDP) and the factory data for January, which will be released on Friday. Investors will pay close attention to the UK GDP data as Bank of England (BoE) policymakers are worried about the economic outlook.
- In the February policy meeting, the BoE revised the GDP forecast for the year to 0.75%, lowered from the 1.5% projected in November. Also, BoE Monetary Policy Committee (MPC) member Catherine Mann favored a larger-than-usual interest rate cut of 50 basis points (bps) amid concerns over growth prospects.
- The UK economy is expected to have grown at a moderate pace of 0.1%, compared to the 0.4% economic expansion seen in December. Monthly factory data is estimated to have declined in the first month of 2025.
- Going forward, the next major trigger for the British currency will be the Bank of England’s (BoE) monetary policy decision, which will be announced next week. The BoE is expected to keep interest rates steady at 4.5% as most officials have guided a ‘gradual and cautious’ policy-easing approach. In the Feb meeting, the BoE reduced interest rates by 25 bps.
Technical Analysis: Pound Sterling sees more upside above 1.3000
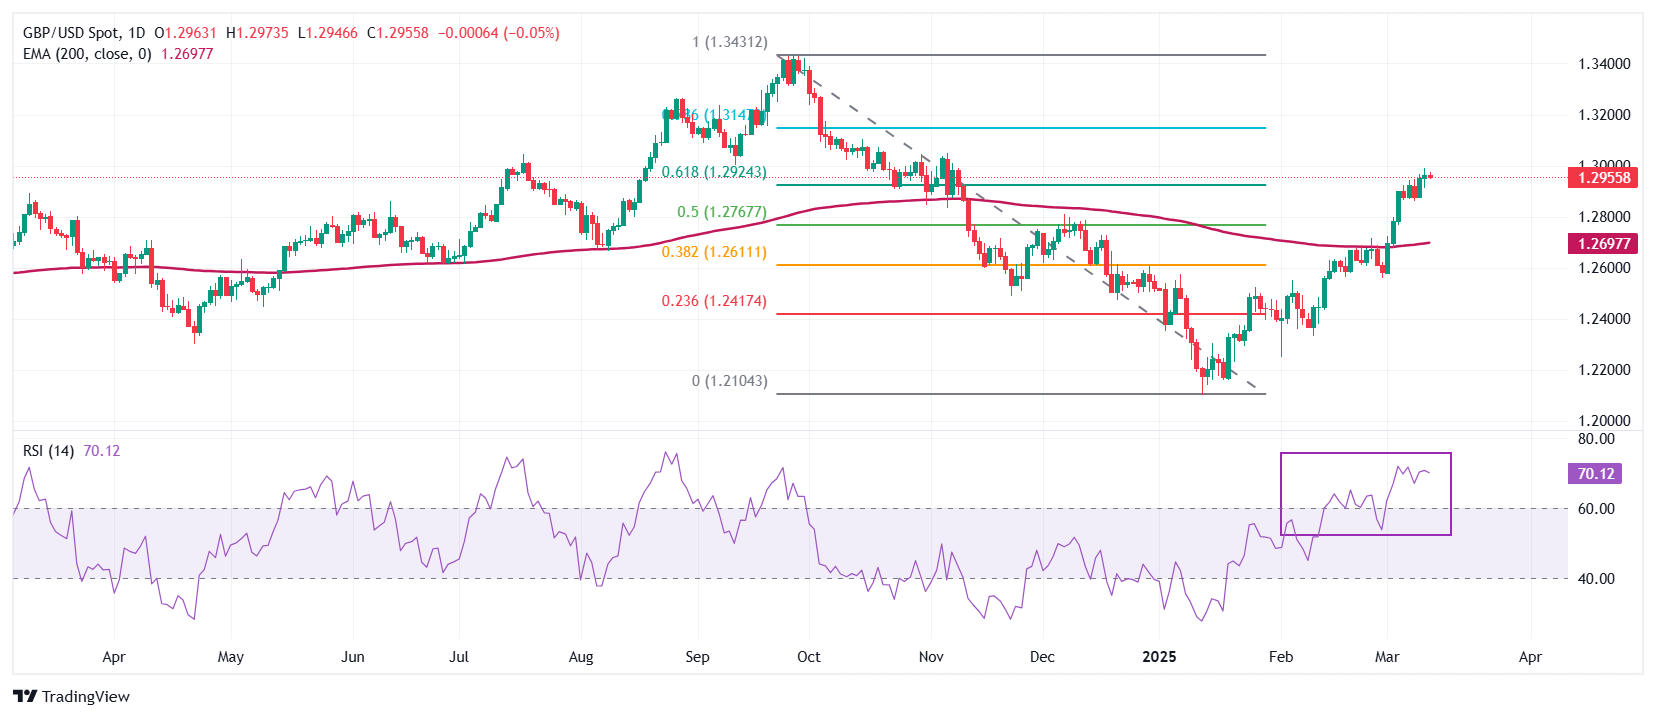
The Pound Sterling trades firmly near the four-month high around the psychological level of 1.3000 against the US Dollar on Thursday. The long-term outlook of the GBP/USD pair has turned bullish as it holds above the 200-day Exponential Moving Average (EMA), which is around 1.2697.
The 14-day Relative Strength Index (RSI) holds above 60.00, indicating a strong bullish momentum.
Looking down, the 50% Fibonacci retracement at 1.2767 and the 38.2% Fibonacci retracement at 1.2608 will act as key support zones for the pair. On the upside, the October 15 high of 1.3100 will act as a key resistance zone.
Pound Sterling FAQs
The Pound Sterling (GBP) is the oldest currency in the world (886 AD) and the official currency of the United Kingdom. It is the fourth most traded unit for foreign exchange (FX) in the world, accounting for 12% of all transactions, averaging $630 billion a day, according to 2022 data. Its key trading pairs are GBP/USD, also known as ‘Cable’, which accounts for 11% of FX, GBP/JPY, or the ‘Dragon’ as it is known by traders (3%), and EUR/GBP (2%). The Pound Sterling is issued by the Bank of England (BoE).
The single most important factor influencing the value of the Pound Sterling is monetary policy decided by the Bank of England. The BoE bases its decisions on whether it has achieved its primary goal of “price stability” – a steady inflation rate of around 2%. Its primary tool for achieving this is the adjustment of interest rates. When inflation is too high, the BoE will try to rein it in by raising interest rates, making it more expensive for people and businesses to access credit. This is generally positive for GBP, as higher interest rates make the UK a more attractive place for global investors to park their money. When inflation falls too low it is a sign economic growth is slowing. In this scenario, the BoE will consider lowering interest rates to cheapen credit so businesses will borrow more to invest in growth-generating projects.
Data releases gauge the health of the economy and can impact the value of the Pound Sterling. Indicators such as GDP, Manufacturing and Services PMIs, and employment can all influence the direction of the GBP. A strong economy is good for Sterling. Not only does it attract more foreign investment but it may encourage the BoE to put up interest rates, which will directly strengthen GBP. Otherwise, if economic data is weak, the Pound Sterling is likely to fall.
Another significant data release for the Pound Sterling is the Trade Balance. This indicator measures the difference between what a country earns from its exports and what it spends on imports over a given period. If a country produces highly sought-after exports, its currency will benefit purely from the extra demand created from foreign buyers seeking to purchase these goods. Therefore, a positive net Trade Balance strengthens a currency and vice versa for a negative balance.
-
07:49
WTI remains below $67.50 as escalating trade tensions overshadow potential demand boost
- WTI price holds losses as global trade tensions escalate following President Trump’s renewed tariff threats.
- OPEC+ struggles to enforce production targets amid a surge in February crude output, driven primarily by Kazakhstan.
- US gasoline inventories plummeted by 5.7 million barrels, surpassing analysts' expectations of a 1.9 million-barrel decline.
West Texas Intermediate (WTI) crude Oil price remains subdued after two days of gains, trading around $67.40 per barrel during early European hours on Thursday. However, crude Oil could face headwinds as traders shift their focus to escalating global trade tensions.
US President Donald Trump threatened additional tariffs in response to the European Union’s (EU) retaliatory measures against the United States (US). After the US imposed a 25% tariff on European steel and aluminum, the EU countered with tariffs on €26 billion worth of US goods in April. Trump's aggressive stance on tariffs has unsettled investors, weakened consumer and business confidence, and heightened fears of a US recession.
Oil prices may also face downward pressure after the Organization of the Petroleum Exporting Countries (OPEC) reported a significant rise in February crude output, led by Kazakhstan. This increase highlights challenges for OPEC+ in maintaining adherence to agreed production targets, according to Reuters.
On the other hand, Oil found support on Wednesday as US data pointed to strong domestic demand and slowing inflation, easing investor concerns. Government figures showed US gasoline inventories dropped by 5.7 million barrels—far exceeding analysts' expectations of a 1.9 million-barrel decline—while distillate stocks also fell more than anticipated. This sharp decrease in gasoline inventories bolstered expectations for a seasonal demand surge in spring.
According to Reuters, JP Morgan analysts highlighted signs of robust US demand, along with Ukraine’s deployment of 377 drones targeting Russian energy infrastructure and military sites, as factors supporting Oil prices. "As of March 11, global Oil demand averaged 102.2 million barrels per day, growing by 1.7 million barrels per day year-over-year and exceeding our projected monthly increase by 60,000 barrels per day," they noted.
WTI Oil FAQs
WTI Oil is a type of Crude Oil sold on international markets. The WTI stands for West Texas Intermediate, one of three major types including Brent and Dubai Crude. WTI is also referred to as “light” and “sweet” because of its relatively low gravity and sulfur content respectively. It is considered a high quality Oil that is easily refined. It is sourced in the United States and distributed via the Cushing hub, which is considered “The Pipeline Crossroads of the World”. It is a benchmark for the Oil market and WTI price is frequently quoted in the media.
Like all assets, supply and demand are the key drivers of WTI Oil price. As such, global growth can be a driver of increased demand and vice versa for weak global growth. Political instability, wars, and sanctions can disrupt supply and impact prices. The decisions of OPEC, a group of major Oil-producing countries, is another key driver of price. The value of the US Dollar influences the price of WTI Crude Oil, since Oil is predominantly traded in US Dollars, thus a weaker US Dollar can make Oil more affordable and vice versa.
The weekly Oil inventory reports published by the American Petroleum Institute (API) and the Energy Information Agency (EIA) impact the price of WTI Oil. Changes in inventories reflect fluctuating supply and demand. If the data shows a drop in inventories it can indicate increased demand, pushing up Oil price. Higher inventories can reflect increased supply, pushing down prices. API’s report is published every Tuesday and EIA’s the day after. Their results are usually similar, falling within 1% of each other 75% of the time. The EIA data is considered more reliable, since it is a government agency.
OPEC (Organization of the Petroleum Exporting Countries) is a group of 12 Oil-producing nations who collectively decide production quotas for member countries at twice-yearly meetings. Their decisions often impact WTI Oil prices. When OPEC decides to lower quotas, it can tighten supply, pushing up Oil prices. When OPEC increases production, it has the opposite effect. OPEC+ refers to an expanded group that includes ten extra non-OPEC members, the most notable of which is Russia.
-
07:33
Switzerland Producer and Import Prices (YoY): -0.1% (February) vs -0.3%
-
07:33
Switzerland Producer and Import Prices (MoM) came in at 0.3%, above forecasts (0.2%) in February
-
07:29
Forex Today: Risk recovery loses steam ahead of mid-tier data releases
Here is what you need to know on Thursday, March 13:
Following the improvement seen in market sentiment on Wednesday, investors adopt a cautious stance early Thursday. Eurostat will publish Industrial Production data for January and the US economic calendar will feature weekly Initial Jobless Claims and February Producer Price Index (PPI) data later in the day.
US Dollar PRICE This week
The table below shows the percentage change of US Dollar (USD) against listed major currencies this week. US Dollar was the weakest against the Euro.
USD EUR GBP JPY CAD AUD NZD CHF USD -0.40% -0.25% -0.06% 0.18% 0.11% 0.13% 0.25% EUR 0.40% 0.11% 0.32% 0.59% 0.61% 0.51% 0.53% GBP 0.25% -0.11% 0.15% 0.45% 0.49% 0.34% 0.49% JPY 0.06% -0.32% -0.15% 0.24% 0.24% 0.11% 0.39% CAD -0.18% -0.59% -0.45% -0.24% -0.10% -0.05% 0.04% AUD -0.11% -0.61% -0.49% -0.24% 0.10% -0.10% -0.01% NZD -0.13% -0.51% -0.34% -0.11% 0.05% 0.10% 0.20% CHF -0.25% -0.53% -0.49% -0.39% -0.04% 0.01% -0.20% The heat map shows percentage changes of major currencies against each other. The base currency is picked from the left column, while the quote currency is picked from the top row. For example, if you pick the US Dollar from the left column and move along the horizontal line to the Japanese Yen, the percentage change displayed in the box will represent USD (base)/JPY (quote).
Reflecting the risk-averse market atmosphere, US stock index futures were last seen losing between 0.2% and 0.7% on the day. Meanwhile, the US Dollar (USD) Index holds steady above 103.50 after having snapped a seven-day losing streak on Wednesday. The US Bureau of Labor Statistics reported midweek that annual inflation in the US, as measured by the change in the Consumer Price Index (CPI), softened to 2.8% in February from 3% in January. On a monthly basis, the core CPI, which excludes volatile food and energy prices, rose 0.2%.
The Bank of Canada (BoC) announced on Wednesday that it lowered the policy rate by 25 basis points to 2.75% as anticipated. "Heightened trade tensions and US tariffs will likely increase inflationary pressures in Canada and curb growth," the BoC noted in its policy statement. After falling nearly 0.5% on Wednesday, USD/CAD stays trades marginally higher on the day, at around 1.4400.
EUR/USD corrected lower and lost about 0.3% on Wednesday. The pair struggles to gather bullish momentum and trades below 1.0900 in the European morning on Thursday.
GBP/USD failed to make a decisive move in either direction and ended the day virtually unchanged on Wednesday. The pair extends its sideways grind at around 1.2950 early Thursday.
The data from Australia showed early Thursday that Consumer Inflation Expectations declined to 3.6% in March from 4.6%. After posting small gains on Wednesday, AUD/USD edges lower and fluctuates near 0.6300 to begin the European session.
Following a two-day rebound, USD/JPY turns south early Thursday and trades below 148.00. Bank of Japan (BoJ) Governor Kazuo Ueda said on Thursday that Japan's underlying inflation is "still somewhat below 2%."
Gold managed to build on Tuesday's rebound and gained more than 0.5% on Wednesday. XAU/USD trades above $2,930 in the European morning.
Inflation FAQs
Inflation measures the rise in the price of a representative basket of goods and services. Headline inflation is usually expressed as a percentage change on a month-on-month (MoM) and year-on-year (YoY) basis. Core inflation excludes more volatile elements such as food and fuel which can fluctuate because of geopolitical and seasonal factors. Core inflation is the figure economists focus on and is the level targeted by central banks, which are mandated to keep inflation at a manageable level, usually around 2%.
The Consumer Price Index (CPI) measures the change in prices of a basket of goods and services over a period of time. It is usually expressed as a percentage change on a month-on-month (MoM) and year-on-year (YoY) basis. Core CPI is the figure targeted by central banks as it excludes volatile food and fuel inputs. When Core CPI rises above 2% it usually results in higher interest rates and vice versa when it falls below 2%. Since higher interest rates are positive for a currency, higher inflation usually results in a stronger currency. The opposite is true when inflation falls.
Although it may seem counter-intuitive, high inflation in a country pushes up the value of its currency and vice versa for lower inflation. This is because the central bank will normally raise interest rates to combat the higher inflation, which attract more global capital inflows from investors looking for a lucrative place to park their money.
Formerly, Gold was the asset investors turned to in times of high inflation because it preserved its value, and whilst investors will often still buy Gold for its safe-haven properties in times of extreme market turmoil, this is not the case most of the time. This is because when inflation is high, central banks will put up interest rates to combat it. Higher interest rates are negative for Gold because they increase the opportunity-cost of holding Gold vis-a-vis an interest-bearing asset or placing the money in a cash deposit account. On the flipside, lower inflation tends to be positive for Gold as it brings interest rates down, making the bright metal a more viable investment alternative.
-
07:25
ECB’s Nagel: US trade tariffs on the EU could push Germany into recession this year
European Central Bank (ECB) policymaker and Bundesbank President Joachim Nagel warned in a BBC News interview on Thursday, “US trade tariffs on the European Union (EU) could push Germany into recession this year.”
Meanwhile, a Chinese official urged the US to cancel tariffs on steel and aluminium.
Market reaction
Nagel’s comments keep the offered tone intact on the Euro, as the EUR/USD pair loses 0.10% on the day to trade at 1.0877.
Tariffs FAQs
Tariffs are customs duties levied on certain merchandise imports or a category of products. Tariffs are designed to help local producers and manufacturers be more competitive in the market by providing a price advantage over similar goods that can be imported. Tariffs are widely used as tools of protectionism, along with trade barriers and import quotas.
Although tariffs and taxes both generate government revenue to fund public goods and services, they have several distinctions. Tariffs are prepaid at the port of entry, while taxes are paid at the time of purchase. Taxes are imposed on individual taxpayers and businesses, while tariffs are paid by importers.
There are two schools of thought among economists regarding the usage of tariffs. While some argue that tariffs are necessary to protect domestic industries and address trade imbalances, others see them as a harmful tool that could potentially drive prices higher over the long term and lead to a damaging trade war by encouraging tit-for-tat tariffs.
During the run-up to the presidential election in November 2024, Donald Trump made it clear that he intends to use tariffs to support the US economy and American producers. In 2024, Mexico, China and Canada accounted for 42% of total US imports. In this period, Mexico stood out as the top exporter with $466.6 billion, according to the US Census Bureau. Hence, Trump wants to focus on these three nations when imposing tariffs. He also plans to use the revenue generated through tariffs to lower personal income taxes.
-
06:56
FX option expiries for Mar 13 NY cut
FX option expiries for Mar 13 NY cut at 10:00 Eastern Time via DTCC can be found below.
EUR/USD: EUR amounts
- 1.0775 892m
- 1.0800 1.9b
- 1.0850 1.2b
- 1.0860 1.1b
- 1.0955 1.2b
- 1.1000 966m
USD/JPY: USD amounts
- 146.00 735m
- 148.00 1.4b
USD/CHF: USD amounts
- 0..8820 530m
- 0.8935 600m
USD/CAD: USD amounts
- 1.4250 1b
- 1.4400 784m
EUR/GBP: EUR amounts
- 0.8450 402m
-
06:55
USD/CHF remains on the defensive near 0.8800 ahead of US PPI data
- USD/CHF remains weak around 0.8810 in Thursday’s early European session, down 0.15% on the day.
- US CPI data came in softer than expected in February.
- Traders await the US PPI inflation data, which is due later on Thursday.
The USD/CHF pair softens to near 0.8810 during the early European session on Thursday. The fear that US President Donald Trump’s protectionism will push the US economy into recession drags the US Dollar (USD) lower against the Swiss Franc (CHF). Investors will take more cues from the US February Producer Price Index (PPI) and the weekly Initial Jobless Claim, which will be released later on Thursday.
The US inflation, as measured by the Consumer Price Index (CPI), eased to 2.8% YoY in February from 3.0% in January, softer than the estimate of 2.9%, the Labor Statistics reported on Wednesday. Meanwhile, the core CPI inflation, excluding volatile food and energy categories, declined to 3.1% in February from 3.3% in the previous month.
On a monthly basis, the headline US CPI increased 0.2% in February after a sharp 0.5% advance in January, softer than the expectation of 0.3%. The core CPI, excluding volatile food and energy categories, rose 0.2% during the same reported period versus 0.4% prior.
With the economic outlook deteriorating because of tariffs, financial markets expect the US Federal Reserve (Fed) is expected to resume cutting rates in June after it paused its easing cycle in January. This, in turn, might continue to undermine the Greenback in the near term.
Additionally, heightened safe-haven demand amid growing concerns over global economic conditions and geopolitical tensions in the Middle East could boost the Swiss Franc (CHF) and create a headwind for USD/CHF. A Houthi spokesman said late Tuesday that they will attack any Israeli ship that violates the group's ban on Israeli ships passing through the Red and Arabian Seas, the Bab al-Mandab Strait, and the Gulf of Aden, effective immediately.Swiss Franc FAQs
The Swiss Franc (CHF) is Switzerland’s official currency. It is among the top ten most traded currencies globally, reaching volumes that well exceed the size of the Swiss economy. Its value is determined by the broad market sentiment, the country’s economic health or action taken by the Swiss National Bank (SNB), among other factors. Between 2011 and 2015, the Swiss Franc was pegged to the Euro (EUR). The peg was abruptly removed, resulting in a more than 20% increase in the Franc’s value, causing a turmoil in markets. Even though the peg isn’t in force anymore, CHF fortunes tend to be highly correlated with the Euro ones due to the high dependency of the Swiss economy on the neighboring Eurozone.
The Swiss Franc (CHF) is considered a safe-haven asset, or a currency that investors tend to buy in times of market stress. This is due to the perceived status of Switzerland in the world: a stable economy, a strong export sector, big central bank reserves or a longstanding political stance towards neutrality in global conflicts make the country’s currency a good choice for investors fleeing from risks. Turbulent times are likely to strengthen CHF value against other currencies that are seen as more risky to invest in.
The Swiss National Bank (SNB) meets four times a year – once every quarter, less than other major central banks – to decide on monetary policy. The bank aims for an annual inflation rate of less than 2%. When inflation is above target or forecasted to be above target in the foreseeable future, the bank will attempt to tame price growth by raising its policy rate. Higher interest rates are generally positive for the Swiss Franc (CHF) as they lead to higher yields, making the country a more attractive place for investors. On the contrary, lower interest rates tend to weaken CHF.
Macroeconomic data releases in Switzerland are key to assessing the state of the economy and can impact the Swiss Franc’s (CHF) valuation. The Swiss economy is broadly stable, but any sudden change in economic growth, inflation, current account or the central bank’s currency reserves have the potential to trigger moves in CHF. Generally, high economic growth, low unemployment and high confidence are good for CHF. Conversely, if economic data points to weakening momentum, CHF is likely to depreciate.
As a small and open economy, Switzerland is heavily dependent on the health of the neighboring Eurozone economies. The broader European Union is Switzerland’s main economic partner and a key political ally, so macroeconomic and monetary policy stability in the Eurozone is essential for Switzerland and, thus, for the Swiss Franc (CHF). With such dependency, some models suggest that the correlation between the fortunes of the Euro (EUR) and the CHF is more than 90%, or close to perfect.
-
05:45
USD/MXN Price Forecast: Resumes downside under 100-day EMA below 20.50
- USD/MXN trades in positive territory around 20.20 in Thursday’s early European session.
- The pair resumes its downside as the pair is below the 100-day EMA with a bearish RSI indicator.
- The first downside target to watch is the 20.10-20.00 region; the immediate resistance level emerges at 20.40.
The USD/MXN pair edges higher to near 20.20 during the early European session on Thursday, bolstered by a modest recovery of the US Dollar (USD). However, Mexico’s strong external accounts, including a trade surplus and robust remittances, might boost the Mexican Peso (MXN) and create a headwind for the pair in the near term.
Technically, EUR/USD resumes its downside journey after crossing below the key 100-day Exponential Moving Average (EMA) on the daily chart. Additionally, the downward momentum is supported by the 14-day Relative Strength Index (RSI), which is located below the midline around 41.40, indicating that the path to the least resistance level is to the downside.
The initial support level for USD/MXN emerges at the 20.10-20.00 zone, representing the lower limit of the Bollinger Band and the psychological level. A breach of this level could expose 19.25, the low of October 11, 2024. Extended losses could push prices lower toward 18.60, the low of October 16, 2024.
On the upside, the first upside barrier is seen at 20.40, the high of March 11. Sustained bullish momentum could see a rally to 20.66, the upper boundary of the Bollinger Band. Further north, the next hurdle to watch is the 21.00 psychological level.USD/MXN daily chart
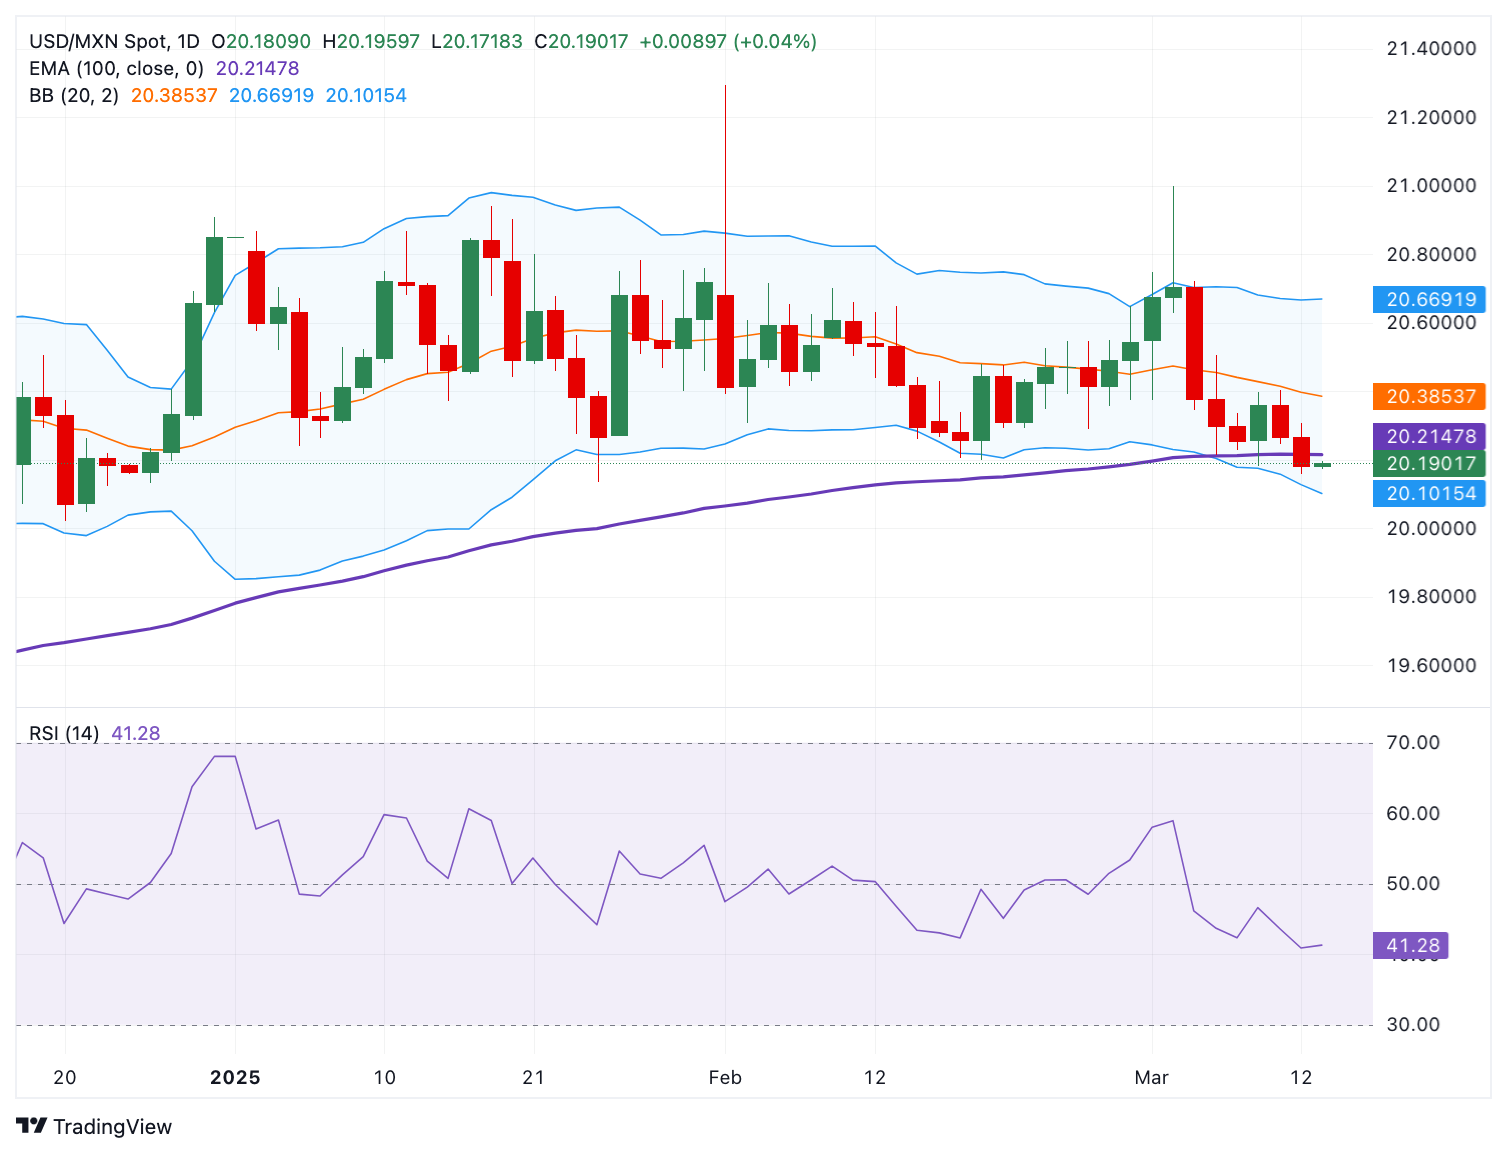
Mexican Peso FAQs
The Mexican Peso (MXN) is the most traded currency among its Latin American peers. Its value is broadly determined by the performance of the Mexican economy, the country’s central bank’s policy, the amount of foreign investment in the country and even the levels of remittances sent by Mexicans who live abroad, particularly in the United States. Geopolitical trends can also move MXN: for example, the process of nearshoring – or the decision by some firms to relocate manufacturing capacity and supply chains closer to their home countries – is also seen as a catalyst for the Mexican currency as the country is considered a key manufacturing hub in the American continent. Another catalyst for MXN is Oil prices as Mexico is a key exporter of the commodity.
The main objective of Mexico’s central bank, also known as Banxico, is to maintain inflation at low and stable levels (at or close to its target of 3%, the midpoint in a tolerance band of between 2% and 4%). To this end, the bank sets an appropriate level of interest rates. When inflation is too high, Banxico will attempt to tame it by raising interest rates, making it more expensive for households and businesses to borrow money, thus cooling demand and the overall economy. Higher interest rates are generally positive for the Mexican Peso (MXN) as they lead to higher yields, making the country a more attractive place for investors. On the contrary, lower interest rates tend to weaken MXN.
Macroeconomic data releases are key to assess the state of the economy and can have an impact on the Mexican Peso (MXN) valuation. A strong Mexican economy, based on high economic growth, low unemployment and high confidence is good for MXN. Not only does it attract more foreign investment but it may encourage the Bank of Mexico (Banxico) to increase interest rates, particularly if this strength comes together with elevated inflation. However, if economic data is weak, MXN is likely to depreciate.
As an emerging-market currency, the Mexican Peso (MXN) tends to strive during risk-on periods, or when investors perceive that broader market risks are low and thus are eager to engage with investments that carry a higher risk. Conversely, MXN tends to weaken at times of market turbulence or economic uncertainty as investors tend to sell higher-risk assets and flee to the more-stable safe havens.
-
05:41
US Dollar Index Price Forecast: Tests immediate support at 103.50 near four-month lows
- The US Dollar Index may test its primary support at the four-month low of 103.34.
- The 14-day RSI remains below 30, indicating oversold conditions and the potential for an upward correction.
- On the upside, initial resistance is seen at the nine-day EMA at 104.34.
The US Dollar Index (DXY), which measures the value of the US Dollar (USD) against its six major peers, remains steady after registering gains in the previous session, trading around 103.60 during the Asian hours on Thursday. However, the technical analysis of the daily chart indicates a persistent bearish bias, with the index moving downwards within a descending channel pattern.
The US Dollar Index is trading below the nine- and 50-day Exponential Moving Averages (EMAs), indicating a weakening short- and medium-term trend. However, the 14-day Relative Strength Index (RSI) remains below 30, suggesting oversold conditions and the potential for an upward correction.
On the downside, the US Dollar Index may test its primary support at the four-month low of 103.34, recorded on November 6, followed by the lower boundary of the descending channel at 103.00. A break below this critical support zone could strengthen the bearish outlook, pushing the index toward the five-month low of 100.68.
The DXY may encounter initial resistance at the nine-day EMA at 104.34. A break above this level could strengthen short-term price momentum, pushing the index toward the 50-day EMA at 106.44, followed by the upper boundary of the descending channel at 106.70.
US Dollar Index: Daily Chart
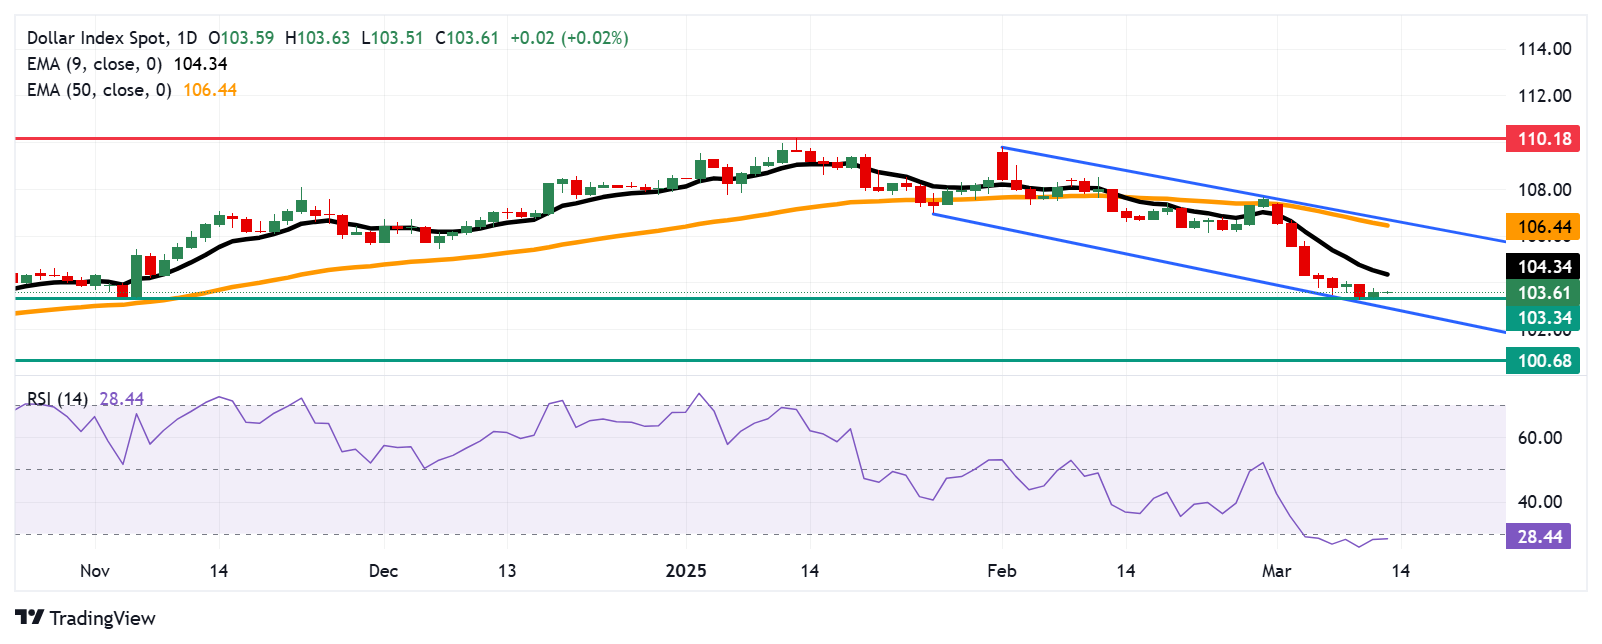
US Dollar PRICE Today
The table below shows the percentage change of US Dollar (USD) against listed major currencies today. US Dollar was the strongest against the Australian Dollar.
USD EUR GBP JPY CAD AUD NZD CHF USD 0.07% 0.07% -0.34% 0.17% 0.29% 0.12% -0.07% EUR -0.07% 0.00% -0.40% 0.09% 0.23% 0.08% -0.14% GBP -0.07% -0.01% -0.40% 0.09% 0.22% 0.07% -0.11% JPY 0.34% 0.40% 0.40% 0.47% 0.63% 0.46% 0.30% CAD -0.17% -0.09% -0.09% -0.47% 0.15% -0.02% -0.21% AUD -0.29% -0.23% -0.22% -0.63% -0.15% -0.15% -0.31% NZD -0.12% -0.08% -0.07% -0.46% 0.02% 0.15% -0.15% CHF 0.07% 0.14% 0.11% -0.30% 0.21% 0.31% 0.15% The heat map shows percentage changes of major currencies against each other. The base currency is picked from the left column, while the quote currency is picked from the top row. For example, if you pick the US Dollar from the left column and move along the horizontal line to the Japanese Yen, the percentage change displayed in the box will represent USD (base)/JPY (quote).
-
05:31
USD/CAD Price Forecast: Advances to 1.4400 neighborhood; lacks bullish conviction
- USD/CAD regains positive traction and draws support from a combination of factors.
- Fed rate cut bets continue to undermine the USD and cap the upside for the major.
- The mixed technical setup warrants caution before placing aggressive directional bets.
The USD/CAD pair attracts some dip-buyers in the vicinity of mid-1.4300s during the Asian session on Thursday and reverses a part of the previous day's losses. Spot prices climb to the 1.4400 neighborhood in the last hour, though a combination of factors might keep a lid on any meaningful upside.
The Canadian Dollar (CAD) continues to be weighed down by the Bank of Canada's (BoC) seventh consecutive interest rate cut on Wednesday and the escalating US-Canada trade war. Apart from this, the lack of follow-through buying around Crude Oil prices undermines the commodity-linked Loonie and acts as a tailwind for the USD/CAD pair. However, the underlying bearish tone around the US Dollar (USD), amid bets that the Federal Reserve (Fed) will cut rates several times this year, caps the upside for the currency pair.
From a technical perspective, the USD/CAD pair, so far, has been struggling to find acceptance above the 1.4500 psychological mark and the subsequent slide warrants caution for bullish traders. That said, positive oscillators on the daily chart suggest that any further decline is likely to find decent support near the 100-period Simple Moving Average (SMA) on the 4-hour chart, currently pegged around the 1.4345 area. A sustained break below, however, might prompt aggressive selling and pave the way for deeper losses.
The USD/CAD pair might then weaken further below the 100-day SMA, around the 1.4215 area, the 1.4200 mark, towards testing the year-to-date low, around the 1.4150 region set on February 14. Spot prices could eventually drop to the 1.4100 round-figure mark.
On the flip side, a sustained strength beyond the 1.4500 mark could allow the USD/CAD pair to test the monthly swing high, around the 1.4540-1.4545 region. Some follow-through buying could lift spot prices to the 1.4600 round figure en route to the 1.4670 region and the 1.4700 mark. The momentum could extend further towards the 1.4800 neighborhood, or the highest level since April 2003 touched last month.
USD/CAD 4-hour chart
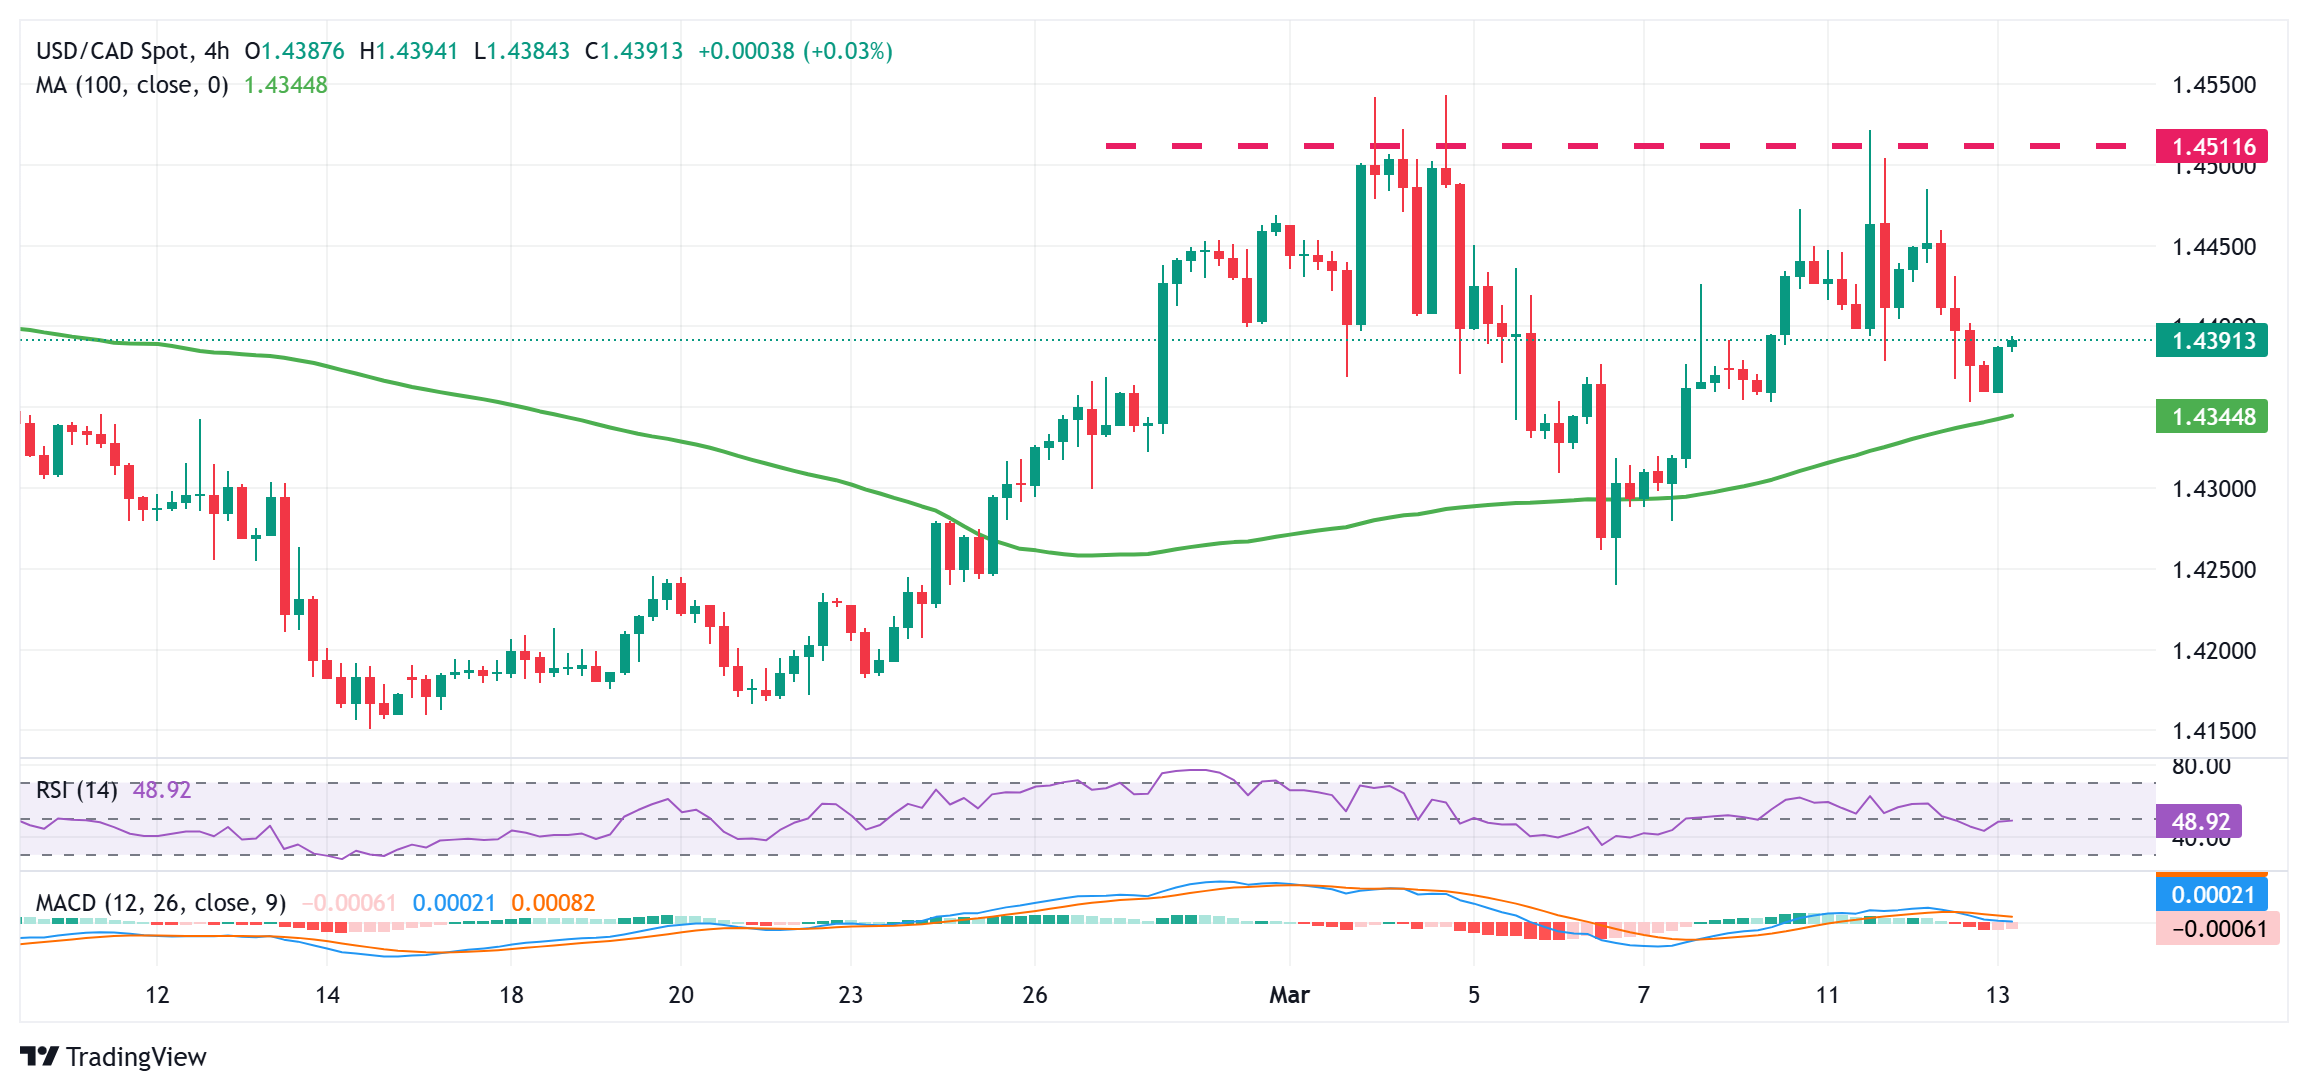
Canadian Dollar FAQs
The key factors driving the Canadian Dollar (CAD) are the level of interest rates set by the Bank of Canada (BoC), the price of Oil, Canada’s largest export, the health of its economy, inflation and the Trade Balance, which is the difference between the value of Canada’s exports versus its imports. Other factors include market sentiment – whether investors are taking on more risky assets (risk-on) or seeking safe-havens (risk-off) – with risk-on being CAD-positive. As its largest trading partner, the health of the US economy is also a key factor influencing the Canadian Dollar.
The Bank of Canada (BoC) has a significant influence on the Canadian Dollar by setting the level of interest rates that banks can lend to one another. This influences the level of interest rates for everyone. The main goal of the BoC is to maintain inflation at 1-3% by adjusting interest rates up or down. Relatively higher interest rates tend to be positive for the CAD. The Bank of Canada can also use quantitative easing and tightening to influence credit conditions, with the former CAD-negative and the latter CAD-positive.
The price of Oil is a key factor impacting the value of the Canadian Dollar. Petroleum is Canada’s biggest export, so Oil price tends to have an immediate impact on the CAD value. Generally, if Oil price rises CAD also goes up, as aggregate demand for the currency increases. The opposite is the case if the price of Oil falls. Higher Oil prices also tend to result in a greater likelihood of a positive Trade Balance, which is also supportive of the CAD.
While inflation had always traditionally been thought of as a negative factor for a currency since it lowers the value of money, the opposite has actually been the case in modern times with the relaxation of cross-border capital controls. Higher inflation tends to lead central banks to put up interest rates which attracts more capital inflows from global investors seeking a lucrative place to keep their money. This increases demand for the local currency, which in Canada’s case is the Canadian Dollar.
Macroeconomic data releases gauge the health of the economy and can have an impact on the Canadian Dollar. Indicators such as GDP, Manufacturing and Services PMIs, employment, and consumer sentiment surveys can all influence the direction of the CAD. A strong economy is good for the Canadian Dollar. Not only does it attract more foreign investment but it may encourage the Bank of Canada to put up interest rates, leading to a stronger currency. If economic data is weak, however, the CAD is likely to fall.
-
04:47
EUR/USD weakens below 1.0900 on trade tensions
- EUR/USD trades in negative territory around 1.0880 in Thursday’s Asian session.
- The growing trade war between the US and EU undermines the shared currency.
- Investors will closely watch the US February PPI and the weekly Initial Jobless Claim data, which are due later on Wednesday.
The EUR/USD pair loses ground to around 1.0880 during the Asian trading hours on Thursday. The escalating trade tension between the United States and the European Union (EU) exerts some selling pressure on the Euro (EUR) against the Greenback. Traders will take more cues from the US February Producer Price Index (PPI) and the weekly Initial Jobless Claim data, which are due later on Wednesday.
US President Donald Trump said the US would respond to the EU’s countermeasures against his new 25% tariffs on steel and aluminum, raising the risk of further escalation in his global trade war. The European Commission announced retaliatory tariffs Wednesday, saying that its tariffs would apply to US goods worth up to 26 billion euros ($28.4 billion) and cover a wide variety of items, including boats, bourbon, and motorbikes. This measure would take effect on April 1, and a second set of countermeasures expected in mid-April.
However, the downside for the major pair might be capped amid the fear that Trump’s protectionism will push the US economy into recession, weighing on the USD.
"We were also going to get an inflation update, which we did, and inflation is still pretty sticky and it came lighter than expected. I think it was a little bit of a relief for the marketplace, so it improved sentiment. But sentiment is on a very short leash and it can change so quickly based on the headline risks,”said Amarjit Sahota, executive director at Klarity FX in San Francisco.Euro FAQs
The Euro is the currency for the 19 European Union countries that belong to the Eurozone. It is the second most heavily traded currency in the world behind the US Dollar. In 2022, it accounted for 31% of all foreign exchange transactions, with an average daily turnover of over $2.2 trillion a day. EUR/USD is the most heavily traded currency pair in the world, accounting for an estimated 30% off all transactions, followed by EUR/JPY (4%), EUR/GBP (3%) and EUR/AUD (2%).
The European Central Bank (ECB) in Frankfurt, Germany, is the reserve bank for the Eurozone. The ECB sets interest rates and manages monetary policy. The ECB’s primary mandate is to maintain price stability, which means either controlling inflation or stimulating growth. Its primary tool is the raising or lowering of interest rates. Relatively high interest rates – or the expectation of higher rates – will usually benefit the Euro and vice versa. The ECB Governing Council makes monetary policy decisions at meetings held eight times a year. Decisions are made by heads of the Eurozone national banks and six permanent members, including the President of the ECB, Christine Lagarde.
Eurozone inflation data, measured by the Harmonized Index of Consumer Prices (HICP), is an important econometric for the Euro. If inflation rises more than expected, especially if above the ECB’s 2% target, it obliges the ECB to raise interest rates to bring it back under control. Relatively high interest rates compared to its counterparts will usually benefit the Euro, as it makes the region more attractive as a place for global investors to park their money.
Data releases gauge the health of the economy and can impact on the Euro. Indicators such as GDP, Manufacturing and Services PMIs, employment, and consumer sentiment surveys can all influence the direction of the single currency. A strong economy is good for the Euro. Not only does it attract more foreign investment but it may encourage the ECB to put up interest rates, which will directly strengthen the Euro. Otherwise, if economic data is weak, the Euro is likely to fall. Economic data for the four largest economies in the euro area (Germany, France, Italy and Spain) are especially significant, as they account for 75% of the Eurozone’s economy.
Another significant data release for the Euro is the Trade Balance. This indicator measures the difference between what a country earns from its exports and what it spends on imports over a given period. If a country produces highly sought after exports then its currency will gain in value purely from the extra demand created from foreign buyers seeking to purchase these goods. Therefore, a positive net Trade Balance strengthens a currency and vice versa for a negative balance.
-
04:41
Gold price eyes record high amid rising trade tensions, Fed rate cut bets
- Gold price attracts buyers for the third straight day and advances to over a two-week high.
- Trade war fears, Fed rate cut bets, and a bearish USD support the precious metal’s upward momentum.
- Traders now look forward to the release of the US PPI report for additional impetus.
Gold price (XAU/USD) trades with a positive bias for the third consecutive day and climbs to over a two-week high, around the $2,942-2,943 region during the Asian session on Thursday. Concerns about rising trade tensions and the potential economic slowdown in the wake of US President Donald Trump's tariffs continue to act as a tailwind for the safe-haven bullion. Apart from this, the growing acceptance that the Federal Reserve (Fed) will cut interest rates several times this year turns out to be another factor benefiting the lower-yielding yellow metal.
The softer-than-expected US consumer inflation figures released on Wednesday come on top of signs of a cooling labor market. Adding to this, fears of an economic downturn on the back of the uncertainty surrounding Trump's policies might force the Federal Reserve (Fed) to resume its rate-cutting cycle in June. This keeps the US Dollar (USD) depressed near its lowest level since October 16 touched on Tuesday and lends additional support to the Gold price. That said, a generally positive risk tone could act as a headwind for the XAU/USD pair.
Daily Digest Market Movers: Gold price is underpinned by a combination of supporting factors
- The uncertainty surrounding US President Donald Trump's aggressive trade tariffs fuels concerns about the potential economic slowdown and continues to push investors toward traditional safe-haven assets.
- Trump's 25% tariff on all steel and aluminum imports took effect on Wednesday. Moreover, Trump threatened that he would respond to any countermeasures announced by the European Union and Canada.
- The European Commission on Wednesday said that the EU will impose tariffs on $28 billion worth of US goods from next month, while Canada announced 25% tariffs on more than $20 billion worth of US goods.
- Adding to this, a cooler US inflation report released on Wednesday lifted market bets for three 25-basis-point rate cuts each by the Federal Reserve at the June, July, and October monetary policy meetings.
- A report published by the US Bureau of Labor Statistics (BLS) showed that the headline Consumer Price Index (CPI) eased more than expected, to the 2.8% YoY rate in February from 3% in the previous month.
- Adding to this, the core gauge, which excludes volatile food and energy prices, rose 3.1% on a yearly basis during the reported month, marking a slowdown from the 3.3% increase registered in January.
- The US Dollar Index, which measures the Greenback against a basket of currencies, languishes near its lowest level since October 16, pushing the Gold price higher for the third straight day on Thursday.
- Traders now look forward to the US economic docket, featuring the release of the Producer Price Index (PPI), for a fresh impetus and to grab short-term opportunities later during the North American session.
Gold price technical setup favors bulls and supports prospects for move towards testing record high, around $2,956
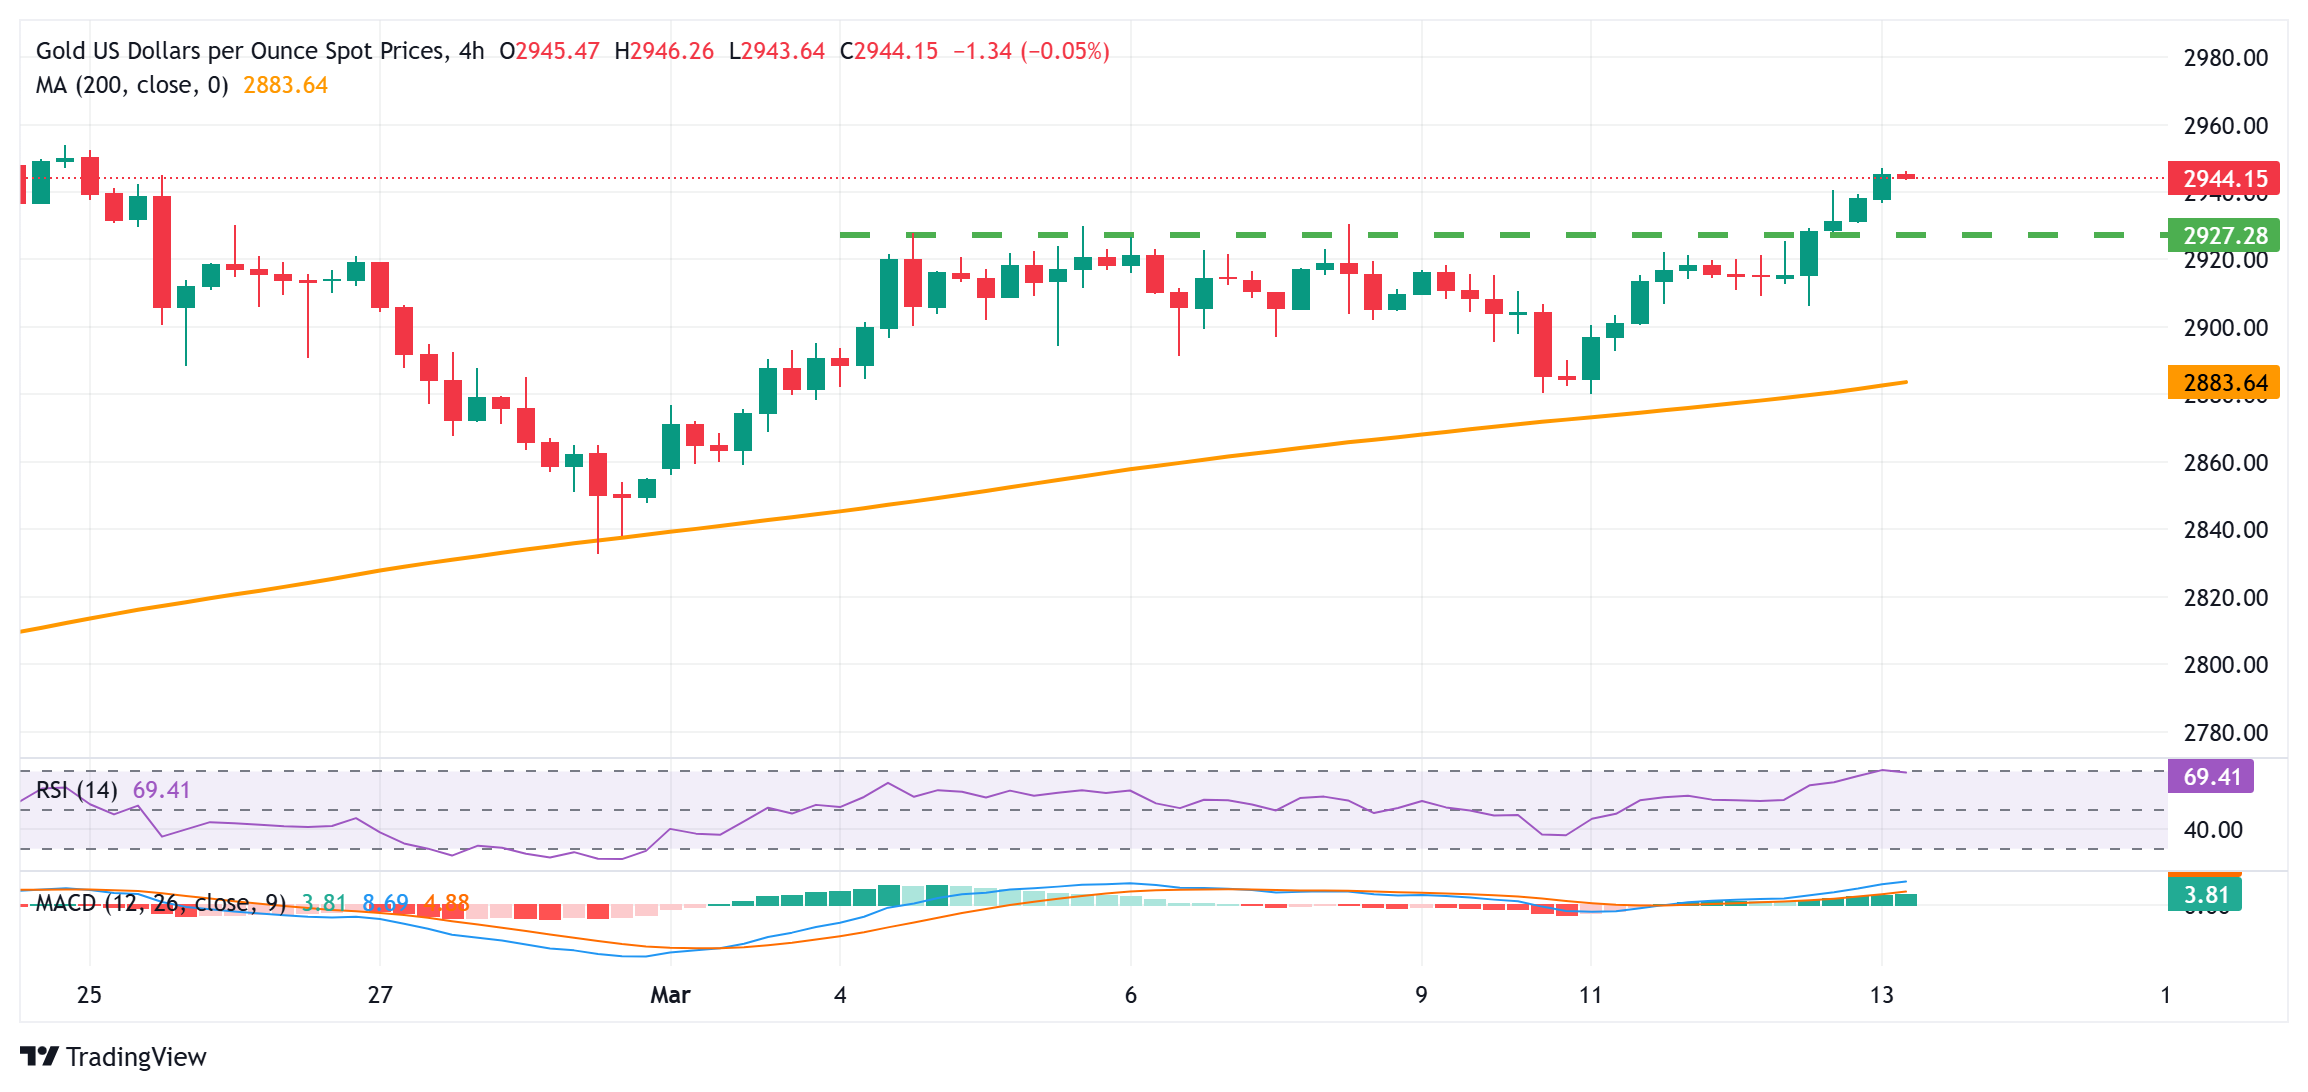
From a technical perspective, the overnight sustained move beyond the $2,928-2,930 horizontal barrier supports prospects for a move towards challenging the all-time peak, around the $2,956 area touched on February 24. Given that oscillators on the daily chart are holding comfortably in positive territory and are still away from being in the overbought zone, some follow-through buying will be seen as a fresh trigger for bulls. This, in turn, will set the stage for an extension of the recent well-established uptrend witnessed over the past three months or so.
On the flip side, the $2,930-2,828 resistance breakpoint now seems to protect the immediate downside, below which the Gold price could accelerate the slide back towards the $2,912-2,910 intermediate support en route to the $2,900 round figure. This is followed by the weekly low, around the $2,800 region. This is followed by the $2,860 zone, which if broken decisively could pave the way for deeper losses. The XAU/USD pair might then slide towards the late February swing low, around the $2,833-2,832 region, before eventually dropping to the $2,800 mark.
Gold FAQs
Gold has played a key role in human’s history as it has been widely used as a store of value and medium of exchange. Currently, apart from its shine and usage for jewelry, the precious metal is widely seen as a safe-haven asset, meaning that it is considered a good investment during turbulent times. Gold is also widely seen as a hedge against inflation and against depreciating currencies as it doesn’t rely on any specific issuer or government.
Central banks are the biggest Gold holders. In their aim to support their currencies in turbulent times, central banks tend to diversify their reserves and buy Gold to improve the perceived strength of the economy and the currency. High Gold reserves can be a source of trust for a country’s solvency. Central banks added 1,136 tonnes of Gold worth around $70 billion to their reserves in 2022, according to data from the World Gold Council. This is the highest yearly purchase since records began. Central banks from emerging economies such as China, India and Turkey are quickly increasing their Gold reserves.
Gold has an inverse correlation with the US Dollar and US Treasuries, which are both major reserve and safe-haven assets. When the Dollar depreciates, Gold tends to rise, enabling investors and central banks to diversify their assets in turbulent times. Gold is also inversely correlated with risk assets. A rally in the stock market tends to weaken Gold price, while sell-offs in riskier markets tend to favor the precious metal.
The price can move due to a wide range of factors. Geopolitical instability or fears of a deep recession can quickly make Gold price escalate due to its safe-haven status. As a yield-less asset, Gold tends to rise with lower interest rates, while higher cost of money usually weighs down on the yellow metal. Still, most moves depend on how the US Dollar (USD) behaves as the asset is priced in dollars (XAU/USD). A strong Dollar tends to keep the price of Gold controlled, whereas a weaker Dollar is likely to push Gold prices up.
-
04:38
EUR/JPY falls to near 161.00 as global trade war weigh on market sentiment
- EUR/JPY declines as the Japanese Yen strengthens on increased safe-haven demand.
- The Bank of Japan is widely expected to raise interest rates in 2025, supported by sustained wage growth and inflation.
- The Euro faces pressure as market sentiment weakens following the EU retaliatory tariffs on the United States.
EUR/JPY declines after two consecutive sessions of gains, trading around 161.10 during Asian hours on Thursday. The weakness of the currency cross is driven by a stronger Japanese Yen (JPY), which is benefiting from increased safe-haven demand.
The JPY remains supported by expectations that the Bank of Japan (BoJ) will continue raising interest rates this year, given persistent wage growth and inflation. BoJ Governor Ueda highlighted that long-term interest rates naturally adjust based on market expectations for future short-term rates, emphasizing the importance of clear communication on policy decisions.
On Wednesday, Japanese firms agreed to substantial wage hikes for the third straight year, aiming to help workers manage inflation and address labor shortages. Higher wages are expected to boost consumer spending, drive inflation, and give the BoJ more room for rate hikes.
However, Japanese Finance Minister Shunichi Kato cautioned on Thursday that Japan has yet to permanently overcome deflation, noting that the country's economy is facing a supply shortage rather than weak demand.
Additionally, the EUR/JPY cross faces pressure as the Euro (EUR) struggles amid dampened market sentiment following the European Union’s (EU) retaliatory tariffs on the United States (US). The US imposed a 25% tariff on European steel and aluminum, prompting the EU to respond with tariffs on €26 billion worth of US goods in April.
Traders remain cautious as Germany’s plans for a significant increase in state borrowing encounter new hurdles. On Wednesday, a co-leader of the Greens party remained non-committal about reaching a deal, while the far-left party filed another legal challenge.
Meanwhile, election winner Friedrich Merz is pushing to pass debt reforms and establish a €500 billion ($545 billion) infrastructure fund before the outgoing parliament dissolves. The success of these plans depends on support from the Greens and could also face potential roadblocks from court rulings, according to Reuters.
Risk sentiment FAQs
In the world of financial jargon the two widely used terms “risk-on” and “risk off'' refer to the level of risk that investors are willing to stomach during the period referenced. In a “risk-on” market, investors are optimistic about the future and more willing to buy risky assets. In a “risk-off” market investors start to ‘play it safe’ because they are worried about the future, and therefore buy less risky assets that are more certain of bringing a return, even if it is relatively modest.
Typically, during periods of “risk-on”, stock markets will rise, most commodities – except Gold – will also gain in value, since they benefit from a positive growth outlook. The currencies of nations that are heavy commodity exporters strengthen because of increased demand, and Cryptocurrencies rise. In a “risk-off” market, Bonds go up – especially major government Bonds – Gold shines, and safe-haven currencies such as the Japanese Yen, Swiss Franc and US Dollar all benefit.
The Australian Dollar (AUD), the Canadian Dollar (CAD), the New Zealand Dollar (NZD) and minor FX like the Ruble (RUB) and the South African Rand (ZAR), all tend to rise in markets that are “risk-on”. This is because the economies of these currencies are heavily reliant on commodity exports for growth, and commodities tend to rise in price during risk-on periods. This is because investors foresee greater demand for raw materials in the future due to heightened economic activity.
The major currencies that tend to rise during periods of “risk-off” are the US Dollar (USD), the Japanese Yen (JPY) and the Swiss Franc (CHF). The US Dollar, because it is the world’s reserve currency, and because in times of crisis investors buy US government debt, which is seen as safe because the largest economy in the world is unlikely to default. The Yen, from increased demand for Japanese government bonds, because a high proportion are held by domestic investors who are unlikely to dump them – even in a crisis. The Swiss Franc, because strict Swiss banking laws offer investors enhanced capital protection.
-
04:35
India Gold price today: Gold rises, according to FXStreet data
Gold prices rose in India on Thursday, according to data compiled by FXStreet.
The price for Gold stood at 8,241.26 Indian Rupees (INR) per gram, up compared with the INR 8,211.09 it cost on Wednesday.
The price for Gold increased to INR 96,124.48 per tola from INR 95,772.53 per tola a day earlier.
Unit measure Gold Price in INR 1 Gram 8,241.26 10 Grams 82,412.64 Tola 96,124.48 Troy Ounce 256,332.10 Daily digest market movers: Gold price shrugs of high US yields
-
The US 10-year Treasury bond yield recovers and rises three basis points to 4.314%.
-
US real yields, as measured by the US 10-year Treasury Inflation-Protected Securities (TIPS) yield that correlates inversely to Gold prices, climb one basis points to 1.981%, capping non-yielding metal gains.
-
The US Consumer Price Index (CPI) for February increased 2.8% YoY, slightly below the expected 2.9% and down from 3.0% in January, indicating continued moderation in inflation.
-
Core CPI, which strips out volatile food and energy prices, dipped from 3.3% in January to 3.1% YoY, reinforcing signs of continued disinflation in the U.S. economy.
-
The Atlanta Fed GDPNow model predicts the first quarter of 2025 at -2.4%, which would be the first negative print since the COVID-19 pandemic.
-
Money market traders had priced in 71 basis points of easing in 2025, down from 77 bps a day ago, via data from Prime Market Terminal.
FXStreet calculates Gold prices in India by adapting international prices (USD/INR) to the local currency and measurement units. Prices are updated daily based on the market rates taken at the time of publication. Prices are just for reference and local rates could diverge slightly.
Gold FAQs
Gold has played a key role in human’s history as it has been widely used as a store of value and medium of exchange. Currently, apart from its shine and usage for jewelry, the precious metal is widely seen as a safe-haven asset, meaning that it is considered a good investment during turbulent times. Gold is also widely seen as a hedge against inflation and against depreciating currencies as it doesn’t rely on any specific issuer or government.
Central banks are the biggest Gold holders. In their aim to support their currencies in turbulent times, central banks tend to diversify their reserves and buy Gold to improve the perceived strength of the economy and the currency. High Gold reserves can be a source of trust for a country’s solvency. Central banks added 1,136 tonnes of Gold worth around $70 billion to their reserves in 2022, according to data from the World Gold Council. This is the highest yearly purchase since records began. Central banks from emerging economies such as China, India and Turkey are quickly increasing their Gold reserves.
Gold has an inverse correlation with the US Dollar and US Treasuries, which are both major reserve and safe-haven assets. When the Dollar depreciates, Gold tends to rise, enabling investors and central banks to diversify their assets in turbulent times. Gold is also inversely correlated with risk assets. A rally in the stock market tends to weaken Gold price, while sell-offs in riskier markets tend to favor the precious metal.
The price can move due to a wide range of factors. Geopolitical instability or fears of a deep recession can quickly make Gold price escalate due to its safe-haven status. As a yield-less asset, Gold tends to rise with lower interest rates, while higher cost of money usually weighs down on the yellow metal. Still, most moves depend on how the US Dollar (USD) behaves as the asset is priced in dollars (XAU/USD). A strong Dollar tends to keep the price of Gold controlled, whereas a weaker Dollar is likely to push Gold prices up.
(An automation tool was used in creating this post.)
-
-
03:48
GBP/USD maintains position above 1.2950 near four-month highs
- GBP/USD pair reached to four-month high of 1.2989 on March 13.
- The US Dollar could further depreciate as recent US inflation data fueled expectations of the Fed delivering rate cuts soon.
- RICS Housing Price Balance fell to 11% in February, marking its second consecutive decline.
GBP/USD attempts to extend its gains for the third successive day, trading around 1.2960 during the Asian session on Thursday. The GBP/USD pair rises as the US Dollar (USD) faces headwinds amid ongoing tariff uncertainty from US President Donald Trump and growing concerns over a potential US recession.
The Greenback may further lose ground as the US inflation cooled more than anticipated in February, raising speculation that the Federal Reserve (Fed) might cut interest rates sooner than expected. Market participants are now awaiting Thursday’s US Producer Price Index (PPI) data and weekly jobless claims for further economic cues.
US monthly headline inflation slowed to 0.2% in February from 0.5% in January, while core inflation eased to 0.2%, below the forecasted 0.3%. On an annual basis, headline inflation declined to 2.8% from 3.0%, while core inflation slipped to 3.1% from 3.3%.
In the United Kingdom (UK), the latest Residential Market Survey by RICS showed that the Housing Price Balance dropped to 11% in February, marking its second consecutive decline. This figure fell short of market expectations of 20% and was lower than January’s 21% reading.
UK Prime Minister Keir Starmer expressed optimism that Britain could avoid US tariffs on steel and aluminum, emphasizing a "pragmatic approach" in negotiations while keeping all options open. Unlike the European Union (EU), which has signaled immediate retaliation against Trump’s tariffs, the UK reaffirmed its commitment to trade talks with the United States (US).
Meanwhile, the UK’s 10-year gilt yield surged to 4.68%, its highest level in two months, as expectations grew that the Bank of England (BoE) will maintain elevated interest rates for a prolonged period. Traders now anticipate just a 52 basis point (bps) rate cut in 2025, scaling back earlier forecasts for more aggressive easing. Investors are now looking ahead to Friday’s UK monthly GDP data for January, which could provide further insights into the country’s economic outlook.
Pound Sterling FAQs
The Pound Sterling (GBP) is the oldest currency in the world (886 AD) and the official currency of the United Kingdom. It is the fourth most traded unit for foreign exchange (FX) in the world, accounting for 12% of all transactions, averaging $630 billion a day, according to 2022 data. Its key trading pairs are GBP/USD, also known as ‘Cable’, which accounts for 11% of FX, GBP/JPY, or the ‘Dragon’ as it is known by traders (3%), and EUR/GBP (2%). The Pound Sterling is issued by the Bank of England (BoE).
The single most important factor influencing the value of the Pound Sterling is monetary policy decided by the Bank of England. The BoE bases its decisions on whether it has achieved its primary goal of “price stability” – a steady inflation rate of around 2%. Its primary tool for achieving this is the adjustment of interest rates. When inflation is too high, the BoE will try to rein it in by raising interest rates, making it more expensive for people and businesses to access credit. This is generally positive for GBP, as higher interest rates make the UK a more attractive place for global investors to park their money. When inflation falls too low it is a sign economic growth is slowing. In this scenario, the BoE will consider lowering interest rates to cheapen credit so businesses will borrow more to invest in growth-generating projects.
Data releases gauge the health of the economy and can impact the value of the Pound Sterling. Indicators such as GDP, Manufacturing and Services PMIs, and employment can all influence the direction of the GBP. A strong economy is good for Sterling. Not only does it attract more foreign investment but it may encourage the BoE to put up interest rates, which will directly strengthen GBP. Otherwise, if economic data is weak, the Pound Sterling is likely to fall.
Another significant data release for the Pound Sterling is the Trade Balance. This indicator measures the difference between what a country earns from its exports and what it spends on imports over a given period. If a country produces highly sought-after exports, its currency will benefit purely from the extra demand created from foreign buyers seeking to purchase these goods. Therefore, a positive net Trade Balance strengthens a currency and vice versa for a negative balance.
-
03:28
BoJ’s Ueda: Underlying inflation is still somewhat below 2%
Bank of Japan (BoJ) Governor Kazuo Ueda said on Thursday that the “underlying inflation is still somewhat below 2%.”
Additional takeaways
Expect underlying inflation to gradually accelerate as economy continues to recover.
The BoJ is gradually shrinking size of its balance sheet, like to spend time scrutinising what eventual, ideal size will be taking into account overseas examples.
Size of Japan’s monetary base, balance sheet somewhat too big now, which is why we are slowing bond buying.
Market reaction
USD/JPY was last seen trading 0.03% higher on the day at 148.20.
-
02:54
Silver Price Forecast: XAG/USD rises to near five-month highs, $33.50 level
- Silver price climbs to a near five-month high of $33.40, last seen on February 14.
- Demand for the safe-haven metal strengthens amid escalating trade tensions and growing fears of a potential US recession.
- Silver also gains momentum as softer US inflation data fuels speculation of the Fed delivering further rate cuts soon.
Silver price (XAG/USD) continues its upward momentum for the third consecutive session, hovering around $33.30 per troy ounce during Asian trading hours on Thursday. The precious metal benefits from growing safe-haven demand amid escalating trade tensions and mounting concerns over a potential United States (US) recession.
Trade tensions intensified after US President Donald Trump imposed higher tariffs on steel and aluminum imports, heightening economic uncertainty and boosting Silver’s appeal as a safe-haven asset. Trump also described the economy as being in a "transition period," signaling a possible slowdown. Investors interpreted his comments as an early warning of potential economic turbulence ahead.
The non-interest-bearing commodities including Silver gained traction as the US inflation cooled more than anticipated in February, raising speculation that the Federal Reserve (Fed) might cut interest rates sooner than expected.
US monthly headline inflation slowed to 0.2% in February from 0.5% in January, while core inflation eased to 0.2%, below the forecasted 0.3%. On an annual basis, headline inflation declined to 2.8% from 3.0%, while core inflation slipped to 3.1% from 3.3%. Market participants are now awaiting Thursday’s US Producer Price Index (PPI) data and weekly jobless claims for further economic cues.
Additionally, demand for dollar-denominated Silver could rise as the US Dollar (USD) remains under pressure due to cooling inflation. A weaker Greenback makes commodities more affordable for foreign buyers. At the time of writing, the US Dollar Index (DXY), which measures the USD against six major currencies, remains steady around 103.50.
Silver FAQs
Silver is a precious metal highly traded among investors. It has been historically used as a store of value and a medium of exchange. Although less popular than Gold, traders may turn to Silver to diversify their investment portfolio, for its intrinsic value or as a potential hedge during high-inflation periods. Investors can buy physical Silver, in coins or in bars, or trade it through vehicles such as Exchange Traded Funds, which track its price on international markets.
Silver prices can move due to a wide range of factors. Geopolitical instability or fears of a deep recession can make Silver price escalate due to its safe-haven status, although to a lesser extent than Gold's. As a yieldless asset, Silver tends to rise with lower interest rates. Its moves also depend on how the US Dollar (USD) behaves as the asset is priced in dollars (XAG/USD). A strong Dollar tends to keep the price of Silver at bay, whereas a weaker Dollar is likely to propel prices up. Other factors such as investment demand, mining supply – Silver is much more abundant than Gold – and recycling rates can also affect prices.
Silver is widely used in industry, particularly in sectors such as electronics or solar energy, as it has one of the highest electric conductivity of all metals – more than Copper and Gold. A surge in demand can increase prices, while a decline tends to lower them. Dynamics in the US, Chinese and Indian economies can also contribute to price swings: for the US and particularly China, their big industrial sectors use Silver in various processes; in India, consumers’ demand for the precious metal for jewellery also plays a key role in setting prices.
Silver prices tend to follow Gold's moves. When Gold prices rise, Silver typically follows suit, as their status as safe-haven assets is similar. The Gold/Silver ratio, which shows the number of ounces of Silver needed to equal the value of one ounce of Gold, may help to determine the relative valuation between both metals. Some investors may consider a high ratio as an indicator that Silver is undervalued, or Gold is overvalued. On the contrary, a low ratio might suggest that Gold is undervalued relative to Silver.
-
02:40
Japanese Yen edges higher against USD, drags USD/JPY closer to 148.00 mark
- The Japanese Yen snaps a two-day losing streak against the USD and recovers further from the weekly low.
- Concerns about Trump’s trade tariffs and hawkish BoJ expectations continue to act as a tailwind for the JPY.
- Fed rate cut bets keep the USD close to a multi-month low and contribute to capping the upside for USD/JPY.
The Japanese Yen (JPY) edged higher against its American counterpart during the Asian session on Thursday and moves away from the weekly low touched the previous day. The chaotic implementation of US President Donald Trump's tariffs and their impact on the global economy might continue to drive demand for the safe-haven JPY. Moreover, rising bets that the Bank of Japan (BoJ) will continue raising interest rates amid broadening inflation in Japan lend support to the JPY.
Meanwhile, hawkish BoJ expectations remain supportive of the recent surge in the Japanese government bond (JGB) yields. The resultant narrowing of the rate differential between Japan and other countries further acts as a tailwind for the lower-yielding JPY. The US Dollar (USD), on the other hand, hangs near a multi-month low amid expectations that the Federal Reserve (Fed) will cut rates several times this year. This, in turn, contributes to capping the upside for the USD/JPY pair.
Japanese Yen draws support from rising trade tensions and BoJ rate hike bets
- US President Donald Trump's 25% tariff on all steel and aluminum imports took effect on Wednesday. Trump also threatened that he would respond to any countermeasures announced by the European Union and Canada.
- Trump repeated his warning to reveal "reciprocal" tariffs next month on countries around the world, fueling concerns about a further escalation of a trade war and lending support to the traditionally safe-haven Japanese Yen.
- Japanese firms agreed to significant wage hikes for the third straight year to help workers cope with inflation and address labour shortages. Higher wages are expected to boost consumer spending and contribute to rising inflation.
- This potential gives the Bank of Japan more room for additional interest rate hikes this year. This, in turn, keeps the yield on the 10-year Japanese government bond close to its highest levels since the 2008 Global Financial Crisis.
- Meanwhile, BOJ Governor Kazuo Ueda signaled that they have no immediate plans to intervene in the bond market, and said that it is natural for long-term rates to move in a way that reflects the market's outlook for the policy rate.
- Traders ramp up their bets that the Federal Reserve will have to lower interest rates this year by more than expected amid the rising possibility of an economic downturn on the back of the Trump administration’s aggressive policies.
- The expectations were reaffirmed by data released on Wednesday, which showed that the headline US Consumer Price Index (CPI) rose less than expected, by 2.8% on a yearly basis in February, down from 3% in the previous month.
- Additional details of the report revealed that the core CPI, which excludes volatile food and energy prices, eased from the 3.3% increase in January to the 3.1% YoY rate during the reported month. The reading was below the 3.2% anticipated.
- Traders now look forward to the release of the US Producer Price Index (PPI) for a fresh impetus later during the early North American session. The fundamental backdrop, however, seems tilted in favor of the USD/JPY bears.
USD/JPY could retest multi-month low once the 148.00 mark is broken decisively
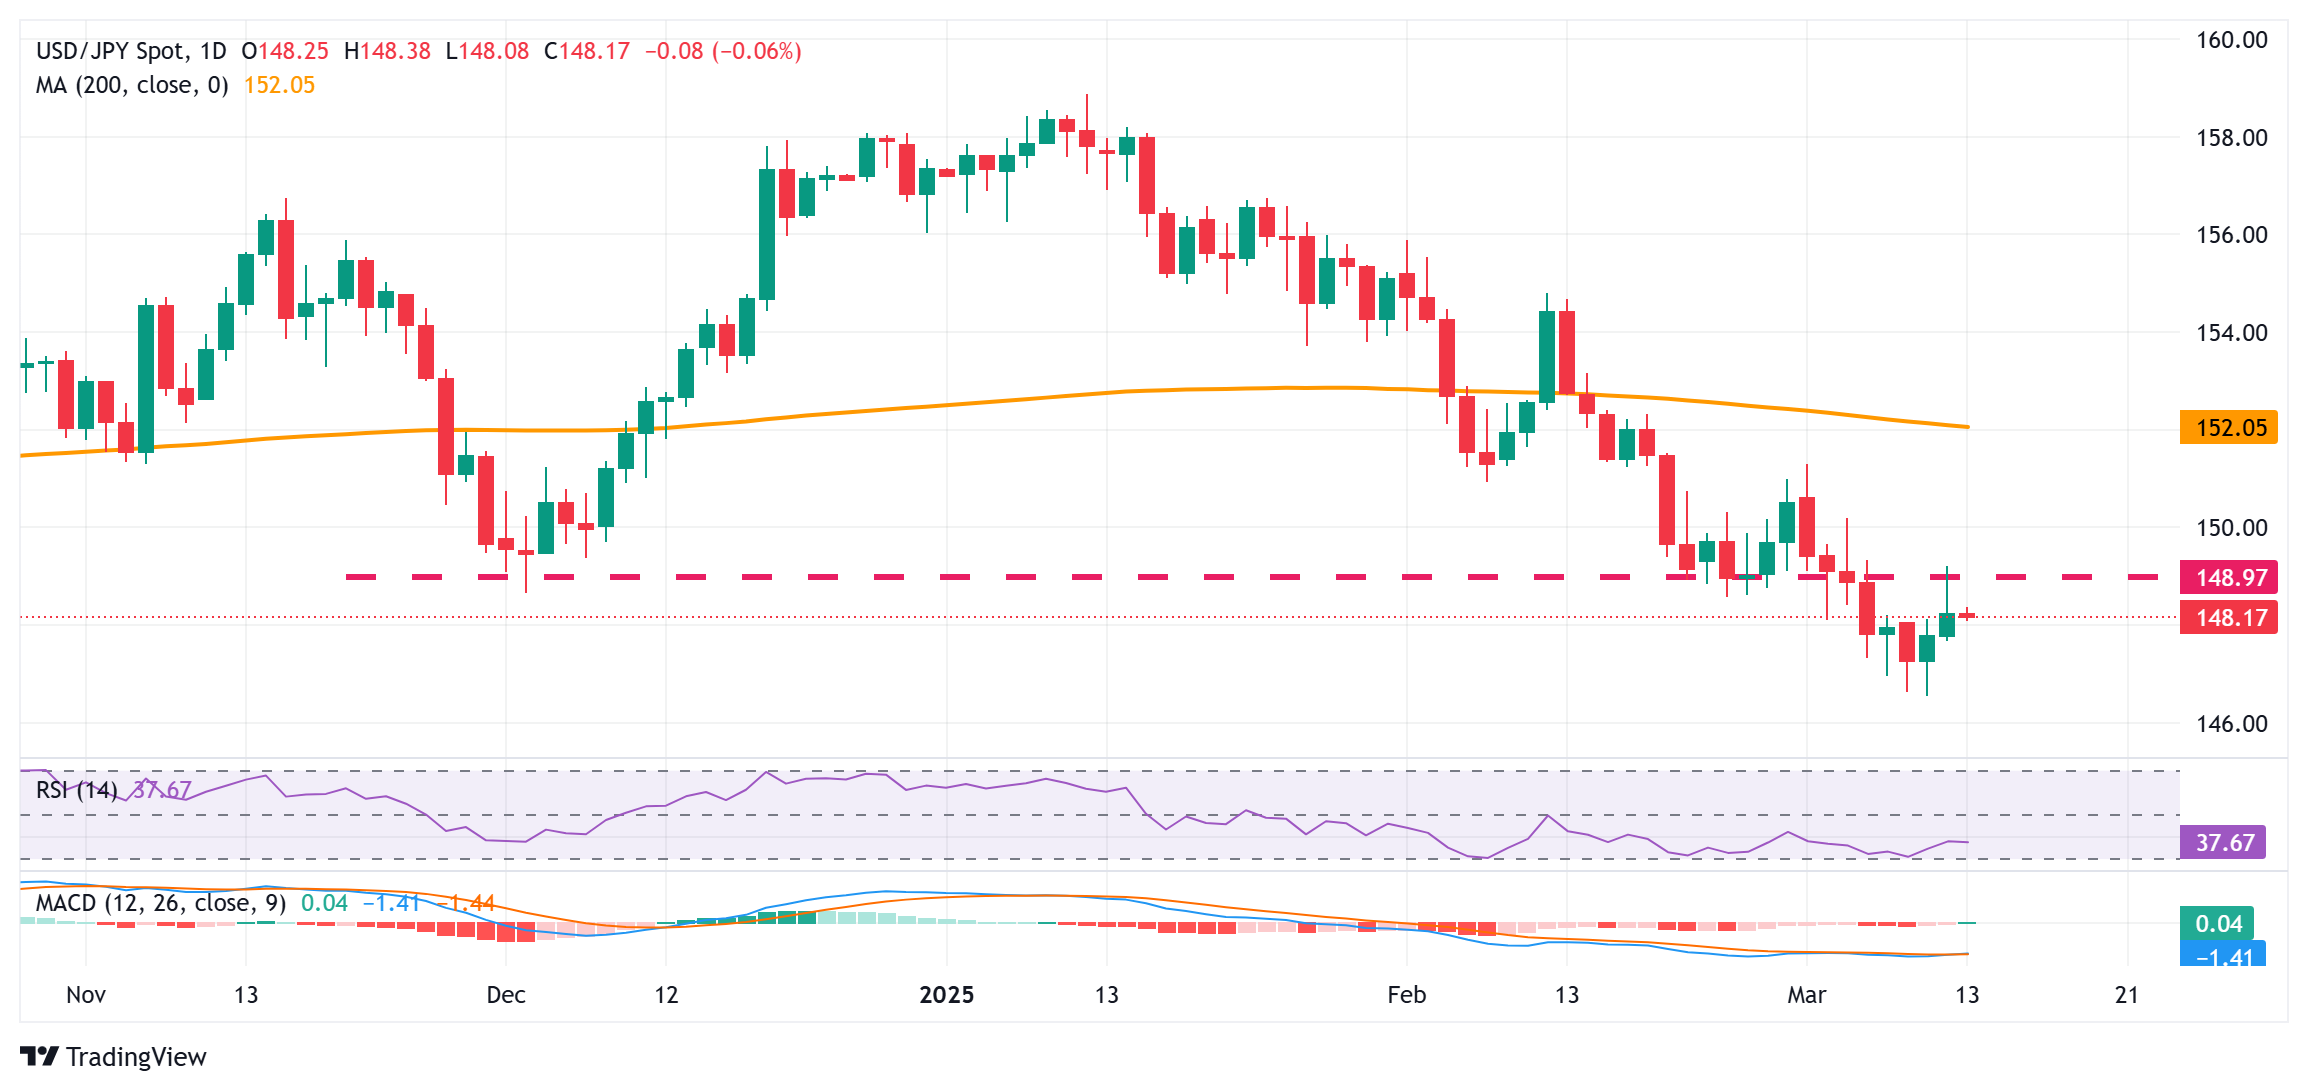
From a technical perspective, the overnight failure to find acceptance above the 149.00 round-figure mark and the subsequent pullback validate the negative outlook for the USD/JPY pair. Moreover, oscillators on the daily chart are holding deep in bearish territory and are still away from being in the oversold zone. This, in turn, suggests that the path of least resistance for spot prices remains to the downside. Hence, some follow-through selling below the 148.00 mark could expose the next relevant support near the 147.25-147.20 region before the pair slides further below the 147.00 mark, towards retesting the multi-month low, around the 146.55-146.50 area touched on Tuesday.
On the flip side, the 148.60-148.70 zone now seems to act as an immediate hurdle ahead of the 149.00 mark and the overnight swing high, around the 149.20 region. A sustained strength beyond the latter might prompt a short-covering rally and allow the USD/JPY pair to reclaim the 150.00 psychological mark. The momentum could extend further towards the 150.55-150.60 horizontal barrier en route to the 151.00 round figure and the monthly swing high, around the 151.30 area.
Japanese Yen FAQs
The Japanese Yen (JPY) is one of the world’s most traded currencies. Its value is broadly determined by the performance of the Japanese economy, but more specifically by the Bank of Japan’s policy, the differential between Japanese and US bond yields, or risk sentiment among traders, among other factors.
One of the Bank of Japan’s mandates is currency control, so its moves are key for the Yen. The BoJ has directly intervened in currency markets sometimes, generally to lower the value of the Yen, although it refrains from doing it often due to political concerns of its main trading partners. The BoJ ultra-loose monetary policy between 2013 and 2024 caused the Yen to depreciate against its main currency peers due to an increasing policy divergence between the Bank of Japan and other main central banks. More recently, the gradually unwinding of this ultra-loose policy has given some support to the Yen.
Over the last decade, the BoJ’s stance of sticking to ultra-loose monetary policy has led to a widening policy divergence with other central banks, particularly with the US Federal Reserve. This supported a widening of the differential between the 10-year US and Japanese bonds, which favored the US Dollar against the Japanese Yen. The BoJ decision in 2024 to gradually abandon the ultra-loose policy, coupled with interest-rate cuts in other major central banks, is narrowing this differential.
The Japanese Yen is often seen as a safe-haven investment. This means that in times of market stress, investors are more likely to put their money in the Japanese currency due to its supposed reliability and stability. Turbulent times are likely to strengthen the Yen’s value against other currencies seen as more risky to invest in.
-
02:36
USD/INR recovers ahead of US PPI release
- The Indian Rupee softens in Thursday’s Asian session.
- Weakness in Asian peers and higher oil prices undermine the INR, but interbank USD sales might help limit its losses.
- US February PPI data and the weekly Initial Jobless Claims will be the highlights later on Thursday.
The Indian Rupee (INR) trades with mild losses on Thursday. The weakness in Asian currencies drags the Indian currency lower. Furthermore, a rebound in crude oil prices could weigh on the local currency as India is the world's third-largest oil consumer and higher crude oil prices tend to have a negative impact on the INR value.
However, broad-based interbank US Dollar (USD) sales amid a weak global risk environment could provide some support to the INR. Any significant depreciation of the Indian Rupee might be limited due to the potential foreign exchange intervention from the Reserve Bank of India (RBI). Later on Thursday, traders will keep an eye on the US February Producer Price Index (PPI) data, along with the weekly Initial Jobless Claim.Indian Rupee remains fragile amid global headwinds
- India’s Consumer Price Index (CPI) rose 3.61% YoY in February, the lowest in seven months. This figure came in lower than the previous reading of 4.31% and the 4.0% expected.
- Consensus estimates suggest that the Reserve Bank of India will cut rates by an additional 50 basis points (bps) over the remainder of 2025.
- The US CPI increased 0.2% MoM in February after a sharp 0.5% advance in January, according to the Labor Statistics on Wednesday. This figure came in softer than the expectation of 0.3%. The core CPI, excluding volatile food and energy categories, rose 0.2% MoM during the same reported period versus 0.4% prior.
- On an annual basis, the US headline CPI inflation eases to 2.8% in February from 3.0% in January, softer than the estimate of 2.9%. The core CPI inflation declines to 3.1% in February from 3.3% in the previous month.
- The US budget deficit for the first five months of fiscal 2025 hit a record $1.15 trillion, the Treasury Department said on Wednesday. On a monthly basis, the US deficit totaled just over $307 billion, 4.0% higher than a year earlier.
- Traders are fully pricing in another quarter-point interest rate cut in June, with about 70 basis points of reductions expected throughout 2025.
USD/INR oscillates in a symmetrical triangle
The Indian Rupee trades weaker on the day. The USD/INR pair has consolidated within a symmetrical triangle on the daily chart. However, the bullish outlook of the pair remains intact as the price holds above the key 100-day Exponential Moving Average (EMA), while the 14-day Relative Strength Index (RSI) stands above the midline.
The first upside barrier for USD/INR emerges at 87.30, the upper boundary of a symmetrical triangle. Extended gains above this level could see the rally to 87.53, the high of February 28, en route to an all-time high of 88.00.
On the other hand, the crucial support level for the pair is located at 86.86, representing the low of March 6 and the lower limit of the triangle pattern. Further south, the next contention level to watch is 86.48, the low of February 21, followed by 86.14, the low of January 27.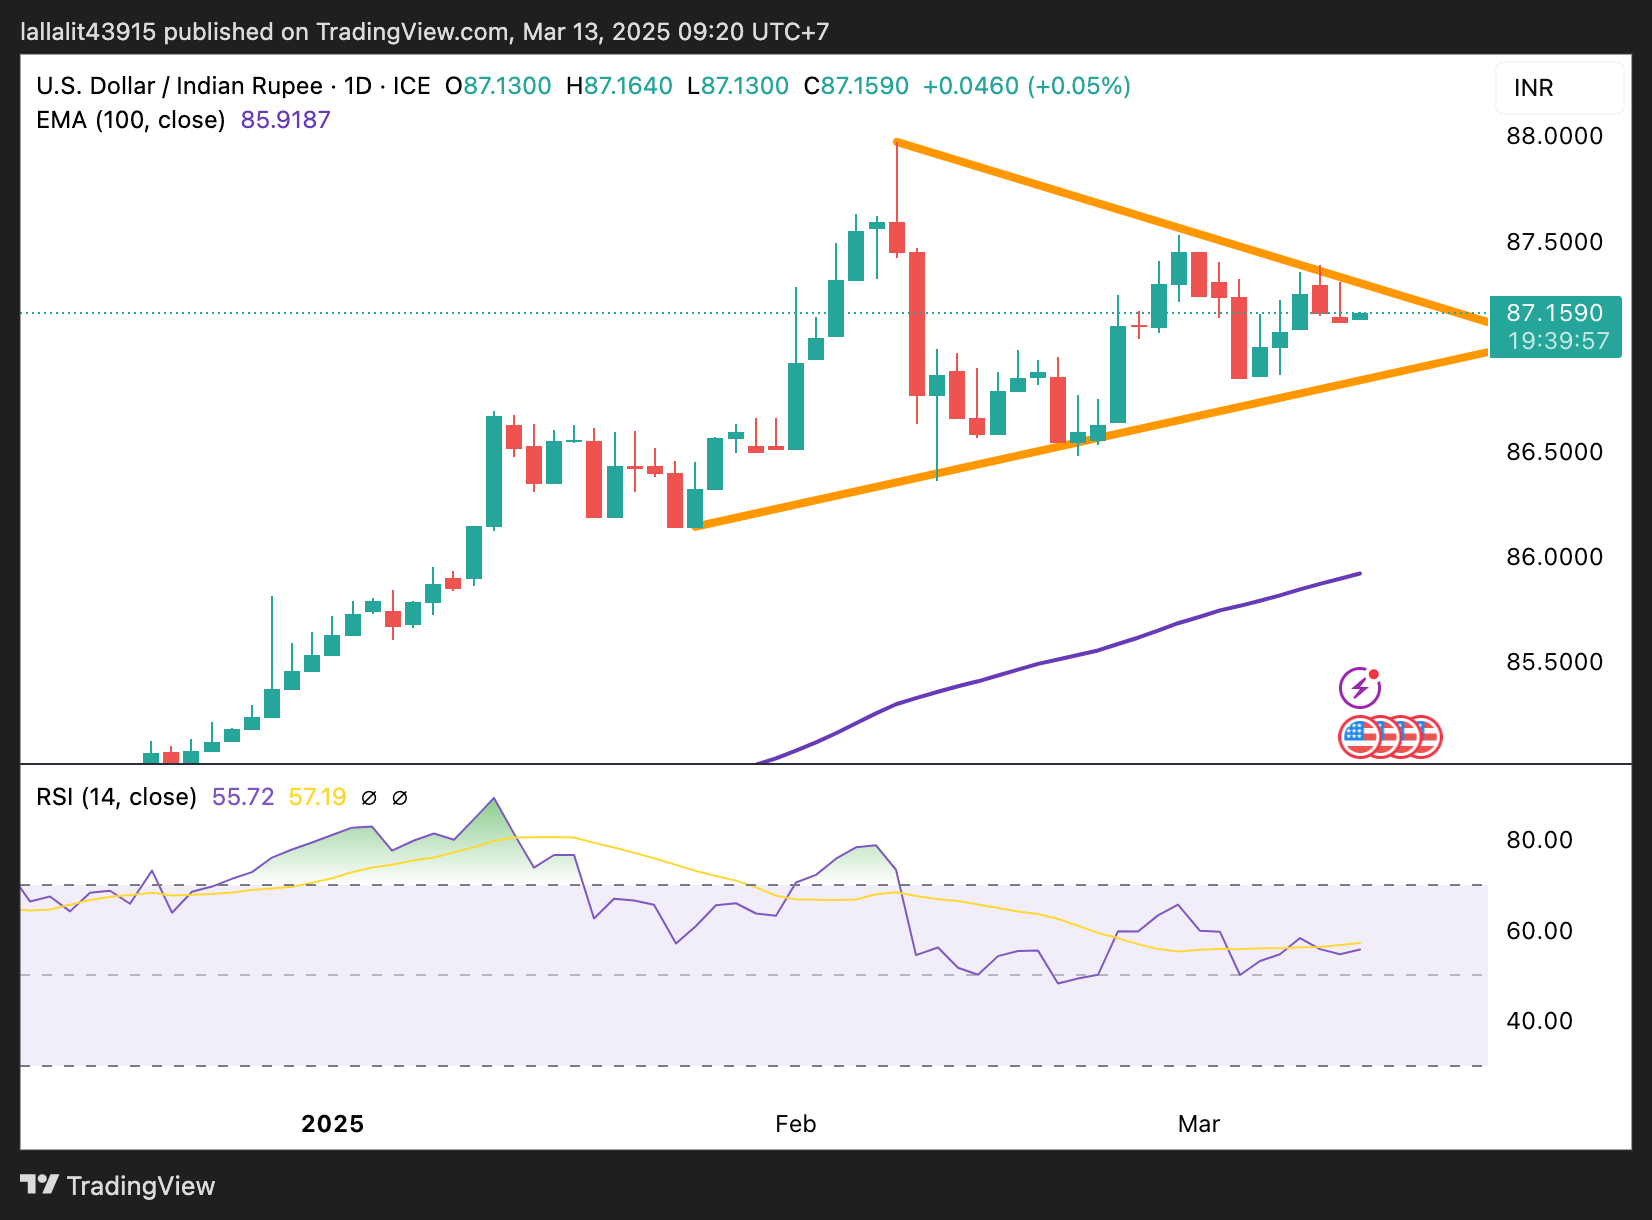
Indian Rupee FAQs
The Indian Rupee (INR) is one of the most sensitive currencies to external factors. The price of Crude Oil (the country is highly dependent on imported Oil), the value of the US Dollar – most trade is conducted in USD – and the level of foreign investment, are all influential. Direct intervention by the Reserve Bank of India (RBI) in FX markets to keep the exchange rate stable, as well as the level of interest rates set by the RBI, are further major influencing factors on the Rupee.
The Reserve Bank of India (RBI) actively intervenes in forex markets to maintain a stable exchange rate, to help facilitate trade. In addition, the RBI tries to maintain the inflation rate at its 4% target by adjusting interest rates. Higher interest rates usually strengthen the Rupee. This is due to the role of the ‘carry trade’ in which investors borrow in countries with lower interest rates so as to place their money in countries’ offering relatively higher interest rates and profit from the difference.
Macroeconomic factors that influence the value of the Rupee include inflation, interest rates, the economic growth rate (GDP), the balance of trade, and inflows from foreign investment. A higher growth rate can lead to more overseas investment, pushing up demand for the Rupee. A less negative balance of trade will eventually lead to a stronger Rupee. Higher interest rates, especially real rates (interest rates less inflation) are also positive for the Rupee. A risk-on environment can lead to greater inflows of Foreign Direct and Indirect Investment (FDI and FII), which also benefit the Rupee.
Higher inflation, particularly, if it is comparatively higher than India’s peers, is generally negative for the currency as it reflects devaluation through oversupply. Inflation also increases the cost of exports, leading to more Rupees being sold to purchase foreign imports, which is Rupee-negative. At the same time, higher inflation usually leads to the Reserve Bank of India (RBI) raising interest rates and this can be positive for the Rupee, due to increased demand from international investors. The opposite effect is true of lower inflation.
-
02:27
Japan’s Kato: Still not in a state where we can permanently call end to deflation
Japanese Finance Minister Shunichi Kato said on Thursday that “Japan is still not in a state where we can permanently call an end to deflation.”
Additional quotes
Japan's economy in state of experiencing supply shortage, rather than lack of demand.
Don't have plan now to modify joint govt, the Bank of Japan (BoJ) statement on ending deflation.
Japan is transiting to an economy where price rises are driven by import costs, to that driven by wage gains.
Judging from underlying inflation and comprehensive look at price gauges.
Market reaction
At the press time, USD/JPY is holding lower ground near 148.15, modestly flat on the day.
-
01:46
Australian Dollar holds gains despite softer Consumer Inflation Expectations
- The Australian Dollar strengthens as the US Dollar struggles amid persistent tariff uncertainty and recession fears.
- Australia’s Consumer Inflation Expectations dropped to 3.6% in March, down from 4.6% in February.
- The latest US Consumer Price Index report showed that headline and core inflation cooled faster than anticipated in February.
The Australian Dollar (AUD) continues to strengthen against the US Dollar (USD) for the third consecutive session, despite weaker Consumer Inflation Expectations data released on Thursday. Consumer expectations of future inflation during the next 12 months fell to 3.6% in March, down from 4.6% in February—the highest level since April 2024.
The AUD/USD pair rises as the US Dollar faces headwinds amid ongoing tariff uncertainty from US President Donald Trump and growing concerns over a potential US recession. However, the pair’s gains may be capped after Trump ruled out exempting Australia from his 25% tariffs on aluminum and steel, key exports valued at nearly $1 billion.
Prime Minister Anthony Albanese affirmed on Wednesday that “Australia will not impose reciprocal tariffs on the US,” emphasizing that retaliatory measures would only increase costs for Australian consumers and drive inflation higher.
Investors remain focused on the Reserve Bank of Australia’s (RBA) policy outlook, particularly after last week’s robust economic data lowered expectations of further rate cuts. Economic growth exceeded forecasts, marking its first acceleration in over a year.
Australian Dollar appreciates as US Dollar struggles amid recession concerns
- The US Dollar Index (DXY), which tracks the US Dollar against six major currencies, is remaining steady around 103.50 at the time of writing. However, the DXY strengthened as traders digested the latest US Consumer Price Index (CPI) data, which showed both headline and core inflation cooling faster than expected in February. The softer inflation report fueled speculation that the US Federal Reserve (Fed) could cut interest rates sooner than anticipated.
- US monthly headline inflation slowed to 0.2% in February, down from 0.5% in January, while core inflation eased to 0.2%, below the expected 0.3%. On an annual basis, headline inflation declined to 2.8% from 3.0%, while core inflation fell to 3.1% from 3.3%.
- President Trump reversed his decision to double tariffs on Canadian steel and aluminum to 50%, a move he announced late Tuesday. However, the White House confirmed to Reuters that new 25% tariffs on all imported steel and aluminum will still take effect on Wednesday, impacting allies and key US suppliers, including Canada and Mexico.
- Trump characterized the economy as being in a "transition period," hinting at a potential slowdown. Investors took his remarks as an early signal of possible economic turbulence in the near future.
- Last week, Fed Chair Jerome Powell reassured markets that the central bank sees no immediate need to adjust monetary policy despite rising uncertainties. San Francisco Fed President Mary Daly echoed this sentiment, noting that increasing business uncertainty could dampen demand but does not justify an interest rate change.
- RBA Deputy Governor Andrew Hauser highlighted that global trade uncertainty is at a 50-year high. Hauser warned that uncertainty stemming from US President Donald Trump's tariffs could prompt businesses and households to delay planning and investment, potentially weighing on economic growth.
- Bloomberg reported on Tuesday, citing sources familiar with the matter, that trade and other negotiations between the US and China remain at a deadlock. Chinese officials state that the US has not provided clear steps regarding fentanyl measures needed for tariff relief. Meanwhile, a source familiar with White House discussions indicated that no plans are currently underway for an in-person meeting between the two leaders.
- China announced on Saturday that it will impose a 100% tariff on Canadian rapeseed oil, oil cakes, and peas, along with a 25% levy on aquatic products and pork from Canada. The move comes in retaliation for tariffs introduced by Canada in October, escalating trade tensions. This marks a new front in a broader trade conflict driven by US President Donald Trump's tariff policies. The tariffs are set to take effect on March 20.
Australian Dollar maintains position above 50-day EMA near 0.6300
The AUD/USD pair is trading near 0.6320 on Thursday, with technical analysis of the daily chart showing the pair moving above the nine-day Exponential Moving Average (EMA), signaling strengthening short-term price momentum. Additionally, the 14-day Relative Strength Index (RSI) has moved slightly above 50, indicating a bullish bias.
On the upside, the AUD/USD pair could explore the area around the three-month high of 0.6408, last reached on February 21.
The AUD/USD pair could find immediate support at the 50-day EMA at 0.6307 level, aligned with the nine-day EMA at 0.6304 level. A break below this level could weaken the short-term price momentum and lead the pair to navigate the region around the five-week low of 0.6187, recorded on March 5.
AUD/USD: Daily Chart
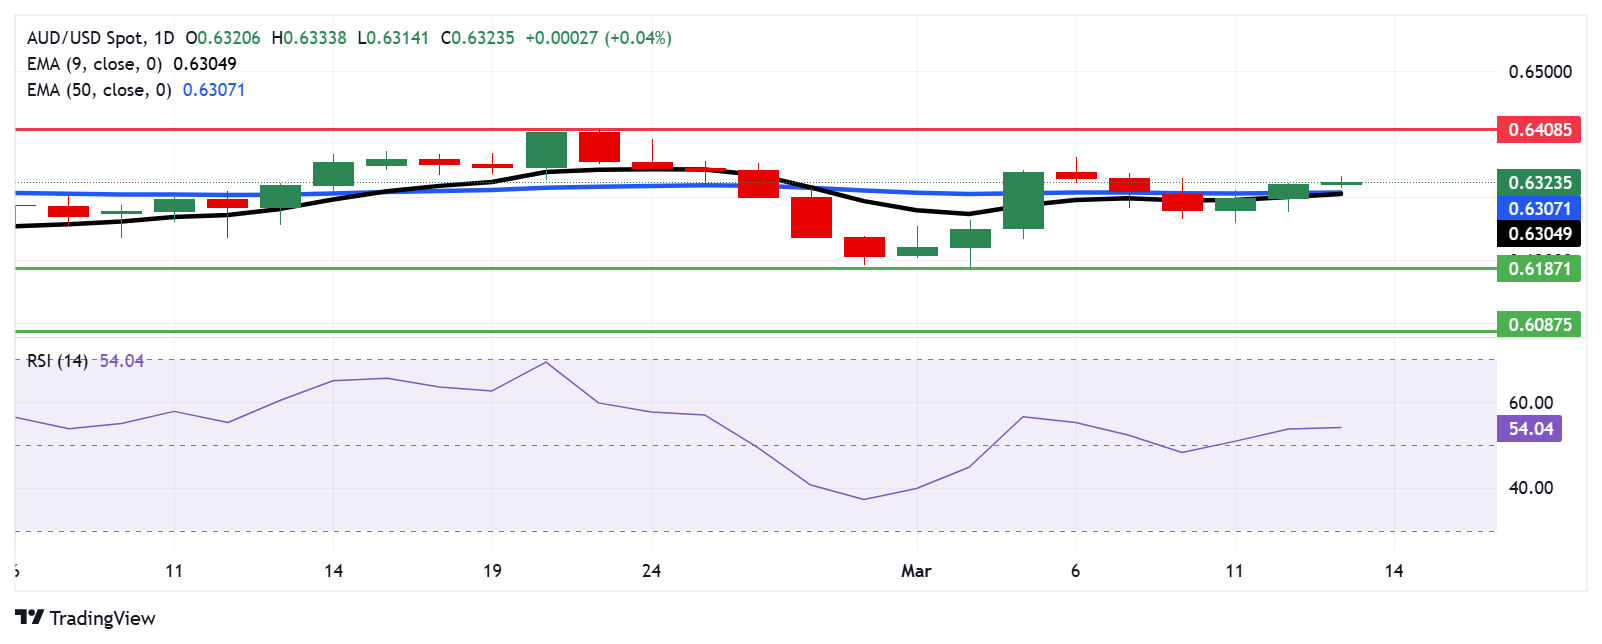
Australian Dollar PRICE Today
The table below shows the percentage change of Australian Dollar (AUD) against listed major currencies today. Australian Dollar was the strongest against the Japanese Yen.
USD EUR GBP JPY CAD AUD NZD CHF USD -0.01% -0.02% 0.01% 0.03% -0.02% -0.10% -0.09% EUR 0.00% -0.01% 0.03% 0.02% -0.02% -0.06% -0.08% GBP 0.02% 0.00% 0.02% 0.03% -0.01% -0.06% -0.04% JPY -0.01% -0.03% -0.02% 0.00% -0.03% -0.10% -0.06% CAD -0.03% -0.02% -0.03% -0.00% -0.03% -0.10% -0.08% AUD 0.02% 0.02% 0.00% 0.03% 0.03% -0.05% -0.01% NZD 0.10% 0.06% 0.06% 0.10% 0.10% 0.05% 0.05% CHF 0.09% 0.08% 0.04% 0.06% 0.08% 0.01% -0.05% The heat map shows percentage changes of major currencies against each other. The base currency is picked from the left column, while the quote currency is picked from the top row. For example, if you pick the Australian Dollar from the left column and move along the horizontal line to the US Dollar, the percentage change displayed in the box will represent AUD (base)/USD (quote).
Economic Indicator
Consumer Inflation Expectations
The Consumer Inflation Expectation released by the Melbourne Institute presents the consumer expectations of future inflation during the next 12 months. The higher expectations, the stronger the effect they will have on a probability of a rate hike by the RBA. Therefore, a high reading should be taken as positive, or bullish, for the AUD, while a low expectations are seen as negative or bearish.
Read more.Last release: Thu Mar 13, 2025 00:00
Frequency: Monthly
Actual: 3.6%
Consensus: -
Previous: 4.6%
Source: University of Melbourne
-
01:15
PBOC sets USD/CNY reference rate at 7.1728 vs. 7.1696 previous
The People’s Bank of China (PBOC) set the USD/CNY central rate for the trading session ahead on Thursday at 7.1728 as compared to the previous day's fix of 7.1696.
PBOC FAQs
The primary monetary policy objectives of the People's Bank of China (PBoC) are to safeguard price stability, including exchange rate stability, and promote economic growth. China’s central bank also aims to implement financial reforms, such as opening and developing the financial market.
The PBoC is owned by the state of the People's Republic of China (PRC), so it is not considered an autonomous institution. The Chinese Communist Party (CCP) Committee Secretary, nominated by the Chairman of the State Council, has a key influence on the PBoC’s management and direction, not the governor. However, Mr. Pan Gongsheng currently holds both of these posts.
Unlike the Western economies, the PBoC uses a broader set of monetary policy instruments to achieve its objectives. The primary tools include a seven-day Reverse Repo Rate (RRR), Medium-term Lending Facility (MLF), foreign exchange interventions and Reserve Requirement Ratio (RRR). However, The Loan Prime Rate (LPR) is China’s benchmark interest rate. Changes to the LPR directly influence the rates that need to be paid in the market for loans and mortgages and the interest paid on savings. By changing the LPR, China’s central bank can also influence the exchange rates of the Chinese Renminbi.
Yes, China has 19 private banks – a small fraction of the financial system. The largest private banks are digital lenders WeBank and MYbank, which are backed by tech giants Tencent and Ant Group, per The Straits Times. In 2014, China allowed domestic lenders fully capitalized by private funds to operate in the state-dominated financial sector.
-
01:05
NZD/USD extends its upside to near 0.5750, eyes on US PPI release
- NZD/USD gains traction to around 0.5740 in Thursday’s early Asian session.
- Trump's unpredictable announcements on tariffs undermine the US Dollar.
- China's deflationary pressures might cap the upside for China-proxy Kiwi.
The NZD/USD pair extends its upside to around 0.5740 during the early Asian session on Thursday, bolstered by the weaker US Dollar (USD). The US Producer Price Index (PPI) will be the highlight later on Thursday, followed by the weekly Initial Jobless Claims.
Worries over US President Donald Trump's unpredictable trade policies have spread uncertainty among investors, weighing on the Greenback. Investors are worried about US weaker economic data as well as big cuts to the government workforce and government spending. Goldman Sachs analysts last week raised its recession chance from 15% to 20%, citing it saw policy changes as the key risk to the economy.
On the other hand, concerns over persistent deflationary pressures in China, New Zealand's biggest export market, undermine the Kiwi. China's Consumer Price Index (CPI) in February missed expectations and fell at the sharpest pace in 13 months, while producer price deflation persisted.
"China's economy still faces deflationary pressure. While sentiment was improved by the developments in the technology space, domestic demand remains weak," said Zhiwei Zhang, president and chief economist at Pinpoint Asset Management.New Zealand Dollar FAQs
The New Zealand Dollar (NZD), also known as the Kiwi, is a well-known traded currency among investors. Its value is broadly determined by the health of the New Zealand economy and the country’s central bank policy. Still, there are some unique particularities that also can make NZD move. The performance of the Chinese economy tends to move the Kiwi because China is New Zealand’s biggest trading partner. Bad news for the Chinese economy likely means less New Zealand exports to the country, hitting the economy and thus its currency. Another factor moving NZD is dairy prices as the dairy industry is New Zealand’s main export. High dairy prices boost export income, contributing positively to the economy and thus to the NZD.
The Reserve Bank of New Zealand (RBNZ) aims to achieve and maintain an inflation rate between 1% and 3% over the medium term, with a focus to keep it near the 2% mid-point. To this end, the bank sets an appropriate level of interest rates. When inflation is too high, the RBNZ will increase interest rates to cool the economy, but the move will also make bond yields higher, increasing investors’ appeal to invest in the country and thus boosting NZD. On the contrary, lower interest rates tend to weaken NZD. The so-called rate differential, or how rates in New Zealand are or are expected to be compared to the ones set by the US Federal Reserve, can also play a key role in moving the NZD/USD pair.
Macroeconomic data releases in New Zealand are key to assess the state of the economy and can impact the New Zealand Dollar’s (NZD) valuation. A strong economy, based on high economic growth, low unemployment and high confidence is good for NZD. High economic growth attracts foreign investment and may encourage the Reserve Bank of New Zealand to increase interest rates, if this economic strength comes together with elevated inflation. Conversely, if economic data is weak, NZD is likely to depreciate.
The New Zealand Dollar (NZD) tends to strengthen during risk-on periods, or when investors perceive that broader market risks are low and are optimistic about growth. This tends to lead to a more favorable outlook for commodities and so-called ‘commodity currencies’ such as the Kiwi. Conversely, NZD tends to weaken at times of market turbulence or economic uncertainty as investors tend to sell higher-risk assets and flee to the more-stable safe havens.
-
00:15
Currencies. Daily history for Wednesday, March 12, 2025
Pare Closed Change, % AUDUSD 0.63194 0.4 EURJPY 161.373 0.05 EURUSD 1.08873 -0.26 GBPJPY 192.115 0.41 GBPUSD 1.29618 0.12 NZDUSD 0.57296 0.28 USDCAD 1.4367 -0.43 USDCHF 0.88156 -0.12 USDJPY 148.211 0.29 -
00:07
WTI edges higher to near $67.50 on tighter US supplies
- WTI price drifts higher to $67.40 in Thursday’s early Asian session.
- Crude oil stockpiles in the US rose by 1.448 million barrels last week, according to the EIA.
- Concerns over the US economic slowdown and Trump's aggressive tariffs on imports might weigh on the WTI.
West Texas Intermediate (WTI), the US crude oil benchmark, is trading around $67.40 during the early Asian session on Thursday. The WTI price extends the rally amid tighter-than-expected oil inventories. However, the upside for the WTI price might be limited due to mounting fears of a US economic slowdown and the impact of tariffs on global economic growth.
Crude Oil inventories climbed last week. The US Energy Information Administration (EIA) weekly report showed crude oil stockpiles in the United States for the week ending March 7 increased by 1.448 million barrels, compared to a rise of 3.614 million barrels in the previous week. The market consensus estimated that stocks would increase by 2.1 million barrels.
"This week, the oil build was smaller than expected and gasoline and diesel draws were larger than expected," noted Josh Young, Chief Investment Officer, Bison Interests. "This evidences stronger demand and could see oil prices rise as a result.”
Nonetheless, US President Donald Trump's aggressive tariffs on imports are expected to raise prices for businesses, boost inflation and undermine consumer confidence in a blow to economic growth. This, in turn, might drag the WTI price lower. The White House confirmed on Tuesday that fresh 25% tariffs on all imported steel and aluminum will still go into effect on Wednesday, including against allies and major US suppliers Canada and Mexico.WTI Oil FAQs
WTI Oil is a type of Crude Oil sold on international markets. The WTI stands for West Texas Intermediate, one of three major types including Brent and Dubai Crude. WTI is also referred to as “light” and “sweet” because of its relatively low gravity and sulfur content respectively. It is considered a high quality Oil that is easily refined. It is sourced in the United States and distributed via the Cushing hub, which is considered “The Pipeline Crossroads of the World”. It is a benchmark for the Oil market and WTI price is frequently quoted in the media.
Like all assets, supply and demand are the key drivers of WTI Oil price. As such, global growth can be a driver of increased demand and vice versa for weak global growth. Political instability, wars, and sanctions can disrupt supply and impact prices. The decisions of OPEC, a group of major Oil-producing countries, is another key driver of price. The value of the US Dollar influences the price of WTI Crude Oil, since Oil is predominantly traded in US Dollars, thus a weaker US Dollar can make Oil more affordable and vice versa.
The weekly Oil inventory reports published by the American Petroleum Institute (API) and the Energy Information Agency (EIA) impact the price of WTI Oil. Changes in inventories reflect fluctuating supply and demand. If the data shows a drop in inventories it can indicate increased demand, pushing up Oil price. Higher inventories can reflect increased supply, pushing down prices. API’s report is published every Tuesday and EIA’s the day after. Their results are usually similar, falling within 1% of each other 75% of the time. The EIA data is considered more reliable, since it is a government agency.
OPEC (Organization of the Petroleum Exporting Countries) is a group of 12 Oil-producing nations who collectively decide production quotas for member countries at twice-yearly meetings. Their decisions often impact WTI Oil prices. When OPEC decides to lower quotas, it can tighten supply, pushing up Oil prices. When OPEC increases production, it has the opposite effect. OPEC+ refers to an expanded group that includes ten extra non-OPEC members, the most notable of which is Russia.
-
00:01
Australia Consumer Inflation Expectations declined to 3.6% in March from previous 4.6%
-
00:01
United Kingdom RICS Housing Price Balance registered at 11%, below expectations (20%) in February
-