Notícias do Mercado
-
21:10
Gold price pulls back after historic surge past $3,000 on Trump trade woes
- Gold briefly hits unprecedented high at $3,004 per ounce before settling lower at $2,982 amid US Dollar volatility.
- Geopolitical tensions rise as Russia-Ukraine ceasefire falters; China's central bank extends bullion buying streak, boosts Gold.
- US recession fears escalate following dismal consumer sentiment report, raising bets the Fed could ease policy further in 2025.
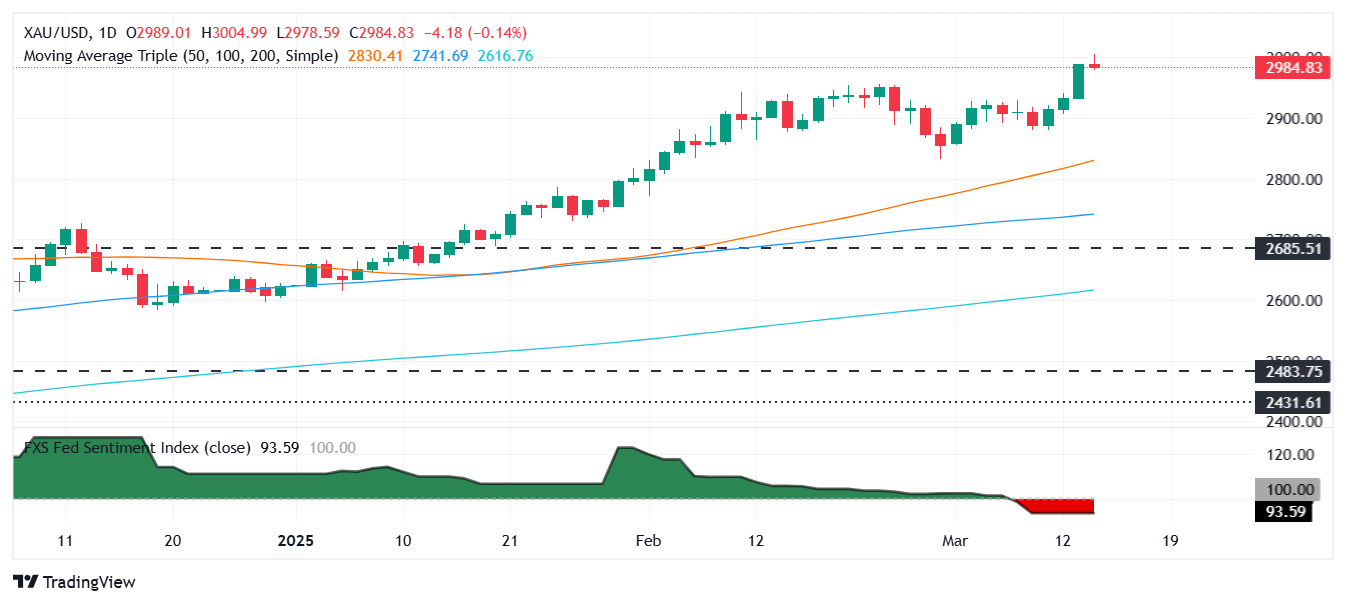
Gold prices retreat after hitting a record high, surpassing $3,000, as traders remain uncertain about US President Donald Trump's trade policies. This and the weakness of the US Dollar drove the precious metal to reach an all-time high of $3,004 a troy ounce before retreating to $2,982, losing 0.21% in the day.
Geopolitics are also impacting Gold’s demand. The Ukraine—Russia ceasefire is at a crossroads, with the latter seeming reluctant to adhere to the 30-day truce.
In the meantime, the People’s Bank of China (PBoC) increased its Bullion reserves for the fourth straight month in February, according to the World Gold Council (WGC).
Recession fears surrounding the economy of the United States (US) sent the Greenback on a tailspin, spurring demand for the non-yielding metal. This increased the odds that the Federal Reserve (Fed) would ease policy by 66 basis points (bps) in 2025, down from 74 bps a day ago.
Traders are focused on next week’s Federal Reserve (Fed) policy decision.Last Friday, Fed Chair Jerome Powell noted that "market measures of inflation expectations have moved up, driven by tariffs," signaling concerns that trade policies could contribute to renewed price pressures.
Data-wise, the University of Michigan (UoM) Consumer Sentiment Index registered a dismal print, while inflation expectations aimed higher due to US President Trump’s tariffs.
Next week, the US economic schedule will feature Retail Sales, housing data, the Fed’s monetary policy decisions, and economic projections.
Daily digest market movers: Gold price treads water amid soft US Dollar
- The US 10-year Treasury bond yield has recovered some ground and climbed five basis points up at 4.320%.
- US real yields, as measured by the US 10-year Treasury Inflation-Protected Securities (TIPS) yield that correlates inversely to Gold prices surges four and a half bps up at 2.013% via Reuters.
- The US Dollar Index (DXY), which tracks the Greenback’s value against six currencies, falls 0.14% to 103.71.
- The University of Michigan (UoM) Consumer Sentiment survey for March revealed a sharp decline in sentiment, falling to 57.9 from 64.7, well below the 63.1 forecast.
- Inflation expectations surged, with Americans projecting 12-month inflation to rise from 4.3% to 4.9%. Over a five-year period, consumers expect inflation to increase to 3.9%, up from the previous 3.5% estimate.
- Despite recent cooler-than-expected inflation data, economists caution that tariffs on US imports could lead to a renewed inflationary uptick in the coming months.
- On Wednesday, 25% US tariffs on steel and aluminum took effect at midnight as US President Donald Trump is battling to reduce the trade deficit by applying duties on imports.
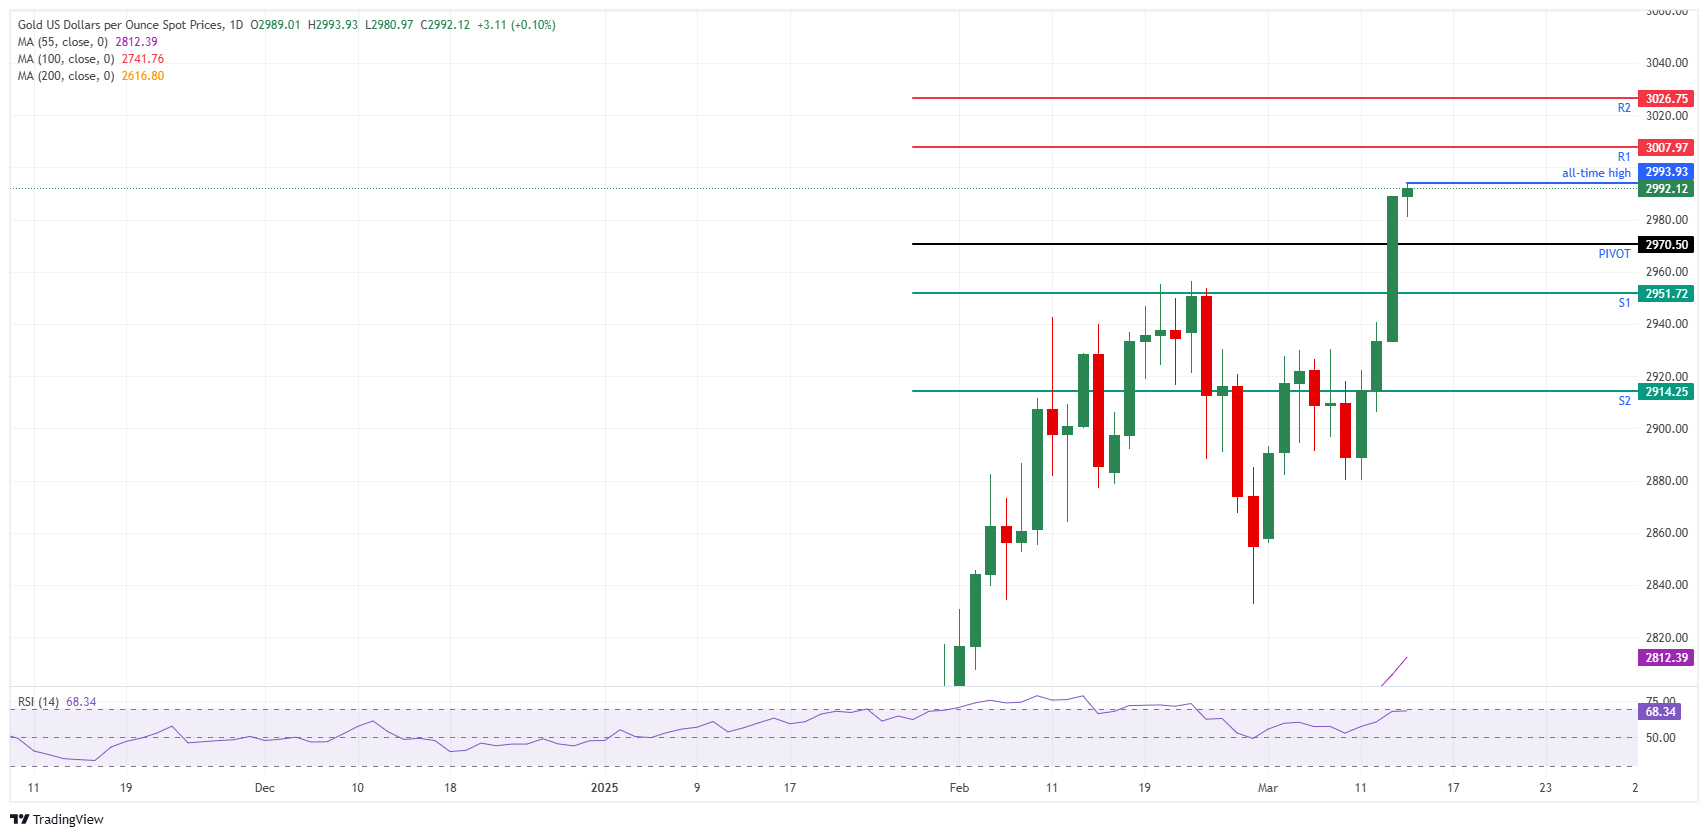
XAU/USD technical outlook: Gold price struggles to hold above $3,000
Gold price retreats after finally reaching the $3,000 milestone. The pullback is seen as bulls taking a breather before launching a second attack to achieve a daily close above the all-time high of $3,004. The following key resistance levels seen are $3,050 and $3,100.
On the flipside, the first support is the $2,950, which, if cleared, could pave the way to test $2,900 ahead of $2,850. The following support will be a February 28 low of $2,832.
Gold FAQs
Gold has played a key role in human’s history as it has been widely used as a store of value and medium of exchange. Currently, apart from its shine and usage for jewelry, the precious metal is widely seen as a safe-haven asset, meaning that it is considered a good investment during turbulent times. Gold is also widely seen as a hedge against inflation and against depreciating currencies as it doesn’t rely on any specific issuer or government.
Central banks are the biggest Gold holders. In their aim to support their currencies in turbulent times, central banks tend to diversify their reserves and buy Gold to improve the perceived strength of the economy and the currency. High Gold reserves can be a source of trust for a country’s solvency. Central banks added 1,136 tonnes of Gold worth around $70 billion to their reserves in 2022, according to data from the World Gold Council. This is the highest yearly purchase since records began. Central banks from emerging economies such as China, India and Turkey are quickly increasing their Gold reserves.
Gold has an inverse correlation with the US Dollar and US Treasuries, which are both major reserve and safe-haven assets. When the Dollar depreciates, Gold tends to rise, enabling investors and central banks to diversify their assets in turbulent times. Gold is also inversely correlated with risk assets. A rally in the stock market tends to weaken Gold price, while sell-offs in riskier markets tend to favor the precious metal.
The price can move due to a wide range of factors. Geopolitical instability or fears of a deep recession can quickly make Gold price escalate due to its safe-haven status. As a yield-less asset, Gold tends to rise with lower interest rates, while higher cost of money usually weighs down on the yellow metal. Still, most moves depend on how the US Dollar (USD) behaves as the asset is priced in dollars (XAU/USD). A strong Dollar tends to keep the price of Gold controlled, whereas a weaker Dollar is likely to push Gold prices up.
-
19:44
Mark Carney becomes new Canadian Prime Minister, vows to meet Trump at the table
Newly-minted Canadian Prime Minister Mark Carney took over the reigns of Canada from now-former Prime Minister Justin Trudeau on Friday morning, and the fresh Canadian leader wasted no time in declaring his intent to meet US President Donald Trump head-on as the Trump administration spools up a messy, global trade war with nearly all of the US's closest trading partners simultaneously.
Key highlights
Mark Carney sworn in as Canada's prime minister, now faces Trump tariffs.
Carney plans visit to France and the UK next week.
Carney: We will create new trade corridors with reliable partners.
I plan to go to France and the UK.
I hope to have a call with Trump but I don't have a plan to do so.
Election news in coming days and we're seeking strong mandate.
I look forward to speaking with Trump; we understand his agenda.
I'm confident we can find a mutual solution with Trump.
Canada has progressed with Trump, and we will find a solution.
'America is not Canada,' new Prime Minister Mark Carney says in rebuke to Trump.
-
19:37
United States CFTC Oil NC Net Positions increased to 164.1K from previous 154.8K
-
19:37
Japan CFTC JPY NC Net Positions rose from previous ¥133.7K to ¥133.9K
-
19:37
Australia CFTC AUD NC Net Positions remains unchanged at $-48.2K
-
19:37
United States CFTC Gold NC Net Positions fell from previous $243.3K to $236.1K
-
19:37
United Kingdom CFTC GBP NC Net Positions up to £29.2K from previous £18.6K
-
19:37
United States CFTC S&P 500 NC Net Positions: $80.6K vs $32.1K
-
19:37
Eurozone CFTC EUR NC Net Positions increased to €13.1K from previous €-10.1K
-
19:23
Argentina Consumer Price Index (MoM) came in at 2.4%, above forecasts (2.3%) in February
-
19:20
Dow Jones Industrial Average pares losses on Friday, but remains steeply bearish
- The Dow Jones recovered around 600 points on Friday.
- Despite the last-minute pullback, the Dow remains down 1,300 points for the week.
- Equities shrugged off one of the worst consumer sentiment prints in years.
The Dow Jones Industrial Average (DJIA) fought back at the brink on Friday, clawing back roughly 500 points following a string of bad losses that saw the Dow Jones crumble 3,373 points, or -7.66%, peak-to-trough over a two-week period. Friday’s broad recovery in equities may be poorly timed, however: University of Michigan (UoM) consumer outlook indicators saw their deepest plunge in years on Friday, and the pain from souring consumer sentiment may hit further down the line.
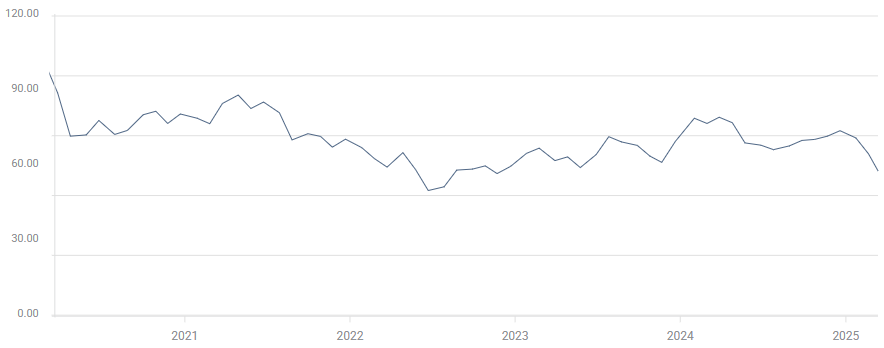
The UoM Consumer Sentiment Index for March tumbled to its lowest print in over two years, slumping to 57.9 as the Trump administration’s aspirations of a global trade war with everyone at the same time begins to punch holes in US consumers’ outlook. Median market forecasts had expected a slight downturn in the key consumer index, expecting a decline to 63.1 from 64.7.
UoM Consumer Sentiment Index (March)
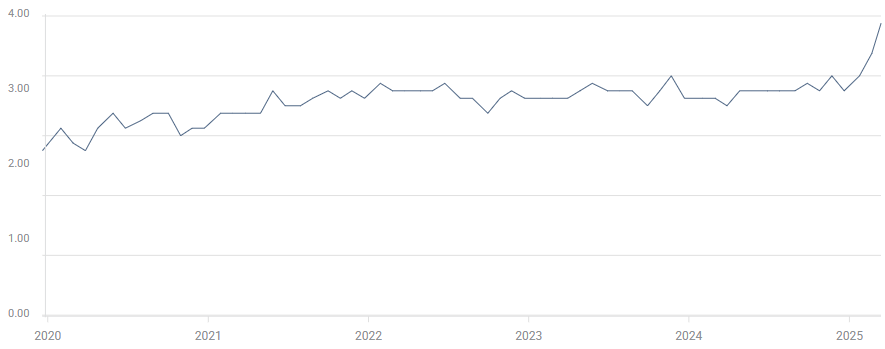
March’s UoM consumer inflation outlook also rocketed higher, with the 5-year estimate reaching 3.9%, and the indicator’s highest monthly gain in over four decades. UoM one-year inflation expectations also surged to a two-year high of 4.9%, anchoring consumer inflation fears well above the Federal Reserve’s (Fed) 2% annual target.
UoM 5-year Consumer Inflation Expectation (March)
Crumbling consumer confidence bodes poorly for economic activity in the US, as noted by chief economist for Comerica Bank Bill Adams:
"The pullback in confidence is becoming a real threat to consumer spending which, as is often repeated, accounts for two thirds of U.S. economic activity."
To their credit, rate markets remain stubbornly attached to the idea of a Q2 rate cut from the Fed. According to the CME’s FedWatch Tool, rate traders are still pricing in nearly 80% odds of another quarter-point rate trim from the Fed in June. Fed Chair Jerome Powell and the other members of the Federal Open Market Committee (FOMC) are expected to stand pat on rates at next week’s rate call and again in May.
Dow Jones news
Most of the securities listed on the Dow Jones Industrial Average are finding room on the high side on Friday as investors stretch their buying buttons. However, gains are concentrated in tech rally favorites and US banking giants. Nvidia (NVDA) has rebounded 4.5%, climbing above $120 per share as the tech rally darling struggles to snap a recent losing streak that dragged the silicon puncher off of record highs above $150.
Read more: JPMorgan, Goldman Sachs, American Express gain on US budget bill prospects
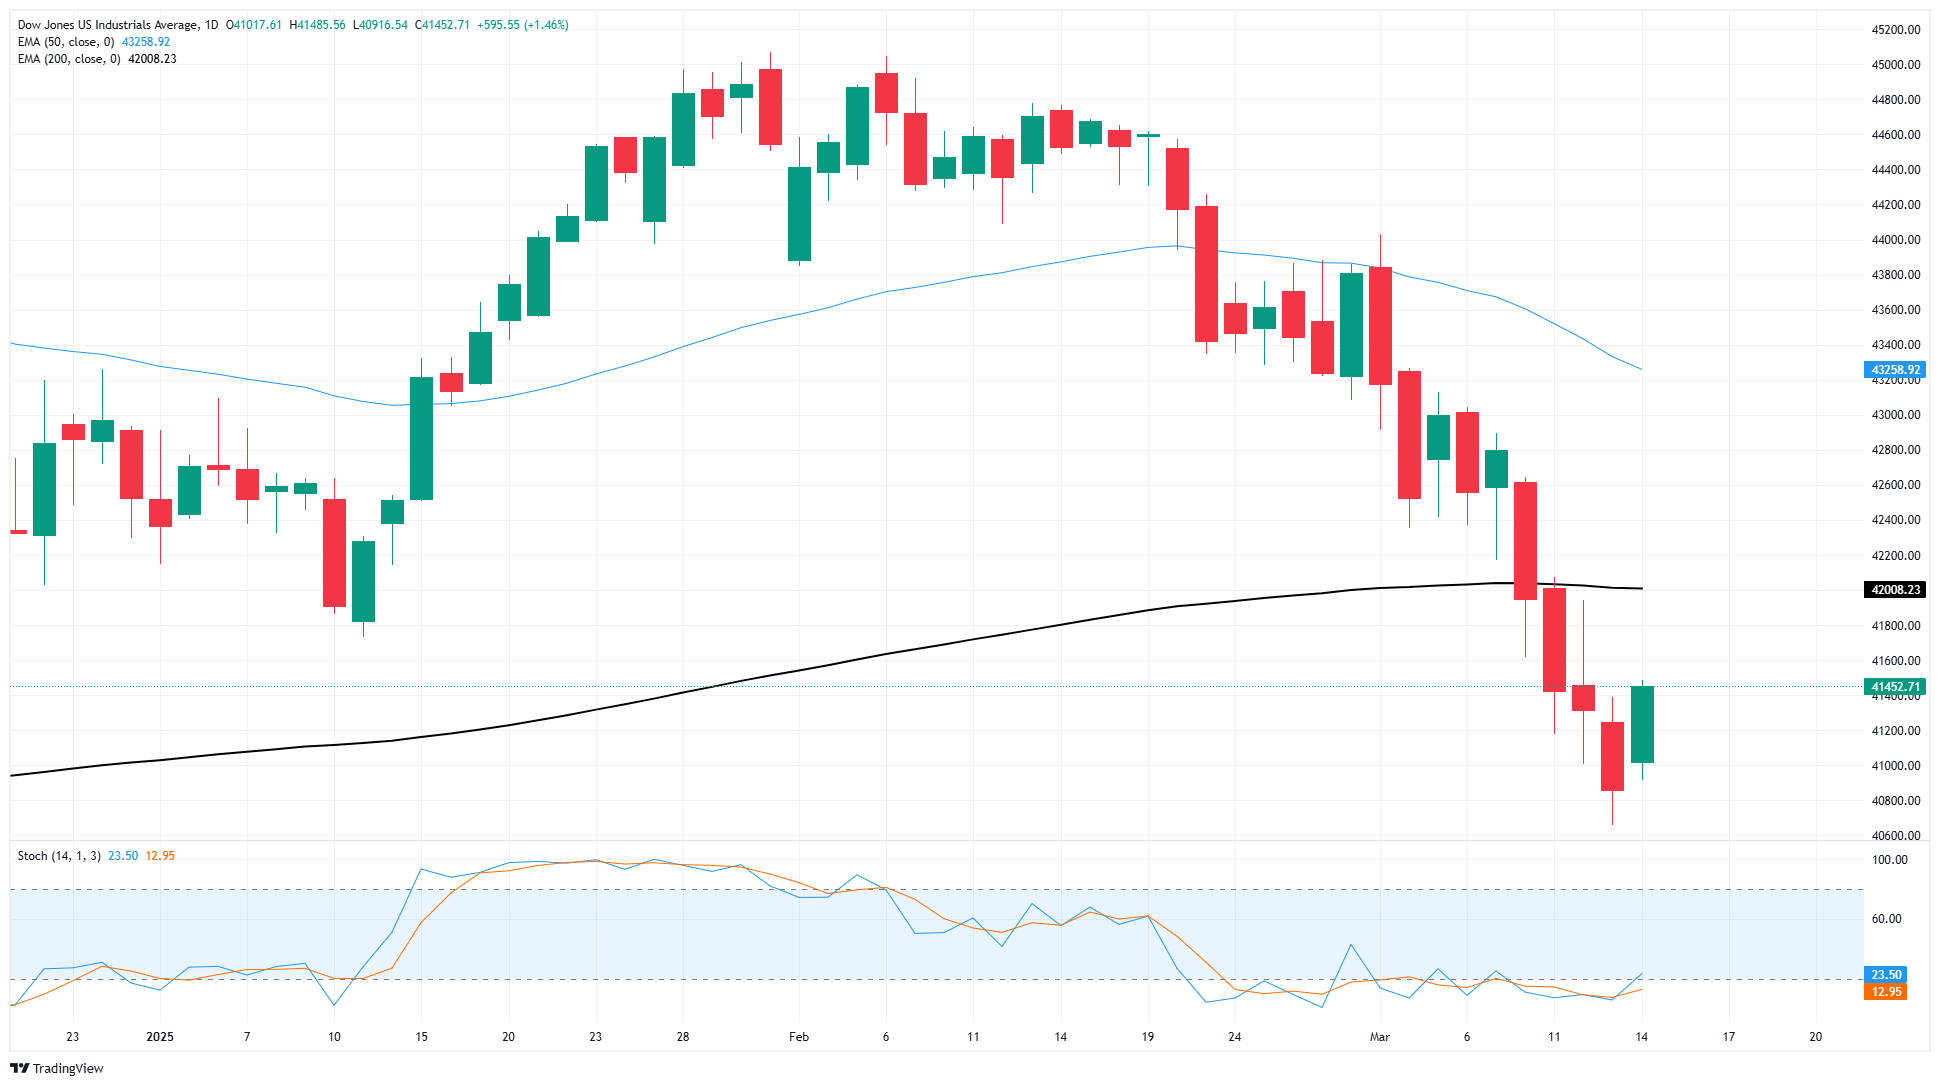
Dow Jones price forecast
A Friday splurge has snapped a four-day losing streak on the Dow Jones, but the major equity index remains on the bearish side of the 200-day Exponential Moving Average (EMA) near the 42,000 major price handle. The Dow Jones came within inches of hitting correction territory after failing to chalk in new highs since November’s peak just north of 45,000, and stock traders will be looking to extend a fresh bullish leg after briefly testing chart territory below 41,000.
Dow Jones daily chart
Dow Jones FAQs
The Dow Jones Industrial Average, one of the oldest stock market indices in the world, is compiled of the 30 most traded stocks in the US. The index is price-weighted rather than weighted by capitalization. It is calculated by summing the prices of the constituent stocks and dividing them by a factor, currently 0.152. The index was founded by Charles Dow, who also founded the Wall Street Journal. In later years it has been criticized for not being broadly representative enough because it only tracks 30 conglomerates, unlike broader indices such as the S&P 500.
Many different factors drive the Dow Jones Industrial Average (DJIA). The aggregate performance of the component companies revealed in quarterly company earnings reports is the main one. US and global macroeconomic data also contributes as it impacts on investor sentiment. The level of interest rates, set by the Federal Reserve (Fed), also influences the DJIA as it affects the cost of credit, on which many corporations are heavily reliant. Therefore, inflation can be a major driver as well as other metrics which impact the Fed decisions.
Dow Theory is a method for identifying the primary trend of the stock market developed by Charles Dow. A key step is to compare the direction of the Dow Jones Industrial Average (DJIA) and the Dow Jones Transportation Average (DJTA) and only follow trends where both are moving in the same direction. Volume is a confirmatory criteria. The theory uses elements of peak and trough analysis. Dow’s theory posits three trend phases: accumulation, when smart money starts buying or selling; public participation, when the wider public joins in; and distribution, when the smart money exits.
There are a number of ways to trade the DJIA. One is to use ETFs which allow investors to trade the DJIA as a single security, rather than having to buy shares in all 30 constituent companies. A leading example is the SPDR Dow Jones Industrial Average ETF (DIA). DJIA futures contracts enable traders to speculate on the future value of the index and Options provide the right, but not the obligation, to buy or sell the index at a predetermined price in the future. Mutual funds enable investors to buy a share of a diversified portfolio of DJIA stocks thus providing exposure to the overall index.
-
18:54
Banxico: Uncertainty clouds Mexico's economic horizon – El Financiero
- Public safety and the policies implemented by the United States are a source of concern for businesses.
- Central bank warns slowdown could deepen; urges investment boost amid weakening demand and trade tensions
Banco de Mexico (Banxico) Director of Economic Research Alejandrina Salcedo Cisneros said that uncertainty is having a widespread impact on the country's businesses, so the outlook points to a moderate expansion of regional economies.
Banxico’s economist added, “We had a slowdown that we had been observing for several quarters, to which this environment of uncertainty is now compounded.” She said this could be due to lower internal and external demand, given that manufacturing production slowed in the United States (US).
Mexico’s central bank revealed an economic contraction of -0.6 % in Q4 2024. Although the country is not in a recession, having a negative quarter could be a prelude to a deeper economic slowdown.
Business executives interviewed by Banxico indicated that deteriorating public safety and trade policies implemented by the US are among the risks that could affect regional economies over the next year.
Also, public investment in infrastructure at the state and federal levels may be lower than expected.
She considered that, in the face of these challenges, it is necessary to continue strengthening domestic sources of growth and generating favorable conditions for investment, especially to continue promoting infrastructure construction.
Banxico FAQs
The Bank of Mexico, also known as Banxico, is the country’s central bank. Its mission is to preserve the value of Mexico’s currency, the Mexican Peso (MXN), and to set the monetary policy. To this end, its main objective is to maintain low and stable inflation within target levels – at or close to its target of 3%, the midpoint in a tolerance band of between 2% and 4%.
The main tool of the Banxico to guide monetary policy is by setting interest rates. When inflation is above target, the bank will attempt to tame it by raising rates, making it more expensive for households and businesses to borrow money and thus cooling the economy. Higher interest rates are generally positive for the Mexican Peso (MXN) as they lead to higher yields, making the country a more attractive place for investors. On the contrary, lower interest rates tend to weaken MXN. The rate differential with the USD, or how the Banxico is expected to set interest rates compared with the US Federal Reserve (Fed), is a key factor.
Banxico meets eight times a year, and its monetary policy is greatly influenced by decisions of the US Federal Reserve (Fed). Therefore, the central bank’s decision-making committee usually gathers a week after the Fed. In doing so, Banxico reacts and sometimes anticipates monetary policy measures set by the Federal Reserve. For example, after the Covid-19 pandemic, before the Fed raised rates, Banxico did it first in an attempt to diminish the chances of a substantial depreciation of the Mexican Peso (MXN) and to prevent capital outflows that could destabilize the country.
-
18:29
Mexican Peso defies gloomy data, rockets higher on USD weakness
- Mexican Peso advances as USD/MXN plunges below 19.90, down over 1%.
- The Peso shrugs off Mexico’s weak industrial output and declining consumer confidence fueling recession concerns.
- US consumer sentiment plunges amid rising inflation expectations, driven by upcoming Trump administration tariffs.
The Mexican Peso (MXN) rallied against the US Dollar (USD) on Friday, ignoring softer-than-expected economic data revealed during the week that suggests the economy might slow down. A deterioration of consumer sentiment in the United States (US) exerted pressure on the Greenback, which is poised to finish the week with losses. The USD/MXN trades at 19.86, down more than 1%.
The market mood turned buoyant, a tailwind for the emerging market currency. Dismal reports in Consumer Confidence and Industrial Production in Mexico paint a gloomy economic outlook, further confirmed by Banco de Mexico (Banxico) Director of Economic Research Alejandrina Salcedo Cisneros.
She commented that uncertainty is impacting the country’s business, hinting at an outlook for a moderate expansion of regional economies. Banxico estimated economic contraction in all regions of the country. Nationwide, growth declined -0.6 % in Q4 compared to the previous quarter in seasonally-adjusted figures.
In the US, the University of Michigan (UoM) Consumer Sentiment Index registered a dismal print, while inflation expectations aimed higher due to US President Trump’s tariffs.
Traders' eyes are on next week’s Federal Reserve (Fed) policy decision. Last Friday, Fed Chair Jerome Powell revealed that “market measures of inflation expectations have moved up, driven by tariffs.”
Next week, traders will look at Retail Sales, housing data, the Fed’s monetary policy decisions and economic projections.
Daily digest market movers: Mexican Peso surges as the Greenback weakens
- Mexico's Industrial Production plunges to -2.9% YoY, worse than December’s -2.7% fall alongside a deterioration on Consumer Confidence suggests the Mexican Peso could depreciate despite the ongoing gains observed that are mostly due to overall US Dollar weakness.
- The economy in Mexico is slowing down sharply as projected by private analysts polled by Banco de Mexico (Banxico). They expect growth at 0.81%.
- Banxico is expected to continue easing policy at the March 27 meeting spurred by the evolution of the disinflation process and a stagnant economy.
- On Wednesday, Mexican Finance Minister Edgar Amador Zamora said the national economy is expanding but shows signs of slowing down linked to trade tensions with the US.
- The University of Michigan (UoM) Consumer Sentiment survey showed that in March, sentiment deteriorated from 64.7 to 57.9, below the forecast of 63.1. Notably, inflation expectations jumped with Americans seeing 12-month inflation rise from 4.3% to 4.9%. Over a five-year period, consumers saw prices running at 3.9%, up from 3.5%.
- Money market futures traders had been priced in 67 basis points of easing by the Fed toward the end of the year, down from 74 a day ago.
- A Reuters poll showed that 70 out of 74 economists say the risk of recession has risen in the US, Canada and Mexico.
- In the boiler room, trade disputes between the US and Mexico remain front and center. If the countries reach an agreement, it could pave the way for a recovery of the Mexican currency. Otherwise, further USD/MXN upside is seen as US tariffs could trigger a recession in Mexico.
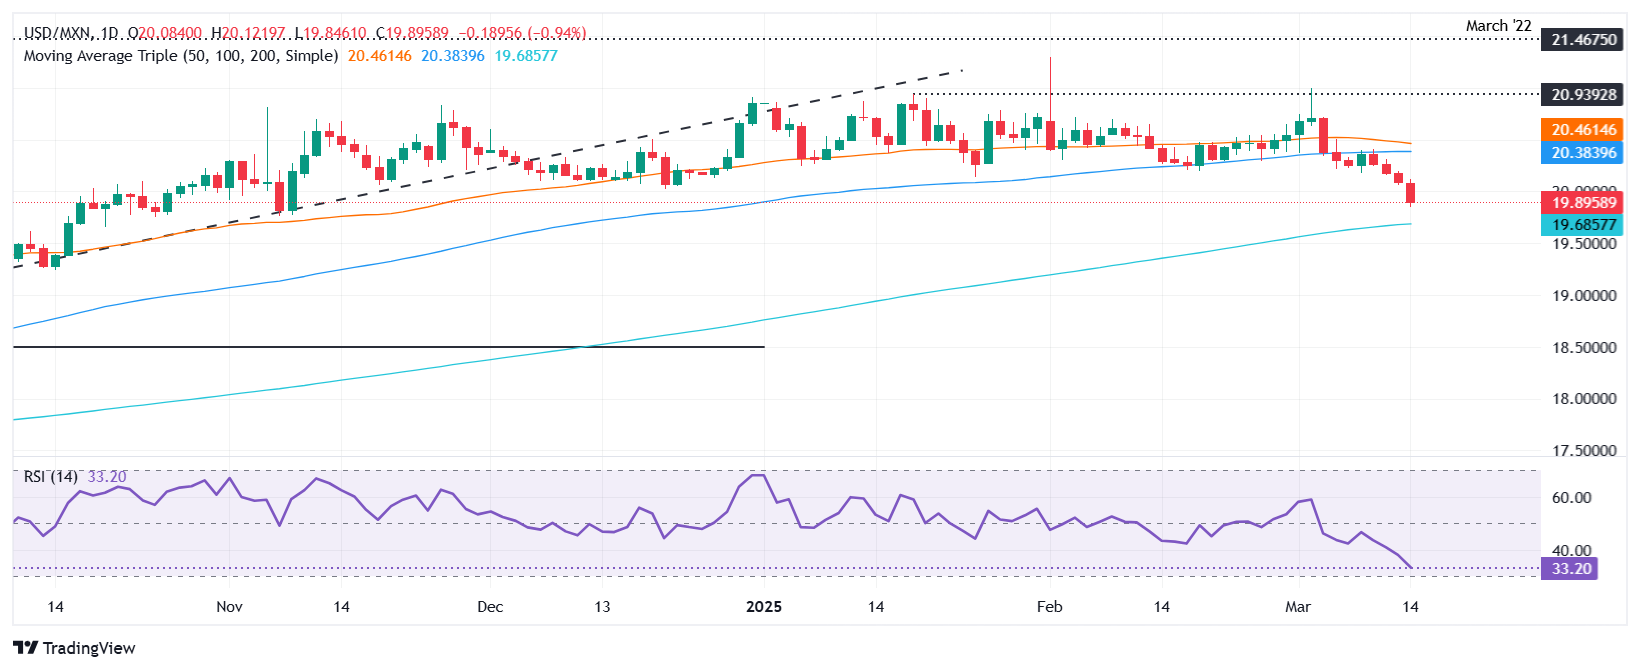
USD/MXN technical outlook: Mexican Peso surges as USD/MXN collapses below 20.00
The USD/MXN finally cleared the 20.00 figure, hitting a fourth-month low of 19.84 earlier during the North American session. Momentum favors further downside on the pair as depicted by the Relative Strength Index (RSI) turning bearish and closing into oversold territory. Hence, the path of least resistance is tilted to the downside.
The USD/MXN first support would be the 200-day Simple Moving Average (SMA) at 19.67. If surpassed, the next stop would be the 19.50 figure, ahead of the September 18 swing low of 19.06. For a bullish resumption, the pair’s first ceiling level is 20.00. A decisive break will expose the 100-day SMA at 20.35.
Mexican Peso FAQs
The Mexican Peso (MXN) is the most traded currency among its Latin American peers. Its value is broadly determined by the performance of the Mexican economy, the country’s central bank’s policy, the amount of foreign investment in the country and even the levels of remittances sent by Mexicans who live abroad, particularly in the United States. Geopolitical trends can also move MXN: for example, the process of nearshoring – or the decision by some firms to relocate manufacturing capacity and supply chains closer to their home countries – is also seen as a catalyst for the Mexican currency as the country is considered a key manufacturing hub in the American continent. Another catalyst for MXN is Oil prices as Mexico is a key exporter of the commodity.
The main objective of Mexico’s central bank, also known as Banxico, is to maintain inflation at low and stable levels (at or close to its target of 3%, the midpoint in a tolerance band of between 2% and 4%). To this end, the bank sets an appropriate level of interest rates. When inflation is too high, Banxico will attempt to tame it by raising interest rates, making it more expensive for households and businesses to borrow money, thus cooling demand and the overall economy. Higher interest rates are generally positive for the Mexican Peso (MXN) as they lead to higher yields, making the country a more attractive place for investors. On the contrary, lower interest rates tend to weaken MXN.
Macroeconomic data releases are key to assess the state of the economy and can have an impact on the Mexican Peso (MXN) valuation. A strong Mexican economy, based on high economic growth, low unemployment and high confidence is good for MXN. Not only does it attract more foreign investment but it may encourage the Bank of Mexico (Banxico) to increase interest rates, particularly if this strength comes together with elevated inflation. However, if economic data is weak, MXN is likely to depreciate.
As an emerging-market currency, the Mexican Peso (MXN) tends to strive during risk-on periods, or when investors perceive that broader market risks are low and thus are eager to engage with investments that carry a higher risk. Conversely, MXN tends to weaken at times of market turbulence or economic uncertainty as investors tend to sell higher-risk assets and flee to the more-stable safe havens.
-
17:02
United States Baker Hughes US Oil Rig Count: 487 vs 486
-
15:27
GBP/USD slides as UK economy falters ahead of central bank bonanza
- GBP/USD drops but holds above key 1.2900 psychological level amid ongoing uncertainty.
- UK economy unexpectedly shrank 0.1% in January, raising bets on future Bank of England rate cuts.
- US consumer inflation expectations surge, complicating Fed decisions ahead of critical US tariff implementation on April 2.
The Pound Sterling registers back-to-back bearish days, dropping some 0.14% on Friday against the Greenback after economic data from the UK revealed that the Gross Domestic Product (GDP) contracted. Despite this, the GBP/USD trades above the 1.2900 figure, poised to finish the day near that level.
GBP/USD pressured after UK GDP miss, while rising US inflation expectations complicate Fed's next move
Recently, data from the University of Michigan (UoM) showed that Consumer Sentiment in March deteriorated, from 64.7 to 57.9, below forecast of 63.1m showed the survey. Notably, inflation expectations jumped, with Americans seeing 12-month inflation up from 4.3% to 4.9%. Over a five-year period, consumers saw prices running at 3.9%, up from 3.5%.
GBP/USD traders' eyes are on next week’s central bank bonanza, beginning with the Federal Reserve. Last Friday, Fed Chair Jerome Powell revealed that “market measures of inflation expectations have moved up, driven by tariffs.”
Therefore, today’s reading could prevent the Fed from easing policy as US President Donald Trump will enact reciprocal tariffs on April 2.
Across the pond, the British economy shrank unexpectedly by -0.1% MoM in January, missing the 0.1% expansion estimated by analysts, after the data, interest rates swaps priced in 56 basis points of interest rate cuts by the Bank of England (BoE) in 2025, which is expected to hold rates next Thursday.
Next week, data from the UK will feature the jobs report, S&P Global Flash PMIs, and the BoE interest rate decision. For the US, traders will look at Retail Sales, housing data, the Fed’s monetary policy decisions, and economic projections.
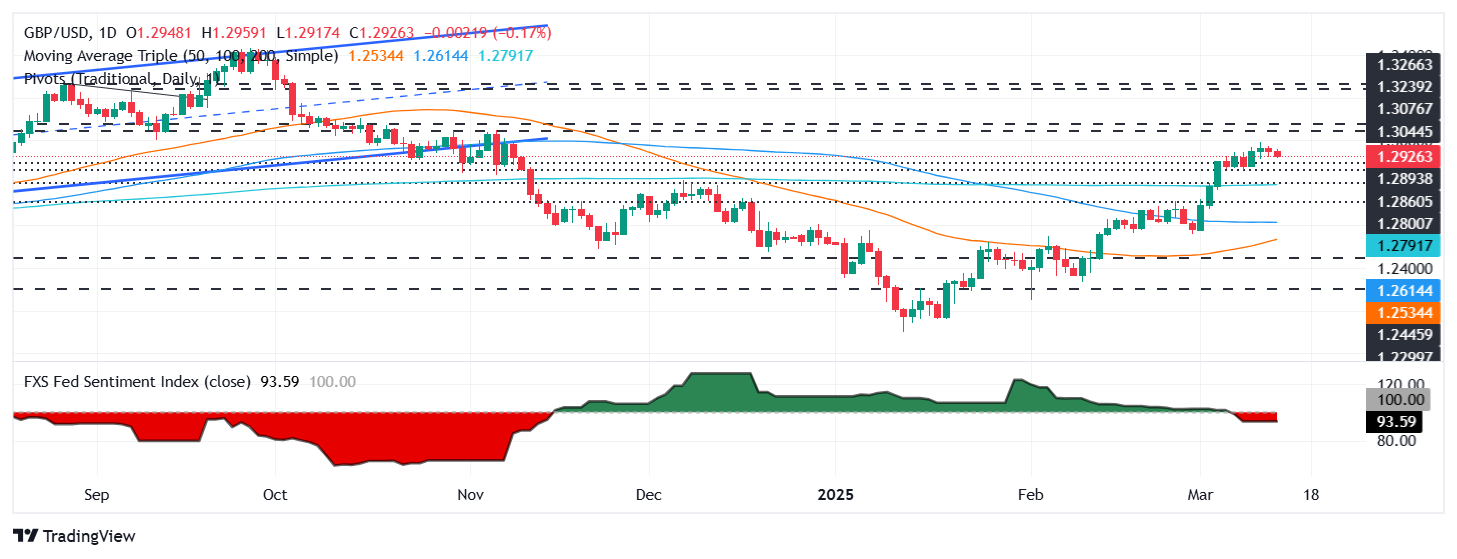
GBP/USD Price Forecast: Technical outlook
Despite retreating towards 1.2900 and reaching a two-day low of 1.2916, traders seem reluctant to push GBP/USD lower, after the pair cleared the 200-day Simple Moving Average (SMA) at 1.2791, on March 5. If buyers clear 1.2950, the next resistance would be 1.3000. Conversely, a drop beneath 1.2900 will expose the current week’s low of 1.2860, which is ahead of the 200-day SMA.
British Pound PRICE Today
The table below shows the percentage change of British Pound (GBP) against listed major currencies today. British Pound was the strongest against the Japanese Yen.
USD EUR GBP JPY CAD AUD NZD CHF USD -0.29% 0.14% 0.45% -0.34% -0.63% -0.86% 0.27% EUR 0.29% 0.47% 0.73% -0.04% -0.35% -0.58% 0.65% GBP -0.14% -0.47% 0.25% -0.53% -0.81% -1.03% 0.18% JPY -0.45% -0.73% -0.25% -0.79% -1.07% -1.29% -0.07% CAD 0.34% 0.04% 0.53% 0.79% -0.27% -0.52% 0.70% AUD 0.63% 0.35% 0.81% 1.07% 0.27% -0.23% 0.94% NZD 0.86% 0.58% 1.03% 1.29% 0.52% 0.23% 1.23% CHF -0.27% -0.65% -0.18% 0.07% -0.70% -0.94% -1.23% The heat map shows percentage changes of major currencies against each other. The base currency is picked from the left column, while the quote currency is picked from the top row. For example, if you pick the British Pound from the left column and move along the horizontal line to the US Dollar, the percentage change displayed in the box will represent GBP (base)/USD (quote).
-
15:03
Colombia Retail Sales (YoY) came in at 10.2%, above expectations (6.8%) in January
-
14:04
US UoM Consumer Sentiment Index is seen declining to 57.9 in March
- Consumer confidence in the US declined markedly in early March.
- One-year inflation expectation edged higher to 4.9%.
US Consumer Sentiment took a dip in early March, according to the preliminary reading of the University of Michigan’s Consumer Sentiment Index. The gauge slipped from 64.7 in February to 57.9, missing the market’s forecast.
Breaking it down further, the Current Conditions Index edged down from 65.7 to 63.5, while the Consumer Expectations Index moved from 64.0 to 54.2.
On the inflation front, the survey revealed a noticeable uptick in one-year inflation expectations—from 4.3% to 4.9%—and the five-year outlook rose from 3.5% to 3.9%.
Market reaction
The release of the indicator did not move the Greenback’s dial, with the US Dollar Index (DXY) resuming its downtrend after two-daily upticks in a row and revisiting the 103.80 region, down modestly for the day.
-
14:00
Russia Foreign Trade increased to $7.159B in January from previous $5.575B
-
14:00
United States UoM 5-year Consumer Inflation Expectation rose from previous 3.5% to 3.9% in March
-
14:00
United States Michigan Consumer Sentiment Index came in at 57.9, below expectations (63.1) in March
-
13:54
EUR/USD briefly back at 1.09 after Trump’s tariffs face headwind
- EUR/USD briefly heads back to 1.0900 on a flurry of headlines on Friday.
- The World Trade Organization could examine if US President Trump’s tariff policy is illegal.
- Markets have a sign of relief on the odds of a spending bill being passed, avoiding the US government shutdown, later this Friday.
The EUR/USD pair edges higher and recovers to 1.0900 at the time of writing on Friday, erasing its sluggish performance from earlier this week. The resurgence in the pair comes after two headlines emerged late Thursday. United States (US) Senate Democratic Leader Chuck Schumer announced that he plans to vote to keep the government open, backing the House-passed government funding measures and effectively ending the shutdown risk in the US.
Meanwhile, Canada initiated a dispute complaint at the World Trade Organization (WTO) and requested a look into US President Donald Trump’s tariff implementations, which might be illegal and contradict the WTO trade rules, Reuters reports. That would mean a huge setback for President Trump’s plans ahead of the reciprocal tariffs that will take effect in April.
Daily digest market movers: Last call
- Gold, as a safe haven asset, has breached the $3,000 mark on Friday in a recession-feared-induced rally as traders are concerned about economic growth and the tariffs outlook, with reciprocal levies coming into effect in April.
- At 14:00 GMT, the University of Michigan will release its preliminary consumer expectations reading for March:
- The US Consumer Sentiment Index is expected to decline to 63.1 from 64.7 in February.
- The US 5-year Consumer Inflation Expectation has no forecast and was 3.5% in the final February reading.
- Equities are attempting to brush off this week’s negative tone. All indices are up over 0.50% across Europe and the US on Friday.
- The CME Fedwatch Tool projects a 97.0% chance for the Federal Reserve (Fed) to keep interest rates unchanged in Wednesday’s upcoming decision. The chances of a rate cut at the May meeting stand at 32.8%, while they show a 78.5% probability of rates being lower than current levels in June.
- The US 10-year yield trades around 4.329%, off its near five-month low of 4.10% printed on March 4 and after hitting a five-day high on Thursday.
Technical Analysis: A vital close
Friday’s close is vital for the EUR/USD pair. From the looks on the technical charts, the pair has good odds of closing above a crucial ascending trend line (green in the chart below), which offered support on Thursday and Friday. A close above that line would mean that the 1.1000 psychological level could get in the cards heading into next week.
On the upside, 1.1000 is the key level to look out for. Once that level is breached, the pair enters the famous 1.1000-1.1500 range, where often it tends to stay for quite some time. Certainly, the 1.1200 big figure, which coincides with the highs of September and October last year, looks interesting for a brief test and possible breach higher.
On the downside, the ascending trend line at 1.0840 should still provide support for now. In case it breaks, the road is open to head into the 1.0700 region. The 200-day Simple Moving Average (SMA) around 1.0722 should be key for traders who want to buy the dip.
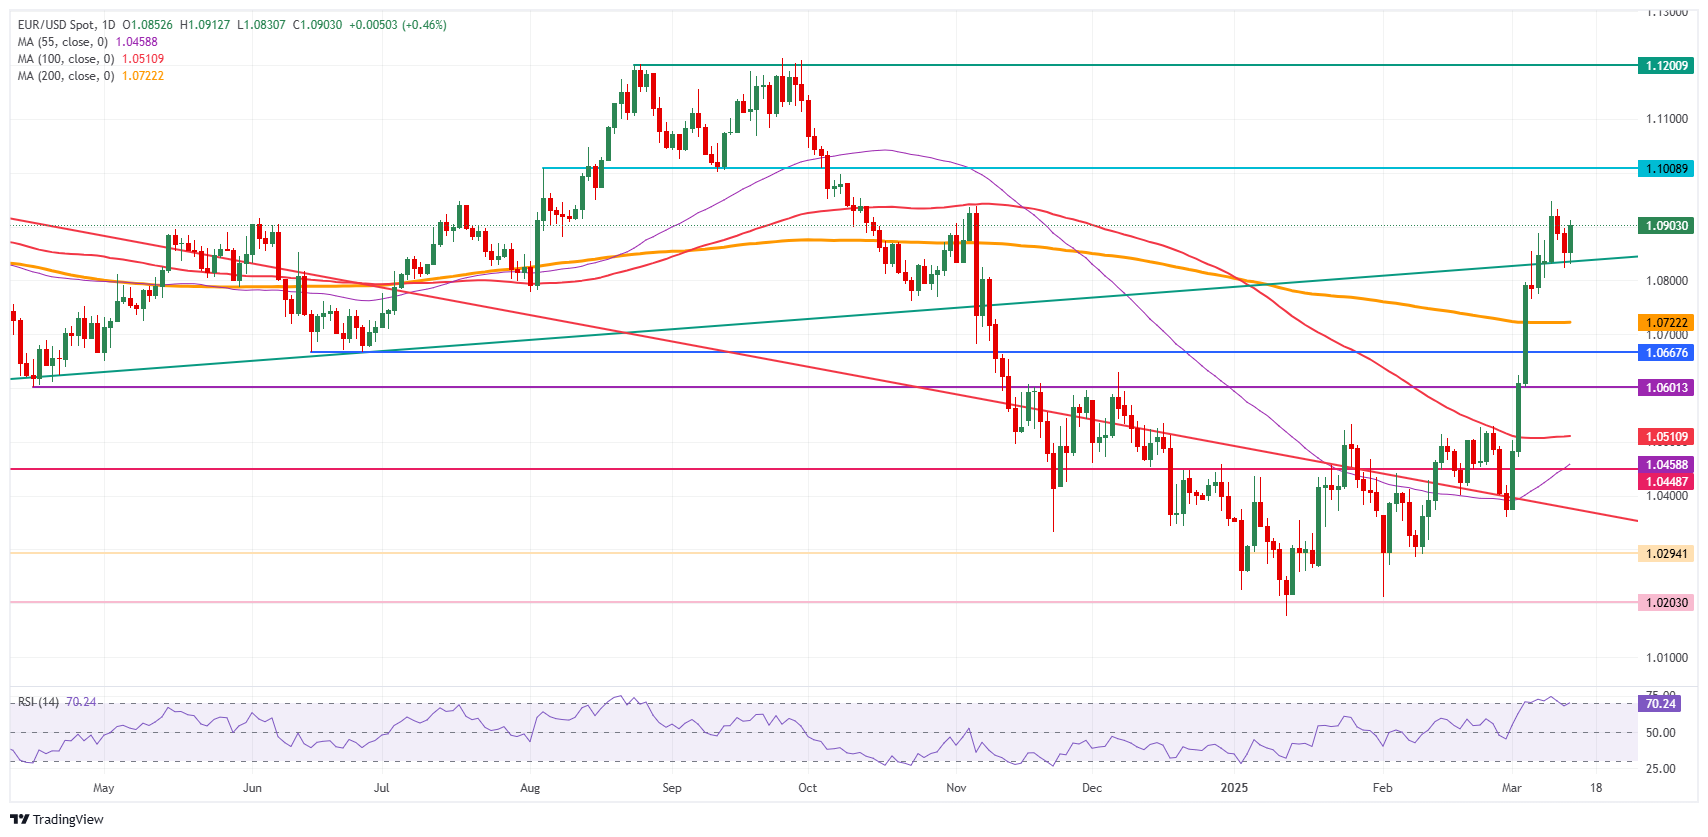
EUR/USD: Daily Chart
US-China Trade War FAQs
Generally speaking, a trade war is an economic conflict between two or more countries due to extreme protectionism on one end. It implies the creation of trade barriers, such as tariffs, which result in counter-barriers, escalating import costs, and hence the cost of living.
An economic conflict between the United States (US) and China began early in 2018, when President Donald Trump set trade barriers on China, claiming unfair commercial practices and intellectual property theft from the Asian giant. China took retaliatory action, imposing tariffs on multiple US goods, such as automobiles and soybeans. Tensions escalated until the two countries signed the US-China Phase One trade deal in January 2020. The agreement required structural reforms and other changes to China’s economic and trade regime and pretended to restore stability and trust between the two nations. However, the Coronavirus pandemic took the focus out of the conflict. Yet, it is worth mentioning that President Joe Biden, who took office after Trump, kept tariffs in place and even added some additional levies.
The return of Donald Trump to the White House as the 47th US President has sparked a fresh wave of tensions between the two countries. During the 2024 election campaign, Trump pledged to impose 60% tariffs on China once he returned to office, which he did on January 20, 2025. With Trump back, the US-China trade war is meant to resume where it was left, with tit-for-tat policies affecting the global economic landscape amid disruptions in global supply chains, resulting in a reduction in spending, particularly investment, and directly feeding into the Consumer Price Index inflation.
-
13:51
GBP consolidates in mid-1.29s – Scotiabank
Pound Sterling (GBP) is little changed on the session after UK GDP data fell 0.1% in the January month, a little weaker than forecast, Scotiabank's Chief FX Strategist Shaun Osborne notes.
GBP/USD appears to be consolidating ahead of another push higher
"The rolling 3m/3m measure rose 0.2%, in line with forecasts. Weak January activity was the result of global uncertainty and tariff concerns, UK Chancellor Reeves suggested, but the UK economy’s struggle to grow away from stagnation continues, regardless."
"The GBP has not made a lot of headway this week but it hasn’t lost much ground either. The GBP rally has stalled but there is no strong sign from price action that recent gains are poised to reverse. Rather, the market appears to be consolidating ahead of another push higher. Short -term support is 1.2910. Resistance (and minor bull trigger) is 1.2955 and 1.2990."
-
13:47
EUR/USD: Signs that German parties agree on debt package – Scotiabank
The EUR is tracking higher on the session, with late week dips to the low 1.08 zone prompting some renewed buying interest from bargain hunters. Short-term EZ/US spreads have nudged a fraction narrower this morning, providing some underpinning for spot, Scotiabank's Chief FX Strategist Shaun Osborne notes.
EUR jumps on the day
"The EUR remains undervalued relative to my equilibrium estimate (1.0957). Final CPI data for February saw German data unchanged (0.4% m/m, 2.3% y/y). French and Spanish headline data were also unrevised. The EUR advance has accelerated just as we go to print on news that German political parties had reached an agreement on the Chancellor Merz’s spending package."
"Solid gains in the EUR through late morning European trade suggest spot’s recent consolidation from Tuesday’s peak near 1.0950 is breaking down and EUR gains are resuming. Recall that underlying trend momentum is solidly EUR-bullish, with DMI oscillators aligned positively for the EUR across the short-, medium– and long-term studies."
"This typically means limited counter-trend corrections and an ongoing bid in the market. Resistance is 1.0950/55 but the potential for a retest of the 1.12 September highs is strong."
-
13:43
CAD holds range on the day – Scotiabank
The Canadian Dollar (CAD) is trading slightly more firmly on the session, helped by an improvement in risk appetite that has lifted high beta FX generally, Scotiabank's Chief FX Strategist Shaun Osborne notes.
Markets await tariff developments
"Broad range trading is likely to persist in the short run as markets await developments on tariffs and the new Canadian government’s approach to these challenges. The CAD continues to trade well below my fair value estimate—equilibrium is holding around the 1.41 level into the end of the week—which should at least help curb scope for further CAD losses for now, all else equal."
"Spot losses from the early week peak around 1.4520 continue to suggest (via a bearish 'evening star' candle pattern on the daily chart) that a short-term top in funds is in place at least. The USD is a reluctant loser at the moment, however, and so more, flattish range trading is likely in the short run. Support is 1.4350."
-
13:40
USD slips on the day – Scotiabank
The Dollar Index (DXY) is trading lower at the end of the week. Dollar gains on the day are concentrated against the JPY and CHF, with havens falling as equity markets rebound amid hopes that a US government shutdown will be avoided. Note, however, that gold traded above $3000 for the first time this morning, reflecting ongoing demand for a hiding place from broader uncertainty as trade wars intensify and sovereign investors passively diversifying from the USD, Scotiabank's Chief FX Strategist Shaun Osborne notes.
USD slide extends into the end of the week
"Most of the major currencies are showing gains versus the USD on the session so far and the DXY is slipping towards a net loss on the week overall. I still rather think the broader trend in the DXY is geared towards further declines in the coming weeks towards the 100/102 range. Chinese stocks jumped more than 2% earlier as investors anticipate stimulus measures will result from a government briefing on boosting consumption next Monday."
"US equity futures are positive but more than half of the stocks in the S&P 500 are in 'correction' mode now and market breadth is quite weak, with just 35% of NYSE stocks trading above their 200-day MA. It’s not difficult to think that conditions point to more softness in stocks as tariff risks remain prominent. Losses for the S&P 500 are around 6% since the start of the year. Fedex has underperformed the broader market by a significant margin, falling 14% YTD terms. Fedex is something of a bellwether for global trade so the downturn augurs for some slowing in global trade volumes in the coming months after a pickup last year."
"That is no great surprise in the current environment, but it does reflect obvious headwinds for global growth momentum. The U. Michigan sentiment data is the only economic release from the US today. March data is expected to reflect a third consecutive monthly drop in sentiment, reflecting consumer concerns about the erratic roll out of tariffs, DOGE-driven austerity and worries that the Trump platform could slow growth momentum in the next couple of quarters."
-
13:30
Germany Current Account n.s.a. fell from previous €24B to €11.8B in January
-
12:30
Canada Wholesale Sales (MoM) came in at 1.2%, below expectations (1.9%) in January
-
12:18
United Kingdom NIESR GDP Estimate (3M) up to 0.4% in February from previous 0.3%
-
12:05
US Dollar trades slightly lower ahead of final US data of the week
- The US Dollar trades slightly lower on Friday after recovering initial weekly losses.
- The US Dollar has barely been affected by the geopolitical events this week.
- The US Dollar Index has been limited by the 104.00 hurdle and looks to be closing off the week in a negative tone.
The US Dollar Index (DXY), which tracks the performance of the US Dollar (USD) against six major currencies, sees volatility abate this week. The index, which has been limited below the 104.00 hurdle this week, hasn’t moved that much despite rumors of a possible ceasefire deal by Ukraine, the first steps in the German spending plan voting and retaliations from Canada and Europe on US tariffs.
On the economic data front, the final releases are expected later this Friday. The University of Michigan will publish its preliminary consumer sentiment reading for March and the 5-year inflation expectation.
Daily digest market movers: Calming down towards the weekend
- Gold as a safe haven asset has breached the $3,000 mark this Friday in a recession-feared-induced rally where traders are much concerned about economic growth and the tariffs outlook, with reciprocal levies coming into effect in April.
- A government shutdown looks to be avoided after Senate Minority Leader Chuck Schumer is said to back the House-passed funding measure.
- At 14:00 GMT, the University of Michigan will release its preliminary reading for March:
- The US Consumer Sentiment Index is expected to decline by 63.1, coming from 64.7.
- The US 5-year Consumer Inflation Expectation has no forecast and was at 3.5% in the final February reading.
- Equities are making another attempt to brush off the negative tone for this week. All indices are up over 0.50% across Europe and in the US.
- The CME Fedwatch Tool projects a 97.0% chance for no interest rate changes in the upcoming Fed meeting on March 19. The chances of a rate cut at the May 7 meeting stand at 32.8% and 78.5% at June’s meeting.
- The US 10-year yield trades around 4.329%, off its near five-month low of 4.10% printed on March 4 and after hitting a five-day high on Thursday.
US Dollar Index Technical Analysis: Does it make sense?
The US Dollar Index (DXY) shows bearish fatigue after its steep downward correction last week. Volatility in its price action completely eroded, and even the DXY stabilizes on Friday after recovering initial weekly losses. While tensions build-up ahead of reciprocal tariffs taking effect in April, it looks like the US Dollar Index might be on the verge of paring back some of the previous week’s losses when assessing the direction into next week.
Upside risk is a rejection at 104.00 that could result in more downturn. If bulls can avoid that, look for a large sprint higher towards the 105.00 round level, with the 200-day Simple Moving Average (SMA) at 105.02. Once broken through that zone, a string of pivotal levels, such as 105.53 and 105.89, will present as caps.
On the downside, the 103.00 round level could be considered a bearish target in case US yields roll off again, with even 101.90 not unthinkable if markets further capitulate on their long-term US Dollar holdings.
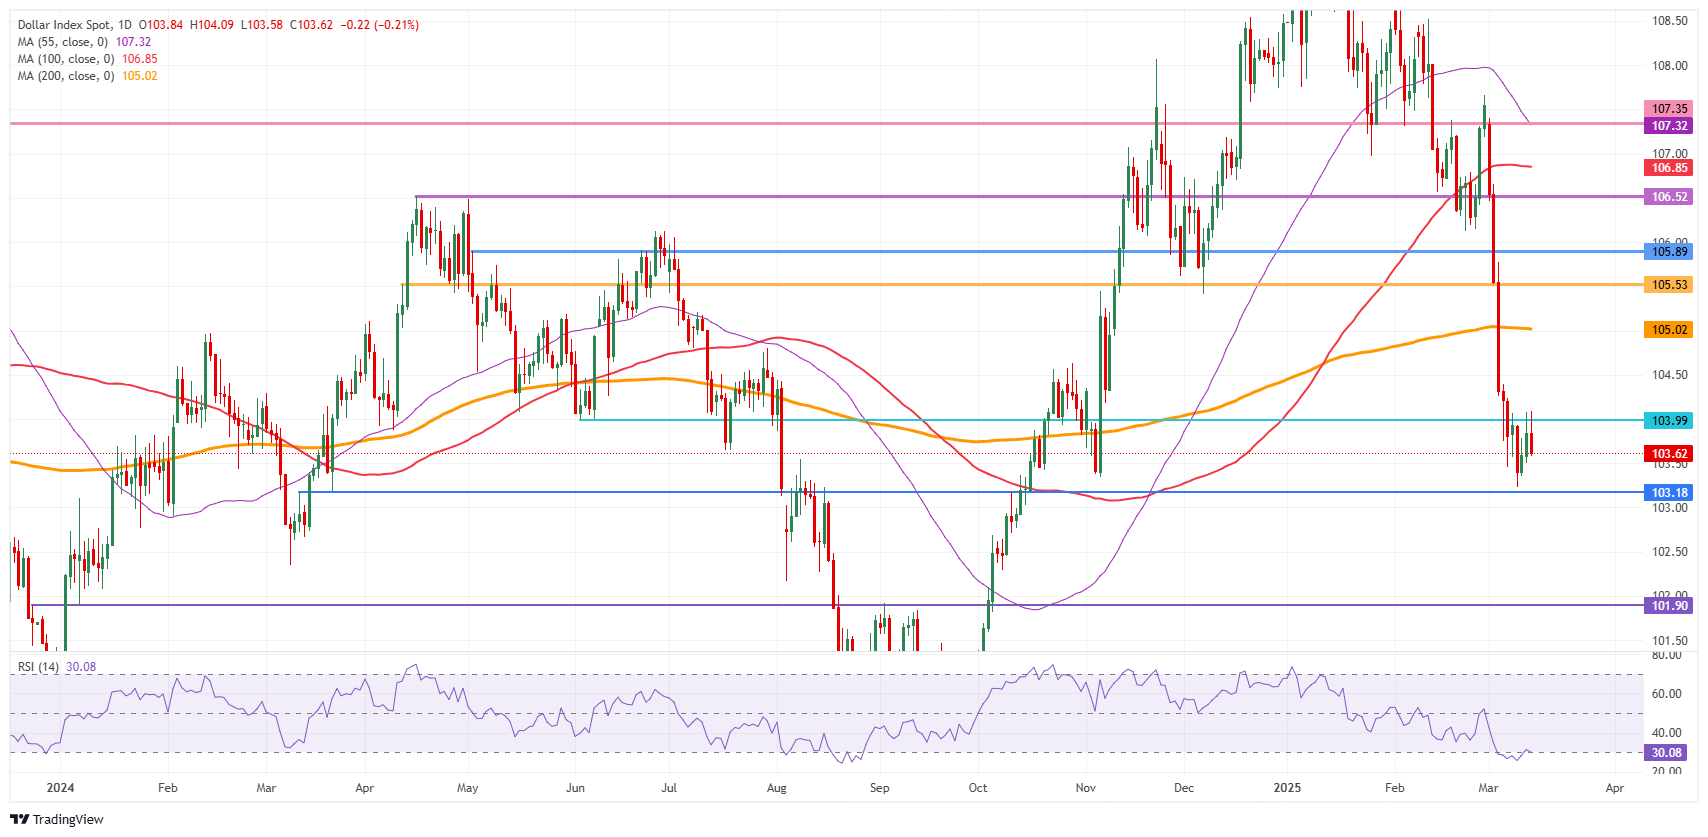
US Dollar Index: Daily Chart
US-China Trade War FAQs
Generally speaking, a trade war is an economic conflict between two or more countries due to extreme protectionism on one end. It implies the creation of trade barriers, such as tariffs, which result in counter-barriers, escalating import costs, and hence the cost of living.
An economic conflict between the United States (US) and China began early in 2018, when President Donald Trump set trade barriers on China, claiming unfair commercial practices and intellectual property theft from the Asian giant. China took retaliatory action, imposing tariffs on multiple US goods, such as automobiles and soybeans. Tensions escalated until the two countries signed the US-China Phase One trade deal in January 2020. The agreement required structural reforms and other changes to China’s economic and trade regime and pretended to restore stability and trust between the two nations. However, the Coronavirus pandemic took the focus out of the conflict. Yet, it is worth mentioning that President Joe Biden, who took office after Trump, kept tariffs in place and even added some additional levies.
The return of Donald Trump to the White House as the 47th US President has sparked a fresh wave of tensions between the two countries. During the 2024 election campaign, Trump pledged to impose 60% tariffs on China once he returned to office, which he did on January 20, 2025. With Trump back, the US-China trade war is meant to resume where it was left, with tit-for-tat policies affecting the global economic landscape amid disruptions in global supply chains, resulting in a reduction in spending, particularly investment, and directly feeding into the Consumer Price Index inflation.
-
12:00
Brazil Retail Sales (MoM) above forecasts (-0.2%) in January: Actual (-0.1%)
-
11:30
India FX Reserves, USD up to $653.97B in March 3 from previous $638.7B
-
10:37
JPY is under a downward pressure – BBH
Japanese Yen (JPY) is under broad downside pressure in line with a modest recovery in equity markets, BBH FX analysts report.
BOJ is unlikely to tighten the policy by more than expected
"Japan's largest labor union group, Rengo, secured a 5.46% average pay gain. That’s the highest level since 1991 and exceeded last year’s initial reading of 5.28%. Still, the pay hike was more modest than anticipated as members were asking an average wage increase of 6.09% this year."
"As such, the BOJ is unlikely to tighten the policy by more than is currently priced which is a headwind for JPY. The swaps market continues to imply less than 50bps of rate hikes over the next twelve months."
-
10:35
GBP trades lower vs USD and EUR – BBH
Pound Sterling (GBP) is down versus US Dollar (USD) and Euro (EUR). UK economic activity unexpectedly shrinks in January, BBH FX analysts report.
BOE is expected to pause easing at its March 20 meeting
"Real GDP fell -0.1% m/m (consensus: 0.1%) vs. 0.4% in December driven by a -0.9% m/m contraction in the production sector and a -0.2% m/m decline in construction output. The service sector grew 0.1% m/m vs. 0.4% in December. Real GDP is on track to undershoot the Bank of England’s (BOE) Q1 projection of 0.4% q/q."
"Still, the BOE is expected to pause easing at its March 20 meeting in part because services inflation remains high at 5% y/y. Over the next 12 months, the swaps market is pricing in 50bps of cuts and small odds of an additional 25bps cut. Bottom line: the UK’s near-term stagflation backdrop can continue to weigh on GBP against EUR."
-
10:30
Gold prices finally break above the recent range – Société Générale
Gold has broken out above the upper limit of the range within which it consolidated since February denoting possibility of extension in uptrend, Société Générale's FX analysts note.
Next objectives are located at projections of $3015 and $3035/3050
"Daily MACD is at a lower level than February highlighting receding upward momentum however signals of a meaningful pullback are not yet visible in price action. Next objectives are located at projections of $3015 and $3035/3050 which is also the upper limit of an ascending channel. Recent pivot low of $2880 is a crucial support in case a brief pullback materializes."
-
10:27
EUR/GBP to remain bearish in the near term – Danske Bank
EUR/GBP took a breather during yesterday's session after rising more than 2% since the beginning of March, Danske Bank's FX analysts Kristoffer Kjær Lomholt and Filip Andersson report.
EUR/GBP to target 0.81 in 12 months
"While global developments remain at the front and centre for the cross, focus today returns to the release of domestic data. This morning, we get the monthly GDP figures for January where consensus expects GDP growth at 0.1% m/m, down from 0.4% in December."
"While the growth outlook remains subdued at present, we expect both private and public consumption to boost growth the coming quarters. We remain modestly bearish on EUR/GBP, targeting the cross at 0.81 in 12M."
-
10:25
USD/CNH: Any advance is unlikely to reach 7.2650 – UOB Group
US Dollar (USD) is expected to edge higher vs Chinese Yuan (CNH); any advance is unlikely to reach 7.2650. In the longer run, current price movements are likely part of a 7.2100/7.2800 consolidation range, UOB Group's FX analysts Quek Ser Leang and Peter Chia note.
Price movements are part of a 7.2100/7.2800 consolidation range
24-HOUR VIEW: "Yesterday, we were of the view that USD 'is likely to trade in a range between 7.2230 and 7.2520.' USD then traded in a 7.2301/7.2533 range. There has been a slight increase in upward momentum. Today, we expect USD to edge higher. However, we do not expect any advance to reach the resistance at 7.2650. Support is at 7.2400, followed by 7.2300."
1-3 WEEKS VIEW: "After holding a negative USD view since late last week, we indicated two days ago (12 Mar, spot at 7.2330) that 'while there has been no significant increase in downward momentum, USD could potentially drop to 7.2000.' Since then, USD has not been able to make further headway on the downside, and downward momentum has eased. We view the current price movements as part of a 7.2100/7.2800 consolidation range."
-
10:20
USD/CNY is trading lower, EUR/CNY – higher – Danske Bank
The CNY has gained versus the USD lately, but it is more a story about USD weakening than CNY strength. The rate spread between US and China has thus narrowed as weaker US data has pushed US bond yields lower, Danske Bank's FX analysts Kristoffer Kjær Lomholt and Filip Andersson report.
PBOC keeps USD/CNY fixing stable around 7.17-7.18
"PBOC continues to keep the USD/CNY fixing stable around 7.17-7.18 in line with their repeated message of a preference for stability. We have been surprised that they haven't let the fixing increase following the 20% increase in US tariffs, but it suggests they are keen on keeping the cross stable."
"Maybe in order to not antagonize Trump and risk more tariffs but likely also to provide some anchor of stability in a world in flux, much as they have done previously, for example during the Asian crisis in 1997/98. It does put some downside risk to our 7.60 12M forecast. With the relative stability in the USD/CNY, the changes in EUR/USD transmit directly into the EUR/CNY cross and hence we have seen it move higher with the increase in EUR/USD."
"As we still see the USD gaining in the medium to long term, the current weaker levels of CNY should be considered to hedge expenses. Not least as the world has become more unpredictable and FX moves can quickly reverse as we have seen recently."
-
10:05
USD/JPY: Expected to trade in a range between 146.50 and 149.50 – UOB Group
US Dollar (USD) is expected to trade in a range vs Japanese Yen (JPY), most likely between 147.45 and 148.70. In the longer run, downward momentum has largely faded; USD is expected to trade in a range between 146.50 and 149.50, UOB Group's FX analysts Quek Ser Leang and Peter Chia note.
Downward momentum has largely faded
24-HOUR VIEW: "Yesterday, we expected USD to 'trade in a range between 147.60 and 148.90.' USD then traded in a lower and narrower range than expected (147.39/148.37), closing at 147.81 (-0.30%). The price action did not result in an increase in either downward or upward momentum, and we continue to expect USD to trade in a range, most likely between 147.45 and 148.70."
1-3 WEEKS VIEW: "Two days ago (12 Mar, spot at 148.00), we revised our view to neutral, indicating that 'downward momentum has largely faded.' We expected USD to “trade in a range between 146.50 and 149.50.” There is no change in our view."
-
10:02
Gold hits fresh record high – ING
Gold reached a fresh record high, trading just shy of US$2,990/oz, following modest US inflation numbers supporting the case for the US Federal Reserve to ease monetary policy, ING's commodity experts Ewa Manthey and Warren Patterson note.
Gold reaches new record highs
"Swap traders are fully pricing in another quarter-point reduction in June, with about 70 basis points of easing seen for all of 2025. Furthermore, concerns tariffs will boost inflation and slow economic growth are fueling demand for safe-haven assets like gold. Total known gold exchange-trade fund holdings have grown by around 3.5moz so far this year to almost 86.4moz."
-
09:58
Kremlin: Both the US and Russia understand there's a need for a Trump-Putin call
The latest headlines crossing the wires via Reuters, citing the Kremlin saying that both the US and Russia understand there's a need for a Trump-Putin call.
Additional takeaways
US and Russia will determine timing of Trump-Putin call once Witkoff has conveyed to Trump the information that he has gotten from Moscow.
There are grounds for cautious optimism.
Putin is in general in solidarity with Trump's position but there's a lot of work to do.
Market reaction
The traditional safe-haven Gold price is trading at fresh all-time highs, flirting with the $3,000 mark on these headlines.
Gold FAQs
Gold has played a key role in human’s history as it has been widely used as a store of value and medium of exchange. Currently, apart from its shine and usage for jewelry, the precious metal is widely seen as a safe-haven asset, meaning that it is considered a good investment during turbulent times. Gold is also widely seen as a hedge against inflation and against depreciating currencies as it doesn’t rely on any specific issuer or government.
Central banks are the biggest Gold holders. In their aim to support their currencies in turbulent times, central banks tend to diversify their reserves and buy Gold to improve the perceived strength of the economy and the currency. High Gold reserves can be a source of trust for a country’s solvency. Central banks added 1,136 tonnes of Gold worth around $70 billion to their reserves in 2022, according to data from the World Gold Council. This is the highest yearly purchase since records began. Central banks from emerging economies such as China, India and Turkey are quickly increasing their Gold reserves.
Gold has an inverse correlation with the US Dollar and US Treasuries, which are both major reserve and safe-haven assets. When the Dollar depreciates, Gold tends to rise, enabling investors and central banks to diversify their assets in turbulent times. Gold is also inversely correlated with risk assets. A rally in the stock market tends to weaken Gold price, while sell-offs in riskier markets tend to favor the precious metal.
The price can move due to a wide range of factors. Geopolitical instability or fears of a deep recession can quickly make Gold price escalate due to its safe-haven status. As a yield-less asset, Gold tends to rise with lower interest rates, while higher cost of money usually weighs down on the yellow metal. Still, most moves depend on how the US Dollar (USD) behaves as the asset is priced in dollars (XAU/USD). A strong Dollar tends to keep the price of Gold controlled, whereas a weaker Dollar is likely to push Gold prices up.
-
09:57
US natural gas storage falls more than expected – ING
US natural gas storage fell more than expected over the last week, ING's commodity experts Ewa Manthey and Warren Patterson note.
The release provides short-term support to the market
"Energy Information Administration (EIA) data shows that working storage fell by 62bcf, more than the 50bcf the market was expecting. Total storage is now 11.9% below the five-year average. The release provided some short-term support to the market. However, forecasts for warmer weather over parts of the US made it short-lived."
-
09:54
NZD/USD: Expected to trade between 0.5675 and 0.5725 – UOB Group
New Zealand Dollar (NZD) is expected to trade between 0.5675 and 0.5725 vs US Dollar (USD). In the longer run, current price movements are likely part of a range trading phase between 0.5640 and 0.5765, UOB Group's FX analysts Quek Ser Leang and Peter Chia note.
Current price movements are likely part of a range trading phase
24-HOUR VIEW: "When NZD was at 0.5730 yesterday, we indicated that, 'provided that 0.5700 holds, NZD could rise and test 0.5760.' Our assessment was incorrect as NZD dropped to a low of 0.5683. The price movements did not result in a significant increase in downward momentum. Our view today is for NZD to trade between 0.5675 and 0.5725."
1-3 WEEKS VIEW: "We highlighted on Tuesday (10 Mar, spot at 0.5695) that the recent price action did not result 'in any increase in momentum,' and a break of 0.5660 (‘strong support’ level) would mean that the recovery is not reaching 0.5775.' NZD traded in a range over the past couple of days. While our strong support level has not been breached yet, upward momentum has faded. The current price movements are likely part of a range trading phase, most likely between 0.5640 and 0.5765."
-
09:46
Oil: Surplus environment – ING
Oil prices couldn’t escape a broader risk-off move amid intense selling of US equities and global growth concerns. ICE Brent settled a little more than 1.5% down on the day. A somewhat bearish release from the International Energy Agency (IEA) hardly helped, ING's commodity experts Ewa Manthey and Warren Patterson note.
Non-OPEC+ supply is forecast to grow by around 1.5m b/d this year
"In its latest monthly oil market report, the IEA highlighted risks that trade and tariff uncertainty pose to oil demand. The agency expects global oil demand to grow by a bit over 1m b/d in 2025. The IEA marginally revised lower demand growth estimates for the fourth quarter of 2024 and the first quarter of 2025."
"It estimates that global oil supply grew by 240k b/d in February as OPEC+, and in particular Kazakhstan, saw output hit a record high. Non-OPEC+ supply is forecast to grow by around 1.5m b/d this year, while OPEC+ supply depends on what the group does with supply cuts after April. The IEA forecasts that the global oil market will be in a 600k b/d surplus in 2025. There’s a risk that this will grow to 1m b/d if OPEC+ unwind cuts through the year."
"The ICE gasoil crack continues to come under pressure, trading below US$17/bbl and to its lowest level this year. Improved middle distillate flows through the Suez Canal supported the move lower in the crack. However, further weakness may be limited given that Amsterdam-Rotterdam-Antwerp (ARA) gasoil stocks have declined for 5 consecutive weeks, falling by 95kt over the last week to 2.27mt."
-
09:32
United Kingdom Consumer Inflation Expectations: 3.4% vs 3%
-
09:30
Silver price today: Silver rises, according to FXStreet data
Silver prices (XAG/USD) rose on Friday, according to FXStreet data. Silver trades at $33.93 per troy ounce, up 0.22% from the $33.85 it cost on Thursday.
Silver prices have increased by 17.42% since the beginning of the year.
Unit measure Silver Price Today in USD Troy Ounce 33.93 1 Gram 1.09
The Gold/Silver ratio, which shows the number of ounces of Silver needed to equal the value of one ounce of Gold, stood at 88.31 on Friday, broadly unchanged from 88.30 on Thursday.
Silver FAQs
Silver is a precious metal highly traded among investors. It has been historically used as a store of value and a medium of exchange. Although less popular than Gold, traders may turn to Silver to diversify their investment portfolio, for its intrinsic value or as a potential hedge during high-inflation periods. Investors can buy physical Silver, in coins or in bars, or trade it through vehicles such as Exchange Traded Funds, which track its price on international markets.
Silver prices can move due to a wide range of factors. Geopolitical instability or fears of a deep recession can make Silver price escalate due to its safe-haven status, although to a lesser extent than Gold's. As a yieldless asset, Silver tends to rise with lower interest rates. Its moves also depend on how the US Dollar (USD) behaves as the asset is priced in dollars (XAG/USD). A strong Dollar tends to keep the price of Silver at bay, whereas a weaker Dollar is likely to propel prices up. Other factors such as investment demand, mining supply – Silver is much more abundant than Gold – and recycling rates can also affect prices.
Silver is widely used in industry, particularly in sectors such as electronics or solar energy, as it has one of the highest electric conductivity of all metals – more than Copper and Gold. A surge in demand can increase prices, while a decline tends to lower them. Dynamics in the US, Chinese and Indian economies can also contribute to price swings: for the US and particularly China, their big industrial sectors use Silver in various processes; in India, consumers’ demand for the precious metal for jewellery also plays a key role in setting prices.
Silver prices tend to follow Gold's moves. When Gold prices rise, Silver typically follows suit, as their status as safe-haven assets is similar. The Gold/Silver ratio, which shows the number of ounces of Silver needed to equal the value of one ounce of Gold, may help to determine the relative valuation between both metals. Some investors may consider a high ratio as an indicator that Silver is undervalued, or Gold is overvalued. On the contrary, a low ratio might suggest that Gold is undervalued relative to Silver.
(An automation tool was used in creating this post.)
-
09:15
AUD/USD: Likely to trade in a 0.6260/0.6315 range – UOB Group
Australian Dollar (AUD) is likely to trade in a 0.6260/0.6315 range vs US Dollar (USD). In the longer run, slightly firm underlying tone suggests AUD is likely to trade in a higher range of 0.6245/0.6385, UOB Group's FX analysts Quek Ser Leang and Peter Chia note.
Slightly firm underlying tone
24-HOUR VIEW: "We noted yesterday that AUD 'is facing mild upward pressure.' We indicated that it 'is likely to edge higher but is unlikely to threaten the major resistance at 0.6355.' However, AUD rose less than expected (high of 0.6335) and then fell sharply to a low of 0.6269. The decline lacks momentum, and instead of continuing to weaken, AUD is more likely to trade in a lower range of 0.6260/0.6315."
1-3 WEEKS VIEW: "We continue to hold the same view as yesterday (12 Mar, spot at 0.6325). As highlighted, we 'continue to expect AUD to trade in a range, but the slightly firm underlying tone suggests a higher range of 0.6245/0.6385.”
-
09:08
Palladium price today: Rare metals mixed at the start of the European session
Platinum Group Metals (PGMs) trade mixed at the beginning of Friday, according to FXStreet data. Palladium (XPD) changes hands at $969.20 a troy ounce, with the XPD/USD pair advancing from its previous close at $966.10.
In the meantime, Platinum (XPT) trades at $995.40 against the United States Dollar (USD) early in the European session, shedding ground after the XPT/USD pair settled at $997.05 at the previous close.
Palladium FAQs
Palladium is a rare and valuable precious metal with strong industrial demand, particularly in the automotive sector. It is widely used in catalytic converters to reduce vehicle emissions, making it essential for global environmental regulations. Investors also see palladium as a store of value, similar to gold and silver, and a potential hedge against inflation. Given its supply constraints and high demand, palladium often attracts traders looking for price volatility and profit opportunities.
In trading, palladium (XPD/USD) is considered both an industrial and a precious metal. It is traded on major commodity exchanges like the New York Mercantile Exchange (NYMEX) and the London Platinum and Palladium Market (LPPM). Traders speculate on palladium prices through futures contracts, exchange-traded funds (ETFs), and spot markets. Since palladium supply is concentrated in a few countries, particularly Russia and South Africa, geopolitical and mining disruptions can lead to significant price swings, making it an attractive asset for short-term traders and long-term investors alike.
Palladium has historically been less expensive than gold, but in recent years, it has traded at a premium due to rising demand and tight supply. Prices fluctuate based on market conditions, but palladium has, at times, outperformed gold due to its critical role in the automotive industry. However, as markets shift and industrial demand changes, the price relationship between the two metals can vary.
Palladium prices are influenced by several factors, including industrial demand, supply constraints, and macroeconomic conditions. The automotive industry is the biggest driver of demand, as stricter emissions regulations increase the need for palladium-based catalytic converters. Supply is heavily dependent on mining output from Russia and South Africa, making the metal vulnerable to geopolitical risks and supply chain disruptions. Additionally, broader market trends, such as the strength of the US dollar, interest rates, and economic growth, can impact palladium prices, as they do with other precious metals.
Platinum Group Metals (PGMs) prices mentioned above are based on the FXStreet data feed for Contracts for Differences (CFDs).
(An automation tool was used in creating this post.)
-
09:06
Gold rallies to a new all-time high in its sprint toward $3,000
- Gold benefits from US President Donald Trump’s harsh talks on tariffs.
- US yields turn lower after printing a new five-day high on Thursday.
- Traders are heading back into safe-haven assets as reciprocal tariffs approach.
Gold’s price (XAU/USD) hits a fresh all-time high above the $2,990 level at the time of writing on Friday, registering a weekly gain of over 2.5% for now. The additional inflow and demand for Bullion came after United States (US) President Donald Trump fired back at European counter-tariffs, saying he would slap 200% tariffs on wine and champagne from the region.
This has spooked market participants into believing that all bets are off and that US President Trump will not step back or ease his stance on tariffs, raising even more concerns regarding growth and demand for risk assets. Meanwhile, US yields hit a fresh five-day high on Thursday before retreating.
Daily digest market movers: Concerns are growing
- President Donald Trump’s aggressive tariff agenda fanned concerns about the potential hit to growth, hurting demand for risk assets and aiding flows into bullion-backed funds, Bloomberg reports.
- Some Chinese jeweler stocks have risen substantially this week. On Friday, mainland-listed Zhejiang Ming Jewelry Co. surged by its 10% gain limit for a fourth day. Chow Tai Fook Jewellery Group was also up, showing that traders are looking for associated companies that can profit from a higher Gold price, Bloomberg reports.
- Macquarie Group’s Commodities Strategy team lead, Marcus Garvey, pointed out on Thursday that holdings are still about 20% below its previous peak in 2020. This means there is still ample scope for inflows to increase in the precious metal, Reuters reports.
- The CME Fedwatch Tool sees a 97.0% chance for no interest rate changes in the upcoming Fed meeting on March 19. The chances of a rate cut at the May 7 meeting currently stand at 30.3%.
Technical Analysis: $3,000 before the closing bell
The $3,000 mark has come into play quickly just a day after the French bank BNP Paribas said $3,200 would be the target price for Gold for the second quarter. With the European and US sessions still ahead, a quick sprint higher could materialize. However, traders should refrain from entering on the break of $3,000 because this level will likely trigger some short-term profit-taking.
The new all-time high at $2,993 can easily be taken out any time now. Look for the psychological $3,000 mark on the way up. Beyond that level, it is an uncharted territory where resistances and supports from the daily Pivot Point can help guide direction. The daily R1 resistance at $3,007 and the R2 resistance at $3,026 are certainly levels to look out for.
On the downside, the daily Pivot Point stands at $2,970. In case that level breaks, look at the S1 support around $2,951. Further down, the S2 support stands at $2,914, preceding the $2,900 big figure, which should be strong enough to catch any corrections.
XAU/USD: Daily Chart
Gold FAQs
Gold has played a key role in human’s history as it has been widely used as a store of value and medium of exchange. Currently, apart from its shine and usage for jewelry, the precious metal is widely seen as a safe-haven asset, meaning that it is considered a good investment during turbulent times. Gold is also widely seen as a hedge against inflation and against depreciating currencies as it doesn’t rely on any specific issuer or government.
Central banks are the biggest Gold holders. In their aim to support their currencies in turbulent times, central banks tend to diversify their reserves and buy Gold to improve the perceived strength of the economy and the currency. High Gold reserves can be a source of trust for a country’s solvency. Central banks added 1,136 tonnes of Gold worth around $70 billion to their reserves in 2022, according to data from the World Gold Council. This is the highest yearly purchase since records began. Central banks from emerging economies such as China, India and Turkey are quickly increasing their Gold reserves.
Gold has an inverse correlation with the US Dollar and US Treasuries, which are both major reserve and safe-haven assets. When the Dollar depreciates, Gold tends to rise, enabling investors and central banks to diversify their assets in turbulent times. Gold is also inversely correlated with risk assets. A rally in the stock market tends to weaken Gold price, while sell-offs in riskier markets tend to favor the precious metal.
The price can move due to a wide range of factors. Geopolitical instability or fears of a deep recession can quickly make Gold price escalate due to its safe-haven status. As a yield-less asset, Gold tends to rise with lower interest rates, while higher cost of money usually weighs down on the yellow metal. Still, most moves depend on how the US Dollar (USD) behaves as the asset is priced in dollars (XAU/USD). A strong Dollar tends to keep the price of Gold controlled, whereas a weaker Dollar is likely to push Gold prices up.
-
09:05
SEK: Krona remains expensive – ING
Our model returns a short-term fair value for EUR/SEK around 11.25-11.30. This means that despite the correction from the recent highs, the krona continues to price in a good deal of positives, ING's FX analysts Francesco Pesole and James Smith note.
EUR/SEK to return to the 11.20 area in the second quarter
"Our baseline for the second quarter is that negative tariff news will take over fiscal enthusiasm as the main driver for European currencies. Since EUR/SEK has an inverse correlation with European risk sentiment, we forecast a return to the 11.20 area in the second quarter. Also supporting the pair could be a hawkish repricing in ECB rate expectations, as markets are still pricing in two cuts and we expect only one."
"Markets are not pricing in any additional easing by the Riksbank, so should policymakers signal they are keeping the door open for easing if needed, SEK may accelerate its correction after the rate announcement."
-
09:03
China New Loans registered at 1010B, below expectations (1275B) in February
-
09:02
Crude Oil price today: WTI price bullish at European opening
West Texas Intermediate (WTI) Oil price advances on Friday, early in the European session. WTI trades at $67.18 per barrel, up from Thursday’s close at $66.53.
Brent Oil Exchange Rate (Brent crude) is also up, advancing from the $69.79 price posted on Thursday, and trading at $70.42.
WTI Oil FAQs
WTI Oil is a type of Crude Oil sold on international markets. The WTI stands for West Texas Intermediate, one of three major types including Brent and Dubai Crude. WTI is also referred to as “light” and “sweet” because of its relatively low gravity and sulfur content respectively. It is considered a high quality Oil that is easily refined. It is sourced in the United States and distributed via the Cushing hub, which is considered “The Pipeline Crossroads of the World”. It is a benchmark for the Oil market and WTI price is frequently quoted in the media.
Like all assets, supply and demand are the key drivers of WTI Oil price. As such, global growth can be a driver of increased demand and vice versa for weak global growth. Political instability, wars, and sanctions can disrupt supply and impact prices. The decisions of OPEC, a group of major Oil-producing countries, is another key driver of price. The value of the US Dollar influences the price of WTI Crude Oil, since Oil is predominantly traded in US Dollars, thus a weaker US Dollar can make Oil more affordable and vice versa.
The weekly Oil inventory reports published by the American Petroleum Institute (API) and the Energy Information Agency (EIA) impact the price of WTI Oil. Changes in inventories reflect fluctuating supply and demand. If the data shows a drop in inventories it can indicate increased demand, pushing up Oil price. Higher inventories can reflect increased supply, pushing down prices. API’s report is published every Tuesday and EIA’s the day after. Their results are usually similar, falling within 1% of each other 75% of the time. The EIA data is considered more reliable, since it is a government agency.
OPEC (Organization of the Petroleum Exporting Countries) is a group of 12 Oil-producing nations who collectively decide production quotas for member countries at twice-yearly meetings. Their decisions often impact WTI Oil prices. When OPEC decides to lower quotas, it can tighten supply, pushing up Oil prices. When OPEC increases production, it has the opposite effect. OPEC+ refers to an expanded group that includes ten extra non-OPEC members, the most notable of which is Russia.
Disclaimer: West Texas Intermediate (WTI) and Brent oil prices mentioned above are based on FXStreet data feed for Contracts for Differences (CFDs).
(An automation tool was used in creating this post.)
-
09:02
China M2 Money Supply (YoY) meets forecasts (7%) in February
-
09:01
Italy Industrial Output s.a. (MoM) registered at 3.2% above expectations (1.5%) in January
-
09:00
Italy Industrial Output w.d.a (YoY) increased to -0.6% in January from previous -7.1%
-
08:51
USD: Focus on consumer confidence – ING
The Dollar Index (DXY) is back above 104 again as European currencies soften a little. The latest reports suggest a US government shutdown this weekend has been averted as the Democrats in the Senate prepare to pass the House bill agreed earlier this week, ING's FX analyst Chris Turner notes.
DXY to trade in a tight range today
"While that may be seen as an excuse for a mild uptick in US equities, there are much bigger forces in play - such as the path for tariffs and whether subdued US consumer and business sentiment is going to weigh on real activity. Federal Reserve Chair Jerome Powell said that 'sentiment readings have not been a good predictor of consumption growth in recent years'."
"For today, the US focus will therefore be on the 1500CET release of March Consumer sentiment. These readings have fallen quite sharply over the last two months and any further large drop could weigh on the dollar today. However, the bigger reaction here may come next Monday when the February retail sales figure is released. Consensus expects quite a large rebound after January's drop (-0.9% month-on-month headline, -0.5% core). Failure for that rebound to materialise is a downside risk for the dollar."
"Elsewhere, comments on the dollar from Treasury Secretary Scott Bessent gained some attention yesterday. He said that this year's dollar sell off is a 'natural adjustment' after last year's rally. We doubt that means much/anything for the US Treasury's dollar policy and he's just acknowledging the noise/disturbance this 'transition' period is having on the US economy. Ultimately we think Washington would like a weaker dollar, but a global trade war is dollar positive. DXY to trade in a tight range today - perhaps between 103.70 and 104.30."
-
08:36
GBP/USD: Likely to trade in a 1.2900/1.2975 range – UOB Group
Pound Sterling (GBP) is likely to trade in a 1.2900/1.2975 range. In the longer run, to continue to rise, GBP must break and remain above 1.3000, UOB Group's FX analysts Quek Ser Leang and Peter Chia note.
To continue to rise, GBP must break and remain above 1.3000
24-HOUR VIEW: "Following the rise in GBP to 1.2990 on Wednesday, we indicated yesterday (Thursday) that 'there is a chance for GBP to test 1.3000.' However, we pointed out, 'A clear break above this level seems unlikely.' Our view did not materialise as GBP traded in a choppy range of 1.2921/1.2971, closing largely unchanged (1.2951, -0.07%). Momentum indicators are turning flat, and further range trading seems likely today, probably in a 1.2900/1.2975 range."
1-3 WEEKS VIEW: "Having held a positive outlook in GBP since early this month, we indicated the following yesterday (13 Mar, spot at 1.2960): 'To continue to rise, GBP must break and remain above 1.3000. The chance of GBP breaking clearly above 1.3000, although not high, will remain intact as long as 1.2880 (‘strong support’ level) is not breached.' We continue to hold the same view."
-
08:31
JPY: Wage requests not quite as high as expected – ING
USD/JPY is edging higher in early Europe as Japan's largest labour union, Rengo, agreed a 5.46% wage increase for the coming year - perhaps a little lower than early speculation of 6%, ING's FX analyst Chris Turner notes.
Difficult for USD/JPY to sustain a recovery over 150 near term
"However, today's agreement keeps the virtuous cycle of higher wages, higher consumption and higher prices in play and suggests the market is very much under-pricing the risk of a Bank of Japan rate hike in May. A 25bp hike is priced with only a 14% probability, whereas a hike in May is ING's house call."
"We certainly see yen outperformance on the crosses over coming months, led by tariff unrest in April and a BoJ rate hike in May. And unless we see some strong bounce back in US data, it will be difficult for USD/JPY to sustain a recovery over 150 near term."
-
08:25
EUR/USD can edge below 1.0820 but unlikely to reach 1.0780 – UOB Group
Euro (EUR) is under mild downward pressure vs US Dollar (USD); it could edge below 1.0820 but is unlikely to reach 1.0780. In the longer run, more than week-long rally is taking a pause; EUR is likely to consolidate in a 1.0680/1.0950 range for now, UOB Group's FX analysts Quek Ser Leang and Peter Chia note.
More than week-long rally is taking a pause
24-HOUR VIEW: "We highlighted yesterday that 'Further range trading seems likely, even though the slightly softened underlying tone suggests a lower range of 1.0850/1.0920.' However, USD dropped to 1.0820, rebounding to close lower by 0.31% at 1.0852. The decline resulted in a slight increase in downward momentum. Today, EUR has the potential to edge below 1.0820, but any further decline is unlikely to reach 1.0770. Resistance is at 1.0880; a breach of 1.0910 would suggest the current mild downward pressure has eased."
1-3 WEEKS VIEW: "We turned positive in EUR early last week (see annotations in the chart below). In our most recent narrative from two days ago (12 Mar, spot at 1.0915), we highlighted that 'while the uptrend remains intact for now, it is worth noting that conditions are very deeply overbought.' We also highlighted that 'this suggests that while further gains are possible, the potential for additional upside may be limited.' Yesterday, EUR fell and tested our ‘strong support’ level at 1.0820. While the ‘strong support’ level has not been clearly breached yet, upward momentum has largely eased. To put it another way, the more than week-long rally is taking a pause, and the current price movements are likely part of a consolidation phase. For now, we expect EUR to trade in a 1.0680/1.0950 range. While this range may seem wide, it is not unexpected given the size of the recent rally."
-
08:21
EUR: Some modest reappraisal of the euro – ING
The FX options market had been warning about last week's upside spike in EUR/USD. However, the latest indications suggest EUR/USD upside appetite is fading. Here, the one month EUR/USD risk reversal has softened quite a lot. Last week, this pricing showed a skew for euro calls over euro puts of +0.45%, ING's FX analyst Chris Turner notes.
Soft US consumer confidence data is an upside risk
"That was the most bullish the market had been in this one month tenor since 2021. However, that skew has now dropped to -0.14% in favour of euro puts. Helping that switch in sentiment is probably the looming threat of tariffs in early April. There seems little love lost between European and US leadership currently, and next month's reciprocal trade tariffs could see Europe hit hard."
"At the same time, the market is focusing on developments in the German lower house - the Bundestag. CDU leader Friedrich Merz is trying to get the Greens on board to pass constitutional debt-brake reform and the EUR500bn infrastructure package. There could be a lot more noise to be had in these negotiations as the Greens try to secure key concessions ahead of a crucial vote next Tuesday. Any headlines that the Greens are refusing to back the bill stand to hit EUR/USD intra-day."
"After the close today, we'll also see Fitch rating agency's latest review on France. It may be too early for Fitch to cut France from AA- after only shifting to a negative outlook last October. And the surprise remains how core and peripheral eurozone government bond spreads remain so tight to German Bunds in spite of looming. Tariff news and German politics is a downside risk to EUR/USD today. Soft US consumer confidence data is an upside risk. 1.0810-1.0880 could be the EUR/USD range today."
-
08:00
Spain Consumer Price Index (YoY) meets forecasts (3%) in February
-
08:00
Spain Consumer Price Index (MoM) meets expectations (0.4%) in February
-
08:00
Spain Harmonized Index of Consumer Prices (YoY) in line with expectations (2.9%) in February
-
08:00
Spain Harmonized Index of Consumer Prices (MoM) meets expectations (0.4%) in February
-
07:53
Silver Price Forecast: XAG/USD remains solid near $34.00 amid increased safe-haven demand
- Silver maintains its position near the five-month high at $33.96, reached on Thursday.
- Safe-haven demand strengthened after President Trump threatened a 200% tariff on all European wines and champagne.
- A non-interest-bearing Silver finds support from growing expectations of Fed rate cuts following weaker US inflation data.
Silver price (XAG/USD) continues its upward momentum for the fourth consecutive day, trading around $33.90 per troy ounce during European trading hours on Friday. The precious metal benefits from increased safe-haven demand as global trade tensions increase.
Market concerns intensified after US President Donald Trump threatened 200% tariffs on European wines, champagnes, and other alcoholic beverages in response to the EU’s 50% tariff on American whiskey.
Silver, a non-interest-bearing asset, finds support from growing expectations of Federal Reserve (Fed) rate cuts following weaker US inflation data. On Thursday, the US Producer Price Index (PPI) rose 3.2% year-over-year in February, down from 3.7% in January and below the 3.3% forecast. The core PPI, which excludes food and energy, increased 3.4% annually, compared to 3.8% in January.
Meanwhile, Wednesday’s Consumer Price Index (CPI) data showed a decline to 2.8% year-over-year from 3.0%, while core inflation fell to 3.1% from 3.3%.
In political developments, Senate Democratic Leader Chuck Schumer announced late Thursday his support for keeping the government open, as the Senate prepares to vote on a GOP stopgap funding bill on Friday.
Additionally, US Commerce Secretary Howard Lutnick stated that the administration plans to balance the budget within President Donald Trump's term, aiming to achieve this over three years.
However, Silver's upside could be limited as the US Dollar (USD) continues to strengthen. A stronger USD makes Silver more expensive for foreign buyers, potentially dampening demand. At the time of writing, the US Dollar Index (DXY), which tracks the USD against six major currencies, is hovering near 104.00.
Silver FAQs
Silver is a precious metal highly traded among investors. It has been historically used as a store of value and a medium of exchange. Although less popular than Gold, traders may turn to Silver to diversify their investment portfolio, for its intrinsic value or as a potential hedge during high-inflation periods. Investors can buy physical Silver, in coins or in bars, or trade it through vehicles such as Exchange Traded Funds, which track its price on international markets.
Silver prices can move due to a wide range of factors. Geopolitical instability or fears of a deep recession can make Silver price escalate due to its safe-haven status, although to a lesser extent than Gold's. As a yieldless asset, Silver tends to rise with lower interest rates. Its moves also depend on how the US Dollar (USD) behaves as the asset is priced in dollars (XAG/USD). A strong Dollar tends to keep the price of Silver at bay, whereas a weaker Dollar is likely to propel prices up. Other factors such as investment demand, mining supply – Silver is much more abundant than Gold – and recycling rates can also affect prices.
Silver is widely used in industry, particularly in sectors such as electronics or solar energy, as it has one of the highest electric conductivity of all metals – more than Copper and Gold. A surge in demand can increase prices, while a decline tends to lower them. Dynamics in the US, Chinese and Indian economies can also contribute to price swings: for the US and particularly China, their big industrial sectors use Silver in various processes; in India, consumers’ demand for the precious metal for jewellery also plays a key role in setting prices.
Silver prices tend to follow Gold's moves. When Gold prices rise, Silver typically follows suit, as their status as safe-haven assets is similar. The Gold/Silver ratio, which shows the number of ounces of Silver needed to equal the value of one ounce of Gold, may help to determine the relative valuation between both metals. Some investors may consider a high ratio as an indicator that Silver is undervalued, or Gold is overvalued. On the contrary, a low ratio might suggest that Gold is undervalued relative to Silver.
-
07:45
France Inflation ex-tobacco (MoM): 0% (February) vs previous 0.1%
-
07:45
France Consumer Price Index (EU norm) (YoY) in line with expectations (0.9%) in February
-
07:45
France Consumer Price Index (EU norm) (MoM) registered at 0.1% above expectations (0%) in February
-
07:36
Forex Today: US Dollar extends recovery, Gold holds near record-high
Here is what you need to know on Friday, March 14:
The US Dollar (USD) holds its ground in the European morning on Friday, with the USD Index staying in positive territory near 104.00 after posting modest gains for two consecutive days. The US economic calendar will feature the University of Michigan's preliminary Consumer Sentiment Index data for March heading into the weekend.
US Dollar PRICE This week
The table below shows the percentage change of US Dollar (USD) against listed major currencies this week. US Dollar was the strongest against the Japanese Yen.
USD EUR GBP JPY CAD AUD NZD CHF USD -0.05% -0.06% 0.61% 0.40% 0.07% -0.01% 0.46% EUR 0.05% -0.04% 0.69% 0.46% 0.22% 0.01% 0.40% GBP 0.06% 0.04% 0.65% 0.47% 0.26% 0.00% 0.51% JPY -0.61% -0.69% -0.65% -0.22% -0.48% -0.70% -0.07% CAD -0.40% -0.46% -0.47% 0.22% -0.37% -0.41% 0.04% AUD -0.07% -0.22% -0.26% 0.48% 0.37% -0.19% 0.24% NZD 0.01% -0.01% -0.01% 0.70% 0.41% 0.19% 0.55% CHF -0.46% -0.40% -0.51% 0.07% -0.04% -0.24% -0.55% The heat map shows percentage changes of major currencies against each other. The base currency is picked from the left column, while the quote currency is picked from the top row. For example, if you pick the US Dollar from the left column and move along the horizontal line to the Japanese Yen, the percentage change displayed in the box will represent USD (base)/JPY (quote).
Senate Democratic Leader Chuck Schumer announced late Thursday that he plans to vote to keep the government open as the chamber prepares to take up a GOP stopgap bill continuing government funding Friday. US stock index futures were last seen rising between 0.5% and 0.8% after Wall Street's main indexes registered large losses on Thursday. Meanwhile, the benchmark 10-year US Treasury bond yield holds steady, slightly below 4.3%.
In the early European session, the UK's Office for National Statistics reported that the UK's Gross Domestic Product contracted by 0.1% on a monthly basis in January. Other data showed that Manufacturing Production and Industrial Production decreased by 1.1% and 0.9%, respectively, in the same period. These figures came in weaker than analysts' estimates and caused Pound Sterling to come under pressure. At the time of press, GBP/USD was trading in the red below 1.2950.
Gold preserved its bullish momentum and rose more than 1.8% on Thursday. After reaching a new record-high above $2,990 during the Asian trading hours on Friday, XAU/USD seems to have entered a consolidation phase near $2,980.
EUR/USD struggles to gain traction and trades slightly below 1.0850 in the European morning on Friday. In a social media post on Thursday, US President Donald Trump said that he would seek to impose his 200% tariff on European wines and champagne. In response, French Finance Minister Eric Lombard said Trump's threat to augment tariffs on French liquor imports were not a surprise and called his actions an "idiotic war."
USD/CAD rose about 0.5% on Thursday and erased Wednesday's losses. The pair stays relatively quiet and fluctuates around 1.4400 early Friday. Canada's Finance Minister Dominic LeBlanc said late Thursday that tariffs are harmful to both the US and Canada, adding that moving forward with dialogue is crucial.
After posting small losses on Thursday, USD/JPY gathers bullish momentum and rises about 0.8% on the day near 149.00 on Friday. Japan's largest trade union group Rengo announced on Friday that the first-round data showed an average wage hike of 5.46% for fiscal year 2025, below the 6.09% hike demanded.
Gold FAQs
Gold has played a key role in human’s history as it has been widely used as a store of value and medium of exchange. Currently, apart from its shine and usage for jewelry, the precious metal is widely seen as a safe-haven asset, meaning that it is considered a good investment during turbulent times. Gold is also widely seen as a hedge against inflation and against depreciating currencies as it doesn’t rely on any specific issuer or government.
Central banks are the biggest Gold holders. In their aim to support their currencies in turbulent times, central banks tend to diversify their reserves and buy Gold to improve the perceived strength of the economy and the currency. High Gold reserves can be a source of trust for a country’s solvency. Central banks added 1,136 tonnes of Gold worth around $70 billion to their reserves in 2022, according to data from the World Gold Council. This is the highest yearly purchase since records began. Central banks from emerging economies such as China, India and Turkey are quickly increasing their Gold reserves.
Gold has an inverse correlation with the US Dollar and US Treasuries, which are both major reserve and safe-haven assets. When the Dollar depreciates, Gold tends to rise, enabling investors and central banks to diversify their assets in turbulent times. Gold is also inversely correlated with risk assets. A rally in the stock market tends to weaken Gold price, while sell-offs in riskier markets tend to favor the precious metal.
The price can move due to a wide range of factors. Geopolitical instability or fears of a deep recession can quickly make Gold price escalate due to its safe-haven status. As a yield-less asset, Gold tends to rise with lower interest rates, while higher cost of money usually weighs down on the yellow metal. Still, most moves depend on how the US Dollar (USD) behaves as the asset is priced in dollars (XAU/USD). A strong Dollar tends to keep the price of Gold controlled, whereas a weaker Dollar is likely to push Gold prices up.
-
07:31
Japan Rengo's first-round wage hike exceeds 5% for second straight year
Japan's largest trade union group, Rengo’s first-round data shows an average wage hike of 5.46% for fiscal 2025, compared to the demand of a 6.09% hike.
The 5.46% wage hike is higher than last year's average of 5.1%, exceeding 5% for the second straight year with the Japanese spring wage negotiations (Shunto) underway.
Market reaction
The Japanese Yen (JPY) has come under fresh selling pressure on these headlines, driving USD/JPY 0.73% higher on the day at 148.90 at the press time.
-
07:13
EUR/GBP Price Analysis: Appreciates toward 0.8400 following weaker UK GDP data
- EUR/GBP could find primary resistance around the psychological level of 0.8400.
- The currency cross is testing nine-day EMA support, suggesting a potential weakening of short-term price momentum.
- UK Gross Domestic Product declined by 0.1% following a 0.4% increase in December.
EUR/GBP gains ground after registering losses in the previous two sessions, trading around 0.8380 during the early European hours. The currency cross appreciates following the United Kingdom's (UK) Gross Domestic Product (GDP) released on Friday.
The Office for National Statistics (ONS) reported that the UK economy shrank in January, with Gross Domestic Product (GDP) declining by 0.1% following a 0.4% increase in December. Markets had anticipated a 0.1% expansion for the period.
A technical examination of the daily chart indicates the price of the currency cross testing nine-day Exponential Moving Average (EMA) support, suggesting a potential weakening of short-term price momentum.
However, the 14-day Relative Strength Index (RSI), a key momentum indicator, remains above 50, indicating a bullish bias is still intact. However, the EUR/GBP cross remains above the 50-day, reinforcing medium-term price momentum.
On the upside, the EUR/GBP cross could explore the area around the psychological level of 0.8400, followed by the two-month high of 0.8449, met on March 11.
The EUR/GBP cross tests immediate support at the nine-day EMA of 0.8374 level, followed by the 50-day EMA at 0.8337 level. A break below this level could weaken the medium-term price momentum and lead the currency cross to navigate the region around the three-month low at 0.8242 level, recorded on February 28.
EUR/GBP: Daily Chart
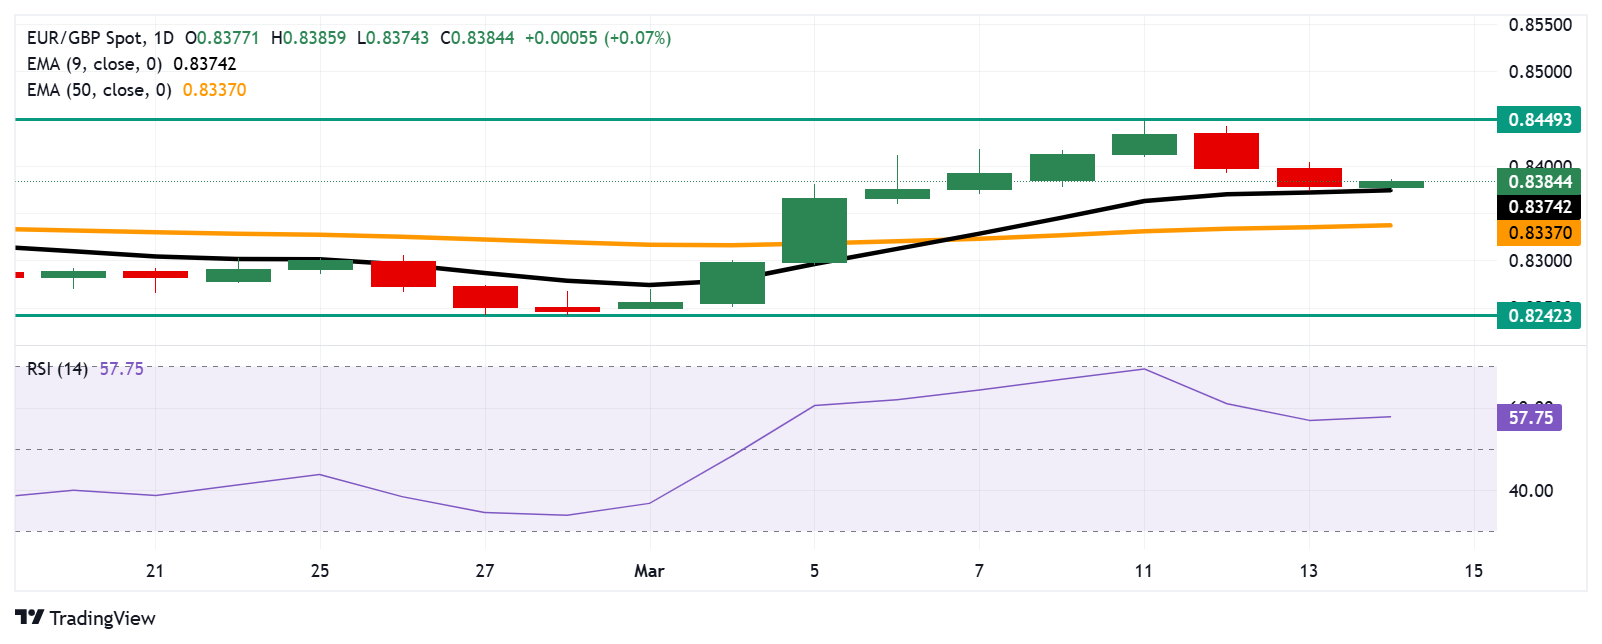
Economic Indicator
Gross Domestic Product (MoM)
The Gross Domestic Product (GDP), released by the Office for National Statistics on a monthly and quarterly basis, is a measure of the total value of all goods and services produced in the UK during a given period. The GDP is considered as the main measure of UK economic activity. The MoM reading compares economic activity in the reference month to the previous month. Generally, a rise in this indicator is bullish for the Pound Sterling (GBP), while a low reading is seen as bearish.
Read more.Last release: Fri Mar 14, 2025 07:00
Frequency: Monthly
Actual: -0.1%
Consensus: 0.1%
Previous: 0.4%
Source: Office for National Statistics
-
07:09
GBP/USD loses momentum below 1.2950 on downbeat UK GDP data
- GBP/USD drifts lower to near 1.2925 in Friday’s early European session.
- The UK GDP declined 0.1% MoM in January, weaker than expected.
- Traders raise their bets that the Fed will restart its rate cuts in June.
The GBP/USD pair loses ground to near 1.2925 during the early European session on Friday. The Pound Sterling (GBP) edges lower after the release of UK growth numbers. The attention will shift to the preliminary Michigan Consumer Sentiment for March, which will be published later on Friday.
Data released by the Office for National Statistics (ONS) showed on Friday that the UK economy contracted 0.1% over the month in January. The reading missed the estimation of 0.1% growth in the reported period. Meanwhile, UK Industrial Production declined 0.9% MoM in January versus 0.5% prior, below the market consensus of -0.1%. The GBP attracts some sellers in an immediate reaction to the downbeat UK GDP data.
The Bank of England (BoE) is expected to hold interest rates steady at the next Monetary Policy Committee meeting next week as most policymakers have guided a ‘gradual and cautious’ policy-easing approach. That would leave the base rate unchanged at 4.5%. In the February meeting, the UK central bank decided to reduce its interest rates by 25 basis points (bps) amid concerns over growth prospects.
The softer US consumer and producer inflationary pressures could pave the way for the Federal Reserve (Fed) to cut interest rates in the June policy meeting, which might help limit the pair’s losses. Previously, Barclays projected a single 25 basis points (bps) cut in June. Short-term interest-rate futures have priced in nearly 75% odds of a quarter-point reduction to the Fed's policy rate by June, according to the CME FedWatch tool.Pound Sterling FAQs
The Pound Sterling (GBP) is the oldest currency in the world (886 AD) and the official currency of the United Kingdom. It is the fourth most traded unit for foreign exchange (FX) in the world, accounting for 12% of all transactions, averaging $630 billion a day, according to 2022 data. Its key trading pairs are GBP/USD, also known as ‘Cable’, which accounts for 11% of FX, GBP/JPY, or the ‘Dragon’ as it is known by traders (3%), and EUR/GBP (2%). The Pound Sterling is issued by the Bank of England (BoE).
The single most important factor influencing the value of the Pound Sterling is monetary policy decided by the Bank of England. The BoE bases its decisions on whether it has achieved its primary goal of “price stability” – a steady inflation rate of around 2%. Its primary tool for achieving this is the adjustment of interest rates. When inflation is too high, the BoE will try to rein it in by raising interest rates, making it more expensive for people and businesses to access credit. This is generally positive for GBP, as higher interest rates make the UK a more attractive place for global investors to park their money. When inflation falls too low it is a sign economic growth is slowing. In this scenario, the BoE will consider lowering interest rates to cheapen credit so businesses will borrow more to invest in growth-generating projects.
Data releases gauge the health of the economy and can impact the value of the Pound Sterling. Indicators such as GDP, Manufacturing and Services PMIs, and employment can all influence the direction of the GBP. A strong economy is good for Sterling. Not only does it attract more foreign investment but it may encourage the BoE to put up interest rates, which will directly strengthen GBP. Otherwise, if economic data is weak, the Pound Sterling is likely to fall.
Another significant data release for the Pound Sterling is the Trade Balance. This indicator measures the difference between what a country earns from its exports and what it spends on imports over a given period. If a country produces highly sought-after exports, its currency will benefit purely from the extra demand created from foreign buyers seeking to purchase these goods. Therefore, a positive net Trade Balance strengthens a currency and vice versa for a negative balance.
-
07:01
Germany Harmonized Index of Consumer Prices (MoM) came in at 0.5%, below expectations (0.6%) in February
-
07:01
UK GDP declines 0.1% MoM in January vs. +0.1% expected
- UK GDP decreased 0.1% MoM in January, missing estimates by a wide margin.
- GBP/USD drops toward 1.2900 after the UK economic data.
The UK economy contracted in January, with the Gross Domestic Product (GDP) coming in at -0.1% after increasing 0.4% in December, according to the latest data published by the Office for National Statistics (ONS) on Friday. Markets projected a 0.1% growth in the reported period.
Meanwhile, the Index of services (January) arrived at 0.4% 3M/3M versus December’s 0.2%.
Other data from the UK showed that monthly Industrial and Manufacturing Production declined by 0.9% and 1.1%, respectively, in January. Both readings fell short of expectations.
Market reaction to the UK data
The UK economic data fuelled a fresh downside in the Pound Sterling. At the press time, GBP/USD is trading 0.19% lower on the day near 1.2930.
British Pound PRICE Today
The table below shows the percentage change of British Pound (GBP) against listed major currencies today. British Pound was the weakest against the New Zealand Dollar.
USD EUR GBP JPY CAD AUD NZD CHF USD 0.14% 0.14% 0.59% -0.09% -0.17% -0.24% 0.10% EUR -0.14% 0.03% 0.44% -0.23% -0.32% -0.39% 0.03% GBP -0.14% -0.03% 0.40% -0.26% -0.35% -0.41% 0.00% JPY -0.59% -0.44% -0.40% -0.68% -0.76% -0.84% -0.40% CAD 0.09% 0.23% 0.26% 0.68% -0.07% -0.16% 0.27% AUD 0.17% 0.32% 0.35% 0.76% 0.07% -0.08% 0.31% NZD 0.24% 0.39% 0.41% 0.84% 0.16% 0.08% 0.43% CHF -0.10% -0.03% -0.01% 0.40% -0.27% -0.31% -0.43% The heat map shows percentage changes of major currencies against each other. The base currency is picked from the left column, while the quote currency is picked from the top row. For example, if you pick the British Pound from the left column and move along the horizontal line to the US Dollar, the percentage change displayed in the box will represent GBP (base)/USD (quote).
-
07:01
United Kingdom Index of Services (3M/3M) above expectations (0.3%) in January: Actual (0.4%)
-
07:01
Germany Consumer Price Index (YoY) in line with forecasts (2.3%) in February
-
07:01
Germany Harmonized Index of Consumer Prices (YoY) below forecasts (2.8%) in February: Actual (2.6%)
-
07:01
Germany Consumer Price Index (MoM) in line with expectations (0.4%) in February
-
07:00
United Kingdom Manufacturing Production (YoY) registered at -1.5%, below expectations (-0.4%) in January
-
07:00
United Kingdom Industrial Production (MoM) registered at -0.9%, below expectations (-0.1%) in January
-
07:00
United Kingdom Manufacturing Production (MoM) came in at -1.1%, below expectations (0%) in January
-
07:00
United Kingdom Gross Domestic Product (MoM) below expectations (0.1%) in January: Actual (-0.1%)
-
07:00
United Kingdom Industrial Production (YoY) came in at -1.5% below forecasts (-0.7%) in January
-
05:56
US Dollar Index holds gains near 104.00 ahead of Michigan Consumer Sentiment Index release
- The US Dollar Index climbs toward 104.00, supported by 2- and 10-year Treasury yields at 3.96% and 4.29%, respectively.
- US Initial Jobless Claims for the week ending March 7 came in at 220,000, beating the forecast of 225,000.
- President Trump threatened a 200% tariff on all European wines and champagne, sparking global concerns.
The US Dollar Index (DXY), which tracks the US Dollar (USD) against six major currencies, extends its winning streak for a third consecutive day amid improved Treasury yields. The DXY is trading near 104.00 with 2- and 10-year yields on US Treasury bonds standing at 3.96% and 4.29%, respectively, during Asian hours on Friday.
The Greenback strengthened after better-than-expected jobless claims and weaker-than-anticipated Producer Price Index (PPI) data released on Thursday. Traders now await the preliminary Michigan Consumer Sentiment Index for March, set for release in the North American session.
In the labor market, US Initial Jobless Claims came in at 220,000 for the week ending March 7, below the expected 225,000. Continuing claims also fell to 1.87 million, beating forecasts of 1.90 million, signaling a resilient US job market.
Meanwhile, inflationary pressures eased further. The US PPI rose 3.2% year-over-year in February, down from 3.7% in January and below the 3.3% market forecast. Core PPI, which excludes food and energy, increased 3.4% annually, compared to 3.8% in the previous month. On a monthly basis, the headline PPI remained unchanged, while core PPI edged down by 0.1%.
The US Dollar also found support as risk sentiment weakened following President Donald Trump’s announcement of a 200% tariff on all European wines and champagne during Thursday’s early US session.
Senate Democratic Leader Chuck Schumer announced late Thursday that he will support keeping the government open as the chamber prepares to vote on a GOP stopgap funding bill on Friday. Meanwhile, US Commerce Secretary Howard Lutnick stated that the administration plans to balance the budget within President Donald Trump's term, aiming to achieve this goal over three years.
US Dollar PRICE Today
The table below shows the percentage change of US Dollar (USD) against listed major currencies today. US Dollar was the strongest against the Japanese Yen.
USD EUR GBP JPY CAD AUD NZD CHF USD 0.05% 0.02% 0.51% -0.06% -0.14% -0.26% 0.04% EUR -0.05% -0.00% 0.44% -0.11% -0.21% -0.32% 0.07% GBP -0.02% 0.00% 0.44% -0.12% -0.20% -0.31% 0.07% JPY -0.51% -0.44% -0.44% -0.55% -0.63% -0.75% -0.34% CAD 0.06% 0.11% 0.12% 0.55% -0.07% -0.20% 0.19% AUD 0.14% 0.21% 0.20% 0.63% 0.07% -0.12% 0.23% NZD 0.26% 0.32% 0.31% 0.75% 0.20% 0.12% 0.39% CHF -0.04% -0.07% -0.07% 0.34% -0.19% -0.23% -0.39% The heat map shows percentage changes of major currencies against each other. The base currency is picked from the left column, while the quote currency is picked from the top row. For example, if you pick the US Dollar from the left column and move along the horizontal line to the Japanese Yen, the percentage change displayed in the box will represent USD (base)/JPY (quote).
-
05:53
EUR/JPY Price Forecast: Key resistance level emerges above 162.00
- EUR/JPY climbs to near 161.10 in Friday’s early European session, up 0.45% on the day.
- The positive view of the cross remains in place above the key 100-period EMA with the bullish RSI indicator.
- The immediate resistance level emerges near 162.35; the key support level to watch is at the 160.05160.00 region.
The EUR/JPY cross gains traction to around 161.10 during the early European trading hours on Friday. The Japanese Yen (JPY) softens against the Euro (EUR) on a positive tone around the equity markets and improved risk sentiment. Furthermore, a source familiar with the Bank of Japan's (BoJ) thinking noted that rising global uncertainty could affect the rate-hike timing. This, in turn, contributes to the JPY’s downside and creates a tailwind for EUR/JPY.
Technically, the bullish outlook of EUR/JPY remains in play, with the cross holding above the key 100-period Exponential Moving Average (EMA) on the daily chart. Further upside cannot be ruled out as the 14-day Relative Strength Index (RSI) stands above the midline around 56.0.
In the bullish case, the key resistance level for the cross is located near 162.35, representing the upper boundary of the Bollinger Band and the high of March 12. Sustained trading above this level could attract some buyers to 162.70, the high of January 28. Further north, the next hurdle is seen at 163.22, the high of January 22.
On the downside, the low of March 13 and the psychological level in the 160.05160.00 zone act as a crucial support level for the cross. Extended losses could see a drop to the lower limit of the Bollinger Band at 159.75. A decisive break below the mentioned level could pave the way to 159.35, the 100-period EMA.EUR/JPY 4-hour chart
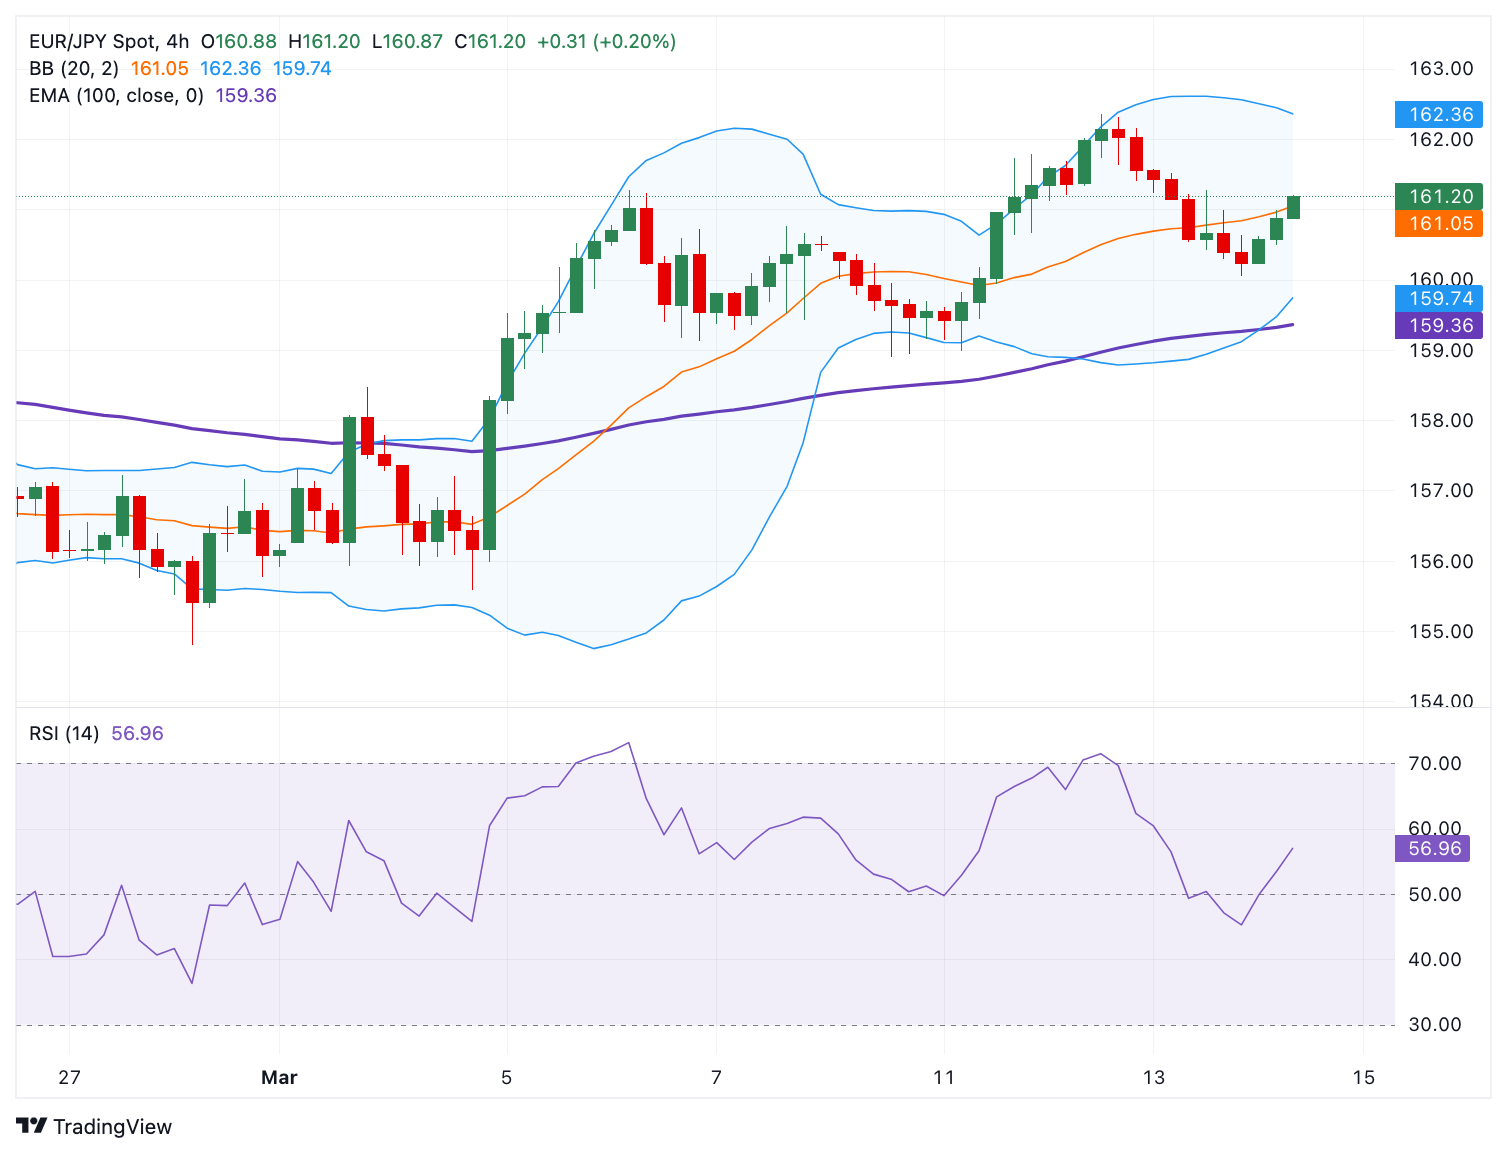
Japanese Yen FAQs
The Japanese Yen (JPY) is one of the world’s most traded currencies. Its value is broadly determined by the performance of the Japanese economy, but more specifically by the Bank of Japan’s policy, the differential between Japanese and US bond yields, or risk sentiment among traders, among other factors.
One of the Bank of Japan’s mandates is currency control, so its moves are key for the Yen. The BoJ has directly intervened in currency markets sometimes, generally to lower the value of the Yen, although it refrains from doing it often due to political concerns of its main trading partners. The BoJ ultra-loose monetary policy between 2013 and 2024 caused the Yen to depreciate against its main currency peers due to an increasing policy divergence between the Bank of Japan and other main central banks. More recently, the gradually unwinding of this ultra-loose policy has given some support to the Yen.
Over the last decade, the BoJ’s stance of sticking to ultra-loose monetary policy has led to a widening policy divergence with other central banks, particularly with the US Federal Reserve. This supported a widening of the differential between the 10-year US and Japanese bonds, which favored the US Dollar against the Japanese Yen. The BoJ decision in 2024 to gradually abandon the ultra-loose policy, coupled with interest-rate cuts in other major central banks, is narrowing this differential.
The Japanese Yen is often seen as a safe-haven investment. This means that in times of market stress, investors are more likely to put their money in the Japanese currency due to its supposed reliability and stability. Turbulent times are likely to strengthen the Yen’s value against other currencies seen as more risky to invest in.
-
05:51
FX option expiries for Mar 14 NY cut
FX option expiries for Mar 14 NY cut at 10:00 Eastern Time via DTCC can be found below.
EUR/USD: EUR amounts
- 1.0750 888m
- 1.0800 700m
- 1.0815 771m
- 1.0850 1.1b
- 1.0900 655m
- 1.1000 761m
GBP/USD: GBP amounts
- 1.2755 500m
USD/JPY: USD amounts
- 146.00 1.2b
- 149.00 618m
- 149.55 653m
AUD/USD: AUD amounts
- 0.6125 1.3b
- 0.6400 1.1b
USD/CAD: USD amounts
- 1.4400 590m
- 1.4450 1b
- 1.4600 696m
NZD/USD: NZD amounts
- 0.5760 909m
-
05:30
Netherlands, The Consumer Spending Volume: 1.2% (January) vs previous 1.8%
-
05:22
EUR/GBP maintains position near 0.8400 ahead of German HICP inflation, UK GDP data
- EUR/GBP could face further depreciation as the Euro weakens amid an escalating US-EU trade war.
- President Trump threatened a 200% tariff on all European wines and champagne, raising global market concerns.
- UK economy is projected to have grown modestly by 0.1% in January, down from the 0.4% expansion seen in December.
EUR/GBP holds ground after registering losses in the previous two consecutive sessions, trading around 0.8380 during the Asian hours on Friday. The currency cross faced challenges as the Euro (EUR) depreciated against its peers amid an escalating trade war between the United States and the European Union (EU). US President Donald Trump threatened a 200% tariff on all European wines and champagne during Thursday’s early US session, sparking concerns in global markets.
Traders are expected to closely monitor Germany's February Harmonized Index of Consumer Prices (HICP), along with the UK’s January Gross Domestic Product (GDP) and factory data, set for release later in the day.
European Central Bank (ECB) policymaker and Bundesbank President Joachim Nagel warned that US tariffs on imported goods could push Germany, Europe’s largest economy, into another recession, worsening its economic struggles. "We are in a world with tariffs, so we could expect maybe a recession this year if the tariffs take effect," Nagel said on Thursday.
Traders will closely watch the UK GDP figures as the Bank of England (BoE) has expressed concerns over the economic outlook. In its February policy meeting, the BoE revised its GDP growth forecast for the year to 0.75%, down from the 1.5% projected in November.
The UK economy is projected to have grown modestly by 0.1% in January, slowing from the 0.4% expansion recorded in December. Meanwhile, monthly factory data is expected to show a decline for the first month of 2025.
Tariffs FAQs
Tariffs are customs duties levied on certain merchandise imports or a category of products. Tariffs are designed to help local producers and manufacturers be more competitive in the market by providing a price advantage over similar goods that can be imported. Tariffs are widely used as tools of protectionism, along with trade barriers and import quotas.
Although tariffs and taxes both generate government revenue to fund public goods and services, they have several distinctions. Tariffs are prepaid at the port of entry, while taxes are paid at the time of purchase. Taxes are imposed on individual taxpayers and businesses, while tariffs are paid by importers.
There are two schools of thought among economists regarding the usage of tariffs. While some argue that tariffs are necessary to protect domestic industries and address trade imbalances, others see them as a harmful tool that could potentially drive prices higher over the long term and lead to a damaging trade war by encouraging tit-for-tat tariffs.
During the run-up to the presidential election in November 2024, Donald Trump made it clear that he intends to use tariffs to support the US economy and American producers. In 2024, Mexico, China and Canada accounted for 42% of total US imports. In this period, Mexico stood out as the top exporter with $466.6 billion, according to the US Census Bureau. Hence, Trump wants to focus on these three nations when imposing tariffs. He also plans to use the revenue generated through tariffs to lower personal income taxes.
-
05:01
USD/CAD Price Forecast: Remains depressed around 1.4430-1.4425; downside seems limited
- USD/CAD ticks lower on Friday, though it lacks follow-through and manages to hold above 1.4400.
- The optimism over US-Canada trade talks exerts pressure, while a modest USD uptick lends support.
- The range-bound price action also warrants some caution before placing aggressive directional bets.
The USD/CAD pair struggles to capitalize on the previous day's positive move and trades with a mild negative bias during the Asian session on Friday. Spot prices, however, manage to hold above the 1.4400 mark amid a modest US Dollar (USD) uptick, though the upside seems capped amid some positive news coming out of the US-Canada trade talks on Thursday.
Moreover, expectations that the Federal Reserve (Fed) will cut interest rates several times this year amid worries about a tariff-driven US economic slowdown, signs of easing inflationary pressure, and a cooling labor market might limit the USD gains. Apart from this, an uptick in Crude Oil prices could underpin the commodity-linked Loonie and further contribute to keeping a lid on the USD/CAD pair.
Meanwhile, spot prices, barring a knee-jerk spike on Tuesday, have been oscillating in a range since the beginning of this week. This comes on top of the recent repeated failures to find acceptance above the 1.4500 psychological mark and warrants some caution for bullish traders. However, positive technical indicators on the daily chart support prospects for an eventual breakout to the upside.
From current levels, the 1.4470-1.4475 region could act as an immediate hurdle ahead of the 1.4500 mark and the weekly swing high, around the 1.4520 area. This is followed by the monthly top, around the 1.4545 zone, above which the USD/CAD pair could reclaim the 1.4600 mark and climb further to the 1.4670 region en route to 1.4700 and the 1.4800 neighborhood, or over a two-decade high.
On the flip side, weakness below the 1.4400 round figure could find some support near the 1.4355-1.4350 area. A convincing break below could drag the USD/CAD pair to the 1.4300 mark en route to the monthly low, around the 1.4240-1.4235 region. This is followed by the 100-day Simple Moving Average (SMA), currently pegged near the 1.4215 area, which should act as a strong base.
USD/CAD 4-hour chart
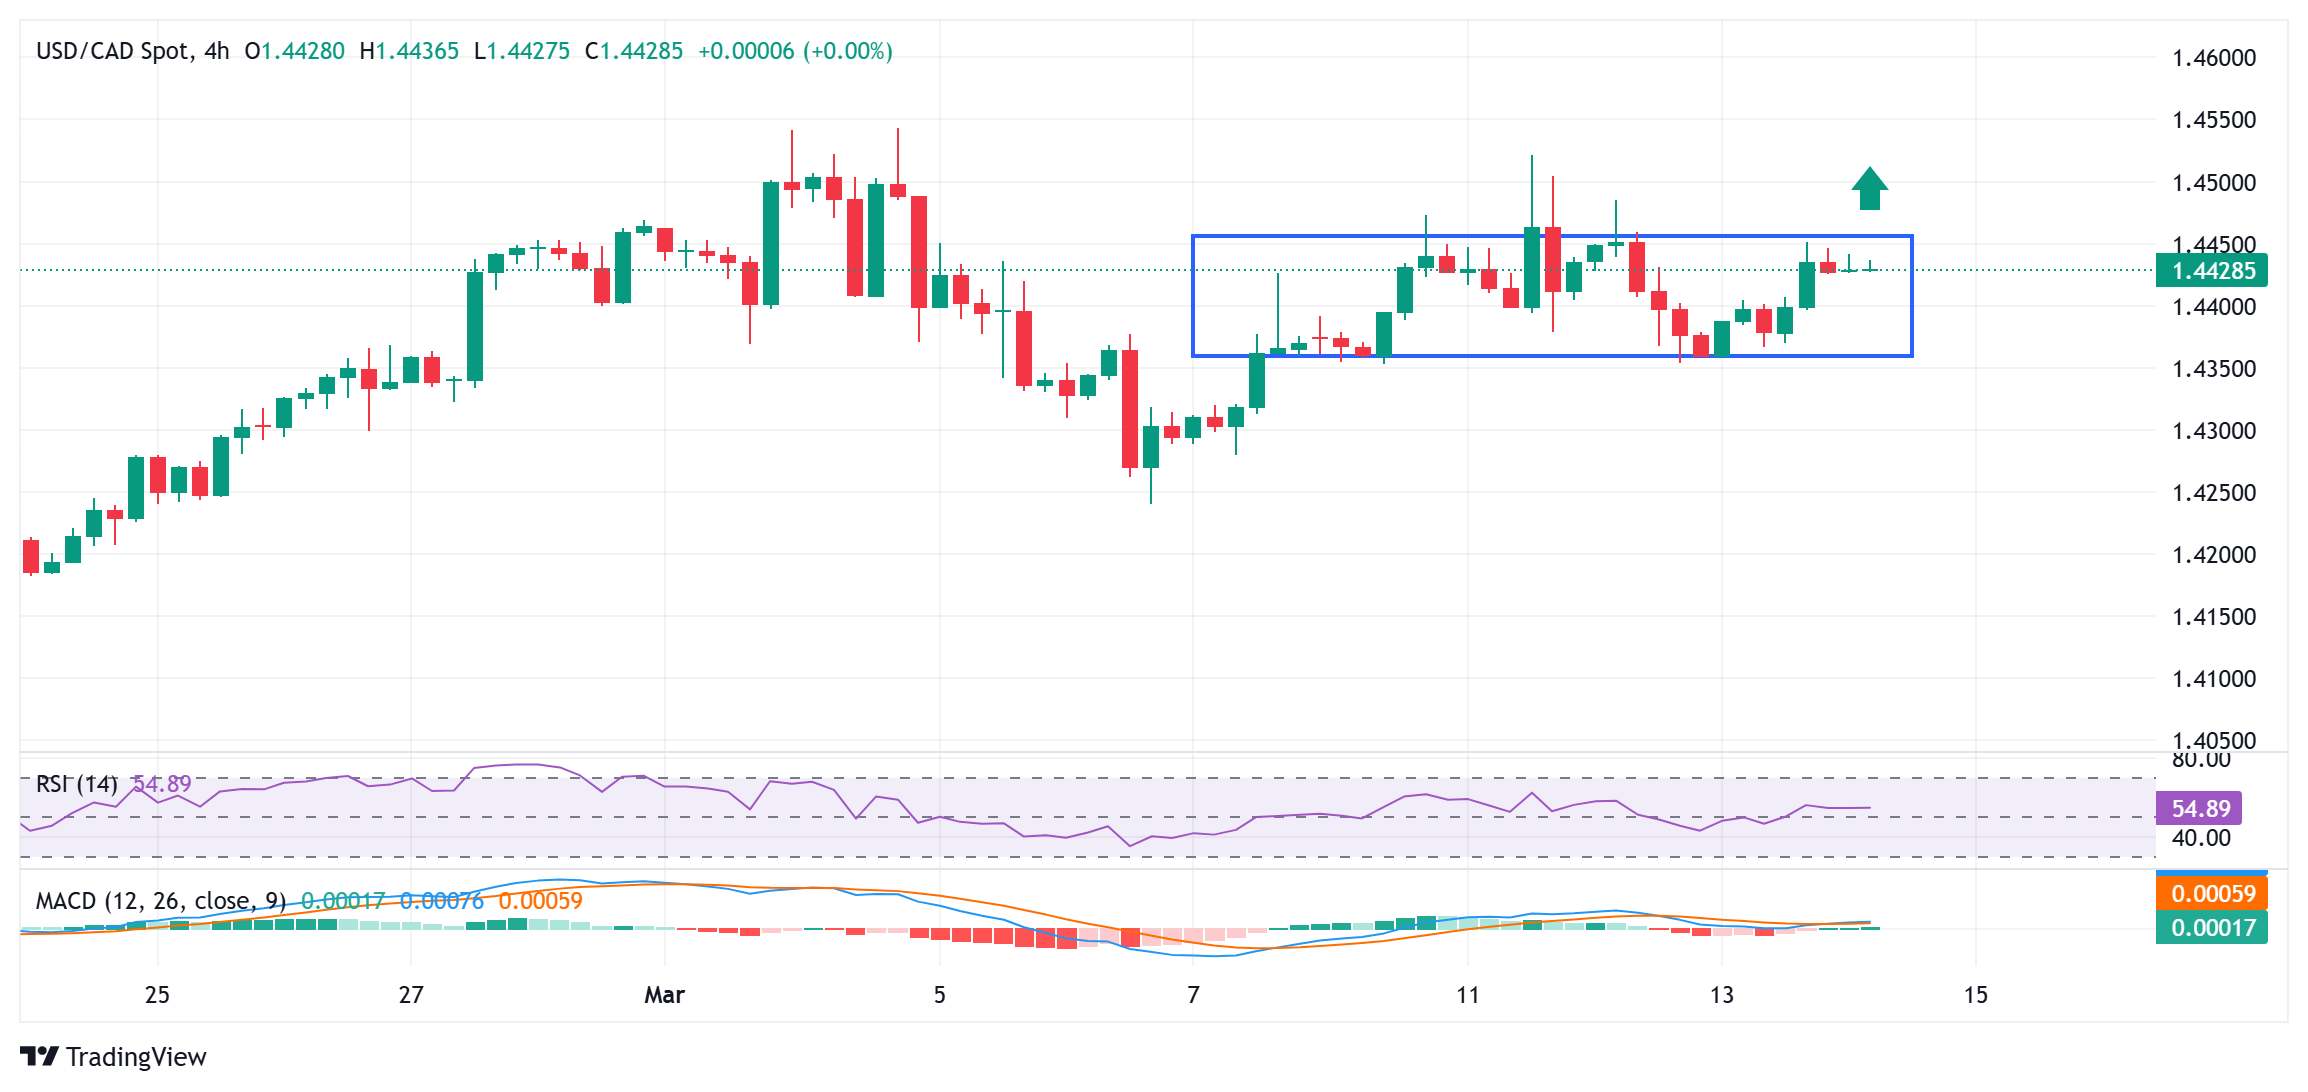
Tariffs FAQs
Tariffs are customs duties levied on certain merchandise imports or a category of products. Tariffs are designed to help local producers and manufacturers be more competitive in the market by providing a price advantage over similar goods that can be imported. Tariffs are widely used as tools of protectionism, along with trade barriers and import quotas.
Although tariffs and taxes both generate government revenue to fund public goods and services, they have several distinctions. Tariffs are prepaid at the port of entry, while taxes are paid at the time of purchase. Taxes are imposed on individual taxpayers and businesses, while tariffs are paid by importers.
There are two schools of thought among economists regarding the usage of tariffs. While some argue that tariffs are necessary to protect domestic industries and address trade imbalances, others see them as a harmful tool that could potentially drive prices higher over the long term and lead to a damaging trade war by encouraging tit-for-tat tariffs.
During the run-up to the presidential election in November 2024, Donald Trump made it clear that he intends to use tariffs to support the US economy and American producers. In 2024, Mexico, China and Canada accounted for 42% of total US imports. In this period, Mexico stood out as the top exporter with $466.6 billion, according to the US Census Bureau. Hence, Trump wants to focus on these three nations when imposing tariffs. He also plans to use the revenue generated through tariffs to lower personal income taxes.
-
04:57
USD/CHF attracts some buyers to near 0.8850 on US Dollar’s recovery
- USD/CHF gains traction to around 0.8840 in Friday’s Asian session, adding 0.26% on the day.
- The renewed US Dollar demand provides some support to the pair.
- The safe-haven flows could lift the Swiss Franc and cap the pair’s upside.
The USD/CHF pair drifts higher to near 0.8840 during the Asian trading hours on Friday, bolstered by the renewed US Dollar demand. Nonetheless, a global trade war and rising geopolitical tensions could boost the safe-haven currency like the Swiss Franc (CHF) and cap the pair’s upside.
On Thursday, the Labor Department reported that US producer prices unexpectedly unchanged on a monthly basis in February. However, tariffs are unlikely to keep prices down in the near future. “Looking ahead, the inflation landscape has become increasingly uncertain as various economic factors begin to take effect. One of the key contributors is the impact of tariffs, which have started to influence consumer prices,” said Sung Won Sohn chief economist at SS Economics. This, in turn, and provides some support to the Greenback against the CHF.
On the other hand, Trump’s tariffs may inflict irreparable harm to the US economy and might push the US economy into recession. Trump emphasized that he will be imposing tariffs on Europe, China and everyone else that trades with the US to bring manufacturing back home, and “Make America Great Again.” The global uncertainty, along with the escalating geopolitical tensions in the Middle East could the safe-haven demand, benefiting the CHF.Swiss Franc FAQs
The Swiss Franc (CHF) is Switzerland’s official currency. It is among the top ten most traded currencies globally, reaching volumes that well exceed the size of the Swiss economy. Its value is determined by the broad market sentiment, the country’s economic health or action taken by the Swiss National Bank (SNB), among other factors. Between 2011 and 2015, the Swiss Franc was pegged to the Euro (EUR). The peg was abruptly removed, resulting in a more than 20% increase in the Franc’s value, causing a turmoil in markets. Even though the peg isn’t in force anymore, CHF fortunes tend to be highly correlated with the Euro ones due to the high dependency of the Swiss economy on the neighboring Eurozone.
The Swiss Franc (CHF) is considered a safe-haven asset, or a currency that investors tend to buy in times of market stress. This is due to the perceived status of Switzerland in the world: a stable economy, a strong export sector, big central bank reserves or a longstanding political stance towards neutrality in global conflicts make the country’s currency a good choice for investors fleeing from risks. Turbulent times are likely to strengthen CHF value against other currencies that are seen as more risky to invest in.
The Swiss National Bank (SNB) meets four times a year – once every quarter, less than other major central banks – to decide on monetary policy. The bank aims for an annual inflation rate of less than 2%. When inflation is above target or forecasted to be above target in the foreseeable future, the bank will attempt to tame price growth by raising its policy rate. Higher interest rates are generally positive for the Swiss Franc (CHF) as they lead to higher yields, making the country a more attractive place for investors. On the contrary, lower interest rates tend to weaken CHF.
Macroeconomic data releases in Switzerland are key to assessing the state of the economy and can impact the Swiss Franc’s (CHF) valuation. The Swiss economy is broadly stable, but any sudden change in economic growth, inflation, current account or the central bank’s currency reserves have the potential to trigger moves in CHF. Generally, high economic growth, low unemployment and high confidence are good for CHF. Conversely, if economic data points to weakening momentum, CHF is likely to depreciate.
As a small and open economy, Switzerland is heavily dependent on the health of the neighboring Eurozone economies. The broader European Union is Switzerland’s main economic partner and a key political ally, so macroeconomic and monetary policy stability in the Eurozone is essential for Switzerland and, thus, for the Swiss Franc (CHF). With such dependency, some models suggest that the correlation between the fortunes of the Euro (EUR) and the CHF is more than 90%, or close to perfect.
-
04:36
India Gold price today: Gold steadies, according to FXStreet data
Gold prices remained broadly unchanged in India on Friday, according to data compiled by FXStreet.
The price for Gold stood at 8,361.12 Indian Rupees (INR) per gram, broadly stable compared with the INR 8,358.71 it cost on Thursday.
The price for Gold was broadly steady at INR 97,522.43 per tola from INR 97,496.98 per tola a day earlier.
Unit measure Gold Price in INR 1 Gram 8,361.12 10 Grams 83,613.91 Tola 97,522.43 Troy Ounce 260,053.80 Daily digest market movers: Gold price soars unfazed by a strong US Dollar
-
The US 10-year Treasury bond yield erases yesterday’s gains, dropping four and a half basis points to 4.270%.
-
US real yields, as measured by the US 10-year Treasury Inflation-Protected Securities (TIPS) yield that correlates inversely to Gold prices, climb one basis point to 1.99%.
-
The US Dollar Index (DXY), which tracks the Greenback’s value against six currencies, recovers 0.27% to 103.85.
-
The US Producer Price Index (PPI) for February came in softer than expected, rising 3.2% YoY, below the 3.3% forecast and down from 3.7% in January.
-
Core PPI, which excludes volatile components, increased 3.4% YoY, falling short of the 3.5% estimate and easing from 3.6% in the prior month.
-
Despite recent cooler-than-expected inflation data, economists caution that tariffs on US imports could lead to a renewed inflationary uptick in the coming months.
-
Meanwhile, Initial Jobless Claims for the week ending March 8 edged down to 220K, beating forecasts of 225K and improving from the 222K reported previously.
-
On Wednesday, 25% US tariffs on steel and aluminum took effect at midnight as US President Donald Trump is battling to reduce the trade deficit by applying duties on imports.
-
Money market futures traders had been priced in 74 basis points of easing by the Federal Reserve (Fed) toward the end of the year.
-
The Atlanta Fed GDPNow model predicts the first quarter of 2025 at -2.4 %, which would be the first negative print since the COVID-19 pandemic.
FXStreet calculates Gold prices in India by adapting international prices (USD/INR) to the local currency and measurement units. Prices are updated daily based on the market rates taken at the time of publication. Prices are just for reference and local rates could diverge slightly.
Gold FAQs
Gold has played a key role in human’s history as it has been widely used as a store of value and medium of exchange. Currently, apart from its shine and usage for jewelry, the precious metal is widely seen as a safe-haven asset, meaning that it is considered a good investment during turbulent times. Gold is also widely seen as a hedge against inflation and against depreciating currencies as it doesn’t rely on any specific issuer or government.
Central banks are the biggest Gold holders. In their aim to support their currencies in turbulent times, central banks tend to diversify their reserves and buy Gold to improve the perceived strength of the economy and the currency. High Gold reserves can be a source of trust for a country’s solvency. Central banks added 1,136 tonnes of Gold worth around $70 billion to their reserves in 2022, according to data from the World Gold Council. This is the highest yearly purchase since records began. Central banks from emerging economies such as China, India and Turkey are quickly increasing their Gold reserves.
Gold has an inverse correlation with the US Dollar and US Treasuries, which are both major reserve and safe-haven assets. When the Dollar depreciates, Gold tends to rise, enabling investors and central banks to diversify their assets in turbulent times. Gold is also inversely correlated with risk assets. A rally in the stock market tends to weaken Gold price, while sell-offs in riskier markets tend to favor the precious metal.
The price can move due to a wide range of factors. Geopolitical instability or fears of a deep recession can quickly make Gold price escalate due to its safe-haven status. As a yield-less asset, Gold tends to rise with lower interest rates, while higher cost of money usually weighs down on the yellow metal. Still, most moves depend on how the US Dollar (USD) behaves as the asset is priced in dollars (XAU/USD). A strong Dollar tends to keep the price of Gold controlled, whereas a weaker Dollar is likely to push Gold prices up.
(An automation tool was used in creating this post.)
-
-
04:31
AUD/JPY rebounds to near 93.50 amid stronger commodity prices, uncertainty over BoJ policy
- AUD/JPY strengthens as rising commodity prices, including gold, steel, and iron ore, support the Australian Dollar.
- The AUD faced challenges after Trump decided to uphold a 25% tariff on Australian aluminum and steel exports.
- The BoJ is expected to leave interest rates unchanged next week while evaluating the risks of escalating US trade tensions.
AUD/JPY recoups recent losses from the prior session, trading around 93.30 during Asian hours on Friday. The Australian Dollar (AUD) finds support from rising commodity prices, including Gold, Steel, and Iron Ore, bolstering its strength against the Japanese Yen (JPY).
However, global trade tensions weigh on the AUD/JPY cross following US President Donald Trump’s decision to maintain a 25% tariff on Australian aluminum and steel exports, valued at nearly $1 billion. This move adds pressure to Australia’s trade outlook and key exports. Despite this, Australian Prime Minister Anthony Albanese confirmed that Australia will not impose retaliatory tariffs on the US, stating that such measures would increase costs for consumers and drive inflation higher.
Meanwhile, the Japanese Yen remains under pressure amid a cautious stance from the Bank of Japan (BoJ). The central bank is expected to keep interest rates unchanged next week while assessing the risks posed by escalating US trade tensions on Japan’s export-driven economy. The timing of the BoJ’s next rate hike remains uncertain, with policymakers monitoring global uncertainties.
“Japan’s economy and price developments appear stable, but external risks are growing,” a source familiar with BoJ discussions told Reuters. “Heightened global uncertainty could impact the BoJ’s rate hike plans,” echoed two additional sources.
Despite the recent pullback, the JPY remains near its strongest levels against its peers in months, supported by expectations of further BoJ rate hikes this year. Additionally, Japanese firms have agreed to substantial wage increases for the third consecutive year to help workers cope with inflation and address labor shortages. Higher wages are expected to boost consumer spending, fuel inflation, and provide the BoJ with greater flexibility for future rate hikes.
Interest rates FAQs
Interest rates are charged by financial institutions on loans to borrowers and are paid as interest to savers and depositors. They are influenced by base lending rates, which are set by central banks in response to changes in the economy. Central banks normally have a mandate to ensure price stability, which in most cases means targeting a core inflation rate of around 2%. If inflation falls below target the central bank may cut base lending rates, with a view to stimulating lending and boosting the economy. If inflation rises substantially above 2% it normally results in the central bank raising base lending rates in an attempt to lower inflation.
Higher interest rates generally help strengthen a country’s currency as they make it a more attractive place for global investors to park their money.
Higher interest rates overall weigh on the price of Gold because they increase the opportunity cost of holding Gold instead of investing in an interest-bearing asset or placing cash in the bank. If interest rates are high that usually pushes up the price of the US Dollar (USD), and since Gold is priced in Dollars, this has the effect of lowering the price of Gold.
The Fed funds rate is the overnight rate at which US banks lend to each other. It is the oft-quoted headline rate set by the Federal Reserve at its FOMC meetings. It is set as a range, for example 4.75%-5.00%, though the upper limit (in that case 5.00%) is the quoted figure. Market expectations for future Fed funds rate are tracked by the CME FedWatch tool, which shapes how many financial markets behave in anticipation of future Federal Reserve monetary policy decisions.
-
04:27
Gold price hits fresh all-time high; approaches $3,000 amid trade war fears
- Gold price remains well supported by the uncertainty surrounding Trump’s aggressive trade policies.
- Fed rate cut bets further benefit the yellow metal, though a modest USD uptick caps further gains.
- An improvement in global risk sentiment would further warrant some caution for the XAU/USD bulls.
Gold price (XAU/USD) enters a bullish consolidation and oscillates in a narrow range near the all-time peak touched during the Asian session on Friday. Investors remain worried about US President Donald Trump's aggressive trade policies and their impact on the global economy, which, in turn, continues to underpin demand for the safe-haven bullion. Apart from this, rising bets for further monetary policy easing by the Federal Reserve (Fed) turn out to be another factor that benefits the non-yielding yellow metal.
However, some follow-through US Dollar (USD) buying, for the third straight day, along with a slight improvement in the global risk sentiment, keeps the Gold price below the $3,000 psychological mark. Furthermore, overbought conditions on the weekly chart seem to hold back bullish traders from placing fresh bets around the XAU/USD pair. Nevertheless, the precious metal remains on track to register strong gains for the second straight week and the fundamental backdrop supports prospects for additional gains.
Daily Digest Market Movers: Gold price continues to attract safe-haven flows amid rising trade tensions
- US President Donald Trump ups the ante on the tariff war, saying that he would levy a 200% duty on European wine and cognac imports unless the European Union removes surcharges on US whiskey. Trump had earlier threatened that he would respond to any countermeasures announced by the EU.
- This comes on top of Trump's 25% tariff on all steel and aluminum imports, which took effect on Wednesday, fueling concerns about the risk of a further escalation in the tariff war between the US and its top trading partner, and pushing the safe-haven Gold price to a fresh record high on Friday.
- Traders ramp up their bets that the Federal Reserve will have to lower interest rates this year by more than expected amid the rising possibility of an economic downturn on the back of the Trump administration’s aggressive policies. The expectations were lifted by softer US inflation figures this week.
- In fact, data released on Wednesday showed that the headline US Consumer Price Index (CPI) rose less than expected, by 2.8% on a yearly basis in February, down from 3% in the previous month. Moreover, the core gauge eased to the 3.1% YoY rate from the 3.3% increase registered in January.
- Adding to this, the US Producer Price Index (PPI) was unchanged in February and the yearly rate slowed to 3.2% from 3.7% in January. This pointed to signs of easing inflationary pressure in the US, which, along with a cooling US labor market, supports prospects for further easing by the Fed.
- Traders are currently pricing in the possibility of three 25 basis points Fed rate cuts each at the June, July, and October monetary policy meetings. This, in turn, is seen as another factor that underpins the non-yielding yellow metal, though a combination of factors keeps a lid on further gains.
- The global risk sentiment gets a minor lift in reaction to some positive comments out of the White House and from Canadian officials. Ontario Premier Doug Ford said that the meeting with US Commerce Secretary Howard Lutnick has lowered the temperature on the ongoing trade war.
- Moreover, Russian President Vladimir Putin expressed conditional support for a 30-day ceasefire proposal put forward by the US and Ukraine. This, along with reports that there will be enough Democratic votes to avoid a US government shutdown, further boosts investors' confidence.
- Meanwhile, the US Dollar Index (DXY), which tracks the Greenback against a basket of currencies, prolongs its recovery from the lowest level since October 16 for the third successive day. This further contributes to capping the upside for the commodity during the Asian session.
- Traders now look forward to the Preliminary release of the Michigan US Consumer Sentiment and Inflation Expectations Index for short-term opportunities. The market focus will then shift to the crucial two-day FOMC monetary policy meeting starting next Tuesday.
Gold price needs to consolidate before making a sustained move above $3,000
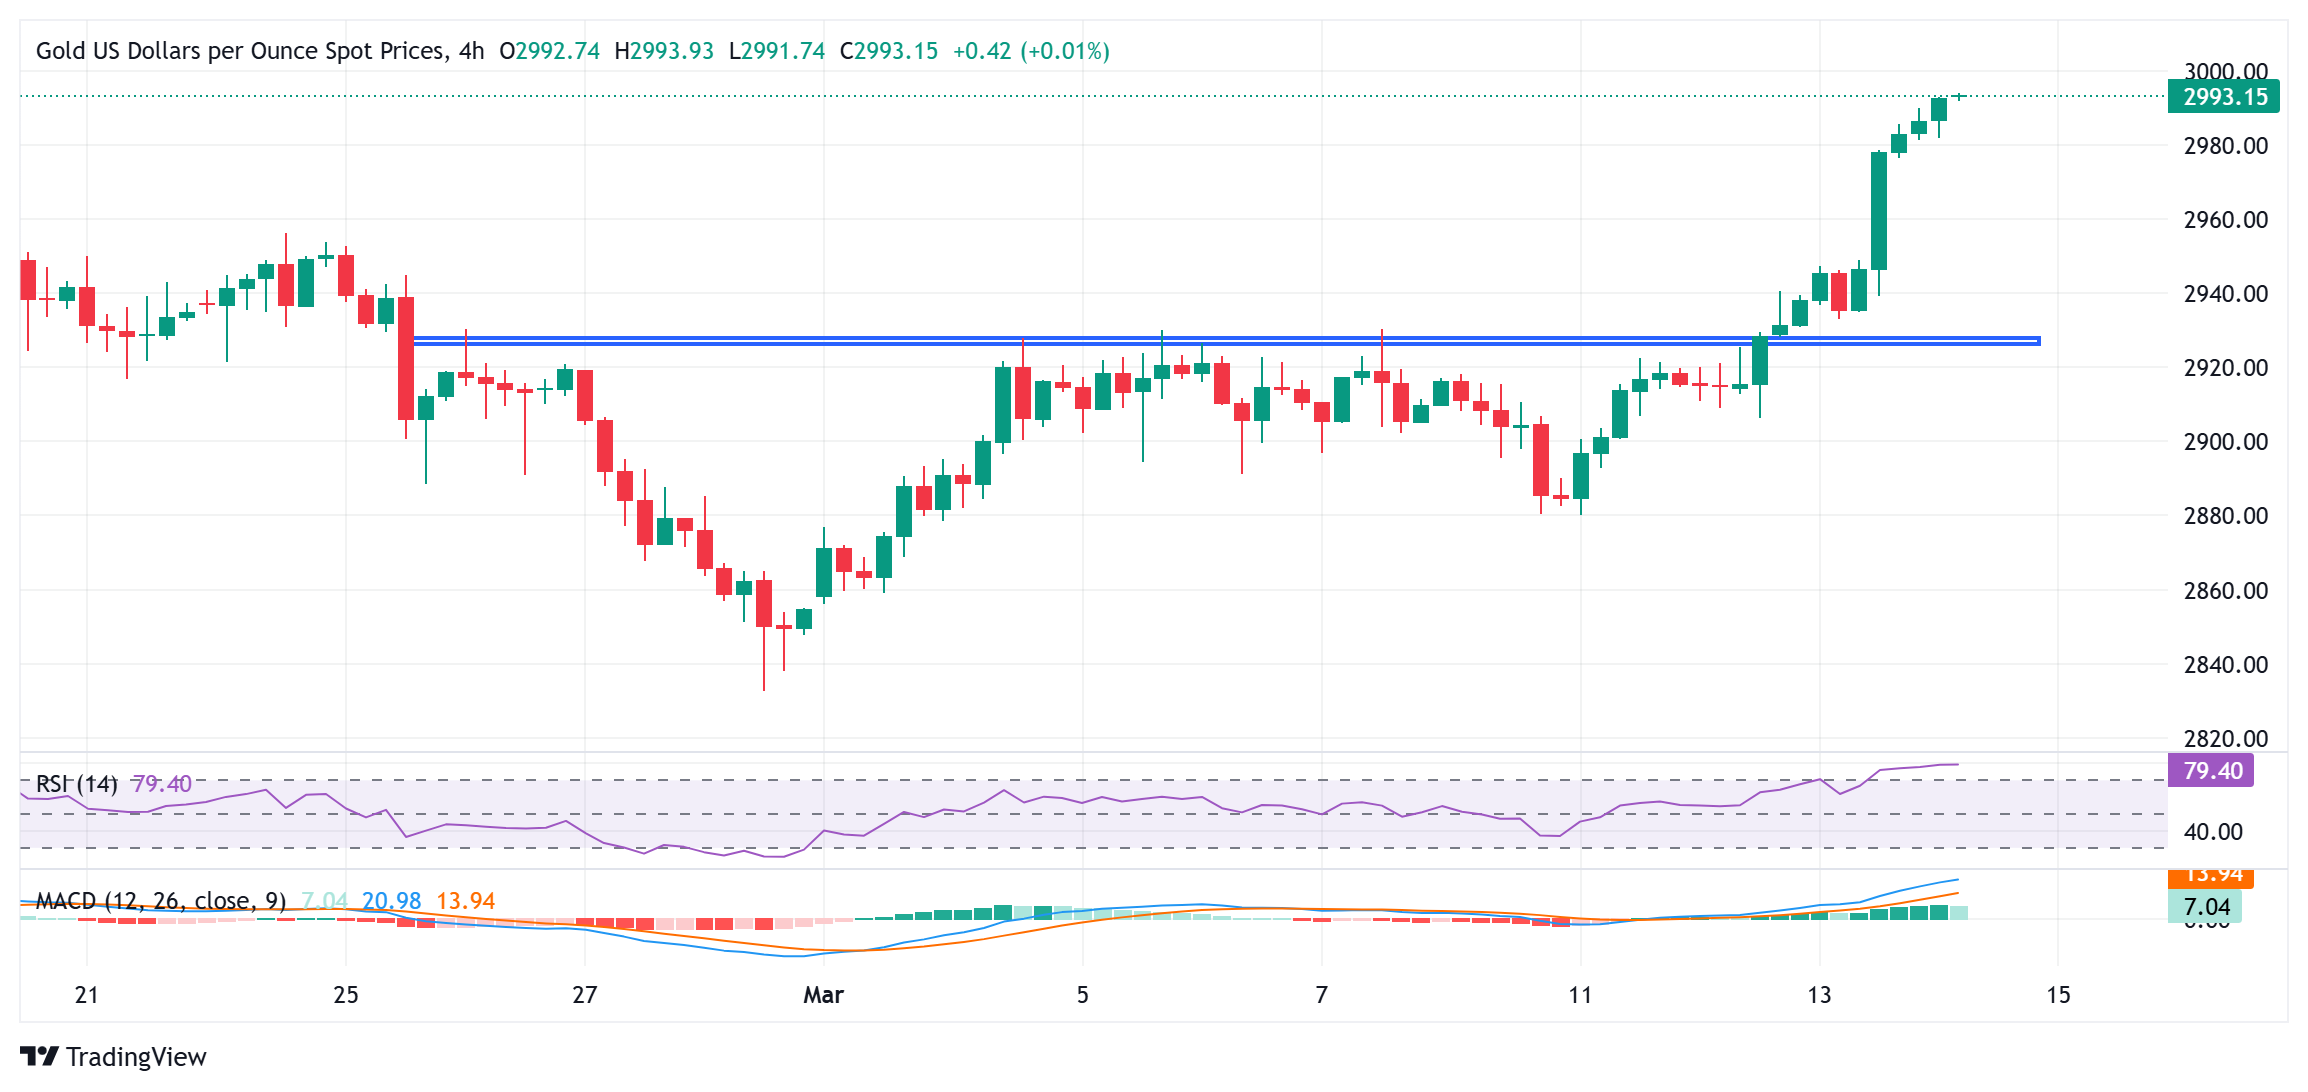
From a technical perspective, this week's breakout through the $2,928-2,930 horizontal resistance and a subsequent move beyond the previous record high, around the $2,956 region, could be seen as a fresh trigger for bulls. That said, the Relative Strength Index (RSI) on the daily chart remains close to the overbought territory and makes it prudent to wait for some near-term consolidation or a modest pullback before the next leg up. The broader setup, however, suggests that the path of least resistance for the Gold price remains to the upside and supports prospects for an extension of a nearly three-month-old well-established uptrend.
In the meantime, any meaningful corrective slide is more likely to attract fresh buyers near the $2,956 area, below which the Gold price could drop to the $2,930-2,928 horizontal resistance breakpoint, now turned support. The latter should act as a key pivotal point and a convincing break below might prompt some technical selling, which should pave the way for deeper losses. The XAU/USD pair might then accelerate the fall towards the $2,900 round figure en route to the $2,880 region, or the weekly low touched on Tuesday.
Gold FAQs
Gold has played a key role in human’s history as it has been widely used as a store of value and medium of exchange. Currently, apart from its shine and usage for jewelry, the precious metal is widely seen as a safe-haven asset, meaning that it is considered a good investment during turbulent times. Gold is also widely seen as a hedge against inflation and against depreciating currencies as it doesn’t rely on any specific issuer or government.
Central banks are the biggest Gold holders. In their aim to support their currencies in turbulent times, central banks tend to diversify their reserves and buy Gold to improve the perceived strength of the economy and the currency. High Gold reserves can be a source of trust for a country’s solvency. Central banks added 1,136 tonnes of Gold worth around $70 billion to their reserves in 2022, according to data from the World Gold Council. This is the highest yearly purchase since records began. Central banks from emerging economies such as China, India and Turkey are quickly increasing their Gold reserves.
Gold has an inverse correlation with the US Dollar and US Treasuries, which are both major reserve and safe-haven assets. When the Dollar depreciates, Gold tends to rise, enabling investors and central banks to diversify their assets in turbulent times. Gold is also inversely correlated with risk assets. A rally in the stock market tends to weaken Gold price, while sell-offs in riskier markets tend to favor the precious metal.
The price can move due to a wide range of factors. Geopolitical instability or fears of a deep recession can quickly make Gold price escalate due to its safe-haven status. As a yield-less asset, Gold tends to rise with lower interest rates, while higher cost of money usually weighs down on the yellow metal. Still, most moves depend on how the US Dollar (USD) behaves as the asset is priced in dollars (XAU/USD). A strong Dollar tends to keep the price of Gold controlled, whereas a weaker Dollar is likely to push Gold prices up.
-
04:02
EUR/USD drifts lower below 1.0850 on US-EU tariff dispute
- EUR/USD loses ground to near 1.0835 in Friday’s Asian session.
- Trump threatens a 200% tariff on alcohol from the EU.
- Traders raise their bets that the Fed will restart its rate cuts in June.
The EUR/USD pair edges lower to around 1.0835 during the Asian trading hours on Friday. The Euro (EUR) weakens against the US Dollar (USD) amid an escalating trade war between the United States and the European Union. The German Harmonized Index of Consumer Price (HICP) for February and the preliminary Michigan Consumer Sentiment for March will be published later on Friday.
Late Thursday, US President Donald Trump threatened to impose a 200% tariff on wine, cognac and other alcohol imports from Europe. This measure came in response to the EU plan to impose tariffs on American whiskey and other products in April, which itself is a reaction to Trump's 25% duties on steel and aluminum imports that took effect on Wednesday. The latest twist of an escalating trade war exerts some selling pressure on the shared currency.
The European Central Bank (ECB) policymaker and Bundesbank President, Joachim Nagel, said that US tariffs on imported goods could tip Germany, Europe’s largest economy, into another recession, adding to the country’s ongoing economic struggles. "We are in a world with tariffs, so we could expect maybe a recession for this year if the tariffs are really coming," said Nagel on Thursday.
On the other hand, the weaker US economic data and concerns over a US slowdown might drag the Greenback lower and cap the downside for the major pair. Barclays analysts adjusted its forecast for US Federal Reserve (Fed) interest rate decisions, now seeing two quarter-point cuts in June and September. Previously, Barclays projected a single 25 basis points (bps) cut in June. Short-term interest-rate futures have priced in nearly a 75% odds of a quarter-point reduction to the Fed's policy rate by June, according to the CME FedWatch tool.Tariffs FAQs
Tariffs are customs duties levied on certain merchandise imports or a category of products. Tariffs are designed to help local producers and manufacturers be more competitive in the market by providing a price advantage over similar goods that can be imported. Tariffs are widely used as tools of protectionism, along with trade barriers and import quotas.
Although tariffs and taxes both generate government revenue to fund public goods and services, they have several distinctions. Tariffs are prepaid at the port of entry, while taxes are paid at the time of purchase. Taxes are imposed on individual taxpayers and businesses, while tariffs are paid by importers.
There are two schools of thought among economists regarding the usage of tariffs. While some argue that tariffs are necessary to protect domestic industries and address trade imbalances, others see them as a harmful tool that could potentially drive prices higher over the long term and lead to a damaging trade war by encouraging tit-for-tat tariffs.
During the run-up to the presidential election in November 2024, Donald Trump made it clear that he intends to use tariffs to support the US economy and American producers. In 2024, Mexico, China and Canada accounted for 42% of total US imports. In this period, Mexico stood out as the top exporter with $466.6 billion, according to the US Census Bureau. Hence, Trump wants to focus on these three nations when imposing tariffs. He also plans to use the revenue generated through tariffs to lower personal income taxes.
-
03:25
GBP/USD hovers around 1.2950, four-month highs ahead of UK GDP, factory data
- GBP/USD maintains its position near the four-month high of 1.2989 reached on March 13.
- Risk sentiment weakened after President Trump threatened a 200% tariff on European wines and champagne.
- Traders will closely watch the UK GDP figures as the BoE has expressed concerns over the economic outlook.
GBP/USD continues its decline for the second straight session, trading near 1.2940 during Friday’s Asian session. The pair faces challenges as the Pound Sterling (GBP) struggles amid weakened risk sentiment, exacerbated by concerns over global trade after US President Donald Trump threatened a 200% tariff on European wines and champagne, unsettling markets.
Traders now await the UK’s monthly Gross Domestic Product (GDP) and factory data for January, set for release on Friday. Investors will closely watch the UK GDP figures as the Bank of England (BoE) has expressed concerns over the economic outlook. In its February policy meeting, the BoE revised its GDP growth forecast for the year to 0.75%, down from the 1.5% projected in November.
The US Dollar (USD) appreciates due to mounting concerns over a global economic slowdown, with traders focusing on Friday’s Michigan Consumer Sentiment Index data. The US Dollar Index (DXY), which tracks the USD against six major currencies, gained strength after Thursday’s positive jobless claims report and weaker-than-expected Producer Price Index (PPI) data. The DXY is trading around 104.00 at the time of writing.
US Initial Jobless Claims for the week ending March 7 came in at 220,000, lower than the expected 225,000. Continuing claims dropped to 1.87 million, below the forecast of 1.90 million, indicating resilience in the US labor market.
Inflationary pressures in the US showed signs of easing. The PPI rose 3.2% year-over-year in February, down from 3.7% in January and below the 3.3% market forecast. Core PPI, which excludes food and energy, increased 3.4% annually, compared to 3.8% in January. On a monthly basis, the headline PPI remained unchanged, while core PPI dipped by 0.1%.
Economic Indicator
Gross Domestic Product (MoM)
The Gross Domestic Product (GDP), released by the Office for National Statistics on a monthly and quarterly basis, is a measure of the total value of all goods and services produced in the UK during a given period. The GDP is considered as the main measure of UK economic activity. The MoM reading compares economic activity in the reference month to the previous month. Generally, a rise in this indicator is bullish for the Pound Sterling (GBP), while a low reading is seen as bearish.
Read more.Next release: Fri Mar 14, 2025 07:00
Frequency: Monthly
Consensus: 0.1%
Previous: 0.4%
Source: Office for National Statistics
-
02:52
Japanese Yen weakens amid positive risk tone; USD/JPY bulls retake 148.00 and seek higher levels beyond
- The Japanese Yen drifts lower amid a slight improvement in the global risk sentiment.
- Hawkish BoJ expectations and rising trade tensions should back the safe-haven JPY.
- Fed rate cut bets could act as a headwind for the Greenback and cap the USD/JPY pair.
The Japanese Yen (JPY) attracts some sellers during the Asian session on Friday and reverses the previous day's positive move against its American counterpart amid a slight improvement in the global risk sentiment. Positive comments out of the White House and from Canadian officials, along with reports that there will be enough Democratic votes to avoid a US government shutdown, boost investors' confidence. This, in turn, leads to a modest recovery in the US equity futures and turns out to be a key factor undermining the JPY's safe-haven status.
Any meaningful JPY depreciation, however, still seems elusive in the wake of the growing acceptance that the Bank of Japan (BoJ) will hike interest rates again. Moreover, hawkish BoJ expectations led to the recent sharp narrowing of the rate differential between Japan and other countries, which should limit losses for the lower-yielding JPY. Apart from this, the underlying bearish sentiment surrounding the US Dollar (USD), amid bets that the Federal Reserve (Fed) will cut rates several times this year, might contribute to capping gains for the USD/JPY pair.
Japanese Yen is undermined by a positive risk tone; BoJ rate hike bets should limit losses
- Ontario Premier Doug Ford said that the meeting with US Commerce Secretary Howard Lutnick was positive and productive and that it has lowered the temperature on the ongoing trade war.
- Adding to this, Canada's Industry Minister Francois-Philippe Champagne and Finance Minister Dominic LeBlanc said that the discussion was constructive and that talks would continue.
- Senate Minority Leader Chuck Schumer signaled that Democrats will vote with Republicans to pass a six-month spending bill that would keep the US government funded through September.
- Russian President Vladimir Putin expressed conditional support for a 30-day cease-fire proposal put forward by the US and Ukraine, providing a modest lift to the global risk sentiment.
- Japan’s Prime Minister Shigeru Ishiba, earlier this week, underscored the significance of the spring wage negotiations and urged trade unions and companies to boost worker’s pay.
- A major Japanese labour union group said on Thursday its member unions had struck agreements for substantial wage hikes and the average rise was just over 5%, slightly smaller than last year.
- The preliminary results of Japan's annual spring labor negotiations, known as Shunto, are due this Friday amid hopes that bumper wage hikes seen last year will continue this year.
- This, along with signs of broadening inflationary pressures in Japan, gives the Bank of Japan headroom to hike rates further, keeping the Japanese government bond yields elevated.
- The yield on the benchmark 10-year JGB remains close to its highest level since October 2008 touched on Monday, which, in turn, should continue to underpin the Japanese Yen.
- The US Dollar, on the other hand, struggles to attract any meaningful buyers and hangs near a multi-month low amid bets that the Federal Reserve will resume its rate-cutting cycle soon.
- In fact, market participants are currently pricing in the possibility of three 25 basis point Fed rate cuts each at the June, July, and October monetary policy meetings.
- The bets were lifted by Thursday's data showing that the US Producer Price Index (PPI) was unchanged in February and the yearly rate slowed to 3.2% from 3.7% in January.
- This comes on top of softer-than-expected US Consumer Price Index (CPI) report on Wednesday and points to signs of easing inflation, which should allow the Fed to cut rates further.
- Traders now look forward to the Preliminary release of the Michigan US Consumer Sentiment and Inflation Expectations Index for short-term opportunities on the last day of the week.
USD/JPY may struggle to capitalize on modest intraday gains
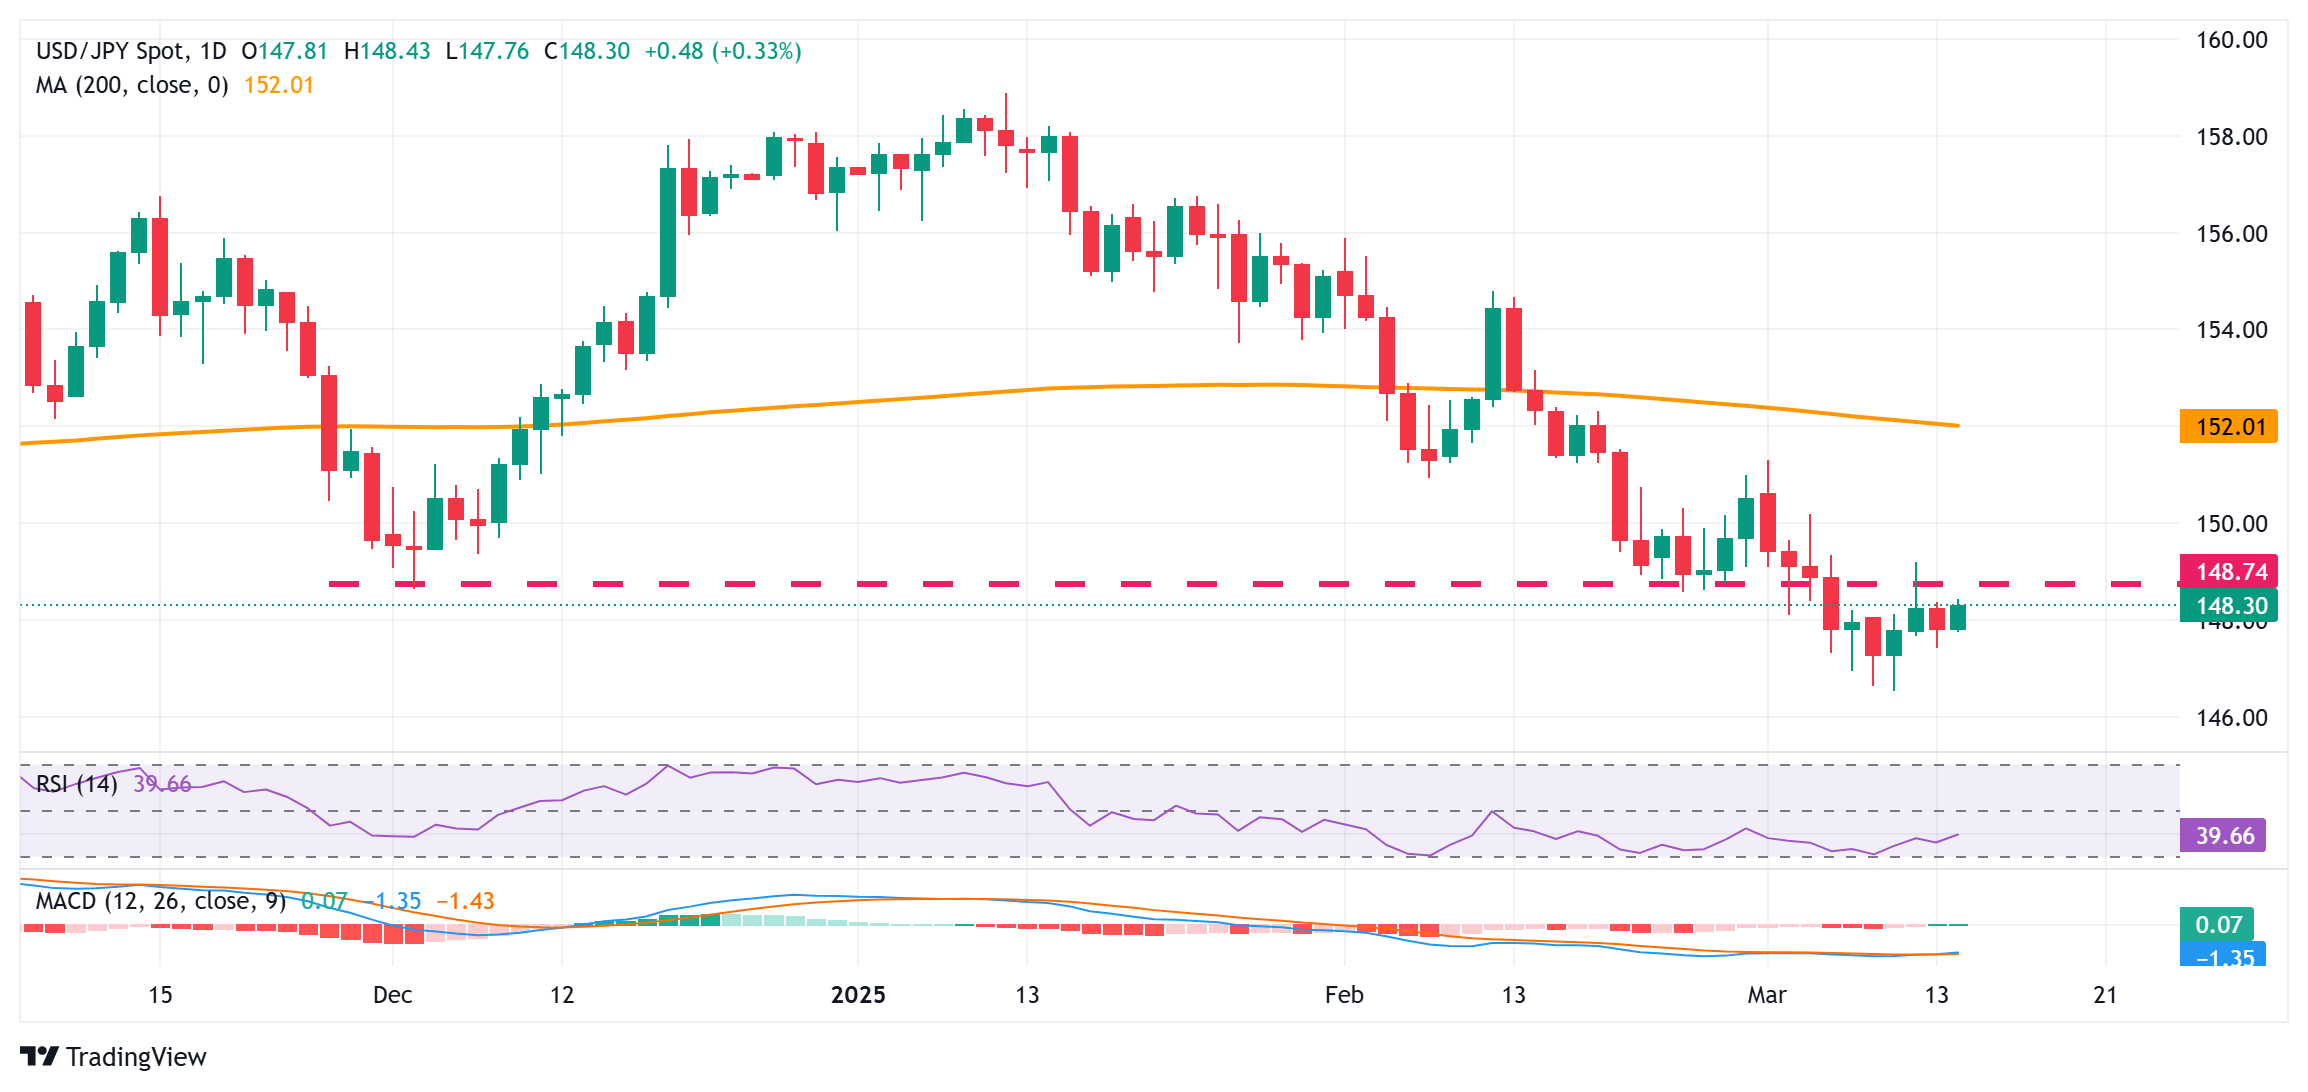
From a technical perspective, any subsequent move-up is likely to confront some resistance near the 148.60-148.70 support breakpoint ahead of the 149.00 mark and the weekly swing high, around the 149.20 region. A sustained strength beyond the latter could trigger a short-covering rally towards the 150.00 psychological mark, above which the USD/JPY pair could climb to the 150.65-150.70 zone. The momentum could extend further towards the 151.00 mark and the monthly peak, around the 151.30 region.
On the flip side, the 147.75-147.70 horizontal zone now seems to have emerged as an immediate support. A convincing break below could make the USD/JPY pair vulnerable to accelerate the fall towards the 147.00 round figure en route to the 146.55-146.50 region, or the lowest level since October touched earlier this week. Given that oscillators on the daily chart are holding in negative territory and are still away from being in the oversold zone, some follow-through selling will be seen as a fresh trigger for bears and pave the way for further losses.
Japanese Yen FAQs
The Japanese Yen (JPY) is one of the world’s most traded currencies. Its value is broadly determined by the performance of the Japanese economy, but more specifically by the Bank of Japan’s policy, the differential between Japanese and US bond yields, or risk sentiment among traders, among other factors.
One of the Bank of Japan’s mandates is currency control, so its moves are key for the Yen. The BoJ has directly intervened in currency markets sometimes, generally to lower the value of the Yen, although it refrains from doing it often due to political concerns of its main trading partners. The BoJ ultra-loose monetary policy between 2013 and 2024 caused the Yen to depreciate against its main currency peers due to an increasing policy divergence between the Bank of Japan and other main central banks. More recently, the gradually unwinding of this ultra-loose policy has given some support to the Yen.
Over the last decade, the BoJ’s stance of sticking to ultra-loose monetary policy has led to a widening policy divergence with other central banks, particularly with the US Federal Reserve. This supported a widening of the differential between the 10-year US and Japanese bonds, which favored the US Dollar against the Japanese Yen. The BoJ decision in 2024 to gradually abandon the ultra-loose policy, coupled with interest-rate cuts in other major central banks, is narrowing this differential.
The Japanese Yen is often seen as a safe-haven investment. This means that in times of market stress, investors are more likely to put their money in the Japanese currency due to its supposed reliability and stability. Turbulent times are likely to strengthen the Yen’s value against other currencies seen as more risky to invest in.
-
02:38
WTI holds position above $66.50 amid fresh US sanctions on Iranian Oil, shadow fleet
- WTI rises but is still set for its eighth straight weekly loss.
- Crude Oil prices climb following new US sanctions on Iranian oil and Hong Kong-flagged vessels linked to Iran’s shadow fleet.
- Oil demand struggles due to heightened global trade tensions after Trump threatened a 200% tariff on European wines and champagne.
West Texas Intermediate (WTI) Oil price edges higher on Friday after losing more than 1% in the previous session. However, WTI remains on track for its eighth consecutive weekly decline, trading around $66.70 per barrel during Asian hours. The price uptick comes as fresh US sanctions on Iranian Oil and shipping provide some support.
On Thursday, the US imposed new sanctions targeting Iran’s Oil minister as part of its ongoing "maximum pressure" campaign against Tehran. The sanctions also extend to several Hong Kong-flagged vessels involved in Iran’s shadow fleet, which helps conceal oil shipments, according to the US Treasury Department.
Despite this, crude Oil remains under pressure due to broader macroeconomic concerns. Fears that global trade tensions could dampen demand persist, especially after US President Donald Trump threatened a 200% tariff on all European wines and champagne during Thursday’s early US session, sparking concerns in global markets.
Additionally, uncertainty looms over a proposed US-brokered ceasefire between Russia and Ukraine. Russian President Vladimir Putin stated on Thursday that Moscow agrees with the US proposal but insists that any ceasefire must pave the way for lasting peace and address the root causes of the conflict. European Union (EU) High Representative for Foreign Affairs and Security Policy, Kaja Kallas, suggested that Russia is likely to accept the ceasefire proposal but with conditions, according to Reuters.
Further pressuring Oil prices, the International Energy Agency (IEA) warned that a growing supply surplus could intensify as trade tensions weigh on demand while The Organization of the Petroleum Exporting Countries and its alias, known as OPEC+, ramp up production. The IEA projects that global Oil supply will outpace demand by approximately 600,000 barrels per day (bpd) this year, driven by US-led supply growth. Meanwhile, demand growth is forecast at 1.03 million bpd—70,000 bpd lower than last month’s estimate.
WTI Oil FAQs
WTI Oil is a type of Crude Oil sold on international markets. The WTI stands for West Texas Intermediate, one of three major types including Brent and Dubai Crude. WTI is also referred to as “light” and “sweet” because of its relatively low gravity and sulfur content respectively. It is considered a high quality Oil that is easily refined. It is sourced in the United States and distributed via the Cushing hub, which is considered “The Pipeline Crossroads of the World”. It is a benchmark for the Oil market and WTI price is frequently quoted in the media.
Like all assets, supply and demand are the key drivers of WTI Oil price. As such, global growth can be a driver of increased demand and vice versa for weak global growth. Political instability, wars, and sanctions can disrupt supply and impact prices. The decisions of OPEC, a group of major Oil-producing countries, is another key driver of price. The value of the US Dollar influences the price of WTI Crude Oil, since Oil is predominantly traded in US Dollars, thus a weaker US Dollar can make Oil more affordable and vice versa.
The weekly Oil inventory reports published by the American Petroleum Institute (API) and the Energy Information Agency (EIA) impact the price of WTI Oil. Changes in inventories reflect fluctuating supply and demand. If the data shows a drop in inventories it can indicate increased demand, pushing up Oil price. Higher inventories can reflect increased supply, pushing down prices. API’s report is published every Tuesday and EIA’s the day after. Their results are usually similar, falling within 1% of each other 75% of the time. The EIA data is considered more reliable, since it is a government agency.
OPEC (Organization of the Petroleum Exporting Countries) is a group of 12 Oil-producing nations who collectively decide production quotas for member countries at twice-yearly meetings. Their decisions often impact WTI Oil prices. When OPEC decides to lower quotas, it can tighten supply, pushing up Oil prices. When OPEC increases production, it has the opposite effect. OPEC+ refers to an expanded group that includes ten extra non-OPEC members, the most notable of which is Russia.
-
02:18
US Treasury Sec. Bessent: We don't get a recursive Biden-flation
In an interview with Breitbart News Network on Friday, US Treasury Secretary Scott Bessent said, "we don't get a recursive Biden-flation,” per Reuters.
Further comments
We're very vigilant about inflation, it could happen again.
Before we can bring down inflation, we also want to help affordability.
As we bring down inflation, we want to bring the absolute price level down through deregulation and bringing down interest rates for house payments and car payments.
Market reaction
At the press time, the US Dollar Index (DXY) is trading 0.14% higher on the day to near 104.00.
-
02:07
Silver Price Forecast: XAG/USD keeps the bullish vibe above $33.50 as trade war escalates
- Silver price drifts lower to $33.75 in Friday’s early Asian session.
- The positive bias of the metal prevails above the 100-period EMA, with the bullish RSI indicator.
- The key resistance level emerges at the $34.00-$34.10 region; the first downside target to watch is $32.94.
The Silver price (XAG/USD) loses momentum to near $33.80 during the early Asian session on Friday. However, the downside for white metal might be limited as the softer US consumer and producer inflationary pressures could pave the way for the Federal Reserve (Fed) to cut interest rates in the June policy meeting, which provides some support to the white metal.
Furthermore, the fear that protectionism from US President Donald Trump will push the United States, the world’s largest economy, into recession might contribute to Silver’s upside.
According to the 4-hour chart, the constructive outlook of the Silver price remains in play as the white metal holds above the key 100-period Exponential Moving Averages (EMA). Additionally, the Relative Strength Index (RSI) stands above the midline near 67.00, indicating bullish momentum. This suggests that further upside looks favorable for XAG/USD.
The crucial resistance level for Silver emerges in the $34.00-$34.10 zone, representing the psychological level and the upper boundary of the Bollinger Band. A decisive break above this level could see a rally to $34.55, the weekly high of October 28, en route to $34.87, the weekly high of October 21.
On the flip side, the initial support level is located at $32.94, the low of March 13. A breach of this level could expose $32.41, the 100-period EMA. Any follow-through selling below the mentioned level could see a drop to near $32.00, the lower limit of the Bollinger Band and round figure.Silver price (XAG/USD) 4-hour chart
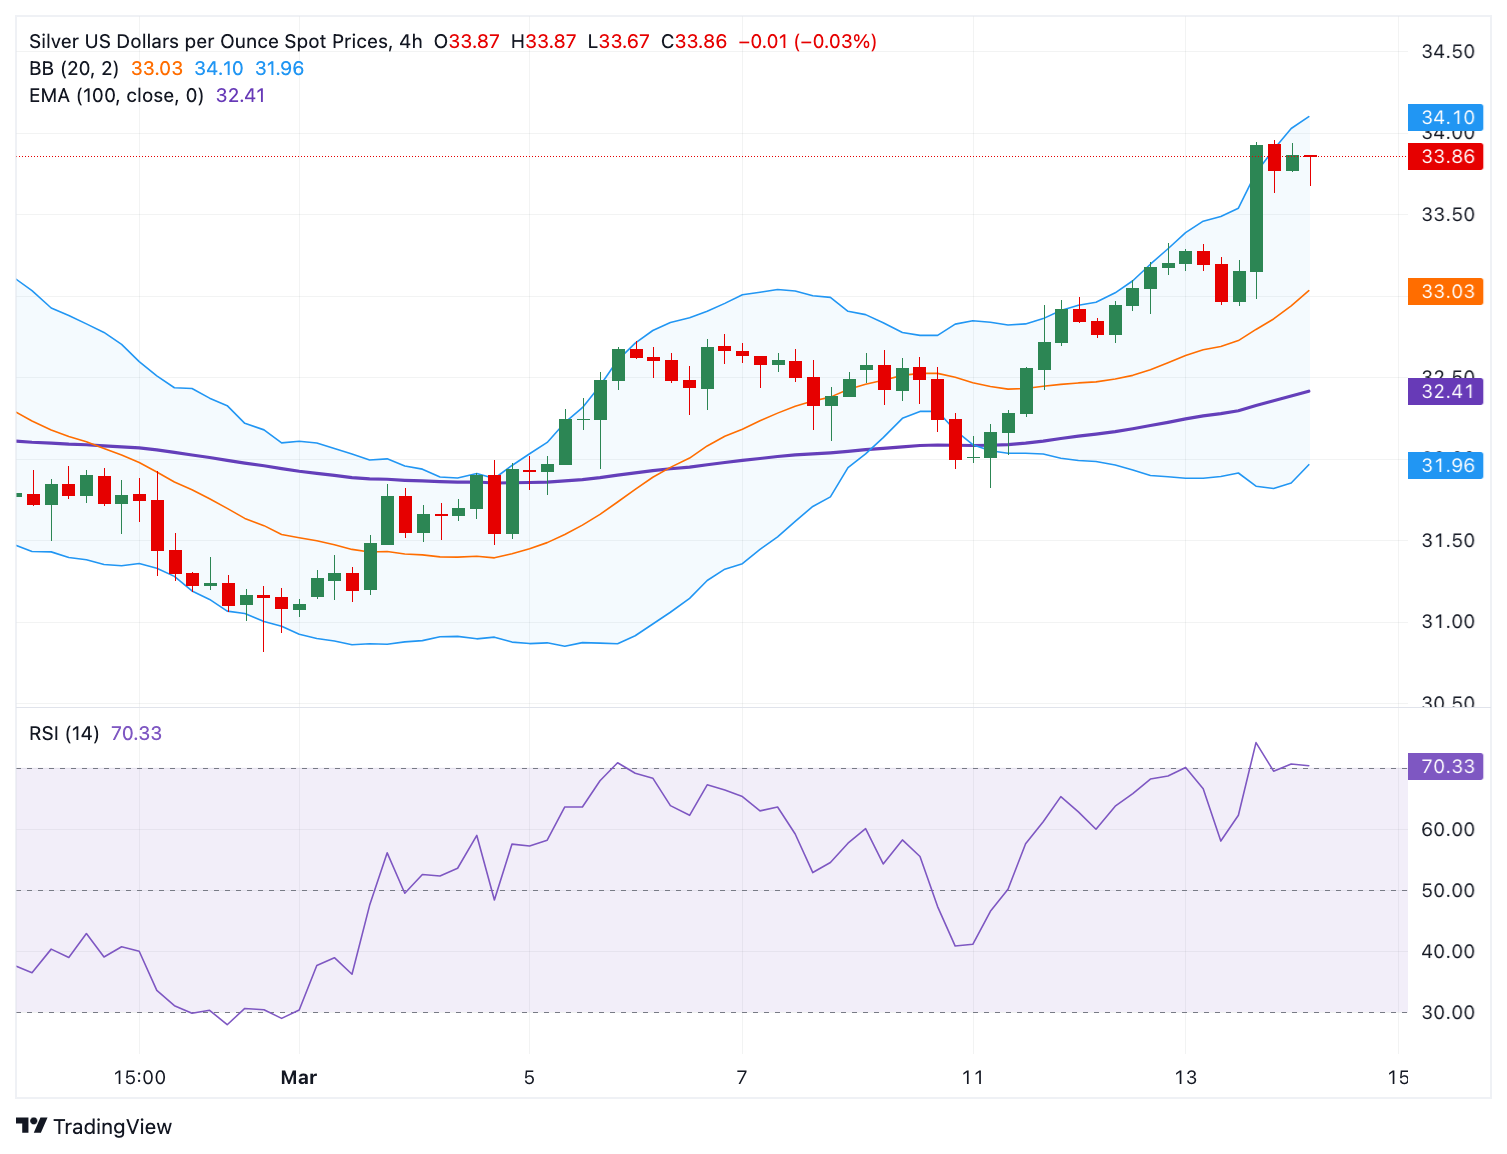
Silver FAQs
Silver is a precious metal highly traded among investors. It has been historically used as a store of value and a medium of exchange. Although less popular than Gold, traders may turn to Silver to diversify their investment portfolio, for its intrinsic value or as a potential hedge during high-inflation periods. Investors can buy physical Silver, in coins or in bars, or trade it through vehicles such as Exchange Traded Funds, which track its price on international markets.
Silver prices can move due to a wide range of factors. Geopolitical instability or fears of a deep recession can make Silver price escalate due to its safe-haven status, although to a lesser extent than Gold's. As a yieldless asset, Silver tends to rise with lower interest rates. Its moves also depend on how the US Dollar (USD) behaves as the asset is priced in dollars (XAG/USD). A strong Dollar tends to keep the price of Silver at bay, whereas a weaker Dollar is likely to propel prices up. Other factors such as investment demand, mining supply – Silver is much more abundant than Gold – and recycling rates can also affect prices.
Silver is widely used in industry, particularly in sectors such as electronics or solar energy, as it has one of the highest electric conductivity of all metals – more than Copper and Gold. A surge in demand can increase prices, while a decline tends to lower them. Dynamics in the US, Chinese and Indian economies can also contribute to price swings: for the US and particularly China, their big industrial sectors use Silver in various processes; in India, consumers’ demand for the precious metal for jewellery also plays a key role in setting prices.
Silver prices tend to follow Gold's moves. When Gold prices rise, Silver typically follows suit, as their status as safe-haven assets is similar. The Gold/Silver ratio, which shows the number of ounces of Silver needed to equal the value of one ounce of Gold, may help to determine the relative valuation between both metals. Some investors may consider a high ratio as an indicator that Silver is undervalued, or Gold is overvalued. On the contrary, a low ratio might suggest that Gold is undervalued relative to Silver.
-
01:39
Australian Dollar remains steady, downside risks appear amid growing economic concerns
- The Australian Dollar faces potential losses amid rising concerns over a global economic slowdown.
- The AUD came under pressure following President Trump’s decision to maintain a 25% tariff on Australian aluminum and steel exports.
- The US Dollar strengthened as traders digested softer-than-expected Producer Price Index data released on Thursday.
The Australian Dollar (AUD) holds firm on Friday after recent losses, as the AUD/USD pair could face pressure from a strengthening US Dollar (USD) amid growing fears of a global economic slowdown.
A key challenge for the AUD comes from US President Donald Trump’s decision to uphold a 25% tariff on Australian aluminum and steel exports, valued at nearly $1 billion. This move adds strain to Australia’s trade outlook, impacting major exports.
Despite this, Australian Prime Minister Anthony Albanese confirmed that Australia will not impose reciprocal tariffs on the US, emphasizing that retaliatory measures would only raise costs for Australian consumers and fuel inflation.
Adding to market concerns, RBA Deputy Governor Andrew Hauser highlighted earlier that global trade uncertainty is at a 50-year high. Hauser warned that ongoing tariff policies and economic tensions could delay business investment and economic growth.
Meanwhile, reports from Bloomberg indicate that US-China trade negotiations remain deadlocked. Chinese officials claim that the US has not outlined clear steps regarding fentanyl-related measures required for tariff relief. Additionally, sources close to the White House reveal that there are currently no plans for an in-person meeting between US and Chinese leaders.
Australian Dollar could face challenges as global trade tensions weigh on market sentiment
- The US Dollar Index (DXY), which measures the USD against six major currencies, strengthened after positive jobless claims and softer-than-expected Producer Price Index (PPI) data released on Thursday. At the time of writing, the DXY is trading around 104.00 as markets shift focus to Friday’s Michigan Consumer Sentiment Index data.
- In the labor market, US Initial Jobless Claims came in at 220,000 for the week ending March 7, lower than expected 225,000. Continuing claims also fell to 1.87 million, below the forecast of 1.90 million, signaling resilience in the US job market.
- Meanwhile, inflationary pressures showed signs of easing. The US Producer Price Index (PPI) rose 3.2% year-over-year in February, down from 3.7% in January and below the 3.3% market expectation. The core PPI, which excludes food and energy, increased 3.4% annually, compared to 3.8% in January. On a monthly basis, the headline PPI remained unchanged, while the core PPI declined by 0.1%.
- With inflation cooling and labor market strength, traders and investors will closely monitor upcoming consumer confidence and inflation expectation data for further insights into the Federal Reserve’s monetary policy outlook and the USD’s future direction.
- The US Dollar faced challenges as the softer inflation report fueled speculation that the US Federal Reserve (Fed) could cut interest rates sooner than anticipated.
- US monthly headline inflation slowed to 0.2% in February, down from 0.5% in January, while core inflation eased to 0.2%, below the expected 0.3%. On an annual basis, headline inflation declined to 2.8% from 3.0%, while core inflation fell to 3.1% from 3.3%.
- President Trump threatened to impose a 200% tariff on all European wines and champagne via his social media account during Thursday’s early US session, raising widespread concerns in global markets.
- Australia's Consumer Inflation Expectations, consumer expectations of future inflation during the next 12 months, fell to 3.6% in March, down from 4.6% in February—the highest level since April 2024.
Technical Analysis: Australian Dollar breaks below 0.6300, ascending channel
AUD/USD is trading near 0.6290 on Friday, with technical analysis indicating a bearish shift after breaking below the ascending channel on the daily chart. Additionally, the 14-day Relative Strength Index (RSI) has dropped below 50, signaling the beginning of a bearish outlook.
On the downside, the AUD/USD pair could navigate the region around the five-week low of 0.6187, recorded on March 5.
The AUD/USD pair tests the immediate barrier at a nine-day Exponential Moving Average (EMA) of 0.6295, followed by a 50-day EMA at a 0.6303 level. A break above these levels could improve the short- and medium-price momentum and support the pair to explore the area around the three-month high of 0.6408, last reached on February 21.
AUD/USD: Daily Chart
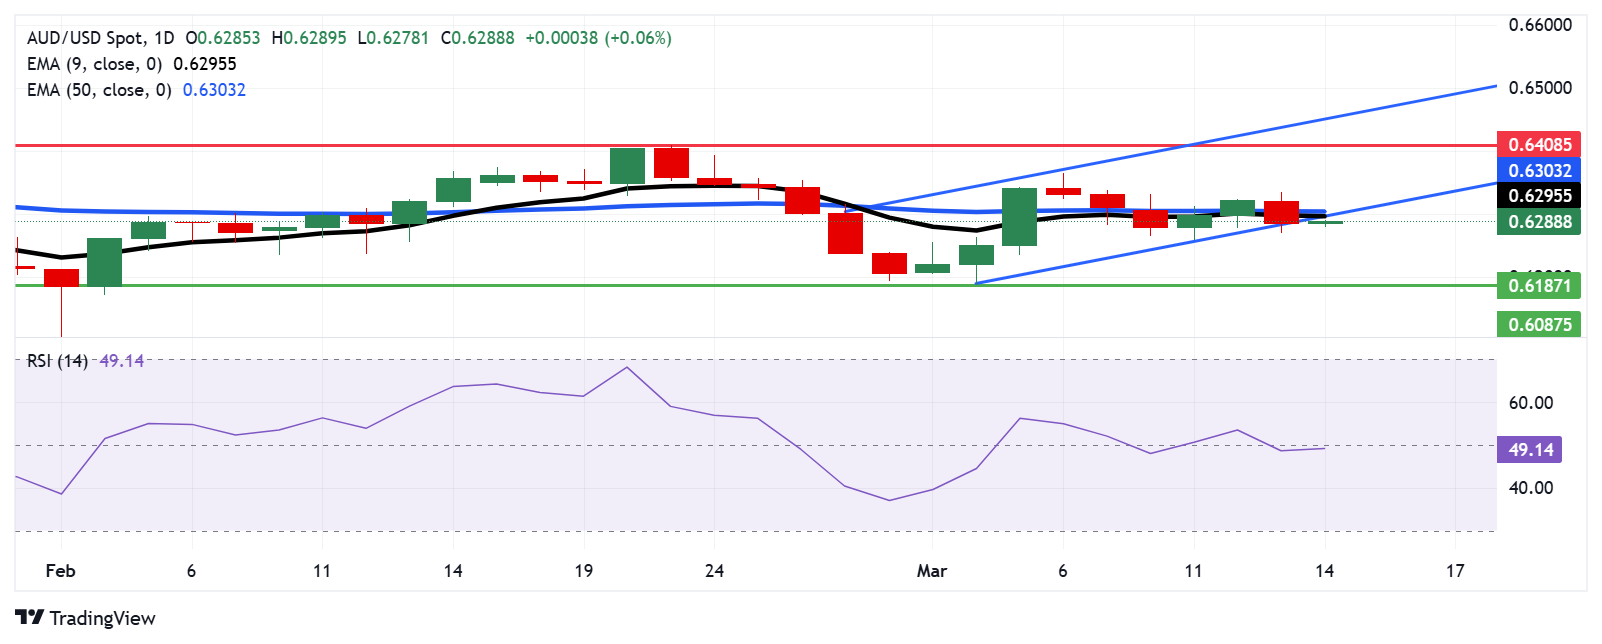
Australian Dollar PRICE Today
The table below shows the percentage change of Australian Dollar (AUD) against listed major currencies today. Australian Dollar was the strongest against the Japanese Yen.
USD EUR GBP JPY CAD AUD NZD CHF USD 0.07% 0.02% 0.30% -0.02% -0.07% -0.22% 0.03% EUR -0.07% -0.01% 0.23% -0.09% -0.15% -0.30% 0.04% GBP -0.02% 0.00% 0.23% -0.08% -0.13% -0.27% 0.06% JPY -0.30% -0.23% -0.23% -0.31% -0.36% -0.51% -0.15% CAD 0.02% 0.09% 0.08% 0.31% -0.04% -0.20% 0.14% AUD 0.07% 0.15% 0.13% 0.36% 0.04% -0.15% 0.14% NZD 0.22% 0.30% 0.27% 0.51% 0.20% 0.15% 0.34% CHF -0.03% -0.04% -0.06% 0.15% -0.14% -0.14% -0.34% The heat map shows percentage changes of major currencies against each other. The base currency is picked from the left column, while the quote currency is picked from the top row. For example, if you pick the Australian Dollar from the left column and move along the horizontal line to the US Dollar, the percentage change displayed in the box will represent AUD (base)/USD (quote).
Australian Dollar FAQs
One of the most significant factors for the Australian Dollar (AUD) is the level of interest rates set by the Reserve Bank of Australia (RBA). Because Australia is a resource-rich country another key driver is the price of its biggest export, Iron Ore. The health of the Chinese economy, its largest trading partner, is a factor, as well as inflation in Australia, its growth rate and Trade Balance. Market sentiment – whether investors are taking on more risky assets (risk-on) or seeking safe-havens (risk-off) – is also a factor, with risk-on positive for AUD.
The Reserve Bank of Australia (RBA) influences the Australian Dollar (AUD) by setting the level of interest rates that Australian banks can lend to each other. This influences the level of interest rates in the economy as a whole. The main goal of the RBA is to maintain a stable inflation rate of 2-3% by adjusting interest rates up or down. Relatively high interest rates compared to other major central banks support the AUD, and the opposite for relatively low. The RBA can also use quantitative easing and tightening to influence credit conditions, with the former AUD-negative and the latter AUD-positive.
China is Australia’s largest trading partner so the health of the Chinese economy is a major influence on the value of the Australian Dollar (AUD). When the Chinese economy is doing well it purchases more raw materials, goods and services from Australia, lifting demand for the AUD, and pushing up its value. The opposite is the case when the Chinese economy is not growing as fast as expected. Positive or negative surprises in Chinese growth data, therefore, often have a direct impact on the Australian Dollar and its pairs.
Iron Ore is Australia’s largest export, accounting for $118 billion a year according to data from 2021, with China as its primary destination. The price of Iron Ore, therefore, can be a driver of the Australian Dollar. Generally, if the price of Iron Ore rises, AUD also goes up, as aggregate demand for the currency increases. The opposite is the case if the price of Iron Ore falls. Higher Iron Ore prices also tend to result in a greater likelihood of a positive Trade Balance for Australia, which is also positive of the AUD.
The Trade Balance, which is the difference between what a country earns from its exports versus what it pays for its imports, is another factor that can influence the value of the Australian Dollar. If Australia produces highly sought after exports, then its currency will gain in value purely from the surplus demand created from foreign buyers seeking to purchase its exports versus what it spends to purchase imports. Therefore, a positive net Trade Balance strengthens the AUD, with the opposite effect if the Trade Balance is negative.
-
01:21
NZD/USD gathers strength above 0.5700 as growth concerns weigh on US Dollar
- NZD/USD trades on a positive note near 0.5700 in Friday’s early Asian session.
- Concerns over the US economic slowdown weigh on the US Dollar.
- Deflationary pressures in China and rising bets of further RBNZ rate cuts might cap the downside for the pair.
The NZD/USD pair edges higher to around 0.5700 during the early Asian session on Friday. The growing concerns about US trade policies weigh on the US Dollar (USD) and create a tailwind for the pair. Later on Friday, traders will keep an eye on the preliminary Michigan Consumer Sentiment.
A series of weaker-than-expected US economic data, including the latest Consumer Price Index (CPI) inflation report, raises the fear about the potential impact of intensifying tariff wars on US economic growth. This, in turn, might drag the Greenback lower against the New Zealand Dollar (NZD) in the near term.
Data released by the US Bureau of Labor Statistics on Thursday showed that the US Producer Price Index (PPI) rose 3.2% YoY in February, compared to the rise of 3.7% seen in January. This figure came in softer than the estimation of 3.3%. The core PPI rose 3.4% YoY in February versus 3.8% prior. On a monthly basis, the PPI was unchanged in February, while the core PPI declined by 0.1% during the same reported period.
Nonetheless, the upside for the pair might be capped amid concerns over persistent deflationary pressures in China. China's Consumer Price Index (CPI) in February missed expectations and fell at the sharpest pace in 13 months, while producer price deflation persisted. This report could undermine the China-proxy Kiwi, as China is the largest trading partner of New Zealand.
Additionally, the expectation of further rate cuts from the Reserve Bank of New Zealand could undermine the NZD, though the RBNZ emphasized a more cautious approach to future moves. RBNZ Governor Adrian Orr said the board is forecasting a lower terminal rate than in its November projections and expects two more 25 basis points (bps) rate reductions in April and May, subject to economic conditions evolving as expected.New Zealand Dollar FAQs
The New Zealand Dollar (NZD), also known as the Kiwi, is a well-known traded currency among investors. Its value is broadly determined by the health of the New Zealand economy and the country’s central bank policy. Still, there are some unique particularities that also can make NZD move. The performance of the Chinese economy tends to move the Kiwi because China is New Zealand’s biggest trading partner. Bad news for the Chinese economy likely means less New Zealand exports to the country, hitting the economy and thus its currency. Another factor moving NZD is dairy prices as the dairy industry is New Zealand’s main export. High dairy prices boost export income, contributing positively to the economy and thus to the NZD.
The Reserve Bank of New Zealand (RBNZ) aims to achieve and maintain an inflation rate between 1% and 3% over the medium term, with a focus to keep it near the 2% mid-point. To this end, the bank sets an appropriate level of interest rates. When inflation is too high, the RBNZ will increase interest rates to cool the economy, but the move will also make bond yields higher, increasing investors’ appeal to invest in the country and thus boosting NZD. On the contrary, lower interest rates tend to weaken NZD. The so-called rate differential, or how rates in New Zealand are or are expected to be compared to the ones set by the US Federal Reserve, can also play a key role in moving the NZD/USD pair.
Macroeconomic data releases in New Zealand are key to assess the state of the economy and can impact the New Zealand Dollar’s (NZD) valuation. A strong economy, based on high economic growth, low unemployment and high confidence is good for NZD. High economic growth attracts foreign investment and may encourage the Reserve Bank of New Zealand to increase interest rates, if this economic strength comes together with elevated inflation. Conversely, if economic data is weak, NZD is likely to depreciate.
The New Zealand Dollar (NZD) tends to strengthen during risk-on periods, or when investors perceive that broader market risks are low and are optimistic about growth. This tends to lead to a more favorable outlook for commodities and so-called ‘commodity currencies’ such as the Kiwi. Conversely, NZD tends to weaken at times of market turbulence or economic uncertainty as investors tend to sell higher-risk assets and flee to the more-stable safe havens.
-
01:15
PBOC sets USD/CNY reference rate at 7.1738 vs. 7.1728 previous
On Friday, the People’s Bank of China (PBOC) set the USD/CNY central rate for the trading session ahead at 7.1738 as compared to the previous day's fix of 7.1728.
-
01:12
EU's Kallas: It's most likely that Russia will agree to a ceasefire with conditions
The European Union (EU) High Representative for Foreign Affairs and Security Policy, Kaja Kallas, said late Thursday that she thinks the most likely scenario is that Russia will say yes to the US proposal for a ceasefire with Ukraine but with conditions, per Reuters.
Key quotes
US is telling G7 members that they understand that Russia may want to extend the process by blurring the picture.
The red line is Ukraine giving away territory.
Without the EU, any deal cannot be implemented because there are elements for which Europe has the card.
Market reaction
At the time of writing, the Gold price (XAU/USD) is trading 0.02% lower on the day to trade at $2,988.
Risk sentiment FAQs
In the world of financial jargon the two widely used terms “risk-on” and “risk off'' refer to the level of risk that investors are willing to stomach during the period referenced. In a “risk-on” market, investors are optimistic about the future and more willing to buy risky assets. In a “risk-off” market investors start to ‘play it safe’ because they are worried about the future, and therefore buy less risky assets that are more certain of bringing a return, even if it is relatively modest.
Typically, during periods of “risk-on”, stock markets will rise, most commodities – except Gold – will also gain in value, since they benefit from a positive growth outlook. The currencies of nations that are heavy commodity exporters strengthen because of increased demand, and Cryptocurrencies rise. In a “risk-off” market, Bonds go up – especially major government Bonds – Gold shines, and safe-haven currencies such as the Japanese Yen, Swiss Franc and US Dollar all benefit.
The Australian Dollar (AUD), the Canadian Dollar (CAD), the New Zealand Dollar (NZD) and minor FX like the Ruble (RUB) and the South African Rand (ZAR), all tend to rise in markets that are “risk-on”. This is because the economies of these currencies are heavily reliant on commodity exports for growth, and commodities tend to rise in price during risk-on periods. This is because investors foresee greater demand for raw materials in the future due to heightened economic activity.
The major currencies that tend to rise during periods of “risk-off” are the US Dollar (USD), the Japanese Yen (JPY) and the Swiss Franc (CHF). The US Dollar, because it is the world’s reserve currency, and because in times of crisis investors buy US government debt, which is seen as safe because the largest economy in the world is unlikely to default. The Yen, from increased demand for Japanese government bonds, because a high proportion are held by domestic investors who are unlikely to dump them – even in a crisis. The Swiss Franc, because strict Swiss banking laws offer investors enhanced capital protection.
-
00:20
Senate Democrats’s Schumer says he will support GOP funding bill, likely avoiding shutdown
Senate Democratic Leader Chuck Schumer announced late Thursday that he plans to vote to keep the government open as the chamber prepares to take up a GOP stopgap bill continuing government funding Friday.
Key quotes
I believe it is my job to make the best choice for the country, to minimize the harm to the American people.
Therefore, I will vote to keep the government open, and not shut it down.
While the Republican bill is very bad, the potential for a shutdown has consequences for America that are much much worse. For sure, the Republican bill is a terrible option.
It is not a clean CR" or continuing resolution.
It is deeply partisan. It doesn't address far too many of this country's needs, but I believe allowing Donald Trump to take even much more power in a government shutdown is a far worse option.
Trump has taken a blowtorch to our country and wielded chaos like a weapon.
For Donald Trump, a shutdown would be a gift. It would be the best distraction he could ask for from his awful agenda.Market reaction
At the time of press, the US Dollar Index was down 0.03% on the day at 103.81.
US Dollar FAQs
The US Dollar (USD) is the official currency of the United States of America, and the ‘de facto’ currency of a significant number of other countries where it is found in circulation alongside local notes. It is the most heavily traded currency in the world, accounting for over 88% of all global foreign exchange turnover, or an average of $6.6 trillion in transactions per day, according to data from 2022. Following the second world war, the USD took over from the British Pound as the world’s reserve currency. For most of its history, the US Dollar was backed by Gold, until the Bretton Woods Agreement in 1971 when the Gold Standard went away.
The most important single factor impacting on the value of the US Dollar is monetary policy, which is shaped by the Federal Reserve (Fed). The Fed has two mandates: to achieve price stability (control inflation) and foster full employment. Its primary tool to achieve these two goals is by adjusting interest rates. When prices are rising too quickly and inflation is above the Fed’s 2% target, the Fed will raise rates, which helps the USD value. When inflation falls below 2% or the Unemployment Rate is too high, the Fed may lower interest rates, which weighs on the Greenback.
In extreme situations, the Federal Reserve can also print more Dollars and enact quantitative easing (QE). QE is the process by which the Fed substantially increases the flow of credit in a stuck financial system. It is a non-standard policy measure used when credit has dried up because banks will not lend to each other (out of the fear of counterparty default). It is a last resort when simply lowering interest rates is unlikely to achieve the necessary result. It was the Fed’s weapon of choice to combat the credit crunch that occurred during the Great Financial Crisis in 2008. It involves the Fed printing more Dollars and using them to buy US government bonds predominantly from financial institutions. QE usually leads to a weaker US Dollar.
Quantitative tightening (QT) is the reverse process whereby the Federal Reserve stops buying bonds from financial institutions and does not reinvest the principal from the bonds it holds maturing in new purchases. It is usually positive for the US Dollar.
-
00:15
Currencies. Daily history for Thursday, March 13, 2025
Pare Closed Change, % AUDUSD 0.62847 -0.6 EURJPY 160.361 -0.64 EURUSD 1.08521 -0.34 GBPJPY 191.377 -0.41 GBPUSD 1.2952 -0.11 NZDUSD 0.56984 -0.57 USDCAD 1.44407 0.51 USDCHF 0.88173 0.02 USDJPY 147.746 -0.31 -
00:00
Ontario Premier: We had a very productive meeting, will have another next week
Ontario Premier Doug Ford said late Thursday that no tariffs have been removed, but he looks forward to continue communicating. Ford further stated that he agreed to another meeting next week.
Key quotes
We agreed to another meeting next week.
It was an extremely productive meeting.
We feel temperatures are lowering.
I'm feeling very positive.
Says it was the best meeting he's ever had in the US.
Says no tariffs have been removed but says he looks forward to continue communicating.
Says it was a long meeting.
Market reaction
At the time of writing, the USD/CAD pair is trading 0.08% lower on the day to trade at 1.4428.
Tariffs FAQs
Tariffs are customs duties levied on certain merchandise imports or a category of products. Tariffs are designed to help local producers and manufacturers be more competitive in the market by providing a price advantage over similar goods that can be imported. Tariffs are widely used as tools of protectionism, along with trade barriers and import quotas.
Although tariffs and taxes both generate government revenue to fund public goods and services, they have several distinctions. Tariffs are prepaid at the port of entry, while taxes are paid at the time of purchase. Taxes are imposed on individual taxpayers and businesses, while tariffs are paid by importers.
There are two schools of thought among economists regarding the usage of tariffs. While some argue that tariffs are necessary to protect domestic industries and address trade imbalances, others see them as a harmful tool that could potentially drive prices higher over the long term and lead to a damaging trade war by encouraging tit-for-tat tariffs.
During the run-up to the presidential election in November 2024, Donald Trump made it clear that he intends to use tariffs to support the US economy and American producers. In 2024, Mexico, China and Canada accounted for 42% of total US imports. In this period, Mexico stood out as the top exporter with $466.6 billion, according to the US Census Bureau. Hence, Trump wants to focus on these three nations when imposing tariffs. He also plans to use the revenue generated through tariffs to lower personal income taxes.
-