Notícias do Mercado
-
23:58
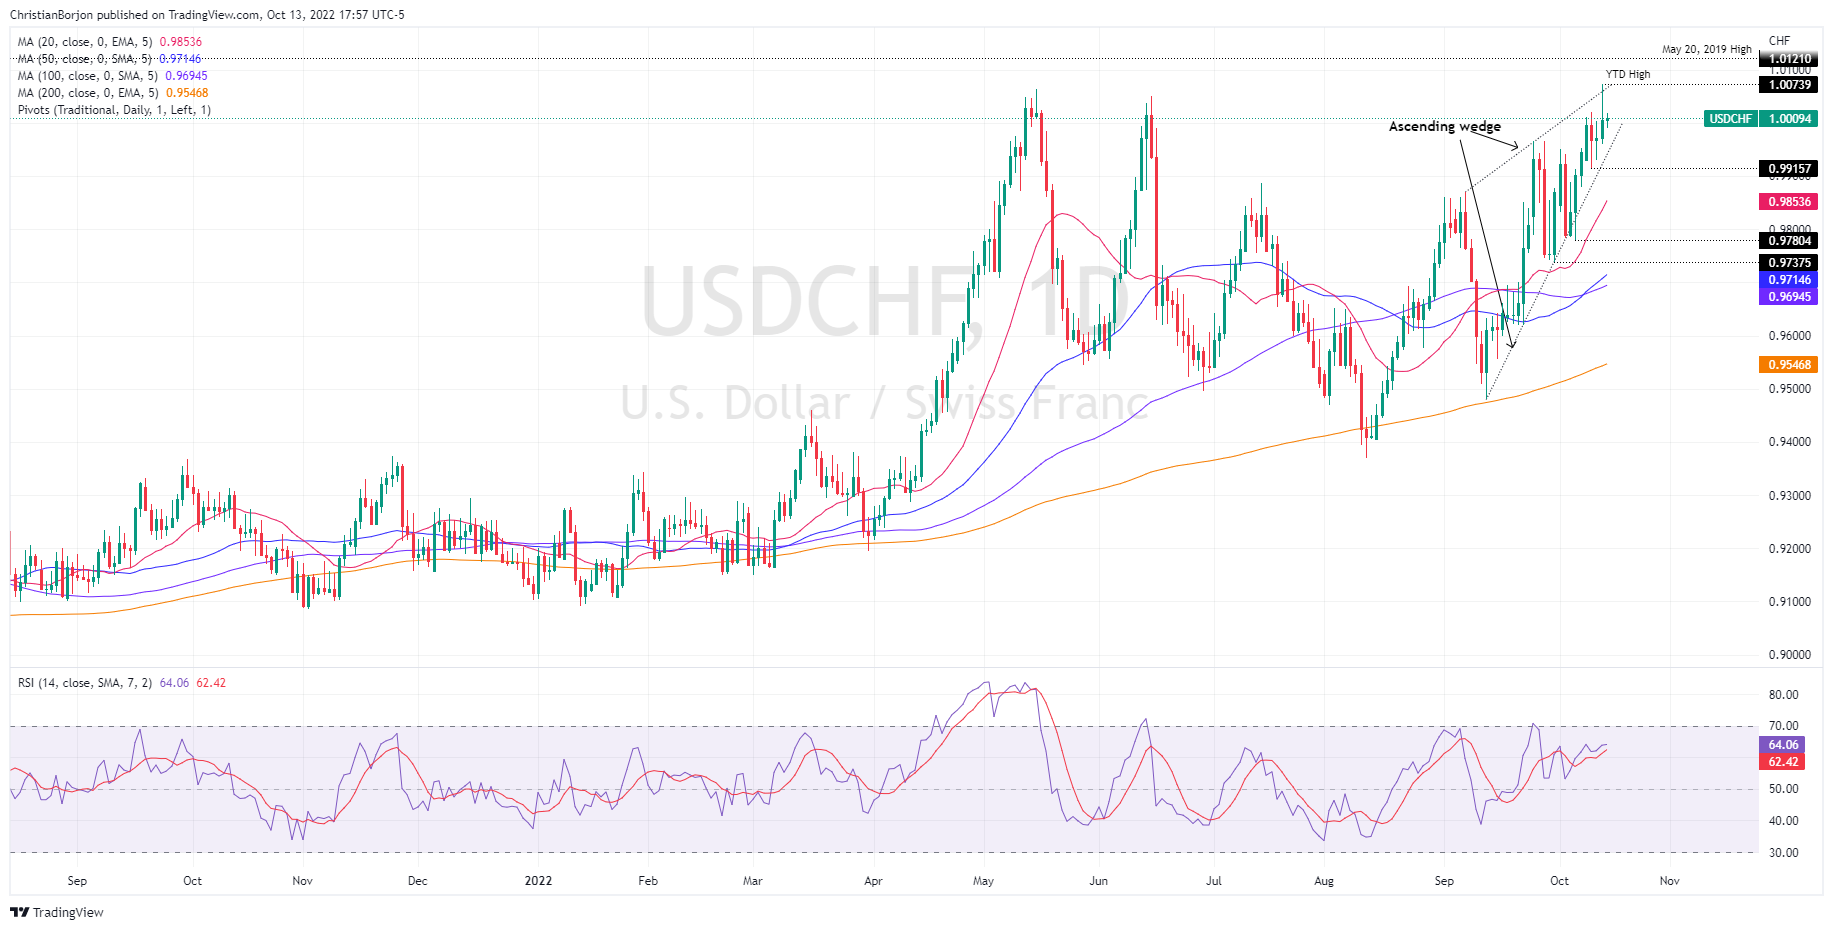
USD/CHF Price Analysis: Solid above parity, eyeing 2019’s highs above 1.0100
- USD/CHF trades above parity for the second consecutive day, following the US CPI report.
- The major hit a fresh YTD high of 1.0074, though retraced to the current spot price.
- USD/CHF Price Forecast: The uptrend remains intact and could reach 2019 May and April highs; otherwise, it could dive below parity.
The USD/CHF oscillates around parity following Thursday’s volatile session, which witnessed the major hitting a YTD high of 1.0074 before retracing to current exchange rates, despite US inflation data, justifying further Fed tightening. At the time of writing, the USD/CHF is trading at 1.0009, above its opening price by 0.04%.
USD/CHF Price Forecast
The daily chart suggests the pair is upward biased, though price action since mid-September and through October formed an ascending wedge, which by the book, is a bearish pattern. However, it is worth noting that successive series of higher highs/lows suggests the uptrend is intact, but a break below the current week low of 0.9915 could open the door for further losses.
Therefore, support levels are 0.9853, the 20-day EMA, followed by October’s 6 0.9780 swing low, ahead of September’s low at 0.9737.
Contrarily, if the USD/CHF breaks above the YTD high at 1.0074, a test of 1.0100 is on the cards. Once cleared, the next resistance levels would be the high of May 20, 2019, at 1.0121, followed by April 26, 2019, high at 1.0230.
USD/CHF Key Technical Levels
-
23:47
Japan’s Suzuki: G20 summary likely to reaffirm FX commitment
“The Group of 20 key nations (G20) is likely to say many currencies have moved significantly this year with increased volatility, reaffirm fx commitment in Chair Summary,” said Japanese Finance Minister Shunichi Suzuki on Friday.
While speaking from the Washington DC, Japan’s Suzuki also mentioned that G20 chair Indonesia likely to issue summary of this meeting's discussion at a later date.
Additional comments
There was no discussion at G7 on what coordinated steps should be taken to address market volatility.
Want to take appropriate action vs excess fx volatility, when asked whether Japan could intervene to prop up yen.
Sid not hold bilateral meeting with US Treasury Secretary Yellen this time.
Has shown clear understanding toward japan's fx intervention last month.
Market implications
The otherwise unimportant news gained attention of the USD/JPY traders as the yen pair jumped to the fresh high since 1998 the previous day, raising expectations of Japan’s intervention. That said, the quote traders firmer around 147.25 by the press time.
Also read: Forex Today: Dramatic U-turn after US inflation misses expectations
-
23:42
GBP/USD bulls take a breather around 1.1330 with eyes on US Retail Sales, Michigan CSI
- GBP/USD steadies nearly weekly top after rising the most in a fortnight.
- UK politics, US inflation surprisingly favored bulls despite hawkish Fed bets.
- More clarity on the British mini-budget appears necessary to keep buyers on the table.
- Risk-negative headlines and firmer expectations from US consumer-centric data can recall the cable bears.
GBP/USD seesaws near 1.1330 as bulls await fresh catalysts to extend the biggest daily jump in two weeks. In doing so, the Cable pair pauses the two-day uptrend around the weekly top.
A slight clarity on the UK government’s mini-budget, as well as the US dollar’s broad declines, could be linked to the quote’s latest run-up. On the same line were the hopes of the Bank of England’s (BOE) hawkish move.
On Thursday, UK Finance Minister Kwasi Kwarteng told BBC that he is focused on delivering on the mini-budget to get growth going again. On the same line, Prime Minister Liz Truss’ office also confirmed no more U-turns from the mini-budget. It’s worth noting that UK Chancellor Kwarteng’s surprise cancellation of the speech and passing the buck on the BOE if the British markets collapse might have also offered indirect support to the GBP/USD prices.
That said, the quote rallied the most in a fortnight despite the 40-year high print of the US Core Consumer Price Index (CPI). On Thursday, the US CPI rose to 8.2% versus 8.1% market forecasts but eased as compared to the 8.3% prior. The CPI ex Food & Energy, mostly known as the Core CPI, jumped to 6.6% while crossing the 6.5% expectations and 6.3% previous readings.
It’s worth noting that the money markets’ wagers on the 75 bps Fed rate hike and a jump in Wall Street seemed to also have played their role in fueling the GBP/USD prices.
Moving on, the risk catalysts are likely to direct immediate GBP/USD moves as there are more challenges to the latest run-up. Among them are the hawkish Fed bets, fears of UK markets’ collapse and the fresh covid fears.
However, major attention will be given to the US Retail Sales for September, the preliminary readings of the Michigan Consumer Sentiment Index (CSI) and the University of Michigan’s (UoM) 5-year Consumer Inflation Expectations for October.
Also read: US Retail Sales Preview: Positive surprises eyed for dollar bulls to regain poise
Technical analysis
Despite crossing the 21-DMA hurdle, now immediate support around 1.1160, a monthly resistance line, close to 1.1390 by the press time, challenges the GBP/USD buyers.
-
23:27
EU Economy Commissioner Gentiloni: EU inflation connected to energy prices – BBG TV
“EU inflation connected to energy prices,” Said European Union (EU) Economics Affairs Commissioner Paolo Gentiloni during the Bloomberg (BBG) TV appearance.
More to come
-
23:12
EUR/USD Price Analysis: Oscillates around the 20-day EMA eyeing Friday’s US economic data
- EUR/USD marches firmly towards 0.9800 on broad US dollar weakness, following a hot US inflation report.
- EUR/USD’s failure to crack the 200-EMA in the hourly chart could send the pair diving towards 0.9700; otherwise, expect a test of 0.9900.
The EUR/USD rallied on Thursday, though it faced solid resistance around the 20-day EMA at 0.9788, and finished the session with gains of 0.76% after hitting a daily low of 0.9631. As the Asian Pacific session begins, the EUR/USD is trading at 0.9772, below its opening price, by a minimal 0.02%.
EUR/USD Price Forecast
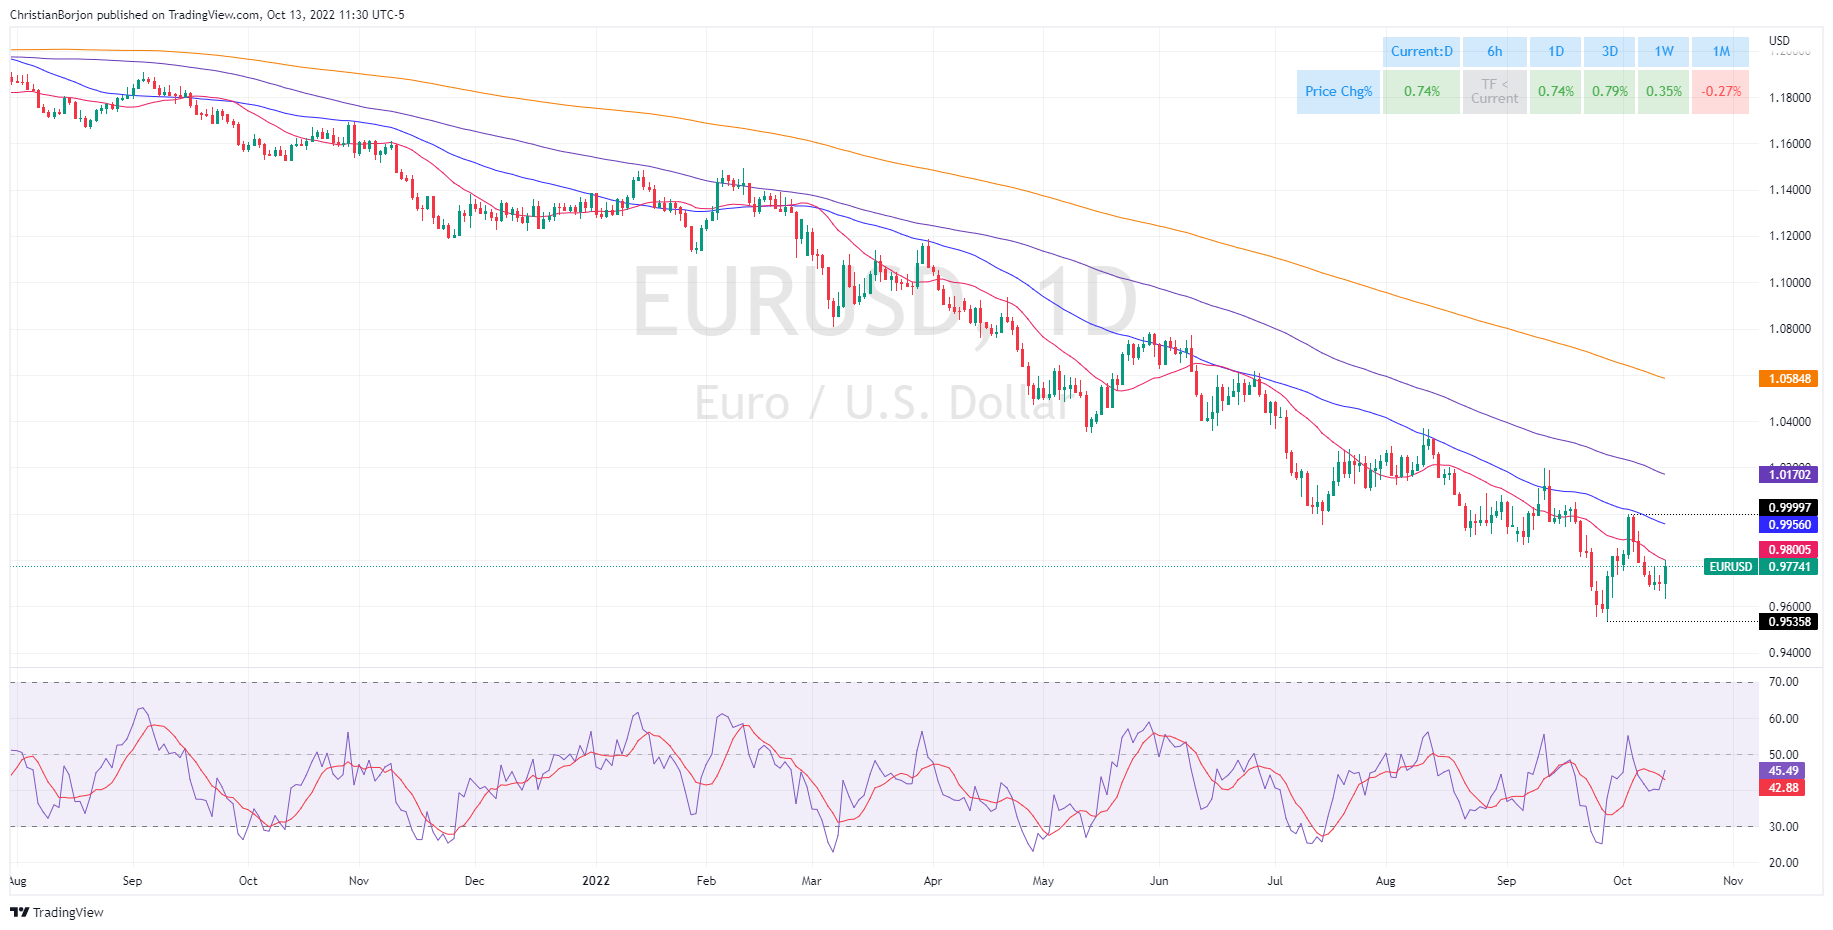
The EUR/USD technical side depicts the major as downward biased. Since the end of February 2022, the EUR/USD dropped below the 20-day EMA, a dynamic resistance level that traders have been using. Even though the EUR/USD had spans trading above it, most of the time price stalled at the 20-day EMA and retraced to lower price levels. So failure to crack it could open the door for further losses. Therefore, the EUR/USD first support would be the October 13 low of 0.9631, followed by the 0.9600 figure, ahead of the YTD low at 0.9538.
Short term, the one-hour time frame depicts the EUR/USD bias as neutral. Of note, the major tested the 200-EMA during the day, but it could not surpass it. Hence, based on price action, the EUR/USD might consolidate around the 0.9774-0.9800 area, though failure to break the top of the range could pave the way for further losses.
Once the EUR/USD breaks 0.9800, key resistance levels lie at the R1 daily pivot at 0.9840, followed by the 0.9900 figure ahead of parity.
On the other hand, the EUR/USD first support would be the daily pivot point at 0.9740, followed by the confluence of the 50/100-EMAs around d0.9715/16, ahead of 0.9700.
Also read: EUR/USD makes a U-turn, climbing to daily highs nearby 0.9800 after hot US inflation
EUR/USD Key Technical Levels
-
23:09
Gold Price Analysis: XAU/USD bulls are moving on for the kill
- Gold bulls move in as the US dollar gives back ground.
- The risk rally has weighed the greenback into the final day of the week and earnings that are due.
Gold ended on Wall Street at around $1,670 and down by over 0.5% on the day in the face of sky-high inflation in the US and on a global scale. XAU/USD travelled between a low of $1642.46 from a high of $1,682.49. However, it was a two-way street for the most part following a suspicious move in the yen that caught the market off guard and subsequently, led to further bizarre price action across asset classes.
The yen strengthened vs.s the dollar by over 100 pips in a matter of a minute in trade following the release of the US Consumer Price Index that firmed the grounds for further strong rate hikes from the Federal Reserve. Wall Street stock indexes made a dramatic recovery as well, closing sharply higher after an earlier sell-off on Thursday while the US dollar gave up the knee-jerk gains. Instead, investors poured back into riskier bets after digesting a red-hot US inflation reading that fueled bets for a big Federal Reserve rate hike next month. The S&P 500 closed the session up 2.6% after declining 5.7% in the previous six sessions. Earlier Thursday it fell 2.3% to its lowest level since Nov. 2020.
US CPI buries Fed pivot sentiment
First off, US inflation eased less than expected in September to 8.2%, and underlying prices excluding energy and food prices accelerated to a new four-decade high.
- US CPI (MoM) Sep: 0.4% (est 0.2%; prev 0.1%).
- US CPI (Y0Y) Sep: 8.2% (est 8.1%; prev 8.3%).
- US CPI Core (M0M) Sep: 0.6% (est 0.2%; prev 0.6%).
- US CPI Core (Y0Y) Sep: 6.6% (est 6.5%; prev 6.3%).
Core CPI gained at its highest annual pace in 40 years, rising 0.6% for the month and 6.6% for the year and Fed funds futures are now pricing in 75 bps in December, up from 50. Moreover, terminal rate expectations rose to 4.85% in March. As a consequence, the 10-year Treasury yield rallied to 4.080% while the 2-year yield was up to 4.535%. As measured by the DXY index, the US dollar dropped by 1% to almost 112.14 as risk sentiment returned to markets. At the time of writing, the DXY index is down by some 0.73% having fallen from a high of 113.92 to a low of 112.147 so far.
Looking forward, the big question is; ''is the risk rally logical, or is it just a short squeeze or a dead cat bounce?''
''It seems the market is embracing aggressive monetary policy and focus is likely to shift to the consequences of such tightening,'' analysts at ANZ Bank argued.
Gold technical analysis

The price is carving out a W-formation that could lead to a move higher for the day ahead, certainly if the US dollar continues to bleed out. The price has already made a 61.8% retracement and is holding near to there while in demand territory.
-
22:39
New Zealand Business NZ PMI came in at 52 below forecasts (52.5) in September
-
22:17
AUD/USD Price Analysis: Bulls have moved in, can they stay the course?
- AUD/USD has found a bid on the back of a sell-off in the US dollar.
- Bulls eye a breakout of 0.6330 recent peak formation highs.
The price has formed a peak formation in the aftermath of the US inflation data which leaves the focus on the upside for the day ahead and on the US Retail Sales data for Friday in the US session. A less-than-encouraging number could be problematic for the US dollar as speculators investors seek out short-term gains elsewhere.
AUD/USD H1 chart
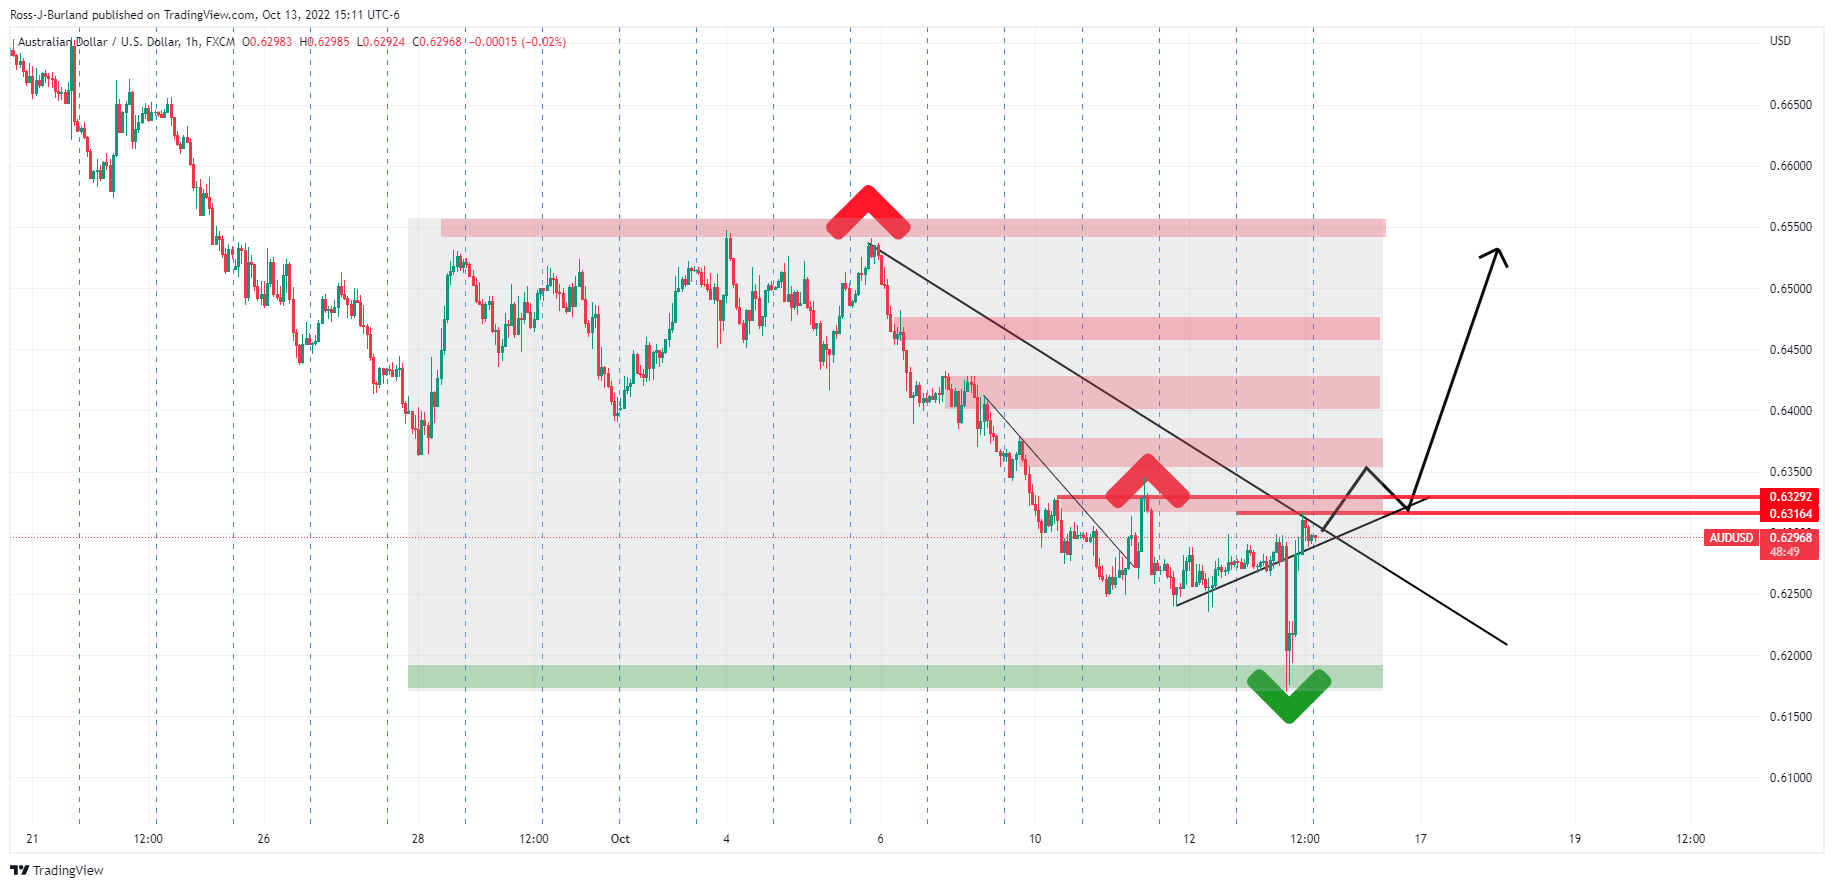
With that being said, the Aussie is high beta to the US stocks markets so it too could struggle in the face of weak data. Nevertheless, the bulls will be back in control on a break of 0.6350 which is above the October 11 peak formation around 0.6330. Beyond 0.6350, the bulls will be eying a move back to 0.6400, 0.6500 and then 0.6550.
-
22:00
South Korea Export Price Growth (YoY) above expectations (8.4%) in September: Actual (15.2%)
-
22:00
South Korea Import Price Growth (YoY) above expectations (20.8%) in September: Actual (24.1%)
-
21:49
AUD/JPY jumps from the 200-DMA, rallies above 92.50 following hot US CPI
- AUD/JPY advances on a risk-on impulse, despite high US inflation.
- Wednesday’s BoJ’s Kuroda dovish commentary weighed on the JPY.
- AUD/JPY’s fall capped at the 200-day EMA at 90.75, from which the pair rallied to 92.83, the day’s high.
The AUD/JPY extends its gains on Thursdays, following the release of US economic data, which initially weighed on most G8 currencies but the greenback, but a risk-on impulse, propelled risk-perceived currencies, namely the Australian dollar. Therefore, the AUD/JPY is trading at 92.68, above its opening price by 0.56%,
US equity indices are set to finish the session with more than 2% gains each. Earlier, US inflation data was reported, with headline CPI rising by 8.2% YoY, less than estimates. The so-called core CPI, which excludes volatile items, surprisingly jumped more than the 6.5% expected YoY, up by 6.6%. Therefore, market participants had priced in a ¾ percent Federal Reserve rate hike at November’s meeting.
The AUD/JPY dived on the news release but bounced off the lows, under 91.00, and staged a comeback above 92.50, a 150 pip rally.
Aside from this, the lack of Aussie economic data leaves AUD/JPY traders leaning on market sentiment dynamics, which favored the AUD/JPY upside. Earlier in the month, the Reserve Bank of Australia decided to raise rates by 25 bps when markets were expecting a 50 bps increase, perceived by a dovish hike, with market participants flying away from the AUD, seeking return.
On the Japanese front, Bank of Japan Governor Haruhiko Kuroda said that one-side moves in the yen driven by speculation are bad for the economy. Kuroda noted “Yen depreciation may have a good impact on the macroeconomy as a whole, but there are some sectors which are suffering.”
Furthermore, Kuroda commented that the BoJ would continue its monetary easing program to achieve the inflation 2% target in a stable and sustained manner.
All that said, the RBA’s dovish hike, and BoJ’s dovish stance, would likely bolster the AUD/JPY. So traders should expect further AUD appreciation after achieving the bearish-flag pattern target, opening the door for further gains.
Next, the Japanese economic calendar will feature M2 Money Supply, while the Aussie’s docket is empty. AUD/JPY traders should also be aware of China’s calendar, which will feature PPI, CPI, and its Trade Balance.
Also read: AUD/JPY Price Analysis: Retraces from around 92.30s on dampened mood
AUD/JPY Key Technical Levels
-
21:07
Forex Today: Dramatic U-turn after US inflation misses expectations
What you need to take care of on Friday, October 14:
US inflation put market players on their toes on Thursday and was behind some wild, volatile moves.
According to the official release, the US Consumer Price Index was up by 8.2% YoY in September, above the 8.1% expected, although easing for a third consecutive month. The core annual inflation, on the other hand, reached a fresh multi-year high of 6.6%. The initial reaction to the news was negative. Wall Street plummeted, yields soared, and the dollar surged. However, markets changed course after the opening bell, and the greenback ended the day with losses against most major rivals.
Fed swaps fully price a 75 bps rate hike in November and a peak policy rate of 4.85% in March 2023. Pretty much the same picture that we had before the release, partially explaining equities comeback. No news was seen as good news after second thoughts.
Additionally, there was again noise coming from the UK. Rumors and back and forth about the United Kingdom’s mini-budget ended, favoring the Pound demand and adding pressure on the American currency. Speculative interest now believes there won’t be tax cuts, while there were market talks pointing out exactly the opposite. Chancellor of the Exchequer, Kwasi Kwarteng, was expected to make an announcement, but he ended up saying there would be more details on the budget on October 31.
On a down note, things between Russia and Ukraine are going no better. Russia said Ukraine's accession to NATO could ignite a third-world war. Also, coronavirus-related restrictions in Shanghai, China, fueled fears of another massive lockdown in the region. Meanwhile, German Health Minister Karl Lauterbach calls for the reintroduction of mask mandates, citing a "sharp increase" in covid cases.
EUR/USD trades around 0.9770, while GBP/USD holds on to substantial gains around 1.1315. Commodity-linked currencies plummeted ahead of Wall Street’s opening but managed to post gains against the dollar. AUD/USD hovers around 0.6300 while USD/CAD is down to 1.3740.
USD/JPY reached a fresh multi-decade high of 147.66. Investors fear a potential BOJ intervention after the pair resumed its advance.
Gold finished the day in the red, despite off its intraday low, now trading around $1,663 a troy ounce. Crude oil prices were up, with WTI now changing hands at around $89 a barrel.
Wall Street was extremely volatile. The Dow Jones Industrial Average added roughly 850 points after trading over 500 points in the red ahead of the US inflation release. The S&P 500 and the Nasdaq Composite added over 2% each.
The Asian session will bring Chinese inflation and trade data, which could affect the market’s sentiment. Later on Friday, the US will publish US Retail Sales.
Top 3 Price Prediction Bitcoin, Ethereum, Ripple: The beginning of a crypto winter
Like this article? Help us with some feedback by answering this survey:
Rate this content -
21:01
NZD/USD's recovery from 0.5515 low stalls below 0.5655
- The Kiwi retraces previous losses before hitting resistance at 0.5655.
- The dollar loses ground as the impact of the US CPI report wanes.
- NZD/USD: Below 0.5700 more weakness is likely – UOB.
The New Zealand dollar has bounced strongly from session lows near 0.5500 retracing all the ground lost after the release of the US CPI report. The pair turned positive on the daily chart before hitting resistance at the 1.5655 area.
The kiwi picks up with the USD pulling back from highs
The greenback has lost ground through the US trading session, as the market digested the unexpectedly high US inflation figures released in September’s CPI report.
According to the US Bureau of Labor Statistics, consumer inflation accelerated at a 0.4% pace in September, and 8.3% year-on-year, beating expectations of 0.4% and 8,1% respectively. These figures boosted hopes of a 100 basis point hike in November and pushed the US dollar higher across the board.
In New Zealand, the focus is on the release of September’s Business NZ PMI due later today. Business activity is expected to decelerate to 52.5 from 54.9 the month before, probably as a result of the hawkish turn of the Reserve Bank of New Zealand.
NZD/USD could weaken further while below 0.5700 – UOB
According to FX analysts a UOB, however, the pair remains skewed to the downside while below 0.5700: “Despite dropping to a fresh year’s low of 0.5561 earlier this week, downward momentum is not strong. However, as long as the ‘strong resistance’ at 0.5700 is not breached, NZD could weaken further. That said, any further decline is expected to face solid support at 0.5535.”
Technical levels to watch
-
21:00
US dollar bears pile in despite red hot inflation, eyes on 110.00 as the box breaks down
- The US dollar is in the hands of the bears despite US CPI data.
- The market is moving out of a speculative US dollar position.
As measured by the DXY index, the US dollar has been a mixed bag on Thursday, initially rallying on the back of the red-hot US inflation data only to fall into the hands of the bears, dropping by 1% to almost 112.14 as risk sentiment returned to markets. At the time of writing, the DXY index is down by some 0.66% having fallen from a high of 113.92 to a low of 112.147 so far.
Hot US CPI burns Fed pivot sentiment
First off, US inflation eased less than expected in September to 8.2%, and underlying prices excluding energy and food prices accelerated to a new four-decade high.
- US CPI (MoM) Sep: 0.4% (est 0.2%; prev 0.1%).
- US CPI (Y0Y) Sep: 8.2% (est 8.1%; prev 8.3%).
- US CPI Core (M0M) Sep: 0.6% (est 0.2%; prev 0.6%).
- US CPI Core (Y0Y) Sep: 6.6% (est 6.5%; prev 6.3%).
Core CPI gained at its highest annual pace in 40 years, rising 0.6% for the month and 6.6% for the year and Fed funds futures are now pricing in 75 bps in December, up from 50. Moreover, terminal rate expectations rose to 4.85% in March. As a consequence, the 10-year Treasury yield rallied to 4.080% while the 2-year yield was up to 4.535%.
Following the CPI report, the DXY index shot higher to 113.92 but dropped sharply shortly after as the US stock market regained ground. Nevertheless, sky-high inflation shows no signs of easing and investors are now pricing in 91% odds of a fourth straight 75-basis-point hike by the Fed at its meeting next month, with some also pricing in a 9% chance of a 100 bps rise. The possibility of a 100 basis points increase in November has also reared its head, though it's currently seen as unlikely, with only a 9% probability. The bottom line, there are no chances of a near-term dovish pivot from the Fed.
However, some price discovery made its way onto Wall Street with no sellers left as the benchmarks danced around a 50% retracement of the March 2020 bull market. Investors are turning their attention to the third-quarter earnings at the end of the week. At 3.33 p.m. ET, the Dow Jones Industrial Average was up 880 points, or 3.00%, at 30,090 and had recovered from the low of the day down at 28,660.94. The 10-year Treasury yield is still up 1.44% but below the 4.080 highs, around 3.952% and the DXY sags down 0.69% on the day.
US dollar technical analysis
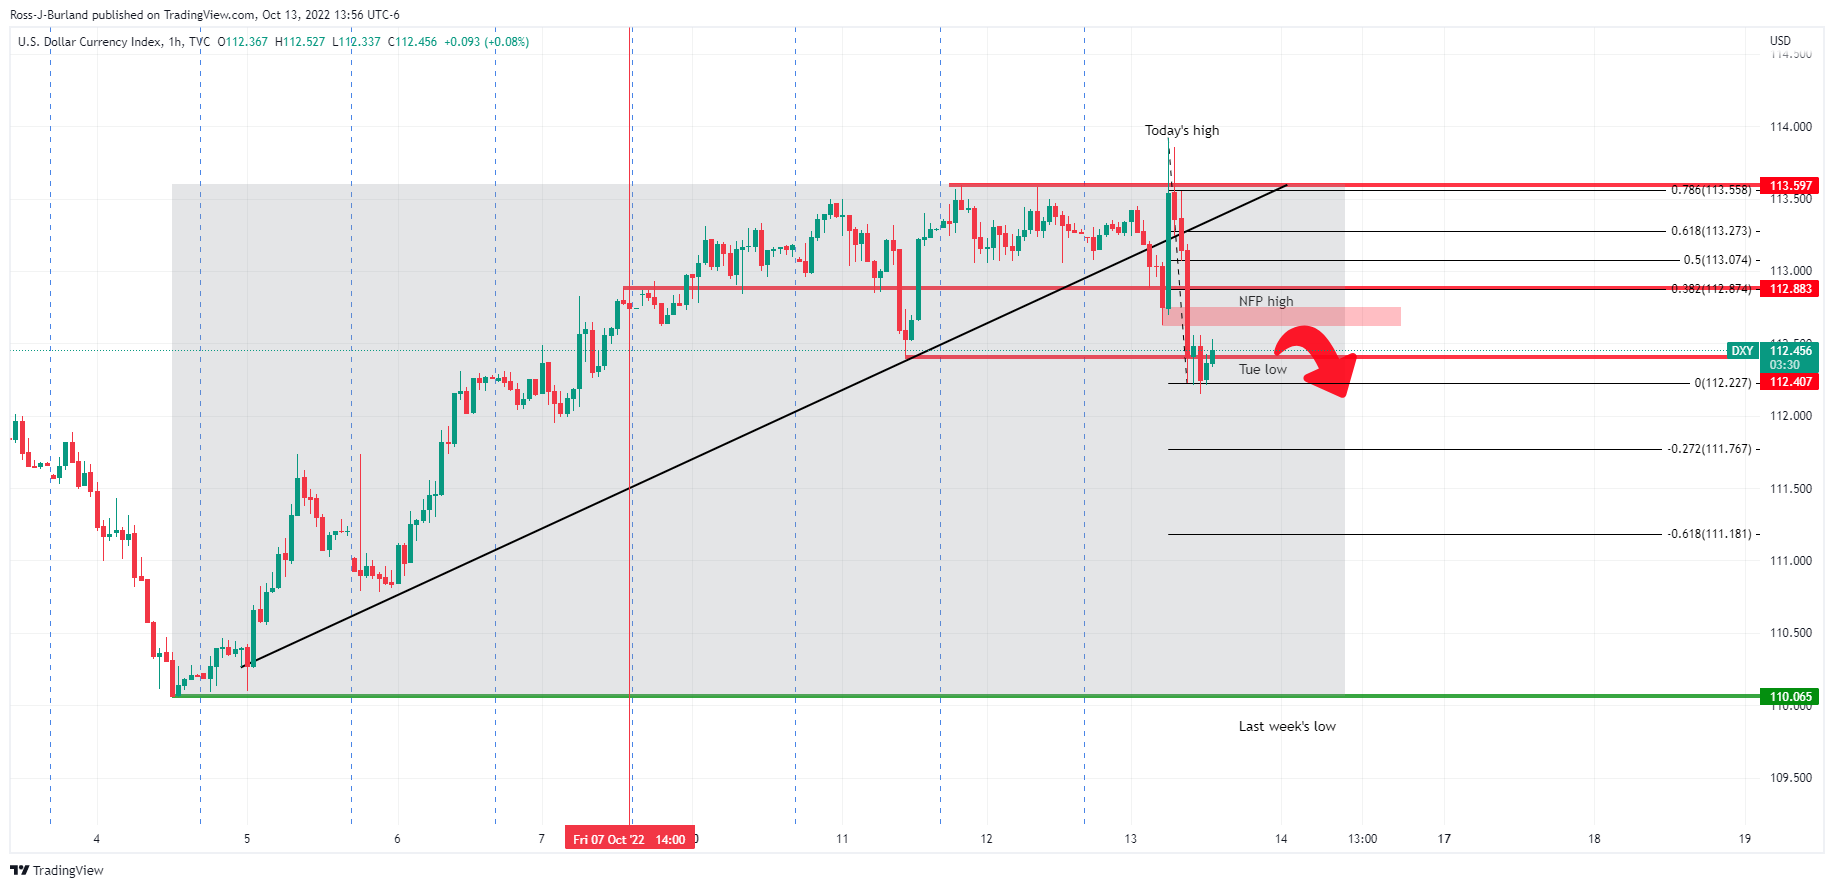
The price is now making a technical case for the downside in a sell-the-fact scenario. The bears are pressing below Tuesday's low, Nonfarm Payroll's high, and trendline support. While below 112.50, there is plenty of space to go until last week's low near 110 the figure.
-
20:07
EUR/JPY Price Analysis: Testing key resistance at 144.00
- EUR/JPY has reached an important resistance area at 144.00.
- The daily chart shows a bullish triangle formation.
The euro appreciates on Thursday for the third consecutive day to retrace last week’s reversal and return to a key resistance area at 144.00, which is being tested at the time of writing.
The pair lies right now at the point where bulls were capped in early October, September 20, and also on June 20, 22, 23, and 28. That resistance line and the bullish trendline support from early August lows are forming an upward triangle pattern.
Furthermore, the 50 and the 10-day moving averages are featuring a bullish crossover, while the RSI shows some room before hitting overbought levels.
This might encourage bulls to break above the mentioned 144.00, aiming for September 12 high at 145.65 ahead of the 2014 high of 149.65.
On the downside, immediate support lies at 140.85 (October 10 low) ahead of trendline support at 140.35. Once below here, bears might take over, pushing the pair towards September lows at 137.30.
EUR/JPY daily chart

Technical levels to watch
-
19:38
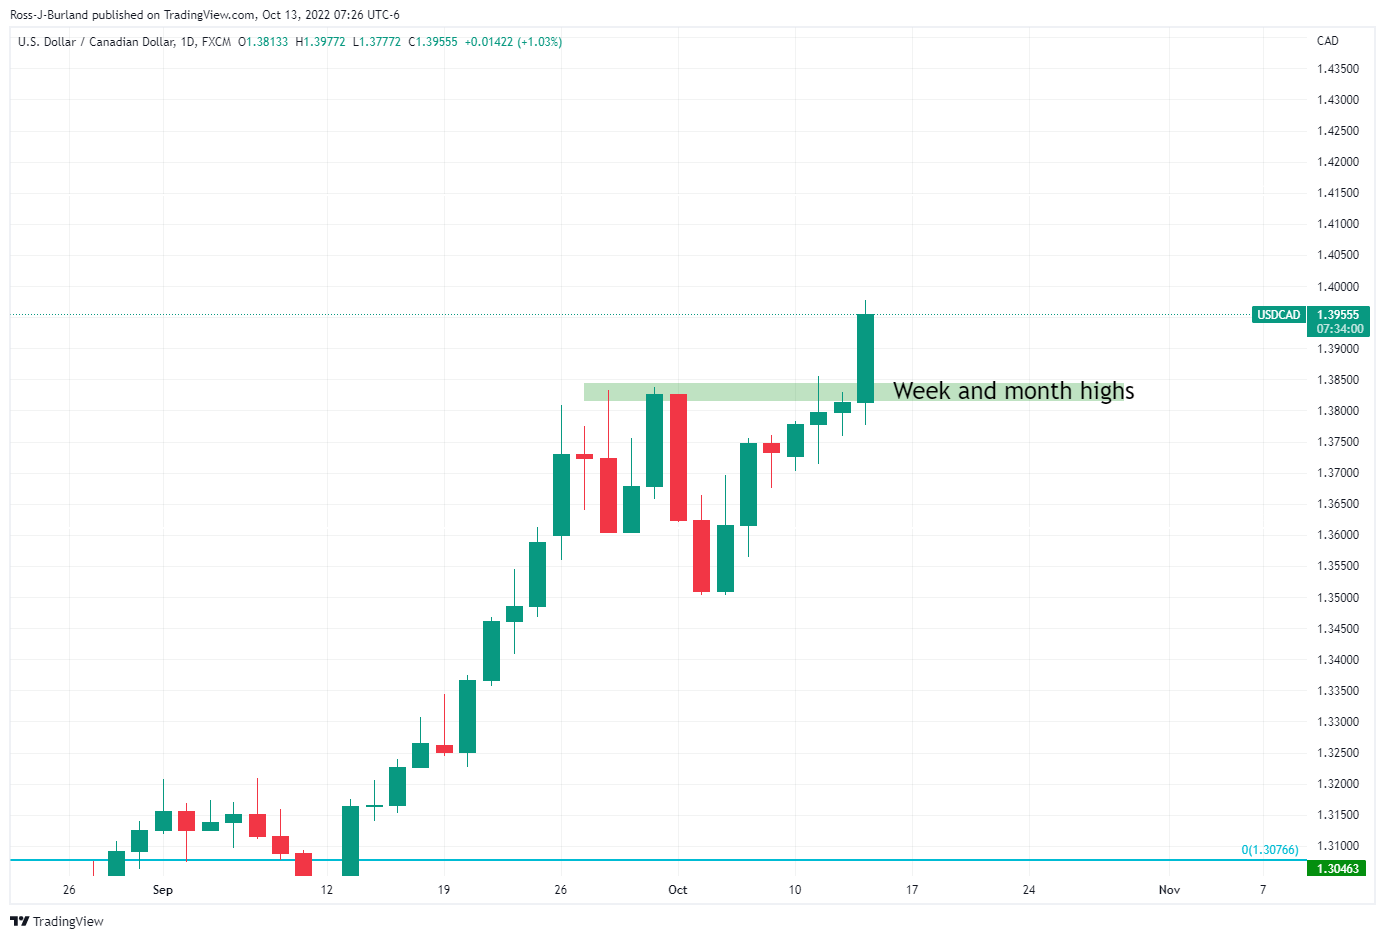
USD/CAD Price Analysis: Bears eye 1.3500 key week low
- USD/CAD bears are moving in and eye a run to last week's lows.
- The current 15-min chart's M-formation could be key in this regard.
USD/CAD bears are back in the driver's seat as the market is a wash with US dollar longs that are being squeezed despite the red-hot US inflation data on Thursday. A resurgence in the oil price is also benefitting the loonie in late afternoon trade on Wall Street which has flipped risk-on. The following is a top-down analysis that arrives at a bearish thesis for the days ahead while below last week's highs of near 1.3850.
USD/CAD weekly chart
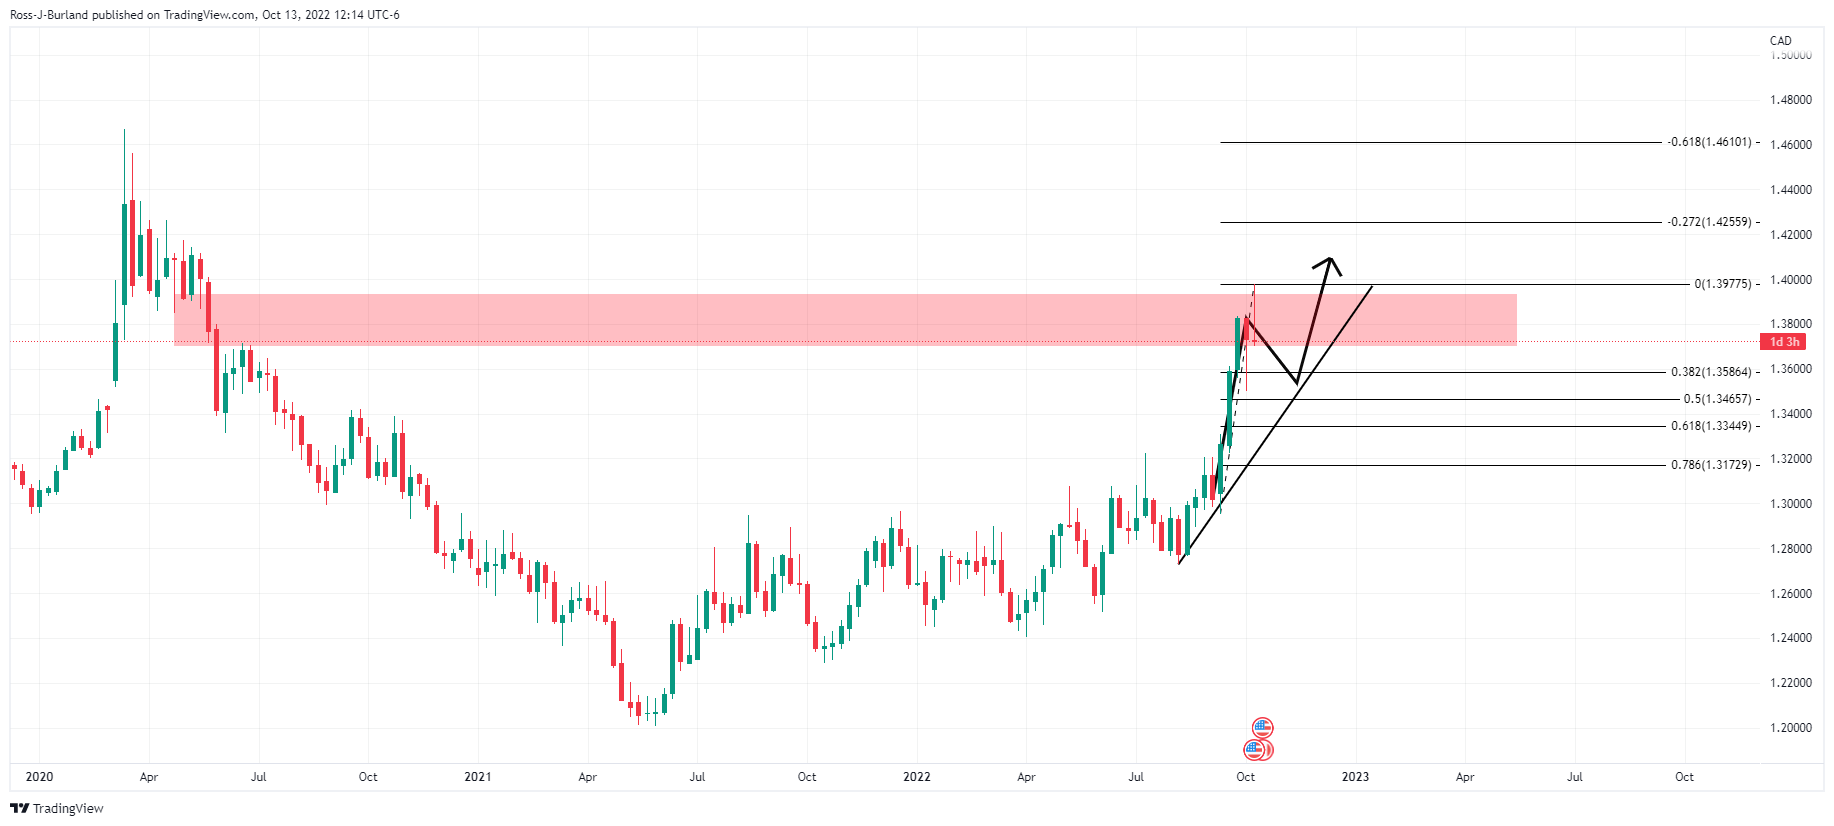
The price has reached a weekly resistance area and a correction could be on the cards for the meantime before the next move up.
USDCAD daily chart
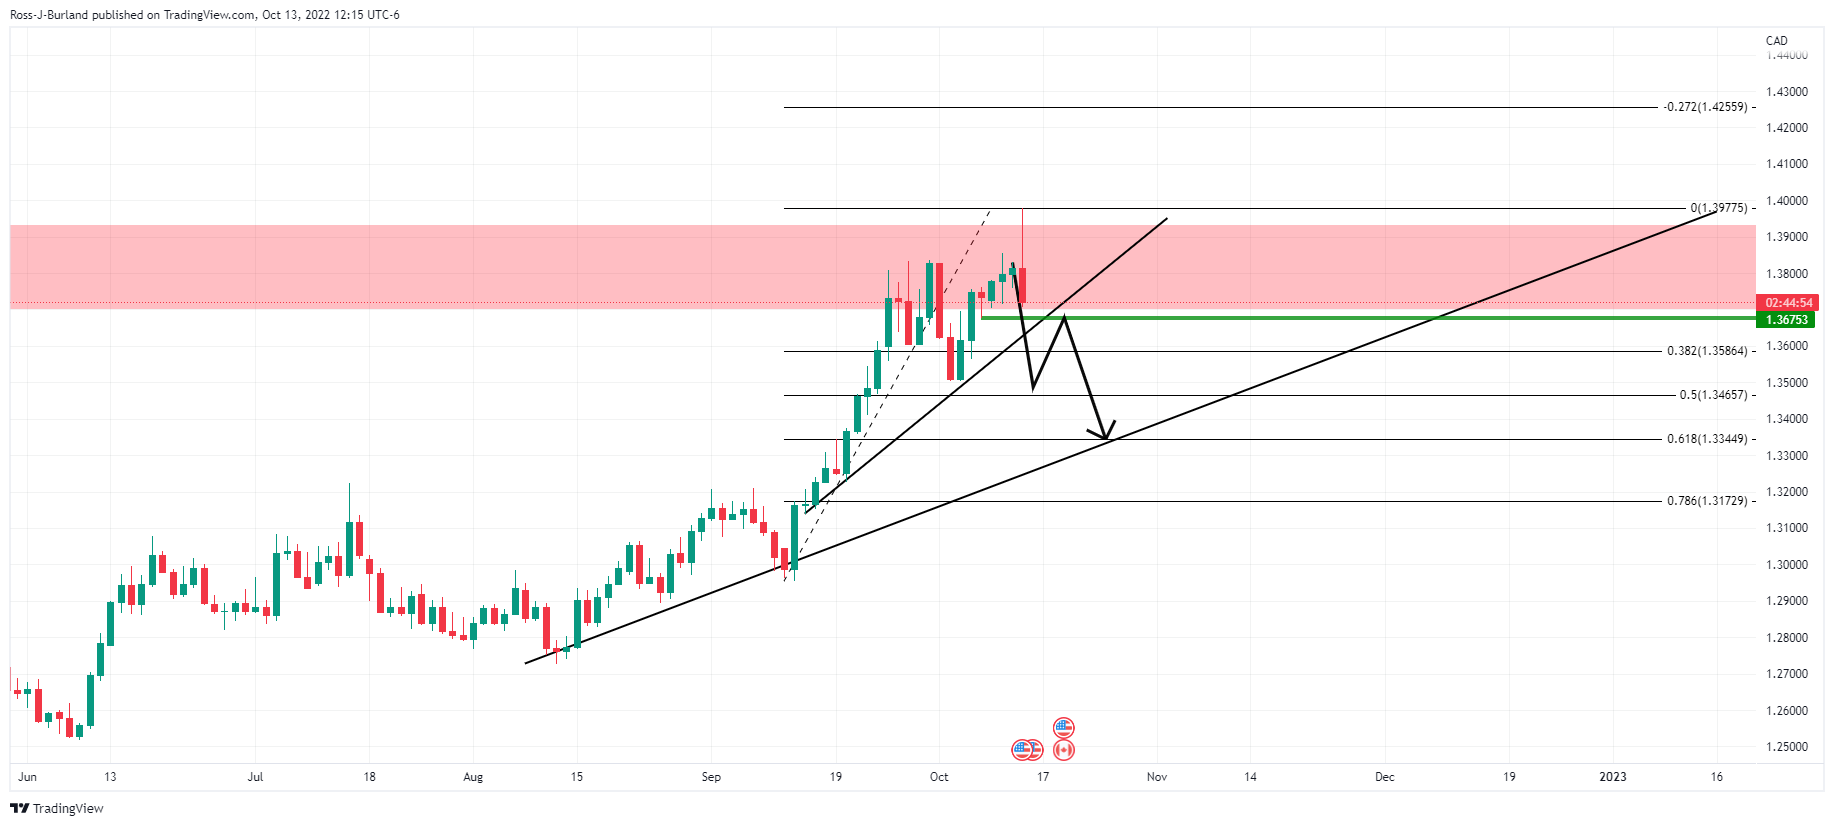
The daily chart is also encouraging bears to the table, having spiked and pinned out on the day so far. The bears, however, need to get below the horizontal and trendline support around 1.3680.
USD/CAD H1 chart
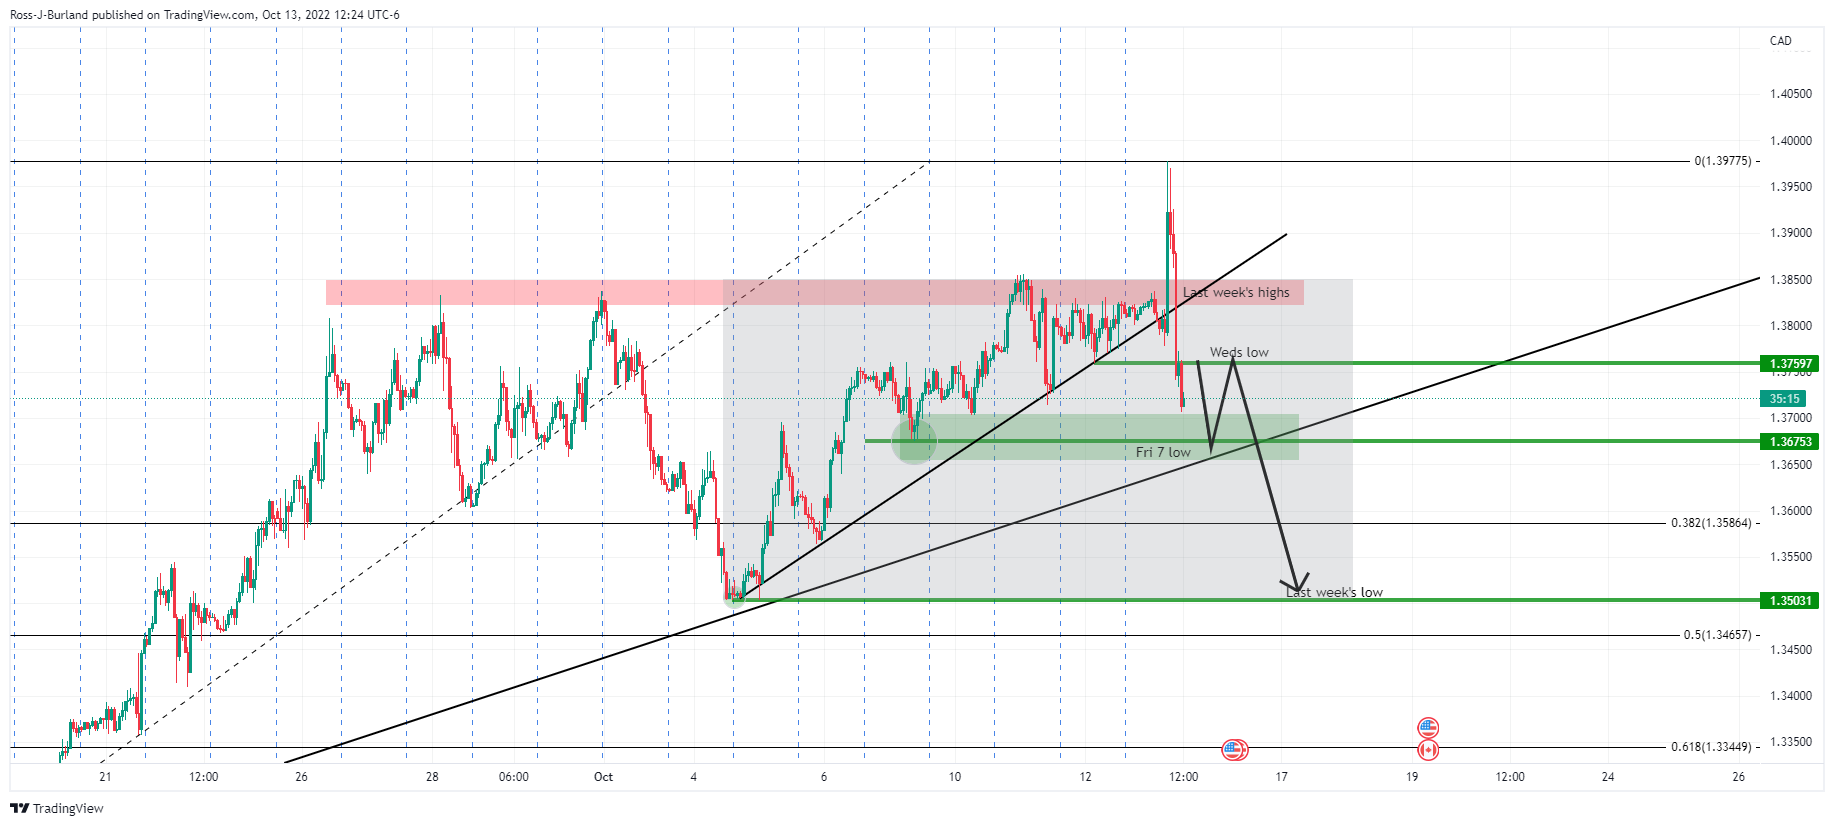
The hourly chart shows the price at the upper end of a box. Therefore, the path of least resistance is to the downside at this juncture with the market having peaked out on Thursday's CPI rally. The highs and lows of the significant days are plotted on the chart and the break of Friday 7 low will be a significant development.
USD/CAD M15 chart
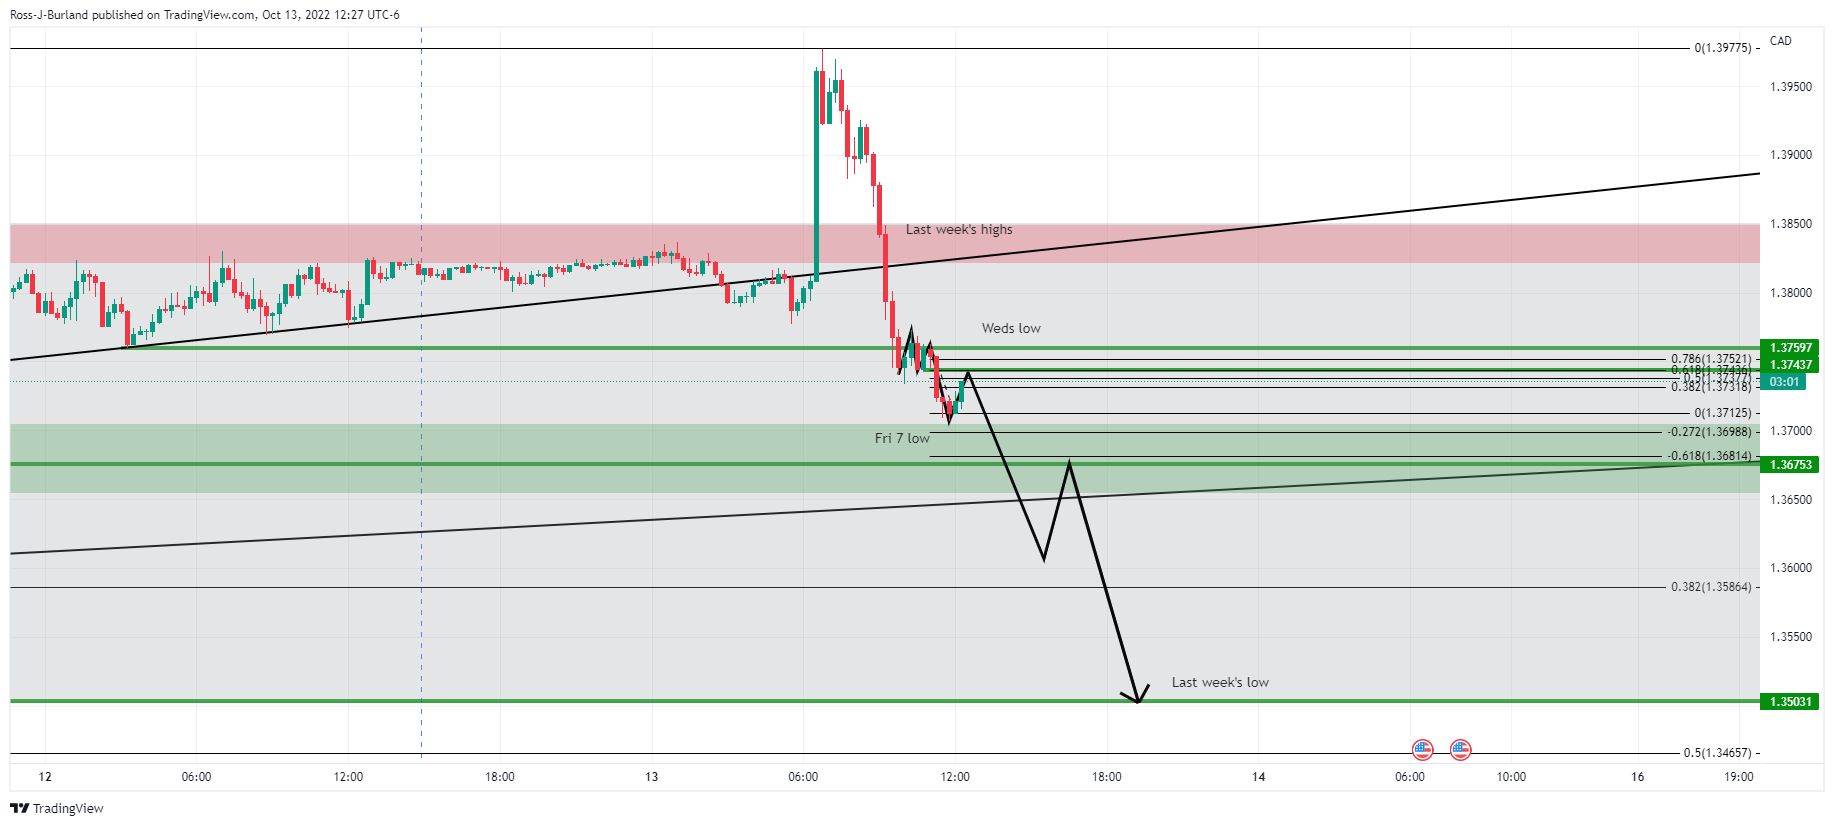
The price has carved out a 15-minute M-formation and should the price hold below it on a restest, followed preferably by a bearish engulfment of the current bullish correction, then the bears will be on track for further downside before the week is out.
-
19:33
GBP/JPY Price Analysis: Soars more than 300 pips, eyeing 168.00
- GBP/JPY advances sharply, more than 2.20%, hitting a fresh one-month high, though the rally stalled.
- The GBP/JPY is upward biased but might dip to 164.80, as the pair is overbought, as shown by the hourly chart RSI.
The GBP/JPY rallies sharply in the North American session as a risk-on impulse keeps US equities extending their gains after tumbling on a high US inflation report. Also, rumors of a possible U-turn on the UK’s tax-cut budget presented in September keep the British pound buoyant. At the time of writing, the GBP/JPY is trading at 166.56.
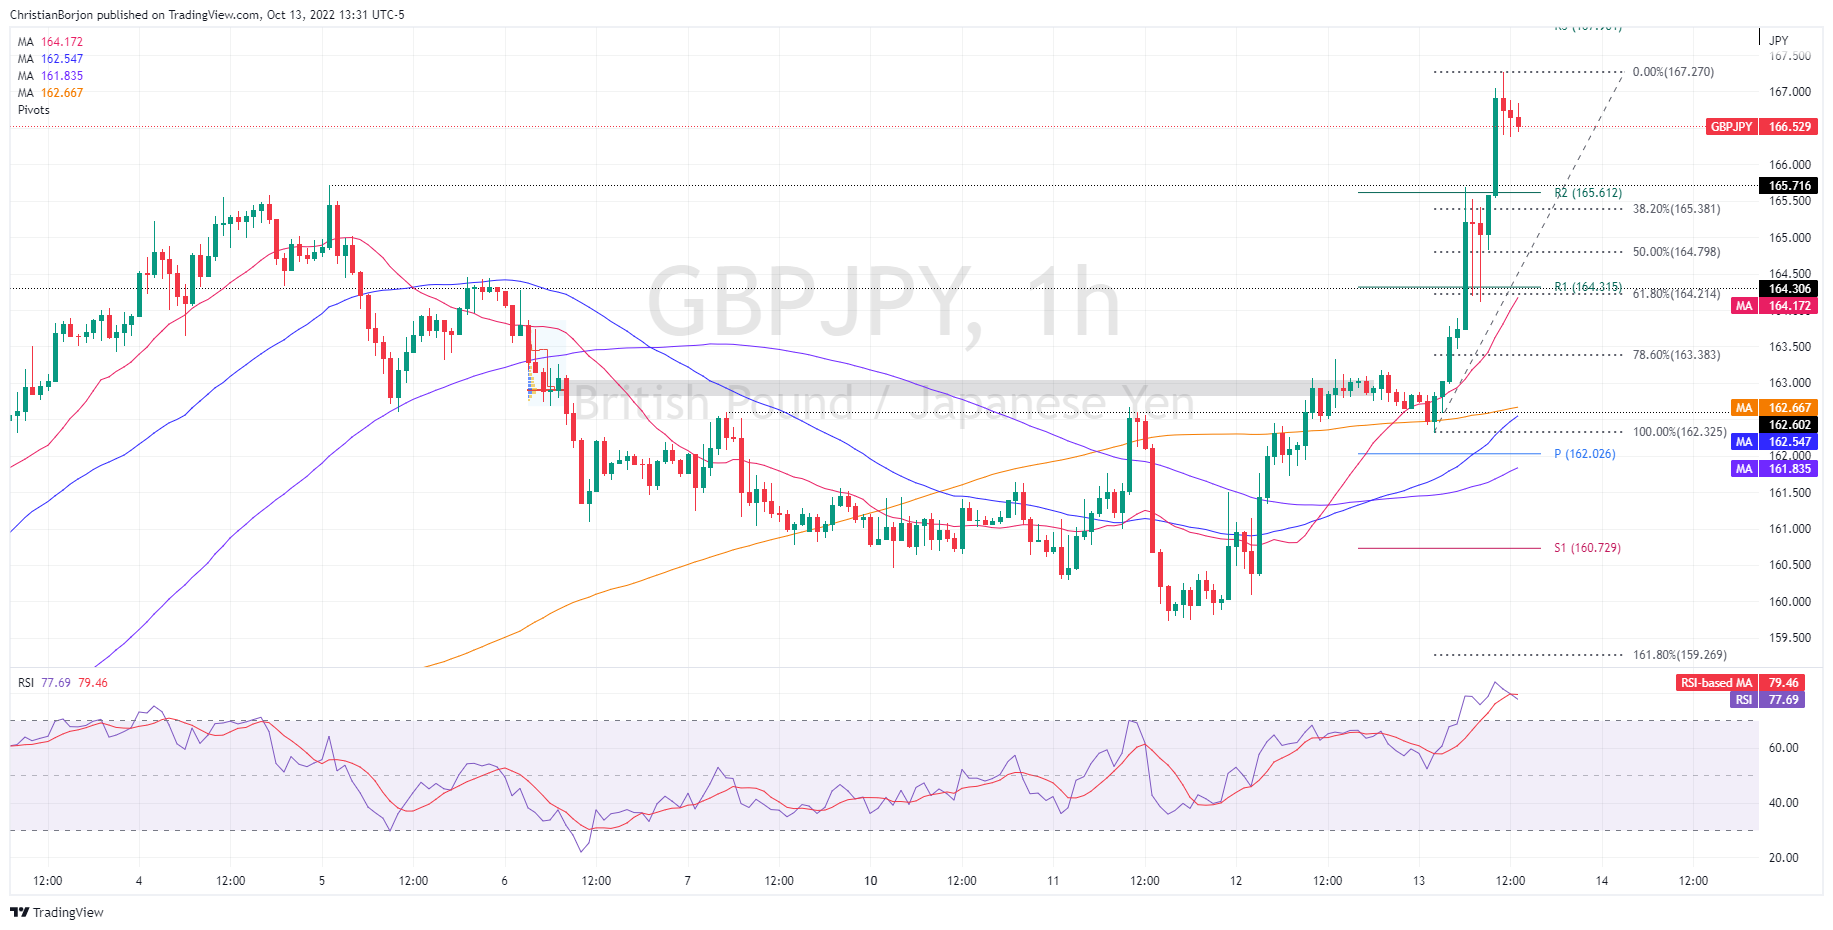
GBP/JPY Price Forecast
The GBP/JPY reached a new October high of 167.27 after the pair cleared the 100-day EMA of 163.17 while also clearing 165.71, last week’s high, exacerbating a rally above the 167.00 figure. Nevertheless, the uptrend lost steam as European traders got off their desks. Despite the sharp 300 pip rally, the Relative Strength Index (RSI) is in positive territory, suggesting buyers are getting a respite before challenging 167.94, September’s high.
The GBP/JPY one-hour chart shows the price is overextended, as the Relative Strength Index (RSI) is overbought. Therefore, the pullback from daily highs opens the door for an extended mean reversion move before resuming the uptrend.
Hence, the GBP/JPY first support would be the confluence of a 38.2% Fibonacci retracement and the R2 pivot around 165.38/61, followed by the 50% Fibonacci level at 164.79. A break below will expose the intersection of the 20-EMA and the R1 daily pivot around 164.21/31, from which the cross-currency could rally to challenge 167.94.
GBP/JPY Key Technical Levels
-
19:13
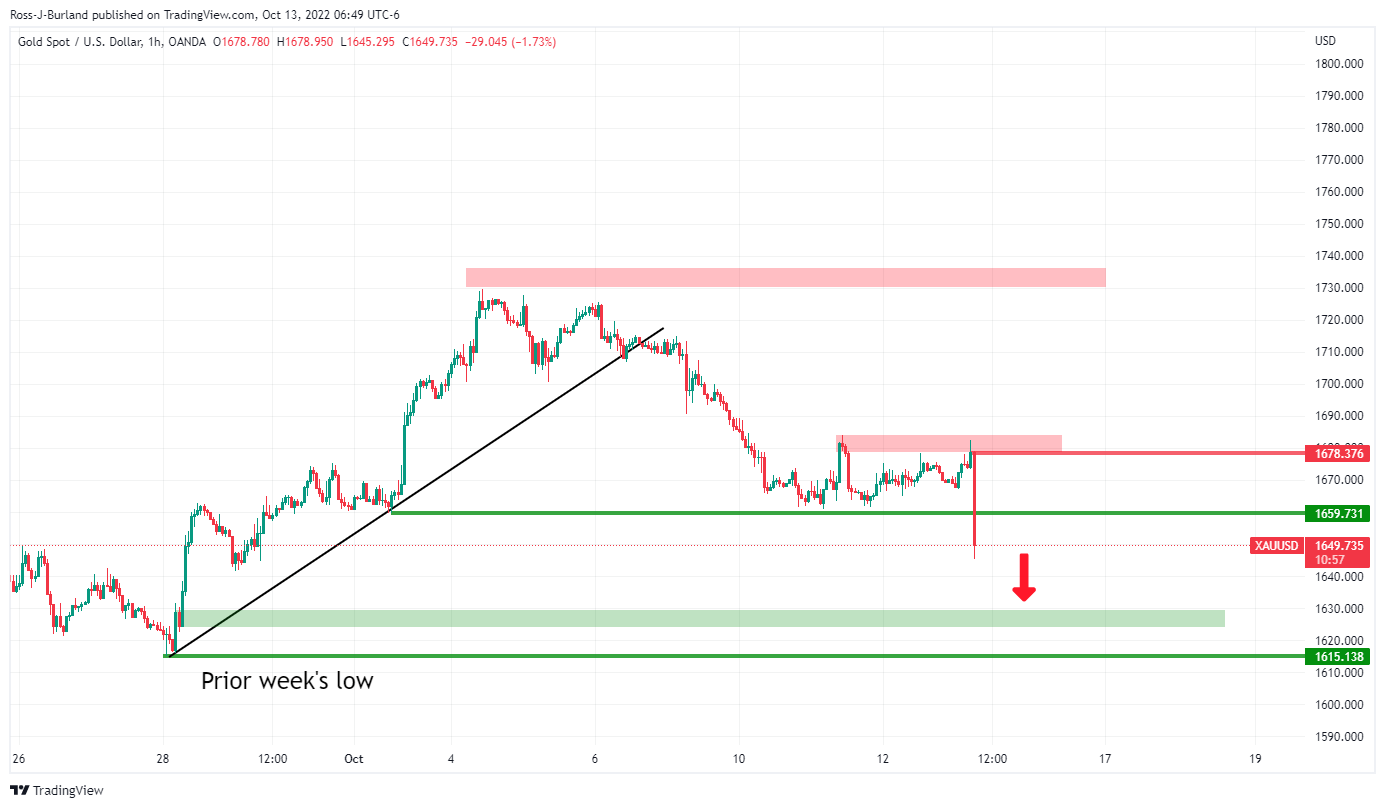
Gold Price Forecast: XAU/USD picks up from lows and returns above $1,670
- Gold bounces up from $1,642 lows and returns to the $1,670 area.
- The US dollar pulls back after the post-CPI rally.
- XAU/USD remains weak, capped below $1.680.
Gold futures are retracing previous losses during Thursday’s US trading session, favored by a broad-based USD pullback. The yellow metal has bottomed at a two-week low of $1,642 before returning to 4 1,670 at the time of writing.
The dollar gives away gains after a post-CPI rally
The greenback is losing ground after the bullish reaction triggered by the release of US CPI data. Consumer prices increased at a 0.4% pace in September, beating expectations of a 0.2% rise, which boosted hopes of a 100 basis point rate hike by the Federal Reserve in November.
Federal Fund Futures priced in a 13% chance that the Federal Reserve could accelerate its hiking pace at the next month’s meeting. The Dollar Index (DXY) rushed higher, to hit a session high right below 114.00, nearing the recent 20-year high of 114.70.
The US dollar seems to have lost steam, as the market confronts the data with the slight dovish tilt observed in September’s FOMC minutes released on Wednesday.
XAU/USD: Upside attempts remain capped below $1,685
The precious metal has reversed losses on Thursday, yet, the near-term bias remains negative, with the pair capped below October 11 high at $1,685. A confirmation above that level might increase bullish momentum, to advance towards $1,730 (September 12 high), ahead of early August highs right above $1,800.
On the downside, initial support lies at $1,650/60 (mid-September lows), and below here, October 3 low at $1,612 and then probably April 2020 low at $1,575.
Technical levels to watch
-
18:46
US stocks are whipsawed around US CPI, benchmarks firmly back in the green
- US stocks rebound in midday trade despite the US CPI print.
- Bulls have stepped in at a bargain on Wall Street.
US stocks are roaring back into positive territory, putting on a short squeeze following the pre-market and opening sell-off that ensued on the back of red-hot Consumer Price Index data. Stocks plunged to lows for the year but bulls moved in at a big discount, sending the Dow Jones and S&P 500 higher by as much as 2% at one point.
Red hot US CPI
Trading was dominated by the release of consumer price figures:
- US CPI (MoM) Sep: 0.4% (est 0.2%; prev 0.1%).
- US CPI (Y0Y) Sep: 8.2% (est 8.1%; prev 8.3%).
- US CPI Core (M0M) Sep: 0.6% (est 0.2%; prev 0.6%).
- US CPI Core (Y0Y) Sep: 6.6% (est 6.5%; prev 6.3%).
Core CPI gained at its highest annual pace in 40 years, rising 0.6% for the month and 6.6% for the year and Fed funds futures are now pricing in 75 bps in December, up from 50. Moreover, terminal rate expectations rose to 4.85% in March. As a consequence, the 10-year Treasury yield rallied to 4.080% while the 2-year yield was up to 4.535%.
The report follows data on Wednesday that showed US producer prices increased more than expected in September and combined with CPI, traders in the money markets are pricing in a near 91% odds of a fourth straight 75-basis-point hike by the Fed at its meeting next month, with some also pricing in a 9% chance of a 100 bps rise.
Nevertheless, some price discovery is coming into the markets ahead of the third-quarter earnings at the end o the week while the indexes trail along the bottom of a 50% correction of the March 2020 rally. At 1.33 p.m. ET, the Dow Jones Industrial Average was up 851 points, or 2.93%, at 30,062 and had recovered from the low of the day down at 28,660.94. The S&P 500 was up 93.80 points to 2.62% while the Nasdaq Composite was up 253 points, or 2.34%%, at 11,037.
S&P 500 weekly chart
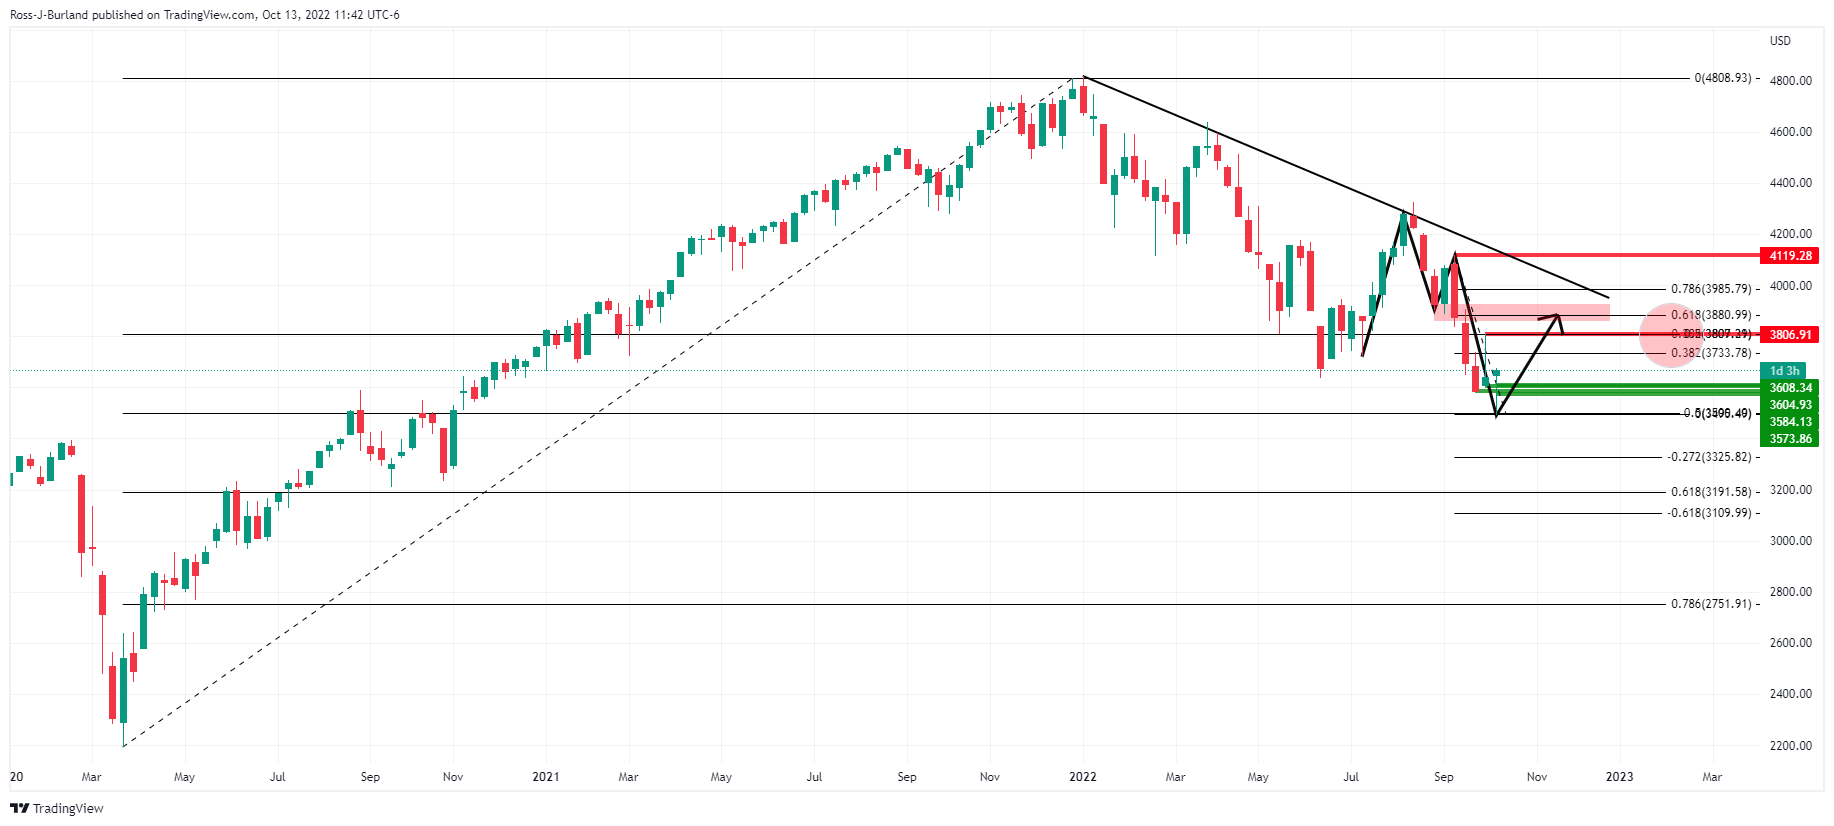
At a 50% mark of the March 2020 bull market, the index is carving out an M-formation that would be respected to see the market move in on the neckline with a 50% mean reversion falling in at the month's highs so far near 3,806.
-
18:45
USD/JPY Price Analysis: Retraces from 24-year highs around 147.60s on soft US dollar
- USD/JPY reached a fresh 24-year high at around 147.67 due to US inflation numbers.
- Once the dust settled down, the greenback weakened, so the USD/JPY traded back below 147.00.
The USD/JPY is paring its gains below the 147.00 figure after registering fresh 24-year highs courtesy of US inflation data, sparking a jump in US Treasury yields, as expectations for further Fed tightening increase, with traders fully pricing a 0.75% hike on November. The USD/JPY is trading at 146.88, below its opening price by 0.02%.
On Thursday’s session, the USD/JPY surprisingly edged higher despite verbal interventions by Japanese authorities. In the Asian session, Japanese Finance Minister Shunichi Suzuki commented that he’s worried about recent forex volatility involving the JPY while saying that authorities are focused on FX volatility rather than the USD/JPY exchange rate.
Therefore, USD/JPY traders perceived that as a green light, so the pair surrendered the 147.00 figure.
USD/JPY Price Forecast
The USD/JPY daily chart confirms the pair as upward biased, though price action is beginning to flash signs that it’s overextending. The major printed a daily high at around May 1998 high of 147.67, but the USD/JPY retraced towards current exchange rates on worries of another intervention in the FX markets. USD/JPY traders should know that a break above 147.67 would open the door toward 150.00.
The USD/JPY, one-hour time frame, suggests the pair tested the R1 daily pivot at 147.38 four times, while the Relative Strength Index (RSI) printed a lower high, suggesting that a negative-divergence formed, sending the USD/JPY sliding from the daily high of 147.62 to the 20-EMA at 146.93. That means that as the exchange rate rose, sellers were gathering momentum.
Additionally, the RSI is accelerating toward crossing the central line, further cementing the case for a correction. Therefore, the USD/JPY first support would be the confluence of the 50-EMA and the daily pivot at around 146.49/57. Break below will expose the confluence of the 100-EMA and the S1 daily pivot point at 146.01/06, followed by a fall to the 200-EMA at 145.35.

USD/JPY Key Technical Levels
-
18:24
GBP/USD’s rally from 1.1050 finds resistance right below 1.1400
- The pound hits resistance at 1.1400 after a 300-pip rally.
- News of a U-turn on the UK fiscal plan boost the cable.
- GBP/USD seen between 1.00 and 1.10 over the coming months – UBS.
The pound seems to be taking a breather as the impressive 300-pip rally from the 1.1060 area has found sellers at 1.1380 before pulling back to the lower range of 1.1300. The pound remains positive on daily charts after having appreciated beyond 3% over the last two days.
Hopes of a U-turn on the UK fiscal plan have boosted the pound
News reporting that the UK Government might be discussing increasing corporation tax next year, thus reversing the mini-Budget that roiled markets last month has been welcomed by investors.
Furthermore, the Financial Times reported on Wednesday that the Bank of England might have agreed privately with lenders on the possibility of extending bond purchases beyond Friday, the day announced as the deadline for the emergency plan. This has contributed to ease negative pressure on the cable.
In this backdrop, the market has overlooked the gloomy macroeconomic data released on Wednesday. National statistics data revealed that UK economy contracted at a 0.3% pace in September, against expectations of a flat performance, on the back of a 1.6% slump in Manufacturing production.
GBP/USD seen between 1.00 and 1.10 in the coming months – UBS
From a wider perspective, FX analysts at UBS see the pair capped below 1.10 over the next months: “With markets still concerned about the viability of the government’s fiscal plans, we think the pound will likely remain volatile, trading in a range of 1.00-1.10 against the US dollar over the coming months (…) Worries over the financial stability of the UK is also feeding into broader market risk aversion – which is also positive for the US dollar.”
Technical levels to watch
-
18:02
United States 30-Year Bond Auction climbed from previous 3.511% to 3.93%
-
17:40
AUD/USD regains lost ground an returns to levels near 0.6300
- The aussie bounces up from six-month lows at 0.6170 and returns to 0.6300.
- The US dollar losses ground as the effect of US CPI data ebbs.
- AUD/USD might depreciate below 0.6000 – ING.
The Australian dollar is going through a sharp recovery during Thursday’s US session erasing loses from earlier on the day. The pair has bounced from six-month lows at 0,6170, returning to levels right below 0.6300 and turning positive on the day.
The US dollar retreats from highs
The Aussie pares losses with the US dollar losing ground as the effect of the US inflation report start to settle. Investors might be coming to terms with the idea that a 100 BP rate hike in November is rather unlikely, especially after the moderately dovish tone of September’s FOMC minutes.
According to the US CPI data, prices accelerated at a 0.4% pace in September, well beyond expectations of a 0.2% increase, with the year inflation surging 8.2% higher. These figures triggered hopes that the Federal Reserve could increase borrowing costs at a more aggressive pace in November.
Federal Fund Futures have priced in a 13% chance of a 100 basis points rate hike immediately after the data release and the US dollar surged across the board. The US Dollar Index (DXY) appreciated to a fresh-24-year high at 114.70 to pull down to the 112.00 area at the moment of writing.
AUD/USD might extend losses below 0.6000 – ING
On a longer-term perspective, currency analysts at ING, observe see the Aussie likely to extend its decline to levels below 0.6000: “We remain bearish on AUD/USD into year-end, as risk sentiment fragility, China’s economic (and currency) woes and a strong USD (…). A break below 0.60 this year is entirely possible.”
Technical levels to watch
-
17:31
EUR/USD makes a U-turn, climbing to daily highs nearby 0.9800 after hot US inflation
- EUR/USD dived to a daily low of 0.9631 as a reaction to US inflation, but stages of recovery.
- US core CPI reached a 40-year high at 6.6% YoY, as Fed odds for further tightening increase.
- US jobless claims were higher-than-estimated, flashing signs of the labor market easing.
The EUR/USD is recovering from earlier losses as inflation in the United States rose above estimates, continuing to test Fed members’ patience. Core CPI in the US jumped to a four-decade high, exceeding forecasts, cementing the case for further Fed tightening at November’s meeting. Hence, the EUR/USD is trading at 0.9775, after sliding to 0.9631 daily low, as traders reacted to US data.
US equities are trading in the green as sentiment shifted positively. The US Department of Labor reported that inflation in the US, mainly core CPI, jumped more than estimated by 6.6% YoY, topping August 6.3%. Contrarily, headline inflation edged lower from the previous month’s 8.3% to 8.2%, almost 1% lower than June’s 2022 peak.
The knee-jerk reaction sent the EUR/USD tumbling to its daily low and the S1 daily pivot, but of late, as investors’ mood changed, the shared currency is trading with solid gains of 0.81%.
At the same time, US jobs data was released. Unemployment claims for the past week ending on October 8 rose by 228K, higher than the 225K foreseen by street’s analyst, though US inflation figures overshadowed data.
Elsewhere, money market futures are repricing odds for the Fed’s next move. The CME FedWatch Tool portrays a 99% chance that the Fed will lift rates 75 bps in November and a 62.3% chance of a ¾ of a percent move for the year’s last meeting.
On the EU’s side, the Bundesbank and Belgium’s central bank chiefs, Joachim Nagel and Piere Wunsch, prompted the ECB for more interest rate hikes due to high inflation levels in the Eurozone. During the European session, German inflation figures rose as expected but persisted at high levels, as shown by HICP at 10.9%, while German CPI remained at 10%.
What to watch
The Eurozone economic calendar will feature inflation readings for France, and Spain, alongside the EU’s Trade Balance. On the US front, US Retail Sales, UoM Consumer Sentiment, and further Fed speakers will offer fresh impetus for EUR/USD traders.
EUR/USD Price Forecast
The EUR/USD daily chart shows the pair remains as downward biased, trading below the DMAs. At the time of typing, the exchange rate is testing the 20-day EMA, which, if cleared, could send the EUR/USD toward the 50-day EMA at 0.9956. Nevertheless, it should be noted that unless buyers break above the October 4 daily high at 0.9997, the downtrend is intact; otherwise, it would shift the bias to neutral downwards, opening the door for a test of the 100-day EMA at 1.0170.
-
17:27
US September CPI likely locks another 75 bps rate hike at next FOMC meeting – Wells Fargo
US inflation data released on Thursday triggered sharp moves across financial markets. According to analysts at Wells Fargo, today's report likely locks the Federal Reserve into another 75 basis points rate hike at its next meeting in November. They point out that past November, they are confident that inflation should move discernibly lower in the coming months.
Key Quotes:
“The Consumer Price Index rose 0.4% in September, once again coming in above consensus expectations and demonstrating that inflation continues to bear formidable momentum. Excluding food and energy prices, core CPI inflation rose 0.6% in September and 6.6% over the past year—a fresh cycle high. Lower gasoline prices once again put downward pressure on inflation.”
“Gradually slowing inflation as well as increasingly tight monetary policy should give the FOMC the breathing room it needs to slow the pace of tightening from its current 75 bps per meeting trajectory. However, there are likely to be some bumps along the way that keep the Fed's guard up over the next few months.”
“Lower gasoline prices have been a powerful balm on inflation this summer, but in recent weeks gas prices have again headed higher in a still-fraught geopolitical environment. Moreover, with core CPI running at a 6.0% annualized pace the past three months, there remains a long way to go before the trend in inflation reaches a pace the Fed can live with.”
-
17:15
USD/CAD retreats more than 200 pips from two-year highs
- US dollar reverses sharply across the board, DXY turns negative.
- US CPI comes in above expectations, triggering volatility.
- USD/CAD sharp reversal, if sustainable, could suggest a top.
The USD/CAD jumped dramatically after US CPI data and then pulled back even with more drama, falling almost 250 pips from the peak. The pair hit the highest level in two years near 1.4000 and as of writing, it is hovering around 1.3750.
Reversal all around
The US September Consumer Price Index came in above expectations and triggered a decline in Wall Street, in Treasuries and a rally of the US dollar. All those moves have been reversed. The Dow Jones is up by 1.73% or 505 points, after a 900-point reversal.
The outcome of the US CPI warrants another 75 basis points rate hike from the Fed at the November meeting. Some analysts could even mention the odds of an even larger hike, but it seems unlikely. The news is that inflation is not pulling back in the US.
The reversal of the US dollar across the board could point to an interim top. In the case of USD/CAD, the move takes place after approaching the psychological 1.40 zone. If the pair manages to rise back above 1.3850 a test of 1.40 would be back on the cards.
On Friday, during the Asian session Chinese CPI data is due. Later, is the turn of US September Retail Sales and Canadian Manufacturing Sales.
Technical levels
-
16:51
EUR/GBP approaching 0.8600 as the pound surges on the UK tax U-turn
- The euro dips below 0.8700 to hit 5-week lows near 0.8600.
- Rumors of a U-turn on the UK tax plan boost the sterling.
- Longer-term, the pound will suffer on liquidity concerns – Danske Bank.
The euro is depreciating sharply against a stronger British pound on Thursday. The pair has extended its reversal from week lows near 0.8870 on Wednesday, to levels right above 0.8600, its lowest price since early September.
GBP rallies on rumours about a U-turn on the UK fiscal plan
Unfazed by the impact of the US inflation data, the pound is rallying against most majors, boosted by news that the UK Government might be discussing changes in the mini-Budget that roiled markets last month.
Furthermore, additional reports pointing out the possibility that the Bank of England might extend bond purchases beyond Friday, the day announced as the deadline of the emergency plan earlier this week, have contributed to easing pressure on the cable.
In absence of first-tier macroeconomic indicators in the UK or the Eurozone. The enthusiasm about the fiscal plan seems to have offset the potential negative impact of a series of downbeat UK data released on Wednesday.
According to National Statistics, the UK economy contracted at a 0.3% pace in September, against expectations of a flat reading and following a 0.2% increase over the previous month. Beyond that, manufacturing production slumped at a 1.6% pace also against expectations of a 0% reading.
EUR/GBP seen at 0.89 in the next three months – Danske Bank
Currency analysts at Dnske Bank are showing little confidence on the current GBP recovery as they see the pound suffering on liquidity concerns: “We forecast EUR/GBP at 0.89 in 3M as we expect to see fragile risk appetite, where liquidity concerns weigh on GBP. Further out, we remain cautiously optimistic that the cross will head lower as a global growth slowdown and the relative appeal of UK assets to investors are positive for GBP relative to EUR.”
-
16:32
United States 4-Week Bill Auction up to 3.25% from previous 2.92%
-
16:29
NZD/USD rebounds sharply from two-year lows as USD reverses
- US Dollar jumps after US CPI, loses momentum during last hours.
- US stocks recover after slide, turn positive.
- NZD/USD bottoms slightly above 0.5500, then rebounds sharply.
The NZD/USD tumbled in a few minutes from 0.5630 to 0.5510, reaching the lowest level since March 2020 following the release of US CPI data. Later the pair recovered ground rising back toward 0.5600.
Volatile hours
The greenback rose sharply immediately after the September US CPI that showed higher-than-expected readings. The Consumer Price Index rose 0.2% in September above the 0.1% of market consensus. The annual core rate hit a new decade high at 6.6%.
Those numbers triggered sharp moves that are still taking place. The dollar jumped as US yields soared to fresh multi-year highs. Later a rebound in equity prices in Wall Street weakened the dollar triggering a reversal that pushed NZD/USD back to 0.5600.
The NZD/USD could face resistance at 0.5620 before the daily high at 0.5635/40. If the pair rises above 0.5740 it would alleviate the bearish pressure. A slide back under 0.5760 would expose the recent lows again.
Technical levels
-
16:24
Silver Price Forecast: XAG/USD drops below $19.00 due to hot US CPI, US bond yields rising
- Silver prices tumble from $19.30s daily highs below $18.80.
- US core inflation expanded at a 40-year high, at 6.6% YoY.
- US October’s data so far justifies another 75 bps rate hike by the Fed.
Silver price tumbles below $19.00 on the news reported by the Department of Labor, revealing that inflation in the US remains stubbornly stickier, particularly core figures, surpassing the 6.5% threshold at 4-decade highs. At the time of writing, XAG/USD is trading at $18.81 a troy ounce, down by 1.40%.
XAG/USD tumbles after hot US CPI, as traders brace for further Fed rate hikes
US data revealed in the US showed that inflation per the headline and core measure persists at high levels, with core CPI exceeding estimates at 6.6% YoY, higher than August’s 6.3%, blamed principally on transportation services, medical care, and shelter. In the meantime, headline inflation, namely, the Consumer Price Index, expanded at an 8.2% pace YoY, less than the previous reading, almost 1% down from its peak on June 2022.
The market’s reaction immediately sought safety, propelling US Treasury bond yields higher, with 2s, and 5s, reaching 4.46% and 4.24%, respectively, as traders brace for another jumbo rate hike by the Fed at November’s meeting.
Similarly, the US 10-year benchmark note is yielding 3.98%, down from its 4.08% reached earlier on the release of hot US inflation. The US Dollar Index, a gauge of the buck’s value vs. a basket of peers, is pairing its earlier gains, down 0.03% at 113.169, after hitting a daily high of 113.920.
Elsewhere, US Initial Jobless Claims for the week ending on October 8 came at 228K, above the previous week’s reading, exceeding estimates of 225K. Even though it flashed that the labor market is easing, last week’s US Nonfarm Payrolls report showed the contrary.
Given the backdrop, Federal Reserve odds of a 75 bps rate hike are fully priced in, as shown by the CME FedWatch Tool, at 99%.
Therefore, XAG/USD would likely continue to extend its losses after hitting a daily high at $19.30, to collapse below $18.70, weighed by high US Treasury bond yields. Also, traders should take cues from real yields or use as a proxy, US Treasury Inflation-Protected Securities (TIPS), with the 10-year yielding as high as 1.757%, though stabilized, at the time of press, is around 1.658%.
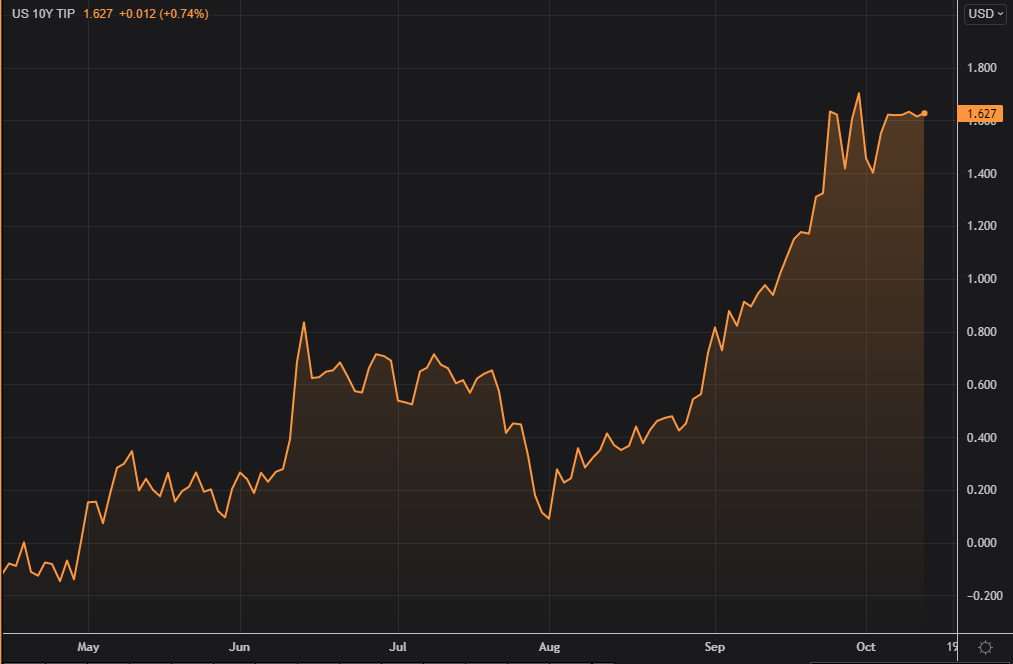
Source: ReutersNext in the US calendar, further Fed speaking is expected, with Atlanta’s Fed President Raphael Bostic being the first to cross wires, following the US inflation report. On Friday, US Retail Sales and the University of Michigan Consumer Sentiment will update the status of the US economy.
XAG/USD Key Technical Levels
-
16:00
United States EIA Crude Oil Stocks Change came in at 9.88M, above forecasts (1.75M) in October 7
-
15:59
US dollar still has room to rise, but the path will not be lineal – TDS
The US dollar remains best in class. That said, strategists at TD Securities reckon that the next phase of USD resilience will be less linear than it has been this year.
More bad news for the Federal Reserve
“With MoM core CPI showing no ebbing in momentum, the implication is pretty clear here: the Fed has to keep going at 75 bps increments and the USD remains best in class.”
“Until we see a few months of moderation in core MoM CPI, it is going to renege on USD resilience. We have stipulated that we will need at least 2-3 months of evidence of slowing momentum. This print pretty much confirms we will not see that this year and may be a Q1 story at the earliest.”
“There is no alternative to the USD, particularly as a G10-led, and in some cases a self-inflicted (like the UK), balance of payments crisis.”
“There has been speculation about whether USD strength will be too much. But until the stock of global FX reserves – which is a lot – runs down significantly (far from it), there is still runway before we should really be concerned. That said, the next leg up will be a bit more difficult to achieve given concern about market functioning.”
-
15:57
WTI pressured below short term bearish trendline in CPI induced risk-off markets
- WTI presses up against key resistance near $88.00.
- The bulls eye a break of trendline resistance and eye $90.00.
West Texas Intermediate, WTI is under pressure following a hot inflation report in the US that has sent markets into a tailspin. At the time of writing, WTI is down around 0.6% having fallen from a high of $88.02 to a low of $85.58.
Before the CPI print, the price of oil was already under pressure due to the International Energy Agency (IEA) that has warned last week's two-million-barrel-per-day production cut by OPEC+ threatened to tip the global economy into recession. The agency has it lowered its demand forecast for the remainder of this year and 2023. In its influential monthly Oil Market Report, the IEA said OPEC+ supply cuts "may prove the tipping point for a global economy already on the brink of recession."
Meanwhile, analysts at TD Securities have argued that, ''fundamentally, energy supply risks are rising, with an Iran deal off the table, Russian production starting to slump at a faster clip, the US SPR releases set to grind to a halt and EU sanctions on Russian crude coming to effect this December.''
''With diesel cracks at their highest levels in several decades and gasoline cracks soaring, demand has outperformed expectations. Chinese mobility as measured by our tracking of road traffic for the top 15 cities by vehicle registrations also suggests that Chinese demand is firming once more. The right tail in energy prices is still fat.''
US CPI comes in hotter
In the United States reported inflation rose at a higher-than-expected pace in September, with prices climbing by an annualized 8.2% last month, down from August's 8.3% rise but above the consensus analyst forecast for an 8.1% increase.
The data arrived as follows:
- US CPI (MoM) Sep: 0.4% (est 0.2%; prev 0.1%).
- US CPI (Y0Y) Sep: 8.2% (est 8.1%; prev 8.3%).
- US CPI Core (M0M) Sep: 0.6% (est 0.2%; prev 0.6%).
- US CPI Core (Y0Y) Sep: 6.6% (est 6.5%; prev 6.3%).
The report is likely to firm the Federal Reserve's hawkish monetary policy stance and lead to more interest-rate hikes as the central bank looks to slow the US economy, raising recession risks.
WTI technical analysis
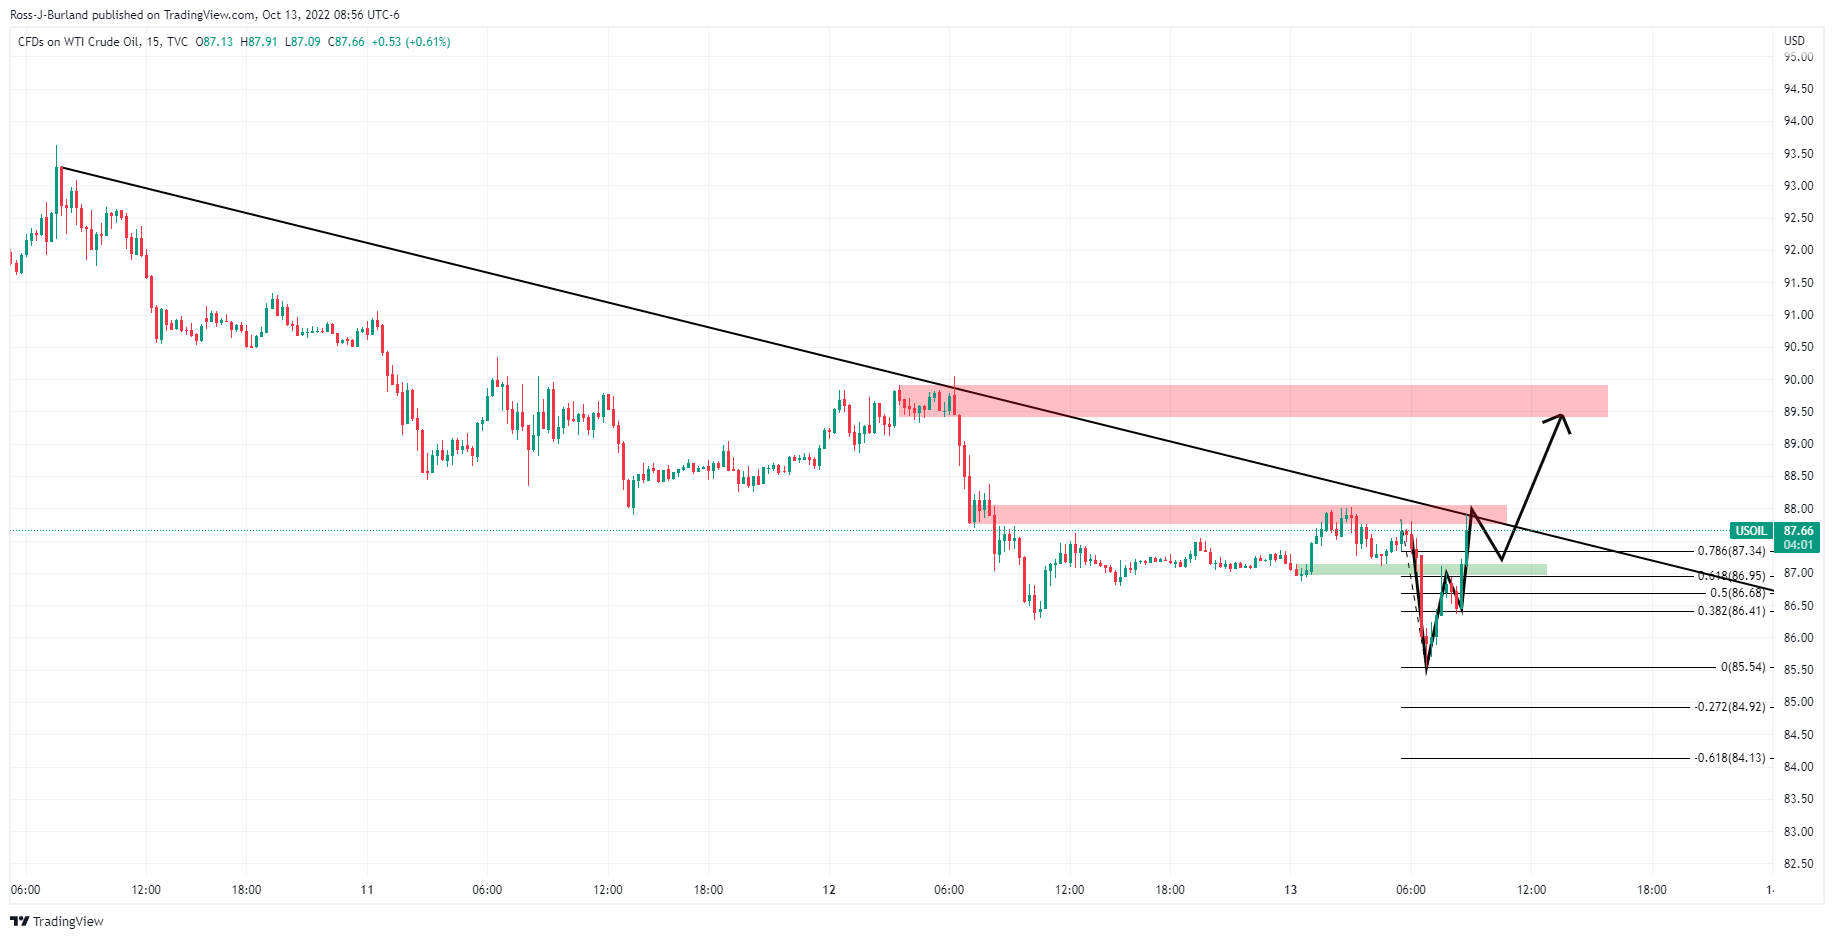
The price is trying to break the downside trendline leaving a W-formation behind which is a bearish formation on a downtrend, but it could lead to a bullish breakout if the bulls commit to support, as highlighted in the above chart with eyes on $90.00bbls.
-
15:54
BoE accepts 1.5460 billion GBP of offers in daily long-dated gilt purchase
The Bank of England (BoE) accepted 1.5460 billion sterling of offers in the daily purchase operation of conventional long-dated gilts, compared to 2.3754 billion sterling on Wednesday, Reuters reported on Thursday.
The BoE rejected 297.2 million sterling of offers in the same operation.
Market reaction
The British pound continues to outperform its major rivals following this outcome. As of writing, the GBP/USD pair was trading at 1.1230, where it was up 1.2% on a daily basis. Meanwhile, the 2-year UK gilt yield was last seen losing 4.65% on the day at 3.82%.
-
15:46
USD/CAD could easily surpass the 1.40 level – TDS
The outlook for the loonie is bleak. USD/CAD rallied to 1.3977 after hotter-than-expected US inflation data and could break above the 1.40 mark, economists at TD Securities report.
Dips into 1.3800/50 are a buy
“Even if the next phase of USD strength is not as linear as it has been for much of this year, there is a lot of negative idiosyncratic risk coming the CAD's way with the debt servicing problem for households only in the early days.”
“While we have forecast 1.40 into year-end, it is no ceiling and it could very easily get worse for the CAD.”
“Dips into 1.3800/50 are a buy.”
-
15:37
US inflation still elevated, Fed to continue to raise interest rates sharply – Commerzbank
US inflation was again higher than expected in September. Further significant rate hikes are thus virtually certain, in the opinion of economists at Commerzbank.
Inflation data seal big rate hikes
“Today's figures confirm the Fed top officials' fear that inflation is more stubborn than previously expected. Even if energy prices settle down over the next few months, inflation is likely to fall only slightly and remain far higher than the Fed's 2% target.”
“The minutes of the latest FOMC meeting reflects the Fed's determination to bring inflation back under control. Monetary policy would have to become /appropriately/ restrictive to achieve this, and the Fed would have to maintain this course of action even in the event of a weakening labor market. Further significant rate hikes are thus virtually certain.”
“We continue to expect another large rate hike of 75 bps at the meeting in early November, and we forecast rates to peak at 5%.”
-
15:30
United States EIA Natural Gas Storage Change registered at 125B above expectations (123B) in October 7
-
15:04
USD/CHF marches on as US stocks fall off a cliff following hot US CPI
- USD/CHF bulls tally up fresh highs but market volatility shakes out the weak hands.
- Profit-taking has ensued following the US CPI print.
USD/CHF has rallied on the back of the hotter-than-expected US Consumer Price Index which has sent the US dollar, as per the DXY index, on a tear towards the 114.776 area and bull cycle. However, the markets are volatile and the greenback is falling back under pressure into the first 30 minutes of the cash open on Wall Street, potentially affected by some suspicious activity in USD/JPY.
Meanwhile, the US CPI data arrived as follows:
- US CPI (MoM) Sep: 0.4% (est 0.2%; prev 0.1%).
- US CPI (Y0Y) Sep: 8.2% (est 8.1%; prev 8.3%).
- US CPI Core (M0M) Sep: 0.6% (est 0.2%; prev 0.6%).
- US CPI Core (Y0Y) Sep: 6.6% (est 6.5%; prev 6.3%).
Sea of red after US CPI
The data is a blow to the Federal Reserve as their efforts to tame inflation have yet to show any significant signs that they are moving the needle. Hotter-than-expected US inflation numbers for both the core and headline measures have encouraged US short-term interest-rate traders to price in around one-in-ten chance of a 100-basis point fed rate hike in November, up from zero before the CPI report. Consequently, US benchmarks collapsed wth the Dow touching as low as 28,660 in a strong bearish opening gap from 28,983, around 1.8% lower. However, the Nasdaq Composite was the weakest major index, dropping by 3%, while the S&P 500 fell 2.6%.
No Fed pivot in sight
Forget about a Fed pivot with Fed funds futures now pricing in the odds of a 75 basis points move in December as well as November. ''Traders are now pricing in a rate hike of 64 basis points in December, up from 57 basis points before the data, which essentially implies a greater chance of a bigger hike. The possibility of a 100 basis points increase in November has also reared its head, though its currently seen as unlikely, with only a 9% probability,'' Reuters reported.
-
15:00
GBP/USD could retest multi-decade low in the coming months – RBC Economics
The new UK government’s fiscal plan prompted a sharp sell-off in Gilts and sterling. In the view of economists at RBC Economics, cable could retest its multi-decade low.
Bank of England can still send a message by ratcheting up to a 75 bps hike in November
“Sterling is up from its multi-decade low against the US dollar but we think that level could be re-tested in the coming months. Government energy support will help households but won’t fix the UK’s current account and budget deficits, and some currency adjustment will be needed to attract capital inflows.”
“We think the nearly 6% terminal rate now priced into the market (including moves of at least 100 bps at each of the remaining two meetings this year) is too aggressive.”
“We think the BoE can still send a message by ratcheting up to a 75 bps hike in November before reverting to a 50 bps increase in December. We’ve lifted our terminal Bank Rate forecast to 3.75% from 3% previously.
“While the BoE still plans to begin active QT at the end of October, we think that move could be delayed once again.”
-
15:00
BoE accepts 3.120 billion GBP of offers in index-linked gilt purchase
The Bank of England (BoE) accepted 3.120 billion sterling of offers in the second daily purchase operation of index-linked gilts, Reuters reported on Thursday.
The BoE rejected 56.4 million sterling of offers in the same operation.
Market reaction
The 2-year UK gilt yield is down more than 4% on the day at 3.83% after this development. The GBP/USD pair was last seen trading at 1.1205, rising 0.9%. Meanwhile, market participants keep a close eye on headlines surrounding the potential adjustments to the UK mini-budget.
-
14:47
GBP/USD Price Analysis: Bullish momentum falters near 1.1300 amid resurgent USD demand
- GBP/USD rallies for the second successive day and hits a one-week high on Thursday.
- Talks of a mini-budget U-turn by the UK government boost sterling and offers support.
- The stronger US CPI-inspired broad-based rally caps the pair near the 1.1300 mark.
The GBP/USD pair gains strong positive traction for the second straight day on Thursday and builds on the previous day's goodish rebound from a nearly two-week low. The momentum lifts spot prices to a one-week high, though falter near the 1.1300 mark following the release of hotter US consumer inflation figures.
The British pound gets a strong lift amid talks that the new UK government could reverse its vast tax cuts announced in the mini-budget in September. The intraday positive move, however, runs out of steam amid a strong pickup in the US dollar demand, bolstered by a stronger US CPI report and hawkish Fed expectations.
From a technical perspective, the GBP/USD pair found decent support on Wednesday near the 50% Fibonacci retracement level of the recent strong recovery from an all-time low. A subsequent move beyond the 100-period SMA on the 4-hour chart prompts some technical selling and contributes to the strong intraday move up.
Bulls, however, face rejection near the 200-hour SMA, which is currently pegged near the 1.1300 round figure and should act as a pivotal point. Meanwhile, technical indicators on the daily chart - though have been recovering from the negative territory - are yet to gain any meaningful traction and warrant caution for bulls.
Hence, it will be prudent to wait for a sustained strength beyond the 1.1300 mark before traders start positioning for any further appreciating move. The GBP/USD pair might then accelerate the momentum towards the next relevant hurdle near the 1.1370 region before aiming to reclaim the 1.1400 round-figure mark.
On the flip side, the 1.1120-1.1115 horizontal zone now seems to protect the immediate downside ahead of the 1.1100 level. Any further decline is likely to find decent support near the 1.1085 region (100-period SMA on the 4-hour chart), which is closely followed by the 38.2% Fibo. level, around the 1.1065-1.1060 zone.
A convincing break below the latter will suggests that the two-day-old uptrend has lost steam and shit the bias back in favour of bearish traders.
GBP/USD 4-hour chart
-638012654860732247.png)
Key levels to watch
-
14:39
UK's Kwarteng: Focused on delivering on mini-budget to get growth going again
When asked about reports of possible corporation tax plan reversal, UK Finance Minister Kwasi Kwarteng told BBC on Thursday that he is focused on delivering on the mini-budget to get growth going again, as reported by Reuters.
"It is a very dicey situation globally," Kwarteng added and noted that he speaks to Prime Minister Liz Truss all the time about delivering the growth plan.
Market reaction
These comments don't seem to be having a noticeable impact on the British pound's performance against its major rivals. As of writing, the GBP/USD pair was up 0.75% on the day at 1.1185.
-
14:29
EUR/USD to extend its downward trend amid geopolitical and recessionary risks – KBC Bank
EUR/USD is in a strong downward trend channel since February. Economists at KBC Bank expect the world’s most popular currency pair to remain under pressure.
Geopolitical and recessionary risks are bigger for Europe
“The dollar remains the main beneficiary of rising US (real) yields in a persistent risk-off context.”
“Geopolitical and recessionary risks are bigger for Europe, holding down the single currency as well even as the European Central Bank finally embraced on a tightening cycle.”
“Resistance stands at 0.9950/1.0050. The YTD low stands at 0.9536.”
-
14:29
USD/CAD bulls take control on hotter than expected US CPI
- USD/CAD bulls break key week and month highs.
- US CPI comes in hot and sends markets lower.
USD/CAD rallied to 1.3977 on the back of hotter-than-expected US inflation data in a highly anticipated Consumer Price Index report. The pair has rallied from a low of 1.3777 on the day and is currently 1.00% higher. The DXY index, which measures the greenback vs. a basket of currencies spiked to 113.92 with 114.80 on the radar, a touch above the September 28 highs.
US CPI comes in hot
The data arrived as follows:
- US CPI (MoM) Sep: 0.4% (est 0.2%; prev 0.1%).
- US CPI (Y0Y) Sep: 8.2% (est 8.1%; prev 8.3%).
- US CPI Core (M0M) Sep: 0.6% (est 0.2%; prev 0.6%).
- US CPI Core (Y0Y) Sep: 6.6% (est 6.5%; prev 6.3%).
Once again, hotter-than-expected US inflation numbers for both the core and headline measures are not seen as good news for the Federal Reserve or the US economy and US stocks don't like it. The S&P500 CFD is down some 2% ahead of the cash open at the top of the hour and gathering bearish momentum. The US short-term interest-rate traders see about a one-in-ten chance of a 100-basis point fed rate hike in November, up from zero before the CPI report. Consequently, Wall Street could be a bloodbath in the open and that is set to weigh on high beta currencies such as the dollar block, including CAD.
USD/CAD technical analysis
The bulls have burst through the week and month highs which could be expected to act as support on a retest.
-
14:23
Germany Current Account n.s.a. below expectations (€8.2B) in August: Actual (€0.6B)
-
14:19
Fed’s dovish pivot will have to wait – RBC Economics
A hawkish Federal Reserve and firm US inflation pushed Treasury yields to fresh highs. Economists at RBC Economics now see fed funds rising to 4.50-4.75% early next year.
Yield curve to flatten further in the coming months
“We continue to expect the US economy will slip into recession in the first half of next year with the jobless rate rising to 5% in the second half of 2023 (the Fed’s Q4/23 forecast is just 4.4%).”
“While we think the economy will ultimately fare worse than the Fed is projecting, we see little reason to push back against its near-term tightening plans. So the Fed’s dovish pivot will have to wait.”
“Our forecast now assumes another 75 bps hike in November followed by a 50 bps increase in December and 25 bps in February.”
“The yield curve is likely to flatten further in the coming months with longer-term yields expected to come down amid a softening economic backdrop and easing inflation, while a still-hawkish Fed will keep the front end sticky.”
-
14:11
EUR/USD drops to monthly lows near 0.9630 on US CPI
- EUR/USD loses the grip and retreats to 0.9630.
- US CPI rose more than expected in September.
- The probability of a 75 bps rate hike by the Fed picks up pace.
The single currency quickly abandoned the area of daily highs vs. the dollar and forced EUR/USD to drop to fresh 2-week lows near 0.9630 on Thursday.
EUR/USD sold-off on higher-than-expected CPI
The selling pressure in EUR/USD accelerates after the key US inflation figures came in on the strong side in September, with the headline CPI rising 8.2% YoY and 0.4% MoM. Same trend showed the Core CPI after rising 6.6% vs. the same month of 2021 and 0.6% from a month earlier.
Further data releases showed the usual weekly Claims rose by 228K in the week to October 8, also missing expectations.
Extra strength in the buck came from the jump in US yields across the curve, while the now increased probability of a ¾ point hike by the Fed at the November 2 gathering also collaborated with the decline in spot.
What to look for around EUR
EUR/USD now looks offered and opens the door to a deeper retracement in the short-term horizon, always on the back of the robust sentiment around the dollar.
In the meantime, price action around the European currency is expected to closely follow dollar dynamics, geopolitical concerns and the Fed-ECB divergence. Following latest results from key economic indicators, the latter is expected to extend further amidst the ongoing resilience of the US economy.
Furthermore, the increasing speculation of a potential recession in the region - which looks propped up by dwindling sentiment gauges as well as an incipient slowdown in some fundamentals – adds to the sour sentiment around the euro
Key events in the euro area this week: Germany Final Inflation Rate (Thursday) – EMU Balance of Trade (Friday).
Eminent issues on the back boiler: Continuation of the ECB hiking cycle vs. increasing recession risks. Impact of the war in Ukraine and the persistent energy crunch on the region’s growth prospects and inflation outlook.
EUR/USD levels to watch
So far, the pair is down 0.43% at 0.9659 and a drop below 0.9631 (monthly low October 13) would target 0.9535 (2022 low September 28) en route to 0.9411 (weekly low June 17 2002). On the flip side, the next up barrier emerges at 0.9999 (weekly high October 4) followed by 1.0050 (weekly high September 20) and finally 1.0197 (monthly high September 12).
-
14:07
AUD/USD plummets below 0.6200, lowest since April 2020 amid post-US CPI USD rally
- AUD/USD meets with aggressive supply and dives to its lowest level since April 2020.
- The USD strengthens across the board on stronger US CPI report and exerts pressure.
- The risk-off mood also contributes to driving flows away from the risk-sensitive aussie.
The AUD/USD pair comes under intense selling pressure during the early North American session and dives to its lowest level since April 2020 in reaction to stronger US consumer inflation figures.
In fact, the US Bureau of Labor Statistics reported that the headline CPI rose 0.4% MoM (0.2% expected) and the yearly rate eased to 8.2% from 8.3% in August, though was still higher than the 8.1% estimated. Adding to this, core inflation, which excludes food and energy prices, holds steady at 0.6% during the reported month and accelerates from 6.3% to 6.6% YoY - the highest since August 1982.
This comes on the back of more hawkish cues from the FOMC minutes released on Wednesday and lifts bets for a more aggressive policy tightening by the Fed. In fact, the markets have now started pricing in a small possibility of a 100 bps Fed rate hike move in November. This, in turn, pushes the yield on the benchmark US Treasury note beyond the 4.0% threshold and boosts the greenback.
Apart from this, a fresh wave of the global risk sentiment - as depicted by another round of a sell-off in the equity markets - underpins the safe-haven buck and weighs on the risk-sensitive aussie. Apart from this, technical selling below the previous YTD low, around the 0.6235 region, further aggravated the bearish pressure surrounding the AUD/USD pair and contributes to the steep decline.
That said, slightly oversold conditions on intraday charts hold back bearish traders from placing fresh bets and limit the downside for the AUD/USD pair, at least for the time being. Nevertheless, the fundamental backdrop suggests that any attempted recovery might be seen as a selling opportunity and runs the risk of fizzling out rather quickly amid looming recession risks.
Technical levels to watch
-
14:00
Russia Central Bank Reserves $ increased to $548.7B from previous $540.7B
-
13:54
Gold Price Forecast: XAU/USD pressured on hotter than expected US CPI
- Gold is under pressure on the back of the US CPI beat.
- US yields and the US dollar take off, pressuring gold to the downside.
The gold price has dropped on the back of the main event for the week's outcome in the US Consumer Price Index. The yellow metal has fallen to $1,645 while the high of the day has been $1,682.49. Eyes are on 28 September's lows of $1,614.
The US dollar, as measured by the DXY index has shot to a high of 113.888 from the lows of 112.69. US yields have shot higher as well, with the 10-year Treasury yield touching 4.09%.
US CPI comes in hot
The data arrived as follows:
- US CPI (MoM) Sep: 0.4% (est 0.2%; prev 0.1%).
- US CPI (Y0Y) Sep: 8.2% (est 8.1%; prev 8.3%).
- US CPI Core (M0M) Sep: 0.6% (est 0.2%; prev 0.6%).
- US CPI Core (Y0Y) Sep: 6.6% (est 6.5%; prev 6.3%).
Once again, hotter-than-expected US inflation numbers for both the core and headline measures are not seen as good news for the Federal Reserve or the US economy. US short-term interest-rate traders see about a one-in-ten chance of a 100-basis point fed rate hike in November, up from zero before the CPI report. Consequently, US Dow futures dropped more than 350 points after a hotter-than-expected inflation report.
''Inflation's rising persistence suggests the Fed is unlikely to stop hiking preemptively, which points to a prolonged period of restrictive rates,'' analysts at TD Securities said. ''This suggests traders should ignore gold's siren calls, as a sustained downtrend will likely prevail''
Meanwhile, more data will be coming in from the US tomorrow with US Retail Sales. ''We look for retail sales to gain further momentum in September, following a 0.3% MoM rise in August,'' analysts at TD Securities said. ''Spending was likely boosted by another increase in auto sales and the first gain in gasoline station sales in three months. Importantly, control group sales likely stayed subdued, while those for the restaurants' segment likely slowed to a crawl following a 1.1% jump in August.''
Gold technical analysis
The price is on the way to the bottom of the prior bullish run with the 28 September lows in focus.
-
13:50
US: Weekly Initial Jobless Claims rise to 228K vs. 225K expected
- Initial Jobless Claims in the US rose by 9,000 in the week ending October 8.
- US Dollar Index stays in positive territory above 113.50 after the data.
There were 228,000 initial jobless claims in the week ending October 8, the weekly data published by the US Department of Labor (DOL) showed on Thursday. This print followed the previous week's print of 219,000 and came in slightly worse than the market expectation of 225,000.
Further details of the publication revealed that the advance seasonally adjusted insured unemployment rate was 1% and the 4-week moving average was 211,500, an increase of 5,000 from the previous week's unrevised average.
"The advance number for seasonally adjusted insured unemployment during the week ending October 1 was 1,368,000, an increase of 3,000 from the previous week's revised level," the DOL further reported.
Market reaction
Boosted by the hot September inflation data, the US Dollar Index was last seen rising 0.5% on the day at 113.80.
-
13:46
USD Index rises to 2-week highs and targets 114.00 post-CPI
- The index gathers further pace and approaches 114.00.
- US headline/Core CPI surprised to the upside in September.
- US Initial Jobless Claims rose more than expected last week.
The USD Index (DXY), which gauges the greenback vs. a bundle of its main rival currencies, rapidly advanced to the proximity of the 114.00 mark in the wake of the release of US CPI results.
USD Index in multi-day tops post-inflation data
The index extends further the ongoing upside momentum and approaches the 114.00 barrier after US inflation figures tracked by the CPI came in above estimates in September.
Indeed, the headline CPI rose at an annualized 8.2% during last month and 0.4% MoM. The Core CPI followed suit and rose 6.6% from a year earlier and 0.6% vs. the previous month.

Additional data saw Initial Jobless Claims rise more than expected 228K in the week to October 8.
Following the release of US CPI, CME Group’s FedWatch Tool now sees the probability of a 75 bps rate hike at nearly 97%, from around 50% a month ago.

What to look for around USD
The rally in the dollar gathers renewed traction and now re-focuses on the 114.00 barrier following the release of higher-than-predicted US inflation results.
In the meantime, the firmer conviction of the Federal Reserve to keep hiking rates until inflation looks well under control regardless of a likely slowdown in the economic activity and some loss of momentum in the labour market continues to prop up the underlying positive tone in the index.
Looking at the more macro scenario, the greenback also appears bolstered by the Fed’s divergence vs. most of its G10 peers in combination with bouts of geopolitical effervescence and occasional re-emergence of risk aversion.
Key events in the US this week: Inflation Rate, Initial Jobless Claims (Thursday) – Retail Sales, Flash Michigan Consumer Sentiment, Business Inventories (Friday).
Eminent issues on the back boiler: Hard/soft/softish? landing of the US economy. Prospects for further rate hikes by the Federal Reserve vs. speculation of a recession in the next months. Geopolitical effervescence vs. Russia and China. US-China persistent trade conflict.
USD Index relevant levels
Now, the index is gaining 0.46% at 113.78 and faces the next up barrier at 113.88 (monthly high October 13) followed by 114.76 (2022 high September 28) and then 115.32 (May 2002 high). On the other hand, the breakdown of 110.05 (weekly low October 4) would open the door to 109.35 (weekly low September 20) and finally 107.68 (monthly low September 13).
-
13:42
USD/JPY spikes to fresh 24-year peak, around mid-147.00s on stronger US CPI
- USD/JPY catches aggressive bids in reaction to stronger US CPI and hits a fresh 24-year peak.
- The USD rallies across the board after the US consumer inflation figures surpass expectations.
- Intervention speculations might hold back bulls from placing fresh bets and cap the upside.
The USD/JPY pair attracts fresh buying during the early North American session and spikes to a new 24-year peak, closer to mid-147.00s in reaction to hotter US consumer inflation figures.
The US Bureau of Labor Statistics reported that the headline CPI rose 0.4% in September and the yearly rate eased to 8.2% from 8.3% in August. Adding to this, core inflation, which excludes food and energy prices, held steady at 0.6% during the reported month and the yearly rate accelerated to 6.6% from 6.3% previous. The readings were higher than consensus estimates and reaffirms market bets for another supersized 75 bps Fed rate hike move in November.
The US dollar strengthens across the board in reaction to the stronger CPI report and turns out to be a key factor pushing the USD/JPY higher for the seventh successive day. The strong move up takes along some short-term trading stops placed near the 147.00 round-figure mark. Hence, the latest leg of a sharp rally over the past hour or so could also be attributed to some technical buying. It, however, remains to be seen if bulls are able to capitalize on the move.
The markets have already been pricing in a more aggressive policy tightening by the Fed, which is evident from a rather muted reaction in the US fixed-income market. Apart from this, speculations for more currency market intervention by Japanese authorities and a fresh leg down in the equity markets should offer some support to the safe-haven Japanese yen. This, in turn, might cap the upside for the USD/JPY pair amid near-term overbought conditions.
Technical levels to watch
-
13:31
United States Initial Jobless Claims above forecasts (225K) in October 7: Actual (228K)
-
13:31
United States Consumer Price Index n.s.a (MoM) came in at 296.808, above expectations (296.43) in September
-
13:31
United States Consumer Price Index Core s.a increased to 298.66 in September from previous 296.95
-
13:31
United States Consumer Price Index ex Food & Energy (MoM) came in at 0.6%, above forecasts (0.5%) in September
-
13:31
United States Consumer Price Index ex Food & Energy (YoY) came in at 6.6%, above expectations (6.5%) in September
-
13:31
United States Consumer Price Index (YoY) above expectations (8.1%) in September: Actual (8.2%)
-
13:30
United States Continuing Jobless Claims above forecasts (1.365M) in September 30: Actual (1.368M)
-
13:30
United States Consumer Price Index (MoM) above expectations (0.2%) in September: Actual (0.4%)
-
13:30
Breaking: US annual CPI inflation declines to 8.2% in September vs. 8.1% expected
The US Bureau of Labor Statistics reported on Thursday that inflation in the US, as measured by the Consumer Price Index (CPI), declined to 8.2% on a yearly basis in September from 8.3% in August. This reading came in higher than the market expectation of 8.1%.
The Core CPI, which excludes volatile energy and food prices, was up 0.6% and 6.6%, on a monthly and yearly basis, respectively. Both of these figures surpassed analysts' estimates.
Follow our live coverage of the market reaction to US inflation data.
Market reaction
The hot inflation data provided a boost to the greenback with the initial market reaction. As of writing, the US Dollar Index was up 0.28% on a daily basis at 113.58.
-
13:30
United States Initial Jobless Claims 4-week average climbed from previous 206.5K to 211.5K in October 7
-
13:26
GBP/USD bursts out of consolidation, eyes on key daily resistance
- GBP/USD pops on U-turn budget speculation with daily resistance eyed.
- Eyes turn to US CPI as the main event for the week.
GBP/USD has rallied in recent trade ahead of the US inflation data at the top of the hour. At the time of writing, GBP/USD is trading at 1.1250 and popped 1.1299 amid more positive UK political noise. There are reports that there could be a UK budget U-turn with Tuss advocating raising corporation tax. Sky News reported that talks are underway over whether to reverse parts of the mini-budget although chancellor Kwasi Kwarteng has been reiterating his tax-cutting agenda.
Meanwhile, the Bank of England confirmed on Wednesday it's emergency bond-buying scheme will end on Friday as expected. However, the Financial Times reported that the central bank has signalled privately to bankers that it could extend its emergency bond-buying programme, raising some confusion among investors. Either way, volatility is back in the binds and the long-dated UK gilt prices have rallied sharply, pushing yields down by as much as 42 basis points to 4.476%, easing back from 20-year highs struck on Wednesday.
Looking ahead, the US Consumer Price Index will be the driver for the immediate future, the main data release of the week. ''We expect the headline to print relatively low at 0.2% MoM in line with consensus, as gasoline prices continued to decline during September,'' analysts at Danske Bank said. ''For core, we continue to see modest upside risks to the consensus expectation, and forecast a rise of 0.5% MoM (consensus 0.4% MoM).''
GBP/USD technical analysis
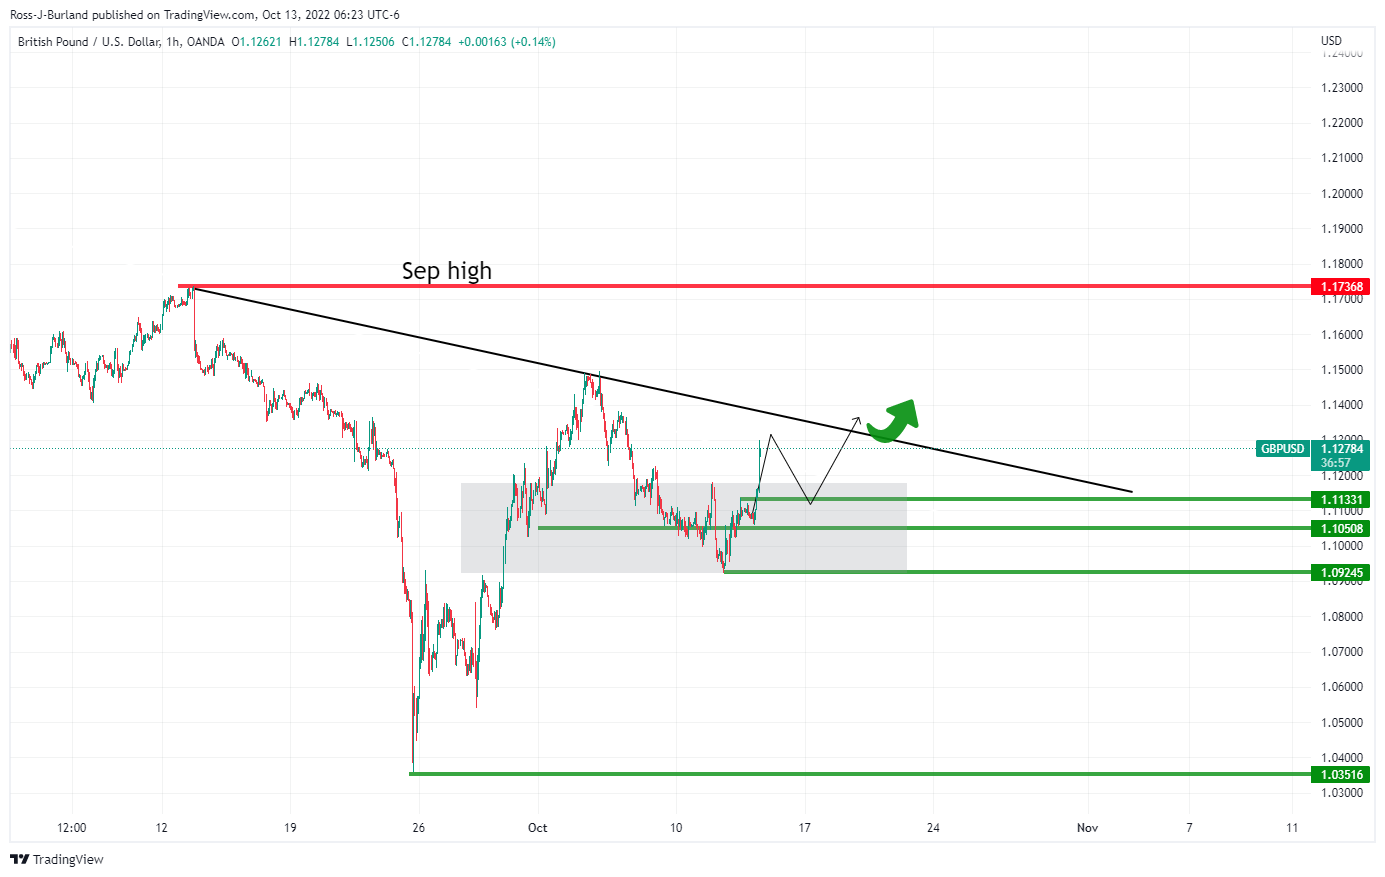
September's high of 1.1736 is on the radar for the bulls on a break of the daily resistance. However, a strong inflation report from the US could see the greenback surge, and that means the recent supports and daily, and weekly lows will be eyed with a focus on 1.1050 first and then 1.0920s.
-
13:17
Malaysia: Foreign Portfolio outflows accelerated in September – UOB
Senior Economist Julia Goh and Economist Loke Siew Ting at UOB Group assess the latest foreign portfolio figures in Malaysia.
Key Takeaways
“Malaysia saw a reversal in foreign portfolio flows last month, logging a net outflow of MYR2.0bn in Sep (from a large net inflow of MYR7.6bn in Aug). This came as foreign investors shied away from both Malaysian equity (Sep: -MYR1.6bn, Aug: +MYR2.0bn) and debt (Sep: -MYR0.4bn, Aug: +MYR5.6bn) markets following tighter global monetary and financial conditions during the month.”
“Bank Negara Malaysia (BNM)’s foreign reserves declined for the second straight month and by a larger magnitude of USD2.1bn m/m to USD106.1bn as at end-Sep (end-Aug: -USD0.9bn m/m to USD108.2bn). It marked the lowest level since Nov 2020 and has taken into account the quarterly foreign exchange revaluation changes. The latest reserves position is sufficient to finance 5.6 months of imports of goods and services and is 1.1 times of the total short-term external debt.”
“Given that investors remain cautious on uncertain policy direction globally and concerned about a global recession next year, we see heightened volatility in foreign capital flows into emerging markets including Malaysia. Domestic political and policy uncertainties will pose further downside risks to non-resident portfolio flows into Malaysia in the near term. With this and expectations of persistent USD strength and CNY weakness, the MYR weakness sees little respite and likely to hit the 4.70 level earlier than we had projected.”
-
13:14
S&P 500 Index to plunge towards 3235/3195 amid significant downward pressure – Credit Suisse
S&P 500 heads into today’s key US CPI data under intense downward pressure. Analysts at Credit Suisse continue to look for a sustained close below the 200-week average for an eventual fall to the 3235/3195 region.
A move above 3641 can offer some near-term relief
“S&P 500 remains under significant downward pressure, holding below its key 200-week average at 3599. Whilst today’s data stays seen critical as to the next immediate directional move for the market, our core outlook stays seen firmly negative, whether we rebound today or not.”
“Resistance at 3641 capping can maintain an immediate bearish outlook with support seen next at 3554/44 then the Q1 2020 pre-pandemic high and 50% retracement of the 2020/2021 uptrend at 3505/3494. Our core objective though remains at the 3235/3195 support cluster, which includes the 38.2% retracement of the entire uptrend from the 2009 GFC low.”
“Above 3641 can offer some near-term relief for strength back to the 13-day exponential average at 3682, potentially the price gap from Friday at 3707/3745 but with a fresh cap expected here.”
-
13:12
EUR/USD Price Analysis: Sell the rallies?
- EUR/USD advances to 2-day peaks near 0.9750.
- The immediate up barrier comes at the October high near parity.
EUR/USD pushes higher and flirts with the 0.9750 region ahead of US CPI.
Further gains are expected to meet the next hurdle of note at the October high at 0.9999, an area also reinforced by the proximity of the 55-day SMA and the multi-month resistance line. Spot is seen faltering around this key resistance area amidst the prospects for further gains in the dollar in the next months.
In the longer run, the pair’s bearish view should remain unaltered while below the 200-day SMA at 1.0584.
EUR/USD daily chart
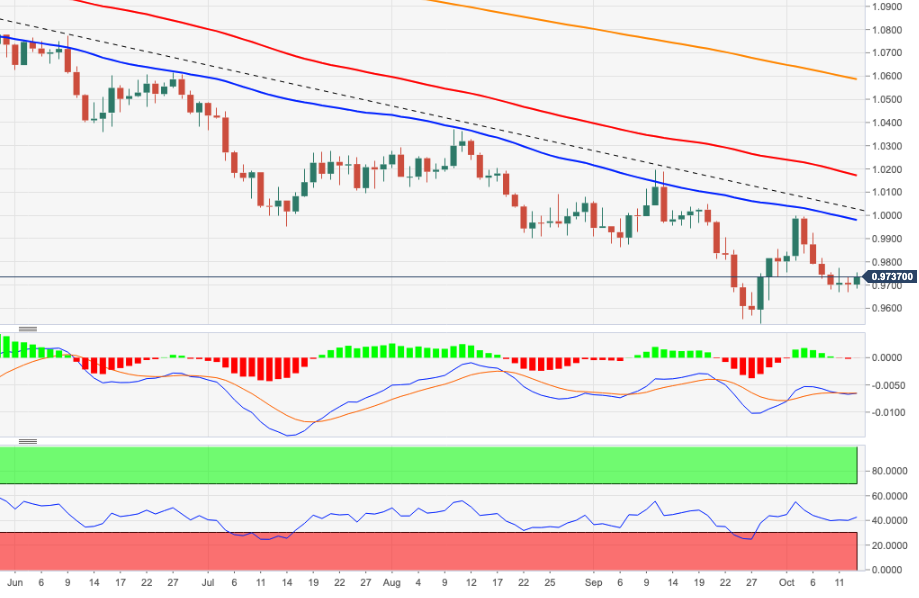
-
13:02
South Korea: BoK raised rates by 50 bps – UOB
Economist at UOB Group Ho Woei Chen, CFA, comments on the latest interest rate decision by the Bank of Korea (BoK).
Key Takeaways
“Bank of Korea (BoK) ratcheted up its benchmark base rate by an outsized 50bps to 3.00% in Oct. This was the second time that the central bank had hiked by a 50bps pace following a similar move in Jul. The strengthened policy move was in response to the high inflation as well as sharp depreciation in the won which was seen adding more inflationary pressure through higher imported prices.”
“Despite opting for a larger 50bps hike, BoK’s tone was evidently more downbeat as Governor Rhee Chang-yong flagged weaker growth outlook for the global and South Korean economies.”
“BoK signaled the need for further interest rate hikes with several BoK members now seeing the ‘terminal rate’ at ‘around 3.50%’.”
“Taking into account of the BoK’s guidance, we revise our call for the ‘terminal rate’ to 3.50% from previous 3.00%. The last meeting for the year is scheduled on 24 Nov. It is far from clear whether the BoK will hike by 25bps or 50bps in Nov but we think the risk is towards a larger rate hike quantum. The BoK made it clear that US Fed rate trajectory does hold some sway over the BoK’s rate decision due to the impact on the currency market. We see another 125bps of hikes in the remaining two FOMC meetings in 2022 (i.e. 75bps in Nov and then 50bps in Dec) and thus the risk is towards BoK frontloading the 50bps hike in Nov.”
-
12:47
USD Index Price Analysis: Another visit to the YTD high is not ruled out
- DXY now comes under some pressure below 113.00.
- The resumption of the upside could advance to the 2022 high.
DXY now adds to Wednesday’s pullback and breaks below the 113.00 mark ahead of the key US inflation figures.
In case bulls regain the initiative and the index surpasses 114.00, then the next target of note should appear at the 2002 top at 114.78 (September 28) prior to the round level at 115.00.
The prospects for extra gains in the dollar should remain unchanged as long as the index trades above the 7-month support line near 107.80.
In the longer run, DXY is expected to maintain its constructive stance while above the 200-day SMA at 103.18.
DXY daily chart
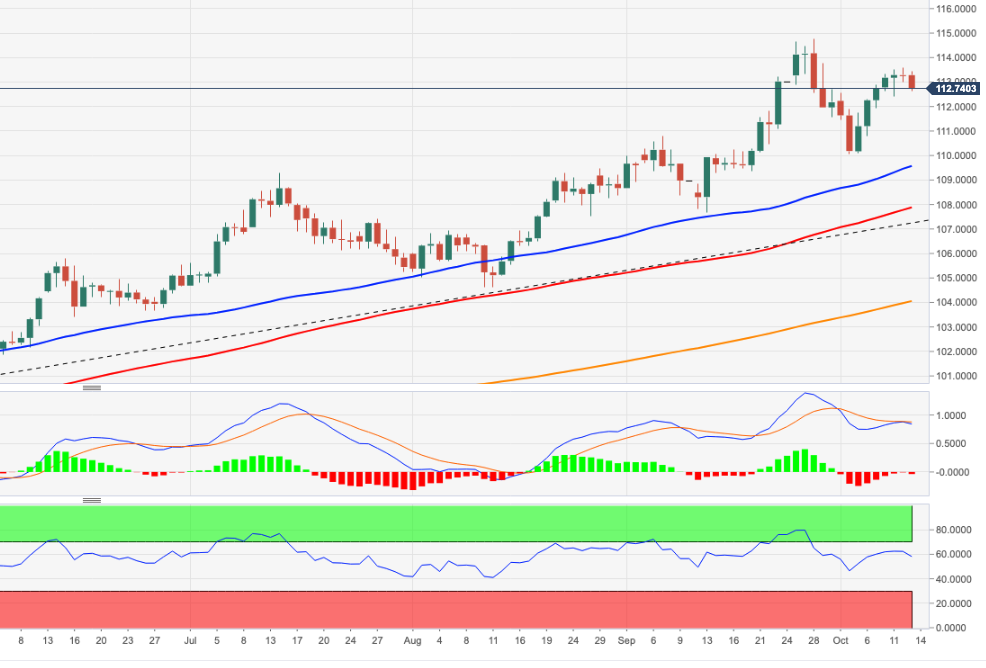
-
12:31
In line or modestly stronger US CPI figures to keep USD bid – OCBC
Markets keep their eyes peeled on the US Consumer Price Index (CPI) release. Unless data surprises to the downside, the greenback is set to stay supported, economists at OCBC Bank report.
DXY finds initial resistance at 113.70
“The outcome of CPI print can be asymmetric on markets. If data surprises to the downside, then potentially we may see more downside on USD being played out but data in line with expectation or modestly stronger may just keep USD broadly supported.”
“Daily momentum is not indicating a clear bias while RSI shows signs of turnaround lower. Bias to lean against strength.”
“Resistance at 113.70, 114.77 (previous high).”
“Support at 112.40 (23.6% fibo retracement of Aug low to Sep high), 111.78 (21DMA) and 111.00 levels (38.2% fibo).”
-
12:20
Malaysia: Unemployment Rate stayed put in August – UOB
UOB Group’s Senior Economist Julia Goh and Economist Loke Siew Ting review the latest labour market report in Malaysia.
Key Takeaways
“Malaysia’s labour market continued to show further improvement albeit moderately in Aug. Both the size of the labour force and employment breached another fresh record level while the national unemployment rate held steady at 3.7%.”
“The gain in total employment was again driven by increased hiring in services (particularly food & beverages services, wholesale & retail trade, and administrative & support service activities), manufacturing, and construction sectors. Agriculture and mining & quarrying sectors continued to trim headcounts. The employment-to-population ratio, which indicates the ability of an economy to create employment, surpassed pre-pandemic high level for four months in a row at 67.1%.”
“Cognizant of a potential global recession next year, still high operating costs and lingering COVID19 related risks, Malaysia’s labour market recovery may hit a speedbump going into 2023. A successful end to the country’s transition to COVID-19 endemicity and continued government support under the re-tabled Budget 2023 after the general elections are key to hold up the existing recovery momentum. We keep the view of a potential full labour market recovery back to pre-pandemic levels by mid-2023 for now, with the unemployment rate expected to ease to 3.5% by end2022 and 3.2% by end-2023.”
-
12:18
EUR/USD settles into a 0.9680-0.9740 range – OCBC
EUR/USD continues to move sideways near 0.9700 on Thursday. Analysts at OCBC Bank expect the world's most popular currency pair to trade in a 0.9680-0.9740 range. They also highlight the key technical levels to watch.
Sideways
“Daily momentum is not indicating a clear bias while a decline in RSI moderated. Consolidative trades likely.”
“Support seen at 0.9650 and 0.9560 levels.”
“Resistance seen at 0.9820, 0.9890 and parity levels.”
“Intra-day look for a 0.9680-0.9740 range.”
See – EUR/USD: No upside potential for the time being – Commerzbank
-
12:16
EUR/JPY Price Analysis: Further rebound targets 144.00 and beyond
- EUR/JPY extends the recovery for the third session in a row.
- Extra gains could see the October peak around 144.00 revisited.
EUR/JPY gathers extra steam and reaches new multi-day highs around the 143.00 neighbourhood on Thursday.
So far, the recovery appears underpinned by the 141.00 region, which stands as quite a decent support for the time being. Further upside could then see the 144.00 zone retested in the short-term horizon ahead of the 2022 top at 145.63 (September 12).
In the meantime, while above the key 200-day SMA at 136.37, the constructive outlook for the cross should remain unchanged.
EUR/JPY daily chart
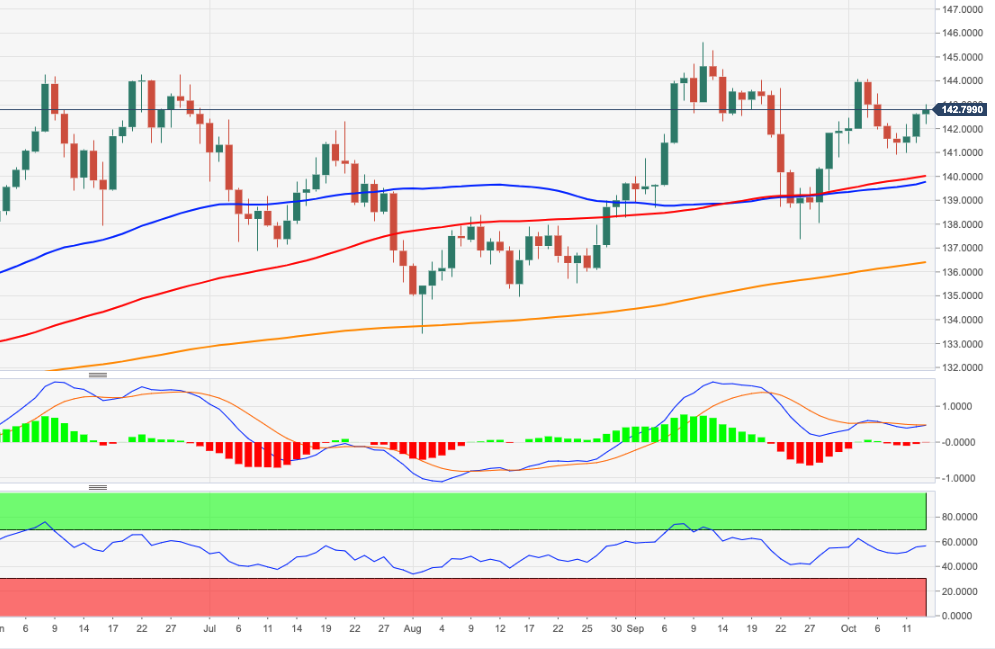
-
12:05
EUR/PLN to approach the 5 mark over the coming months – Danske Bank
The Polish zloty has weakened recently. Economists at Danske Bank expect the EUR/PLN to advance nicely towards the 5 level over the coming months.
Narodowy Bank Polski unlikely to become a lot more hawkish
“As we think that geopolitical risk may remain at current levels or even escalate further that will keep EUR/PLN at the current elevated levels or even higher, especially near-term. Furthermore, we think it is unlikely that NBP will suddenly become a lot more hawkish given the week state of the economy.”
“The joker is whether the Fed will change to a softer stance over the next 12M, but our base-case is not. Hence, we raise our forecast for EUR/PLN to 4.92 on 1M and 4.94 on 3M and then grinding slowly higher to 4.96 on a 6M horizon and further up to 5.00 in 12M.”
-
12:04
When is the US consumer inflation (CPI report) and how could it affect EUR/USD?
US CPI Overview
Thursday's US economic docket highlights the release of the critical US consumer inflation figures for September, scheduled later during the early North American session at 12:30 GMT. On a monthly basis, the headline CPI is anticipated to rise by 0.2% during the reported month. The yearly rate is expected to ease to 8.1% in September from the 8.3% previous. Meanwhile, core inflation, which excludes food and energy prices, is projected to come in at 0.5% for September and edge higher to 6.5% on yearly basis from 6.3% in August.
Analysts at ING offer a brief preview of the report and explain: “The headline rate will be depressed by the lagged effects of the fall in gasoline prices, which is also likely to translate into lower airline fares to some extent. However, the core (ex-food and energy) component is set to continue rising at a rapid pace. We look for a 0.4% MoM increase in prices, which would nudge the annual rate of core inflation up to 6.5% from 6.3%. This unfavourable shift is primarily due to housing costs and recreation prices and should cement expectations for a fourth consecutive 75 bps interest rate increase from the Federal Reserve on 2 November.”
How Could it Affect EUR/USD?
Data released on Wednesday showed that US Producer Price Index rose more than expected in September and fueled speculations for a similar rise in consumer inflation. A stronger CPI print will reaffirm the Fed's hawkish rhetoric and bets for another supersized 75 bps rate hike in November. This will be enough to push the US Treasury bond yields higher and trigger fresh buying around the US dollar.
Conversely, a weaker reading might do little to derail the Fed's aggressive policy tightening path as policymakers want to see a meaningful and sustainable drop in the underlying toward the 2% target. This, along with a further escalation in the Russia-Ukraine conflict, suggests that the path of least resistance for the EUR/USD pair is the downside. Hence, any immediate market reaction to a softer print is likely to be short-lived.
Eren Sengezer offers a brief technical outlook for the pair and writes: “The near-term technical outlook doesn't point to a directional bias with the Relative Strength Index (RSI) indicator on the four-hour chart continuing to move sideways slightly below 50. Additionally, EUR/USD continue to trade near the 20-period SMA, reflecting the pair's indecisiveness.”
Eren also outlines important technical levels to trade the EUR/USD pair: “0.9680 (static level, lower limit of the trading range) aligns as interim support ahead of 0.9650 (static level). With a four-hour close below the latter, EUR/USD could continue to push lower toward 0.9600.”
“On the upside, 0.9720 (Fibonacci 61.8% retracement of the latest uptrend) forms immediate resistance before 0.9760 (100-period SMA) and 0.9780 (Fibonacci 50% retracement),” Eren adds further.
Key Notes
• US CPI Preview: High expectations may trigger a dollar-buying opportunity, three scenarios
• US September CPI Preview: Monthly core inflation is the figure to watch
• EUR/USD Forecast: Euro looks to break out of range on US CPI
About the US CPI
The Consumer Price Index released by the US Bureau of Labor Statistics is a measure of price movements by the comparison between the retail prices of a representative shopping basket of goods and services. The purchasing power of the USD is dragged down by inflation. The CPI is a key indicator to measure inflation and changes in purchasing trends. Generally speaking, a high reading is seen as positive (or bullish) for the USD, while a low reading is seen as negative (or Bearish).
-
12:02
UK PM Spokesperson: There will be no further U-turns on economic plan
When asked if British Prime Minister Liz Truss can make assurances that there will be no further U-turns on her economic plan, PM's spokesperson responded by saying "yes, the position has not changed," as reported by Reuters.
"The OBR is the government's official forecaster and the prime minister has said on a number of occasions she values their scrutiny and respects their independence," the spokesperson added.
Market reaction
These comments don't seem to be having a significant impact on the British pound's market valuation. As of writing, the GBP/USD pair was up 0.45% on the day at 1.1152.
-
11:35
USD/KRW to move up to 1,470 by year-end – MUFG
Korean won snapped an eight-week losing streak, rising 1.3% against the US dollar in the first week of October. Nevertheless, economists at MUFG Bank expect a weaker KRW by the end of Q4 this year.
KRW to be affected by sentiment in near-term
“The KRW likely remains largely driven by external drivers near term. Given a persisting US dollar strength and global growth concern, particularly recessions in UK, Europe and US, we see the pro-cyclical KRW to remain under-perform relative to EM Asian currencies.”
“Also, with a possible worsening of current account balance caused by deteriorating exports amid a softening semiconductor industry and weakening global demand, we see USD/KRW to move up to 1,470 by the end of Q4 this year.”
-
11:26
US: NFP opens the door to large rate hikes – UOB
Senior Economist at UOB Group Alvin Liew reviews the latest release of US Nonfarm Payrolls for the month of September.
Key Takeaways
“The US NFP again exceeded expectations, adding 263,000 jobs in Sep while the unemployment rate unexpectedly eased to 3.5% (from 3.7% in Aug) as labor force participation dipped while the unemployed numbers fell by 261,000 to 5.75 million. Wage growth continued at an expected pace of 0.3% m/m, 5.0% y/y (from 0.3% m/m, 5.2% y/y in Aug).”
“The Sep report pointed to continued hiring momentum and persistent above 5% wage growth in a tight labor market environment, bolstering the case for the Fed to hike rates by a 4th consecutive 75bps in the next Nov FOMC. Attention will now shift to various Fed senior officials speaking this week and Sep CPI (13 Oct), which will shape Fed expectations before Nov’s FOMC.”
-
11:18
AUD/USD Price Analysis: Bulls struggle to make it through 0.6300 confluence ahead of US CPI
- AUD/USD gains traction for the second straight day amid a modest USD downtick.
- The risk-on impulse undermines the buck and benefits the risk-sensitive aussie.
- The 0.6300 confluence hurdle caps the upside ahead of the crucial US CPI report.
The AUD/USD pair attracts some buying for the second straight day on Thursday and might now be looking to build on the previous day's bounce from its lowest level since April 2020. Currently placed around the 0.6300 round-figure mark, a modest US dollar weakness turns out to be a key factor offering support to the major.
A recovery in the global risk sentiment - as depicted by a generally positive tone around the equity markets - undermines the safe-haven buck and benefits the risk-sensitive aussie. That said, hawkish Fed expectations should act as a tailwind for the greenback and cap gains for the AUD/USD pair ahead of the crucial US CPI report, due later during the early North American session.
From a technical perspective, the uptick could be attributed to some short-covering move amid slightly oversold conditions and ahead of the key data risk. The 0.6300 confluence, comprising 100-hour SMA and the 23.6% Fibonacci retracement level of the recent fall from the 0.6540-0.6550 supply zone, continues to cap the upside. This should now act as a pivotal point for intraday traders.
A sustained strength beyond has the potential to lift the AUD/USD pair to the next relevant resistance near the 0.6330 region en route to the 38.2% Fibo. level, around the 0.6355 zone. Some follow-through buying should pave the way for additional gains and allow bulls to reclaim the 0.6400 mark. The latter represents another confluence comprising 200-hour SMA and 50% Fibo. level.
On the flip side, the 0.6250 horizontal zone is likely to protect the immediate downside ahead of the YTD low, around the 0.6235 region. This is followed by the 0.6200 round-figure mark, which if broken decisively will be seen as a fresh trigger for bearish traders. This, in turn, will set the stage for an extension of a well-established downtrend witnessed over the past six months or so.
AUD/USD 1-hour chart
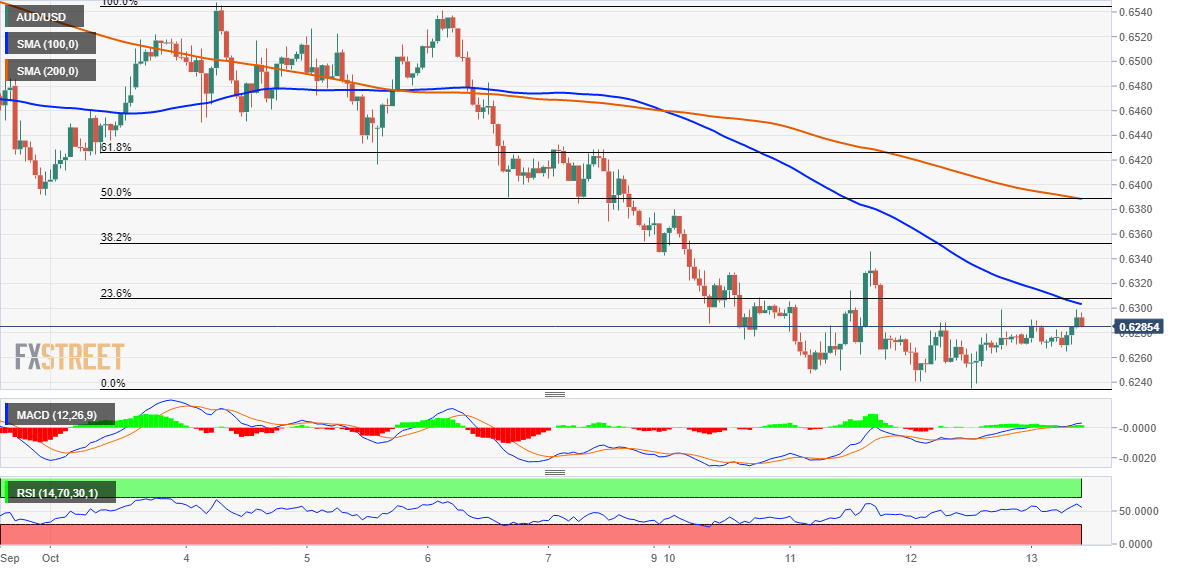
Key levels to watch
-
11:12
No reason to sell USD on in-line or above consensus CPI data – SocGen
US Consumer Price Index (CPI) data for September has tremendous power over sentiment. Barring a downside surprise, the US dollar is set to remain strong, Kit Juckes, Chief Global FX Strategist at Société Générale, reports.
Fed could hike rates too aggressively for too long
“Price increases are steadily spreading through to more parts of the economy. In that sense, I’d worry as much about inflation reaching more parts of the economy, as about the monthly increase.”
“Last night’s FOMC Minutes did nothing at all to diminish the sense that the Fed will want to see very clear evidence of inflation peaking before they stop raising rates and that’s extremely unlikely to emerge as soon as today. The biggest danger is still that, having started slowly, they will be raising rates too aggressively for too long.”
“An in-line figure may offer only temporary relief as it still leaves Fed Funds on track to get to 4.5% by the end of the year, making an even more inverted curve almost unavoidable. So, if the data are in-line or above consensus, we are unlikely to see relief in the Treasury market or any reason to sell the dollar.”
See – US CPI Preview: Forecasts from 10 major banks, price pressure easing only very slowly
-
11:03
Ireland HICP (MoM) declined to 0% in September from previous 0.2%
-
11:02
Ireland Consumer Price Index (MoM) dipped from previous 0.2% to 0% in September
-
11:02
Portugal Consumer Price Index (MoM) remains unchanged at 1.2% in September
-
11:01
Ireland HICP (YoY) declined to 8.6% in September from previous 9%
-
11:01
Portugal Consumer Price Index (YoY): 9.3% (September)
-
11:01
Ireland Consumer Price Index (YoY): 8.2% (September) vs previous 8.7%
-
10:45
EUR/NOK to head higher towards 10.70 over the coming three months – Danske Bank
The Norwegian krone has sold off mirroring the general move lower in commodity currencies. Economists at Danske Bank pencil in a rise in EUR/NOK over the coming three months.
Timing NOK rebound is tricky
“We still pencil in EUR/NOK heading higher over the coming 3-6M driven by a slowdown in growth, a European recession, volatile asset markets and spread tightening in the short-end of rates curves.”
“For 2023, we still pencil in a NOK rebound – but timing is tricky. Until we see global central banks and not least the Fed signal a shift of policy towards a more dovish direction we prefer to play the weak leg in NOK.”
We maintain a ‘reverse V-profile’ and forecast EUR/NOK at 10.60 in 1M (from 10.40), 10.70 in 3M (from 10.60), 10.30 in 6M (from 10.20) and 9.80 in 12M (unchanged).”
-
10:30
GBP/USD steadily climbs to 1.1145-50 area, focus remains glued to US CPI report
- GBP/USD attracts some buying for the second successive day amid a modest USD downtick.
- The risk-on impulse undermines the safe-haven buck and offers some support to the major.
- Aggressive Fed rate hike bets should limit the USD losses as the focus remains on the US CPI.
- Confusion over the BoE’s emergency bond-buying program further warrants caution for bulls.
The GBP/USD pair attracts some buying in the vicinity of the 1.1050 area on Thursday and hits a fresh daily high during the first half of the European session. The pair is currently trading just above the mid-1.1100s, up for the second straight day and might be looking to build on the previous day's goodish rebound from a nearly two-week low.
The US dollar edges lower for the second straight day and turns out to be a key factor lending support to the GBP/USD pair. A recovery in the global risk sentiment - as depicted by a generally positive tone around the equity markets - is undermining the safe-haven greenback. Apart from this, the USD downtick lacks any obvious catalyst and is likely to remain limited amid hawkish Fed expectations.
The markets seem convinced that the US central bank will stick to its aggressive policy tightening path and have been pricing in another supersized 75 bps rate hike in November. The bets were reaffirmed by the FOMC meeting minutes released on Wednesday, which showed that officials were committed to raising interest rates to curb inflation. This remains supportive of elevated US Treasury bond yields.
Hence, the market focus remains glued to the release of the latest US consumer inflation figures, due later during the early North American session. The crucial US CPI report will be looked upon for clues about the size of the Fed's next interest rate hike. This, in turn, will play a key role in influencing the near-term USD price dynamics and provide a fresh directional impetus to the GBP/USD pair.
In the meantime, the fact that the Bank of England could end its program of temporary gilt purchases on Friday could act as a headwind for sterling amid concerns about the UK government's fiscal plans. It is worth mentioning that the new UK government said that it would not reverse its vast tax cuts or reduce public spending, warranting caution before placing bullish bets around the GBP/USD pair.
Technical levels to watch
-
10:24
USD/CNH: Extra gains seem likely above 7.2200 – UOB
USD/CNH is seen picking up further upside traction once 7.2200 is cleared, according to UOB Group’s Markets Strategist Quek Ser Leang and Senior FX Strategist Peter Chia.
Key Quotes
24-hour view: “Yesterday, USD traded within a range of 7.1549/7.1916 before closing largely unchanged at 7.1782 (+0.04%). The price actions appear to be consolidative in nature and we expect USD to trade between 7.1450 and 7.2000 for today.”
Next 1-3 weeks: “Despite the relatively rapid rise from last week’s low of 7.0128, upward momentum is not strong. That said, the risk is still on the upside but USD has to break clearly above 7.2200 before further advance is likely. Overall, only a breach of the ‘strong support’ at 7.1250 would indicate that the upside risk has subsided.”
-
10:20
EUR/USD picks up pace above 0.9700 prior to US data
- EUR/USD maintains its consolidation around the 0.9700 region.
- German final CPI matched the preliminary readings for September.
- Markets’ attention will be on US CPI and Initial Claims, both due later.
The single currency attempts a mild rebound and prompts EUR/USD to probe daily highs around 0.9730 on Thursday.
EUR/USD focuses on US inflation
EUR/USD keeps the erratic performance so far this week amidst the equally flatish price action around the greenback, while risk appetite trends also show no clear direction for the time being.
In the meantime, the side-lined move in the pair comes in tandem with another small drop in the German 10-year bund yields following Wednesday’s fresh 11-year peaks past 2.42%.
Earlier in the session, final German inflation figures saw the CPI rise 10.0% YoY and 1.9% MoM in September, matching the preliminary results. Moving forward, all the attention will be on the release of US inflation figures measured by the CPI for the month of September seconded by the usual Initial Jobless Claims.

What to look for around EUR
EUR/USD extends the consolidation around the 0.9700 region ahead of key data releases in the US docket.
In the meantime, price action around the European currency is expected to closely follow dollar dynamics, geopolitical concerns and the Fed-ECB divergence. Following latest results from key economic indicators, the latter is expected to extend further amidst the ongoing resilience of the US economy.
Furthermore, the increasing speculation of a potential recession in the region - which looks propped up by dwindling sentiment gauges as well as an incipient slowdown in some fundamentals – adds to the sour sentiment around the euro
Key events in the euro area this week: Germany Final Inflation Rate (Thursday) – EMU Balance of Trade (Friday).
Eminent issues on the back boiler: Continuation of the ECB hiking cycle vs. increasing recession risks. Impact of the war in Ukraine and the persistent energy crunch on the region’s growth prospects and inflation outlook.
EUR/USD levels to watch
So far, the pair is up 0.24% at 0.9725 and faces the next up barrier at 0.9999 (weekly high October 4) followed by 1.0050 (weekly high September 20) and finally 1.0197 (monthly high September 12). On the flip side, a drop below 0.9669 (monthly low October 11) would target 0.9535 (2022 low September 28) en route to 0.9411 (weekly low June 17 2002).
-
10:16
GBP/USD to move in a range of 1.00-1.10 over the coming months – UBS
Sterling has come back under renewed pressure. Economists at UBS expect the GBP/USD to trade in a range of 1.00-1.10.
Concerns over financial stability in the UK remain a drag on sterling
“With markets still concerned about the viability of the government’s fiscal plans, we think the pound will likely remain volatile, trading in a range of 1.00-1.10 against the US dollar over the coming months.”
“Worries over the financial stability of the UK is also feeding into broader market risk aversion – which is also positive for the US dollar.”
-
09:53
USD/JPY consolidates below 147.00, bulls retain control near 24-year top ahead of US CPI
- USD/JPY is seen oscillating in a narrow trading band below a 24-year low touched on Wednesday.
- Investors now seem to have moved to the sidelines and prefer to wait for the crucial US CPI report.
- Fears of an intervention by Japanese authorities also hold back traders from placing aggressive bets.
The USD/JPY pair now seems to have entered a bullish consolidation phase and oscillates in a narrow band through the first half of the European session. Spot prices remain well within the striking distance of the highest level since August 1998, around the 147.00 mark touched on Wednesday as investors brace for the crucial US CPI report.
The US inflation figures will determine the size of the Fed's next interest rate hike, which, in turn, will help determine the near-term trajectory for the US dollar and the USD/JPY pair. In the meantime, traders prefer to move to the sidelines amid speculations for more currency market intervention by Japanese authorities. In fact, Japan's Finance Minister Shunichi Suzuki reiterated earlier this week that the government stands ready to intervene and respond appropriately to excess FX moves.
Moreover, Bank of Japan BoJ Governor Haruhiko Kuroda said on Wednesday that the government intervention last month to stop one-sided depreciating moves in the Japanese yen was quite appropriate. That said, the divergent policy stance adopted by the Bank of Japan (dovish) and other major central banks (hawkish), along with the risk-on impulse, continue to undermine the safe-haven JPY. It is worth mentioning that the Japanese central bank, so far, has shown no inclination to hike interest rates.
Adding to this, Japan's Prime Minister Fumio Kishida said that the BoJ needs to stick to its ultra-lose policy until wages rise. In contrast, the markets have been pricing in another supersized 75 bps Fed rate hike move in November, which remains supportive of elevated US Treasury bond yields. The resultant widening of the US-Japan rate differential favours bullish traders. Hence, any meaningful pullback could be seen as a buying opportunity and is likely to remain limited, for the time being.
Technical levels to watch
-
09:51
EUR/SEK to trend higher towards 11.20 over the coming months – Danske Bank
Weaker growth prospects have sent the Swedish krona to its weakest level since March 2020. Economists at Danske Bank expect EUR/SEK to move higher over the coming months to 11.20.
Krona hit by triple whammy
“We stick to our long-held, non-consensus, negative view on the SEK, which is underpinned by the gloomy global growth outlook, associated negative outlook for global and Swedish equities alike and relative monetary policy – a triple whammy if you like.”
“The Riksbank’s 100 bps rate hike had no lasting positive impact on the krona. The rate path underwhelmed expectations. In addition, more frontloading will exacerbate the downturn in the Swedish housing market, a headwind for the krona.”
“Forecast: 10.80 (1M), 11.00 (3M), 11.20 (6M), 11.20 (12M).”
-
09:29
USD/JPY to inch towards next potential resistance of 148-150 – SocGen
USD/JPY climbed to a fresh multi-decade high at 147.00 before going into a consolidation phase. Economists at Société Générale expect the pair to reach the 148-150 region.
Immediate support aligns at 145
“The USD/JPY pair is gradually inching towards next potential resistances of 148-150 representing the high of 1998, a multi-month channel band and projections for the move. A pullback is not ruled out after achievement of this zone.”
“The upper end of the recent range at 145 and 143.50 are immediate support levels.”
-
09:28
USD/JPY now looks to test 147.65 – UOB
In light of the recent upside, USD/JPY could now challenge the 1998 high at 147.65, comment UOB Group’s Markets Strategist Quek Ser Leang and Senior FX Strategist Peter Chia.
Key Quotes
24-hour view: “Not surprisingly, the sharp rally in USD is deep in overbought territory. However, upward momentum is not showing signs of easing just yet and USD could rise above 147.00. The next major resistance at 147.65 is unlikely to come under challenge. Support is at 146.40, followed by 146.10.”
Next 1-3 weeks: “The strong rise in USD over the past week has room to extend. The level to focus on is at the 1998 high near 147.65. On the downside, a breach of 145.40 would indicate that the upward pressure has eased.”
-
09:25
USD Index treads water around 113.30 ahead of US CPI
- The index attempts some consolidation in the low-113.00s.
- US yields reverse the recent weakness and move slightly higher.
- US inflation figures tracked by the CPI takes centre stage on Thursday.
The greenback seems to have moved into a consolidative phase in the 113.20/30 band when measured by the USD Index (DXY).
USD Index now looks to US CPI
The index navigates the 113.30 region and appears consolidative ahead of the upcoming release of the US CPI for the month of September, all amidst alternating risk appetite trends on Thursday.
Indeed, the release of inflation figures has grown in importance since the last FOMC event on the back of the data-dependent stance from the Federal Reserve and its direct impact on the size and timing of the next interest rate hikes.
Other than the September’s CPI, the usual weekly Initial Claims are due along with the EIA’s report on US crude oil supplies in the week to October 7.
What to look for around USD
The rally in the dollar appears to have met some decent hurdle in the 113.60 region so far this week.
In the meantime, the firmer conviction of the Federal Reserve to keep hiking rates until inflation looks well under control regardless of a likely slowdown in the economic activity and some loss of momentum in the labour market continues to prop up the underlying positive tone in the index.
Looking at the more macro scenario, the greenback also appears bolstered by the Fed’s divergence vs. most of its G10 peers in combination with bouts of geopolitical effervescence and occasional re-emergence of risk aversion.
Key events in the US this week: Inflation Rate, Initial Jobless Claims (Thursday) – Retail Sales, Flash Michigan Consumer Sentiment, Business Inventories (Friday).
Eminent issues on the back boiler: Hard/soft/softish? landing of the US economy. Prospects for further rate hikes by the Federal Reserve vs. speculation of a recession in the next months. Geopolitical effervescence vs. Russia and China. US-China persistent trade conflict.
USD Index relevant levels
Now, the index is gaining 0.07% at 113.34 and faces the next up barrier at 113.59 (monthly high October 12) followed by 114.76 (2022 high September 28) and then 115.32 (May 2002 high). On the other hand, the breakdown of 110.05 (weekly low October 4) would open the door to 109.35 (weekly low September 20) and finally 107.68 (monthly low September 13).
-
09:17
USD/CAD sticks to modest gains above 1.3800 mark, eyes US CPI for fresh impetus
- USD/CAD trims a part of its modest intraday gains, though the downside remains cushioned.
- A goodish bounce in crude oil prices underpins the loonie and acts as a headwind for the pair.
- Aggressive Fed rate hike bets continue to lend support as traders await the key US CPI report.
The USD/CAD pair struggles to capitalize on its modest intraday uptick and retreats a few pips from the daily high touched during the early European session. Spot prices, however, manage to hold above the 1.3800 round-figure mark as investors prefer to stay on the sidelines and brace for the crucial US consumer inflation figures.
In the meantime, a goodish recovery in crude oil prices seems to underpin the commodity-linked loonie and acts as a tailwind for the USD/CAD pair. The fundamental backdrop, however, still seems tilted in favour of bullish traders and supports prospects for an extension of the recent rally from the 1.3500 psychological mark. Hence, any meaningful pullback might still be seen as a buying opportunity and is more likely to remain limited.
Investors remain worried that a deeper global economic downturn and a resurgence in COVID-19 cases in China will hurt fuel demand. In fact, OPEC on Wednesday lowered its global oil demand growth estimates for both 2022 and 2023. This, to a larger extent, overshadows the initial enthusiasm over the OPEC+ decision last week to slash production by the most since the 2020 COVID pandemic and should cap any meaningful recovery for the black liquid.
The US dollar, on the other hand, is seen consolidating its recent gains recorded over the past week or so, though remains well supported by more hawkish cues from the Federal Reserve. In fact, the minutes from the last FOMC meeting on September 20-21 released on Wednesday showed that officials remain committed to raising interest rates to curb inflation. Hence, the focus remains glued to the crucial US CPI report, due later during the early North American session.
Given that US Producer Price Index climbed more than expected in September, investors anticipate consumer inflation to remain stubbornly high and reinforce the Fed's hawkish rhetoric. This, in turn, favours the USD bulls and adds credence to the near-term positive outlook for the USD/CAD pair. That said, repeated failures to make it through the 1.3840-1.3850 supply zone warrant some caution before positioning for any further appreciating move.
Technical levels to watch
-
09:10
WTI eases from daily highs near $87 on IEA’s oil market report
In its latest oil market report, the International Energy Agency (IEA) said that OPEC+ cuts will sharply reduce a much-needed build in global oil stocks.
Additional takeaways
Russian oil exports fell by 230,000 bpd to 7.5 mln bpd in September, down 560,000 bpd from pre-war levels.
OECD industry stocks were 243 million barrels below the five-year average at the end of august at 2.736 billion barrels.
Reduces oil demand growth outlook for 2023 to 1.7 mln bpd, down by 470,000 bpd from last estimate.
New OPEC+ cuts derailed the growth trajectory of oil supply this year and next.
Actual decline in OPEC+ supply will be around 1 million bpd from November.
Higher oil prices may prove a tipping point for global economy already on brink of recession.
World oil demand will contract by 340,000 bpd year-on-year in Q422
Reduces oil demand growth outlook for 2022 to 1.9 mln bpd, down by 60,000 bpd from last estimate.
World is struggling to navigate the worst global energy crisis in history.
Economic deterioration, higher prices sparked by opec+ supply cuts are slowing world oil demand.
Market reaction
WTI is retreating from daily highs of $86.86 on IEA’s gloomy outlook on global oil demand. The US oil is trading at $86.57, still adding 0.70% on the day.
-
09:06
USD Index to test 115 on higher-than-expected US core CPI – ING
Today's US September Consumer Price Index (CPI) release should again be a major market mover. In any case, the US dollar is set to stay supported, in the opinion of economists at ING.
September CPI to prove a major market mover
“All eyes will be on the core measures. Consensus expects 0.4% month-on-month, taking the core year-on-year back to the 6.5% cycle high. While any sub-consensus number could see the dollar briefly dip, we doubt it would alter expectations that the Fed hikes 75 bps in early November and dollar weakness should prove temporary. An above consensus number should send the dollar back to the highs and sink both Treasuries (already softened by the Gilt debacle) and global equity markets.”
“DXY losses are limited to the 111/112 area on a soft CPI print and test 115 on any above consensus number.”
See – US CPI Preview: Forecasts from 10 major banks, price pressure easing only very slowly
-
08:57
NZD/USD: Further retracement should meet support at 0.5535 – UOB
Extra weakness in NZD/USD is expected to face a solid contention at 0.5535 in the near term, suggest UOB Group’s Markets Strategist Quek Ser Leang and Senior FX Strategist Peter Chia.
Key Quotes
24-hour view: “NZD traded sideways within a range of 0.5561/0.5626 yesterday before closing at 0.5608 (+0.46%). The underlying tone has firmed somewhat and NZD could edge higher. However, any advance is unlikely to break the resistance at 0.5660. Support is at 0.5585 but only a breach of 0.5560 would indicate that the current mild upward pressure has eased.”
Next 1-3 weeks: “Despite dropping to a fresh year’s low of 0.5561 earlier this week, downward momentum is not strong. However, as long as the ‘strong resistance’ at 0.5700 is not breached, NZD could weaken further. That said, any further decline is expected to face solid support at 0.5535. To look at it another way, NZD has to break clearly below 0.5535 before further sustained weakness is likely.”
-
08:57
Coronavirus Update: Shanghai reimposes strict measures as cases rise
The Financial Times (FT) is reporting on Thursday, half of Shanghai districts will be under lockdown this weekend to test millions of residents after signs emerged of renewed community transmission of coronavirus.
This comes after China’s financial hub reported 11 new infections on Thursday. The strict measures will affect eight of Shanghai’s 16 districts, including Pudong, one of the worst-hit areas at the start of the lockdown, the FT said.
Meanwhile, Beijing is also on high alert after a cluster of cases was detected in Chaoyang on Thursday.
Market reaction
The discouraging news from China seems to have little to no impact on risk sentiment so far, as the S&P 500 futures see a 0.20% gain while the AUD/USD pair is re-approaching 0.6300, at the time of writing.
-
08:54
EUR/CHF to move lower toward 0.93 over the coming months – Danske Bank
EUR/CHF has traded fairly volatile, most recently moving back up to 0.97. Nonetheless, economists at Danske Bank expect the pair to edge lower toward 0.93 over the coming months.
Swiss National Bank to hike by 75 basis points in December
“We expect the SNB to hike by 75 bps in December to curtail underlying inflation pressures bringing the policy rate to 1.25%. With the SNB broadly following the ECB, we see relative rates as an inferior driver for the cross.”
“We continue to forecast the cross to move lower on the back of fundamentals and a tighter global investment environment.”
“We continue to forecast EUR/CHF at 0.93 in 12M.”
-
08:44
GBP/JPY remains depressed near daily low, lacks follow-through selling
- GBP/JPY struggles to capitalize on the previous day’s strong move up to the weekly high.
- A combination of factors offers support to the safe-haven JPY and exerts some pressure.
- Confusion over the BoE’s emergency bond-buying program weighs on the British pound.
- The BoJ-BoE policy divergence warrants caution before placing aggressive bearish bets.
The GBP/JPY cross attracts fresh selling near the 100-day SMA barrier on Thursday and reverses a part of the previous day's strong move up to the weekly high. The cross maintains its offered tone through the early European session and is currently hovering near the daily low, just above the mid-162.00s.
Speculations for more currency market intervention by Japanese authorities, along with the prevalent cautious market mood, help ease the recent bearish pressure surrounding the Japanese yen. This, in turn, is seen as a key factor exerting some downward pressure on the GBP/JPY cross. Japan's Finance Minister Shunichi Suzuki reiterated earlier this week that the government stands ready to intervene and respond appropriately to excess FX moves.
Moreover, Bank of Japan BoJ Governor Haruhiko Kuroda said on Wednesday that the government intervention last month to stop one-sided depreciating moves in JPY was quite appropriate. Meanwhile, the market sentiment remains fragile amid concerns about economic headwinds stemming from rapidly rising borrowing costs and geopolitical risks. Apart from this, a resurgence of COVID-19 cases in China fuels recession fears and tempers investors’ appetite for riskier assets.
The British pound, on the other hand, is pressured by the fact that the Bank of England could end its program of temporary gilt purchases on October 14 and concerns about the UK government's fiscal plans. The new UK government said that it would not reverse its vast tax cuts or reduce public spending. That said, speculations for a full 100 bps rate hike by the UK central bank offer some support to sterling and could limit losses for the GBP/JPY cross.
Adding to this, a big divergence in the policy stance adopted by BoJ (dovish) and other major central banks (hawkish) could lend support to the GBP/JPY cross. In fact, the Japanese central bank has shown no inclination to hike interest rates and remains committed to continuing with its monetary easing. Furthermore, Japan's Prime Minister Fumio Kishida said that the BoJ needs to stick to its ultra-lose policy until wages rise, warranting caution for bearish traders.
Technical levels to watch
-
08:39
UK’s Cleverly: We are seeing the start of the improvements in bond markets
UK Foreign Secretary James Cleverly said on Thursday, “we are seeing the start of the improvements in bond markets.”
Additional quotes
“We are going to stick with the plan to grow the economy.”
“Changing the leadership would be a disastrously bad idea.”
Market reaction
Despite renewed US dollar strength, GBP/USD is catching a fresh bid on the above comments, currently trading at 1.1089, still down 0.11% on the day.
-
08:35
USD to extend its rally for the rest of the year before pulling back in 2023 – DBS Bank
Economists at DBS Bank see the US dollar extending its uptrend into the end of the year before consolidating in 2023.
USD to stay strong for the rest of the year
“The Federal Reserve’s continued rate hikes should keep the US dollar strong for the rest of 2022.”
“Expected peak and pause in the Fed hike cycle in 2023 could cool USD, barring financial stress and a hard landing.”
See – Fed: Key interest rate to peak at 5.00% in Q1 2023 – Commerzbank
-
08:21
GBP/USD set to challenge the 1.0350 low again – Credit Suisse
GBP/USD remains up 6% from its all-time lows at 1.0350 set last month. The pair retains a noteworthy fragility which threatens a quick return to test those lows again, economists at Credit Suisse report.
UK monetary and fiscal policy are working at cross purposes
“UK monetary and fiscal policy are working at cross purposes and that the scope for mistakes that create chaos is great, given the sheer number of actors that need to work seamlessly together to prevent renewed mayhem.”
“We set our GBP/USD Q4 range target at 1.0350-1.1400 and we continue to expect a move to the lower end of the range.”
-
08:01
Fed: Key interest rate to peak at 5.00% in Q1 2023 – Commerzbank
The Federal Reserve in September raised key interest rates by 75 basis points for the third time in a row. The upper bound of the target corridor now stands at 3.25%. The Fed is expected to raise it to 5.0% by the end of the first quarter, according to economists at Commerzbank.
Fed is stepping on the brakes hard
“We expect another big 75 bps rate hike at the meeting in early November. By the end of the year, the key interest rate should stand at 4.50% and peak at 5.00% in the first quarter of 2023. We have thus raised our forecasts for the fed funds terminal rate.”
“Despite the recession expected in the US in the first half of 2023, the Fed is likely to be reluctant to cut key rates again quickly due to stubborn inflation. We do not expect this until towards the end of 2023.”
-
07:58
AUD/USD sellers ignore Wednesday’s Doji to aim for 0.6215 ahead of US CPI
- AUD/USD takes offers to reverse the previous day’s bounce off yearly low.
- Firmer yields, risk aversion exert downside pressure during pre-data anxiety.
- Grim headlines from China, hawkish Fedspeak and downbeat Aussie data please sellers.
- US inflation numbers may add strength to the bearish bias unless missing forecasts with wide margins.
AUD/USD remains depressed around 0.6270, mildly offered of late, as European traders brace for Thursday’s inflation data. In doing so, the Aussie pair portrays the market’s cautious mood while also ignoring the bullish candlestick formation at the multi-month low marked the previous day.
Talking about the negatives, fresh lockdowns in Shanghai and Hong Kong’s determination to keep the covid-linked entry barrier intact weigh on the AUD/USD prices due to Australia’s trade ties with China. On the same line are fears of an energy crisis in the Eurozone due to the latest gas pipeline leak from Russia to Germany.
A pause in the heading Treasury yields, after a two-day downtrend, also seems to underpin the AUD/USD weakness, via the US dollar strength. Additionally, downbeat prints of Australia’s Consumer Inflation Expectations for October, to 5.4% from 5.8% prior, also offer extra negative for the Aussie pair. US restrictions on doing business with Chinese chipmakers and fears of economic slowdown in Beijing also lure the bears of late.
It should be noted that the recently softer US inflation expectations and a retreat in the hawkish Fed bets seem to challenge the pair sellers. Further, talks that China’s state authorities are buying houses as a part of the stimulus also should have put a floor under the AUD/USD pair.
Above all, the market’s cautious mood before the US Consumer Price Index (CPI) seems to help the AUD/USD pair in grinding lower. That said, forecasts suggest that the headline US CPI is expected to ease to 8.1% YoY versus 8.3% prior. However, the more important CPI ex Food & Energy is likely to increase to 6.5% YoY from 6.3% prior and can favor more downside of the AUD/USD pair.
Technical analysis
Although Wednesday’s Doji near the 31-month low joins the oversold RSI (14) to challenge AUD/USD bears, a five-week-old bearish trend channel keeps the sellers hopeful. With this, the Aussie pair is gradually rushing towards the March 2020 low surrounding 0.6215.
-
07:55
Gold Price Forecast: XAU/USD trades with modest losses as investors look to US CPI report
- Gold comes under renewed selling pressure on Thursday amid more hawkish cues from the Fed.
- Aggressive Fed rate hike bets remain supportive of elevated US bond yields and exert pressure.
- Subdued USD price action, recession fears could offer some support ahead of the US CPI report.
Gold struggles to capitalize on the previous day's recovery move from the $1,660 support zone and meets with a fresh supply on Thursday. The XAU/USD remains depressed through the early European session and is currently placed near the daily low, just below the $1,670 level.
More hawkish signals from the Federal Reserve remain supportive of elevated US Treasury bond yields and continue to act as a headwind for the non-yielding gold. In fact, minutes of the FOMC policy meeting on September 20-21, released on Wednesday, showed that policymakers unanimously agreed to push monetary policy into restrictive territory. Moreover, officials remain committed to keeping interest rates high for a longer period as the central bank struggles to bring down inflation.
Hence, the focus will remain glued to the crucial US CPI report, due for release later during the early North American session. Given that US Producer Price Index climbed more than expected in September, investors anticipate consumer inflation to remain stubbornly high and reinforce the Fed's hawkish rhetoric. Nevertheless, the key US inflation figures will influence the size of the US central bank's next interest rate hike and provide a fresh directional impetus to gold.
In the meantime, subdued US dollar price action could offer support to the dollar-denominated gold amid a relatively quiet trading action. Furthermore, concerns about economic headwinds stemming from rapidly rising borrowing costs, geopolitical risks and a resurgence of COVID-19 cases in China warrants caution for aggressive bearish traders. Hence, it will be prudent to wait for strong follow-through selling below the $1,660 level before positioning for some meaningful downside.
Technical levels to watch
-
07:50
ECB to raise deposit rate to 3% – Commerzbank
At its meeting on 8 September, the European Central Bank (ECB) decided to raise its three key interest rates by 75 basis points (the deposit rate is now 0.75%). Economists at Commerzbank continue to expect it to raise its deposit rate to 3.0% by March next year.
ECB to pause the rate hike process in spring
“We expect the ECB to raise its deposit rate to 3% by the first quarter of next year. Signals from the ECB that it wants to reach the neutral interest rate by the end of the year (which it now probably sees at 2%) and is prepared to go beyond it thereafter speak in favour of noticeable rate hikes in the near future. This willingness is likely to increase in the coming months because the central bank is likely to raise its inflation projection noticeably.”
“From next spring, the ECB is likely to suspend the interest rate hike process for roughly one year, since on the one hand the recession expected by many should then be clearly visible in the GDP data and on the other hand the deposit rate at 3% should be noticeably above the neutral level from the ECB's point of view.”
-
07:49
Forex Today: Dollar stays quiet as focus shifts to US inflation report
Here is what you need to know on Thursday, October 13:
Following Wednesday's choppy market action, the greenback stays quiet early Thursday. Ahead of the US Bureau of Labor Statistics' highly-anticipated Consumer Price Index (CPI) data for September, the US Dollar Index fluctuates in a tight range above 113.00. The US stock index futures trade unchanged on the day and the 10-year US Treasury bond yield holds steady below 4%. Investors will also keep a close eye on the UK gilt markets as the Bank of England (BoE) nears the planned end of its emergency gilt purchase programme.
US CPI Preview: High expectations may trigger a dollar-buying opportunity, three scenarios.
The annual CPI in the US is expected to decline to 8.1% in September from 8.3% in August. The Core CPI, which excludes volatile food and energy prices, is forecast to rise to 6.5% from 6.3%. Meanwhile, the CME Group's FedWatch Tool shows that markets are pricing in an 81.3% probability of one more 75 basis points rate hike in November.
US September CPI Preview: Monthly core inflation is the figure to watch.
The BoE will conclude its emergency gilt-buying programme on Friday as planned. On Thursday, the bank accepted 1.96 billion and 2.37 billion pounds of offers in index-linked and long-dated gilt purchases, respectively. Bank of England Chief Economist Huw Pill said that significant policy response will still be required in November and the British pound preserved its strength. GBP/USD gained more than 150 pips on Wednesday and snapped a five-day losing streak. Meanwhile, Bloomberg reported that Chancellor of the Exchequer Kwasi Kwarteng would blame the BoE in case gilt yields surge next week. As of writing, GBP/USD was trading in negative territory at around 1.1070.
European Central Bank (ECB) President Christine Lagarde announced on Wednesday that the discussions on quantitative tightening have started but noted that the interest rate is still their primary policy tool. EUR/USD struggled to make a decisive move in either direction on Wednesday and continues to move sideways near 0.9700 early Thursday. The data from Germany showed that the annual CPI was 10% in September, matching the flash estimate and the market expectation.
USD/JPY surpassed the level that triggered the currency intervention in late September and climbed to a fresh multi-decade high at 147.00 before going into a consolidation phase below that level. Japanese Finance Minister Shunichi Suzuki, once again, said that they are ready to take action against speculative yen moves.
Crude oil prices fell for the third straight day on Wednesday and the barrel of West Texas Intermediate (WTI) touched its lowest level in a week at $86.25 amid renewed concerns over the oil demand outlook. WTI stays calm at around $87 in the early European morning.
Gold closed in positive territory amid sliding US yields on Wednesday but failed to carry its bullish momentum over to Thursday. At the time of press, XAU/USD was posting small daily losses slightly below $1,670.
Bitcoin extends its sideways grind into a third straight day and trades near $19,000. Ethereum failed to stage a convincing rebound on Wednesday and dropped below $1,300 early Thursday.
-
07:48
FX option expiries for Oct 13 NY cut
FX option expiries for Oct 13 NY cut at 10:00 Eastern Time, via DTCC, can be found below.
- EUR/USD: EUR amounts
- 0.9610-15 865m
- 0.9640-50 1.22b
- 0.9695-05 731m
- 0.9735-55 1.04b
- 0.9800 763m
- 0.9820 305m
- 0.9850 2.2b
- 0.9880 541m
- 0.9900 1.6b
- GBP/USD: GBP amounts
- 1.1150 274m
- 1.1250 365m
- USD/JPY: USD amounts
- 144.95-00 320m
- 146.00 516m
- 146.25 410m
- 147.25 1.9b
- 147.50 305m
- 148.00 397m
- USD/CAD: USD amounts
- 1.3800 475m
- EUR/GBP: EUR amounts
- 0.8750 834m
- 0.8925 497m
- EUR/CHF: EUR amounts
- 0.9600 281m
-
07:40
Gold Price Forecast: XAU/USD downside bias remains intact heading into US CPI
Gold price is reversing the previous rebound. As FXStreet’s Dhwani Mehta notes, XAU/USD looks south amid a bearish daily technical setup heading into the US inflation release.
XAU/USD bears eye $1,650 on US Core inflation beat
“The 14-day Relative Strength Index (RSI) in pointing lower below the 50.00 level, suggesting that there is more room to the downside. Lower highs made on the said timeframe so far this week, also add credence to the negative outlook.”
“Sellers eye a sustained break below the $1,660 demand area on a bigger-than-expected increase in the US Core CPI. The $1,650 psychological level will be threatened thereafter. The September 29 low of $1,642 will be next on sellers’ radars.”
“Bulls need a daily closing above the 21-Daily Moving Average (DMA) at $1,673. to negate the bearish momentum in the near term. The next relevant barrier is seen at the previous day’s high of $1,678, above which the $1,700 mark will be back in the picture.”
See – US CPI Preview: Forecasts from 10 major banks, price pressure easing only very slowly
-
07:36
EUR/USD: No upside potential for the time being – Commerzbank
EUR/USD points downward in the short-term. The euro should only start to recover when investors increasingly bet on an end to the crisis next year, economists at Commerzbank report.
ECB rate hikes continue to lag those of the Fed
“The determined tightening of monetary policy and the astonishingly robust US economy make the US dollar the favorite currency of international investors.”
“For the euro, downside risks still dominate for the time being: ECB rate hikes continue to lag those of the Fed. The ECB is perceived as less determined in the fight against inflation. This tends to weigh on the euro. In addition, the energy crisis will remain a burdening factor for the euro in the coming months.”
“For 2023, we expect EUR/USD to rally as the energy crisis is priced out and the euro area growth outlook brightens. In addition, the Fed is likely to cut its interest rates slightly again after all due to the US recession, which would further close the gap between monetary policies.”
-
07:36
EUR/JPY Price Analysis: 61.8% golden ratio challenges upside momentum
- EUR/JPY grinds higher after confirming a bullish chart pattern.
- Firmer RSI adds strength to the upside bias but 61.8% Fibonacci Retracement level probes buyers.
- Double tops around 144.00 appear the key hurdle, sellers need to break 141.70 to retake control.
EUR/JPY remains sidelined, recently taking offers, while printing mild losses around 142.40 during early Thursday in Europe.
The cross-currency pair confirmed the bullish triangle breakout the previous day but the 61.8% Fibonacci retracement level of September 12-26 downside, around 142.50, challenges the quote’s immediate upside.
Even so, the firmer RSI (14) and successful trading above the 200-SMA keep the EUR/JPY buyers hopeful unless the quote stays beyond the 141.70 support confluence, including the stated triangle upper line and the 200-SMA.
It should be noted that a two-week-old support line, forming part of the triangle, also acts as a short-term key challenge to the EUR/JPY bears, around 141.00 by the press time.
Meanwhile, the pair’s sustained trading above the key Fibonacci retracement level, also known as the golden ratio, will help the buyers to aim for the double tops marked during late September around 144.00.
During the run-up, the October 06 swing high near 143.45 can act as a buffer while the previous monthly high near 145.65 could lure the bulls past 144.00.
EUR/JPY: Four-hour chart
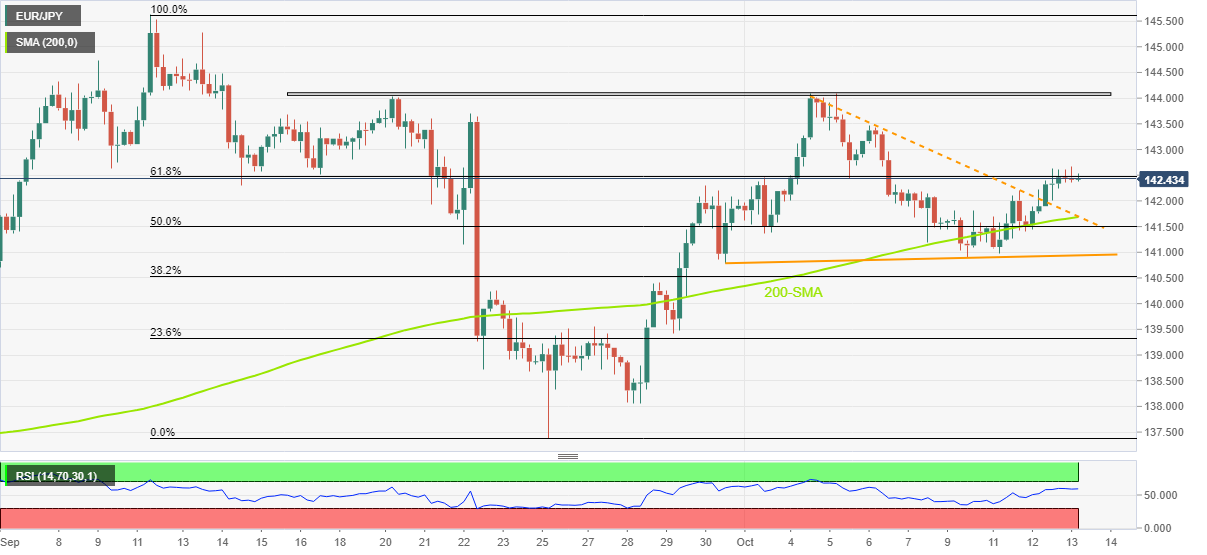
Trend: Further upside expected
-
07:30
UK to see a 2% fall in GDP from peak to trough – Nomura
UK economic output was weaker than expected, falling by 0.3% month-on-month in August and taking GDP to its lowest level since the end of last year. In the opinion of economists at Nomura, the third quarter is set to mark the start of the UK’s recession.
Further GDP decline looks likely in September
“With output likely to have been weakened materially in September on account of the additional bank holiday for the Queen’s funeral, another negative print in September would mean a chunky fall in GDP during the quarter as a whole.
“The longer market volatility remains, the greater the risk that this pulls output down further, and that ultimately means the recession could end up being worse, due to a combination of higher interest rates facing the real economy and weaker sentiment (we currently foresee a 2% fall in GDP from peak to trough).”
See: No sustainable GBP recovery in sight – Commerzbank
-
07:30
Switzerland Producer and Import Prices (YoY) came in at 5.4%, above expectations (4.6%) in September
-
07:30
Switzerland Producer and Import Prices (MoM) came in at 0.2% below forecasts (0.5%) in September
-
07:24
No sustainable GBP recovery in sight – Commerzbank
On Thursday, GBP/USD grinds lower. Economists at Commerzbank expect the pair to stay offered.
Bank of England’s fight against inflation is being undermined
“Without Downing Street back-paddling I find it difficult to imagine how sterling should recover on a sustainable basis. Comments by the Business Secretary that the central bank was to blame for the recent collapse of sterling rather than the government as it had been too slow to hike interest rates, don’t provide much reason for optimism in this respect. The same applies to comments by Chancellor of the Exchequer Kwasi Kwarteng, who sees potential market turmoil after the end of the BoE's emergency purchase program as the responsibility of the central bank.”
“This does not bode well for the British currency as long as the market questions the sustainability of the government’s plans the gilt markets are likely to remain under pressure with the BoE having to clear up the mess. That in turn means that the central bank’s fight against inflation is being undermined, which then points towards a weaker currency.”
-
07:17
EUR/USD steadies near 0.9700 as German Inflation matches initial forecasts, US CPI eyed
- EUR/USD pares recent losses as Germany confirms 10.9% HICP for September.
- Firmer yields jostle with hawkish comments from Fed, ECB policymakers to challenge traders.
- FOMC Minutes showed policymakers’ support for further rate hikes, ECB discusses QT.
- US CPI can lure pair sellers even if the headline figures soften a bit.
EUR/USD remains sidelined around 0.9700, recently picking up bids, even as Germany’s inflation numbers match upbeat forecasts during early Thursday. In doing so, the major currency pair portrays the pre-data trading lull as traders await the US Consumer Price Index (CPI) figures for September.
Germany’s latest headline inflation numbers, namely the CPI and the Harmonized Index of Consumer Prices (HICP), confirmed the initial forecasts of 10.0% and 10.9% respectively for September. With this, the fears of taming inflation in the bloc, while also taming the recession woes, take place among the European Central Bank (ECB) policymakers who recently sounded hawkish.
That said, European Central Bank (ECB) policymaker Klaas Knot said on Wednesday that they need a few more significant rate hikes before reaching neutral territory and noted that the terminal rate in the eurozone is lower than in the US, per Reuters. Following that, ECB President Christine Lagarde said on Wednesday that the Governing Council has started discussions on quantitative tightening (QT), as reported by Reuters. ECB Lagarde, however, also mentioned that the interest rate is the most appropriate tool in current circumstances.
It should be noted that a leak in Russia’s Druzhba gas pipeline to Germany and Russian President Vladimir Putin’s blames on the Eurozone for the gas shortage challenge the EUR/USD buyers even if the ECB policymakers are too hawkish.
Elsewhere, the US 10-year, 2-year and 30-year Treasury yields all snap a two-day downtrend and restrict the US Dollar Index (DXY) moves ahead of the key US CPI data. Also favorable to the greenback is its haven demand, especially amid fresh covid woes from China and Europe, not to forget fears of looming UK markets’ collapse. Also favoring the DXY strength is the latest Fedspeak which is in agreement with the FOMC Meeting Minutes which mentioned that the policymakers are concerned about inflation and fear doing too little.
To sum up, EUR/USD portrays the market’s indecision ahead of the US inflation data. Forecasts suggest that the headline US CPI is expected to ease to 8.1% YoY versus 8.3% prior. However, the more important CPI ex Food & Energy is likely to increase to 6.5% YoY from 6.3% prior and can favor more downside of the pair. However, an absence of hawkish comments from the ECB should be there to ease the pair’s bearish run.
Technical analysis
Lower highs of the EUR/USD pair’s prices in the last three days join the sustained failures to cross the 5-DMA hurdle, around 0.9715, to favor the odds of breaking the three-week-old support near 0.9675.
-
07:16
EUR/USD: Strong US inflation data to open the door for a test of 0.95 – Credit Suisse
The focus is on the release of the US September Consumer Price Index (CPI). Economists at Credit Suisse expect the EUR/USD pair to test the 0.95 mark on strong inflation figures.
EUR/USD could test parity on soft data
“We can see core inflation print in line with what our economists expect taking this pricing somewhat closer to yet another 75 bps hike, and that leaves open the possibility of still more greenback strength. On the other hand, a ‘soft’ core number such as 0.2% MoM or below would arguably play well for another risk short squeeze and USD sell-off given that the market could respond to this by shifting in favour of only a 50 bps rate hike in November.”
“In EUR/USD terms, we see strong US inflation data opening the door for a move to test 0.9500 on the way to our Q4 range low expectation of 0.9200, while soft data risk another move to test parity and our strategic ‘sell zone’ in the 1.0000-1.0200 range.”
See – US CPI Preview: Forecasts from 10 major banks, price pressure easing only very slowly
-
07:11
Natural Gas Futures: Door open to further losses
Open interest in natural gas futures markets rose for the third straight session on Wednesday, this time by nearly 3K contracts according to preliminary readings from CME Group. Volume followed suit and went up by around 26.4K contracts after two daily pullbacks in a row.
Natural Gas risks a breach of $6.50
Wednesday’s downtick in prices of natural gas was on the back of increasing open interest and volume and allows for the continuation of the downside in the very near term at least. Against that, the commodity risks challenging the key support around the $6.50 zone per MMBtu in the short-term horizon.
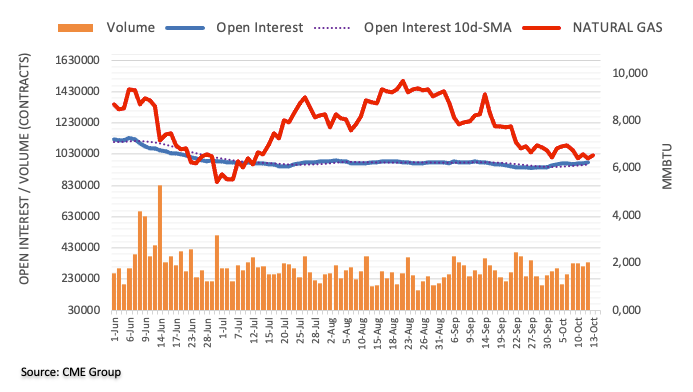
-
07:08
US CPI: Significantly higher number to give the greenback a further boost – Commerzbank
It is clear that today's upcoming September inflation data are the absolute data highlight. Economists at Commerzbank expect the US dollar to enjoy further gains.
An even stronger US dollar?
“I still see the risks on the side of a strong US currency. This is because current inflation levels (most recently 8.3% and 6.3% for core inflation) are so far away from the Fed's target that a decline would have to be dramatic for Fed officials to let up on their aggressive pace.”
“An only slightly lower than expected number should do little damage to the dollar. By contrast, a significantly higher number is likely to give the currency a further boost, as it increases the risk of inflation becoming entrenched at high levels – precisely what the Fed is trying to prevent, which would make rate hikes that are more pronounced than previously priced in more likely.”
See US CPI Preview: Forecasts from 10 major banks, price pressure easing only very slowly
-
07:06
USD/MYR: Ringgit to thrive next year after recent drop in crude palm oil – MUFG
Crude palm oil prices have swiftly retreated in recent months, due to oversupply and demand concerns. In Malaysia, this is likely to be offset by an import growth slowdown and tourism recovery. The crude palm oil outlook is hence slightly bearish for the ringgit, economists at MUFG Bank report.
Crude palm oil outlook very slightly MYR-negative
“The crude palm oil outlook is slightly bearish for the MYR. This is because of the fact that crude palm oil exports are likely to be a secondary driver to Malaysia’s current account dynamics. Tourism is expected to more than offset a slight reduction in the contribution to the current account balance.”
“We forecast some improvements in the MYR in 2023. After an expected 4.75 for USD/MYR at the end of 2022, we forecast it to head lower to 4.65 in Q2-2023 and 4.60 in Q3-2023.”
-
07:05
NZD/USD remains sideways above 0.5600 as volatility squeezes ahead of US Inflation
- NZD/USD is juggling above 0.5600 as the focus has shifted to the US inflation data.
- Investors are going light towards the US inflation event.
- Business NZ PMI is seen lower due to the extremely tight RBNZ policy.
The NZD/USD pair is displaying topsy-turvy moves in the early European session as investors have shifted sideways ahead of the US inflation. Considering the worth of September’s inflation report, investors are going light and will prefer to make an informed decision post-release. The risk profile has been muted as volatility has contracted dramatically.
Meanwhile, the 10-year US Treasury yields have blocked around 3.92% and the US dollar index (DXY) is barricaded into the chartered territory. The mighty DXY is hovering around the immediate hurdle of 113.30. Wednesday’s hawkish Federal Reserve (Fed) minutes and mixed Producer Price Index (PPI) data failed to fetch a power-pack action in the DXY.
The Fed minutes dictated that Fed policymakers are in favor of keeping the policy extremely tight as the achievement of price stability is the foremost priority. Also, the sustainability of the tight policy for a period is highly crucial until the price pressures decline for several months.
The consideration of US inflation projections indicates that the headline Consumer Price Index (CPI) will decline to 8.1% while the core CPI will land higher at 6.5%. Uncertainty over the US CPI data has reached the rooftop as it will provide lucidity over the likely monetary policy action by the Fed, scheduled for the first week of November.
On the kiwi front, investors are focusing on the Business NZ PMI data, which is due on Friday. The economic data is seen lower at 52.5 vs. the prior release of 54.9. It seems that the consequences of restrictive policy by the Reserve Bank of New Zealand (RBA) are playing out now as firms have postponed their expansion plans due to higher interest obligations. Apart from that, China’s CPI data will be keenly watched. As per the consensus, the annual CPI data will accelerate to 2.8%.
-
07:02
Germany Consumer Price Index (MoM) meets expectations (1.9%) in September
-
07:01
Sweden Consumer Price Index (MoM) registered at 1.4% above expectations (1.1%) in September
-
07:01
Germany Consumer Price Index (YoY) meets forecasts (10%) in September
-
07:01
Sweden Consumer Price Index (YoY) registered at 10.8% above expectations (10.5%) in September
-
07:01
Germany Harmonized Index of Consumer Prices (YoY) meets forecasts (10.9%) in September
-
07:01
Germany Harmonized Index of Consumer Prices (MoM) meets forecasts (2.2%) in September
-
06:49
WTI stays defensive above $86.00 despite supply crunch fears
- WTI crude oil price snap three-day downtrend but buyers appear confused.
- Saudi Arabia defends OPEC+ supply cuts, Druzhba pipeline leak recall gas flow interruptions to Germany.
- Chatters over oil price cap, China adds strength to the recovery moves but cautious sentiment challenge buyers.
- US CPI, EIA inventories eyed for fresh impulse.
WTI takes clues from the recent oil macros suggesting a supply crunch as it snaps a three-day losing streak with mild gains near $86.20 heading into Thursday’s European session.
Saudi Arabia rejects the latest US-led criticism of the Organization of the Petroleum Exporting Countries and allies including Russia, known collectively as OPEC+, supply cut agreement. The Saudi Arabian Foreign Ministry recently stated that the OPEC+ decision was unanimous, took into account the balance of supply and demand and aims at curbing market volatility.
Elsewhere, Bloomberg stated that US officials are concerned that Russia's oil cap will fail as a result of the OPEC+ cut. Earlier, US Treasury Secretary Janet Yellen said that “Russia could profitably sell oil at historical prices in the $60 / barrel range.”
It should be noted that a leak in Russia’s Druzhba gas pipeline to Germany and Russian President Vladimir Putin’s blames on the Eurozone for the gas shortage adds strength to the oil prices. On the same line were Chinese media chatters suggesting the government’s plan to buy houses as a part of the stimulus, which in turn might tame recession fears in the world’s largest commodity user.
However, China’s softer oil demand for this winter and the US Energy Department’s concerns that the oil demand and production are expected to grow more slowly than previously forecast for the remainder of this year and in 2023, per Reuters, seemed to have exerted downside pressure on the black gold.
Above all, fears of recession and the market’s cautious mood ahead of the US Consumer Price Index (CPI) for September appear to challenge oil prices despite the latest rebound.
Technical analysis
Despite the latest weakness, the 21-DMA puts a floor under the WTI prices at around $84.10.
-
06:38
Crude Oil Futures: Downside appears overdone
CME Group’s flash data for crude oil futures markets saw traders scale back their open interest positions by around 17.7K contracts on Wednesday. On the other hand, volume increased for the second session in a row, this time by nearly 111K contracts.
WTI: Next on the upside comes $93.00 and above
Prices of the WTI dropped for the third consecutive session on Wednesday. The downtick, however, was on the back of shrinking open interest, which hints at the idea that a deeper pullback seems not favoured for the time being. Bouts of strength, in the meantime, should target the October peak at $93.62 (October 10).
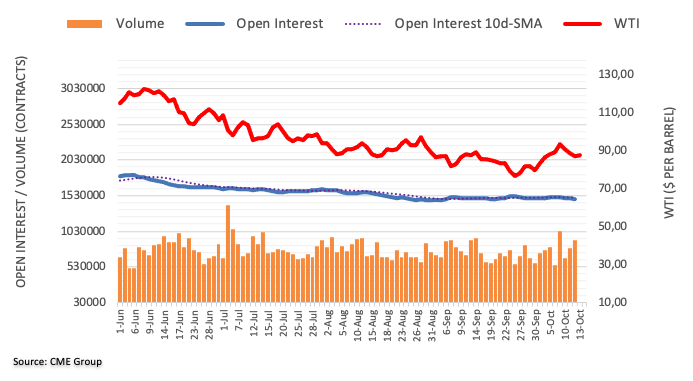
-
06:33
USD/CHF Price Analysis: Further downside hinges on 0.9970 break
- USD/CHF remains mildly offered inside immediate symmetrical triangle.
- Bearish divergence on RSI teases sellers but clear break of triangle appears necessary.
- Tops marked in June, May add to the upside filters.
USD/CHF prints mild losses around 0.9975-80 as bears flex muscles inside a three-day-old triangle formation ahead of Thursday’s European session.
That said, the lower high of prices join the lower tops on RSI (14) to portray the hidden bearish divergence, which in turn lures sellers. However, a clear downside break of the stated triangle’s support line, near 0.9970 by the press time, appears necessary for the USD/CHF bears to retake control.
Following that, 200-HMA and an upward-sloping support line from September 30, respectively near 0.9910 and 0.9880, will gain the trader’s attention.
It’s worth noting that the USD/CHF pair’s weakness past 0.9880 won’t hesitate to challenge the monthly low surrounding 0.9785.
Meanwhile, the pair’s successful trading beyond the 1.0000 parity level, also comprising the stated triangle’s resistance line, could propel the quote toward the monthly high near 1.0020.
Even so, tops marked in June and May, around 1.0050 and 1.0065 could challenge the USD/CHF bulls before directing them to the April 2019 peak of around 1.0240.
USD/CHF: Hourly chart
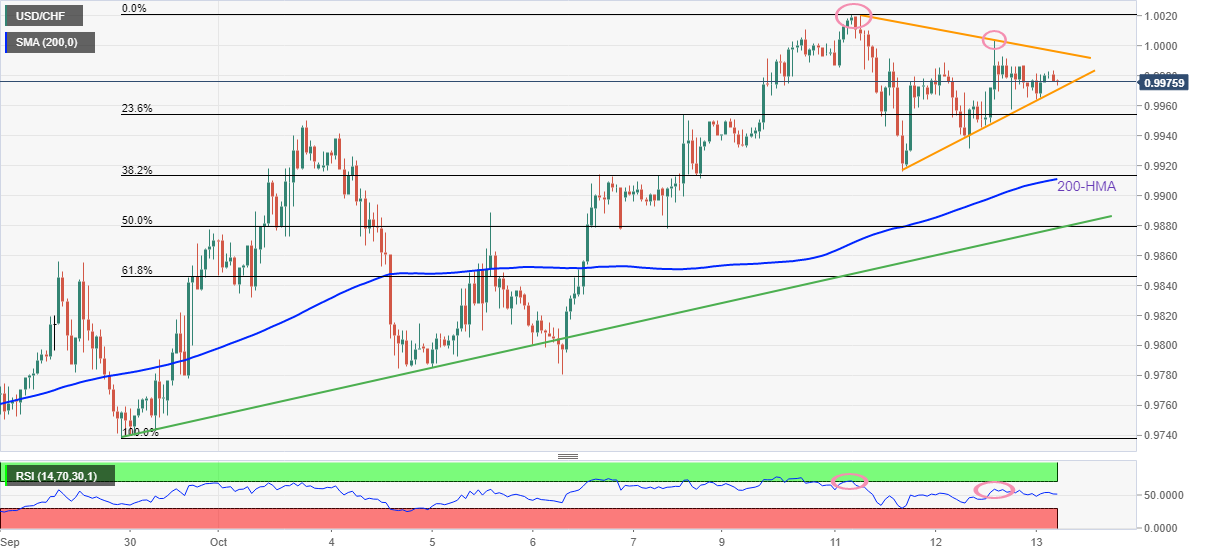
Trend: Further downside expected
-
06:26
GBP/USD: Solid support emerges at 1.0840 – UOB
In the opinion of UOB Group’s Markets Strategist Quek Ser Leang and Senior FX Strategist Peter Chia, GBP/USD risks further decline, although it faces a tough support at 1.0840.
Key Quotes
24-hour view: “GBP soared to a high of 1.1131 before closing on a strong note at 1.1099 (+1.25%). While the rapid rise appears to be running ahead of itself, GBP could test 1.1175 first before the risk of a pullback increases. For today, 1.1260 is unlikely to come into view. Support is at 1.1060, followed by 1.0990.”
Next 1-3 weeks: “The pullback from last week’s high of 1.1493 appears to be corrective in nature. While we do not rule out further declines in GBP, downward momentum is beginning to wane and the support at 10870 is unlikely to be broken. On the upside, a breach of 1.1280 (‘strong resistance’ level) would indicate that GBP is unlikely to weaken further.”
-
06:21
Gold Futures: Scope for extra gains
Considering advanced figures from CME Group for gold futures markets, open interest resumed the uptrend and went up by around 4.5K contracts on Wednesday. Volume, instead, reversed the previous daily build and shrank by around 38.2K contracts.
Gold remains supported by $1,660
Gold prices reversed a multi-session decline on Wednesday on the back of rising open interest, which is supportive of further rebound in the veery near term. In the meantime, the $1,660 region continues to underpin the yellow metal for the time being.
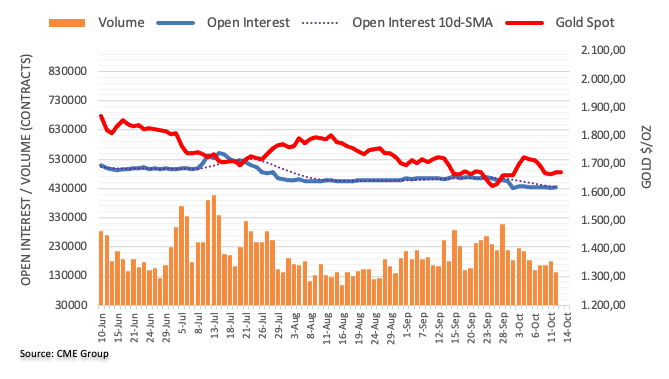
-
06:20
Asian Stock Market: Traces S&P500 losses ahead of US CPI, oil drops on gloomy outlook
- Asian indices are facing pressure as investors prefer to move light for the US inflation event.
- Rising odds of BOJ’s intervention in currency markets are hurting the sentiment of Japanese investors.
- Oil prices have sensed selling interest on escalating US recession fears.
Markets in the Asian domain are following the footprints of the S&P500 as escalating anxiety ahead of the US Consumer Price Index (CPI) release has forced investors to remain on the sidelines. Asian equities have witnessed a sell-off amid the risk-off impulse, citing gloomy growth outlook and signs of recession situation in the US economy responsible, apart from the Fed’s tight policy.
At the press time, Japan’s Nikkei225 dropped 0.48%, ChinaA50 tumbled 1.10%, Hang Seng dived 1.26% and Nifty50 declined 0.62%.
Accelerating odds of the Bank of Japan (BOJ)’s intervention in the currency markets is hurting the sentiment of Japan’s investors. Chatters over intervention are bolstering the fact that the Japanese yen could weaken further. This may hurt the firms which are highly dependent on other countries for raw materials.
Indian indices have taken a hit after a jump in inflationary pressures. Headline inflation for September has landed higher at 7.4% vs. the prior release of 7.0% while the core CPI has escalated to 6.1%. This will weigh pressure on the Reserve Bank of India (RBI) to hike interest rates further.
Meanwhile, the US dollar index (DXY) has continued with its lackluster performance ahead of the US CPI data. As per the consensus, the headline inflation data will decline to 8.1% while the core CPI that excludes oil and food prices will increase to 6.5%. No matter, if the inflation rate drops or accelerates, volatility will explode for sure as September’s inflation report shares the spotlight with the quarterly result season.
On the oil front, oil prices are sideways after dropping to near $85.00. Weakness is expected to persist in the oil prices as fears of a recession situation in the US economy have heightened. Also, commentary from US President Joe Biden that recession will be slight if US encounters don’t bar the recession fears.
-
06:07
GBP/USD: Mildly offered around 1.1080 amid looming collapse in UK markets, focus on US inflation
- GBP/USD grinds lower while paring the bounce off two-week low.
- UK Chancellor Kwarteng passes the buck to BOE if British markets collapse next week.
- Challenges to sentiment, hawkish Fed bets keep bears hopeful ahead of US CPI.
GBP/USD holds lower ground near 1.1080 heading into Thursday’s London open. In doing so, the Cable pair traders brace for the US inflation data while also fearing a collapse of the UK markets’, as recently highlighted by British Chancellor of the Exchequer Kwasi Kwarteng.
“Old Lady will be to blame if UK markets slide next week,” said UK’s Kwarteng early Thursday. The news joined firmer US Treasury yields and other risk-negative catalysts, especially relating to China and coronavirus, to weigh on the GBP/USD prices.
It should, however, be noted that the same exerts additional pressure on the BOE to announce a stronger rate hike that can be seen in the money market bets suggesting a full percentage rate lift by the BOE during the next monetary policy meeting. The same restricts the GBP/USD pair’s downside.
On the other hand, hawkish Fed bets join the pause in the US Treasury yields’ previous downside to underpin the US dollar’s recovery before the all-important US Consumer Price Index (CPI) data. That said, CME’s FedWatch Tool prints a nearly 81% chance of the Fed’s 75 bps rate hike in November.
Amid these plays, the US stock futures struggle to defend the early-day gains while the yields remain mildly positive but the US Dollar Index (DXY) remains sidelined as traders await the CPI numbers.
Forecasts suggest that the headline US CPI is expected to ease to 8.1% YoY versus 8.3% prior. However, the more important CPI ex Food & Energy is likely to increase to 6.5% YoY from 6.3% prior and can favor more downside of the GBP/USD pair.
Additionally, chatters surrounding the Bank of England’s (BOE) gilt buying program will also be important for immediate directions.
Also read: US September CPI Preview: Monthly core inflation is the figure to watch
Technical analysis
A 13-day-old horizontal support area near 1.0930-15 lures GBP/USD bears unless the quote stays successfully beyond the 21-DMA hurdle of 1.1155.
-
05:57
EUR/USD: Sustained losses expected below 0.9630 – UOB
UOB Group’s Markets Strategist Quek Ser Leang and Senior FX Strategist Peter Chia note further downside in EUR/USD is likely on a breach of 0.9630.
Key Quotes
24-hour view: “EUR traded in a relatively quiet manner between 0.9666 and 0.9734 before closing largely unchanged at 0.9704 (+0.01%). The price actions are likely part of a consolidation phase and EUR is likely to trade within a range of 0.9660/0.9770 for today.”
Next 1-3 weeks: “Despite the relatively sharp pullback from last week’s high of 0.9999, the decline in EUR lacks momentum. That said, the bias appears to be tilted to the downside but EUR has to break clearly below 0.9630 before a sustained decline can be expected. On the upside, a breach of 0.9820 (‘strong resistance’ level) would indicate the current mild downward pressure has eased.”
-
05:42
USD/INR Price News: Rupee bears ignore firmer India inflation near 82.30 on hawkish Fed bets
- USD/INR snaps three-day downtrend amid firmer yields, US dollar.
- Five-month high India inflation fails to push RBI hawks.
- US Dollar’s safe-haven demand, upbeat US fundamentals versus India favor pair buyers.
- Any disappointment from US CPI will have limited repercussions on DXY’s broad fundamental strength.
USD/INR picks up bids to 82.32 while paring the first weekly loss in four ahead of Thursday’s European session. In doing so, the Indian rupee (INR) pair traces firmer US Treasury yields ahead of the US inflation numbers for September.
Other than the pre-data anxiety, hawkish Fed bets and the recent Federal Open Market Committee (FOMC) Meeting Minutes, as well as the US data, could also be linked to the USD/INR pair’s run-up.
The latest Fed Minutes mentioned that the policymakers are concerned about inflation and fear doing too little. With this, the CME’s FedWatch Tool prints a nearly 85% chance of the Fed’s 75 bps rate hike in November.
On the other hand, the US action to increase hardships for Chinese chipmakers also propels the pair prices.
On the contrary, Chinese media chatters suggesting the government’s plan to buy houses as a part of the stimulus seemed to have put an immediate floor under the riskier assets, which in turn negatively affect the US dollar. Additionally, the softer US inflation expectations, as per the 10-year and 5-year breakeven inflation rates per the St. Louis Federal Reserve (FRED) data, also probe the greenback buyers.
At home, India's retail inflation accelerated in September to a five-month high of 7.41% year-on-year as food prices surged, raising fears of further interest-rate hikes when the central bank meets for its next policy review in December, reported Reuters on Wednesday. With this, the odds of the Reserve Bank of India's (RBI) 35 bps rate hike in December appear more lucrative. However, the volume of rate increase and the time distance portray a more hawkish scenario for the Fed than the RBI, which in turn favors the USD/INR bulls.
Moving on, USD/INR may portray a sideways to positive move ahead of the US CPI, expected to ease to 8.1% YoY versus 8.3% prior. However, the more important CPI ex Food & Energy is likely to increase to 6.5% YoY from 6.3% prior and can favor more upside considering the recession woes.
Technical analysis
One-month-old support line, around 82.15 by the press time, restricts short-term USD/INR downside amid bullish MACD signals.
-
05:35
USD/JPY hovers at a kissing distance of 147.00, investors’ anxiety soars ahead of US CPI
- USD/JPY oscillates near the 147.00 shore as the risk-off impulse is extremely quiet.
- Fed minutes and the money market have given a green signal for a third consecutive 75 bps rate hike.
- Apart from the US CPI, investors await fresh impetus on BOJ’s intervention plans.
The USD/JPY pair is displaying a lackluster performance in the Asian session as investors are awaiting the release of the US Consumer Price Index (CPI) data. The asset is oscillating in a narrow range of 146.67-146.90 and is expected to continue the rangebound performance. The risk profile is turning quiet amid the absence of volatility in the market.
The US dollar index (DXY) has recovered its morning losses and is attempting to extend its recovery above the day’s high at 113.35. The mighty DXY is expected to remain in the grip of bulls as odds for a fourth consecutive 75 basis points (bps) by the Federal Reserve (Fed) are escalating with sheer momentum. Money market bets indicate that the probability of a 75 bps rate hike announcement is 84%.
Wednesday’s keen-jerk reactions by the DXY were comfortably absorbed by the market participants after the release of the Fed policy minutes. Fed policymakers found favoring the continuation of the current pace of hiking interest rates to achieve the agenda of price stability. Also, reaching the targeted terminal rate and sticking to it for an uncertain period is critical to contain the mounting price pressures.
On the Tokyo front, odds for intervention in the currency market by the Bank of Japan (BOJ) are skyrocketing. The verdict has strengthened as Japanese Finance Minister Shunichi Suzuki said on Thursday that the government will take decisive action in the FX market if speculative moves are observed in the yen.
He further added that volatility is in the consideration of Japanese officials rather than a specific dollar/yen level.
Well, volatility in the asset cannot be ruled out as escalating anxiety ahead of the US inflation data will explode and wild moves will be witnessed by the market participants.
-
05:09
Gold Price Forecast: XAU/USD remains bearish towards $1,650 ahead of US inflation – Confluence Detector
- Gold price fades recovery from weekly low as multiple hurdles challenge XAU/USD bulls.
- Pre-even anxiety restricts immediate moves but hawkish Fed bets keep bears hopeful.
- US CPI could push the metal towards breaking $1,660 support convergence.
Gold price (XAU/USD) takes offers to renew intraday low as it reverses the previous day’s bounce off weekly low ahead of the key US Consumer Price Index (CPI). The metal’s latest weakness could be linked to the hawkish bias over the Fed’s next move, especially after the latest Federal Open Market Committee (FOMC) Meeting Minutes. Also exerting downside pressure on the bullion are the headlines surrounding China as the US escalates hardships for the chipmakers and Shanghai/Hong Kong hardens virus-led lockdowns. Alternatively, the pre-CPI trading lull joins China’s stimulus, via the housing market intervention, to restrict the XAU/USD downside.
That said, the recently firmer yields and hawkish Fed bets keep the bullion sellers hopeful amid hopes of fierce inflation woes ahead.
Also read: Gold Price Forecast: XAU/USD rebound appears lucrative above $1,660, US inflation in focus
Gold Price: Key levels to watch
The Technical Confluence Detector shows that the gold price has a smooth run towards the $1,660 key support that comprises the pivot point one-week S1, the previous day’s low and Fibonacci 38.2% one-month.
Minor support around $1,655 could then test the bear’s commitments as the support encompasses pivot point one-day S2 and the lower band of the Bollinger on 4H.
It’s worth noting that the metal’s weakness past $1,655 may not hesitate to challenge the yearly low of $1,615.
Alternatively, a convergence of the middle Bollinger and SMA100 on 4H guards immediate XAU/USD recovery near $1,674.
Following that, the previous yearly low near $1,678 holds the key to the gold price run-up towards the $1,690 hurdle including 10-DMA, pivot point one-day R2 and SMA200 on 4H.
Overall, gold price remains well below the key resistances and has a smooth run towards the south.
Here is how it looks on the tool
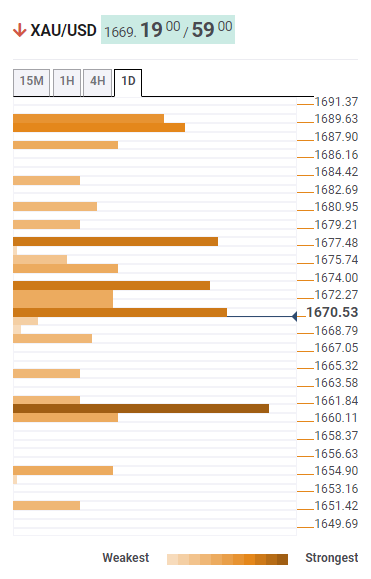
About Technical Confluences Detector
The TCD (Technical Confluences Detector) is a tool to locate and point out those price levels where there is a congestion of indicators, moving averages, Fibonacci levels, Pivot Points, etc. If you are a short-term trader, you will find entry points for counter-trend strategies and hunt a few points at a time. If you are a medium-to-long-term trader, this tool will allow you to know in advance the price levels where a medium-to-long-term trend may stop and rest, where to unwind positions, or where to increase your position size.
-
04:48
EUR/USD drops to near 0.9700 as DXY recovers, US CPI is in spotlight
- EUR/USD has slipped to near 0.9700 as a rebound in the risk-off impulse has weighed pressure.
- As per CME FedWatch tool, chances for a 75 bps rate hike have sky-rocketed to 84%.
- ECB policymaker is looking to exploit interest rates further to support quantitative tightening.
The EUR/USD pair has slipped to near 0.9700 after attempting to overstep the immediate hurdle of 0.9720 in the Tokyo session. The asset has sensed pressure as the US dollar index (DXY) has recovered its entire morning losses and is hovering around 113.30, at the press time. The risk-off impulse has regained traction as anxiety ahead of the US Consumer Price Index (CPI) data is accelerating dramatically.
Meanwhile, the 10-year US Treasury yields have rebounded after dropping to near 3.9%. Thursday’s Consumer Price Index (CPI) data carries utmost importance as August figures were better than projections.
September’s projections indicate a decline in the headline US CPI data to 8.1% while the core inflation rate could accelerate further to 6.5%. A higher-than-expected inflation report would bring extreme volatility in the risk-perceived currencies as it will bolster the chances of a hefty rate hike by the Federal Reserve (Fed).
As per the CME FedWatch tool, chances of a fourth consecutive 75 basis points (bps) rate hike by the Fed have scaled to 84%.
On Wednesday, the minutes of the Fed meeting were loud and clear that bringing price stability is the topmost priority even at the cost of a tight labor market.
Meanwhile, the shared currency bulls have failed to capitalize on hawkish commentary from European Central Bank (ECB) President Christine Lagarde. ECB policymaker stated that the Governing Council is having discussions on Quantitative Tightening (QE) and interest rate is the most appropriate tool in current circumstances.
-
04:45
Japan’s Suzuki: Ready to take action against speculative yen moves
Japanese Finance Minister Shunichi Suzuki said on Thursday, the government will take decisive action in the FX market if speculative moves were seen in the yen.
Key quotes
Will take decisive action if speculative FX moves.
We are focusing on FX volatility rather than a specific dollar/yen level.
We're not looking at levels but volatility when asked about what triggers intervention.
Separately, a Japanese finance ministry official said that it is “desirable for currencies to move stably reflecting economic fundamentals.
Market reaction
USD/JPY is little changed, trading at around 146.85, at the time of writing.
-
04:16
AUD/USD Price Analysis: Aussie bulls meet offers as risk-off impulse rebounds
- A descending triangle formation indicates a volatility contraction in the asset.
- Aussie bulls have failed to keep the asset above the 20-and 50EMAs.
- The downside break of the chart pattern could drag the asset below the psychological support of 0.6000.
The AUD/USD pair has sensed selling pressure while attempting to test Wednesday’s high at 0.6300 in the Tokyo session. The pullback move in the asset has terminated as the risk-off impulse has rebounded amid soaring anxiety ahead of the US Consumer Price Index (CPI). Meanwhile, the US dollar index (DXY) has recovered its morning losses.
On an hourly scale, the asset is auctioning in a descending triangle chart pattern that indicates volatility contraction followed by wider ticks and heavy volume after an explosion. The horizontal support of the chart pattern is plotted from Tuesday’s low at 0.6247. While the downward-sloping trendline is placed from Tuesday’s high at 0.6346.
The antipodean has failed to keep the asset above the 20-and 50-period Exponential Moving Averages (EMAs) at 0.6274 and 0.6282 respectively.
Meanwhile, the Relative Strength Index (RSI) (14) is oscillating in a 40.00-60.00 range and has faced barricades while overstepping 60.00.
A downside break of Wednesday’s low at 0.6240 will drag the asset toward the round-level support at 0.6200 followed by April 2020 low at 0.5991.
On the flip side, a decisive break above October 4 high at 0.6548 will drive the asset toward the round-level resistance at 0.6600. A breach of the latter will expose the asset to smash the 50-EMA at 0.6661.
AUD/USD hourly chart
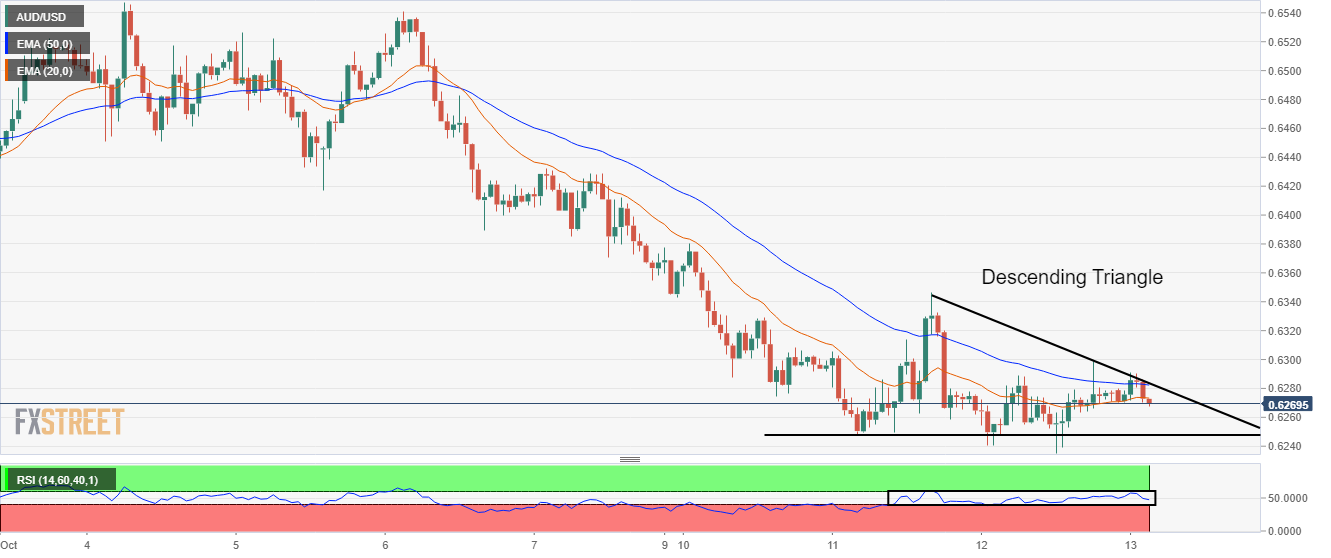
-
03:54
Silver Price Analysis: XAG/USD bears approach six-week-old support below $19.00
- Silver price remains downbeat around two-week low, prints five-day losing streak.
- MACD prints the strongest bearish signals, sustained break of 50-DMA adds strength to the downside bias.
- Multiple hurdle to the north challenge hopes for XAG/USD recovery.
Silver price (XAG/USD) stays on the bear’s radar during the five-day downtrend as it flirts with the $19.00 mark during Thursday’s Asian session. In doing so, the bright metal justifies the strongest bearish MACD signals since early September while extending Tuesday’s downside break of the 50-DMA.
With this, the XAG/USD bears are all set to challenge an upward-sloping support line from September 01, around $18.80.
However, a horizontal area comprising multiple lows marked since June, between $18.25 and $18.35, appears a tough nut to crack for the metal sellers afterward.
In a case where XAG/USD sellers break the $18.25 support, the odds of witnessing a slump towards the yearly low marked the last month, close to $17.55, can’t be ruled out.
On the flip side, the silver price has multiple hurdles to the north even if it manages to cross the 50-DMA resistance level surrounding $19.35, which in turn disappoints the buyers.
That said, the 50% and 61.8% Fibonacci retracement level of June-September downside, around $20.00 and $20.60 in that order, precedes the metal’s run-up toward the monthly high of $21.24. Also acting as an upside filter is August month’s peak of $20.87.
Silver: Daily chart
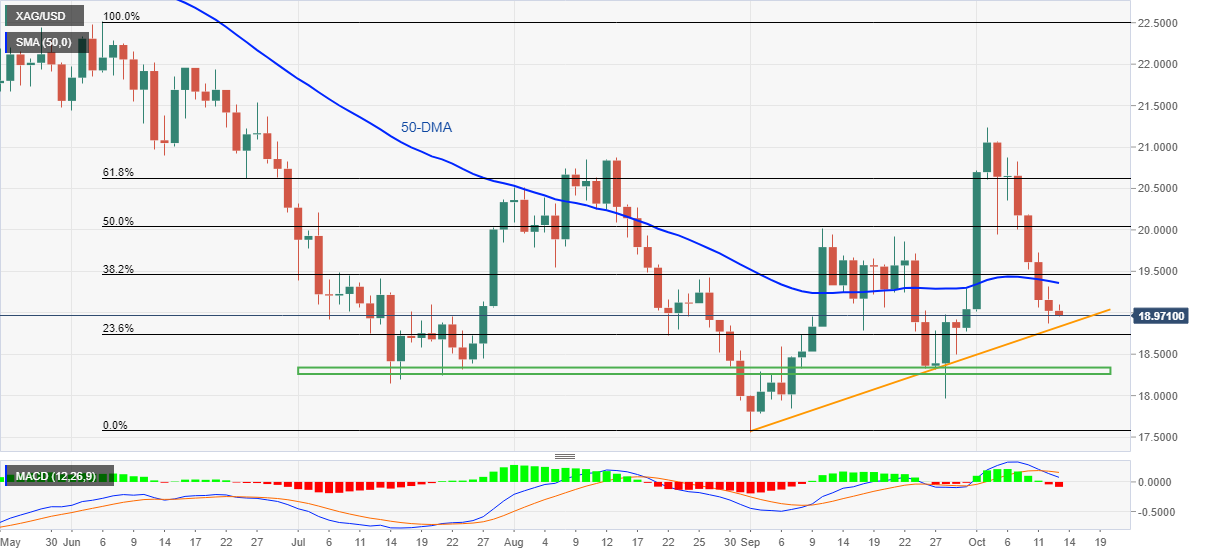
Trend: Further weakness expected
-
03:43
US officials concerned that Russia's oil cap will fail – Bloomberg
Citing sources with knowledge of the matter, Bloomberg reported that US officials are concerned that Russia's oil cap will fail as a result of the OPEC+ cut.
Earlier on, US Treasury Secretary Janet Yellen said that “Russia could profitably sell oil at historical prices in the $60 / barrel range.”
Related reads
- Saudi Arabian Foreign Minister defends OPEC+ output cut decision
- US Treasury Secretary Yellen will step up efforts to advance Russia's oil price cap
-
03:37
EUR/GBP pares the biggest daily loss in two weeks around 0.8750 ahead of German inflation
- EUR/GBP picks up bids to consolidate the previous day’s heavy losses.
- UK Chancellor’s blames on BOE, downbeat British statistics keep buyers hopeful.
- Hopes of BOE’s aggressive rate hikes in the next week, likely hardships for the bloc weigh on prices.
- Germany's inflation numbers could allow buyers to keep the reins.
EUR/GBP prints mild gains around 0.8750 as it licks its wounds during Thursday’s sluggish Asian session. In doing so, the cross-currency pair pares the biggest daily loss in a fortnight as traders await the key inflation data from Germany.
EUR/GBP pair’s latest weakness could be linked to the tussles between UK Chancellor of the Exchequer Kwasi Kwarteng and the Bank of England, informally called the “Old Lady”.
“Old Lady will be to blame if UK markets slide next week,” said UK’s Kwarteng, which in turn exerted additional pressure on the BOE to announce a stronger rate hike. As a result, the money market bets suggest a full percentage rate lift by the BOE during the next monetary policy meeting.
Also fueling the GBP could be the comments from Bank of England policymaker Catherine Mann who stated that tackling inflation will hurt the UK more than others. On the same line could be the UK PM Liz Truss’ determination to keep the widely criticized mini budget despite knowing that it will post a £60 billion funding hole. "I am still inclined to believe that a significant monetary policy response will be required in November," Bank of England (BOE) Chief Economist Huw Pill said on Wednesday, as reported by Reuters.
On Wednesday, chatters that the BOE will extend its gilt purchases triggered the GBP’s upside before the “Old Lady mentioned that gilt purchases are a temporary program and that they will be unwound in a smooth and orderly fashion. The news reversed Sterling’s initial gains and recollected downbeat UK statistics to challenge the EUR/GBP bulls before the EUR weakness favored the pair’s upside momentum.
Further, the mixed data from the UK also weighed on the EUR/GBP prices. That said, UK Gross Domestic Product (GDP) dropped to -0.3% MoM in August versus 0.0% expected and 0.2% prior whereas the Industrial Production (IP) and Manufacturing Production (MP) also slumped into the negative territory during the stated month.
Additionally, a survey conducted by YouGov and consultancy the Centre for Economics and Business Research stated that the UK Consumer Confidence gauge fell to 97.7 in September from 98.8. The detail also stated that British consumer confidence fell due to a steep deterioration in homeowners’ attitudes toward their house values.
Moving on, Germany’s Harmonized Index of Consumer Prices (HICP) figures for September, expected to confirm initial readings of 10.9% YoY, will be crucial for the EUR/GBP pair traders amid the fresh covid woes from the bloc. Also likely to weigh on the prices could be the ongoing energy crisis in the old continent.
Technical analysis
EUR/GBP remains capable of refreshing the yearly high, currently around 0.9255, unless breaking a five-week-old support line, near .8710 by the press time.
-
03:33
Japan’s Matsuno: Closely watching FX moves with a high sense of urgency
Japanese Chief Cabinet Secretary Hirokazu Matsuno is reiterating that the government is closely watching the FX market moves, as USD/JPY closes in on 147.00.
Key quotes
No comment on daily FX moves.
Closely watching FX moves with a high sense of urgency.
If there are any excessive forex moves, we will take appropriate action.
Market reaction
USD/JPY is consolidating near 24-year highs at 146.93, almost unchanged on the day, as investors await the US inflation data.
-
03:29
Saudi Arabian Foreign Minister defends OPEC+ output cut decision
Saudi Arabia’s Foreign Minister Prince Faisal bin Farhan told Al Arabiya late Wednesday that they defend the recent decision by OPEC+ to cut oil output.
Key quotes
“Saudi Arabia completely rejects statements critical of the kingdom following the OPEC+ decision on October 5th.”
“The OPEC+ decision was unanimous, took supply and demand into account, and aims to reduce market volatility.”
“During consultations with the US administration, Saudi Arabia stressed that postponing the oil cut for a month, as proposed, would have negative economic consequences.”
-
03:26
IMF’s Japan Chief: BOJ stimulus is required for long-term inflation
Ranil Salgado, the IMF's mission chief for Japan, supports the Bank of Japan’s (BOJ) ultra-loose monetary policy stance for propelling inflation over the long term.
Key quotes
“Stimulus from the BOJ is required for long-term inflation.”
“A shorter BOJ yield target is necessary for policy sustainability.”
-
03:20
US CPI Preview: Core and headline figures seen rising in September – Goldman Sachs
Analysts at Goldman Sachs offer their expectations for Thursday’s US Consumer Price Index (CPI) release for the month of September.
Key quotes
"We expect a 0.41% increase in September core CPI, in line with consensus expectations for a 0.4% increase and corresponding to a 0.2pp increase in the year-over-year rate to 6.50%.”
"We forecast a 0.26% increase in headline CPI in September, a bit above consensus expectations for a 0.2% increase and corresponding to a 0.2pp decline in the year-over-year rate to 8.10%.”
-
03:11
USD/CAD Price Analysis: Dribbles inside weekly triangle around 1.3800
- USD/CAD remains sidelined while snapping three-day uptrend inside an immediate symmetrical triangle.
- Sustained trading beyond the key moving averages, steady RSI favor buyers.
- Two-week-old resistance adds to the upside filters on the way to early 2020 levels.
USD/CAD treads water around 1.3800 while staying inside a four-day-old symmetrical triangle during Thursday’s Asian session. Even so, firmer RSI and the Loonie pair’s ability to stay beyond the key moving averages keep the buyers hopeful.
That said, the aforementioned triangle restricts the nearby USD/CAD moves between 1.3825 and 1.3785.
Also acting as the short-term trading filters is the 100-HMA and an upward-sloping resistance line from September 28, respectively near 1.3770 and 1.3855.
Given the increased optimism about the USD/CAD pair’s upside momentum, coupled with the multiple failures to cross the stated trend line hurdle, a clear break of 1.3855 won’t hesitate to challenge the 1.4000 psychological magnet. In doing so, the quote will aim for the levels marked during May 2020.
Alternatively, a downside break of the 1.3770 HMA support won’t be a warm welcome for the sellers as the 200-HMA level of 1.3708 will act as the last defense for the USD/CAD buyers.
USD/CAD: Hourly chart
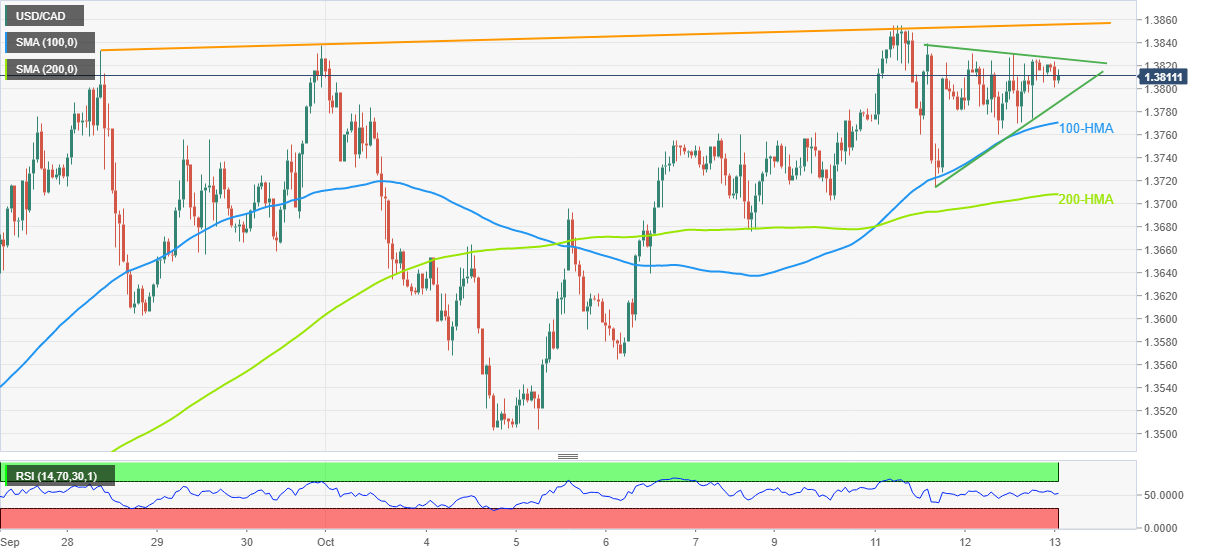
Trend: Sideways
-
02:53
USD/CNH fails to cheer China stimulus above 7.1700 amid US hardships for chipmakers, pre-CPI lull
- USD/CNH struggles to defend six-day uptrend despite bouncing off intraday low.
- China’s local governments buy houses to aid real-estate developers.
- Fears from US-led hardships for Chinese chipmakers, covid woes join hawkish Fed bets to favor buyers.
- PBOC versus Fed divergence keeps upside bias intact, US inflation will be the key for fresh impulse.
USD/CNH picks up bids to refresh intraday high around 7.1800 but posts mild gains amid the cautious markets ahead of the key US Consumer Price Index (CPI) data on Thursday. In addition to the pre-data anxiety, mixed catalysts surrounding China also challenge the offshore Chinese yuan (CNH) pair.
Biden administration announced tougher rules for doing business with China during Wednesday’s announcement. “The Biden administration’s new restrictions on doing business with China are sending shock waves through the global semiconductor industry, with chip-equipment makers girding for perhaps the most painful fallout,” stated Bloomberg after the release.
On the same line, US Treasury Secretary Janet Yellen said, per Reuters, that the global economy was facing "significant headwinds" and the United States was working to shore up its supply chains and guard against "geopolitical coercion" by Russia, China and others.
Elsewhere, Federal Reserve Governor Michelle Bowman said that if high inflation does not start to wane she will continue to support aggressive rate rises aimed at taming price pressures, reported Reuters. The Fed policymaker’s comments were in agreement with the latest Federal Open Market Committee (FOMC) Meeting Minutes which mentioned that the policymakers are concerned about inflation and fear doing too little.
Further fueling the USD/CNH prices could be the CME’s FedWatch Tool prints a nearly 85% chance of the Fed’s 75 bps rate hike in November while the US inflation expectations, as per the 10-year and 5-year breakeven inflation rates per the St. Louis Federal Reserve (FRED) data, retreated from the recent one-week highs.
Additionally, recently announced covid-led lockdowns in Shanghai and Hong Kong’s determination to keep virus-linked restrictions in place also favor the pair buyers.
On the contrary, Chinese media chatters suggesting the government’s plan to buy houses as a part of the stimulus seemed to have challenged the USD/CNH bulls of late. Further, the previously softer US Treasury yields and comments from US Treasury Secretary Yellen suggesting a liquidity crunch in the Treasury market also act as a negative for the pair.
Looking forward, USD/CNH may portray a sideways to positive move ahead of the US CPI, expected to ease to 8.1% YoY versus 8.3% prior. However, the more important CPI ex Food & Energy is likely to increase to 6.5% YoY from 6.3% prior and can favor more upside considering the recession woes.
Also read: US September CPI Preview: Monthly core inflation is the figure to watch
Technical analysis
Wednesday’s Doji and multiple failures to provide a daily closing beyond 7.1800 teases USD/CNH sellers.
-
02:41
UK Chancellor Kwarteng: BoE will be to blame if UK markets slide next week
No more than a data after the UK's Chancellor of the Exchequer Kwasi Kwarteng had praised the Bank of England’s response to recent market turmoil, saying he is working closely with Governor Andrew Bailey and they speak regularly, he has reportedly said the Old Lady will be to blame if UK markets slide next week.
Bloomberg is with the story in Asia today.
The Bank of England's governor, Andrew Baily on Wednesday warned the Bank of England would not extend its emergency intervention in financial markets beyond this week, after the turmoil sparked by the government’s mini-budget. This weighed heavily on sterling on Wednesday which dropped below 1.1000 vs. the greenback after the Bank’s governor insisted the £65bn scheme to purchase UK government bonds would not be continued beyond the deadline on Friday.
Meanwhile, official data showed Britain's economy unexpectedly shrank by 0.3% in August, hit by weakness in manufacturing and maintenance work in the North Sea oil and gas fields. Still, the markets do not expect weaker-than-forecast growth to deter the BoE from continuing to raise rates. Money markets are fully pricing in a full-point rate rise from the Bank of England at its November meeting, according to Refinitiv data.
GBP/USD technical analysis

GBP/USD is trying to move higher in a recovery attempt in the 1.11s with eyes on 1.1180 for the sessions ahead.
-
GBP/USD Price Analysis: Bulls eye a break to 1.1150 and 1.1180 thereafter
-
-
02:38
EUR/JPY advances towards 143.00, investors await development on BOJ intervention story
- EUR/JPY is marching towards 143.00 as the risk-off traction has been trimmed.
- ECB Lagarde sees interest rates as the most appropriate tool for policy tightening.
- Investors await more development on BOJ’s intervention for further guidance.
The EUR/JPY pair is hovering around the immediate hurdle of 142.60 in the Tokyo session. The asset is auctioning in a range of 142.25-142.60 and is preparing for an upside break as the risk-off impulse is showing fading signs. The cross is marching towards the crucial hurdle of 143.00 as a hawkish commentary from European Central Bank (ECB) President Christine Lagarde has infused fresh blood in the shared currency bulls.
ECB policymaker stated that the Governing Council is having discussions on Quantitative Tightening (QE) and interest rate is the most appropriate tool in current circumstances. As price prices are soaring in the trading bloc and have not displayed any sign of exhaustion yet, the continuation of restrictive policy measures is highly likely.
On the Tokyo front, the odds of intervention in the currency markets by the Bank of Japan (BOJ) for the second time are mounting. Japanese officials believe that the current yen price doesn’t justify economic fundamentals. It is worth noting that the USD/JPY pair has surpassed the area where BOJ intervened last month.
Japanese Chief Cabinet Secretary Hirokazu Matsuno denied on commenting over day to day movement in the FX domain but cited that “We are closely watching FX moves with a high sense of emergency and will take appropriate steps on excess FX moves. The commentary came after the USD/JPY pair refreshed its multi-year high at around 146.40.
-
02:32
S&P 500 Futures regain 3,600 despite steady Treasury bond yields ahead of US inflation
- Market sentiment remains mildly positive even as pre-data anxiety restricts momentum.
- S&P 500 Futures snap six-day downtrend, yields print the first daily gains in three.
- China’s stimulus jostles with hawkish Fedspeak, US hardships for chipmakers to add to trading filters.
- US CPI becomes crucial catalyst, likely to drown riskier assets.
Global markets portray the typical pre-data trading lull on early Thursday as traders eagerly await US Consumer Price Index (CPI) data for September. Also challenging the momentum are the mixed headlines surrounding China and Fed, as well as a light calendar in Asia.
While portraying the mood, the S&P 500 Futures print mild gains around 3,600 to break the six-day losing streak. On the same line, the US 10-year, 2-year and 30-year Treasury yields are all snap a two-day downtrend even if the recovery remains sluggish.
The US action to increase hardships for Chinese chip manufacturer joins hawkish Fedspeak to exert downside pressure on the market sentiment, preceding the upbeat Fed Minutes. On the contrary, Chinese media chatters suggesting the government’s plan to buy houses as a part of the stimulus seemed to have put an immediate floor under the riskier assets.
Earlier in the day, Federal Reserve Governor Michelle Bowman said that if high inflation does not start to wane she will continue to support aggressive rate rises aimed at taming price pressures, reported Reuters. The Fed policymaker’s comments were in agreement with the latest Federal Open Market Committee (FOMC) Meeting Minutes which mentioned that the policymakers are concerned about inflation and fear doing too little.
With this, the CME’s FedWatch Tool prints a nearly 85% chance of the Fed’s 75 bps rate hike in November. Elsewhere, the US inflation expectations, as per the 10-year and 5-year breakeven inflation rates per the St. Louis Federal Reserve (FRED) data, retreated from the recent one-week highs.
That said, US Treasury Secretary Janet Yellen’s response, shared via Bloomberg, to a question relating to the Treasury market’s liquidity also challenges the risk appetite. “We are worried about a loss of adequate liquidity in the market,” Yellen said Wednesday in answering questions following a speech in Washington, per Bloomberg.
Given the pre-CPI trading lull is in full steam, today’s US inflation data are likely to offer more volatility amid the recently hawkish Fed signals and the market’s wagers on hawkish moves.
Also read: US September CPI Preview: Monthly core inflation is the figure to watch
-
02:28
GBP/USD Price Analysis: Bulls eye a break to 1.1150 and 1.1180 thereafter
- GBP/USD bulls are taking the control back with eyes on a key daily resistance line.
- The bulls need to get above 1.1150 for prospects of a break into the 1.1200s and higher.
The pound is in recovery mode, breaking through last week's lows of 1.1055 and is now penetrating into the 1.1100 (New York equities open high) area in Asia. The following illustrates the prospects of a restest of Wednesday's highs and a move to 1.1150 and beyond with 1.1180 as the prior day's highs. 1.1495 was last week's high.
GBP/USD M15 chart
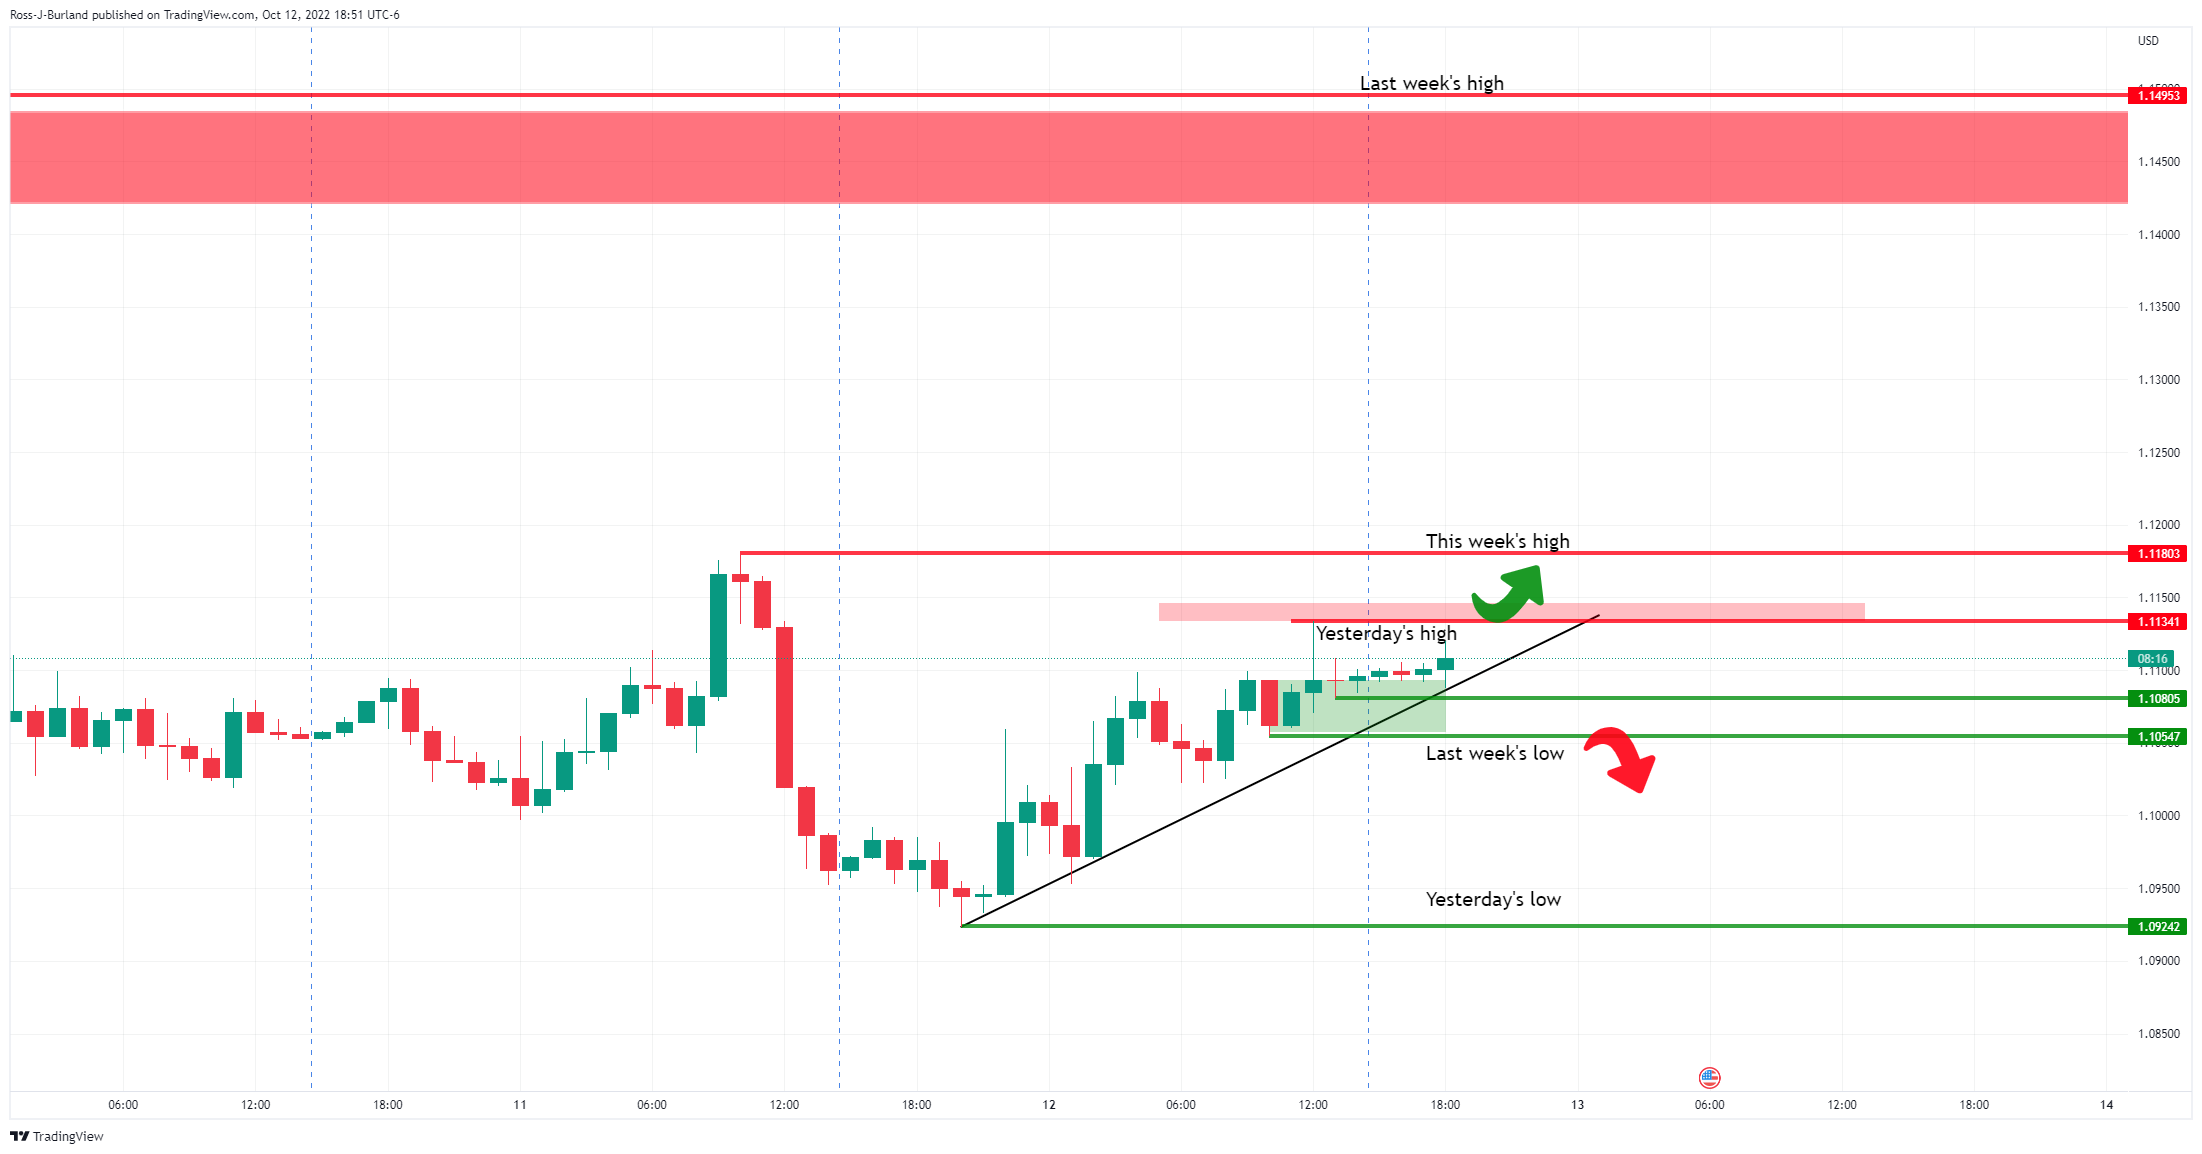
The price is riding up the trendline support with this week's high near 1.1180 as a meanwhile target on a break of 1.1150. The support structure, however, on a break of 1.1080 guards a move to 1.1050 and then a test of 1.1000 ahead of space to Wednesday's low down near 1.0925.
GBP/USD daily
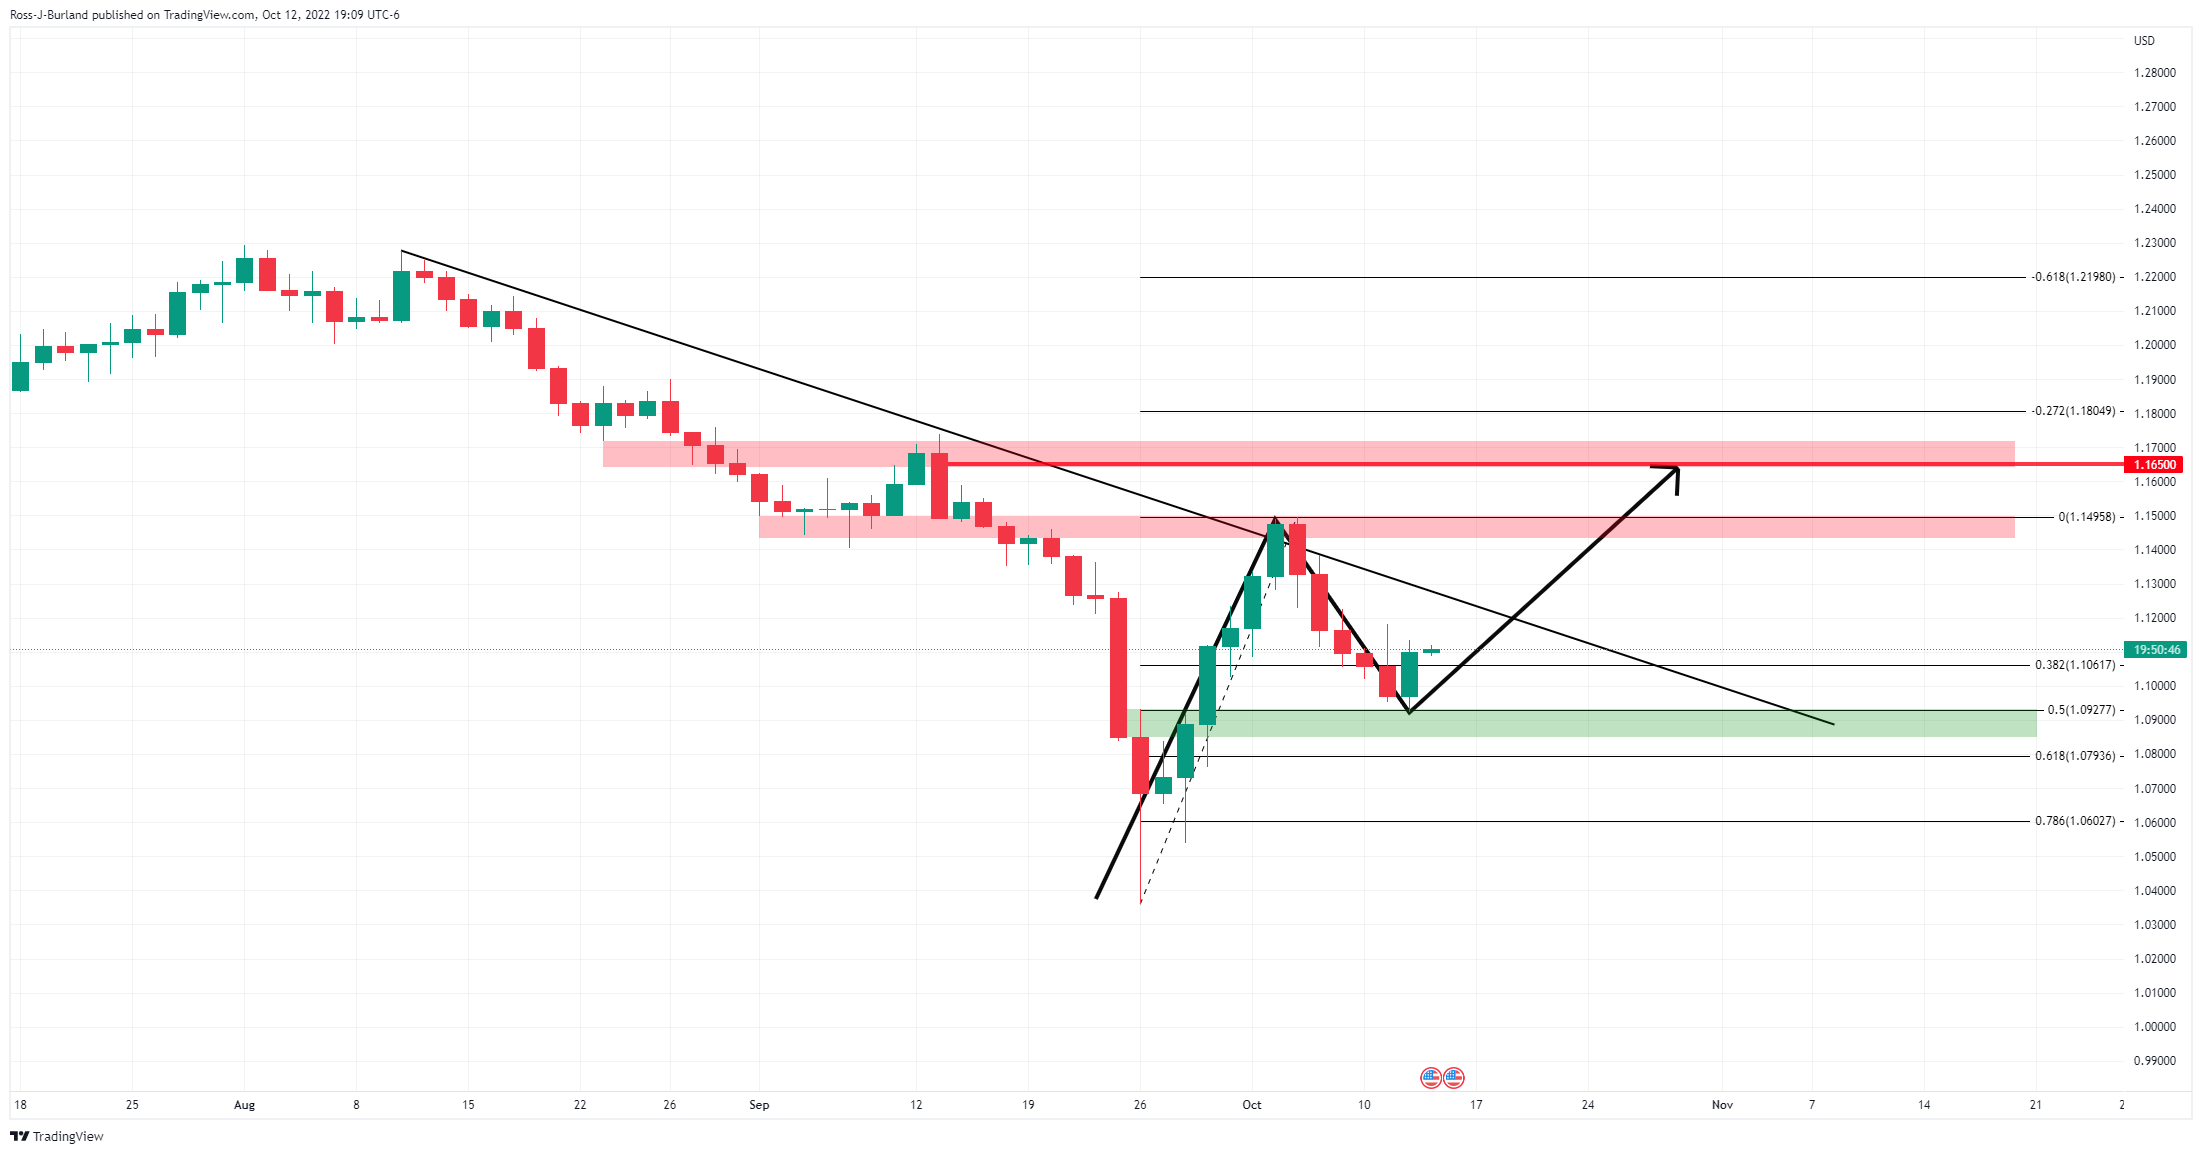
The daily chart, on the other hand, has the price firmly supported at a key retracement area in a 50% mean reversion of the prior bullish impulse. The trendline resistance could come under pressure in due course and this puts the focus on a significant upside recovery on the table with 1.1650 eyed above 1.1500 (last week's high)
-
02:18
USD/CNY fix: 7.1101 vs. the last close of 7.1799
In recent trade today, the People’s Bank of China (PBOC) set the yuan (CNY) at 7.1101 vs. the last close of 7.1799.
About the fix
China maintains strict control of the yuan’s rate on the mainland.
The onshore yuan (CNY) differs from the offshore one (CNH) in trading restrictions, this last one is not as tightly controlled.
Each morning, the People’s Bank of China (PBOC) sets a so-called daily midpoint fix, based on the yuan’s previous day's closing level and quotations taken from the inter-bank dealer.
-
02:09
US inflation expectations retreat ahead of US CPI
US inflation expectations remained pressured on Wednesday as yields retreated ahead of Thursday’s key Consumer Price Index (CPI) data for September.
That said, the inflation precursors, as per the 10-year and 5-year breakeven inflation rates per the St. Louis Federal Reserve (FRED) data, retreated from the recent one-week highs of 2.31% and 2.36% respectively to 2.32% and 2.29% in that order.
It should be noted, however, that the inflation expectations remain well beyond the multi-month low marked during late September, which in turn justifies the latest hawkish Fedspeak and the Federal Open Market Committee (FOMC) Meeting Minutes.
Even so, a retreat in the US inflation expectations and yields challenge the US Dollar Index (DXY) which extends the previous day’s pullback from the two-week top to 113.17 by the press time.
Also read: US Dollar Index struggles to justify hawkish Fedspeak, FOMC Minutes ahead of US CPI
-
02:00
AUD/JPY Price Analysis: Short term structure turns bullish on 20-EMA violation
- Aussie bulls have driven the asset into the highest auction area in a 92.16-94.74 range.
- An establishment above the 20-EMA indicates that the short-term trend has turned bullish.
- The emerging risk-on profile adds to the upside filters.
The AUD/JPY pair has sensed fresh demand from the round-level cushion of 92.00 in the Tokyo session. The current momentum in the cross is expected to drive the asset above the immediate hurdle of 92.42 as the risk-on profile is emerging in the market.
On a four-hour scale, the cross has entered into the prior highest auction area, which is considered the recent most traded range. The balanced profile is plotted in a range of 92.16-94.74. Entry of the asset in the highest auction area indicates that the asset is challenging the inventory adjustment phase and a make-or-break move is expected ahead.
The cross has comfortably established above the 20-period Exponential Moving Average (EMA) at 92.00. While the 50-EMA at 92.61 is still far from reach.
Meanwhile, the Relative Strength Index (RSI) (14) has shifted its range into the 40.00-60.00 zone from the bearish range of 20.00-40.00, which indicates that the cross is not bearish anymore.
Going forward, a break above Wednesday’s high at 92.42 will drive the asset towards October 5 low at 92.93, followed by September 30 high at 94.22.
On the flip side, a drop below Wednesday’s low at 91.29 will drag the asset toward the August 2 low at 90.52. If the asset surrenders the 90.52 cushion, yen bulls will further drag the asset toward the psychological support of 90.00.
AUD/JPY four-hour chart
-638012195869919266.png)
-
02:00
Gold Price Forecast: XAU/USD rebound appears lucrative above $1,660, US inflation in focus
- Gold price extends the recent bounce off previous resistance line amid US dollar pullback.
- Sluggish session, light calendar and mixed clues allow traders to brace for US CPI.
- Firmer inflation could trigger fresh XAU/USD downside amid hawkish Fed bias.
Gold price (XAU/USD) remains sidelined around $1,675 during Thursday’s Asian session, after bouncing off a short-term key support line, previous resistance, earlier in the week. In doing so, the precious metal portrays the typical pre-data trading lull ahead of the US Consumer Price Index (CPI) data for September.
It should be noted that the US action to increase hardships for Chinese chip manufacturer joins hawkish Fedspeak to exert downside pressure on the quote. However, Chinese media chatters suggesting the government’s plan to buy houses as a part of the stimulus seemed to have put an immediate floor under the XAU/USD.
That said, Federal Reserve Governor Michelle Bowman said that if high inflation does not start to wane she will continue to support aggressive rate rises aimed at taming price pressures, reported Reuters.
On the same line, the latest Federal Open Market Committee (FOMC) Meeting Minutes, published Wednesday, failed to impress the US dollar bulls despite showing the policymakers’ hawkish bias amid concerns over more persistently high inflation. The Fed Minutes also mentioned that the participants agreed the Committee needed to move to, and then maintain, a more restrictive policy stance in order to meet the Committee’s legislative mandate to promote maximum employment and price stability.
As a result, the CME’s FedWatch Tool prints a nearly 85% chance of the Fed’s 75 bps rate hike in November.
Against this backdrop, the benchmark US 10-year Treasury yields remain sidelined around 3.90%, pausing the two-day downtrend, whereas the S&P 500 Futures print mild gains.
It’s worth mentioning that the US Producer Price Index (PPI) printed 8.5% YoY figures for September versus 8.4% expected and 8.7% prior, which in turn suggests further downside for the XAU/USD if the CPI figures don’t unveil the anticipated weakness. Forecasts suggest that the headlines CPI will ease to 8.1% YoY versus 8.3% prior but the more important CPI ex Food & Energy is likely to increase to 6.5% YoY from 6.3% prior and can trigger more downside considering the recession woes.
Technical analysis
Gold price remains above the resistance-turned-support line stretched from early August despite the latest lackluster performance. The same joins bullish MACD signals and firmer RSI (14) keeping buyers hopeful of portraying another battle with the 50-DMA hurdle surrounding $1,714.
However, a four-month-old bearish trend channel’s resistance line, close to $1,730 by the press time, appears a tough nut to crack for the XAU/USD bulls afterward, which in turn could challenge the upside momentum and keep the sellers hopeful. Should the quote rises past $1,730, the buyers could aim for August month’s high near $1,807.
Alternatively, a downside break of the aforementioned previous resistance line, near $1,660, will need validation from the multiple supports around $1,650 and $1,643 before directing gold bears toward the yearly low near $1,615. In a case where the bullion prices remain weak past $1,615, the stated channel’s lower line, close to $1,600 at the latest, will be in focus.
Overall, gold prices remain firmer unless the bears provide a daily closing below $1,660 support.
Gold: Daily chart
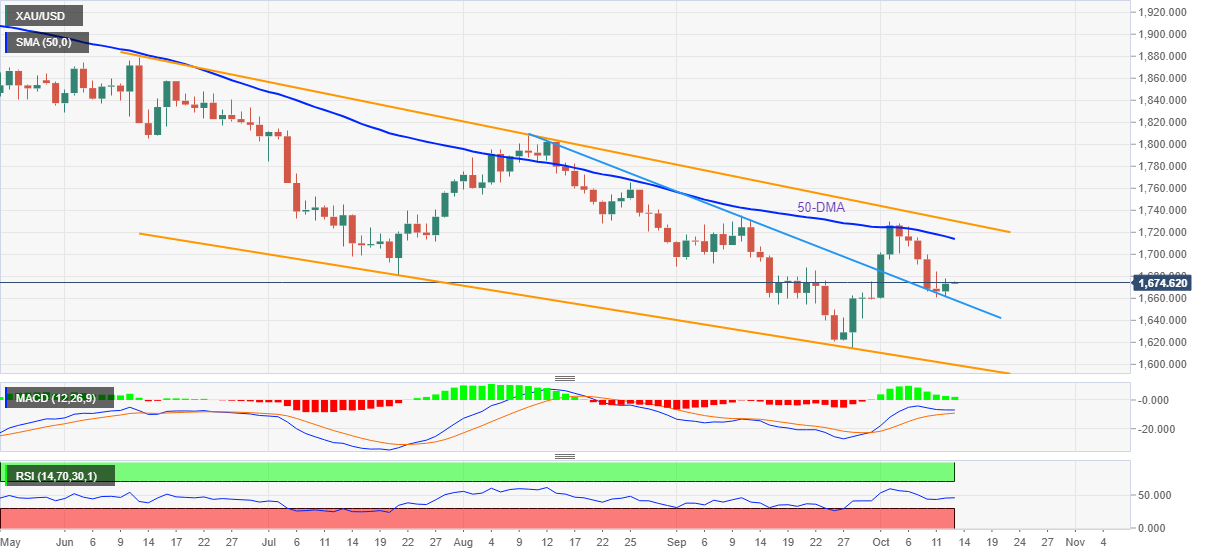
Trend: Further recovery expected
-
01:35
USD/JPY bears eye a breakout but bulls are holding the fort ahead of US CPI
- USD/JPY is pressing below a key trend line support and horizontal structure.
- Bulls need to break into the 147s or face capitulation risks into the US CPI data while bears need to get below 146.66.
USD/JPY has been consolidating below the bull cycle lows for the best part of Wednesday's trade, stalling into and around the Federal Open Market Committee minutes that failed to move the needle significantly enough to put much of a dent into the bullish trend. At the time of writing, USD/JPY is trading between a low of 146.66 and 146.91 as Tokyo opens.
On Wednesday, the US dollar climbed to a fresh 24-year peak versus the yen despite the lofty levels that have some observers anticipating central bank intervention. Japan had staged its first yen-buying intervention since 1998 on September 22, when the dollar was at 145.90 yen. Nevertheless, traders were given the green light to sell the yen after Bank of Japan Governor Haruhiko Kuroda vowed to keep monetary policy loose in order to support an economic recovery. Kuroda said that the weak currency could be a benefit to the economy.
Meanwhile, the greenback pared gains after minutes from the last Federal Reserve meeting showed some dovish undertones. There was a hint of a pivot in the minutes, where "several participants noted that... it would be important to calibrate the pace of further policy tightening with the aim of mitigating the risk of significant adverse effects on the economic outlook," which sank the 10-year yield initially and weighed on the greenback, allowing the yen to strengthen to the low of the day before it weakened again. Overall, the Fed is seen to remain committed to raising interest rates in order to bring down inflation which continues to support USD.
Additionally, the greenback had been firm on the back of data that was released at the start of the day showing US producer prices increased more than expected in September. The producer price index for final demand rebounded 0.4%, above the forecast for a 0.2% rise. In the 12 months through September, the PPI increased 8.5% after advancing 8.7% in August.
For the day ahead, it is all about US inflation data. Consumer Price Index likely stayed strong in September, as analysts at TD Securities said, ''with the series registering another large 0.5% MoM gain. Shelter inflation likely remained strong, though we look for used vehicle prices to retreat sharply. Importantly, gas prices likely brought additional relief for the headline series again, declining by about 5% MoM. Our MoM forecasts imply 8.2%/6.6% YoY for total/core prices.''
USD/JPY technical analysis
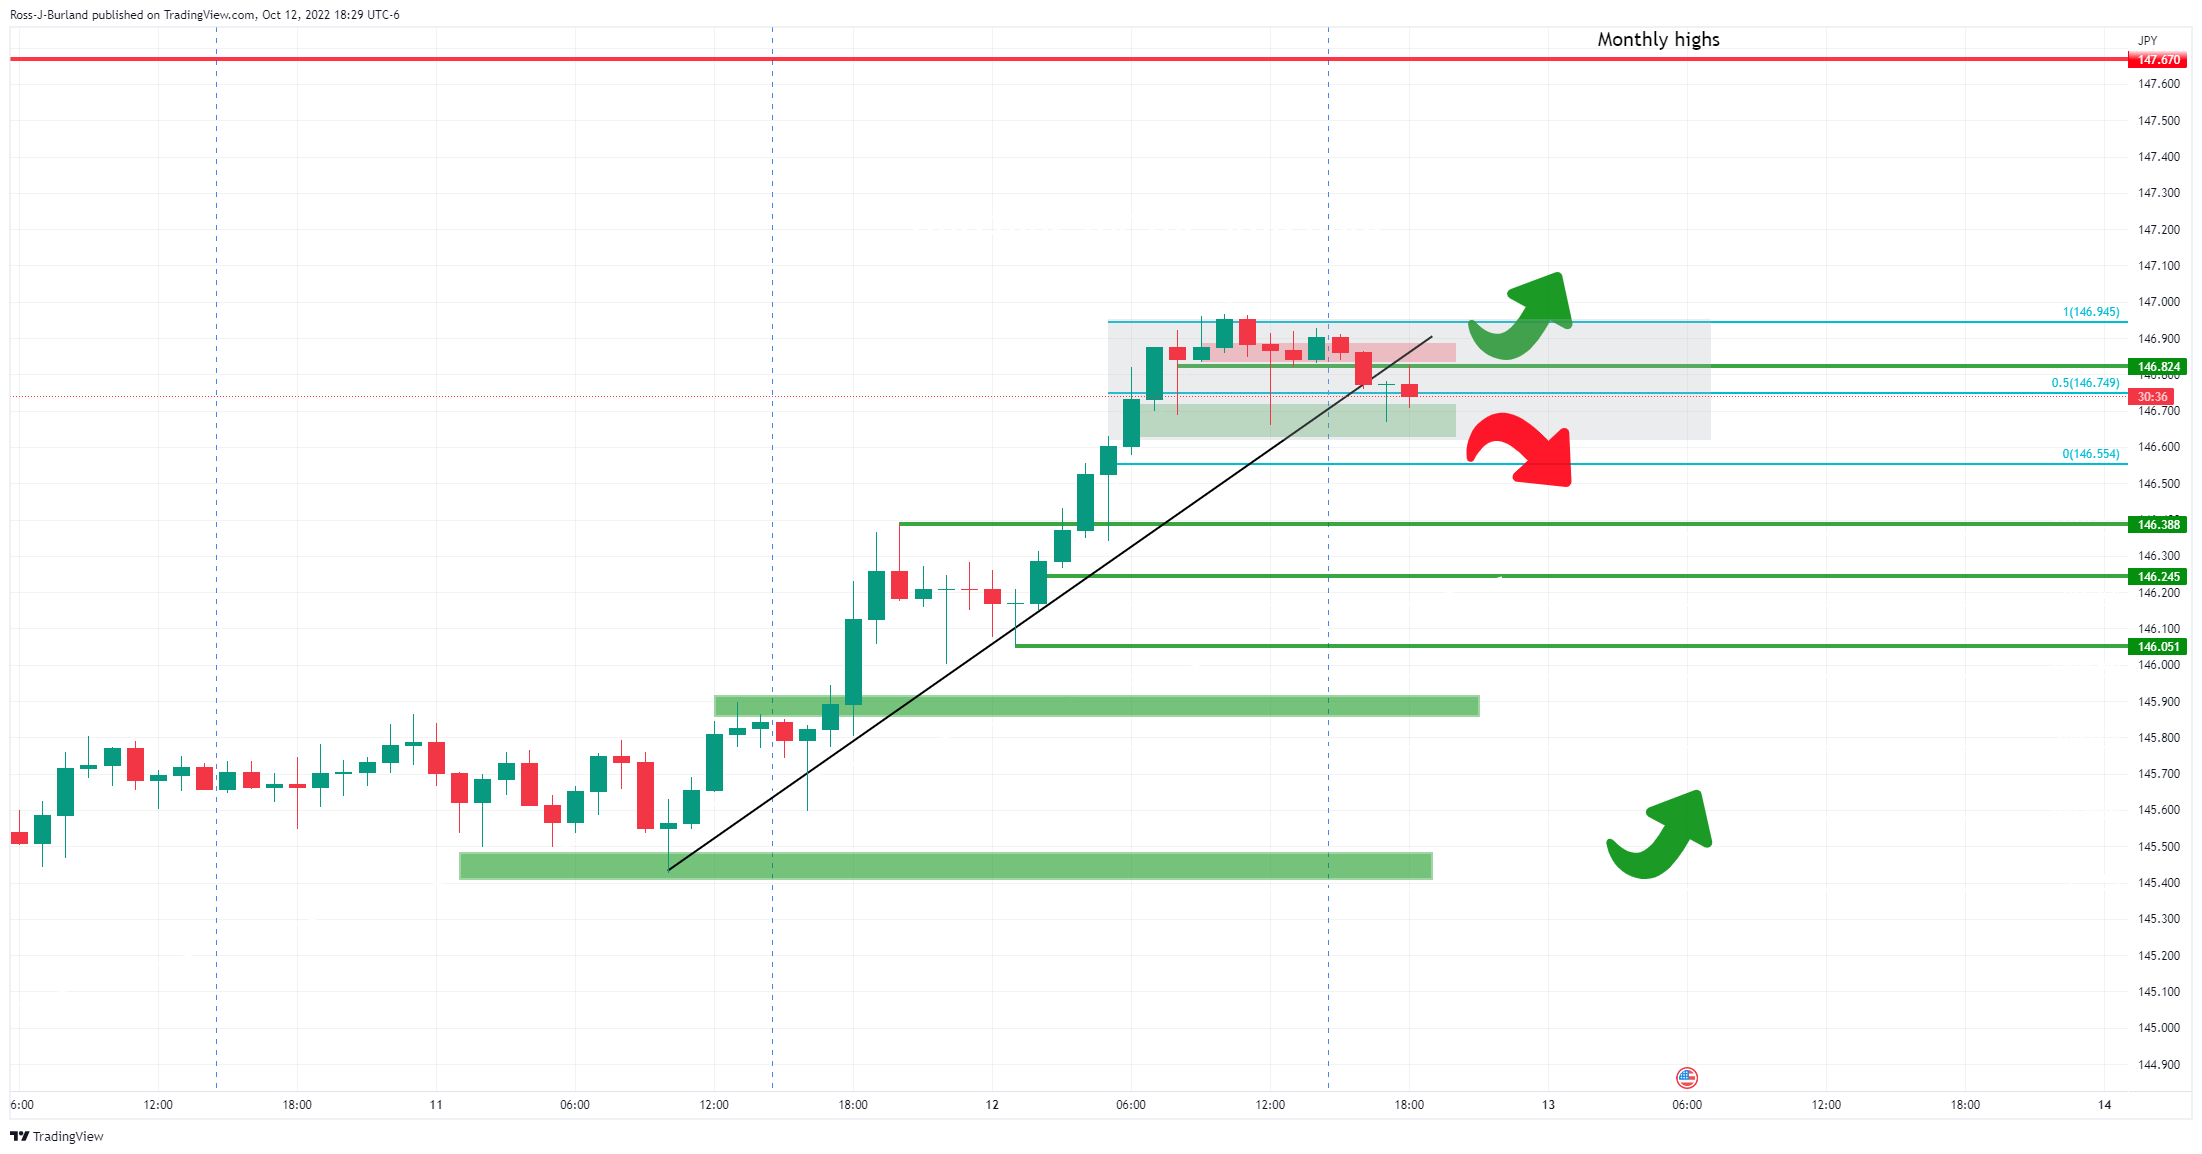
The price is moving out of trendline support which puts the onus on the downside. However, if the bears can't get below the double bottom and horizontal support ahead of US CPI, then the risks will be tilted for an onwards bullish continuation and the data will determine the outcome of this phase of consolidation.
-
01:30
AUD/USD ignores Australia Consumer Inflation Expectations near 0.6280, US CPI eyed
- AUD/USD remains steady after bouncing off yearly low, renews intraday high of late.
- Australia’s Consumer Inflation Expectations for October dropped below the market forecasts.
- Traders portray typical pre-data trading lull even as recession, covid woes tease bears.
- US CPI may exert downside pressure considering hawkish FOMC Minutes and Fedspeak.
AUD/USD treads water around 0.6280, despite refreshing the intraday high, as traders await the key US inflation data during early Thursday. In doing so, the Aussie pair ignores recently downbeat data from home, as well as hawkish Fedspeak.
Australia’s Consumer Inflation Expectations for October reprint 5.4% figures versus the market forecasts supporting 5.8% level.
On the same line were the latest hawkish comments from Federal Reserve Governor Michelle Bowman who said that if high inflation does not start to wane she will continue to support aggressive rate rises aimed at taming price pressures, reported Reuters.
Also likely to challenge the AUD/USD buyer is the CME’s FedWatch Tool which takes clues from the hawkish bias at the US central bank, as per the latest Fed Minutes, as it portrays a nearly 85% chance of the Fed’s 75 bps rate hike in November.
Additionally, fears surrounding the fresh covid-led lockdowns from China and increasing virus numbers from Europe should have also weighed on the risk barometer pair.
It should be noted that the Chinese media chatters suggesting the government’s plan to buy houses as a part of the stimulus seemed to have put an immediate floor under the AUD/USD prices.
Amid these plays, the benchmark US 10-year Treasury yields remain sidelined around 3.90%, pausing the two-day downtrend, whereas the S&P 500 Futures print mild gains.
Looking forward, the US Consumer Price Index (CPI) data for September, expected to ease to 8.1% YoY versus 8.3% prior, may challenge the AUD/USD sellers considering the US dollar’s lackluster moves and the market’s resistance to respect the inflation data.
Technical analysis
Although a five-week-old bearish channel is likely to restrict the AUD/USD pair’s moves between 0.6160 and 0.6430, an oversold RSI (14) signals limited downside room.
-
01:27
WTI drops to near $85.00 as recession fears escalate, US CPI buzz
- Oil prices have shifted into a negative trajectory amid accelerating US recession fears.
- A tight US inflation report would force the Fed to continue the current pace of hiking interest rates.
- US President Joe Biden believes that the recession situation will be slight if it occurs.
West Texas Intermediate (WTI), futures on NYMEX, witnessed a steep fall to near $85.00 after surrendering the critical support of $87.00. The oil prices have attempted a rebound, however, the downside risks are still favored amid escalating fears of a recession situation in the US economy.
Tuesday’s warning from chairman and CEO of JPMorgan Chase, Jamie Dimon that the US economy could slip into recession in the coming six to nine months grabbed the spotlight. He further added that the Eurozone is already in recession and it may put the mighty US into recession too. He cited soaring inflation and interest rates, and the war situation as responsible for the recession situation ahead reported NewsBytes.
While US President Joe Biden has denied an extreme recession situation in the US. He believes that ''If recession will be there, it’ll be very slight. The comments from US President Joe Biden could be a sigh of relief for the market participants.
On the global front, International Monetary Fund (IMF) has cut global growth projections. The institution has trimmed its 2023 global Gross Domestic Product (GDP) forecast to 2.7%, 20 basis points (bps) lower than expectations made in July, keeping the 2022 projections unchanged at 3.2%. A decline in the global growth rate may keep the oil prices volatile ahead.
For further guidance, Tuesday’s inflation report will be the key catalyst. Price pressures in the US economy have not responded well to the policy tightening announcements by the Federal Reserve (Fed). And, a higher-than-projected report would bolster the case of the fourth consecutive 75 basis points (bps) rate hike by the Federal Reserve (Fed). More stretching in Fed’s policy rates would dwindle the oil demand.
-
01:15
Currencies. Daily history for Wednesday, October 12, 2022
Pare Closed Change, % AUDUSD 0.6277 0.08 EURJPY 142.53 0.74 EURUSD 0.97031 -0.03 GBPJPY 162.983 1.89 GBPUSD 1.10974 1.12 NZDUSD 0.56076 0.44 USDCAD 1.3815 0.16 USDCHF 0.99673 -0.02 USDJPY 146.872 0.76 -
01:13
EUR/USD Price Analysis: Stays inside familiar range surrounding 0.9700
- EUR/USD remains sidelined in an immediate 70-pip trading region.
- Sluggish MACD, RSI also back sideways performance between three-week-old horizontal support and descending resistance line from October 06.
- Bears have a comparatively smoother road to return than buyers.
EUR/USD treads water around 0.9700, staying inside a familiar 70-pip trading range during Thursday’s Asian session. In doing so, the major currency pair portrays the typical pre-data trading lull ahead of the US Consumer Price Index (CPI) data for September.
That said, a three-week-old horizontal line restricts the EUR/USD pair’s immediate downside around 0.9670 while a one-week-long descending trend line joins the 23.6% Fibonacci retracement level of the August-September downside, near 0.9740 to challenge buyers.
It’s worth noting that the RSI (14) and the MACD also portray sluggish markets and hence it all depends upon the scheduled US inflation data.
Even so, the EUR/USD bears might have a quick fall towards the yearly low of 0.9537 on breaking 0.9670 support, which appears smoother than the likely hardships for buyers due to multiple hurdles in the north.
If the quote remains weak past 0.9670, the 61.8% Fibonacci Expansion (FE) of the August-October moves, near 0.9480, will be in focus.
Alternatively, an upside clearance of the 0.9740 hurdle will need validation from the recent swing high near 0.9775 to convince buyers.
Following that, the 38.2% Fibonacci retracement level of 0.9853 and the monthly high near the parity could challenge the EUR/USD pair buyers.
EUR/USD: Four-hour chart
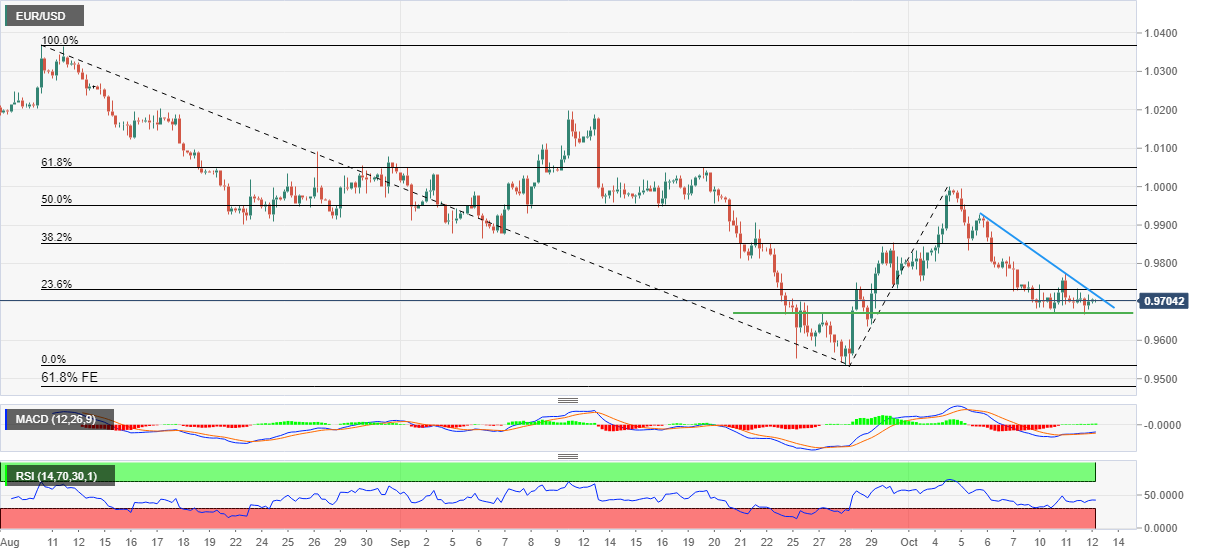
Trend: Sideways
-
01:03
Australia Consumer Inflation Expectations came in at 5.4%, below expectations (5.8%) in October
-
00:57
USD/CHF rebounds from 0.9960 as focus shifts to US Inflation
- USD/CHF has picked bids at around 0.9962 as US inflation data hogs the limelight.
- The DXY remained sideways despite the hawkish Fed minutes and mixed PPI data.
- Investors should brace for sheer volatility on the US inflation release.
The USD/CHF pair has sensed a fresh demand from around 0.9960, however, further upside needs to pass a lot of tests ahead. As the risk impulse is displaying mixed responses ahead of the US Consumer Price Index (CPI) data, a restrictive movement is getting more traction. On Wednesday, S&P500 faded the opening optimism after settling sluggish as the inflation report is a key trigger for decisive action.
Meanwhile, the US dollar index (DXY) is still inside the woods as volatility has contracted dramatically. Wednesday’s release of the Producer Price Index (PPI) failed to impact the DXY. The headline annual PPI figure improved by 10 basis points (bps) to 8.5% against projections. While the core PPI figure declined to 7.2% vs. the expectations and the prior release of 7.3%.
Apart from that, the release of the Federal Reserve (Fed) minutes has cleared that policymakers believe in staying with the current course of action. To bring price stability, reaching faster terminal rates and the sustainability of tight monetary policy is the remedy to curtail soaring inflation despite the sacrifice of a tight labor market.
Going forward, the US Consumer Price Index (CPI) data holds the utmost importance. The plain-vanilla CPI is expected to decline to 8.1% while the core CPI may improve to 6.5%. Apart from that, the quarterly result season is at the doors. Therefore, the deadly duo will accelerate volatility in the market.
On the Swiss franc front, Swiss National Bank (SNB) Chairman Thomas J. Jordan at the IMF meeting in Washington cited that the central bank has a clear focus on bringing price stability back to the target by tightening the financial conditions, reported Bloomberg.
-
00:56
US Dollar Index struggles to justify hawkish Fedspeak, FOMC Minutes ahead of US CPI
- US Dollar Index remains sidelined after retreating from two-week high.
- Fed Minutes portrays policymakers’ concern for inflation, fears of doing too little.
- Comments from Fed’s Bowman, yields and hawkish Fed bets challenge recent downside.
- US CPI for September is likely to ease but expected improvement in Core CPI may recall DXY bulls.
US Dollar Index (DXY) portrays the pre-data anxiety while taking rounds to 113.20, after snapping a five-day uptrend with mild losses the previous day. In doing so, the greenback’s gauge versus the six major currencies fails to justify the recently hawkish Fed bets and upbeat comments from the US Federal Reserve (Fed) policymakers during Thursday’s sluggish performance before the key US Consumer Price Index (CPI) data for September.
Federal Reserve Governor Michelle Bowman said on Wednesday that if high inflation does not start to wane she will continue to support aggressive rate rises aimed at taming price pressures, reported Reuters. That said, CME’s FedWatch Tool takes clues from the hawkish bias at the US central bank, as per the latest Fed Minutes, as it portrays a nearly 85% chance of the Fed’s 75 bps rate hike in November.
The latest Federal Open Market Committee (FOMC) Meeting Minutes failed to impress the US dollar bulls despite showing the policymakers’ hawkish bias amid concerns over more persistently high inflation. The Fed Minutes also mentioned that the participants agreed the Committee needed to move to, and then maintain, a more restrictive policy stance in order to meet the Committee’s legislative mandate to promote maximum employment and price stability.
The DXY witnessed downside pressure on Wednesday while tracking softer yields even if the US Producer Price Index (PPI) printed better than forecast figures. The PPI declined to 8.5% YoY in September versus 8.4% expected and 8.7% prior. Further, the Core PPI eased to 7.2% versus 7.3% previous readings and market forecasts. Also should have helped the US Dollar Index, but did not, were the fresh fears of coronavirus emanating from China and Europe.
While portraying the mood, yields remained weak for the second consecutive day and the equities ended the day with mild losses while the US dollar snapped a five-day uptrend. Further, the S&P 500 Futures and the yields remain lackluster at the latest.
It should be noted that the market’s latest anxiety may allow the US dollar to push back the bears but a firmer inflation number is a must for the DXY to recall the buyers. Forecasts suggest, the headline CPI to ease to 8.1% YoY versus 8.3% prior but the more important CPI ex Food & Energy is likely to increase to 6.5% YoY from 6.3% prior and can trigger more downside considering the recession woes.
Also read: US September CPI Preview: Monthly core inflation is the figure to watch
Technical analysis
US Dollar Index (DXY) bulls need a daily closing beyond a two-week-old resistance area surrounding 113.35-40 to keep the reins.
-
00:50
Japan Bank Lending (YoY) came in at 2.3%, above expectations (2.2%) in September
-
00:50
Japan Producer Price Index (MoM) above forecasts (0.2%) in September: Actual (0.7%)
-
00:50
Japan Producer Price Index (YoY) came in at 9.7%, above expectations (8.8%) in September
-
00:37
USD/CAD steadies above 1.3800, traces lackluster oil prices ahead of US inflation
- USD/CAD grinds higher as bulls await key data after three-day ruling.
- Oil pauses downside as Saudi Arabia defends latest OPEC+ supply cut agreement.
- Cautious mood, hawkish Fed bets challenge movement even as softer yields tease bears.
- US CPI for September can keep buyers hopeful considering upbeat Fed Minutes.
USD/CAD stays defensive around 1.3820, pausing a three-day uptrend near the 2.5-year high, as traders turn cautious ahead of the key US inflation data during early Thursday. Also challenging the pair buyers could be the latest pause in the previously declining oil prices, Canada’s main export item.
WTI crude oil prices regain $86.00 after bouncing off a one-week low as Saudi Arabia rejects the latest US-led criticism of the Organization of the Petroleum Exporting Countries and allies including Russia, known collectively as OPEC+, supply cut agreement. The Saudi Arabian Foreign Ministry recently stated that the OPEC+ decision was unanimous, took into account the balance of supply and demand and aims at curbing market volatility.
Elsewhere, CME’s FedWatch Tool takes clues from the hawkish bias at the US central bank, as per the latest Fed Minutes, as it portrays a nearly 85% chance of the Fed’s 75 bps rate hike in November. That said, the latest Federal Open Market Committee (FOMC) Meeting Minutes failed to impress the US dollar bulls despite showing the policymakers’ hawkish bias amid concerns over more persistently high inflation. The Fed Minutes also mentioned that the participants agreed the Committee needed to move to, and then maintain, a more restrictive policy stance in order to meet the Committee’s legislative mandate to promote maximum employment and price stability.
It should be noted that the latest upbeat comments from Federal Reserve Governor Michelle Bowman defend the USD/CAD buyers as the policymaker said, “If high inflation does not start to wane she will continue to support aggressive rate rises aimed at taming price pressures,” reported Reuters.
On Wednesday, US Producer Price Index (PPI) declined to 8.5% YoY in September versus 8.4% expected and 8.7% prior. Further, the Core PPI eased to 7.2% versus 7.3% previous readings and market forecasts.
Against this backdrop, yields remained weak for the second consecutive day and the equities ended the day with mild losses while the US dollar snapped a five-day uptrend. Further, the S&P 500 Futures and the yields remain lackluster at the latest.
Moving on, the upbeat US PPI and hawkish Fed Minutes keep the USD/CAD buyers hopeful. However, the latest rebound in oil prices challenges the upside momentum.
Technical analysis
A two-week-old resistance line, around 1.3860 by the press time, challenges USD/CAD bulls.
-
00:13
NZD/USD Price Analysis: Negative Divergence in action, 0.5800 a key hurdle
- A mixed market mood is responsible for a rangebound action in NZD/USD.
- The 50-EMA at 0.5640 still has not been poked by the kiwi bulls.
- A negative divergence will trigger if the asset oversteps 0.5814.
The NZD/USD pair is displaying back-and-forth moves above the immediate cushion of 0.5600 in the early Tokyo session after a minor correction from 0.5632. The asset is witnessing a volatility contraction ahead of the US inflation data as investors are awaiting fit and proper guidance before making further positions. Meanwhile, the risk profile is mixed as S&P500 surrendered its intraday gains while settling Wednesday’s trading session.
On a four-hour scale, the asset has witnessed a rebound after witnessing exhaustion in the downtrend. It is worth noting that the asset was continuously making lower lows while the momentum oscillator, Relative Strength Index (RSI) (14) made a higher low. This indicates signs of a loss in the downside momentum.
The major is attempting to sustain above the 20-period Exponential Moving Average (EMA) at 0.5608. While the 50-EMA at 0.5640 has not been poked yet.
The formation of a negative divergence will trigger if the asset oversteps the horizontal resistance plotted from the previous week’s high at 0.5814, which will drive the asset towards September 29 high at 0.5911, followed by the psychological resistance at 0.6000.
Alternatively, the greenback bulls will regain strength if the asset surrenders the two-year low at 0.5536, which will drag the asset toward March 2020 low at 0.5469. A slippage below the latter will expose the asset to the round-level cushion at 0.5400.
NZD/USD four-hour chart
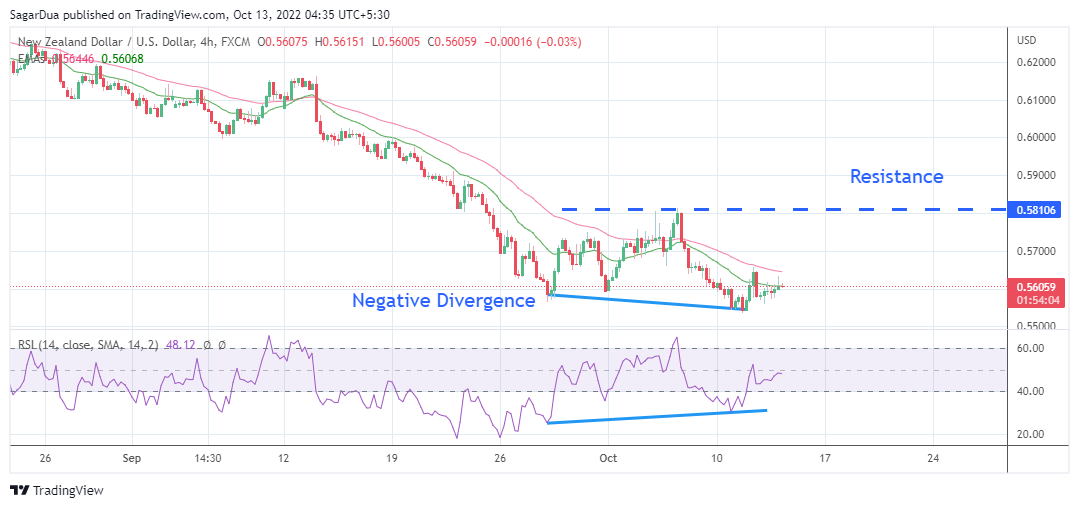
-
00:12
EUR/GBP Price Analysis: Drops below 0.8800 on fragile sentiment
- EUR/GBP slumped from weekly highs, forming a bearish-engulfing pattern; further downside is expected.
- A clear break below 0.8730 would exert downward pressure on the EUR/GBP; a fall towards 0.8700 is likely to happen.
The EUR/GBP slightly climbs as the Asian Pacific session begins, following a solid session for the British pound, strengthening vs. the shared currency, as delineated by the EUR/GBP sliding 1.19% on Wednesday. The EUR/GBP/ is trading at 0.8745, below its opening price at the time of writing,
EUR/GBP Price Forecast
On Wednesday, the EUR/GBP tumbled below the 20-day EMA, shifting its bias from upwards to neutral-upwards, while the formation of a bearish-engulfing pattern at the end of an uptrend would open the door for further losses. EUR/GBP traders should be aware that the Relative Strength Index (RSI) is neutral, at the 50-midline, almost horizontal, meaning consolidation lies ahead.
The key support levels are the October 4 low at 0.8648, which, once cleared, could open the door for a test of the 50-day EMA at 0.8638. On the flip side, the 20-day EMA at 0.8794 is the first resistance, followed by the 0.8800 figure.
Short term, the EUR/GBP four-hour time frame shows the pair trading above the confluence of the 200-EMA and a two-week upslope support trendline, around 0.8730. If prices tumble below, the EUR/GBP might tumble to the S1 daily pivot around 0.8690, which, once broken, would send the EUR/GBP sliding towards 0.8648, the October 4 low of 0.8648. On the flip side, the intersection of the 20-EMA and the daily pivot point at 0.8780 is the first resistance, followed by the 100-EMA at 0.8807.
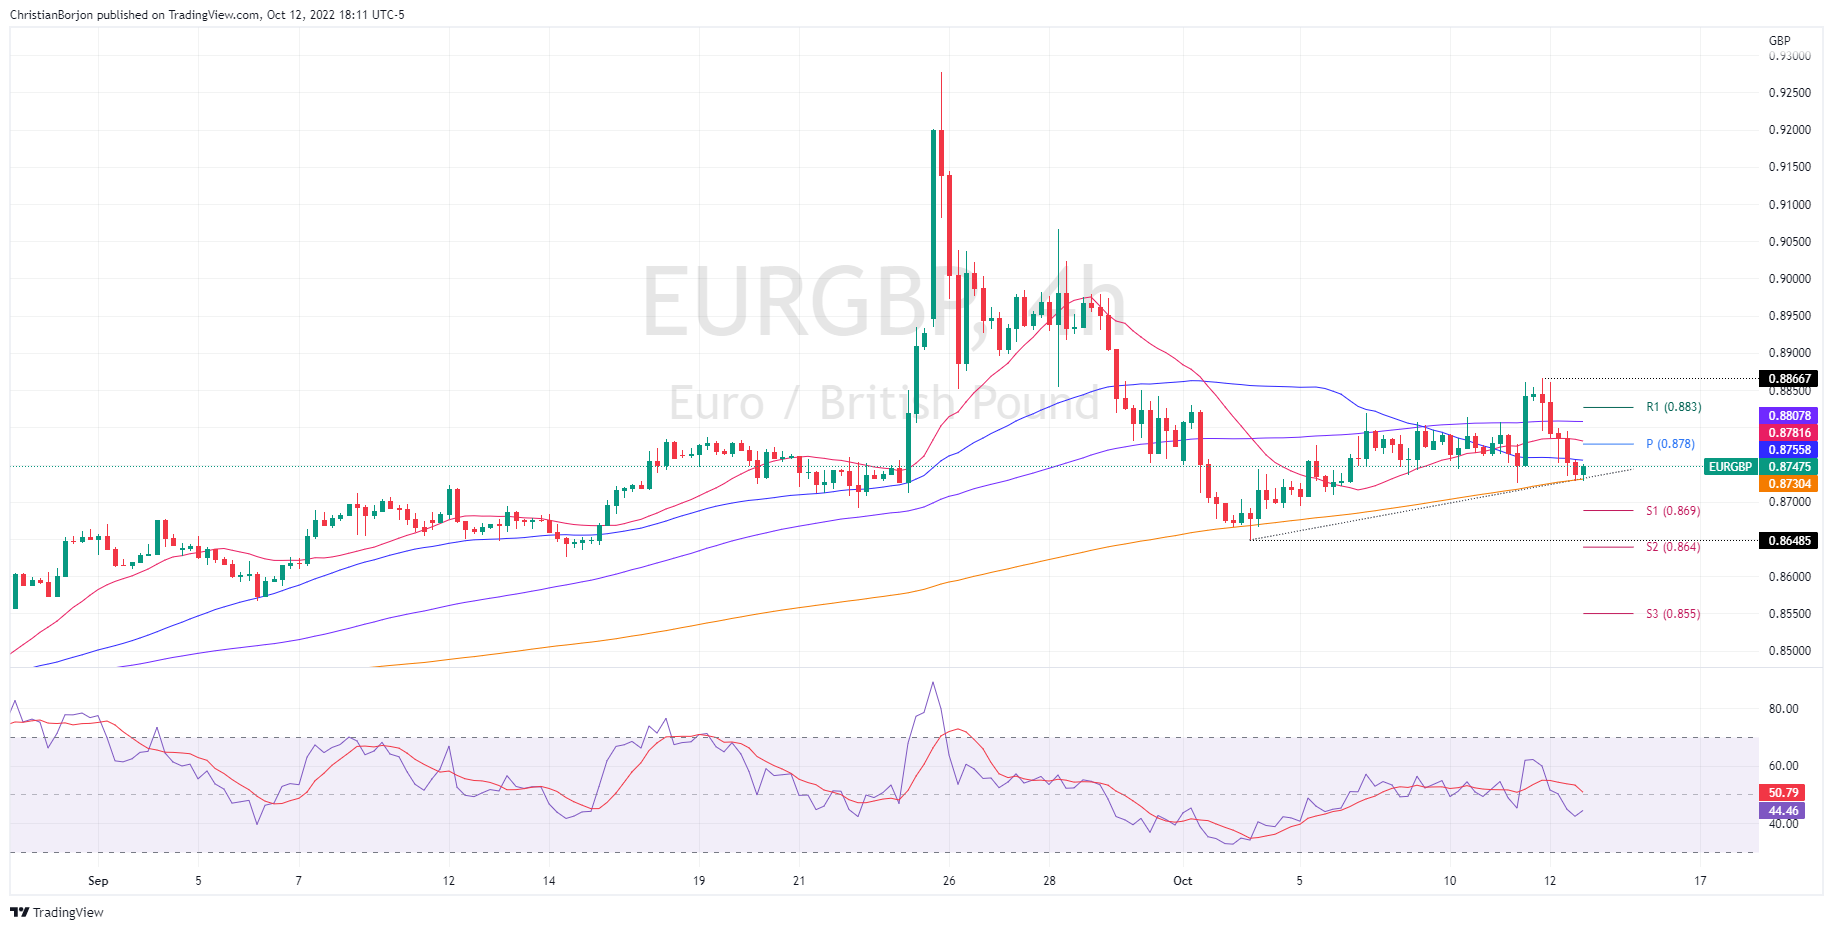
EUR/GBP Key Technical Levels
-
00:12
GBP/JPY Price Analysis: Retreats from 100-DMA near 163.00
- GBP/JPY pares the biggest daily gains in a fortnight near the weekly top.
- Bullish MACD signals keep buyers hopeful unless prices break 13-day-old support line.
- Monthly resistance line adds to the upside filters.
GBP/JPY bulls take a breather after printing the biggest daily jump in two weeks, retreating to 162.85 during Thursday’s Asian session.
In doing so, the cross-currency pair reverses from the 100-DMA but stays above the key Fibonacci retracement level of the quote’s June-September moves, as well as an important support line stretched from September 26, amid bullish MACD signals.
With this, buyers are likely to keep the reins unless the quote breaks the aforementioned support line, around 160.70 by the press time. However, the latest pullback can retest the 61.8% Fibonacci retracement level of 161.10.
Also acting as a downside filter is the weekly low around 159.75 and the 50% Fibonacci retracement level of 158.75.
Alternatively, an upside clearance of the 100-DMA hurdle, close to 163.20 at the latest, could propel the GBP/JPY prices towards a one-month-long resistance line near 164.80.
Should the bulls keep reins past 164.80, the odds of witnessing a fresh high, currently around 165.75, can’t be ruled out.
Overall, GBP/JPY witnesses a pullback but remains on the bull’s radar.
GBP/JPY: Daily chart
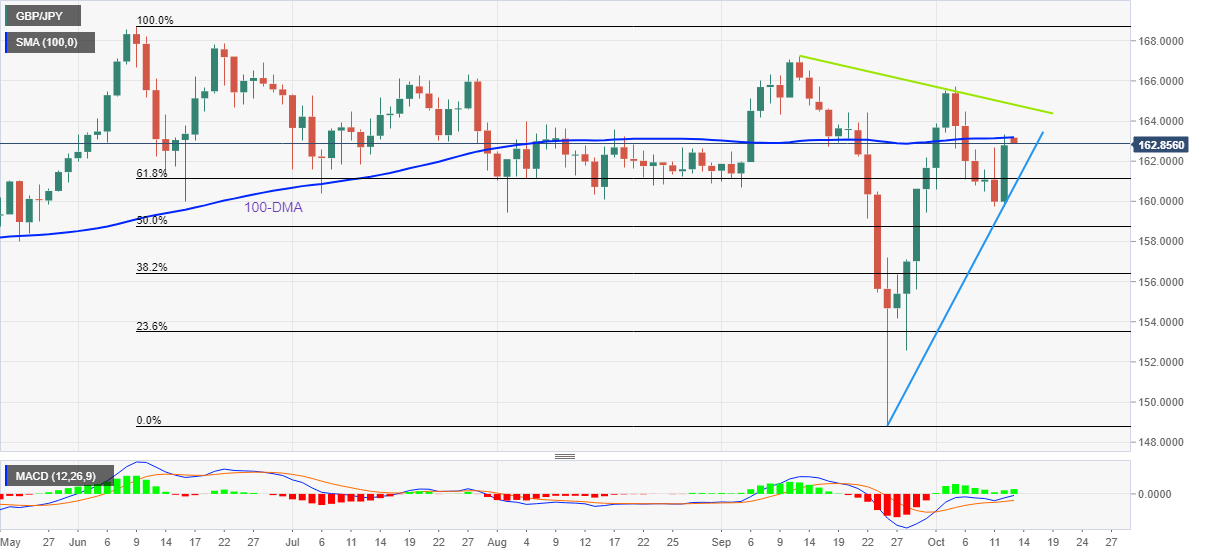
Trend: Further upside expected
-
00:10
BoE’s Huw Pill: Big rate rise next month
The UK's Times reports that the Bank of England's Huw Pill predicts a bg rate rise next month.
Motr to come...
-
00:06
United Kingdom RICS Housing Price Balance below expectations (58.3%) in September: Actual (32%)
-