Notícias do Mercado
-
16:40
Foreign exchange market. American session: the U.S. dollar traded mixed against the most major currencies after mixed economic data from the U.S.
The U.S. dollar traded mixed against the most major currencies after mixed economic data from the U.S. The U.S. producer price index rose 0.1% in July, in line with expectations, after a 0.4% gain in June.
On a yearly basis, the U.S. producer price index increased 1.7% in July, missing expectations for a 1.8% gain, after a 0.4% rise in June.
The U.S. producer price inflation, excluding food and energy, climbed 0.2% in July, in line with expectations, after a 0.2% rise the previous month.
On a yearly basis, the U.S. producer price index, excluding food and energy, gained 1.6% in July, in line with expectations, after a 1.8% increase in June.
The Reuters/Michigan consumer sentiment index declined to 79.2 in August from 81.8 in June. Analysts had expected the index to increase to 82.7.
The NY Fed Empire State manufacturing index decreased to 14.7 in August from 25.6 in July, missing expectations for a fall to 20.3.
The euro traded higher against the U.S. dollar in the absence of any major economic reports in the Eurozone.
The U.S. industrial production rose 0.4% in July, exceeding expectations for a 0.3% rise, after a 0.4% gain in June. June's figure was revised up from a 0.2% increase.
The British pound traded mixed against the U.S. dollar after the better-than-expected UK GDP. The UK gross domestic product grew at annual rate of 3.2% in the second quarter, exceeding expectations for a 3.1% gain, after a 3.1% rise in the first quarter. That was the fastest pace since the end of 2007.
On a monthly basis, the UK GDP increased 0.8% in the second quarter, in line with expectations, after a 0.8% rise in the first quarter.
The Canadian dollar traded mixed against the U.S. dollar after the better-than-expected Canadian manufacturing shipments. The Canadian manufacturing shipments climbed 0.6% in June, beating expectations for a 0.5% rise, after a 1.7% gain in May. May's figure was revised up from a 1.6% increase.
The New Zealand dollar traded mixed against the U.S dollar in the absence of any major economic reports in New Zealand.
The Australian dollar traded lower against the U.S. dollar. No major economic reports were released in Australia.
The Japanese yen increased against the U.S. dollar in absence of any major economic reports in Japan.
-
14:55
U.S.: Reuters/Michigan Consumer Sentiment Index, August 79.2 (forecast 82.7)
-
14:45
Option expiries for today's 1400GMT cut
EUR/USD $1.3365(E200mn), $1.3400(E545mn), $1.3425(E519mn)
USD/JPY Y101.80-85($200mn), Y102.00($100mn), Y102.25($100mn), Y102.50($150mn), Y103.00($220mn), Y103.50($455mn)
GBP/USD $1.6740(stg263mn)
EUR/GBP stg0.7940(E250mn), stg0.8000(E160mn), stg0.8100(E200mn)
AUD/USD $0.9275(A$132mn), $0.9315-25(A$450mn), $0.9375(A$100mn)
NZD/USD $0.8450(NZ$100mn)
USD/CAD C$1.0815($200mn), C$1.0850($481mn), C$1.0875($490mn), C$1.0915-25($450mn), C$1.0950($327mn)
-
14:41
U.S. producer price index increased 0.1% in July
The U.S. Labor Department released the producer price data today. The U.S. producer price index rose 0.1% in July, in line with expectations, after a 0.4% gain in June.
On a yearly basis, the U.S. producer price index increased 1.7% in July, missing expectations for a 1.8% gain, after a 0.4% rise in June.
Gasoline prices declined 2.1in July, while food prices rose 0.4% last month.
Prices for services increased 0.1% in July.
The U.S. producer price inflation, excluding food and energy, climbed 0.2% in July, in line with expectations, after a 0.2% rise the previous month.
On a yearly basis, the U.S. producer price index, excluding food and energy, gained 1.6% in July, in line with expectations, after a 1.8% increase in June.
-
14:15
U.S.: Industrial Production (MoM), July +0.4% (forecast +0.3%)
-
14:15
U.S.: Capacity Utilization, July 79.2% (forecast 79.2%)
-
14:00
U.S.: Total Net TIC Flows, June -153.5 (forecast 27.3)
-
14:00
U.S.: Net Long-term TIC Flows , June -18.7
-
13:31
U.S.: PPI excluding food and energy, m/m, July +0.2% (forecast +0.2%)
-
13:31
U.S.: PPI excluding food and energy, Y/Y, July +1.6% (forecast +1.6%)
-
13:30
U.S.: NY Fed Empire State manufacturing index , August 14.7 (forecast 20.3)
-
13:30
Canada: Manufacturing Shipments (MoM), June +0.6% (forecast +0.5%)
-
13:30
U.S.: PPI, m/m, July +0.1% (forecast +0.1%)
-
13:30
U.S.: PPI, y/y, July +1.7% (forecast +1.8%)
-
13:00
Orders
EUR/USD
Offers $1.3445-50
Bids $1.3335-30
GBP/USD
Offers $1.6800/10, $1.6725-30, $1.6700-05
Bids $1.6650, $1.6620
AUD/USD
Offers $0.9400, $0.9380, $0.9350
Bids $0.9300, $0.9285/80, $0.9240, $0.9220/00
EUR/JPY
Offers Y138.20, Y138.00, Y137.50
Bids Y137.00, Y136.80, Y136.50, Y136.25/20
USD/JPY
Offers Y103.50, Y103.00, Y102.80/85, Y102.65/70
Bids Y102.25/20, Y102.00, Y101.80, Y101.50
EUR/GBP
Offers stg0.8100
Bids stg0.8000, stg0.7990
-
13:00
Foreign exchange market. European session: the euro traded higher against the U.S. dollar in the absence of any major economic reports in the Eurozone
Economic calendar (GMT0):
(Time/ Region/ Event/ Period/ Previous/ Forecast/ Actual)
06:00 France Bank holiday
08:30 United Kingdom GDP, q/q (Revised) Quarter II +0.8% +0.8% +0.8%
08:30 United Kingdom GDP, y/y (Revised) Quarter II +3.1% +3.1% +3.2%
The U.S. dollar traded mixed to lower against the most major currencies ahead of the economic data from the U.S. Yesterday's disappointing the number of initial jobless claims in the U.S. weighed on the greenback. The number of initial jobless claims in the week ending August 9 rose by 21,000 to 311,000 from 290,000 in the previous week.
The euro traded higher against the U.S. dollar in the absence of any major economic reports in the Eurozone.
The British pound traded mixed against the U.S. dollar after the better-than-expected UK GDP. The UK gross domestic product grew at annual rate of 3.2% in the second quarter, exceeding expectations for a 3.1% gain, after a 3.1% rise in the first quarter. That was the fastest pace since the end of 2007.
On a monthly basis, the UK GDP increased 0.8% in the second quarter, in line with expectations, after a 0.8% rise in the first quarter.
The Canadian dollar traded mixed against the U.S. dollar ahead of the Canadian manufacturing shipments. The Canadian manufacturing shipments are expected to climb 0.5% in June, after a 1.6% gain in May.
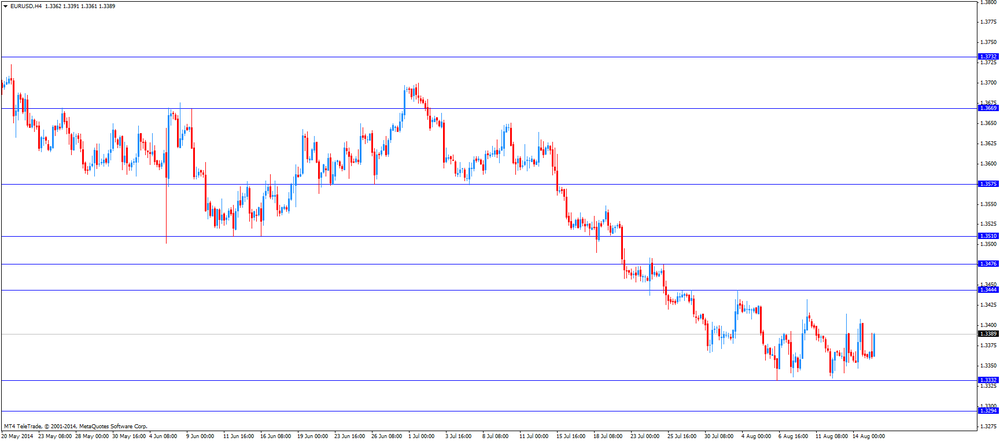
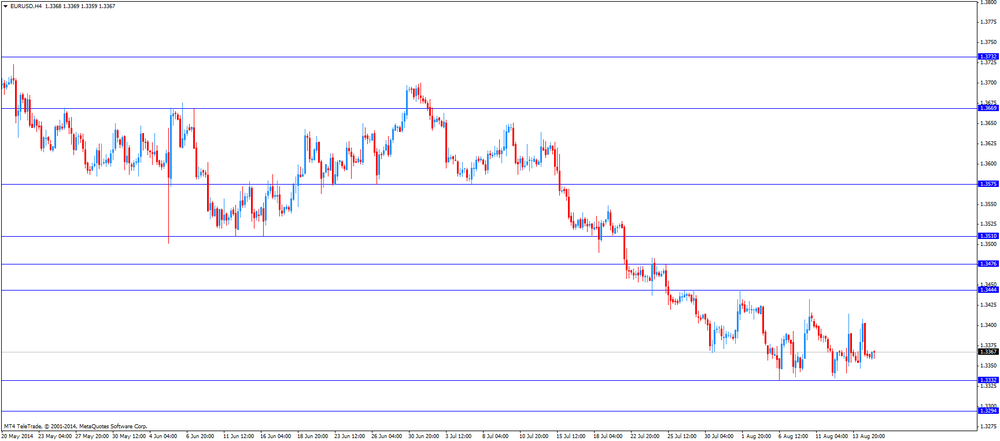
EUR/USD: the currency pair rose to $1.3391
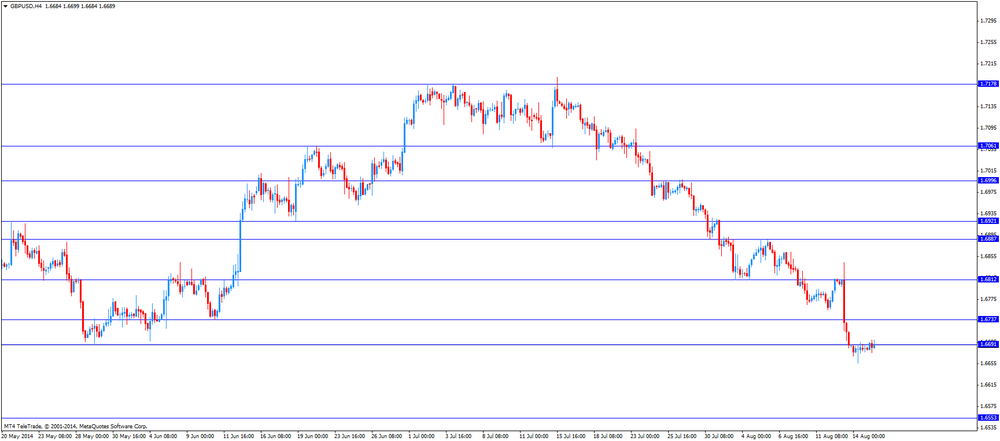
GBP/USD: the currency pair traded mixed
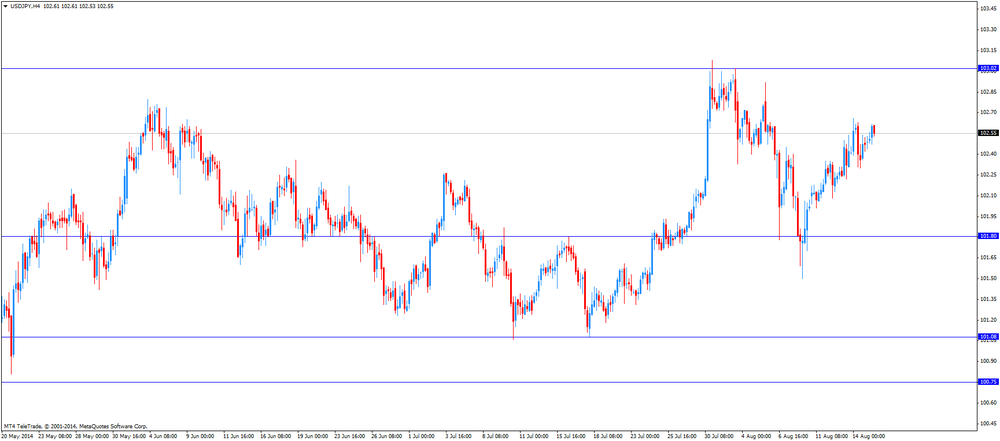
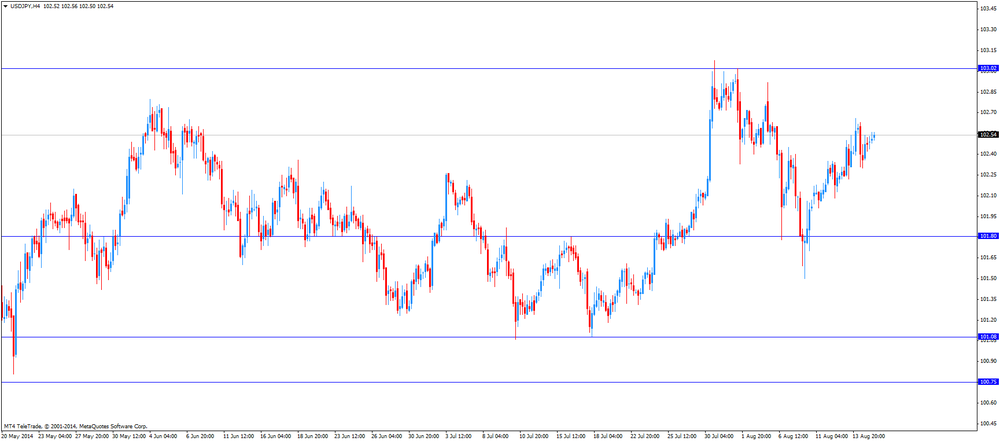
USD/JPY: the currency pair increased to Y102.62
The most important news that are expected (GMT0):
12:30 Canada Manufacturing Shipments (MoM) June +1.6% +0.5%
12:30 U.S. PPI, m/m July +0.4% +0.1%
12:30 U.S. PPI, y/y July +1.9% +1.8%
12:30 U.S. PPI excluding food and energy, m/m July +0.2% +0.2%
12:30 U.S. PPI excluding food and energy, Y/Y July +1.8% +1.6%
12:30 U.S. NY Fed Empire State manufacturing index August 25.6 20.3
13:00 U.S. Total Net TIC Flows June 19.4 27.3
13:00 U.S. Net Long-term TIC Flows June 35.5
13:15 U.S. Industrial Production (MoM) July +0.2% +0.3%
13:15 U.S. Capacity Utilization July 79.1% 79.2%
13:55 U.S. Reuters/Michigan Consumer Sentiment Index (Preliminary) August 81.3 82.7
-
11:38
UK gross domestic product grew at annual rate of 3.2% in the second quarter
The Office for National Statistics (ONS) released revised gross domestic product estimate. The UK gross domestic product grew at annual rate of 3.2% in the second quarter, exceeding expectations for a 3.1% gain, after a 3.1% rise in the first quarter. That was the fastest pace since the end of 2007.
On a monthly basis, the UK GDP increased 0.8% in the second quarter, in line with expectations, after a 0.8% rise in the first quarter.
The construction sector has showed a stronger performance than previously calculated.
The service sector expanded by 1%.
-
10:20
Option expiries for today's 1400GMT cut
EUR/USD $1.3365(E200mn), $1.3400(E545mn), $1.3425(E519mn)
USD/JPY Y101.80-85($200mn), Y102.00($100mn), Y102.25($100mn), Y102.50($150mn), Y103.00($220mn), Y103.50($455mn)
GBP/USD $1.6740(stg263mn)
EUR/GBP stg0.7940(E250mn), stg0.8000(E160mn), stg0.8100(E200mn)
AUD/USD $0.9275(A$132mn), $0.9315-25(A$450mn), $0.9375(A$100mn)
NZD/USD $0.8450(NZ$100mn)
USD/CAD C$1.0815($200mn), C$1.0850($481mn), C$1.0875($490mn), C$1.0915-25($450mn), C$1.0950($327mn)
-
09:41
Foreign exchange market. Asian session: the Australian dollar rose against the U.S. dollar due to yesterday’s weaker-than-expected number of initial jobless claims in the U.S.
Economic calendar (GMT0):
(Time/ Region/ Event/ Period/ Previous/ Forecast/ Actual)
06:00 France Bank holiday
08:30 United Kingdom GDP, q/q (Revised) Quarter II +0.8% +0.8% +0.8%
08:30 United Kingdom GDP, y/y (Revised) Quarter II +3.1% +3.1% +3.2%
The U.S. dollar traded mixed to lower against the most major currencies. Yesterday's disappointing the number of initial jobless claims in the U.S. weighed on the U.S. currency. The number of initial jobless claims in the week ending August 9 rose by 21,000 to 311,000 from 290,000 in the previous week.
The New Zealand dollar traded mixed against the U.S dollar in the absence of any major economic reports in New Zealand.
The Australian dollar rose against the U.S. dollar due to yesterday's weaker-than-expected number of initial jobless claims in the U.S. No major economic reports were released in Australia.
The Japanese yen traded mixed against the U.S. dollar in absence of any major economic reports in Japan.
EUR/USD: the currency pair traded mixed
GBP/USD: the currency pair traded mixed
USD/JPY: the currency pair traded mixed
The most important news that are expected (GMT0):
12:30 Canada Manufacturing Shipments (MoM) June +1.6% +0.5%
12:30 U.S. PPI, m/m July +0.4% +0.1%
12:30 U.S. PPI, y/y July +1.9% +1.8%
12:30 U.S. PPI excluding food and energy, m/m July +0.2% +0.2%
12:30 U.S. PPI excluding food and energy, Y/Y July +1.8% +1.6%
12:30 U.S. NY Fed Empire State manufacturing index August 25.6 20.3
13:00 U.S. Total Net TIC Flows June 19.4 27.3
13:00 U.S. Net Long-term TIC Flows June 35.5
13:15 U.S. Industrial Production (MoM) July +0.2% +0.3%
13:15 U.S. Capacity Utilization July 79.1% 79.2%
13:55 U.S. Reuters/Michigan Consumer Sentiment Index (Preliminary) August 81.3 82.7
-
09:30
United Kingdom: GDP, q/q, Quarter II +0.8% (forecast +0.8%)
-
09:30
United Kingdom: GDP, y/y, Quarter II +3.2% (forecast +3.1%)
-
06:27
Options levels on friday, August 15, 2014:
EUR / USD
Resistance levels (open interest**, contracts)
$1.3422 (1303)
$1.3404 (682)
$1.3382 (39)
Price at time of writing this review: $ 1.3364
Support levels (open interest**, contracts):
$1.3340 (1790)
$1.3321 (4601)
$1.3296 (4371)
Comments:
- Overall open interest on the CALL options with the expiration date September, 5 is 54227 contracts, with the maximum number of contracts with strike price $1,3400 (5731);
- Overall open interest on the PUT options with the expiration date September, 5 is 56824 contracts, with the maximum number of contracts with strike price $1,3100 (6055);
- The ratio of PUT/CALL was 1.05 versus 1.06 from the previous trading day according to data from August, 14
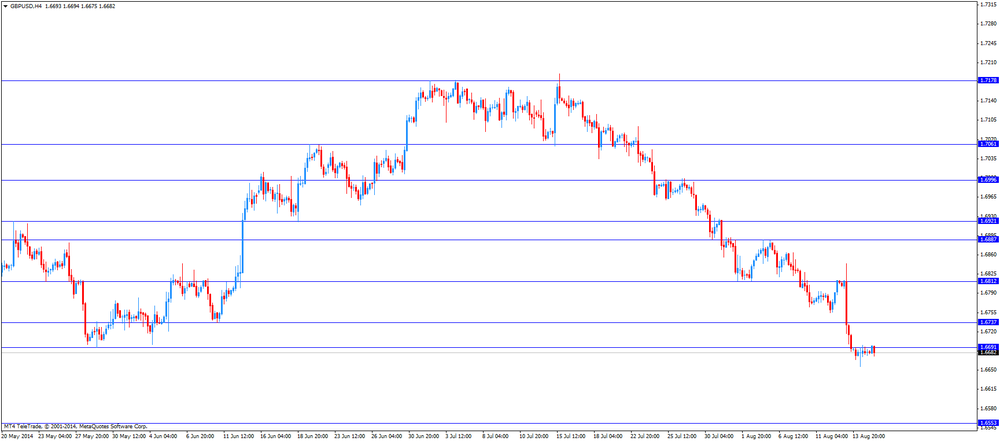
GBP/USD
Resistance levels (open interest**, contracts)
$1.7000 (3314)
$1.6901 (2208)
$1.6803 (1525)
Price at time of writing this review: $1.6692
Support levels (open interest**, contracts):
$1.6596 (1894)
$1.6498 (1920)
$1.6399 (752)
Comments:
- Overall open interest on the CALL options with the expiration date September, 5 is 27465 contracts, with the maximum number of contracts with strike price $1,7000 (3314);
- Overall open interest on the PUT options with the expiration date September, 5 is 29260 contracts, with the maximum number of contracts with strike price $1,6800 (4007);
- The ratio of PUT/CALL was 1.07 versus 1.09 from the previous trading day according to data from August, 14
* - The Chicago Mercantile Exchange bulletin (CME) is used for the calculation.
** - Open interest takes into account the total number of option contracts that are open at the moment.
-