Notícias do Mercado
-
23:39
NZD/USD teases bullish flag confirmation below 0.7200, focus on US GDP
- NZD/USD grinds higher inside a bullish technical set-up.
- Record trade deficit, softer ANZ data probed bulls ahead of the key day.
- Market sentiment sours amid pre-US GDP cautions, central bank moves.
- No major data at home, risk catalysts are important for fresh impulse.
NZD/USD remains directionless, taking rounds to the weekly top during the initial Asia session on the key Thursday. That being said, the kiwi pair recently retreats to 0.7170 following the first daily negatives in four.
Although hopes of the heavy rate hike by the Reserve Bank of New Zealand (RBNZ) and carry trade keep NZD/USD afloat, recently soft data at home join cautious mood to weigh on the quote of late.
New Zealand (NZ) Trade Balance shrank more than $-2139M (revised) prior to $-2171M in September to mark the all-time low MoM figures. However, the Imports and Exports were better than their previous readouts as the former rose past $6.495 billion to $6.57 billion whereas the latter grew to $4.4 billion versus $4.351 billion.
On the same line were downbeat figures of October’s Business Confidence and Activity Outlook by the Australia and New Zealand Banking Group (ANZ).
Alternatively, a lower-than-expected US Good Trade Balance and improvement in Durable Goods Orders probed the US dollar bulls ahead of the key Q3 GDP.
It should, however, be noted that the increasing optimism over the monetary policy tightening by the front-line central banks also hints at a reduction in the carry trade and challenge the NZD/USD bulls. Recently, the Bank of Canada (BOC) announced the end of bond purchases and the UK also cuts bond issuance. Further, Australia’s strong prints of the RBA Trimmed Mean CPI also push the Reserve Bank of Australia (RBA) towards a rate hike.
Amid these plays, the US 10-year Treasury yields dropped the most since mid-August and weighed on the US Dollar Index (DXY). However, the equities were mixed and the futures are mildly bid by the press time.
Looking forward, a light calendar at home keeps NZD/USD moves at the mercy of external factors. The same highlight today’s speech from RBA Deputy Governor Guy Debelle and Australia’s Import-Export Price Index for Q3. However, major attention will be given to the preliminary readings of the US Q3 GDP for clear direction.
Read: US Third Quarter GDP Preview: A most uncertain estimate
Technical analysis
NZD/USD prints a bullish flag chart pattern on the four-hour (4H) timeframe amid firmer RSI, suggesting a need for the breakout to portray a fresh upside.
The 0.7190 mark acts as a trigger for the north-run aiming a rally towards 0.7360 theoretical target, with May’s high near 0.7315-20 acting as an intermediate halt. Alternatively, 50-SMA restricts immediate declines around 0.7150 before the flag’s support line, close to 0.7120. In a case where the quote drops below 0.7120, the 100-SMA and 50% Fibonacci retracement of October 06-21 upside, around 0.7050, will be in focus.
NZD/USD: Four-hour chart
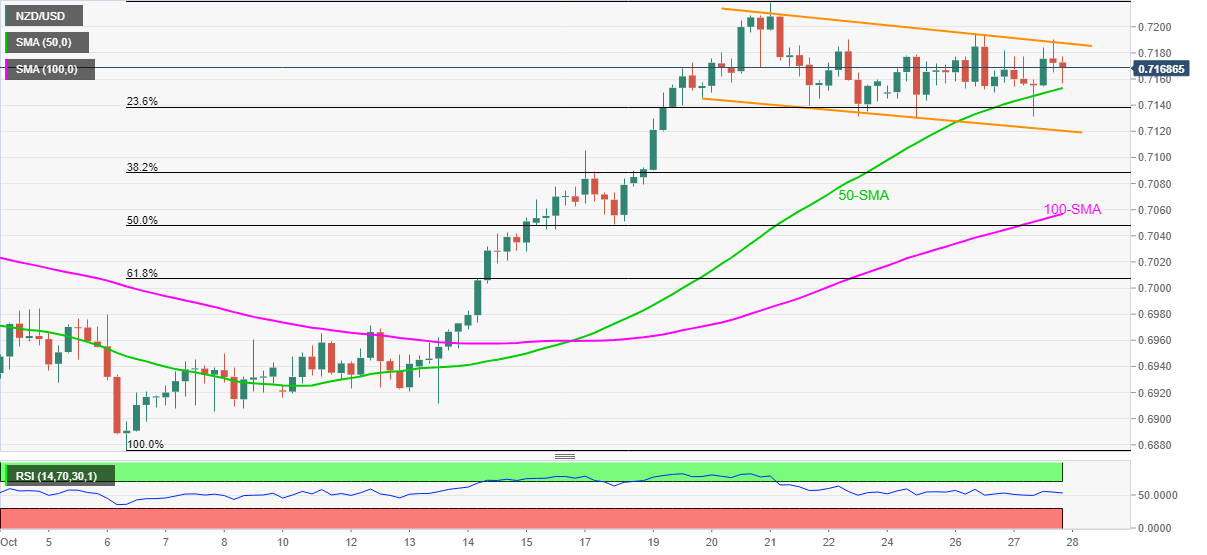
Trend: Bullish
-
23:38
USD/JPY consolidates below 114.00 ahead of BOJ decision, US critical data
- USD/JPY consolidates on Thursday in the initial Asian session.
- Lower US Treasury yields undermine the demand for the US dollar.
- BOJ interest rate decisions will be on the traders radar.
USD/JPY continue to move sideways following the previous session’s downside movement. The pair stayed in a narrow trading range. At the time of writing USD/JPY is trading at 113.81, down 0.01% so far.
The US benchmark 10-year T bond yields fell to 1.53%, the biggest decline since July, which underscores the demand for the greenback. Investors remained concerned about rising inflation, supply chain issues, and downbeat data.
The greenback remains steady near 93.80, following downbeat economic data. The US New Durable Goods orders fell less than estimated in September. The rise for August was revised down to 1.3% growth from 1.8%.
On the other hand, the Japanese yen struggles to find demand ahead of the Bank of Japan (BoJ) policy update. The BoJ is expected to maintain its massive stimulus program and cut this year’s inflation forecasts at its meeting on Thursday.
It is worth noting that, S&P 500 Futures are trading at 4,550.50,up 0.13% so far.
As for now, traders are waiting for Japan Retail Sales, BOJ Interest Rate Decision, and US GDP Growth Rate to gauge the market sentiment.
USD/JPY additional levels
-
23:12
White House pushes for budget talks, Democrats add extra meeting for US Pres. Biden
“President Joe Biden’s top budget official urged lawmakers to swiftly broker an agreement on spending levels for federal agencies for the current fiscal year,” said Bloomberg during early Thursday morning in Asia.
The news adds the reasons behind the move as to, “Avoid another stopgap bill when the current short-term measure runs out in a little over six weeks.”
Key quotes (from Bloomberg)
In a letter obtained by Bloomberg News, Acting Budget Director Shalanda Young wrote to the leaders of the House and Senate Appropriations Committees urging swift talks on top-line spending levels for the year that began October 1.
The 12 draft bills cover regular agency spending, distinct from the longer-term economic bills now before Congress. Democratic congressional leaders are hoping to pass Biden’s estimated $2 trillion tax and social safety net package and a $550 billion bipartisan infrastructure bills in the coming days.
Lawmakers will then need to pivot to avoiding a government shutdown after Dec. 3, when the current stopgap funding measure runs out, addressing the federal debt ceiling. The Treasury’s borrowing authority is set to run out around the same Dec. 3 deadline.
On a different page, the US House Democrats have added an extra meeting around 13:00 GMT Thursday for negotiations over US President Joe Biden’s stimulus plan. The reason could be the latest demands from the Republicans to remove the majority of Biden’s component from the stimulus proposal.
Late on Thursday, Reuters came out with the news saying, "White House spokeswoman Jen Psaki said on Wednesday that it is still realistic for congress to get a deal on U.S. President Joe Biden's signature spending agenda by Thursday." The hopes of a deal on Thursday were also backed by the Senator Joe Manchin.
FX implications
The news adds to the cautious sentiment in the market and weighs on the S&P 500 Futures by the press time.
Read: AUD/USD: Bulls take a breather below 0.7565 hurdle ahead of US GDP
-
23:06
GBP/JPY steady around 156.40 amid a mixed market sentiment
- GBP/JPY gave back its Tuesday’s gains, as investors flew towards safe-haven assets, the Yen is up.
- Market sentiment has dampened, as robust US Q3 corporate earnings fade, alongside month-end flows.
- UK’s economy expected to grow 6.5% in 2021 – UK’s Office for Budgetary Responsibility.
On Wednesday, the GBP/JPY seesawed at a wide range, dipping down from 157.27 to 155.70, ultimately stabilizing around 156.40 as the Asian session began.
The market sentiment Is mixed as the Asien session kicks in
As the New York session winds down, the market sentiment was mixed, as showed by US stock indices finishing in the red, except for the heavy-tech Nasdaq Composite, which printed gains of 0.25% on the back of Microsoft and Google Alphabet.
Uncertainties like the US fiscal policy, central bank tightening, and inflationary pressures kept investors uncomfortable, as some safe-haven currencies appreciated in tandem with precious metals. That, in part, boosted the prospects of the Japanese yen, which despite non-important information on its macroeconomic docket, relied on its safe-haven status versus the risk-sensitive British pound.
In the meantime, in the UK, Rishi Sunak, the Chancellor of the Exchequer, presented the Autumn 2021 British budget. Sunak appeared at the Parliament. He said that the British economy would expand by 6.5% in 2021, better than the 4% predicted during COVID-19 lockdowns. Putting this aside, the Office for Budgetary Responsibility (OBR) expects a deficit contraction, to 7.9% of the GDP, from previous forecasts of 10.3%.
GBP/JPY Price Forecast: Technical Outlook
Weekly chart
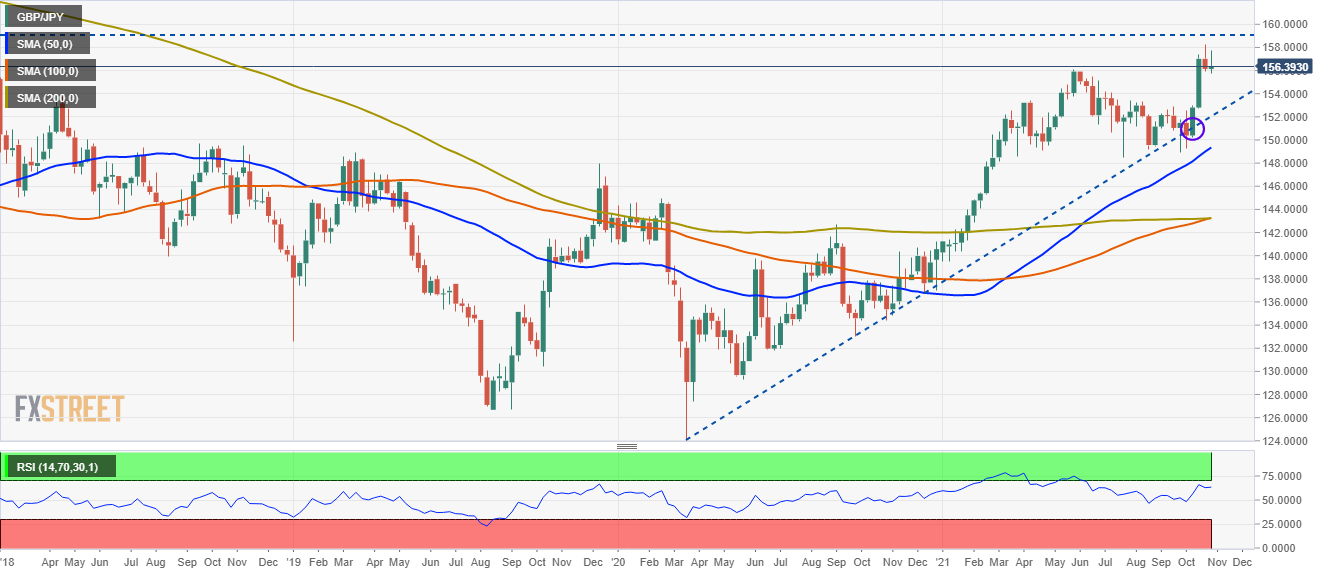
The weekly chart depicts the GBP/JPY pair is in a solid upward trend portrayed by rising slope weekly simple moving averages (WSMA’s) located beneath the spot price, alongside a test of the February 2, 2018, resistance level at 156.61. Since July, the cross-currency has appreciated 6.50%, and the 100-WSMA is just crossing over the 200-WSMA, adding another bullish sign to the previously mentioned hints.
Furthermore, an upward slope trendline that travels from March 2020 lows under September 2020 lows was unsuccessfully tested by the GBP/JPY pair, which bounced off at 150.00, rallying over 700 pips until finally settling at current levels.
Hence, the pair could be headed towards the upside. However, the lack of recent price action above the 156.00 threshold leaves June 24, 2016, swing highs around 159.20 as the next resistance level.
-
22:56
GBP/USD Price Analysis: Sellers attack 50-DMA on monthly support break
- GBP/USD fades bounce off weekly low, keeps monthly support line breakdown.
- Bullish MACD challenges downside past 50-DMA, recovery moves have a bumpy road below 200-DMA.
GBP/USD prints a three-day downtrend following the key support break, pressured around 1.3740 during the early Asian session on Thursday.
The cable pair broke an ascending support line, now resistance, from September 30 the previous day but refrained from closing below 50-DMA.
Given the bullish MACD signals and multiple supports around the 1.3710-3700 area, comprising 50-DMA and 50% Fibonacci retracement of late July-September fall, the GBP/USD pair’s heavy downside remain doubtful.
However, a daily closing below 1.3700 won’t hesitate to direct the pair bears towards August lows of 1.3600.
Meanwhile, a convergence of the previous support and 61.8% Fibonacci retracement level near 1.3770-75 guards the quote’s corrective pullback ahead of the 200-DMA level surrounding 1.3855.
In a case where GBP/USD bulls manage to conquer the 1.3855 hurdle, September’s high of 1.3913 and July peak close to 1.3985 may probe the run-up towards the 1.4000 psychological magnet.
GBP/USD: Daily chart
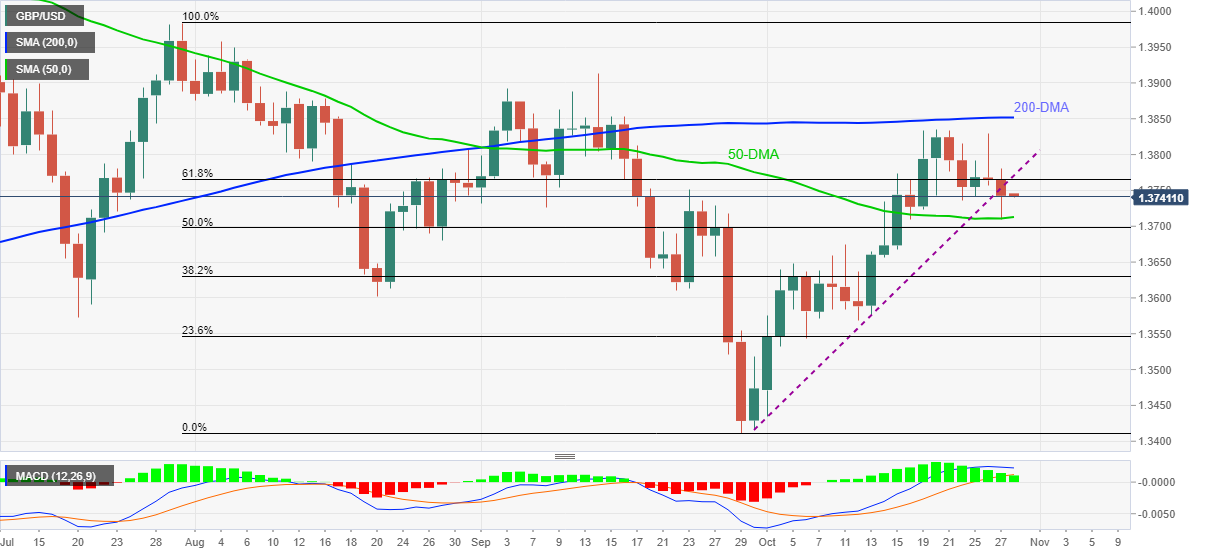
Trend: Further weakness expected
-
22:40
Brazil Interest Rate Decision came in at 7.75%, above forecasts (7.25%)
-
22:39
AUD/USD: Bulls take a breather below 0.7565 hurdle ahead of US GDP
- AUD/USD seesaws around monthly high, retreats of late.
- Strong RBA Trimmed Mean Inflation prints join global central bank actions to favor bulls.
- Softer yields, mixed US data weigh on USD to offer additional upside momentum.
- Australia’s Import-Export Price Index, RBA’s Debelle can entertain traders ahead of Q3 US GDP.
AUD/USD seesaws around monthly high, despite recently easing to 0.7520 during the four-day uptrend at the start of the key Thursday.
The risk barometer pair previously benefited from a jump in the Reserve Bank of Australia (RBA) preferred inflation gauge before the global central banks portrayed tapering moves. However, the bulls are recently cautious ahead of the speech from RBA Deputy Governor Guy Debelle and preliminary readings of the US Q3 GDP.
Australia’s headlines Consumer Price Index (CPI) matched 0.8% QoQ forecast for the third quarter (Q3) release while the YoY figures eased below 3.8% prior and 3.1% market consensus to 3.0%. However, it was the RBA Trimmed Mean CPI that lured the bulls with a six-year high yearly print of 2.1%, versus 1.8% expected and 1.6% prior. The central bank’s preferred gauge of inflation rose past 0.5% market forecast and previous readouts to 0.7% on QoQ.
With the inflation figures back to the RBA’s 2-3% target range for the first time since 2015, the Aussie central bank is likely rushing towards the rate hike and joining its Western pals. Such speculations propelled the Treasury bonds at home to a multi-year high, before retreating a bit and fueling the AUD/USD prices.
In addition to the increasing hopes of the RBA’s rate hike, the UK’s cut in bond issuance and the Bank of Canada’s (BOC) end of tapering were additional signals that the global central bank is more confident, which in turn fuelled AUD/USD due to its safe-haven allure.
Elsewhere, a lower-than-expected US Good Trade Balance and improvement in Durable Goods Orders probed the US dollar bulls ahead of the key Q3 GDP. The same joined the optimism at other central banks and weighed on the US Treasury yields, as well as the US Dollar Index (DXY). It should be noted, however, that the equities were mixed and the commodities dropped as risk-averse traders await the key US data amid Fed tapering tantrums.
Read: US Third Quarter GDP Preview: A most uncertain estimate
While the US Q3 GDP will be important for AUD/USD moves, RBA’s will be eyed more closely for immediate moves as the Aussie policymakers previously highlighted the need for firmer wages to accept the reflation fears. Hence, any hints of the firmer inflation pushing the RBA towards a rate hike will be welcomed with zeal by the AUD/USD buyers while an otherwise case may take clues from the pre-US GDP sentiment to probe the upside moves.
Technical analysis
Although AUD/USD bulls seem to have tired below the 200-DMA near, the monthly support line and a hidden bullish divergence, a condition where prices make lower high but the RSI prints higher high, keeps the upside momentum intact. Hence, even a short-term pullback remains less convincing until the quote stays beyond the stated support line around 0.7495. However, the 200-DMA level close to 0.7565 acts as the key hurdle to watch during the fresh run-up.
-
22:20
US Stoks Forecast: Nasdaq supported by tech big caps
- The Dow Jones Industrial Average fell 266.19 points, or 0.74%,
- The S&P 500 lost 23.11 points, or 0.51%, and the Nasdaq Composite added 0.12 points.
US stocks were mixed on Wednesday as strong results from technology heavyweights kept the Nasdaq Composite in the green. However, declining government bond yields and a drop in commodity prices sent the Dow Jones Industrial Average and the S&P 500 lower.
The Nasdaq finished little changed on Wednesday, supported by gains in Microsoft and Google parent Alphabet following quarterly results. The Dow Jones Industrial Average lost 266.19 points, or 0.74%, to 35,490.69, the S&P 500 dropped 23.11 points, or 0.51%, to 4,551.68 and the Nasdaq Composite added 0.12 point, or unchanged, to 15,235.84.
As for performers, Microsoft Corp MSFT added 4.21% and ended making a record high after forecasting a strong end to the calendar year. Alphabet Inc rallied 4.96% after reporting a record quarterly profit on a surge in ad sales. The move combined added 90 points to the Nasdaq. Microsoft was the biggest boost to the Dow Industrials, S&P 500 and Nasdaq. Meanwhile, the drop in the far data US Treasury bond yields and a flattening of the yield curve lifted the growth stocks which were the only advancing S&P sectors on the day.
The benchmark 10-year US Treasury yield declined for a fourth straight day, dropping more than 6 basis points to put it on track for its biggest one-day decline since Aug 13. Thus taking it below the daily dynamic trendline support and opening bearish prospects:

-
21:21
EUR/USD Price Analysis: Bears stepping in as US yields melt
- EUR/USD is currently trapped between critical support and resistance.
- The single unit is faring better following a fall in US yields.
EUR/USD is slightly firmer on the day trading around the 1.16 figure after rising from a low of 1.1548 to a score a high of 1.1626 following a drop in US yields as follows:
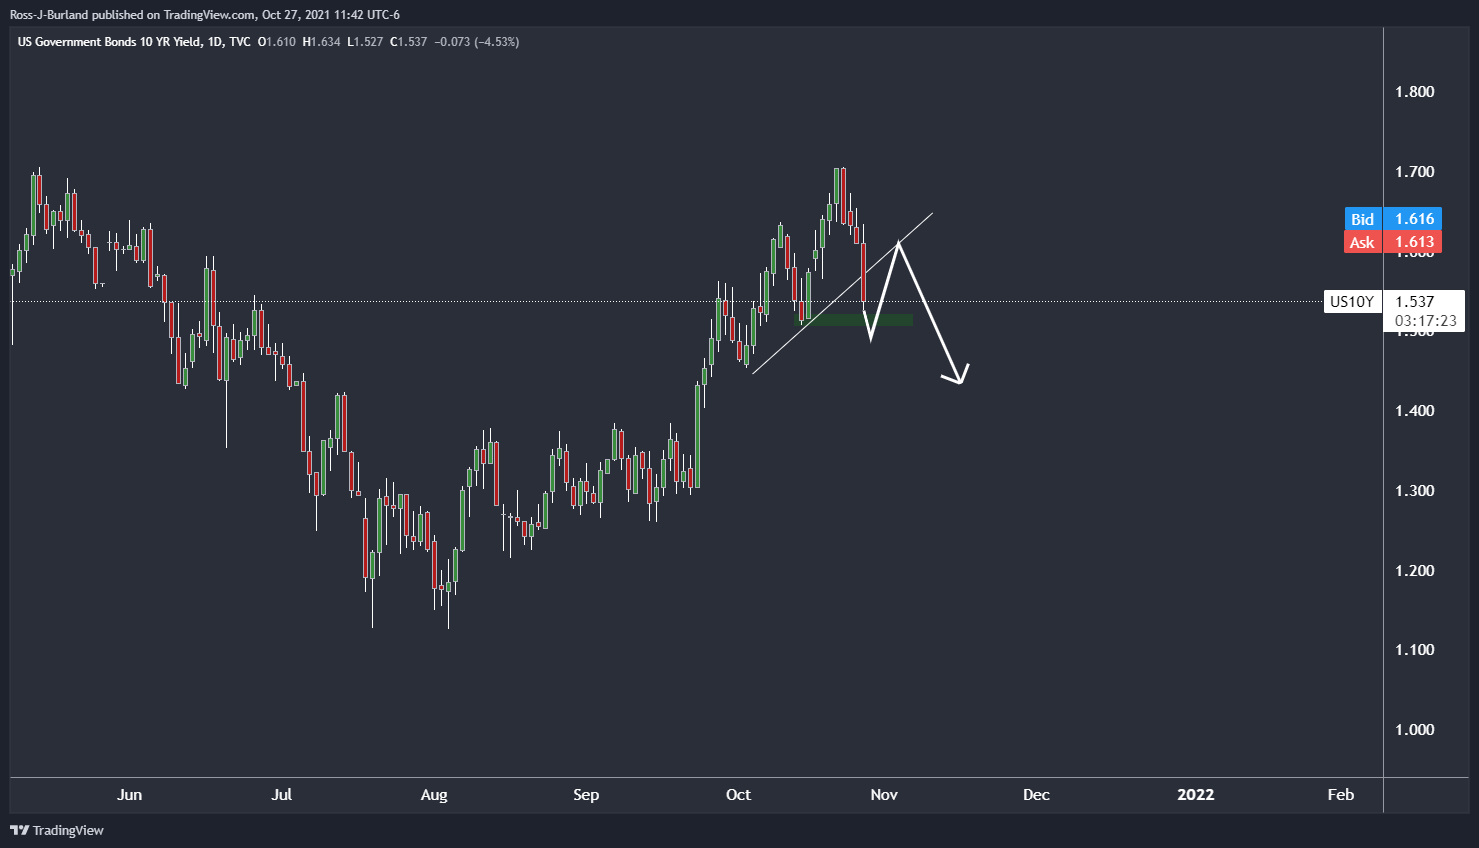
The 10-year yield is testing the horizontal support and has broken below the trendline. On a restest of what is now regarded as a counter trendline, should the bears step in, the US dollar would be expected to be pressured also. This gives rise to bullish prospects for the single currency as follows:
EUR/USD weekly chart
The weekly chart offers a bearish bias at this juncture, pressure below the resistance.
EUR/USD daily chart
As for the daily chart, the price is trapped between critical support and resistance following a test of the M-formation's neckline.
EUR/USD 4HR chart
The 4-hour chart illustrates the trapped scenario and the critical levels of support and resistance structure shown in the chart above.
-
20:58
USD/CAD downward move capped at 1.2300, steady around 1.2350
- USD/CAD trims some of its daily losses, despite BoC ending QE.
- USD/CAD plunged 130 pips once the central bank released its monetary policy decision.
- Bank of Canada will begin the "reinvesting phase," meaning a replacement of maturing bonds for new ones.
- Bank of Canada: If inflation is stickier than expected, the bank will act to bring it down.
The USD/CAD slumps for the first time in the week, down 0.25%, trading at 1.2358 during the New York session at the time of writing. Earlier 30-minutes into the New York stock market session, the Bank of Canada (BoC) released its monetary policy statement announcing the ending of its weekly pandemic bond-purchasing program.
Furthermore, the BoC decided to keep interest rates unchanged. However, investors' expectation towards the QE was a reduction in its weekly purchases from CAD 2 billion to CAD 1 billion. Instead, the central bank decided to halt its stimulus, as the threatening of stickier inflation clouds the economic growth.
The USD/CAD pair reaction to the BoC decision
Before the announcement, the pair was trading at 1.2430 but plummeted on the announcement 130 pips, touching the daily low at 1.2300.
BoC Governor Tiff Macklem: We will consider raising rates sooner than we had previously thought
One hour after the release of the Statement, BoC Governor Tiff Macklem held a press conference. He said that despite the bank's decision to finalize the QE program, significant stimulus to the economy would remain in the palace.
The end of QE comes as increasing vaccination rates are enabling continued progress in the economic recovery in Canada and around the world", said the BoC in the opening statement.
Additionally, the central bank announced that it would end the QE program, but it will begin the "reinvesting phase." The BoC will purchase bonds only to replace those maturing, meaning that the overall holdings remain stable over time.
Further, Macklem added that he believes there are good reasons for inflation to ease in 2022 but warned that if they see signs of prolonged inflation, they will take action to curb elevated price pressures.
-
20:43
Forex Today: The global tightening spree has just started
What you need to know on Thursday, October 28:
The greenback seesawed between gains and losses, ending the day weaker against most major rivals, although within familiar levels. Demand for the greenback eased as yields retreated further. The yield on the 10-year Treasury note currently stands at 1.54%, while that on the 2-year note ticked higher, now at 0.50%. The yield curve is flattening, usually a hint of a rate hike cycle.
Speculation of tighter monetary policies across the board was fueled by news that Australian inflation surged at its fastest annual pace since 2015 in the three months to September. According to the official report, the RBA Trimmed Mean CPI was up 2.1% YoY, well above the 1.8% expected and the previous 1.6%. The quarterly figure printed at 0.7% up from 0.5% in the second quarter. Investors were caught off guard and rushed to price in an earlier interest rate hike.
Additionally, the Bank of Canada announced it has decided to end its weekly purchases of government bonds, the first central bank to end pandemic-related facilities, surprising investors who were speculating on a gradual reduction of QE. The US Federal Reserve, the Bank of England and even the European Central Bank, are also in the tapering path, with movements there expected for the next quarter. The Bank of Japan and the ECB will announce their decisions this Thursday, while the Fed will meet next week.
Global indexes edged mostly lower. In Wall Street, only the Nasdaq Composite was able to post some gains.
Gold edged higher, ending the day around $1,796 a troy ounce, while crude oil prices plummeted. WTI settled at $82.10 a barrel after the EIA reported a larger than anticipated build in local stockpiles of 4.267 million.
Like this article? Help us with some feedback by answering this survey:
Rate this content -
20:24
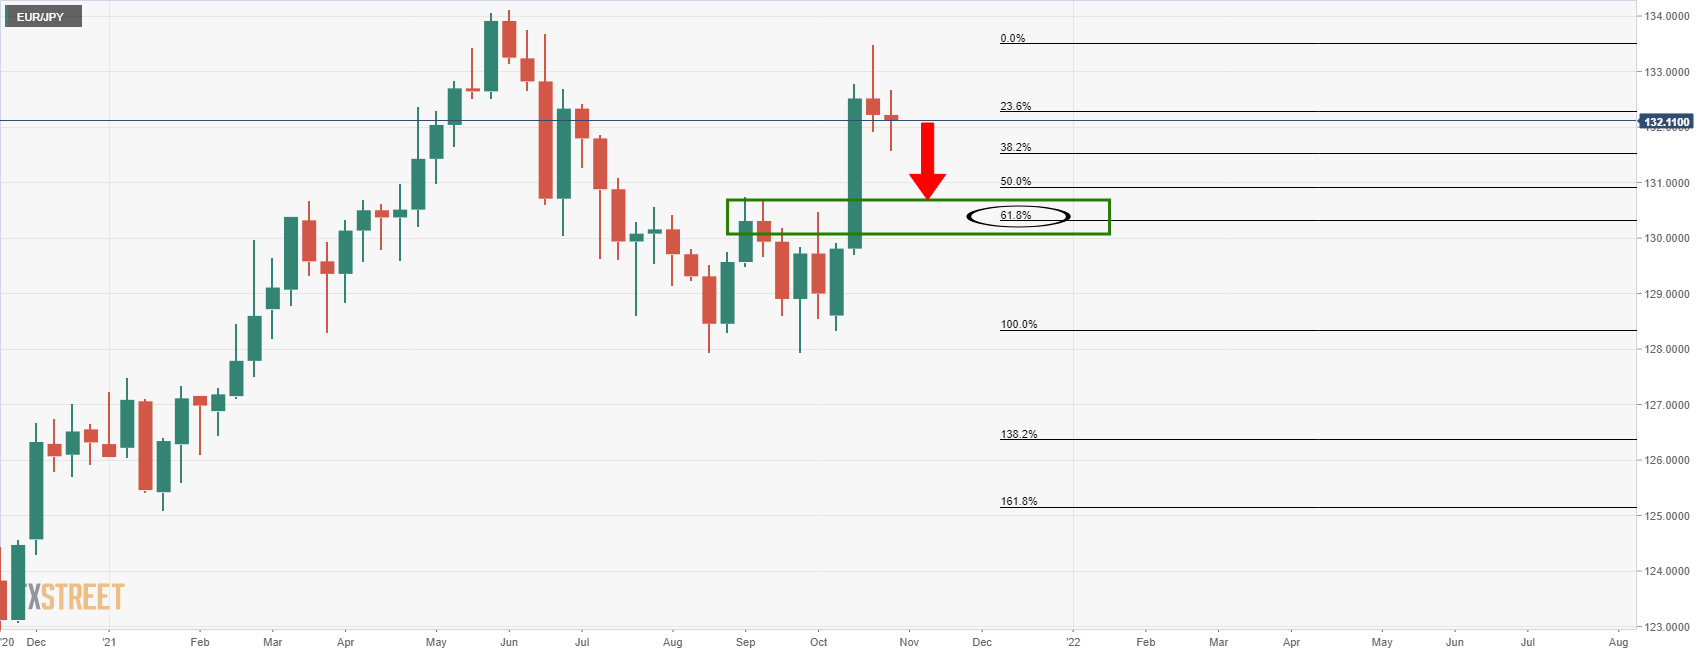
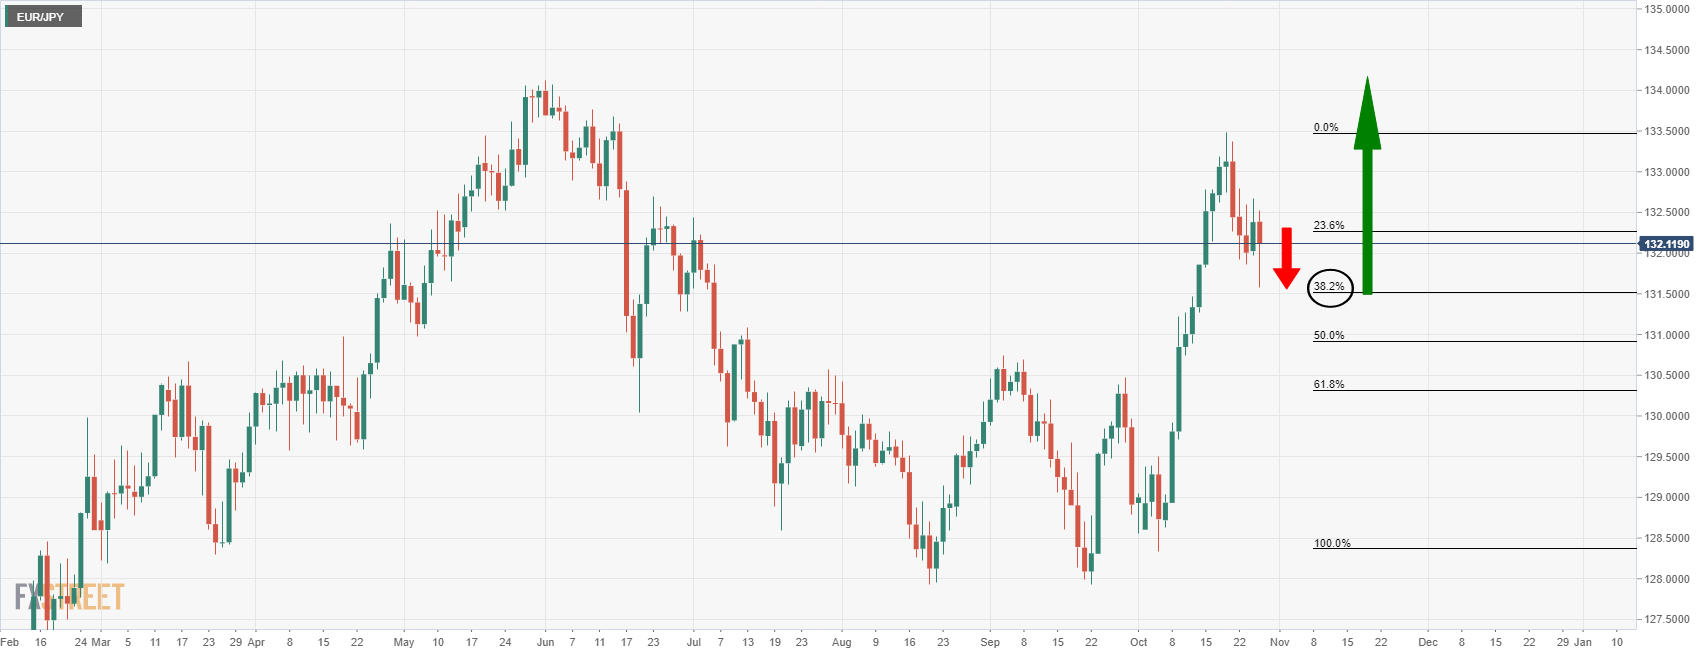
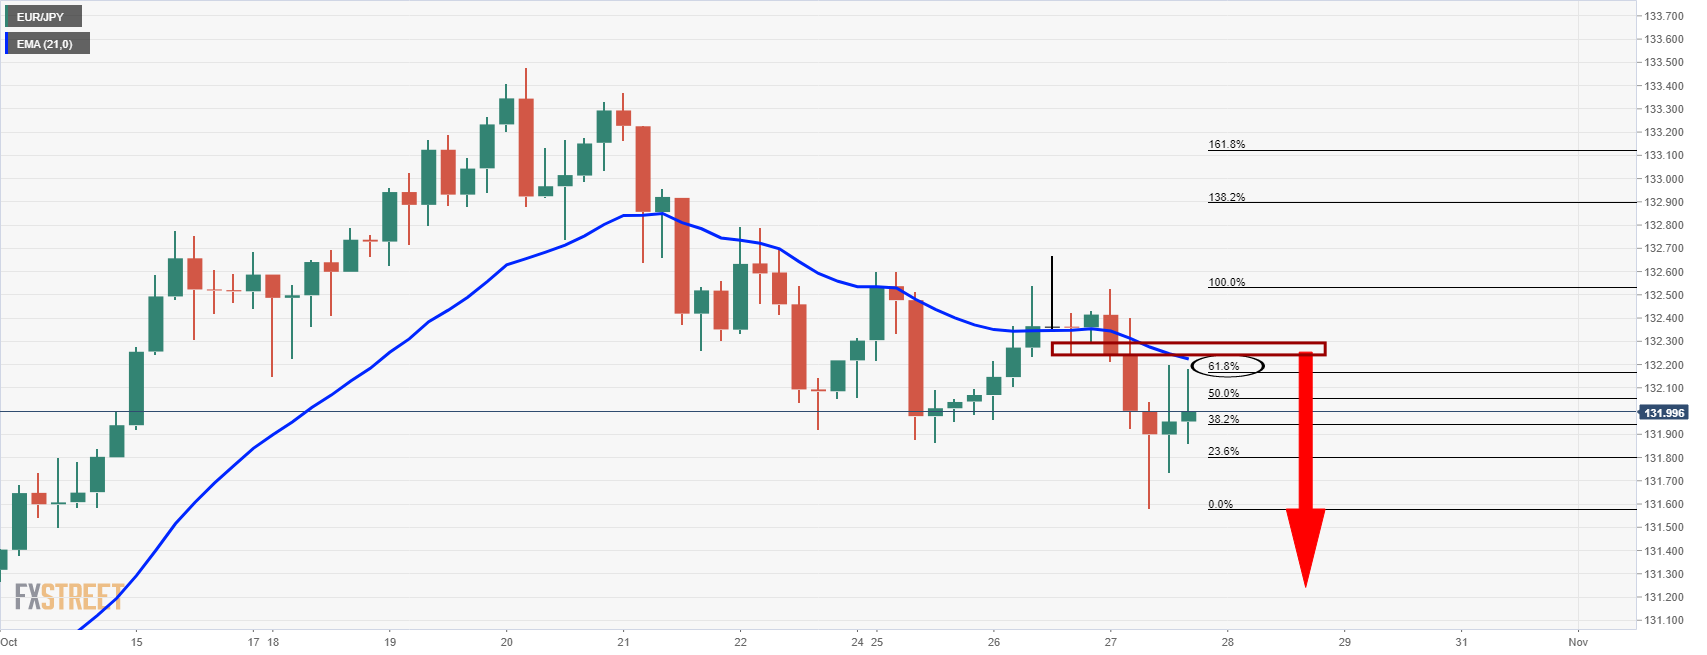
EUR/JPY Price Analysis: Bulls seek a monthly extension, but bears in control on the 4-hour
- EUR/JPY bears on top n the ower time frames.
- Bulls are taking charge longer-term as per the monthly chart.
EUR/JPY is under pressure as per the lower time frames and the following is a top-down analysis that arrives at a bullish bias longer term, but bearish for the near term.
EUR/JPY monthly chart
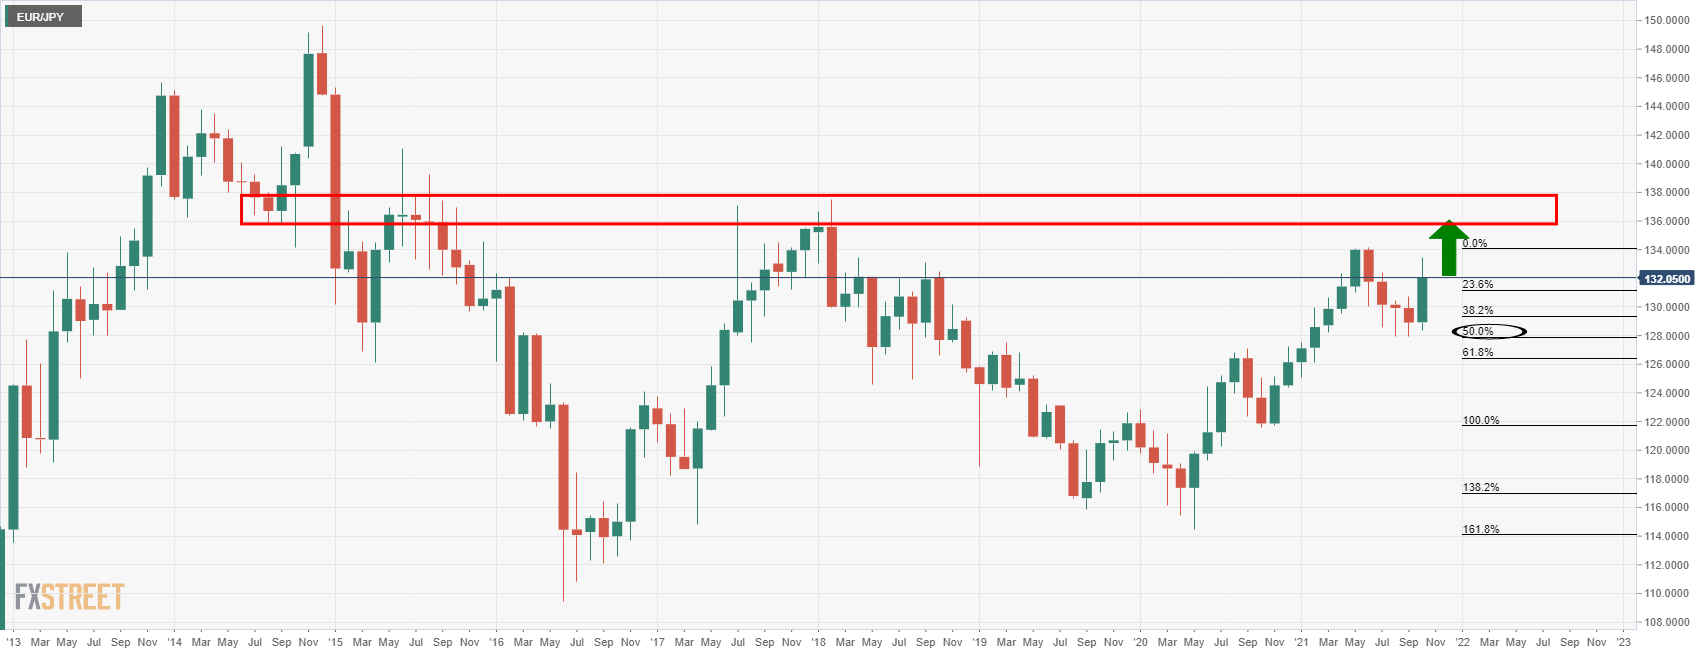
The monthly chart is showing signs of a fresh impulse to the upside, although there could still be some work to be done yet by the bulls according to the lower time frames.
EUR/JPY weekly chart
The weekly chart is offering a bearish bias as the price continues to slip following the big rejection wick of last week's business.
EUR/JPY daily chart
On the daily chart, we can see that the price is attempting to recover from a close touch of the 38.2% Fibonacci. retracement level. However, given the velocity of the correction, the momentum is still with the bears and a visit of 131.50 is probable.
EUR/JPY 4HR chart
The 4-hour chart is offering a bearish bias also with the price coming in close to the 61.8% Fibonacci retracement level and caped bt the 21-EMA.
-
20:13
NZD/USD stalls at 0.7200, steady around 0.7177 amid risk-off market sentiment
- The NZD/USD gains despite mixed market sentiment but struggles at 0.7200.
- The commodity currencies edge higher against the greenback.
- NZD/USD: The daily chart confirms the upward bias, but NZD bulls, to accelerate the trend, will need to reclaim 0.7200.
The NZD/USD advances for the fourth consecutive day, despite mild risk-off market sentiment is up 0.27%, trading at 0.7183 during the New York session at the time of writing.
Major US equity stocks are mixed as the New York session wanes. The S&P and the Nasdaq Composite rise 0.09% and 0.94%, respectively, while on the other hand, the Dow Jones losses 0.27%. Investors remain at bay due to month-end flows, US fiscal policy uncertainties, and central bank pandemic-stimulus ends.
That said, antipodean currencies and the Canadian dollar advance against the greenback. Meanwhile, the US Dollar Index, which tracks the buck’s performance against a basket of its peers, slumps 0.16%, sits at 93.79.
It is worth noting that on Wednesday, the Bank of Canada ended its weekly QE program, adding to the Reserve Bank of New Zealand as the only central banks, that are normalizing their monetary policy.
Turning to US fiscal policy, according to wires, US President Joe Biden reportedly agreed to push for a deal as soon as possible in a meeting with lawmakers. Also, the US Senate Finance Committee Chairman Ron Wyden unveiled a 23.8% tax proposal focused on unrealized gains of assets held by billionaires, affecting 700 people.
Macroeconomic data from New Zealand reported that the ANZ Business Confidence dropped from -8.6 in September to -13.4 in October. Furthermore, Statistics of New Zealand said that the Trade Balance deficit expanded in September.
Meanwhile, in the US economic docket, Durable Good Orders for September contracted by 0.4%, less than the 1.1% expected by analysts. On the other hand, the Nondefense orders, excluding aircraft, expanded by 0.8%, higher than the 0.5% estimated.
NZD/USD Price Forecast: Technical outlook
The NZD/USD daily chart depicts the pair has a bullish bias, portrayed by daily moving averages (DMA’s) beneath the spot price, with an upward slope.
Furthermore, the Relative Strength Index (RSI), a momentum indicator at 66, edges slightly up, confirming the abovementioned, but the trend seems to fade. NZD bulls to accelerate the upward trend speed will need a daily close above 0.7200. In that outcome, they will find immediate resistance at 0.7219. A clear break of the latter would expose crucial supply zones, the June 7 high at 0.7244, followed by the 0.7300 thresholds.
NZD/USD TECHNICAL LEVELS TO WATCH
-
20:09
USD/CHF unable to regain 0.9200, edges down to 0.9170
- The dollar fails to return above 0.9200, edges down to 0.9170 area.
- US dollar loses momentum on the back of softer US T-bond yields.
- USD/CHF remains weak while below 0.9200.
The US dollar is trading lower on Wednesday after having failed to return above 0.9200. The pair depreciates 0.3% on the daily chart, retreating towards the 0.9170 area amid moderate dollar weakness.
The USD loses ground amid lower US Treasury bonds
The pair has confirmed its reversal from Tuesday’s high at 0.9225 weighed by broad-based US dollar weakness. The decline in US T-Bond yields, which have fueled USD’s rally from late July lows is pulling the dollar lower across the board.
The yield on the benchmark 10-year note has dropped to 1.52% on Wednesday, down from the multi-month highs at 1.68% hit last week. The hawkish message from the Bank of Canada, which confirmed the end of its QE program earlier today, has rattled debt markets with the investors bracing for a similar decision by the Federal Reserve at next week’s meeting.
On the macroeconomic front, US data has been mixed today with orders for durable goods manufactured in the US contracting less than expected in September, due to a solid increase of non-defense capital goods. On the other hand, the US goods trade deficit widened to $96.3B in September from $89.4B in the previous month on the back of a sharp decline in exports which will have a negative impact on the third quarter’s growth.
USD/CHF: Near-term trend remains negative below 0.9200
Technical indicators show the near-term USD/CHF trend biased lower, after having broken the upward channel from early August lows, with next potential targets at 0.9150 (October 22 and 24 lows) and 0.9100 (August 18 and 30 lows), which might expose August 4 low at 0.9020.
On the upside, a bullish reaction past 0.9225 (October 26 high) would ease negative pressure and confirm the breach of trendline resistance, increasing positive traction towards October 18 high at 0.9275 and then 0.9310 (October 12 and 13 highs).
USD/CHF Daily Chart
Technical levels to watch
-
19:18
Gold Price Forecast: Bull’s eye $1,800 as US T-bond yields plummet as central banks cut stimulus
- The Bank of Canada adds to the RBNZ as the only central banks that finished its pandemic QE.
- US T-bond yields plunged once the BoC decision hit the wires.
- Gold aims higher, as nervousness grows on investors, of what the Federal Reserve might do next.
Gold (XAU/USD) climbs during the New York session, is up 0.20%, trading at $1,796.47 a troy ounce at the time of writing. The non-yielding metal recovered some of its brightness as the session progressed, boosted by safe-haven flows.
Risk-off market sentiment spurred my month-end flows and US fiscal policy concerns, kept investors at bay. Furthermore, the economic growth outlook and central bank tightening monetary policy conditions seem to weigh on lately, hurting the greenback thus favoring gold.
In the meantime, the US T-bond yields plummet in the session, with the 10-year note breaking decisively below the 1.60% threshold, sitting at 1.535% down eight basis points, weighing on the greenback, as noted by the US Dollar Index falling 0.16%, at 93.79.
It is worth noting that on Wednesday, the Bank of Canada ended its weekly bond-purchasing program, that in turn, weighed on investors as yields plunged severely in the session.
That said, expectations around gold lie heavily on the Federal Reserve November meeting. A $15 Billion bond taper is priced in. However, If the Federal Reserve aims for a quicker than expected bond-tapering, that might send gold tumbling below the $1,720 threshold and potentially towards a renewed test of 2021 lows.
XAU/USD Price Forecast: Technical outlook
Daily chart
Gold (XAU/USD) spot price is above the confluence of the 100 and 200-day moving average (DMA) and on Tuesday broke a downward slope trendline previously resistance-turned-support, which could be viewed as a bullish signal. The Relative Strength Index (RSI) is at 58, aims slightly low, but as it remains above the 50-midline, it is bullish for the yellow metal.
To resume the upward trend, gold buyers will need a daily close above $1,800. In that outcome, the September 3 high at $1,834 would be the first resistance level. A clear break above the latter would expose the June 4 low at $1,855, followed by the $1,900 threshold.
XAU/USD TECHNICAL LEVELS TO WATCH
-
19:15
GBP/JPY finds support at 155.90 and bounces up towards 156.45
- Pound reversal from 157.75, contained at 156.00 area.
- The sterling trims losses following an upbeat UK Budget Report.
- GBP/USD remains biased higher, aiming to 158.22 – DBS Bank.
The pound’s reversal from 157.75 witnessed on Tuesday has failed to confirm below the 155.90/00 support area, where the pair found support to bounce up on Wednesday’s US trading time and return to the 156.45 area.
The sterling appreciates on upbeat budget forecasts
The pound has shrugged off the previous weakness on Wednesday, trimming losses against its main rivals on the back of the positive economic forecasts released by the British finance minister, Rishi Sunak, at the Autumn 2021 budget statement.
Sunak assured that The British economy will expand at a 6.5% pace in 2021, beating previous forecasts of a 4.0% growth predicted at the time when COVID-19 lockdowns were still active. Beyond that, the Office for Budgetary Responsibility (OBR) expects the deficit for the financial year to shrink to 7.9% of the GDP, down from previous estimations of 10.3%.
GBP/JPY is expected to resume its uptrend, aiming to 158.22 – DBS Bank
On a broader view, according to Benjamin Wong, Strategist at DBS Bank, expects the pair to resume its uptrend from late-July lows: “A quick look at the daily Ichimoku charts shows bullish momentum remains in a feverish pitch, and there is no affirmation that the 158.22 highs are a verified absolute top. Hence, we remain open to the possibility of the cross assailing higher levels before it ends terminally the bull run that currently came off 148.47, the July 2021 lows.”
Technical levels to watch
-
18:56
US bond market is in a sate of flux post BoC and ahead of the Fed next week
- US yields plunge below daily trendline support and weighs on USD.
- BoC rocks the applecart with a hawkish tone.
Worries around rising inflation, supply chain issues and a slowdown in the economy, continue to weigh on investors’ minds. US yields have taken a knock in trade today with the 10-year yield sliding below critical trendline support while MSCI's global equity benchmark hovers close to Monday's seven-week high, on track for the best month in almost a year.
This has led to an offer in the US dollar that has lost value against major currencies on Wednesday as the Bank of Canada hit a hawkish tone. The moves in debt markets came after the BoC announced that it was ending its quantitative easing program, joining a growing number of central banks that are rolling back their pandemic era programs. The US Federal Reserve is set to meet again next week. The action broke a calm that had settled over the currency markets this week and took the US dollar index down 0.2% to 93.693
The BoC said it now expected slack in the economy to be absorbed in the "middle quarters" of 2022, signalling rates could rise months sooner than previously forecast. Before the announcement, the Canadian dollar traded as highs as 1.2341 vs the greenback, but is now down nearly 0.4% after touching a low of 1.2300, moving in on its lowest level in nearly two weeks. The comments from the Bank of Canada could trigger new assessments of how interest rates will change and impact currencies as central bankers try to support the pandemic recovery without unleashing sustained inflation.
US yields in focus
Meanwhile, the US Treasury's 5-year auction hit a high yield of 1.157% on Wednesday, up from the 0.99% high in the previous auction. The bid to cover ratio for the auction was 2.55, above the 2.37 ratio in the previous auction. Dealers represented 56.86% of the bids, with direct bidders at 10.65% and indirect bidders at 32.49%. For takedown, bidders took 17.85%, with direct bidders at 17.37% and indirects were awarded 64.78%.
The 10-year US Treasury yield plunged over 8 basis points to 1.527% which is a major upset for the forex space. This leaves a bearish prospect on the daily chart as follows:

The moves in yields come as investors prepare for the next move from the Federal Reserve. The Fed is widely expected to begin slowing its asset purchases later this year. Even though yields have retreated below the trend line, the 10-year is still trading well above its recent lows near 1.1% in early August. However, we could still see a continuation of the long-end creeping up as the short end is just basically going to trade based on what the market expects for next year as far as rate hikes go
-
18:43
United States 5-Year Note Auction climbed from previous 0.99% to 1.157%
-
18:28
Silver Price Analysis: XAG/USD remains capped below $24.20/25 resistance area
- Solver prices' recovery from 23.80 lows stalls below $24.25.
- Precious metals edge up on Wednesday, favoured by a softer US dollar.
- XAG/USD is expected to appreciate towards $25.20 – Commerzbank.
Silver futures are attempting to bounce up from intra-week lows at $23.80 on Wednesday. The precious metal has pared previous losses, turning positive on the day, although it remains unable to consolidate above $24.00, with sellers at the $24.20/25 area keeping upside attempts in check.
Precious metals edge up as the US dollar falters
Precious metals are trading in a slightly positive tone on Wednesday’s US session as the greenback loses ground. The US Dollar Index is trading 0.2% lower on the day, retreating from 94.00 to the mid-range of 93.00, weighed by the decline in US Treasury bond yields.
Markets, however, remain broadly calm, moving within narrow ranges, with the investors awaiting monetary policy decisions by the European Central Bank and the Bank of Japan on Thursday, which are expected to give a fresh impulse to the major currency crosses and, probably, set the near-term direction for precious metals.
XAG/USD remains positive, aiming to $25.53 – Commerzbank
From a technical point of view, Karen Jones, Team Head FICC Technical Analysis Research at Commerzbank, remains bullish on silver, expecting the pair to reach levels past $25.00: “Silver has rallied towards and failed just ahead of the $24.95 recent high and looks to be easing back to the 55-DMA at $23.41, provided it stabilizes around here an upside bias will remain (…) Resistance extends up to tougher resistance offered by the 200-DMA at $25.53 and $26.07, the August high. The market will need to regain this area to regenerate bullish impetus. Please note that the 55-week ma also lies at $25.29. We favor the topside but it may take several attempts to clear this band.”Technical levels to watch
-
18:07
GBP/USD recovers from daily lows hover around 1.3750
- Market sentiment is downbeat as investors weigh the Q4 economic outlook and US fiscal policy woes.
- UK’s Treasury reveals a 75 Billion pound budget, slashed taxes to pubs and restaurants.
- UK’s economy to grow 6.5% by the end of the year.
- US Durable Good Orders were better than expected but contracted.
The GBP/USD edges lower during the New York session, down 0.12%, trading at 1.3748 at the time of writing. The London fix lifted the pair as traders suddenly increased the bets on cable, jumping from 1.3720 to current levels.
Factors like month-ending flows, portfolio reshuffling, economic growth concerns, and US fiscal policy woes kept investors’ mood negative, as witnessed by US equity indices falling. Safe-haven currencies like the Japanese yen, the Swiss franc, and the US Dollar benefit on a flight to safe-haven flows.
During the European session, Rishi Sunak, the Chancellor of the Exchequer, revealed a 75 Billion pound budget in which he slashed taxes for pubs and restaurants, cut duties on alcohol, and increased support for the nation’s poorest, he said in a statement on the Parliament.
Furthermore, UK’s economy contracted almost 10% in 2020, but it is set to grow 6.5% by the end of the year, according to the Office for Budget Responsibility (OBR). Also, the OBR expects inflation to average 4%, double of the Bank of England’s target, which the Bank of England has been aware of, as some policymakers had expressed concerns about elevated prices.
An absent UK economic docket leaves GBP/USD traders at the dynamics and developments around the greenback. Meanwhile, in the US economic docket, Durable Good Orders for September contracted by 0.4%, less than the 1.1% expected by analysts. On the other hand, the Nondefense orders, excluding aircraft, expanded by 0.8%, higher than the 0.5% estimated.
That said, GBP/USD trader’s focus turns to the US Gross Domestic Product for the Q3, expected at 2.5%, to be unveiled on Thursday. On Friday, the Fed’s favorite inflation measure, the PCE, will be revealed. Good numbers out of those readings would be positive for the greenback.
GBP/USD Price Forecast: Technical outlook
Daily chart
The GBP/USD pair is in a mild-bearish trend, depicted by the daily moving averages (DMA’s) above the spot price, except for the 50-day moving average at 1.3705 that was tested early in the day.
Furthermore, Tuesday’s price action depicted a grave-stone doji indicating selling pressure mounting on the pair but failed to break below the 50-DMA at the time being.
The Relative Strength Index (RSI) is at 52, aims lower, indicates the downward trend might accelerate but, a pierce of the 50-mid line is required to confirm the abovementioned.
A daily close below the 50-DMA could send GBP/USD tumbling below 1.3700. Key support levels lie ahead on the way south. The first support would be the April 12 low at 1.3669, followed by the October 12 low at 1.35.67, and then the 2021 low at 1.3411.
GBP/USD ADDITIONAL TECHNICAL LEVELS
-
17:41
WTI dips below $83.00 on the back of higher US stocks
- WTI futures depreciate beyond 1% to hit session lows below $83.00.
- Higher than expected US stocks have increased negative pressure on oil prices.
- WTI: testing support at $82.50.
Front-month WTI prices have extended their reversal from multi-year highs at 85.35 on Monday. Crude prices have depreciated more than 1% so far today, reaching session lows at $82.50.
US crude oil stocks increase beyond expectations
Commercial inventories of crude oil increased in the US by 4.3 million barrels last week, according to data released by the US Energy Information Administration. These figures represent a much higher increment than the 1.91 million barrels anticipated by market analysts and have added negative pressure on crude prices.
Oil prices have surged about 35% over the last two months, boosted by concerns that the global increase in demand due to the post-pandemic recovery will cause an energy crunch. Beyond that, the Organization of Petroleum Exporting Countries remains reluctant to increase supply, which has prompted some analysts to forecast crude prices near $100 by the end of the year.
WTI testing support at test support at $82.50 area
WTI futures have accelerated their reversal on Wednesday, retreating below $83.00 to seek support at 82.50. Below here, the next potential targets might be at 81.75 (October 22 low) and $80.80 (October 20 and 21 lows).
Alternatively, a bullish reaction from current levels would send the pair to retest intra-day highs at $84.20 ahead of October 25 high at $85.35, which would open the path towards the 90.00 psychological area.Technical levels to watch
-
17:08
US Durable Goods Orders: Blame transportation for the 0.4% decline – Wells Fargo
Data released on Wednesday showed a lower-than-expected slide in Durable Goods Orders in September. Analysts at Wells Fargo point out weakness in transportation orders was largely behind the 0.4% decline in the main index. They point out numbers continue to demonstrate a manufacturing sector strapped by a lack of supply.
Key Quotes:
“Durable goods orders slipped 0.4% in September, but declines can largely be traced to the volatile transportation sector. Excluding transportation, orders advanced for the seventh consecutive month, rising 0.4%. While the trend in core orders has been rather resilient, the data for September continue to demonstrate a manufacturing sector strapped by a lack of supply.”
“The weakness in transportation orders was largely expected. The 27.9% decline in aircraft orders is consistent with orders data from Boeing, which revealed just 27 new orders during the month, around half of what is traditionally seen during September, and down from 53 new orders in August.”
“Outside transportation, the orders details were pretty mixed. Orders for machinery and metals increased, but computers and electrical equipment orders decreased. Overall, the continued gain in core capital goods orders in September is encouraging and points to ongoing strength in capital investment.”
“This morning's data present some upside risk to our call for equipment spending to decline by 7.6% in Q3.”
-
17:00
Russia Industrial Output registered at 6.8% above expectations (4.6%) in September
-
16:48
EUR/USD fails again at 1.1625 and pulls back to 1.1600 area
- The euro consolidates near 1.1600 with upside attempts limited below 1.1625.
- The common currency hesitates ahead of ECB's monetary policy decision.
- EUR/USD is expected to drop towards 1.1524 – Scotiabank.
Euro-dollar's rebound from 1.1585 lows witnessed during Wednesday’s European trading session has been unable to extend past 1.1625 and the pair retreated to the 1.1600 area.
The euro treads water awaiting the ECB
The pair remains practically flat for the second consecutive day in a rather calm market on Wednesday. The euro is looking for direction with all eyes on the ECB’s monetary policy decision with the USD in a soft tone, as the Dollar Index edges down 0.1% on the back of lower US T-Bond yields and mixed macroeconomic data.
Investors are positioning for a dovish message by the European Central Bank, which is expected to maintain its bond-purchasing plan unchanged and the benchmark interest rate near zero, in spite of the persistently high inflation, to avoid creating tensions in some peripheral markets.
On the macroeconomic front, in the absence of relevant Eurozone releases, orders for durable goods manufactured in the US have contracted less than expected in September, due to a solid increase of non-defense capital goods. These figures suggest that US businesses have continued spending in equipment, in spite of the disruptions caused by supply restrictions.
On the other hand, the US goods trade deficit widened to $96.3B in September from $89.4B in the previous month due to a sharp decline in exports.
EUR/USD: Expected to extend losses towards 1.1524 – Scotiabank
The FX Analysis team at Scotiabank observes the pair biased lower, targeting 1.1524 area: “The German and Eurozone economy more broadly are expected to decelerate significantly in the fourth quarter – pointing to moderate weakness ahead in the EUR (…) The EUR’s bearish reversal is likely to extend past the high-figure zone after support at 1.1572, setting the 1.1524 October low in its sights.”
Technical levels to watch
-
16:43
BoC's Macklem: We will considering raising rates sooner than we had previously thought
Bank of Canada (BoC) Governor Tiff Macklem said on Wednesday during the press conference he believes there are good reasons for inflation to ease in 2022 and warned that if they see signs of prolonged inflationary pressures, they will take action to bring it back down to target.
Earlier in the day, the BoC left its policy rate unchanged at 0.25% as expected. Additionally, the bank announced that it will end net purchases of government bonds, ending QE and going into the “reinvesting phase”. The central bank will purchase bonds only to replace those that are maturing so the overall holdings remain roughly stable over time.
“We move forward the timing of when we think we will be considering raising our policy interest rate”, said Macklem. He mentioned they are adjusting and they will continue to adjust to bring inflation back to the 2% target but it will take a bit longer. “This global supply issues, shipping bottlenecks, are proving to be more severe and persistent than expected but there are good reasons for those to ease off”.
-
16:31
AUD/USD falls from daily tops at 0.7535, hovers around 0.7510
- Risk-off market sentiment surrounds the financial markets, but the Australian dollar resilience holds.
- US President Joe Biden agreed to push for a deal in a meeting with lawmakers.
- Australian CPI figures rose more than expected, lifting the AUD/USD towards the daily tops at 0.7535.
- US Durable Good Orders shrank less than expected, minimizing the impact on the US dollar.
The AUD/USD edges higher during the New York session, up 0.17% is trading at 0.7513 at the time of writing. The market sentiment was downbeat during the European session, which benefited safe-haven currencies like the greenback. However, the risk-sensitive AUD held to its gains, sitting comfortably around 0.7510.
The market sentiment is downbeat, as US stock indices shed early week gains, except for the tech-heavy Nasdaq Composite rising 0.47%. The US spending bill is back on the radar, as it was one of the factors, while commodity prices ease a tad.
According to wires, US President Joe Biden reportedly agreed to push for a deal as soon as possible in a meeting with lawmakers. Also, the US Senate Finance Committee Chairman Ron Wyden unveiled a 23.8% tax proposal focused on unrealized gains of assets held by billionaires, affecting 700 people.
US mixed economic data sent the US Dollar Index seesawing between gains and losses
In the Asian session, the Australian economic docket unveiled inflationary numbers. The RBA Trimmed Mean Consumer Price Index for the Q3 expanded by 0.7%, higher than the 0.5% estimated, while the headline Consumer Price Index rose by 0.8%, in line with foreseen and Q2 figures. The AUD/USD reacted positively to the news, reaching a daily high at 0.7535, ahead of US figures.
On the US front, the macroeconomic docket featured Durable Good Orders for September. The headline Durable Good Orders came at -0.4% better than the -1.1% expected but lower than the 1.3% August figure. Contrarily the Nondefense Capital Goods Orders excluding Aircraft rose to 0.8%, higher than the 0.5% estimated and previously printed number.
The greenback reacted negatively to the news, but it has last seen at 93.82, losing 0.14% at press time underpinned by falling US T-bond yields, with the 10-year benchmark note down four basis points, sitting at 1.575%.
That said, the AUD/USD traders would lie on the back of the market sentiment, along with US dollar dynamics, as focus turns to the Federal Reserve meeting on November 2-3. Additionally, spending bills and fiscal policy developments would be watched for investors, as market sentiment triggers, as November kicks in, reducing maneuver time on the Democrats.
AUD/USD ADDITIONAL LEVELS TO WATCH
-
16:27
BoC's Macklem: Increasing vaccination rates are enabling continued progress in the economic recovery
Bank of Canada (BoC) Governor Tiff Macklem said on Wednesday that despite today’s decisions, significant stimulus injected through QE remains in place. “The end of QE comes as increasing vaccination rates are enabling continued progress in the economic recovery in Canada and around the world”, said the BoC in the opening statement.
Earlier in the day, the BoC left its policy rate unchanged at 0.25% as expected. Additionally, the bank announced that it will end net purchases of government bonds, ending QE and going into the “reinvesting phase”. The central bank will purchase bond only to replace those that are maturing so the overall holdings remain roughly stable over time.
Additional takeaways:
“With the economy once again growing robustly, Governing Council judged that QE is no longer needed. This means we will stop growing our holdings of Government of Canada bonds. It is important, however, to remind Canadians that the significant stimulus we have injected through QE remains in place. We just won’t be adding to it. We call this the reinvestment phase. In this phase, we will purchase bonds only to replace those that are maturing so that our overall holdings of Government of Canada bonds remain roughly stable over time.”
“The end of QE comes as increasing vaccination rates are enabling continued progress in the economic recovery in Canada and around the world.”
“We’ve seen strong job growth in recent months. Many sectors that were hardest hit by lockdowns earlier in the pandemic rebounded strongly as Canadians resumed more normal activities. Strong job growth has reduced the very uneven impacts of the pandemic, particularly for youth and women.”
“In view of the continued excess capacity in the economy, my fellow Governing Council members and I judged that the economy still needs considerable monetary policy support. While we ended QE, we kept our policy interest rate at its lowest level, and reaffirmed our commitment to keep it there until slack in the economy is absorbed so that the 2 percent inflation target is sustainably achieved. Based on our current projection, this happens sometime in the middle quarters of 2022.”
“How long the reinvestment phase lasts is a future monetary policy decision. It will depend on the strength of the recovery and the evolution of inflation. But as I indicated in September, it is reasonable to expect that we will be there for a period of time, at least until we raise our policy interest rate.”
-
16:05
USD strength could persist into 2022 – Wells Fargo
According to analysts at Wells Fargo, with global growth still trending softer and the Federal Reserve likely to taper asset purchases in the near future, the dollar can broadly strengthen through the end of this year. They believe the dollar’s strength could persist into early 2022.
Key Quotes:
“The external environment we highlighted above should, in our view, be conducive to U.S. dollar strength through at least the end of this year. We believe a decelerating global economy that is still facing serious and potentially longer-term risks, should attract safe-haven capital flows toward the U.S. dollar. As safe-haven flows hit the U.S. dollar, we expect most G10 currencies to weaken, with some of the more risk-sensitive currencies, such as the Australian dollar, to underperform.”
“Also supporting our view for short-term dollar strength is an elevated likelihood the Fed officially announces a decision to taper asset purchases in the near future. Given recent commentary from Fed Chair Powell and other FOMC members, we believe a taper announcement could take place as early as November and for the actual reduction in asset purchases to begin in December.”
“Tighter Fed monetary policy in 2022 and slower policy tightening from foreign central banks could result in a stronger greenback into early next year as well. For now, we believe the U.S. dollar will revert to a weaker trend over the longer term; however, given recent developments, that longer-term outlook is also evolving and the greenback's performance could be more mixed. We still expect U.S. dollar softness against many foreign currencies, but also see increasing potential for U.S. dollar resilience against several foreign currencies based on country-specific fundamentals.”
-
15:54
USD/JPY rebound from weekly lows but find resistance again around 113.80/85
- USD/JPY remains off lows, facing resistance at 113.85.
- Quick rebound in US yields did not last, USD weakens again.
The USD/JPY rose from weekly lows at 113.37 to 113.83, reaching the highest level since the beginning of the European session but then quickly pulled back to the 113.65 area.
After the release of the Durable Goods Orders report, the USD/JPY bottomed at 113.37, the lowest level since October. A few minutes later, the decision of the Bank of Canada to end its QE program, boosted US yields and triggered a spike in USD/JPY to 113.83.
During the last hour, US yield turned again to the downside. The US 10-year yield is back at 1.56% after a brief rebound to 1.59%, down more than 3% for the day. The recovery in Treasuries is keeping the USD/JPY under pressure.
On Thursday, the Bank of Japan will have its monetary policy meeting and US economic data to be released includes Q3 GDP.
The immediate support in USD/JPY is seen around 113.40 area. A consolidation below would add more pressure targeting 113.20 and then 113.00/05. The US dollar needs to recover levels above 113.85 to alleviate the bearish pressure. Above the next resistance is located at 114.25.
Technical levels
-
15:47
US Pres. Biden: Deeply concerned by China’s coercive actions across Taiwan strait
While speaking at the East Asia Summit on Wednesday, US President Joe Biden said that they are deeply concerned by China's coercive and proactive actions across the Taiwan strait and called it a threat to peace and stability, per Reuters.
Biden further noted that the US will start discussions with Indo-Pacific partners on the regional economic framework.
Market reaction
These comments don't seem to be having a noticeable impact on market sentiment. As of writing, the S&P 500 Index was virtually unchanged on the day at 4,572.
-
15:42
US: EIA Crude Oil Stocks rise by 4.3 million barrels, WTI trades below $84
Commercial crude oil inventories in the US increased by 4.3 million barrels in the week ending October 22, the weekly report published by the US Energy Information Administration (EIA) revealed on Wednesday. This reading came in much higher than the market expectation for an inventory build of 1.9 million barrels.
Market reaction
Crude oil prices remain on the back foot after this report. As of writing, the barrel of West Texas Intermediate (WTI) was trading at $83.50, losing 1.1% on a daily basis.
Additional takeaways
"Total motor gasoline inventories decreased by 2.0 million barrels last week and are about 3% below the five year average for this time of year."
"US crude oil refinery inputs averaged 15.0 million barrels per day during the week ending October 22, 2021."
"US crude oil imports averaged 6.3 million barrels per day last week, up by 430,000 barrels per day from the previous week."
"Total products supplied over the last four-week period averaged 20.8 million barrels a day, up by 9.9% from the same period last year."
-
15:30
United States EIA Crude Oil Stocks Change came in at 4.267M, above forecasts (1.914M) in October 22
-
15:20
BoC lowers 2021 growth forecast to 5.1% from 6%
The Bank of Canada (BoC) said in its fall Monetary Policy Report (MPR) that it lowered the 2021 Gross Domestic Product (GDP) growth forecast to 5.1% from 6% in July's MPR.
Key takeaways from MPR as summarized by Reuters
"2021 Q2 annualized GDP was -1.1% (vs +2.0% in July MPR), Q3 annualized GDP seen +5.5% (vs +7.3%), Q4 annualized GDP seen +4.0%."
"Output gap was between -2.25% to -1.25% in Q3, smaller than revised estimate of -3.25% to -2.25% in Q2."
"Significant uncertainty surrounds outlook for GDP and potential output."
"Canada Q4 annual inflation rate likely to hit 4.8%; around one-third of this will come from higher energy prices."
"Overall Canada 2021 inflation seen at 3.4% vs 3.0% in July MPR, 2022 inflation seen at 3.4% (2.4%) dipping to around 2% by end 2022, in 2023 seen at 2.3% (vs 2.2%)."
"Realization of upside risks to inflation could lead to rise in inflation expectations along with more pervasive labor cost and inflationary pressures."
"Canadian economy is once again growing robustly; labor market recovery is well under way but incomplete."
"Potential output growth to average about 1.6% per year over 2021-23, down 0.2 percentage points from July MPR."
"US growth seen +5.6% in 2021 vs +6.6% in July MPR, +3.9% in 2022 (vs +5.1%) and +2.7% in 2023 (vs +1.8%)."
-
15:13
USD/CAD tumbles toward 1.2300 after BoC decision
- Bank of Canada decision to end QE boosts CAD across the board.
- USD/CAD drops toward 1.2300, falling more than a hundred pips from highs.
The USD/CAD dropped sharply following the announcement of the Bank of Canada (BoC) to end QE. The loonie soared across the board becoming the best performer. Versus the dollar is climbed to the highest in three days.
BoC’s decision to keep interest rates unchanged as expected. Market consensus was looking at a reduction in QE to around CAD1 billion per week from 2B, instead, the central bank decided to end purchases. In a few minutes, BoC Governor Macklem will host a press conference.
The larger than expected tightening from the BoC triggered also a rebound in US yields.
The USD/CAD dropped from 1.2410 to 1.2312 after the statement reached the lowest level since Thursday. The pair remains near the lows. A break under 1.2320 (Oct 22 low) will clear the way for a test of 1.2300. Earlier on Wednesday, USD/CAD traded at 1.2430, the highest level in two weeks.
Technical levels
-
15:02
Gold Price Forecast: XAU/USD to tackle support at $1721 as rally falters aheaf of $1813 – Commerzbank
Gold has rallied to and so far failed at the $1813 55-week moving average. Karen Jones, Team Head FICC Technical Analysis Research at Commerzbank, expects XAU/USD to drop to the $1721 September low.
Gold falters at the 55-week ma of $1813
“Gold has rallied towards the 55-week ma at $1813 and currently remains capped here. We suspect that the move back from here will be pretty shallow, but we are essentially neutral at this point.”
“XAU/USD has to clear the $1832/34, highs since July and the $1842 2020-2021 resistance line in order to regenerate upside interest for a recovery to $1856/57 4th June low. Above here lies the $1917 May 2021 peak.”
“We have minor support at $1760 ahead of the $1721 September low. Below $1721, support is found at $1679/77, and is reinforced by the $1670 June 2020 low.”
“Below $1670 would target the 2018-2021 uptrend at $1611.”
See – Gold Price Forecast: XAU/USD to tank towards $1565/60 on a break below $1691/77 – Credit Suisse
-
15:01
Breaking: BoC leaves policy rate unchanged, ends weekly asset purchases
The Bank of Canada (BoC) announced on Wednesday that it left its key rate unchanged at 0.25% following the October policy meeting as expected. More importantly, the BoC decided to end its weekly purchases of the government of Canada bonds, the quantitative easing program. The policy statement revealed that the BoC will continue to buy only enough bonds to replace those that are maturing.
Market reaction
With the initial market reaction, the USD/CAD pair fell sharply and was last seen losing 0.42% on the day at 1.2336.
Key takeaways from policy statement as summarized by Reuters
"Economic slack should be absorbed sometime in the middle quarters of 2022; had previously said this would happen in H2 2022."
"Maintaining extraordinary forward guidance on the path for the overnight rate."
"Moving from QE into the reinvestment phase, will now purchase Canada government bonds solely to replace maturing bonds."
"Will keep overall holdings of Canada government bonds roughly constant."
"Economy continues to require considerable monetary policy support."
-
15:00
Canada BoC Interest Rate Decision in line with expectations (0.25%)
-
14:38
S&P 500 Index opens flat above 4,550, energy shares slide
- Wall Street's main indexes trade mixed on Wednesday.
- Energy stocks push lower amid falling crude oil prices.
- Data from the US showed a contraction in Durable Goods Orders in September.
Major equity indexes in the US opened mixed on Wednesday as investors assess the latest earnings reports and data releases from the US.
As of writing, the S&P 500 was down 0.1% on the day at 4,570, the Dow Jones Industrial Average was losing 0.06% at 35,737 and the Nasdaq Composite was rising 0.3% at 15,283.
Earlier in the day, the data published by the US Census Bureau revealed that Durable Goods Orders declined by 0.4% on a monthly basis in September. Additionally, the international trade deficit expanded to $96.3 billion from $88.2 billion in August.
Among the 11 major S&P 500 sectors, the Energy Index is down 1.7% after the opening bell pressure by a more-than-1% drop witnessed in crude oil prices. On the other hand, the Consumer Discretionary Index is up 0.4% as the largest gainer in the early trade.
S&P 500 chart (daily)
-
14:38
USD/TRY stays on the defensive, extends the downside to 9.4600
- USD/TRY remains in corrective mode and tests sub-9.50 levels.
- Turkey’s Economic Confidence Index eased to 101.40 in October.
- The lira regains some ground following Monday’s all-time low.
The Turkish lira appreciates for the third session in a row and now drags USD/TRY to the 9.4600 region just to bounce soon afterwards.
USD/TRY retreats from all-time highs
USD/TRY extends the negative streak for the third day on Wednesday in response to fresh buying interest surrounding the lira and the persistent offered stance in the greenback.
Indeed, declining US yields hurt the dollar and prompt the US Dollar Index (DXY) to reverse two consecutive daily advances and refocus instead on the downside.
Spot, in the meantime, regains downside traction and puts further distance from Monday’s new all-time highs past the 9.8000 mark. It is worth recalling that the lira collapsed at the beginning of the week in response to President Erdogan’s threats over the weekend to expel 10 foreign ambassadors, a move that could have opened the door to a new crisis between Ankara and the West.
The outlook for the lira did nothing but worsen over the past sessions, starting with the unexpected decision by the Turkish central bank (CBRT) to reduce the One-Week Repo Rate by 200 bps to 16% at its meeting on October 21.
In the domestic data space, Turkey’s Economic Confidence Index ticked lower to 101.40 for the current month (from 102.40). In addition, the trade deficit nearly halved in September at $2.55B (from $4.26B).
USD/TRY key levels
So far, the pair is losing 0.23% at 9.5084 and a drop below 9.4128 (weekly low Oct.26) would aim for 9.1965 (weekly low Oct.21) and finally 9.1605 (20-day SMA). On the other hand, the next up barrier lines up at 9.8395 (all-time high Oct.25) followed by 10.0000.
-
14:33
BoJ Preview: Forecasts from seven major banks, holding fire, slashing price outlook
The Bank of Japan (BoJ) will announce its policy decision on Thursday, October 28 at 03:00 GMT, and as we get closer to the release time, here are the expectations forecast by the economists and researchers of seven major banks. The central bank is unlikely to alter its monetary policy but it is seen cutting growth and price outlook.
See BoJ’s Preview by FXStreet’s Dhwani Mehta to discover how this event can affect the USD/JPY pair.
ING
“The BoJ is likely to retain its accommodative stance, so we don’t expect any surprises here.”
MUFG
“We expect the BoJ to keep monetary policy unchanged, with the policy rate at -0.1% and the target level for the 10Yr JGB yield at around zero percent, with a range of 25bps.” We expect the Monetary Policy Board to split its time addressing: 1) the Outlook Report: corporate and household sector conditions amidst rising prices resulting from a weakening JPY and resource prices climb; and 2) a checkup of the financial system, especially restructuring of the regional banking sector.”
Standard Chartered
“We expect the BoJ to maintain the policy balance rate at -0.1% and the 10Y yield target at c.0%. We think the BoJ has less headroom to normalise liquidity given the slow economic recovery and low inflation. Moreover, we think it is hard to ease policy given global inflationary pressure.”
Danske Bank
“While the pandemic programme has increased loans, they have been unwinding government bonds for about a year now. The October reopening of the economy is convenient at a stage where exports are declining sharply amid lack of supplies. It will be interesting how the BoJ assesses the recent significant JPY weakening after the cabinet has been out warning for the need for a stable currency this week. We expect no changes to the bank’s QQE with yield curve control.”
BBH
“Updated macro forecasts will be released. Reports have emerged that the BoJ will lower its inflation forecast for FY21 to around 0% from 0.6% due to re-basing of the CPI. FY21 growth forecast will reportedly be cut too, but FY22 would be raised. Overall, we expect the updated forecasts to signal a dovish hold that suggests no liftoff before FY24 at the earliest. FY24 will be added with the April 2022 Outlook Report and is likely to show inflation remaining well below the 2% target, which would mean no liftoff until FY25 at the earliest.”
SocGen
“We expect that the BoJ will maintain its current main monetary policy (YCC and ETF purchases). The BoJ will judge that the delay in the economic recovery and the reduction of the price outlook will not be enough to take additional easing into consideration. Although the outlook remains uncertain, it will nevertheless maintain its forecast that the economy will improve as COVID-19 infections subside. In addition, according to the September Tankan survey, the financial positions of both large and small enterprises improved. Therefore, measures to support financing will also be maintained.”
Citibank
“We do not expect any surprises from the BoJ Monetary Policy Meeting, with the bank sticking to its current monetary policy.”
-
14:28
Gold Price Forecast: XAU/USD inches closer to $1,800 amid sliding bond yields/weaker USD
- Gold attracted some dip-buying for the second successive day on Wednesday.
- Retreating US bond yields, weaker USD acted as a tailwind for the commodity.
- Hawkish central bank expectations might continue to cap gains for the metal.
- Gold Price Forecast: 50-DMA to test bulls’ commitments again, as focus shifts to US data, central banks
Gold continued showing some resilience below the 100/200-day SMA confluence and attracted some dip-buying ahead of the $1,780 level for the second successive day. The intraday uptick pushed spot prices to the $1,796 region, or fresh daily highs during the early North American session, albeit lacked follow-through. The US dollar met with some fresh supply on Wednesday and reversed the previous day's upbeat US macro data-inspired gains to over one-week tops. This, in turn, was seen as a key factor that acted as a tailwind for dollar-denominated commodities, including gold.
Apart from this, a softer tone around the equity markets extended additional support to the safe-haven precious metal. Bulls further took cues from an extension of the recent pullback in the longer-dated US Treasury bond yields, which tends to benefit the non-yielding gold. In fact, the yield on the benchmark 10-year US government bond declined for the fourth straight session and slipped below the 1.60% threshold. Conversely, the yield on short-dated US government bonds rose to the highest level since March 2020 amid rising bets for an early policy tightening by the Fed.
Investors seem convinced that the US central bank would be forced to adopt a more aggressive policy response to contain stubbornly high inflation. Adding to this, the markets have been pricing in the possibility of a potential interest rate hike by the Bank of England sooner rather than later. The Bank of Japan and the European Central Bank are also scheduled to announce their policy decision on Thursday, though are not anticipated to announce a change in the policy stance. Nevertheless, the hawkish outlook might cap gains for gold heading into the key central bank meetings.
Technical outlook
From a technical perspective, the emergence of fresh buying at lower levels favours bullish traders. The positive outlook is reinforced by the fact that technical indicators on the daily chart are holding in the bullish territory. That said, the recent pullback from an intermediate hurdle near the $1,812-14 region warrants some caution. This makes it prudent to wait for a strong follow-through buying beyond the mentioned barrier before positioning for any further gains. Gold might then accelerate the momentum further towards challenging the $1,832-34 heavy supply zone.
On the flip side, the $1,783-82 region now seems to have emerged as immediate strong support. A convincing break below might prompt some technical selling and drag the XAU/USD towards the next relevant support near the $1,765-64 zone en-route monthly swing lows, around the $1,745 area. Failure to defend the mentioned support levels will shift the bias in favour of bearish traders and turn gold vulnerable to test $1,722-21 support before eventually dropping to the $1,700 round-figure mark.
Technical levels to watch
-
14:19
USD/CAD to climb towards 1.28 if BoC reaffirms the output gap will close by late-2022 – Scotiabank
USD/CAD trades past 1.24 ahead of steady-handed Bank of Canada policy announcement. Economists at Scotiabank expect the USD/CAD pair to potentially rise towards 1.26 if the BoC pushes back against market pricing for an earlier start to the rate tightening cycle.
USD/CAD to plunge towards 1.23 on a more hawkish BoC
“We are very dubious on whether the BoC will make any concession to the output gap closing earlier than the middle of next year – which would be shorthand for earlier interest rate hikes. In other words, we expect the statement to push back against market pricing for an earlier (April) start to the rate tightening cycle.”
“The CAD is liable to soften towards 1.25 and might extend towards 1.26 if the BoC sticks with the view that the output gap will not close until later in 2022.”
“In the unlikely event of the bank sounding more hawkish and effectively endorsing current market pricing for rates, the CAD will rally towards the low 1.23s at least.”
See – BoC Preview: Forecasts from seven major banks, asset purchases to be cut
-
14:10
EUR/USD set to decline towards the 1.1524 October low – Scotiabank
EUR/USD is steady around 1.16 but technically bearish. Economists at Scotiabank expect the world’s most popular currency pair to slide towards the 1.1524 October low.
Soggy eurozone economy to dampen the euro
“The German and Eurozone economy more broadly are expected to decelerate significantly in the fourth quarter – pointing to moderate weakness ahead in the EUR.”
“The EUR’s bearish reversal is likely to extend past the high-figure zone after support at 1.1572, setting the 1.1524 October low in its sights.”
“Resistance is 1.1615/25.”
-
13:43
US: International trade deficit expands to $96.3 billion in September
- US' international trade deficit increased by $8.1 billion in September.
- US Dollar Index remains on the back foot near 93.80.
The data published by the US Census Bureau revealed on Wednesday that the United States' international trade deficit expanded to $96.3 billion in September from $88.2 billion in August.
"Exports of goods for September were $142.2 billion, $7.0 billion less than August exports," the publication read. "Imports of goods for September were $238.4 billion, $1.1 billion more than August imports."
Market reaction
The US Dollar Index showed little to no reaction to this report and was last seen losing 0.2% on a daily basis at 93.78.
-
13:42
GBP/USD pares intraday losses, keeps the red below mid-1.3700s
- GBP/USD found some support ahead of the 1.3700 mark and stalled its intraday decline.
- BoE rate hike expectations, weaker USD helped attract some dip-buying at lower levels.
- Brexit jitters capped any further gains amid a break below ascending channel support.
The GBP/USD pair quickly recovered around 30-35 pips from daily lows and was last seen trading with modest losses, just below mid-1.3700s.
The pair extended the previous day's sharp retracement slide from the 1.3825-30 resistance zone and witnessed heavy selling during the first half of the trading action on Wednesday. The downward trajectory drag the GBP/USD pair to over one-week lows during the mid-European session, though lacked follow-through selling.
The intraday bounce followed the UK finance minister Rishi Sunak's upbeat economic assessment while presenting the annual government budget. Office for Budget Responsibility (OBR) sees UK GDP will return to the pre-crisis level at the turn of the year and expand 6.5% in 2021. OBR forecasts show GDP growth of 6% and CPI of 4% in 2022.
This reinforced market expectations about an imminent Bank of England rate hike move at the upcoming policy meeting next week and extended some support to the British pound. This, along with the emergence of fresh selling around the US dollar, assisted the GBP/USD pair to find decent support ahead of the 1.3700 mark.
The USD was pressured by an extension of the recent decline in the US Treasury bond yields, which fell for the fourth successive day. In fact, the yield on the benchmark 10-year US government bond slipped below the 1.60% threshold and undermined the greenback, which failed to gain any traction following the release of Durable Goods Orders.
Despite the supporting factors, the attempted recovery witnessed around the GBP/USD pair lacked bullish conviction amid fresh Brexit jitters. In the latest developments, the UK Prime Minister said on Wednesday that conditions had been met to invoke Article 16 unless they see rapid progress on the Northern Ireland protocol.
Even from a technical perspective, the GBP/USD pair has broken through support marked by the lower boundary of an upward sloping channel extending from September swing lows. The technical set-up supports prospects for further losses, suggesting that any further recovery might still be seen as a selling opportunity.
Technical levels to watch
-
13:35
US: Durable Goods Orders decline by 0.4% in September vs. 1.1% expected
- Durable Goods Orders in US fell less than expected in September.
- US Dollar Index stays in the negative territory below 94.00.
Durable Goods Orders in the United States declined 0.4%, or $1 billion, in September to $261.3 billion, the data published by the US Census Bureau showed on Wednesday. This reading followed August's increase of 1.3% and came in better than the market expectation for a contraction of 1.1%.
"Excluding transportation, new orders increased 0.4%," the publication further read. "Excluding defense, new orders decreased 2.0%. Transportation equipment, down two of the last three months, drove the decrease, $1.8 billion or 2.3% to $77.7 billion."
Market reaction
The dollar remains on the back foot after this report and the US Dollar Index was last seen losing 0.2% on the day at 93.79.
-
13:31
United States Wholesale Inventories down to 1.1% in September from previous 1.2%
-
13:31
United States Durable Goods Orders ex Transportation in line with expectations (0.4%) in September
-
13:30
United States Goods Trade Balance dipped from previous $-89.4B to $-96.3B in September
-
13:30
United States Durable Goods Orders came in at -0.4%, above expectations (-1.1%) in September
-
13:30
United States Durable Goods Orders ex Defense came in at -2% below forecasts (0.2%) in September
-
13:07
When is the BoC monetary policy decision and how could it affect USD/CAD?
BoC Monetary Policy Decision – Overview
The Bank of Canada (BoC) is scheduled to announce its monetary policy decision this Wednesday at 14:00 GMT and is expected to reduce government bond purchases to C$1 billion a week from C$2 billion. The BoC is also anticipated to upgrade its inflation and growth forecasts in the accompanying policy statement, setting the stage for an interest rate hike during the first half of 2022. This will be followed by the post-meeting press conference, where comments from Governor Tiff Macklem will be looked upon for the central bank's outlook on interest rates.
How Could it Affect USD/CAD?
The money markets have been pricing the first rate hike in April 2022 as against the BoC projection that policy tightening won't happen until the second half of the next year at the earliest. Against the backdrop of bullish crude oil prices, signs that the BoC is turning more hawkish should be enough to provide a strong boost to the commodity-linked loonie.
That said, the recent recovery in the USD/CAD pair reflects the uncertainty of whether the BoC will address rate hikes. Macklem could push back against market expectations for a more aggressive policy tightening, which should trigger an aggressive short-covering move around the major.
Heading into the key event risk, the USD/CAD pair was seen flirting with a resistance marked by the top boundary of a downward sloping channel extending from September swing highs. A less hawkish BoC should allow the pair to break through the mentioned barrier and climb back towards challenging the very important 200-day SMA, currently around the key 1.2500 psychological mark.
On the flip side, the 1.2370-65 horizontal zone should protect the immediate downside. Sustained weakness below might be seen as a fresh trigger for bearish traders and expose the ascending channel support, currently around the 1.2225 region. The 1.2320-15 region, closely followed by the 1.2300 mark, should act as intermediate support ahead of June 23 swing lows, around mid-1.2200s on the way down.
Key Notes
• Bank of Canada Rate Decision Preview: Inflation prospects headline policy review
• USD/CAD Outlook: Awaits hawkish BoC before the next leg down
• USD/CAD jumps to near two-week tops, further beyond 1.2400 ahead of BoC
About the BoC Interest Rate Decision
BoC Interest Rate Decision is announced by the Bank of Canada. If the BoC is hawkish about the inflationary outlook of the economy and raises the interest rates it is positive, or bullish, for the CAD. Likewise, if the BoC has a dovish view on the Canadian economy and keeps the ongoing interest rate, or cuts the interest rate it is seen as negative, or bearish.
-
13:02
EUR/USD Price Analysis: Gains remain limited by 1.1670
- EUR/USD looks to leave behind the recent couple of pullbacks.
- The next target of note emerges around 1.1670.
EUR/USD wobbles around the 1.1600 mark after two consecutive daily drops on Wednesday.
In the meantime, the inability of the pair to retest recent tops around 1.1670 ideally in the short-term horizon could trigger some corrective move to, initially, the weekly low at 1.1590 (October 25). A drop beyond this level is seen exposing another weekly low near 1.1570 (October 18), all prior to the 2021 low at 1.1524 (October 12).
In the meantime, the near-term outlook for EUR/USD is seen on the negative side below the key 200-day SMA, today at 1.1909.
EUR/USD daily chart
-
13:00
Brazil Unemployment Rate registered at 13.2%, below expectations (13.4%) in August
-
12:51
UK's Sunak: OBR sees CPI of 4% in over next year
British finance minister Rishi Sunak is delivering the budget speech and presenting the spending review.
Key takeaways
"Today’s Budget does not draw a line under Covid; we have challenging months ahead."
"Employment is up, investment is growing, public services are improving, the public finances are stabilising and wages are rising."
"Government can spend up to 3% of GDP for investment."
"Office for Budget Responsibility (OBR) forecasts 2021/22 underlying public debt to GDP ratio of 85.2% (March forecast 88.8%)."
"OBR forecasts 2023/24 underlying public debt to GDP ratio of 85.7% (March forecast 97.1%)."
"OBR forecasts show 2021/22 budget deficit of 7.9% of GDP (March forecast 10.3% of GDP).
"OBR sees UK GDP returning to pre-crisis level at turn of year (March forecast Q2 2022)."
"OBR forecasts show 2021 GDP growth of 6.5% (March forecast 4.0%)."
"OBR forecasts show 2022 GDP growth of 6% (March forecast 7.3%)."
"OBR forecasts show 2023 GDP growth of 2.1% (March forecast 1.7%)."
"OBR sees CPI of 4% in over next year."
"We will give further support to working families in today's budget."
"I have written to BoE to reaffirm their remit to achieve low and stable inflation."
"BoE has strong track record on inflation."
"OBR sees peak unemployment rate of 5.2% (March forecast: peak of 6.5% at end 2021)."
Market reaction
The GBP/USD pair showed no immediate reaction to these remarks and was last seen losing 0.3% on the day at 1.3726.
-
12:42
NZD/USD stays in the negative territory near 0.7150, eyes on US data
- NZD/USD fell to a daily low of 0.7132 on Wednesday.
- US Dollar Index stays in a consolidation phase below 94.00.
- Investors await Durable Goods Orders and Trade Balance data from US.
The NZD/USD pair came under modest bearish pressure in the early European session on Wednesday and declined to a daily low of 0.7132 before staging a rebound. As of writing, the pair was down 0.2% on a daily basis at 0.7155.
Focus shifts to US data, Wall Street
The data from New Zealand showed that the ANZ Business Confidence declined to -13.4 in October from -8.6 in September. Additionally, Statistics New Zealand reported that the trade deficit continued to expand in September.
In addition to the disappointing data releases, the negative shift witnessed in market sentiment made it difficult for the risk-sensitive NZD to find demand. Moreover, escalating geopolitical tensions between the US and China seem to be having an impact on the pair's action.
On the other hand, the US Dollar Index is staying in a consolidation phase a little below 94.00 on Thursday. The 1% decline seen in the benchmark 10-year US Treasury bond yield seems to be capping the greenback's gains. Later in the session, September Durable Goods Orders and Trade Balance data from the US will be looked upon for fresh impetus.
In the meantime, US stock index futures are trading in the negative territory, suggesting that safe-haven flows could start to dominate the financial markets in the second half of the day.
Technical levels to watch for
-
12:33
US Dollar Index Price Analysis: Failure at 94.00 could spark extra losses
- DXY failed once again to extend the move above 94.00.
- Another test of lows near 93.50 should not be ruled out yet.
DXY struggles for direction around the 94.00 neighbourhood on Wednesday. This area of resistance is coincident with the 20-day SMA.
If the index cannot clear the 94.00 area in the near term, it could expose the resumption of the downtrend. In that case, the immediate target should be at the 93.50 region ahead of the 55-day SMA at 93.30.
Looking at the broader picture, the constructive stance on the index is seen unchanged above the 200-day SMA at 91.92.
DXY daily chart
-
12:27
UK PM Johnson: Conditions for invoking Article 16 met if we don't see rapid progress
British Prime Minister Boris Johnson said on Wednesday that conditions had been met to invoke Article 16 unless they see rapid progress on the Northern Ireland protocol, as reported by Reuters.
Market reaction
These remarks don't seem to be having a noticeable impact on market sentiment. As of writing, the UK's FTSE 100 Index was posting small daily losses at 7,272.
In the meantime, the British pound is having a difficult time finding demand on Wednesday. Currently, the GBP/USD pair is down 0.3% on a daily basis at 1.3725.
-
12:12
When are the US durable goods orders and how could they affect EUR/USD?
US durable goods orders overview
Wednesday's US economic docket highlights the release of Durable Goods Orders data for September. The US Census Bureau will publish the monthly report at 12:30 GMT and is expected to show that headline orders declined 1.1% during the reported month. Conversely, orders excluding transportation items, which tend to have a broader impact, are anticipated to have increased by 0.4% in September.
Explaining the relevance of the data, Yohay Elam, FXStreet's own analyst, writes: “The data is of high importance as it feeds into Gross Domestic Product figures due out on Thursday. It will be the first read of US GDP for the third quarter, and it may confirm or dismiss fears of a substantial slowdown. The market reaction is set to be straightforward – better than expected figures are dollar positive, and weaker data is dollar negative.”
How could it affect EUR/USD?
A surprisingly stronger/positive reading will mark a fifth consecutive month of increase and lift expectations from Thursday's release of the Advance Q3 GDP report. This could further fuel expectations for an early policy tightening by the Fed and should be enough to boost the US dollar. Alternatively, a weaker than expected print would mark a reversal of the growth recorded in August and prompt some USD selling, though the immediate market reaction is likely to be muted.
Investors might refrain from placing aggressive USD bearish bets heading into Thursday's key data risk and the upcoming FOMC monetary policy. This, in turn, suggest that the path of least resistance for the EUR/USD pair remains to the downside and any attempted recovery move might still be seen as a selling opportunity.
Meanwhile, Eren Sengezer, Editor at FXStreet, provided a brief technical outlook for the EUR/USD pair: “The Relative Strength Index (RSI) indicator on the four-hour chart is moving sideways a little below 50, reflecting EUR/USD's indecisiveness in the near term.”
Eren also offered important technical levels to trade the major: “The initial support on the downside is located at 1.1600 (psychological level, 100-period SMA). The pair dropped below that level on Wednesday but didn't have a difficult time recovering. A daily close below 1.1600, however, could attract sellers and cause the pair to slide toward 1.1570 (static level) and 1.1525 (2021 low).”
“On the upside, resistance at 1.1620 (Fibonacci 23.6% retracement September downtrend, 50-period SMA) stays intact ahead of 1.1650 (200-period SMA) and 1.1670 (Fibonacci 38.2% retracement),” Eren added further.
Key Notes
• Durable Goods Orders Preview: Five scenarios to trade the event with EUR/USD
• EUR/USD Forecast: Key technical levels hold as focus shifts to US data
• EUR/USD regains the smile above 1.1600, looks to US data
About US durable goods orders
The Durable Goods Orders, released by the US Census Bureau, measures the cost of orders received by manufacturers for durable goods, which means goods planned to last for three years or more, such as motor vehicles and appliances. As those durable products often involve large investments they are sensitive to the US economic situation. The final figure shows the state of US production activity. Generally speaking, a high reading is bullish for the USD.
-
12:07
Singapore: Inflation now seen at 2.0% in 2021 – UOB
Barnabas Gan, Economist at UOB Group, assesses the recently released inflation figures in Singapore.
Key Takeaways
“Singapore’s consumer prices rose 2.5% y/y (+0.4% m/m nsa) in September 2021. This is slightly faster than expected as compared to market (and ours) expectations for a growth of 2.4% y/y (+0.3% m/m sa). The inflation print in September was the fastest year-on-year print year-to-date, suggesting that Singapore’s domestic prices have been accelerating given the higher commodity prices. Accounting for the latest data, Singapore’s inflation averaged 1.8% in the first nine months of 2021.”
“Similarly, Singapore’s core inflation accelerated to 1.2% in September 2021, the fastest gain since May 2019.”
“As a price-taker, Singapore is vulnerable to imported inflation as commodity prices have been on the rise to-date.”
“Beyond cost-push inflation from higher commodity prices, domestic demand pull inflation may have already been seen to-date.”
“Given the elevated consumer prices seen year-to-date, we further upgrade our headline inflation outlook to 2.0% for 2021, while keeping our core inflation outlook unchanged at 1.0%.”
-
12:00
Mexico Trade Balance s/a, $ came in at $-1.697B, above forecasts ($-2.952B) in September
-
12:00
Mexico Trade Balance, $ registered at $-2.398B above expectations ($-2.822B) in September
-
12:00
United States MBA Mortgage Applications up to 0.3% in October 22 from previous -6.3%
-
11:50
Silver Price Analysis: XAG/USD eyes further gains towards 200-DMA at $25.53 – Commerzbank
Silver (XAG/USD) has faltered just ahead of the September high at $24.95 and is consolidating. Karen Jones, Team Head FICC Technical Analysis Research at Commerzbank, expects the precious metal to enjoy further gains towards the 200-day moving average (DMA) at $25.53 while above the 55-DMA at $23.41.
Dips to hold over the $21.87/17 major support
“Silver has rallied towards and failed just ahead of the $24.95 recent high and looks to be easing back to the 55-DMA at $23.41, provided it stabilizes around here an upside bias will remain.”
“Resistance extends up to tougher resistance offered by the 200-DMA at $25.53 and $26.07, the August high. The market will need to regain this area to regenerate bullish impetus. Please note that the 55-week ma also lies at $25.29. We favour the topside but it may take several attempts to clear this band.”
“Initial support is the 55-DMA at $23.41 ahead at $22.85, the 20th August low but the market is underpinned by its long term pivotal support at $21.87/17. These are considered to be a major band of support and we expect them to act as a floor for the market.”
-
11:47
EUR/JPY Price Analysis: Downside meets support near 131.50
- EUR/JPY resumes the downtrend and drops to 131.50.
- Next on the downside comes the 20-day SMA at 131.00.
Sellers have regained control and dragged EUR/JPY to fresh lows in the mid-131.00s so far on Wednesday.
The weekly pullback has met initial contention at the Fibo level near 131.50. Further south from here emerges the 20-day SMA, today at the 131.00 yardstick. This area is also reinforced by another Fibo level around 130.90.
In the broader scenario, while above the 200-day SMA at 130.14, the outlook for the cross is expected to remain constructive.
EUR/JPY daily chart
-
11:45
USD/JPY finds support ahead of mid-113.00s, awaits US data
- USD/JPY witnessed heavy selling on Wednesday and snapped two days of the winning streak.
- A softer risk tone benefitted the safe-haven JPY and exerted pressure amid sliding US bond yields.
- A modest USD strength helped limit any deeper losses ahead of the US Durable Goods Ordes.
The USD/JPY pair dropped to the 113.55-50 area, back closer to weekly lows during the mid-European session, albeit quickly recovered a few pips thereafter. The pair was last seen trading around the 113.75 region, still down nearly 0.35% for the day.
The pair came under some renewed selling pressure on Wednesday and eroded a major part of its weekly gains recorded over the past two trading sessions. The intraday downfall picked up pace amid a modest intraday decline in the equity markets, which drove some haven flows towards the Japanese yen.
Meanwhile, the risk-off impulse led to a further decline in the US Treasury bond yields, which was seen as another factor that added to the selling bias surrounding the USD/JPY pair. That said, a modest pickup in the US dollar demand held limit any deeper losses, at least for the time being.
The greenback drew some support from growing market acceptance that the Fed would be forced to adopt a more aggressive policy response to contain stubbornly high inflation. Apart from this, Tuesday's upbeat US macro data further extended support to the buck, though bulls lacked conviction.
Market participants now look forward to the US economic docket, highlighting the release of Durable Goods Orders. Apart from this, the US bond yields will influence the USD price dynamics, which, along with the broader market risk sentiment, should provide some impetus to the USD/JPY pair.
Beyond this, traders will focus on the Bank of Japan policy meeting and the Advance US Q3 GDP report on Thursday. This, along with the release of the US Core PCE Price Index on Friday would drive the USD/JPY pair heading into next week's FOMC meeting. The latter could act as a key trigger and help determine the near-term trajectory.
Technical levels to watch
-
11:30
Gold Price Forecast: XAU/USD needs to crack $1781 for further downside – Confluence Detector
- Gold price extends losses amid resurgent US dollar demand.
- Market sentiment sours ahead of the critical US macro data.
- Gold bears and bulls fight over $1,800, focus shifts to US GDP.
The US dollar resurgence amid risk-off markets at full steam has once again taken the wind out of the gold price rally, downing the bright metal for the second day in a row. Investors liquidate their USD shorts and reposition themselves ahead of the critical US Q3 GDP report due later this week. Further, rising global inflationary pressures and their potential negative impact on the economic recovery also spurs the safe-haven bids in the dollar at gold’s expense. However, falling US Treasury yields could help put a floor under gold price.
Read: Gold Price Forecast: 50-DMA to test bulls’ commitments again, as focus shifts to US data, central banks
Gold Price: Key levels to watch
The Technical Confluences Detector shows that gold is heading south to test the $1784 demand area, which is the intersection of the SMA200 one-hour, SMA10 one-day and SMA50 four-hour.
Sellers need a strong foothold below $1781 to extend the additional downside. That level is the confluence of the Fibonacci 61.8% one-week and pivot point one-day S1.
Further south, the SMA100 four-hour at $1777 could come to the buyers’ rescue. The next powerful support awaits at $1772, the Bollinger Band one-day Middle.
Alternatively, gold bulls will run into immediate supply pressure at a dense cluster of healthy resistance levels around $1793. Around that region, the SMA5 one-day, SMA200 one-day, Fibonacci 38.2% one-day and Fibonacci 61.8% one-month coincide.
Gold bulls will next target $1799, the meeting point of the Fibonacci 61.8% one-day and SMA50 one-hour.
The Fibonacci 23.6% one-week at $1801 will be the level to beat for gold optimists.
Here is how it looks on the tool
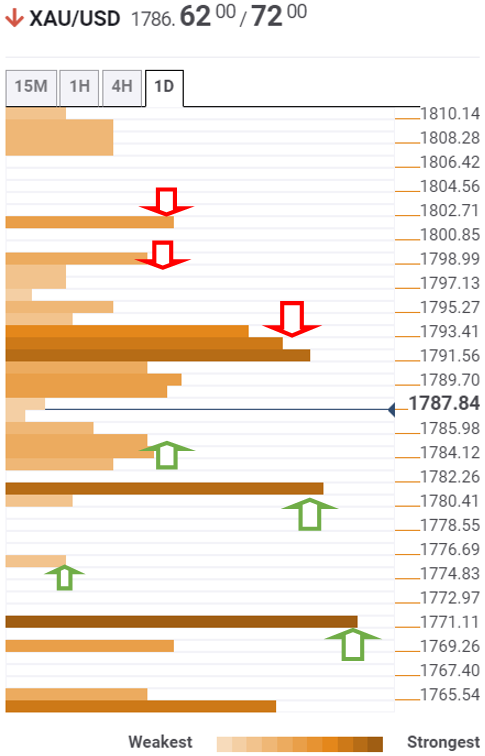
About Technical Confluences Detector
The TCD (Technical Confluences Detector) is a tool to locate and point out those price levels where there is a congestion of indicators, moving averages, Fibonacci levels, Pivot Points, etc. If you are a short-term trader, you will find entry points for counter-trend strategies and hunt a few points at a time. If you are a medium-to-long-term trader, this tool will allow you to know in advance the price levels where a medium-to-long-term trend may stop and rest, where to unwind positions, or where to increase your position size.
-
11:00
GBP/USD drops to over one-week lows near 1.3720-15 area, lacks follow-through
- GBP/USD extended the previous day’s sharp pullback and lost additional ground on Wednesday.
- A turnaround in the global risk sentiment benefitted the safe-haven USD and exerted pressure.
- The downside remains cushioned amid expectations for an imminent BoE rate hike next week.
The GBP/USD pair witnessed heavy selling during the early European session and dropped to one-and-half-week lows, around the 1.3720-15 region in the last hour.
Following a brief consolidation through the first half of the trading action on Wednesday, the GBP/USD pair met with a fresh supply and extended the previous day's slide from the 1.3825-30 resistance zone. A turnaround in the risk sentiment – as depicted by an intraday decline in the equity markets – extended some support to the safe-haven US dollar. This, in turn, was seen as a key factor that exerted some downward pressure on the major.
On the other hand, tensions between the UK and France over fishing rights and a fresh row over the Northern Ireland protocol acted as a headwind for the British pound. This, along with some cross-driven weakness stemming from a goodish rebound in the EUR/GBP cross, weighed on the sterling. Wednesday's downfall could further be attributed to technical selling on a sustained break below a short-term ascending trend-channel support.
Meanwhile, the risk-off impulse in the markets led to a further decline in the US Treasury bond yields amid uncertainty over the likely timing of the policy tightening by the Fed. In fact, the yield on the benchmark 10-year US government bond declined for the fourth successive day and slipped below the 1.60% threshold. This held the USD bulls from placing aggressive bets and limited any deeper losses for the pair, at least for the time being.
Market participants now look forward to the UK annual government budget announcement by the UK Finance Minister Rishi Sunak. Later during the early North American session, traders might take cues from the US Durable Goods Orders data. This, along with the US bond yields and the broader market risk sentiment, will influence the USD price dynamics and produce some meaningful trading opportunities around the GBP/USD pair.
Technical levels to watch
-
10:59
South Korea: GDP seen expanding 4.0% this year – UOB
UOB Group’s Economist Ho Woei Chen, CFA, reviews the latest GDP results in South Korea.
Key Takeaways
“South Korea’s economy expanded by a weaker-than-expected 4.0% y/y, 0.3% q/q seasonally-adjusted in 3Q21 (Bloomberg est: 4.3% y/y, 0.6% s/a q/q; UOB est: 4.2% y/y, 0.5% q/q) as growth moderated from 6.0% y/y, 0.8% q/q in 2Q21. Despite the disappointment, the economy has continued to expand sequentially for the fifth straight quarter since its rebound from the pandemic in the second half of 2020.”
“The letdown was due to the impact of the fourth wave COVID-19 outbreak in July and global supply chain disruption.”
“The outlook for the South Korean economy has remained positive. Consumer confidence has started to recover in September after declining since the fourth wave of COVID-19 outbreak. This was supported by employment gains (total employment has risen above pre-pandemic levels) and the disbursement of cash handouts from the government’s second supplementary budget. With 70% of its population fully vaccinated, the country has planned to further ease social distancing rules in November as it moves towards the gradual return to normal life.”
“Overall, South Korea’s GDP expanded by 4.0% y/y in the first three quarters of 2021. Our full-year 2021 GDP growth forecast of 4.0% remains on track as we expect steady recovery in 4Q21.”
-
10:27
German Economy Ministry: 2021 GDP forecast lowered to 2.6% from 3.5% in April
Germany's economy ministry announced on Wednesday that they have lowered the 2021 growth forecast to 2.6% from 3.5% reported in April, per Reuters.
Additional takeaways
"Raised 2022 GDP forecast to +4.1% from April forecast of +3.6%."
"Expecting GDP growth of +1.6% in 2023."
"Expecting inflation to jump to 3% in 2021 and ease to 2.2% in 2022, 1.7% in 2023."
Market reaction
The common currency remains on the back foot following this report. As of writing, the EUR/USD pair was trading at 1.1590, losing 0.05% on a daily basis.
-
10:27
AUD/USD surrenders intraday gains, slips below 0.7500 mark amid softer risk tone
- AUD/USD struggled to preserve its intraday gains and witnessed a turnaround on Wednesday.
- A modest pullback in the equity markets benefitted the safe-haven USD and exerted pressure.
- Sliding US bond yields capped the upside for the USD and might help further losses for the pair.
The AUD/USD pair dropped to fresh daily lows, below the key 0.7500 psychological mark during the early part of the European session, albeit lacked follow-through selling.
As investors looked past upbeat Australian consumer inflation figures, the AUD/USD pair witnessed an intraday turnaround on Wednesday and retreated nearly 50 pips from the daily swing highs. A slight deterioration in the global risk sentiment – as depicted by a pullback in the equity markets – benefitted the safe-haven US dollar and drove flows away from the perceived riskier aussie.
Meanwhile, the risk-off impulse in the markets led to a further decline in the US Treasury bond yields amid uncertainty over the likely timing of the policy tightening by the Fed. In fact, the yield on the benchmark 10-year US government bond slipped below the 1.60% threshold, which held the USD bulls from placing aggressive bets and should limit any deeper corrective slide for the AUD/USD pair.
Market participants now look forward to the US economic docket, highlighting the release of Durable Goods Orders data for some impetus later during the early North American session. This, along with the US bond yields and the broader market risk sentiment, will influence the USD price dynamics and produce some short-term trading opportunities around the AUD/USD pair.
Beyond this, Thursday's Advance US Q3 GDP report and the US Core PCE Price Index on Friday will set the tone heading into next week's RBA and FOMC monetary policy meetings. Against the backdrop of fears about a faster than expected rise in inflation, fresh clues that the central banks are turning more caution should assist investors to determine the near-term trajectory for the AUD/USD pair.
Technical levels to watch
-
10:13
US Senate Democrat unveils 'billionaires tax' for Biden agenda
US Senate Finance Committee Chairman Ron Wyden unveiled on Wednesday; a tax proposal aimed at unrealized gains on assets held by billionaires.
Key takeaways
Billionaires tax would target about 700 taxpayers with over $1 billion in assets or $100 million in annual income for three consecutive years.
Billionaires tax would impose 23.8% capital gains rate to tradable assets including stocks.
Billionaires tax would also allow deductions for losses incurred on assets.
The so-called billionaires tax is part of a two-pronged legislative strategy that also includes a proposed 15% corporate minimum tax on the most profitable US corporations, which was unveiled on Tuesday.
Market reaction
The US dollar index has caught a fresh bid wave on worsening risk sentiment and the above announcement.
The spot was last seen trading at 93.95, reversing sharply from 93.82 lows.
-
10:05
China’s property developers to propose debt maturity extension, restructuring to regulators
Some Chinese property developers at Tuesday’s regulatory meeting expressed intention to extend offshore bond maturities, Reuters reports, citing sources with knowledge of the matter.
They also proposed debt restructuring, the sources added.
Market reaction
The above headlines fail to have any market impact, as the risk-off mood extends into the European session. Although the S&P 500 futures advance 0.15% on the day, pointing to a positive Wall Street open.
Meanwhile, AUD/USD is feeling the pull of gravity, slipping below 0.7500 despite the hotter Australian inflation data.
-
09:47
USD/CAD jumps to near two-week tops, further beyond 1.2400 ahead of BoC
- A combination of factors assisted USD/CAD to gain positive traction for the third successive day.
- Retreating oil prices undermined the loonie and extended support amid a modest USD strength.
- Bulls might refrain from placing aggressive bets ahead of the US data and BoC policy decision.
The USD/CAD pair broke through the 1.2400 barrier during the early European session and shot to near two-week tops in the last hour. The pair was last seen trading around the 1.2415-20 region, up 0.25% for the day.
Following a brief consolidation through the first half of the trading action on Wednesday, the USD/CAD pair caught fresh bids and built on its recent recovery from sub-1.2300 levels, or four-month lows. This marked the third successive day of a positive move – also the fourth in the previous five – and was sponsored by a combination of factors.
Crude oil prices edged lower and reversed the overnight gains back closer to multi-year tops. This, in turn, undermined the commodity-linked loonie and acted as a tailwind for the USD/CAD pair. Apart from this, the latest leg of a sudden spike over the past hour or so could further be attributed to the emergence of some buying around the US dollar.
Tuesday's upbeat US macro data turned out to be a key factor that extended some support to the greenback amid expectations for an early policy tightening by the Fed. That said, the dominant risk-on mood, along with a further decline in the US Treasury bond yields, might cap gains for the safe-haven greenback and the USD/CAD pair.
Investors might also refrain from placing aggressive bets, rather prefer to move on the sidelines and wait for a fresh catalyst from the Bank of Canada meeting this Wednesday. The Canadian central bank will announce its policy decision later during the early North American session and infuse some volatility around the USD/CAD pair.
Meanwhile, the US economic docket highlights the release of Durable Goods Orders. Apart from this, the US bond yields and the broader market risk sentiment could influence the greenback demand. Traders will further take cues from oil price dynamics to grab some meaningful opportunities around the USD/CAD pair.
Technical levels to watch
-
09:32
Gold Price Forecast: Nascent XAU/USD bull to knock on the $1980 door – DBS Bank
As Benjamin Wong, Strategist at DBS Bank, notes, XAU/USD’s technical chart shows the possibility of a near-term bullish inverse head-and-shoulders pattern, that requires a break over $1830 for validation. Once validated, gold would open up further upside.
The balance of risks appears to be siding with a nascent bull
“Gold is quietly making a bullish inverse head-and-shoulders since June – thus the nascent gold bull is quietly knocking at the door. The neckline stands around $1830, for that pattern to take off. A secondary confirmation probably requires gold to surmount and sustain over the weekly Ichimoku’ cloud fringe resistance at $1873.
“Should the inverse head-and-shoulders pattern get validated, gold would target the upside into $1930, perhaps even $1980 (over the June highs). A break under $1720 would however nullify this potential pattern.”
See – Gold Price Forecast: XAU/USD to go on the topside once above $1813/42 – Commerzbank
-
09:27
Silver Price Analysis: XAG/USD struggles below $24.00, downside potential seems limited
- Silver witnessed some selling for the second successive day on Wednesday.
- Mixed oscillators on hourly/daily charts warrant caution for bearish traders.
- Any subsequent decline is likely to remain limited near the $23.20-15 area.
Silver struggled to capitalize on the previous day's late rebound from multi-day lows and met with some fresh supply on Wednesday. The white metal maintained its offered tone through the early part of the European session and was seen trading below the $24.00 mark, down nearly 1% for the day.
Given that the XAG/USD has repeatedly struggled to find acceptance above 100-day SMA, the latest leg down might have shifted the bias in favour of bearish traders. The negative outlook is reinforced by the fact that technical indicators have been drifting lower in the bearish territory on hourly charts.
That said, oscillators on the daily chart – though have lost positive traction – are still holding in the bullish territory. Hence, any further decline might still be seen as a buying opportunity near the $23.55 region. This should help limit the downside near the $23.20-15 strong resistance breakpoint.
On the flip side, any meaningful positive move might continue to confront stiff resistance near 100-day SMA, currently around mid-$24.00s. A sustained move beyond will be seen as a fresh trigger for bullish traders and set the stage for the resumption of the one-month-old appreciating move.
The momentum could then push the XAG/USD back towards monthly swing highs, around the $24.80-85 region, en-route the key $25.00 psychological mark. The latter coincides with the 50% Fibonacci level of the $28.75-$21.42 downfall, which if cleared should pave the way for additional gains.
Silver daily chart

Technical levels to watch
-
09:20
USD/TRY: Dips to be contained at the 8.80 support – SocGen
USD/TRY has retracted after hitting the upper limit of a multi month channel at 9.85. However, economists at Société Générale see limited downside potential for the pair.
Next target on the upside sits at 10.16
“Steep ascending trend line at 9.20 and upper band of previous rectangle at 8.80 are near term supports.”
“Next projections are located at 10.16.”
-
09:10
S&P 500 Index set to soar towards 4750 by year-end – Credit Suisse
Another day, another record for the S&P 500. Analysts at Credit Suisse look for a move to the beginning of the “typical” extreme at 4614, then to 4750 by year-end.
Initial support moves to 4524/20
“We stay bullish for a move to the beginning of what we see as its ‘typical’ upside extreme – 10% above the 200-day average, currently at 4614.”
“Whilst we would expect an initial pause at the 200-DMA of 4614, our bias is for a move above here in due course, with resistance then seen next at 4665/70, ahead of what is now our next core objective of 4750. We don’t though see the market at its upper extreme until 4824 and we see this as a realistic overshoot objective into year-end.”
“Support moves to 4524/20 initially, with 4448/38 ideally holding further setbacks.”
-
09:03
Austria Purchasing Manager Index fell from previous 62.8 to 60.6 in October
-
09:01
GBP/USD to nosedive into low 1.30’s on low UK growth, BoE disappointment – MUFG
The pound has proven stable against the US dollar for most of this year averaging around 1.3850 since March although it did briefly hit a low of 1.3412 at the end of September. Economists at MUFG Bank expect cable to sink into the mid to low 1.3000’s amid concerns that the UK economy will slow more notably heading into year-end.
Limited upside for GBP/USD as it runs into stronger resistance between 1.3800 and 1.4000
“The lack of support for the pound from higher UK rates still suggests that fundamentals factors driving higher UK rates are not fully supportive for a stronger pound. The risk of higher inflation becoming more embedded in the UK economy posing downside risks to long-term pound valuation.”
“We continue to see only limited upside for cable as it runs into stronger resistance between 1.3800 and 1.4000.”
“Evidence of a deeper slowdown in UK growth heading into year-end and/or the BoE disappointing expectations for the amount of rate hikes in the coming months should see cable dropping back into the mid to low 1.3000’s especially if global equities lose upward momentum as well.”
-
09:01
European Monetary Union M3 Money Supply (3m): 7.6% (September) vs previous 7.9%
-
09:00
Italy Trade Balance non-EU rose from previous €1.58B to €1.67B in September
-
09:00
European Monetary Union Private Loans (YoY) came in at 4.1% below forecasts (4.3%) in September
-
09:00
European Monetary Union M3 Money Supply (YoY) came in at 7.4%, below expectations (7.5%) in September
-
09:00
Switzerland ZEW Survey – Expectations above forecasts (8.7) in October: Actual (15.6)
-
08:55
GBP/USD Price Analysis: Bulls trying to defend ascending channel support near mid-1.3700s
- GBP/USD stalled the previous day’s retracement slide near ascending channel support.
- A sustained breakthrough is needed to support prospects for a further near-term decline.
The GBP/USD pair witnessed an intraday turnaround from a short-term descending trend-line extending from late July and retreated over 70 pips from the 1.3825-30 resistance zone on Tuesday. The pullback, however, lacked strong follow-through selling and the pair, so far, has managed to defend support marked by the lower boundary of an upward sloping channel.
The dominant risk-on mood failed to assist the safe-haven US dollar to capitalize on the previous day's upbeat US data-inspired gains, instead led to a subdued/range-bound price action on Wednesday. This, in turn, extended some support to the GBP/USD pair amid rising bets for an imminent Bank of England rate hike move later this year.
That said, tensions between the UK and France over fishing rights, along with a fresh row over the Northern Ireland protocol acted as a headwind for the British pound. Investors also seemed reluctant to place any aggressive bets around the GBP/USD pair ahead of the annual budget announcement by the UK Finance Minister Rishi Sunak.
Meanwhile, technical indicators on the daily chart – though have been losing positive traction – are still holding in the bullish territory. This further makes it prudent to wait for a sustained break below the trend-channel support before confirming that the recent positive move has run out of steam and placing fresh bearish bets.
The GBP/USD pair might then accelerate the corrective slide to the 1.3725 intermediate support en-route the 1.3700 mark and the next relevant support near mid-1.3600s. Some follow-through selling will set the stage for fall towards testing sub-1.3600 levels ahead of the BoE and FOMC monetary policy meetings next week.
On the flip side, the 1.3790-1.3800 region now seems to act as immediate resistance for the GBP/USD pair ahead of the descending trend-line, around the 1.3825-30 supply zone. This is closely followed by the very important 200-day SMA, around mid-1.3800s, which if cleared will be seen as a fresh trigger for bullish traders.
GBP/USD daily chart
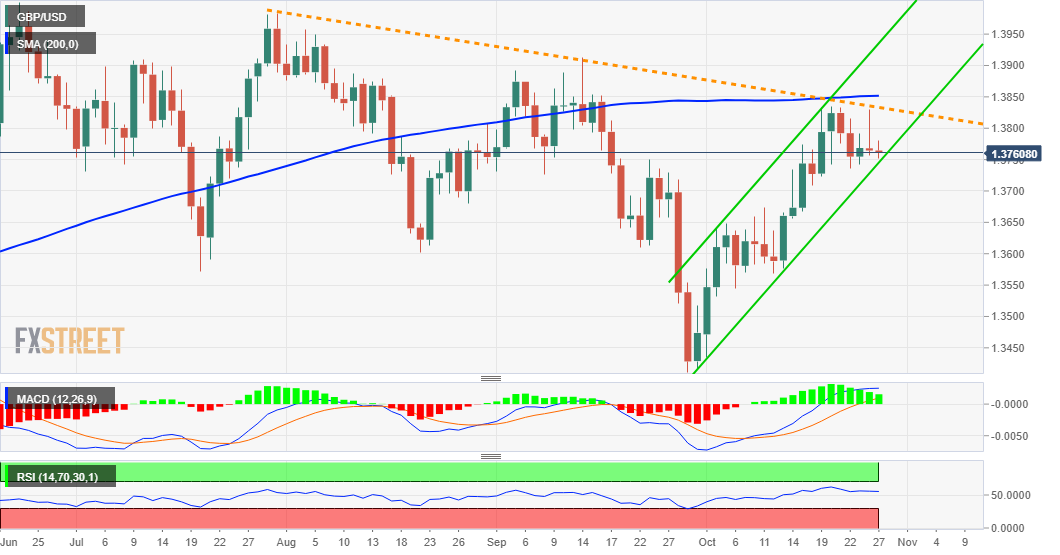
Technical levels to watch
-
08:51
Singapore: Outlook for Industrial Production looks solid – UOB
Barnabas Gan, Economist at UOB Group, comments on the latest Industrial Production figures in Singapore.
Key Takeaways
“Singapore’s industrial production contracted in September 2021 by 3.4% y/y (-2.8% m/m sa), as compared to August’s growth of 11.0% y/y (+5.6% m/m sa)… Accounting for the latest data, Singapore’s manufacturing grew 11.9% year-to-date.”
“Despite the year-on-year contraction in overall industrial production, we note that the bulk of the fall was led primarily by the volatile biomedical manufacturing cluster.”
“On the flip side, the rest of the manufacturing segments rose broadly in tandem with the recovery in Singapore’s economic fundamentals.”
“We maintain our full-year manufacturing growth outlook at 8.0% in 2021 with upside risks, as compared to 2020’s expansion of 7.5%. Given Singapore’s export-oriented nature, the expansion in export demand seen year-to-date is expected to persist for the rest of 2021. This suggests that manufacturing momentum will likely stay supported, on the back of healthy global semiconductor demand, which would benefit the electronic and precision engineering clusters.”
-
08:51
Gold Price Forecast: XAU/USD to tank towards $1565/60 on a break below $1691/77 – Credit Suisse
Gold edged higher last week but ultimately remains capped beneath the July and August highs at $1832/34. Strategists at Credit Suisse expect the yellow metal to grind lower towards $1691/77.
Only a break above $1834/39 would signal a deeper recovery
“We are mildly biased towards an eventual break lower, however only a move below $1691/77 would mark a major top for an important change of trend lower, with support then seen at $1620/15 initially, before $1565/60.”
“Only a break above $1834/39 would be seen to complete an in range base and lessen the topping threat significantly, instead clearing the way for a deeper recovery to $1917.”
-
08:47
USD/BRL drifts lower towards 5.51 and 5.44 supports – SocGen
USD/BRL has experienced an initial pullback after retesting April high of 5.75. Economists at Société Générale expect the Copom to hike the Selic rate by 100bps in the coming meeting. They note that the pair is edging lower towards 5.51.
A bounce towards 5.75/5.79 is not ruled out
“The consensus today for 150bp to 7.75%, that’s still a real rate of -255bp. We pencil in 100bp.”
“USD/BRL is drifting towards a steep up sloping trend line at 5.51 which is also the 38.2% retracement from August. This and recent trough at 5.44 are short-term support levels.”
“A bounce towards 5.75/5.79 is not ruled out with next hurdle at the peak achieved earlier this year at 5.88. This would be an important resistance.”
“Only if 5.44 breaks, there would be a risk of a deeper down move.”
-
08:47
EUR/USD regains the smile above 1.1600, looks to US data
- EUR/USD reclaims the 1.1600 mark after two drops in a row.
- The greenback trades on the defensive and fades recent strength.
- German GfK Consumer Confidence surprised to the upside.
The single currency leaves behind the recent offered bias and lifts EUR/USD back above the 1.1600 mark on Wednesday.
EUR/USD cautious ahead of the ECB
EUR/USD regains some composure and manages to surpass the key hurdle at 1.1600 the figure on Wednesday, always on the back of the resumption of the offered bias around the greenback.
The rebound in spot is accompanied by another uptick in yields of the German 2y note to the -0.65% area, while the 10y Bund yields also advance to levels below -0.13%. In the US cash markets, yields in the front end of the curve trade in levels last seen in March 2020 past 0.50%, while the 1oy yields post modest gains above 1.62%.
The pair is expected to extend the consolidative mood ahead of the ECB event on Thursday. Consensus among market participants expects Chairwoman Lagarde to talk down speculations of a potential interest rate hike by end of 2022, while the centre of the debate will once again be the elevated inflation in the region and the central bank’s view on its duration and actions to tackle it.
In the domestic docket, the German GfK Consumer Confidence improved to 0.9 for the month of November, while Import Prices rose 1.3% MoM in September and 17.7% from a year earlier. In the NA session, Durable Goods Orders and Balance of Trade figures are expected to take centre stage.
What to look for around EUR
EUR/USD regains some upside traction and manages to retest the 1.1600 region on Wednesday. While the improvement in the sentiment surrounding the risk complex lent extra wings to the par in past sessions, price action is expected to keep looking to dollar dynamics for the time being, where tapering chatter remains well in centre stage. In the meantime, the idea that elevated inflation could last longer coupled with the loss of momentum in the economic recovery in the region, as per some weakness observed in key fundamentals, are seen pouring cold water over investors’ optimism as well as bullish attempts in the European currency.
Key events in the euro area this week: German GfK Consumer Confidence (Wednesday) – German labour market report, EMU final Consumer Confidence, ECB meeting, German flash CPI (Thursday) – Advanced German Q3 GDP, flash EMU CPI (Friday).
Eminent issues on the back boiler: Asymmetric economic recovery post-pandemic in the region. Sustainability of the pick-up in inflation figures. Probable political effervescence around the EU Recovery Fund in light of the rising conflict between the EU, Poland and Hungary. ECB tapering speculations.
EUR/USD levels to watch
So far, spot is gaining 0.11% at 1.1607 and faces the next up barrier at 1.1669 (monthly high Oct.19) followed by 1.1702 (55-day SMA) and finally 1.1755 (weekly high Sep.22). On the other hand, a break below 1.1584 (weekly low Oct.26) would target 1.1571 (low Oct.18) en route to 1.1524 (2021 low Oct.12).
-
08:38
USD/CAD: Next stop in the downside is at 1.2230 – SocGen
The Bank of Canada (BoC) will announce its monetary policy decisions at 14:00 GMT. A hawkish BoC should help the loonie. Economists at Société Générale point out that for CAD bulls next support is 1.2230.
Surpassing the 200-DMA at 1.2500 is crucial for a short-term bounce
“The BoC may announce the penultimate tapering step towards ending QE. Canadian money markets have also brought forward lift-off by the BoC to March 2022, adding an additional tailwind other than oil prices for the CAD. The guidance of the central bank is a first increase in 2H 2022. Bond purchases have been reduced already from CAD5 B to CAD2 B per week and a cut to CAD1 B today won’t be a surprise.”
“Daily MACD has dipped within negative territory which points towards continuation in pullback.”
“Next potential objectives are located at 1.2230 and projections of 1.2160/1.2115; this will be a crucial support.”
“Overcoming the 200-DMA at 1.2500 is essential for denoting a short-term rebound”.
See – BoC Preview: Forecasts from seven major banks, asset purchases to be cut
-
08:30
USD/MYR: BNM to prevent appreciation past key psychological level of 4.00 – Credit Suisse
Economists at Credit Suisse expect a USD/MYR trading range of 4.10-4.15 for the rest of Q4 2021 – and think that Bank Negara Malaysia (BNM) will likely prevent appreciation past the key psychological level of 4.00 in 2022.
USD/MYR to move within a range of 4.10-4.15 for the rest of 2021
“We think the central bank will continue to be biased towards reserve accumulation to promote growth and exports.”
“The prospect of higher US yields could also soften the favorable impact on the strength of the ringgit against the dollar from higher oil prices.”
“For the rest of 2021, we expect a USD/MYR trading range of 4.10-4.15, and that BNM will likely prevent appreciation past the key psychological level of 4.00 in 2022.”
-
08:30
Sweden Trade Balance (MoM) rose from previous -10.3B to 6.3B in September
-
08:23
USD/IDR: Rupiah rallies to fade as medium-term risks persist – SocGen
Economists at Société Générale expect the USD/IDR pair to edge higher and, therefore, any rupiah rally should fade.
Fade the rallies
“Higher commodity prices have widened the trade surplus in recent months and have helped the IDR remain resilient. Fed tapering-related upside risks to the USD/IDR are pretty much priced in now. However, a compressing yield differential is a risk to an already weak bond inflow.”
“Amid muted inflationary pressures, we believe that Bank Indonesia’s limited room for policy normalisation, especially in the context of diverging policy objectives vs the US, will be detrimental to the IDR in the medium-term. As such, we expect BI to deliver a first hike in the second half of next year.”
“Despite early signs of recovery, we prefer to fade any IDR rallies, since the medium-term risks, such as a Chinese slowdown, will far outweigh any short-term gains.”
-
08:15
Copper to simmer a move higher towards the psychological $11000 level – Credit Suisse
Copper (LME) is again losing momentum but remains above the crucial 200-day moving average (DMA) at $9278. Therefore, economists at Credit Suisse expect the metal to climb towards the psychological $11000 level.
Support moves to the 55-DMA at $9437
“Copper is again taking a breather. Nevertheless, the industrial metal remains clearly above the crucial 200-DMA, currently at $9278. Although a further consolidation from here should be allowed for, our bias is for an eventual sustained closing break in due course above the previous record high at $10748, with resistance then seen next at the psychological $11000 level.”
“Support moves to the 55-day average at $9437, before the crucial 200-day average at $9278, which we would expect to floor potential weakness the very latest.”
-
08:12
USD/BRL to continue its advance towards the 5.80 level – Credit Suisse
Economists at Credit Suisse revise their USD/BRL target higher from 5.65 to 5.80, following the recent deterioration in the domestic fiscal outlook. In absence of a meaningful shift on the fiscal front, however, they think that dips in the 5.40-5.50 area will quickly find buyers.
Dips to 5.40-5.50 will find buyers
“We remain bearish on BRL and revise our target higher from 5.65 to 5.80.”
In absence of a turn in the domestic political climate, in the form of a reversal or of a reduction in the Auxilio Brasil fiscal initiative, we suspect that dips in USD/BRL in the 5.40-5.50 area are likely to find keen buyers.”
“Rallies in USD/BRL north of the Q1 highs around 5.88 are likely to meet resistance in the form of aggressive FX intervention by the BCB.”
“We suspect that an even larger deterioration in domestic conditions, e.g. with further high-level government defections, needs to realize for USD/BRL to test the all-time highs around 5.97.”
-
08:07
USD/CNH still risks a move lower – UOB
There is still the chance that USD/CNH could slip back to the 6.3525 level in the next weeks, suggested FX Strategists at UOB Group.
Key Quotes
24-hour view: “Yesterday, we highlighted that ‘downward pressure has eased and USD is likely to trade sideways between 6.3730 and 6.3910’. Our view for sideway-trading was not wrong even though USD traded within a narrower range than expected (6.3755/6.3852). The quiet price actions indicate further sideway-trading is likely. Expected range for today, 6.3700/6.3900.”
Next 1-3 weeks: “After the outsized sell-off in USD, we highlighted last Wednesday (20 Oct, spot at 6.3780) that while the sell-off appears to be overdone, there is scope for USD to drop to May’s low near 6.3525. There is no change in our view for now. The downside risk is intact as long as USD does not move above the ‘strong resistance’ level at 6.4200 (no change in level).”
-
08:06
AUD/USD sticks to Australian CPI-led gains, comfortably above 0.7500 mark
- A combination of factors pushed AUD/USD higher for the third successive day on Wednesday.
- The risk-on mood and stronger Australian CPI print underpinned the perceived riskier aussie.
- A subdued USD price action did little to provide any impetus or hinder the intraday move up.
The AUD/USD pair held on to its intraday gains through the early European session and was last seen hovering near daily tops, around the 0.7530 area, up 0.40% for the day.
This pair gained traction for the third successive day and shot to fresh weekly tops on Wednesday following the release of Australian consumer inflation figures. The headline CPI rose 0.8% in the third quarter, as expected, and the yearly rate decelerated to 3.0% from 3.8% previous. However, the Reserve Bank of Australia's favours trimmed mean inflation rose 0.7% during the July-September period, pushing the annual pace above the 2% mark for the first time since 2015.
The data could add pressure on the RBA to further reduce its monetary stimulus in the near future, which was evident from a spike in the shorter-dated Australian government bond yields. This, along with the prevalent risk-on environment, provided a goodish lift boost to the perceived riskier aussie. Apart from this, a subdued US dollar price action remained supportive of the AUD/USD pair's intraday positive momentum back closer to multi-month tops touched last Thursday.
The USD struggled to capitalize on the overnight gains led by stronger US macro data and remained on the defensive, though prospects for an early policy tightening by the Fed acted as a tailwind. Investors seem convinced that the Fed would be forced to adopt a more aggressive policy response in 2022 to contain stubbornly high inflation. Hence, the market focus will remain glued to the release of the US Core PCE Price Index on Friday.
Beyond this, Thursday's Advance US Q3 GDP report will set the tone heading into next week's RBA and FOMC monetary policy meetings. In the meantime, traders might take cues from Wednesday's release of US Durable Goods Orders data. This, along with the US bond yields and the broader market risk sentiment, will influence the USD price dynamics and produce some trading opportunities around the AUD/USD pair.
Technical levels to watch
-
08:06
AUD/USD to lurch higher towards the resistance line at 0.7616 – Commerzbank
AUD/USD has advanced beyond 0.7500 and closes in on the multi-month highs it set at 0.7548 last week. Karen Jones, Team Head FICC Technical Analysis Research at Commerzbank, expects the aussie to surpass the 200-day moving average (DMA) at 0.7562 to challenge the 0.7616 mark.
Attention is again on the 200-DMA
“AUD/USD is bid near-term and capable of retesting the 200-DMA at 0.7562.”
“Near-term risks are shifting to the topside and above the 200-DMA lies the seven-month resistance line lies at 0.7616 and we will need to regain this zone for further upside impetus.”
“Dips should find interim support at 0.7427 the 4th August high and 0.7387 (20-day ma) and this guards the 29th September low at 0.7171.”
-
08:04
US Dollar Index appears capped around 94.00 ahead of data
- The index reversed two daily advances in a row on Wednesday.
- US 10y yields remain side-lined around 1.62%, 2y approach 0.50%.
- Durable Goods Orders, Trade Balance next of note in the docket.
The greenback, when gauged by the US Dollar Index (DXY), gives away part of the recent advance and returns to the vicinity of 93.80 midweek.
US Dollar Index focuses on data
After two consecutive daily advances, the index now shows some weakness and fades further Tuesday’s spike to the area just above the 94.00 barrier.
The ongoing knee-jerk in the buck came in spite of the move higher in US yields, particularly in the front end, where the 2y approach the 0.50% yardstick, levels last seen in March 2020. The belly of the curve, in the meantime, hovers around 1.61% and the long end extends the corrective drop to the 2.03% area.
Tuesday’s better-than-expected results from the Conference Board’s Consumer Confidence gave extra legs to the greenback, reinforced the optimism around the economic recovery and help relegating inflation fears and speculations of the start of the tapering process in the near term.
In the US calendar, Durable Goods Orders will be in the centre of the debate seconded by weekly Mortgage Applications by MBA and advanced Goods Trade Balance figures and Wholesale Inventories.
What to look for around USD
The index recedes some ground following the lack of follow through after Tuesday’s surpass of the 94.00 hurdle. The positive performance of US yields, supportive Fedspeak regarding the start of the tapering process as soon as in November or December (also bolstered by latest comments by Chief Powell) and the rising probability that high inflation could linger for longer remain as key factors behind the constructive outlook for the buck in the near-to-medium term.
Key events in the US this week: Durable Goods Orders, Advanced Trade Balance (Wednesday) – Flash Q3 GDP, Initial Claims, Pending Home Sales (Thursday) – PCE, Core PCE, Personal Income/Spending, Final Consumer Sentiment (Friday).
Eminent issues on the back boiler: Discussions around Biden’s multi-billion Build Back Better plan. US-China trade conflict under the Biden’s administration. Tapering speculation vs. economic recovery. Debt ceiling debate. Geopolitical risks stemming from Afghanistan.
US Dollar Index relevant levels
Now, the index is losing 0.12% at 93.85 and a break above 94.17 (weekly high Oct.18) would open the door to 94.56 (2021 high Oct.12) and then 94.74 (monthly high Sep.25 2020). On the flip side, the next down barrier emerges at 93.48 (monthly low October 25) followed by 93.30 (55-day SMA) and finally 92.98 (weekly low Sep.23).
-
08:01
Turkey Trade Balance increased to -2.55B in September from previous -4.26B
-
08:00
Turkey Economic Confidence Index down to 101.4 in October from previous 102.4
-
08:00
EUR/GBP: At new lows for the year, scope for further losses to 0.8159 – Commerzbank
EUR/GBP has hit new lows for the year. Karen Jones, Team Head FICC Technical Analysis Research at Commerzbank, expects the pair to plunge towards the 0.8239 2019 low and the 200-month ma at 0.8159.
Rallies to find initial resistance at the previous 0.8471 low
“EUR/GBP has charted new lows for the year of 0.8402, this has yet to be confirmed by the daily RSI, but we shall go with it for now.”
“While we hold below the 55-day ma at .8531 we will stay negative for now.”
“Attention is on the 0.8239 2019 low and the 200-month ma lies at 0.8159.”
“Rallies will find initial resistance at the previous low at 0.8471 and the 55-day ma at 0.8531 and will need to regain this in order to alleviate downside pressure and to challenge the 0.8659/73 highs since May.”
-
07:56
EUR/USD: Three factors to drag the pair down – Danske Bank
In EUR/USD, economists at Danske Bank view flows, terms of trade (ToT) and levels as adding to downside risks.
Terms of trade
“In recent quarters, terms of trade have strongly improved for the US. We suspect this may be an effect from commodity exports and broad technology alike, whereas the euro area more so sees the negative effect from rising import prices.”
Flows
“For flows, the loss of global momentum in the manufacturing sector does appear to have become a drag on European equities, whereas US performance continues.”
Levels
“We suspect the downside risk is amplified by EUR/USD (still) being elevated and the level is itself a headwind to spot.”
-
07:54
WTI Price Analysis: Teasing a rising wedge breakdown on 4H chart
- The US oil resumes correction from seven-year highs of $84.97.
- WTI is on the verge of confirming a rising wedge breakdown on the 4H chart.
- 50-SMA support at $82.73 holds the key, as RSI flips bearish.
WTI (NYMEX futures) is back in the red so far this Wednesday, reversing Tuesday’s temporary reversal, as the bears look to resume the corrective decline from seven-year peaks of $84.97.
At the time of writing, the US oil is trading at $83.13, down about 1% on the day, heading towards the next critical support of the upward-sloping 50-Simple Moving Average (SMA) on the four-hour chart at $82.73.
The overnight weakness is extending into the European session, as WTI breached the 21-SMA cap at $83.47.
The black gold now teases a rising wedge breakdown on the said time frame, with a four-hourly candlestick closing below the rising trendline support at $83.23 needed to confirm the downside breakout.
Should the bears succeed, the immediate support is seen at 50-SMA, below which the $81 round figure could be tested.
The next fierce support awaits at the October 21 lows of $80.06.
The Relative Strength Index (RSI) has pierced through the midline, flipping into the bearish zone, suggesting that the further downside remains on the cards.
WTI: Four-hour chart
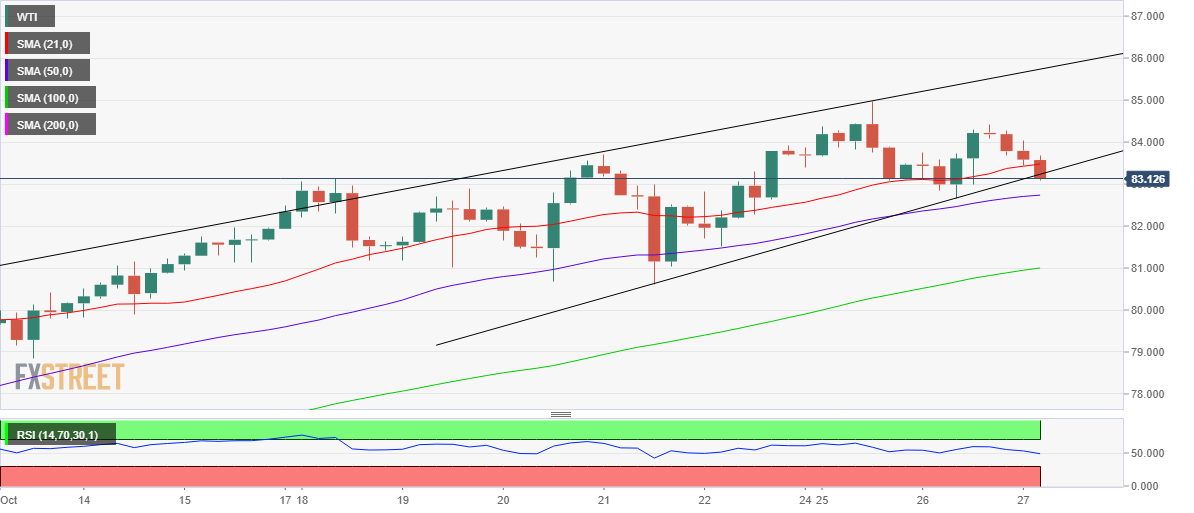
On the flip side, any recovery attempt will meet the initial hurdle at the 21-SMA, the previous support now resistance.
The buyers will then look for fresh entries towards $84.42, October 26 highs. Further up, the upswing could extend towards multi-year tops of $84.97.
WTI: Additional levels to watch
-
07:50
BoC Preview: Forecasts from seven major banks, asset purchases to be cut
The Bank of Canada (BoC) will announce its monetary policy decisions at 14:00 GMT and as we get closer to the release time, here are the expectations as forecast by the economists and researchers of seven major banks, regarding the upcoming announcement. The BoC is widely expected to leave its policy rate unchanged at 0.25% but a reduction in asset purchases could help the CAD stay resilient against its American counterpart.
ING
“The BoC is set to taper QE purchases further to CAD1 B per week with the programme likely concluded in December as the market increasingly prices in 2022 rate hikes. We expect a neutral impact on CAD, which seems to have most of the positives in the price and may experience corrections in the near-term.”
RBC Economics
“Inflation concerns will likely be front-and-center. The BoC will point to persistent supply chain constraints as a drag on near-term growth and as a contributor to rising consumer prices. The key question is how long inflation will remain above the bank’s 1% to 3% target range. Prices aren’t expected to reverse recent increases. The BoC will likely point to its Q3 business and consumer expectations surveys in which respondents anticipated moderation in price growth over the medium-term. There’s little domestic monetary policy can do to counter global supply chain challenges and rising commodity prices. But the strengthening jobs market and inflation numbers suggest the economy is sturdy enough for the central bank to continue reducing monthly asset purchases. The BoC has said it will not hike interest rates until economic slack has been absorbed. Weaker GDP data in the near-term suggests that could happen later than previously thought. However, given a tightening labour market and higher inflation, the BoC will likely hold its position that rates will rise in the second half of next year. If anything, the risk is tilted toward rate increases kicking off even earlier.”
TDS
“We expect the BoC to argue that the inflation surge is largely transitory, and to hold forward guidance for the overnight rate unchanged with rate hikes expected in 2022H2. We also look for the BoC to announce the end of its QE program in its current guise, with the reinvestment phase beginning in November.”
NBF
“We’re not looking for a significant change in tone, though we will likely get an acknowledgment of stronger-than-expected price hikes to date and potential upside risks ahead. A revised economic outlook will also be presented in the Bank’s new Monetary Policy Report. With growth stumbling recently, a markdown to the GDP outlook seems all but certain. The Bank’s inflation projections, on the other hand, will likely be tweaked upward. That said, given its assessment that there is slack still in the economy (including in labour markets), the Bank should project inflation falling back towards its target next year. As for policy changes, we’re looking for the central bank to taper its QE program once again, providing additional guidance on the so-called reinvestment phase that will follow. Finally, there is uncertainty on how the Bank will manage its policy rate forward guidance, but based on recent Tiff Macklem communications, we continue to expect the central bank to flag lift-off in the second half of 2022.”
CIBC
“The BoC will mark down its 2021 growth forecast (likely implying a slightly longer wait to close the output gap), raise its near-term inflation forecasts, keep rates on hold, and announce a cut in its secondary market bond purchases to CAD1 B per week. As our rates strategist Ian Pollick pointed out, that’s not a low enough pace for bond-buying to mark the start of the “reinvestment phase”, since adding in purchases in the primary market, the BoC’s holdings of Government of Canada bonds will still be climbing.”
Citibank
“This week’s BoC meeting is probably not the time for a change in the policy stance as the spread between actual and potential growth (the output gap) is unlikely to close any earlier than the current guidance for H2-2022. This guidance remaining unchanged could be a disappointment to markets pricing over 30bp of rate hikes by the April 2022 meeting. Citi analysts however expect the BoC to further reduce the pace of asset purchases to CAD1 B per week.”
BMO
“The three main things to watch for are (among the many keys): Does the Bank push back on the sudden hawkish outlook for policy in the year ahead? The market is now almost fully priced for four rate hikes in 2022, while the Bank has only previously said they won’t be in a position to hike until late that year. We suspect they modestly push back. Does the Bank effectively bring an end to QE, by moving directly to the reinvestment phase? We think yes, as there simply is no justification for such extreme stimulus at this point. QE was unleashed at a time of emergency – there is no emergency now. Does the Bank significantly adjust their inflation forecast? In July, they expected headline inflation to fade to 3.5% in Q4 of this year, and all the way down to 2.0% by 2022Q4. Arithmetic tells you the first figure will go higher, and logic suggests the second one is also at risk.”
-
07:45
France Producer Prices (MoM) came in at 1.7%, above forecasts (0.7%) in September
-
07:45
France Consumer Confidence came in at 99, below expectations (101) in October
-
07:37
Brent Oil set to hit the $90.00 level – Credit Suisse
Brent Crude Oil is approaching major resistance from its 2018 high and long-term downtrend between $86.74 and $88.95/90 – which economists at Credit Suisse expect to cap.
Initial support seen at $83.36
“Brent Crude Oil has risen further and remains on course for a test of the 2018 high at $86.74, which is the start of a very important technical resistance zone that stretches up to the long-term downtrend from 2008 and psychological level at $88.95/$90.00.”
“Our base case is for a cap at $88.95/$90.00 and we will be alert for any signs of a top forming in this zone. Whilst not our base case, a break can see strength extend to $100.”
“Support is seen at $83.36 initially, before $79.08 and then $77.50, with the 55-day average at $76.48 ideally holding further weakness.”
-
07:22
FX option expiries for October 27 NY cut
FX option expiries for October 27 NY cut at 10:00 Eastern Time, via DTCC, can be found below.
- EUR/USD: EUR amounts
- 1.1600 1.5b
- 1.1615 558m
- 1.1690-00 923m
- USD/JPY: USD amounts
- 112.80 720m
- 113.55 1.5b
- 114.50 758m
- AUD/USD: AUD amounts
- 0.7400 1.2b
- 0.7430 608m
- 0.7450 605m
- 0.7500 710m
- 0.7530 606m
- USD/CAD: USD amounts
- 1.2300 370m
- 1.2400 1b
- 1.2500 258m
- 1.2550 651m
- NZD/USD: NZD amounts
- 0.7200 337m
- EUR/GBP: EUR amounts
- 0.8525 461m
- 0.8700 344m
-
07:19
Forex Today: Majors stay in familiar ranges, eyes on US data, BoC policy decisions
Here is what you need to know on Wednesday, October 27:
The dollar gathered strength against its rivals for the second straight day on Tuesday but the action in major currency pairs remains subdued as investors gear up for key events and data releases. On Wednesday, September Durable Goods Orders and Trade Balance data will be featured in the US economic docket. The Bank of Canada (BoC) will announce its monetary policy decisions at 1400 GMT.
Durable Goods Orders Preview: Five scenarios to trade the event with EUR/USD.
Risk mood: The S&P 500 and the Dow Jones Industrial Average indexes hit new all-time highs on Tuesday but erased a large portion of daily gains before closing modestly higher. The Shanghai Composite is down nearly 1% on Wednesday and the Nikkei 225 is falling 0.25%. US stock index futures trade flat in the early European session. After the closing bell, Google Alphabet reported better-than-expected earnings for the third quarter.
Meanwhile, the 10-year US Treasury bond yield edged lower on Tuesday and seems to have gone into a consolidation phase between 1.6% and 1.65%.
Macro data: On Tuesday, the data from the US showed that New Home Sales surged by 14% in September, compared to the market expectation of 1.5%. Additionally, the Conference Board's Consumer Confidence improved to 113.8 in October from 108.3 in September.
On Wednesday, the Reserve Bank of Australia (RBA) reported that the Trimmed Mean CPI climbed to 2.1% on a yearly basis in the third quarter from 1.6% in the second quarter. This reading surpassed analysts' estimate of 1.8%.
Finally, the GfK Consumer Confidence Index in Germany rose to 0.9 in November from 0.4 in October and beat the market consensus of -0.5 by a wide margin.
EUR/USD continues to trade in a very narrow band around 1.1600 handle ahead of the European Central Bank's highly-anticipated policy meeting.
GBP/USD managed to gain traction on the back of the upbeat CBI retail trade figures on Tuesday but returned below 1.3800 with the dollar preserving its strength.
USD/CAD is staying relatively quiet around 1.2400 early Wednesday. The BoC is widely expected to leave its policy rate unchanged at 0.25% but a reduction in asset purchases could help the CAD stay resilient against its American counterpart.
Bank of Canada Rate Decision Preview: Inflation prospects headline policy review.
AUD/USD advanced beyond 0.7500 after the quarterly inflation data and closes in on the multi-month highs it set at 0.7548 last week.
Gold bulls failed to defend $1,800 on Tuesday and XAU/USD lost nearly 1%. The pair is moving sideways around $1,790 on Wednesday while waiting for the next catalyst.
Cryptocurrencies: Bitcoin met resistance near $64,000 on Tuesday and lost more than 4%. Currently, BTC is trading near $60,000 and additional losses could be witnessed if this support fails. Ethereum preserves its bullish momentum eyes new all-time highs near $4,400.
-
07:15
USD/CAD trades a tad below 1.2400 ahead of BOC rate decision
- USD/CAD makes a sluggish move on Wednesday ahead of a key BOC decision.
- WTI retreats from higher levels, exerting pressure on the prospects of the loonie.
- The greenback remains grounded amid upbeat housing and consumer sentiment data.
USD/CAD trades cautiously on Wednesday in the early European trading hours. The pair recovered from the intraday’s low of 1.2350 in the US session and confided in a very narrow trade band. At the time of writing, USD/CAD is trading at 1.2389, down 0.01% for the day.
The US Dollar Index (DXY), trades at 93.90 ahead of the market volatility amidst the major central banks' meetings. Investors anticipate Fed’s tapering while digesting delay in rate hike expectations. US corporate results remained strong despite inflation concerns, which helped the greenback in finding some traction.
The US New Home Sales soared 14% in September whereas the Consumer Confidence jumped to 113.8 in October from 109.8 in September.
The loonie took a back seat following a retreat in WTI prices and ahead of the critical Bank of Canada's (BOC) policy meeting later in the day. Investors anticipate that the BOC will hike the cash rate, as the Canadian economy faces rising inflation and a tightening labor market. Both conditions put an ideal scenario for the central bank to start increasing rates sooner than expected.
In addition to that, WTI eased on Wednesday after the unexpected rise in US stockpiles. The American Petroleum Institute data showed a 2.3 million barrel expansion in crude oil inventories.
As for now, traders are waiting for the US Durable Goods Orders, BOC Interest Rate Decision data to take fresh trading impetus.
USD/CAD additioanal levels
-
07:08
Gold Price Forecast: XAU/USD to retain a bullish bias above 50-DMA at $1780
Gold price extends previous losses. The 50-day moving average (DMA) at $1780 is set to test bulls’ commitments again as focus shifts to US data, central banks, FXStreet’s Dhwani Mehta reports.
Gold bears return ahead of key central banks’ rate decisions
“Investors gear up for the US Durable Goods Orders release, with the headline number likely to drop to 1.1% in September vs. 1.8% previous. The US macro news will significantly affect the dollar trades, in turn, gold’s price action. Gold traders will watch out for any hawkish hints from the Bank of Canada (BoC) policy meeting while the main event risk this week remains the US Q3 GDP report and the European Central Bank (ECB) decision.”
“The bright metal is challenging the mildly bearish 100-DMA support at $1789, eyeing a retest of the horizontal 50-DMA cap at $1780. Further south, the upward-pointing 21-DMA at $1771 could come to the rescue of gold bulls.”
“If the buyers manage to defend the 50-DMA once again, then a rebound towards the 200-DMA at $1793 will be on the cards.”
“A daily closing above the 200-DMA is critical to revive the previous week’s uptrend. The six-week highs of $1814 will be once again in the buyers’ sights should $1800 hold the fort on the upside. The falling trendline resistance at $1811 could also offer strong resistance on the road to recovery.”
See – Gold Price Forecast: XAU/USD to go on the topside once above $1813/42 – Commerzbank
-
07:07
USD/JPY points to further consolidation near term – UOB
USD/JPY is forecast to keep trading between 113.20 and 114.70 for the time being, commented FX Strategists at UOB Group.
Key Quotes
24-hour view: “We did not anticipate the strong advance in USD to 114.30 yesterday (we were expecting USD to trade within a range or 113.55/114.00). The advance appears to be running ahead of itself and USD is unlikely to strengthen much further. For today, USD is more likely to trade between 113.80 and 114.30.”
Next 1-3 weeks: “Our latest narrative was from last Friday (22 Oct, spot at 114.00). As highlighted, the current movement is viewed as part of a consolidation phase and USD is likely to trade between 113.20 and 114.70 for now.”
-
07:03
Natural Gas Futures: Further gains in the pipeline
Considering advanced prints from CME Group for natural gas futures markets, open interest resumed the downside on Tuesday and shrank by around 16.2K contracts. On the other hand, volume rose for the second consecutive session, now by around 10.8K contracts.
Natural Gas still looks to $6.50
Prices of natural gas dropped on Tuesday after hitting new multi-day highs near $6.10. The move, however, was amidst shrinking open interest, which is indicative that further losses remain unlikely in the very near term at least, while the target stays unchanged at the YTD peak at $6.50 mark per MMBtu (October 6).
-
07:00
Denmark Retail Sales (YoY): 3.1% (September) vs previous 4%
-
07:00
Germany Import Price Index (MoM) came in at 1.3%, below expectations (1.5%) in September
-
07:00
Germany Import Price Index (YoY) came in at 17.7% below forecasts (18%) in September
-
07:00
Germany Gfk Consumer Confidence Survey above expectations (-0.5) in November: Actual (0.9)
-
06:56
USD/CHF Price Analysis: Snaps two-day rebound from 200-DMA
- USD/CHF consolidates intraday losses but stays mildly offered below 50-DMA.
- Bearish MACD, failures to cross the immediate moving average keep sellers hopeful.
USD/CHF recovers from intraday low towards the 0.9200 as European traders brush their screens for a long Wednesday. Even so, the Swiss currency (CHF) pair prints 0.12% daily losses, the first in a week, by the press time.
In doing so, the quote fades the early week bounce off 200-DMA while easing from 50-DMA. Also favoring the sellers are the bearish MACD signals and the pair’s sustained trading below the previous support line from early August.
That said. the 200-DMA level of 0.9146 gains immediate attention of the sellers ahead of the mid-August lows near 0.9100. However, any further weakness will be probed by 0.9020.
Meanwhile, corrective pullback remains less important until crossing the 50-DMA level of 0.9220.
Even if the quote rises past 0.9220, the support-turned-resistance line will challenge the USD/CHF bulls around 0.9285.
In a case where the quote remains firmer past 0.9285, September’s peak of 0.9332 may offer an intermediate halt during the quote’s rally targeting the yearly top surrounding 0.9370.
USD/CHF: Daily chart
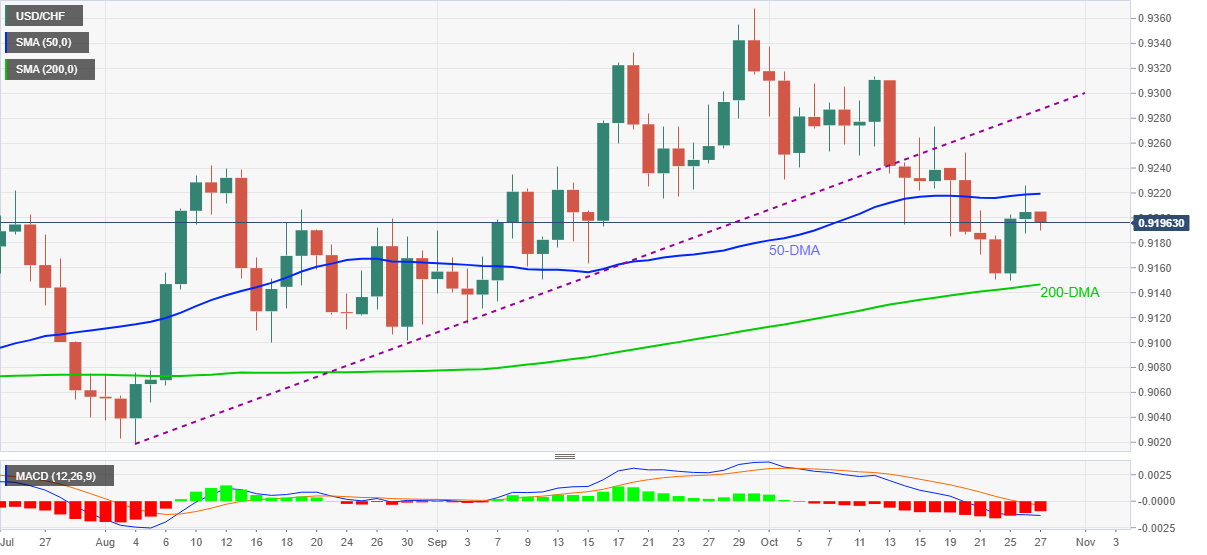
Trend: Pullback expected
-
06:43
Rising bets for further upside in AUD/USD – UOB
AUD/USD could extend the bullish momentum to the mid-0.7500s in the next weeks, noted FX Strategists at UOB Group.
Key Quotes
24-hour view: “We expected AUD to strengthen yesterday but we were of the view that ‘any advance is unlikely to break 0.7520’. The subsequent advance exceeded our expectations as AUD rose to 0.7525. Upward momentum has improved and AUD could strengthen further even though the major resistance at 0.7550 is likely out of reach for today. On the downside, a breach of 0.7485 would indicate that the current upward pressure has eased (minor support is at 0.7500).”
Next 1-3 weeks: “We have held a positive view in AUD for more than 2 weeks now. After AUD rose to 0.7547 and retreated sharply, in our latest narrative from last Friday (22 Oct, spot at 0.7460), we highlighted that ‘rapid drop from the high has resulted in a quick loss in momentum’. We added, ‘a break of our ‘strong support’ at 0.7440 would indicate that the positive phase has come to an end’. The ‘strong support’ level remains intact as AUD moved higher the past couple of days. Upward momentum is beginning to build and the prospect for the current AUD strength to move to 0.7550 has increased. Looking ahead, the next resistance is at 0.7580. On the downside, the ’strong support’ level has moved higher to 0.7460 from 0.7440.”
-
06:38
Crude Oil Futures: Near-term top in place?
Preliminary readings from CME Group noted traders scaled back their open interest positions in crude oil futures markets for yet another session on Tuesday, this time by around 8.2K contracts. In the same line, volume reversed three daily pullbacks in a row and went down by around 468.3K contracts, the largest single-day drop since July 2.
WTI faces some consolidation/correction
Tuesday’s decent advance in WTI prices was amidst shrinking open interest and volume, leaving the probability of extra gains somewhat curtailed in the very near term. That, plus the current overbought conditions could encourage some corrective move sooner rather than later, while the upside stays capped by the YTD highs past the $85.00 mark per barrel.
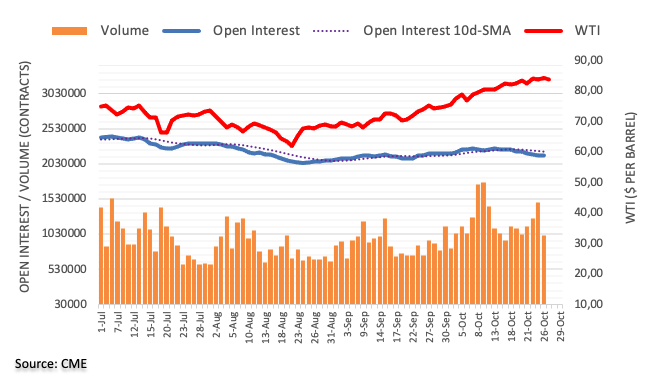
-
06:28
Sino-American tussles over telecom renew, China eyes ‘clear up’ of illegal coal storage
Early Wednesday, The Guardian came out with the news citing further hardships from the US regulators to China’s telecom companies.
“The decision by the US Federal Communications Commission (FCC) means China Telecom Americas must now discontinue US services within 60 days. China Telecom, the largest Chinese telecommunications company, has had the authorization to provide telecommunications services for nearly 20 years in the United States,” said the news.
The US-China tussles could also be witnessed via US Secretary of State Antony Blinken’s latest comments urging all United Nations (UN) members to support Taiwan's participation.
In addition to the absence of cordial relations with America, Beijing also suffers from real-estate-led financial crisis and energy problems at home.
To solve the first one, the dragon nation asked billionaire Hui Ka Yan to use his wealth to ease off the deepening debt crisis in the property development giant, per Bloomberg. For the second one, the National Development and Reform Commission (NDRC) takes action. “China said it will conduct "clean up and rectification" work on coal storage sites in some coal-producing areas and ban storage sites without approvals in its latest move to address skyrocketing coal prices,” per Reuters.
FX implications
Despite the challenges to risk appetite, S&P 500 Futures print mild gains around the record top amid US stimulus hopes and a good start to the Q3 earnings season. Also portraying the firmer mood in the market is the AUD/USD prices, up 0.23% intraday around 0.7515 by the press time.
Read: Gold Price Forecast: Bearish divergence, rising wedge direct XAU/USD towards $1,740
-
06:21
GBP/USD remains within the 1.3690-1.3840 range – UOB
Cable is still seen navigating within the 1.3690-1.3840 range in the short-term horizon, suggested FX Strategists at UOB Group.
Key Quotes
24-hour view: “The sharp but short-lived surge in GBP to 1.3829 and the subsequent rapid pullback came as a surprise (we were expecting GBP to drift lower). While the pullback lacks momentum, we still see chance for GBP to edge lower. That said, any weakness is unlikely to break 1.3725 (there is another support at 1.3740). Resistance is at 1.3785 followed by 1.3810.”
Next 1-3 weeks: “There is no change in our view from Monday (25 Oct, spot at 1.3755). As highlighted, the recent GBP strength has come to an end. The current movement is viewed as part of a consolidation phase and GBP is likely to trade between 1.3690 and 1.3840.”
-
06:16
EUR/GBP Price Analysis: Bounces-off fresh yearly lows near 0.8400, outlook remains weak
- EUR/GBP manages to trade higher on Wednesday in the early European trading hours.
- The pair hovers in a short-term trading range of 0.8420 and 0.8480 since October,15
- The momentum oscillator holds onto the oversold zone and warns caution on aggressive bids.
EUR/GBP held modest gains on Wednesday after it tested 0.8400 in the US session. The pair confided in a narrow trade band with no meaningful traction. At the time of writing, EUR/GBP is trading at 0.8424, up 0.02% for the day.
EUR/GBP daily chart
-637709084400994341.png)
On the daily chart, the EUR/GBP cross currency pair came under selling pressure after testing four-month high at 0.8658 on September 29, which intensified on October,14 after breaking the 50-day Simple Moving Average (SMA) at 0.8547.
If the price breaks below the 0.8400 mark, the gates will be open for February, 2020 at 0.8282.
Alternatively, the Moving Average Convergence Divergence (MACD) holds onto the overbought zone. Any uptick in the MACD could push the spot toward 0.8440 horizontal resistance zone and then the 0.8480 horizontal resistance zone. A break of the short term range of 0.8400 and 0.8480 would entice bulls to recapture the psychological 0.8500 levels.
EUR/GBP additional levels
-
06:14
USD/JPY Price Analysis: Off weekly support to defend 114.00
- USD/JPY snaps two-day uptrend, mildly offered of late.
- Weekly support line, 100-HMA restricts immediate downside.
- 61.8% Fibonacci retracement level, short-term resistance line test recovery moves.
USD/JPY licks its wounds around 114.00, down 0.12% intraday, as European traders brace for Wednesday’s bell. In doing so, the yen pair bounces off a one-week-old ascending support line by the press time.
The recovery moves currently eye 50% and 61.8% Fibonacci retracement levels of October 20-22 downtrend, respectively around 114.05 and 114.20.
However, any further advances will be challenged by the weekly resistance line near 114.30.
In a case where the USD/JPY buyers cross the 114.30 hurdle, the multi-year high flashed the last week, around 114.70, will be in focus.
Alternatively, a 100-HMA level near 113.90 adds to the immediate trend line support of 114.00 to restrict short-term downside.
Following that 113.70 and 113.20 will be important levels to watch before the USD/JPY bears could aim for September’s peak of 112.00.
Given the bearish MACD and weekly triangle formation, USD/JPY remains pressured.
USD/JPY: Hourly chart
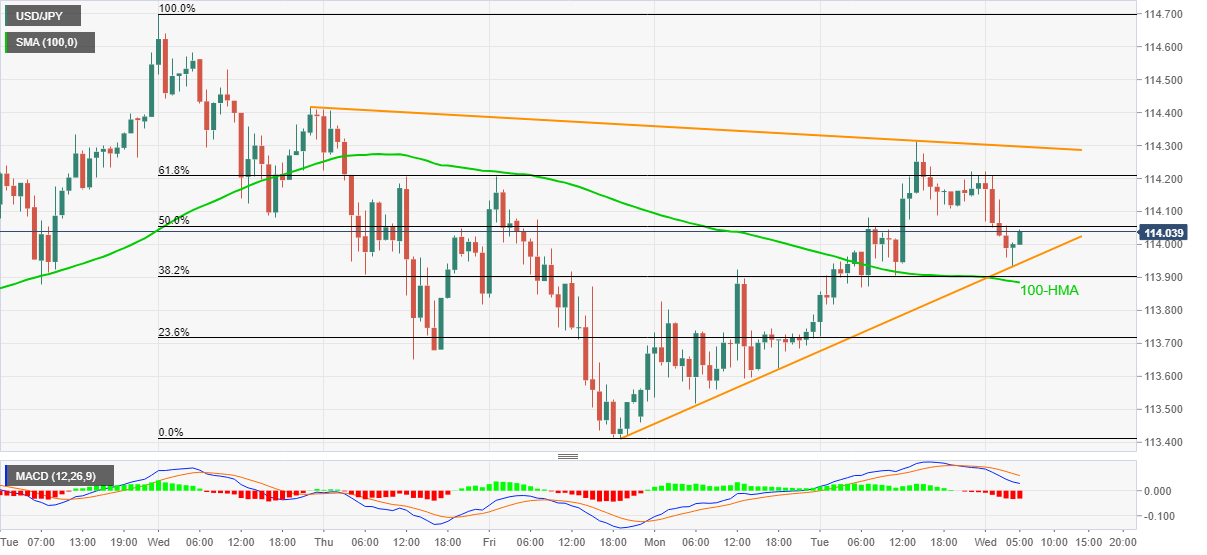
Trend: Further upside expected
-
06:12
Gold Futures: Further decline appears limited
CME Group’s flash data for gold futures markets noted open interest reversed two consecutive daily builds and shrank by around 5.8K contracts on Tuesday. Volume, instead, extended the erratic activity and went up by around 39.5K contracts.
Gold faces the next hurdle at $1,813
Tuesday’s negative price action in gold was accompanied by shrinking open interest and is indicative that a deeper retracement in prices of the yellow metal appears not favoured in the very near term. In the meantime, the monthly peak at $1,813 per ounce troy continues to cap intermittent bullish attempts for the time being.
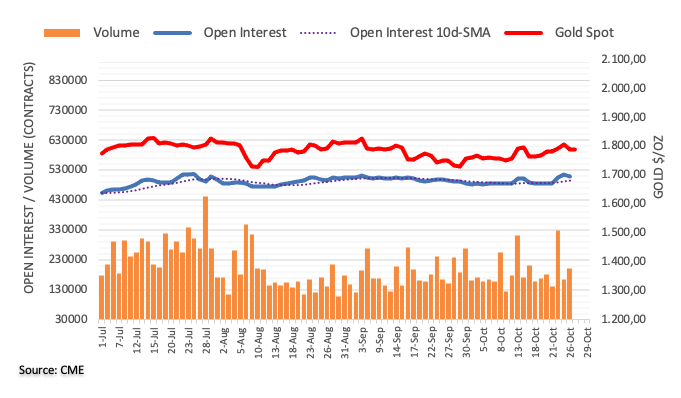
-
05:59
EUR/USD sticks to the consolidative phase – UOB
According to FX Strategists at UOB Group, EUR/USD is expected to keep the 1.1555-1.1670 range unchanged for the time being.
Key Quotes
24-hour view: “We highlighted yesterday that ‘despite the decline, downward momentum has not improved by all that much’. We added, EUR ‘could dip to 1.1580 first before a rebound can be expected’. However, EUR rose to 1.1625 first before dropping back down to 1.1583. The bias from here is on the downside but momentum is still not strong. A dip below 1.1580 would not be surprising but the major support at 1.1555 is unlikely to come under threat. Resistance is at 1.1610 followed by 1.1625.”
Next 1-3 weeks: “There is not much to add to our update from yesterday (26 Oct, spot at 1.1605). As highlighted, the recent EUR strength has run its course. EUR has likely moved into a consolidation phase and is expected to trade between 1.1555 and 1.1670 for now.”
-
05:55
USD/INR Price News: Indian rupee bears flirt with 75.00, US data, central banks eyed
- USD/INR consolidates Tuesday’s losses, picks up bids of late.
- Firmer oil prices, pick-up in covid cases and inflation fears favor pair buyers.
- US Durable Goods Orders may entertain traders ahead of the key Q3 GDP, BOC, ECB in focus too.
USD/INR stays mildly bid around 75.00 amid the early Indian trading session on Wednesday. The Indian rupee (INR) bears sneaks on inflation fears at home, coupled with the fresh increase in the COVID-19 fears. However, cautious mood ahead of the key US data and global central bank movers keep the pair buyers in check.
Although the Asian nation lauds over 1.0 billion vaccinations and hopes of higher tax revenues due to firmer economic transition, the latest jump in the covid cases challenges the INR bulls. That said, the daily rise in COVID-19 infections grew past 12,428 prior to 13,451, per the latest government data on Wednesday.
Additionally, growing fears that the energy crisis and a multi-year high of crude prices will escalate price pressure into the developing economy also weigh on the INR.
In this regard, the Reserve Bank of India (RBI) remains cautiously optimistic and keeps the currently easy monetary policy citing virus-led economic woes.
On the other hand, the US Dollar Index (DXY) snaps a two-day rebound from the monthly low as market sentiment dwindles ahead of the US Durable Goods Orders for September, expected -1.1% versus +1.8% prior. Even so, US stimulus optimism and receding COVID-19 fears in the US weigh on the greenback of late.
Also important will be the monetary policy meeting of the Bank of Canada (BOC) and the European Central Bank (ECB) ahead of the key US Q3 GDP, up for publishing on Thursday.
Amid these plays, US 10-year Treasury yields snap a three-day downtrend and the stock futures struggle for clear direction, suggesting further advances for the DXY should the scheduled data print a positive outcome.
Technical analysis
Sustained trading beyond a two-week-old resistance line, now support around 74.85, keeps USD/INR buyers hopeful.
-
05:17
USD/TRY Price Analysis: Steady below 5-DMA but bulls aren’t out of the woods
- USD/TRY sellers take a breather following two-day downtrend.
- Overbought RSI, SMA breakdown signals further pullback.
- Seven-week-old support line challenges the bears, bulls eye record top.
USD/TRY seesaws near $9.5430-25, keeping the previous day’s 5-DMA breakdown ahead of Wednesday’s European session. The Turkish Lira (TRY) pair dropped during the last two days after refreshing the all-time high earlier in the week.
Although overbought RSI and the near-term moving average breakdown favor USD/TRY sellers, an upward sloping support line from September 07, near $9.2170, restricts immediate downside.
Even if the pair sellers conquer the $9.2170 level, the $9.000 threshold and September’s peak around $8.9590 will question the further downside.
Meanwhile, recovery moves need to cross the 5-DMA hurdle of $9.5590 to recall the USD/TRY bulls.
Following that, the $9.6000 and $9.6660 may prone the advances before the all-time high of $9.8505.
In a case where the USD/TRY run-up remains intact beyond $9.8505, the $9.9000 psychological magnet will be in focus.
USD/TRY: Daily chart
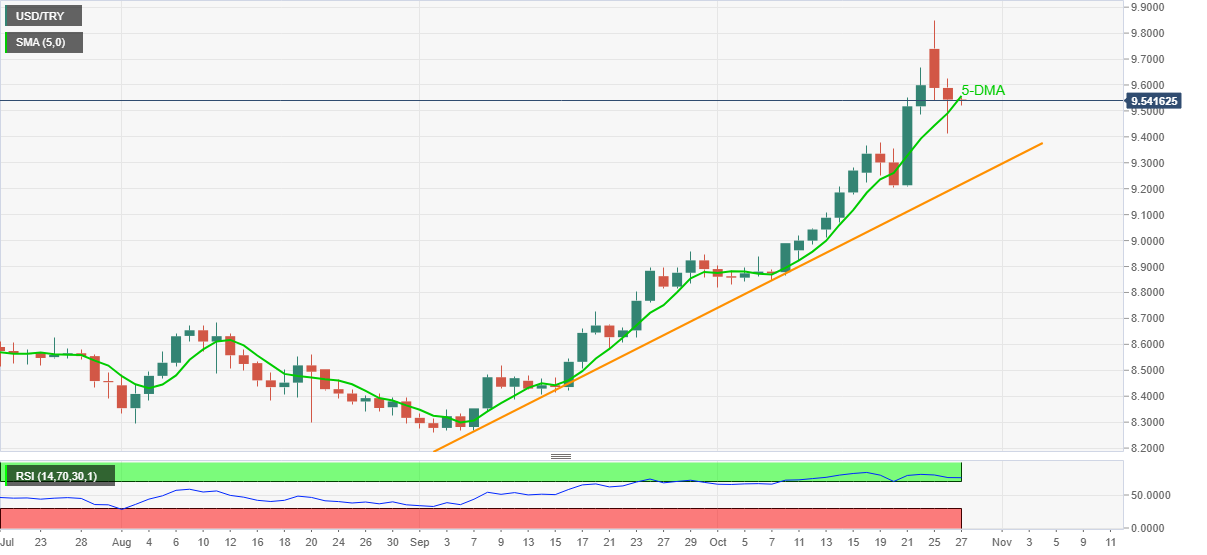
Trend: Bullish
-
05:17
Asian Stock Market: Hang Seng led declines amid China’s property sector concern
- Asian stocks mostly edge lower on Wednesday despite its higher US counterparts.
- Investors remain concerned about Beijing’s plan to introduce a real estate tax, the latest COVID-19 outbreak in Gansu province.
- Upbeat Australia’s quarterly CPI figures cemented early RBA’s rate hike bets.
Asia-Pacific stocks edge lower amid reduced risk appetite ahead of major central banking policy updates. Further, investors remained concerned about higher inflation and the indebted real estate sector in China.
MSCI’s broadest index of Asia-Pacific shares outside Japan edged down 0.53%, so far.
The Shanghai Composite Index lost 0.47%, following fresh concerns after another real-estate developer, Modern Land defaulted. Chinese authorities asked Evergrande Group’s founder Hui Ka Yan to use his personal wealth to pay off the firm’s debt. Further, there were 59 confirmed coronavirus cases as compared to 43 in the previous day.
The Nikkei 225 index declined 0.4% as investors geared up for the Bank of Japan’s (BOJ) monetary policy update on Thursday.
The ASX 200 traded 0.4% higher on Wednesday. The market sentiment was lifted by ongoing economic reopening plans. Australia’s Consumer Price Index (CPI) rose 0.8% in September on a quarterly basis, as per the market expectations.
Hong Kong’s Hang Seng Index declined 1.80% while South Korea’s Kospi fell 0.71%.
-
05:04
Gold Price Forecast: Bearish divergence, rising wedge direct XAU/USD towards $1,740
- Gold remains on the back foot around intraday low, down for the second consecutive day.
- Firmer US Treasury yields, inflation expectations underpin Fed tapering concerns, favoring bears.
- US dollar consolidates weekly gains ahead of the US Durable Goods Orders.
- Gold Price Forecast: Losing its shine and the 1,800 threshold
Gold (XAU/USD) extends the previous day’s losses below $1,800 heading into Wednesday’s European session.
The yellow metal snapped a five-day uptrend on Tuesday while confirming the bearish chart pattern, rising wedge. The corrective pullback, however, failed to reject formation and keeps the sellers hopeful amid firming expectations of the Fed tapering.
US inflation expectations jump to the highest levels last seen during May 2006, marking acute pressure on the Fed policymakers to consolidate the easy money streams. The same propels the US 2-year Treasury yields to the highest since May 2020, around 0.49% by the press time. The much-followed US 10-year Treasury yields also snap a three-day downtrend and challenge the stock future, up by one basis point around 1.62% at the latest.
It should be noted that the US stimulus and upbeat start to the Q3 earnings season seem to keep the equity buyers hopeful, challenging the gold bears. However, cautious mood ahead of the key advance estimation of the US Q3 GDP weighs on the precious metal.
Furthermore, the news of the US ban on China telecom over national security concerns and the Chinese summoning of the property companies to gauge the financial risk exert additional downside pressure on the gold prices.
Looking forward, the US Durable Goods Orders for September, expected -1.1% versus +1.8% prior, may entertain short-term gold traders but the key will be the US GDP and chatters surrounding inflation.
Read: US Third Quarter GDP Preview: A most uncertain estimate
Technical analysis
Gold buyers seemed to have finally stepped back as the quote confirmed a bearish chart pattern, namely rising wedge, on the four-hour (4H) play. Also keeping the sellers hopeful is the hidden bearish divergence between the RSI and prices, not to forget the MACD conditions teasing sellers.
Hence, a clear downside break of $1,795 should set the ball rolling for the gold bears to aim for the theoretical target of $1,740.
During the fall, the 200-SMA level surrounding $1,770 may offer an intermediate halt whereas the monthly low around $1,746 and September’s bottom near $1,721 will challenge the gold bears afterward.
Alternatively, an upside clearance of the weekly resistance line, close to $1,807 by the press time, guards the precious metal’s immediate upside before the monthly peak of $1,814.
It should be noted, however, the upper line of the stated wedge and tops marked since July, respectively around $1,820 and $1,834, will become the tough nuts to crack for the gold buyers then after.
Gold: Four-hour chart
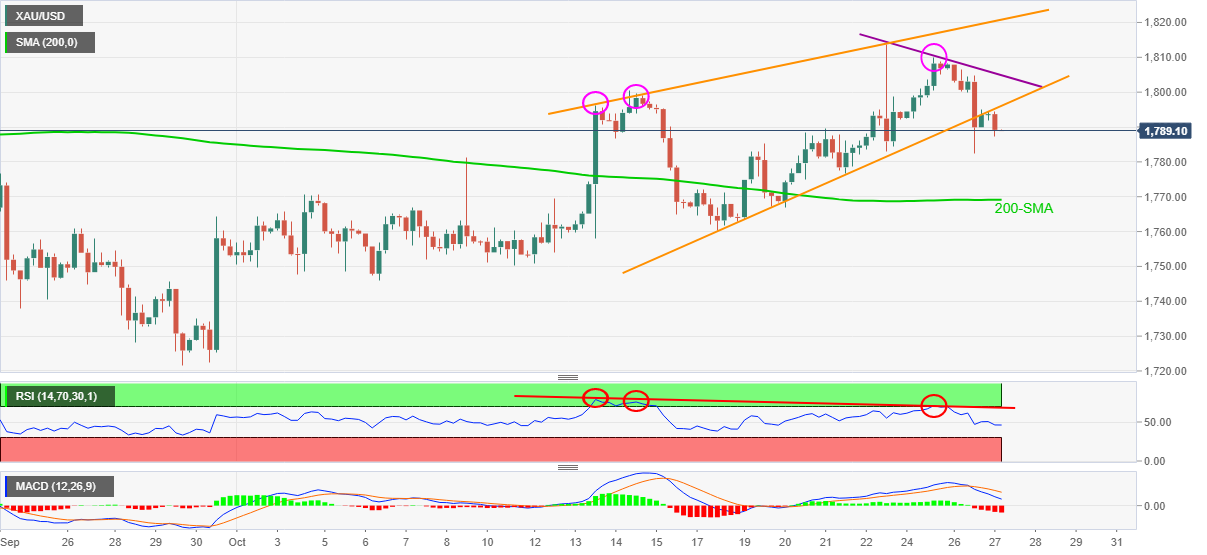
Trend: Further weakness expected
-
04:42
GBP/USD cheers USD retreat past 1.3750, focus on Brexit, UK budget
- GBP/USD consolidates the previous day’s pullback from weekly top.
- France braces for a Brexit fight over fishing issues, UK’s Frost hints at easy checks on EU imports.
- UK Chancellor Sunak to unveil budget 2021, NHS relief, minimum wage hike eyed.
- US Durable Goods Orders, Treasury yields important too.
GBP/USD picks up bids to 1.3775, reversing the previous day’s U-turn from weekly high heading into the key London open on Wednesday. The cable pair benefits from the US dollar pullback ahead of the annual budget announcement by UK Finance Minister (Chancellor of the Exchequer) Rishi Sunak.
The £7 billion aid to the UK’s National Health Services (NHS) and a push to the minimum wage hike to £10 have already been discussed as the promising offers from Mr. Sunak. However, the mystery lies in how the diplomat manages to tame the record budget deficit and the surging inflation.
On the same line, Reuters conveyed the news that the British Retail Consortium (BRC) eyes further jump in the UK inflation ahead of Christmas. The news quotes the BRC executive Helen Dickinson to mention that three in five retailers planned to raise prices before Christmas. “It is now clear that the increased costs from labor shortages, supply chain issues and rising commodity prices have started filtering through to the consumer," adds Dickinson per Reuters.
It should be noted covid fears are regaining momentum in Britain of late. The latest virus-led deaths jump to the highest since March while the daily infections also jumped past 40,000 levels per the latest government figures.
Elsewhere, Thierry Breton, the European Union’s (EU) internal market Commissioner termed Brexit as a catastrophe and causing shortages as the bloc’s representatives arrive in the UK for talks. Joining the line were diplomats from France as The Times reports, “France intends to retaliate against Britain’s refusal to offer more permits for French fishermen working in British inshore waters and is likely to announce its measures today.” Further, Politico quotes UK Brexit Minister David Frost to mark the likelihood of easy checks on the goods from the EU.
Alternatively, the US Dollar Index (DXY) snaps a two-day rebound from the monthly low as market sentiment dwindles ahead of the US Durable Goods Orders for September, expected -1.1% versus +1.8% prior. Even so, US stimulus optimism and receding COVID-19 fears in the US weigh on the greenback of late.
Looking forward, US data and risk catalysts may affect the GBP/USD prices but the UK budget and Brexit will be more important.
Technical analysis
Given the sluggish Momentum and the quote’s latest break below the 50-SMA on the four-hour (4H) chart, the sellers are sneaking in for entries. However, the weekly trading range and the stated support line, respectively around 1.3750 and 1.3740, could restrict the short-term GBP/USD declines.
-
04:25
AUD/USD Price Analysis: Looks to test multi-month resistance at 0.7550
- AUD/USD trades higher on Wednesday in the Asian session.
- Upbeat Australian CPI figures fuel the upside momentum in the pair.
- Additional gains are likely for the pair if price decisively recaptures 0.7550.
AUD/USD extends the previous day’s gains on Wednesday. The pair started the fresh trading week on a higher note after hitting a low 0.7452, a week ago. At the time of writing, AUD/USD is trading at 0.7522, up 0.31% for the day.
AUD/USD daily chart
-637709016436976425.png)
On the daily chart, the AUD/USD pair has been facing a strong resistance barrier near 0.7550, just below the 200-day Simple Moving Average (SMA) at 0.7561. The spot has posted strong gains since the beginning of the October series from the lows of 0.7191.
A daily close above the multi-month high near 0.7550 would fuel another round of buying opportunities in the pair. The first upside target would appear at the psychological 0.7600 level.
The Moving Average Convergence Divergence (MACD) trades into the overbought zone. Any uptick in the MACD would open the gates for the 0.7650 horizontal resistance level, followed by the June,16 high of 0.7717.
Alternatively, if the price reverses direction, in that case, it could test Tuesday’s low of 0.7483, followed by the 0.7450 and the 0.7400 horizontal support zones respectively.
AUD/USD additional levels
-
03:50
EUR/USD loiters near 1.1600 amid USD recovery
- EUR/USD continues to trade under pressure on Wednesday.
- The US Dollar remains steady near 94.00 following uptick in the US T-bond yields.
- Dismal German data, softer view on inflation cemented dovish ECB stance.
EUR/USD remains muted in the Asian session on Wednesday. The pair posted the losses for the third straight day. At the time of writing, EUR/USD is trading at 1.1599, up 0.03% for the day.
The greenback trades near 94.00, tracking the rebound in the US 10-year benchmark Treasury yields. Investors remained concerned about the policy outlook guidance from upcoming central bank meetings. The greenback remained strong against the euro and the yen on policy divergence.The shared currency came under pressure after a European Central Bank (ECB) survey showed that the Eurozone banks tightened access to mortgages in the last three months and expected to continue doing so in the final quarter of 2021. The survey came two days before the ECB is set out to assess the economic situation, paving the way for a decision in December on the continuation of the central bank’s bond-buying program.
In addition to that, the single currency also weighed down by the signs that the ECB will be among the last to raise rates among major central banks. German data released on Monday showed the deteriorating business morale, which cemented the expectations of a dovish message from Thursday’s ECB meeting.
As for now, traders are waiting for German Gfk Consumer Confidence, and US Durable Goods Orders to take fresh trading impetus.
EUR/USD additional levels
-
03:25
Evergrande risks resurface as China urges billionaire founder Hui to pay debt
Renewed concerns surrounding China Evergrande Group are sapping investors’ confidence once again, especially after Chinese regulators asked billionaire Hui Ka Yan to use his personal wealth to ease off the deepening debt crisis in the property development giant, Bloomberg reports, people familiar with the matter.
Key details
Beijing’s directive to the Evergrande founder came after his company missed an initial Sept. 23 deadline for a coupon payment on a dollar bond.
Local governments across China are monitoring Evergrande’s bank accounts to ensure company cash is used to complete unfinished housing projects and not diverted to pay creditors.
Market implications
The Asian stocks are in the red, as investors are unsure whether Hui’s wealth is liquid enough to reduce Evergrande’s sizeable liabilities, which swelled to more than $300 billion as of June.
AUD/USD is reversing the Australian inflation-led rally to 0.7537, weekly tops. The spot was last seen trading at 0.7524, still up 0.35% on the day.
-
03:14
USD/INR Price News: Indian Rupee is testing daily flag counter-trend line
- USD/INR bulls are staying on the sidelines while the US dollar consolidates.
- US 10-year yields are testing the trendline support and could be expected to rise from here.
USD/INR is trying to breakout of the bullish flag pattern on the daily chart but there is a lack of conviction in terms of the US dollar. The greenback has been stuck in a sideways range and trapped between support and resistance. The following illustrates the various component to what is required for a breakout in USD/INR.
USD/INR daily chart
-637708967049373503.png)
The price has been trying to break the trendline resistance of the daily flag but, so far, there has been a lack of follow-through. However, the pullback to the test of the counter trendline is a healthy prospect for bulls waiting on the sidelines.
-637708966483311018.png)
As illustrated, the market structure remains bullish while the price is nestled in at the counter trendline as well as the horizontal support structure. While above this area of support, an upside bias persists. The bulls will be banking on higher US rates as the 10-year yield meets support at the daily dynamic supporting trendline as follows:
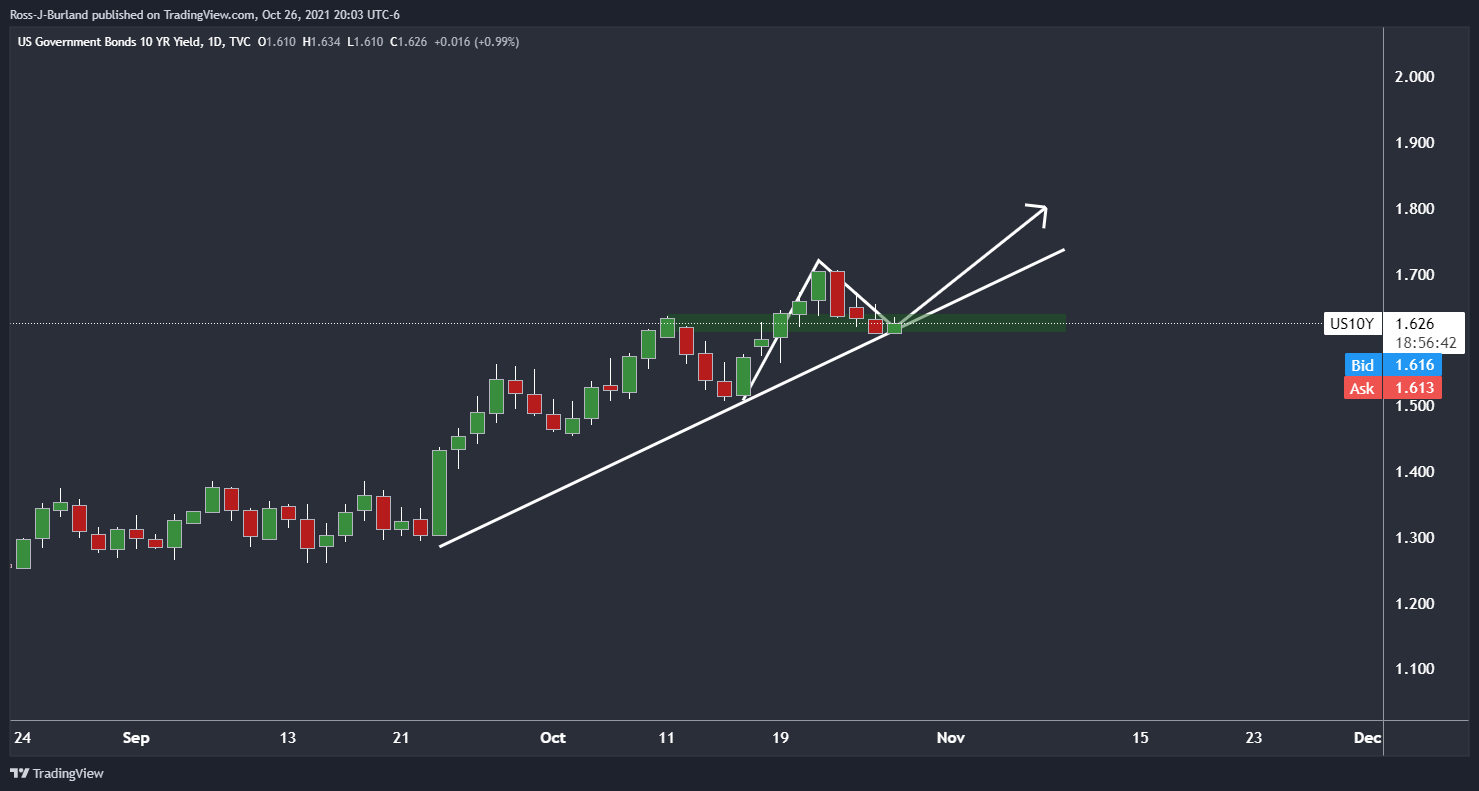
If the US yields continue to move higher at this juncture, then the US dollar would be expected to follow suit. The price is DXY, however, could be on the verge of a reverse head and shoulders, so long as the support of 93.78 holds up. We now have the makings of a reverse head and shoulders as well, which is bullish:
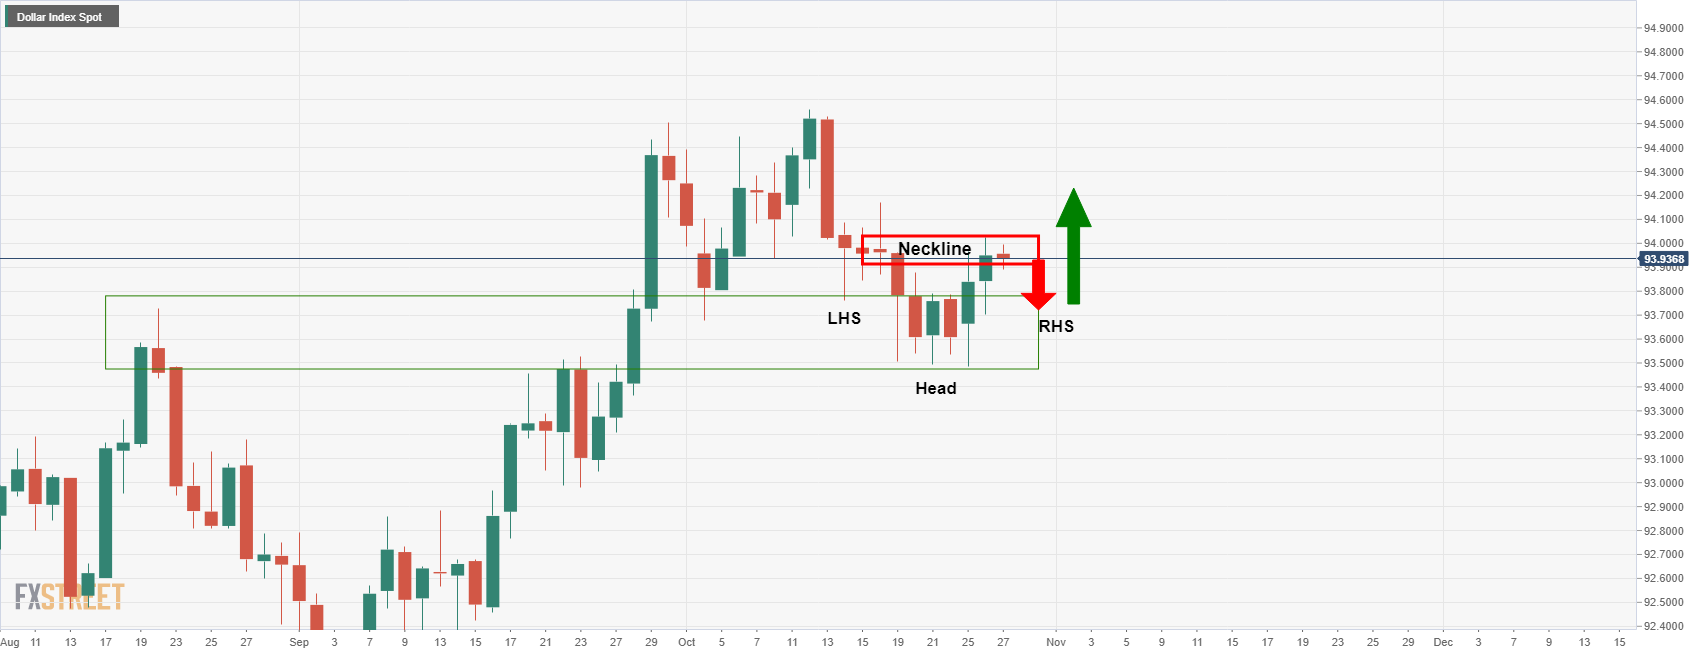
-
03:09
USD/CNH Price Analysis: Pierces weekly hurdle above $6.38 but bears stay hopeful
- USD/CNH picks up bids to refresh intraday high, snaps four-day downtrend.
- Trend line breakout can aim for last week’s peak but previous support, 200-SMA will question bulls.
USD/CNH justifies rebound from immediate support, up 0.07% intraday around $6.3820 during early Wednesday.
In doing so, the offshore Chinese currency pair (CNH) jumps past the weekly resistance line, suggesting further advances toward the October 21 high of $6.4000.
It should be noted that the sluggish Momentum line may challenge the quote’s upside past $6.4000. Also acting as the key hurdles to the north are the support-turned-resistance line near $6.4175 and the 200-SMA level of $6.4225.
Alternatively, a downside break of the stated nearby support line, at $6.3770 by the press time, will recall the USD/CNH bears targeting the monthly low of $6.3685, also the lowest since June.
Should the quote remain bearish past $6.3685, the yearly bottom of $6.3525 will be in focus.
USD/CNH: Four-hour chart
Trend: Bearish
-
03:03
ECB: The most significant meeting to global markets – Scotiabank
In the view of the analysts at Scotiabank, the European Central Bank (ECB) monetary policy decision on Thursday “could be the most significant meeting to global markets.”
Key quotes
“It is fairly widely expected that President Lagarde will lead an effort to push back on pricing for hikes to the -0.5% deposit rate.”
“At present, markets are pricing most of a 10bps hike by next summer, though a return to a zero rate is well down the road.”
“Expect lots of talk of base effects, transitory drivers and slack in terms of its inflation logic going forward.”
Read: Eurozone inflation expectations hit fresh seven-year highs above ECB’s 2% target
-
02:44
S&P 500 Futures retreat from record top as US 2-year Treasury yields jump to 19-month high
- S&P 500 Futures struggle to extend nine-day uptrend around all-time high.
- US Treasury yields track inflation expectations to the north ahead of the key data.
- Wall Street cheers US stimulus hopes, upbeat earnings season.
S&P 500 Futures fail to ignore reflation fears, stepping back from the all-time high to 4,565 during early Wednesday. In addition to the Fed tapering tantrums, cautious sentiment ahead of the key advance estimation of the US Q3 GDP.
US inflation expectations jump to the highest levels last seen during May 2006, marking acute pressure on the Fed policymakers to consolidate the easy money streams. The same propels the US 2-year Treasury yields to the highest since May 2020, around 0.49% by the press time.
It’s worth noting that the 10-year Treasury yields also snap a three-day downtrend and challenge the stock future, up by one basis point around 1.62% at the latest.
Not only in the US but the jump price pressure in Australia and rallying inflation expectations in the Eurozone also challenge the equity bulls even if the earnings season has been good so far. That being said, the tech giant Google beat Q3 estimates during the previous day’s release.
Talking about data, US CB Consumer Confidence unexpectedly recovered in October while figures concerning New Home Sales for September and Richmond Fed Manufacturing Index for the last month also flashed better-than-forecast numbers.
Moving on, the US Durable Goods Orders for September, expected -1.1% versus +1.8% prior, can offer intermediate moves to the market players ahead of tomorrow’s key US GDP data. Also important will be the chatters surrounding the US stimulus package and central bank moves.
-
02:30
AUD/NZD Price Analysis: Aussie CPI sees Wycoff mark-up underway
- AUD/NZD is on the way to complete the M-formation's target at the neckline.
- Wycoff methodology plays out in the mark-up phase.
The price of AUD/NZD is making fresh highs on a break of accumulation resistance as per the 1-hour time frame. The pair has completed a significant phase of the Wycoff methodology as illustrated in a series of analyses since Oct 18 that has tracked the consolidation:
- AUD/NZD Price Analysis: Traders, don't get caught out!
- AUD/NZD Price Analysis: Bulls waiting to pounce
- AUD/NZD Price Analysis: Accumulation is occurring, bulls taking over
- AUD/NZD Price Analysis: Bulls struggle to catch a breakout
AUD/NZD prior analysis, 1HR chart
In the above chart, it was illustrated that the price was working its way through the various stages of the Wycoff method. A breakout to the upside was expected and it too today's CPI data to finally see this occur:
The price has rallied and broken out of the resistance and as per Wycoff, we can now expect a mark-up and the prospects of a test of the daily M-formation's neckline as a target:
AUD/NZD, prior daily analysis
''The market is moving sideways and a trapped environment between hourly support and resistance but there are prospects of a bullish breakout to test the neckline of the following daily M-formation at 1.0524:
AUD/NZD live market, daily chart
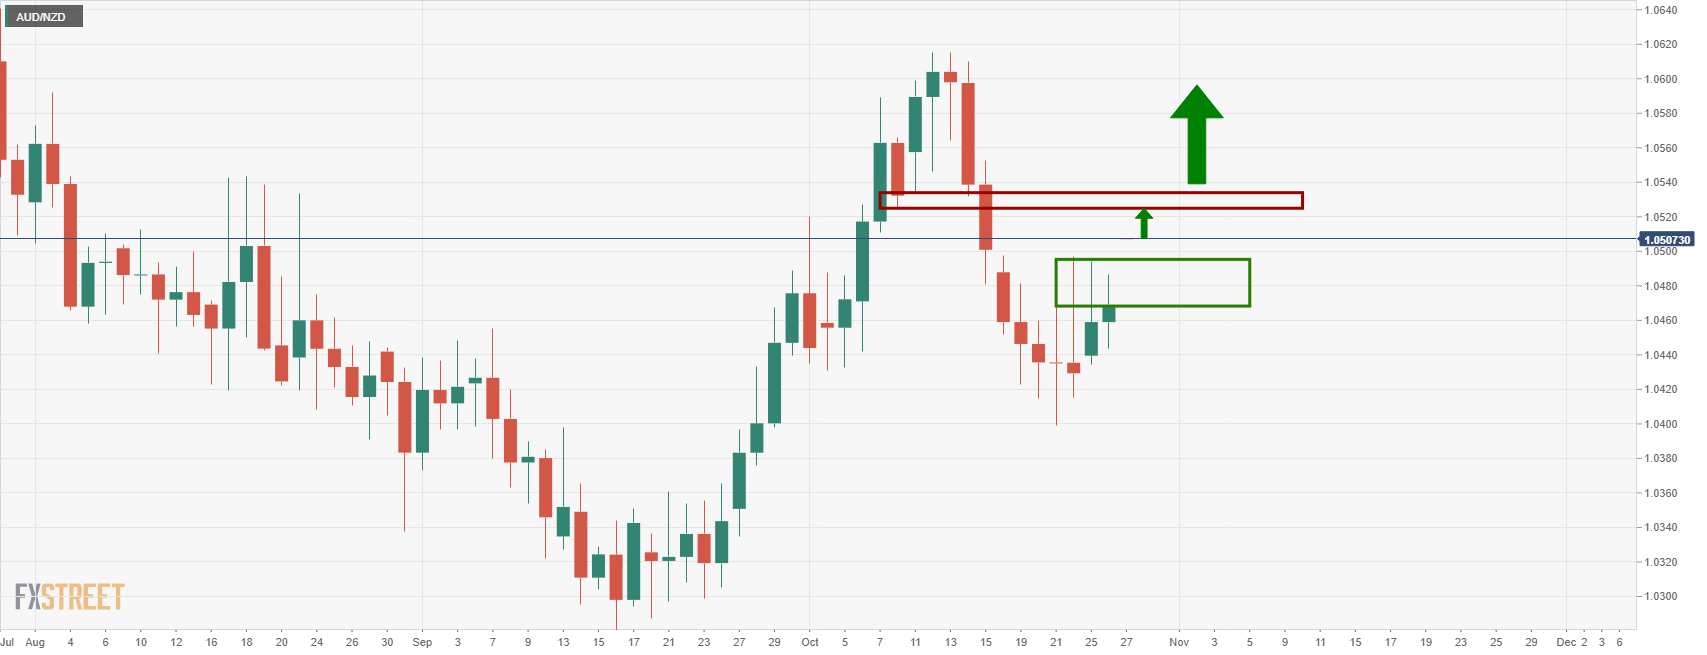
-
02:23
Australia’s 5-year Treasury bond yields refresh 29-month high post inflation data
With the latest Aussie inflation figures pushing the Reserve Bank of Australia (RBA) towards a rate hike, Australia’s 5-year Treasury yields jumped to the highest since May 2019 following the data, at 1.35% by the press time.
That said, the headline Consumer Price Index (CPI) remains unchanged at 0.8% QoQ, matching forecasts while easing below 3.1% market consensus to 3.0% on YoY. On the contrary, the Reserve Bank of Australia's (RBA) trimmed-mean CPI jumped past 1.8% expected and 1.6% prior readouts to 2.1% YoY whereas the quarterly readings also crossed the 0.5% forecast and the previous read to 0.7%.
It should, however, be noted that RBA Governor Philip Lowe earlier cited the need to wait for the Aussie wage numbers to confirm the reflation fears, which in turn probes AUD/USD bulls by the press time.
Also testing the quote’s upside is the 15-year high of US inflation expectations and the market’s cautious mood ahead of the US GDP.
Read: AUD/USD spikes to 0.7535 on strong Australia inflation, bulls eye 0.7565 key hurdle
-
02:23
USD/CNY fix: 6.3856 vs the last close of 6.3830
In recent trade today, the People’s Bank of China (PBOC) set the yuan (CNY) at 6.3856 vs the last close of 6.3830.
About the fix
China maintains strict control of the yuan’s rate on the mainland.
The onshore yuan (CNY) differs from the offshore one (CNH) in trading restrictions, this last one is not as tightly controlled.
Each morning, the People’s Bank of China (PBOC) sets a so-called daily midpoint fix, based on the yuan’s previous day closing level and quotations taken from the inter-bank dealer.
-
02:14
US Dollar Index Price Analysis: DXY pulls back from 100-SMA, focus on weekly support
- DXY snaps two-day uptrend, pressured around intraday low of late.
- Sluggish RSI, failures to cross 100-SMA favor direct sellers toward short-term support line.
- 200-SMA, monthly low add to the downside filters.
US Dollar Index (DXY) remains pressured around 93.90, keeping the previous day’s U-turn from the weekly top. In doing so, the greenback gauge declines for the first time in three days while stepping back from the 100-SMA.
Given the RSI line showing a lack of buying momentum, the latest weakness is likely targeting the weekly support line, near 93.82 by the press time.
However, 200-SMA and the monthly low, respectively around 93.60 and 93.48, will challenge the DXY bears afterward.
Meanwhile, an upside clearance of the immediate SMA hurdle close to the 94.00 threshold will aim for the October 18 peak surrounding 94.20.
In a case where the US Dollar Index remains firmer past 94.20, the monthly high of 94.56 should lure the bulls.
DXY: Four-hour chart

Trend: Pullback expected
-
01:54
AUD/JPY inches toward 0.8600 post Australia upbeat CPI
- AUD/JPY posts gains for the third straight day on Wednesday.
- The Aussie jumps against majors post upbeat CPI data.
- The Japanese yen remains on the backfoot on dovish BOJ, risk-on mood.
AUD/JPY continues to gain on Wednesday in the early Asian session. The cross-currency pair has been rising since the beginning of the October series. As of writing, the AUD/JPY is trading at 85.93 up 0.36% for the day.
Investors cheered up Australia's upbeat inflation data. The Consumer Price Index (CPI) came at 0.8% in line with market expectations on a quarterly basis. The Reserve Bank of Australia (RBA) Trimmed Mean CPI reported at 0.7% QoQ basis, beating the market consensus of 0.5%. The aussie gains on the expectations that the higher inflation readings will prompt the RBA to raise the cash rate before 2024.
In addition to that, the reopening of Australian borders supports the sentiment surrounding the aussie. As per the latest update fully vaccinated Australian citizens and permanent residents will no longer require an exemption from outbound travel from Australia from November 1.
On the other hand, the Japanese yen lost its momentum amid an improved risk appetite among investors. It is worth noting that S&P 500 Futures is trading at 4,569, up 0.07% for the day. Further, the market is bracing for the Bank of Japan (BOJ) dovish monetary policy announcement on Thursday. The BoJ is expected to maintain its massive stimulus program while signaling more delays in the economic recovery.
As for now, the market dynamcis continue to influecne the pair's performance.
AUD/JPY additional levels
-
01:46
AUD/USD spikes to 0.7535 on strong Australia inflation, bulls eye 0.7565 key hurdle
- AUD/USD takes the bids to refresh weekly top following firmer Aussie Q3 inflation data.
- Australia CPI matches QoQ forecasts but RBA Trimmed Mean CPI favors bulls.
- Market sentiment stays mixed amid pre-US data caution, US-China headlines and receding covid fears.
- US Durable Goods Orders eyed for fresh impulse.
AUD/USD remains well-bid around the intraday top of 0.7532, up 0.42% on a day after strong Australia Q3 inflation figures, published during early Wednesday. In doing so, the quote prints a three-day uptrend by the press time.
That said, the headline Consumer Price Index (CPI) remains unchanged at 0.8% QoQ, matching forecasts while easing below 3.1% market consensus to 3.0% on YoY. On the contrary, the Reserve Bank of Australia's (RBA) trimmed-mean CPI jumped past 1.8% expected and 1.6% prior readouts to 2.1% YoY whereas the quarterly readings also crossed the 0.5% forecast and the previous read to 0.7%.
Read: Breaking: Aussie CPI Q3 trimmed mean hotter, AUD rallies
The inflation figures reject the RBA’s efforts to tame the reflation fears and hence propel the AUD/USD prices amid hopes of a rate hike by the Aussie central bank.
Other than the firmer Aussie inflation data, the market’s cautious optimism also favors the AUD/USD prices due to its risk barometer status.
To portray the mood, the S&P 500 Futures print mild gains tracking the Wall Street benchmarks whereas the US 10-year Treasury yields remain for the fourth day in a row. Further, the US Dollar Index (DXY) snaps a two-day rebound from the monthly low while taking offers around 93.90 at the latest.
US stimulus hopes and the recently improving relations between America and China could be cited as the lead positives behind the latest risk-on mood. On the same line are the easy COVID-19 infections in Australia and a jump in the vaccinations.
However, multi-year high inflation expectations from the US keep the Fed tapering on the top and challenge the market’s mood amid the risk-averse eyes before the advance estimation of the US Q3 GDP. Additionally, China’s sour relations with Australia also challenge the sentiment.
That being said, the AUD/USD traders will keep their eyes on the US Durable Goods Orders for September, expected -1.1% versus +1.8% prior, for fresh impulse ahead of tomorrow’s key US GDP data. Also important is the RBA Assistant Governor Guy Debelle’s speech around 23:40 GMT on Wednesday.
Technical analysis
AUD/USD bulls stay in the command above the monthly support line and bullish MACD signals hint at a bit longer reins.
However, a convergence of an ascending resistance line from August and 200-DMA joins nearly overbought RSI conditions to challenge the pair buyers around 0.7565. Also acting as an upside filter is the 61.8% Fibonacci retracement (Fibo.) of May-August fall and late June’s peak, respectively around 0.7590 and 0.7620.
Meanwhile, the stated trend line support joins September’s peak around 0.7480-75 to restrict short-term downside. Also acting as the immediate support is the latest swing low near 0.7450.
Hence, AUD/USD buyers brace for the key hurdle ahead of all-important Aussie Q3 inflation data. However, the bears aren’t allowed entry until the quote stays beyond 0.7450.
AUD/USD: Daily chart
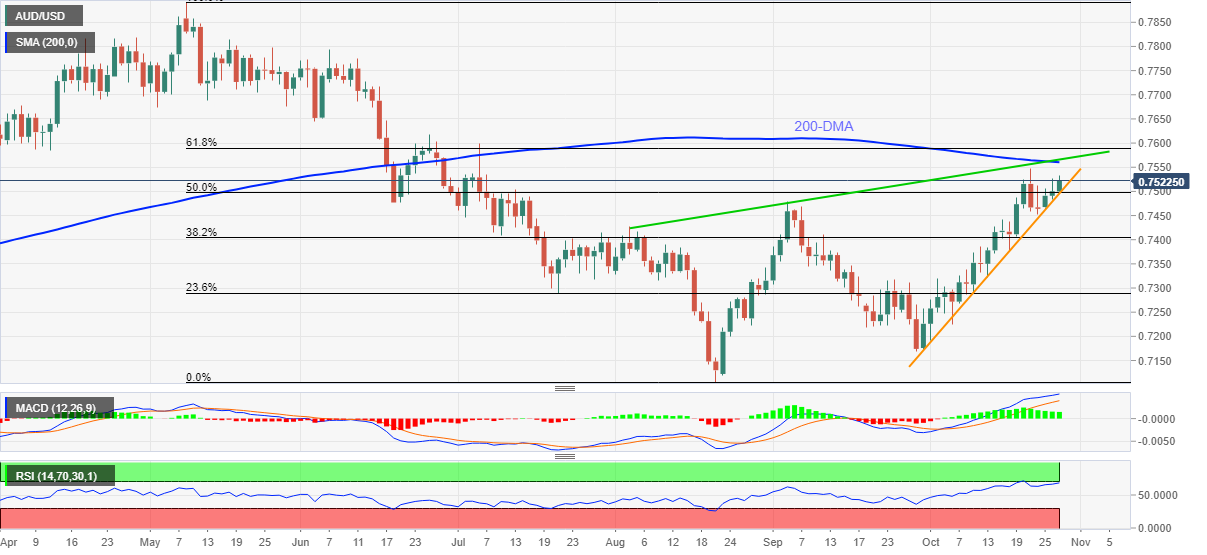
Trend: Pullback expected
-
01:34
Breaking: Aussie CPI Q3 trimmed mean hotter, AUD rallies
Australia’s third-quarter Consumer Price Index has been released. AUD/USD has spiked on hotter trimmed mean data. Australian short-term bond yields are also up after annual trimmed mean inflation rise to the highest since 2015:
Aussie CPI Q3
Q3 RBA trimmed-mean CPI +0.7 pct QoQ (Reuters poll +0.5 pct).
Q3 CPI(all groups) +0.8 pct QoQ (Reuters poll +0.8 pct).
Q3 RBA weighted median CPI +0.7 pct QoQ(Reuters poll +0.5 pct).
Q3 RBA trimmed mean cpi +2.1 pct YoY (Reuters poll +1.8 pct).
Q3 CPI (all groups) +3 pct YoY (Reuters poll +3.1 pct).
Q3 RBA weighted median CPI +2.1 pct YoY (Reuters poll +1.9 pct).
There was more uncertainty than usual due to the lingering effects from the now-expired HomeBuilder grants and the ABS imputing price changes for some services, analysts noted prior to the data.
''The main downward offsets in Q3 are pharmaceuticals and communications.''
Additionally,m given New Zealand's surprise outcome for inflation, there was some prospect of a surprise to the upside for Australia's today.
''The big difference between Australia and New Zealand is that non-tradable inflation in Australia is expected to remain low, and we don’t expect that to change much until wages start to meaningfully accelerate,'' analysts at ANZ Bank argued.
AUD/USD implications
- Australian dollar aud=d3 rises to $0.7528 after inflation data
- Australian short-term bond yields up after annual trimmed mean inflation rise to highest since 2015.
- AUD/USD rallies 0.3% to test 0.7430s.
Prior to the data, the following analysis was performed on the 1-hour chart in order to highlight the market structure and potential areas for which price could move to, depending on the outcome:
- AUD/USD Price Analysis: Bulls in charge pre-CPI, eye 0.7530/50
Before...
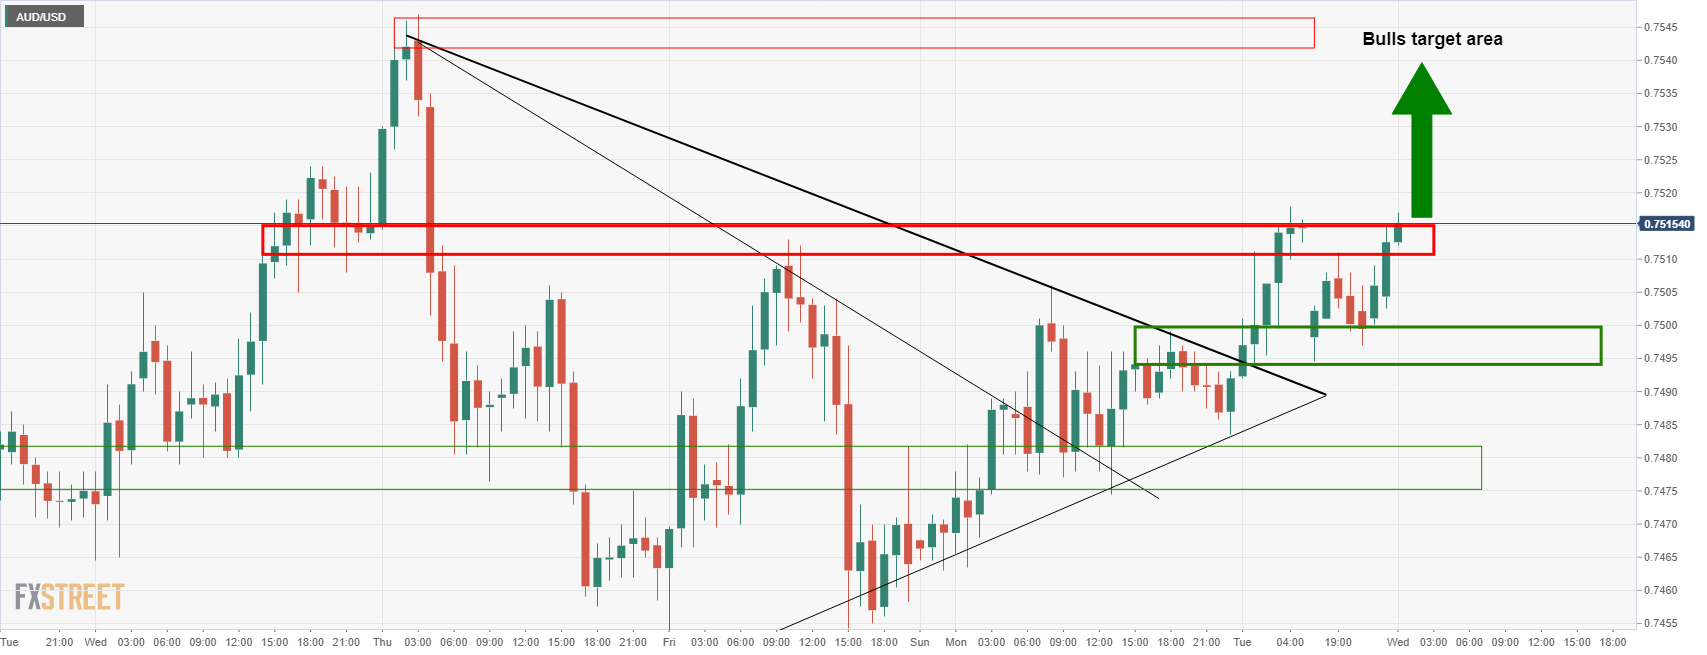
After...
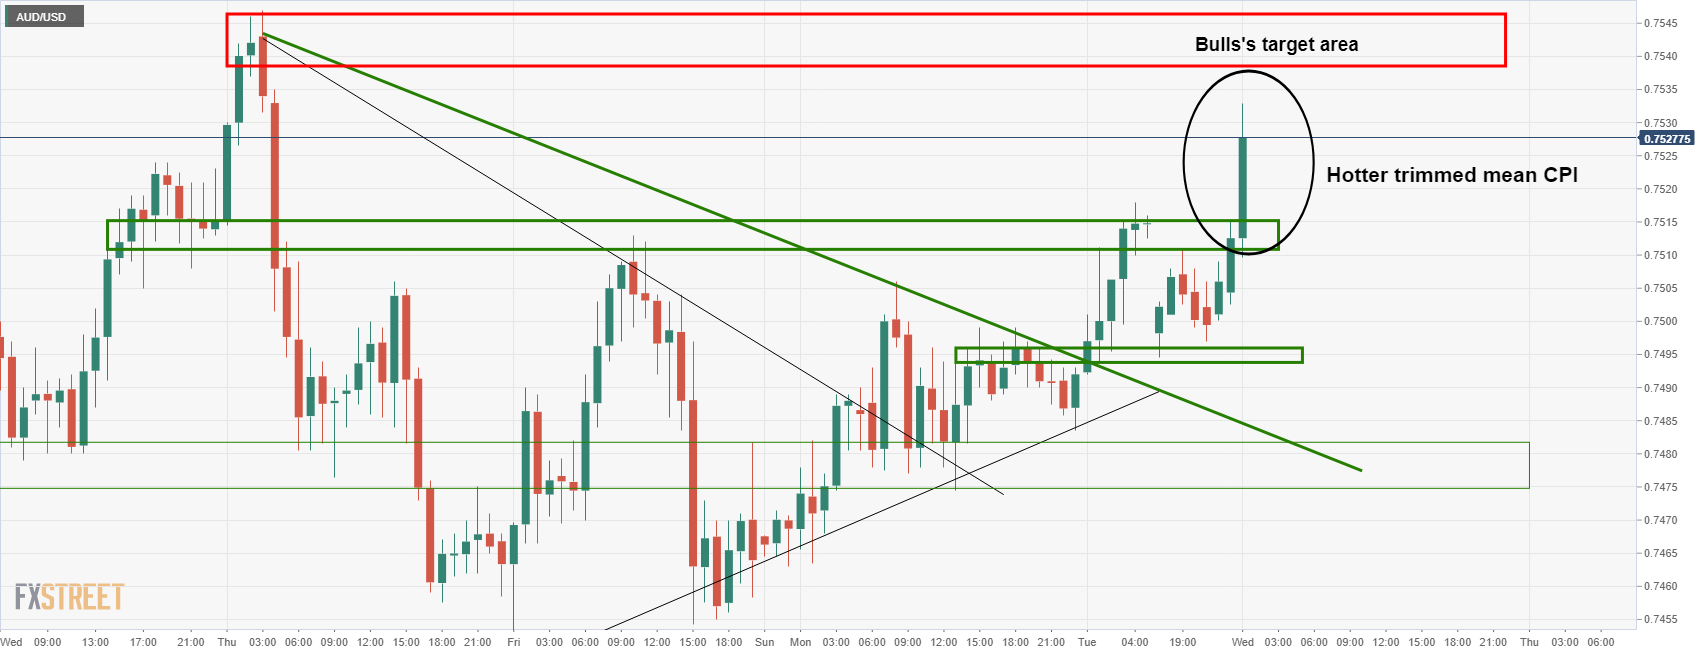
Meanwhile, the price is unlikely to go too far ahead of next week’s RBA decision.
About the Aussie CPI
Australian Bureau of Statistics (ABS) has a significant impact on the market and the AUD valuation. The gauge is closely watched by the Reserve Bank of Australia (RBA), in order to achieve its inflation mandate, which has major monetary policy implications. Rising consumer prices tend to be AUD bullish, as the RBA could hike interest rates to maintain its inflation target. The data is released nearly 25 days after the quarter ends.
The Consumer Price Index released by the RBA and republished by the Australian Bureau of Statistics is a measure of price movements by the comparison between the retail prices of a representative shopping basket of goods and services. The trimmed mean is calculated as the weighted mean of the central 70% of the quarterly price change distribution of all CPI components, with the annual rates based on compounded quarterly calculations.
-
01:31
Australia RBA Trimmed Mean CPI (QoQ) came in at 0.7%, above forecasts (0.5%) in 3Q
-
01:31
Australia Consumer Price Index (YoY) came in at 3%, below expectations (3.1%) in 3Q
-
01:30
Australia Consumer Price Index (QoQ) meets expectations (0.8%) in 3Q
-
01:30
Australia RBA Trimmed Mean CPI (YoY) came in at 2.1%, above forecasts (1.8%) in 3Q
-
01:30
Schedule for today, Wednesday, October 27, 2021
Time Country Event Period Previous value Forecast 00:30 (GMT) Australia Trimmed Mean CPI q/q Quarter III 0.5% 0.5% 00:30 (GMT) Australia CPI, q/q Quarter III 0.8% 0.8% 00:30 (GMT) Australia Trimmed Mean CPI y/y Quarter III 1.6% 1.8% 00:30 (GMT) Australia CPI, y/y Quarter III 3.8% 3.1% 06:00 (GMT) Germany Gfk Consumer Confidence Survey November 0.3 -0.5 06:45 (GMT) France Consumer confidence October 102 101 08:00 (GMT) Eurozone Private Loans, Y/Y September 4.2% 08:00 (GMT) Switzerland Credit Suisse ZEW Survey (Expectations) October 25.7 08:00 (GMT) Eurozone M3 money supply, adjusted y/y September 7.9% 7.5% 12:30 (GMT) U.S. Goods Trade Balance, $ bln. September -87.6 12:30 (GMT) U.S. Durable goods orders ex defense September 2.4% 12:30 (GMT) U.S. Durable Goods Orders ex Transportation September 0.2% 0.4% 12:30 (GMT) U.S. Durable Goods Orders September 1.8% -1.1% 14:00 (GMT) Canada Bank of Canada Monetary Policy Report 14:00 (GMT) Canada Bank of Canada Rate 0.25% 0.25% 14:30 (GMT) U.S. Crude Oil Inventories October -0.431 1.65 23:40 (GMT) Australia RBA Assist Gov Debelle Speaks 23:50 (GMT) Japan Retail sales, y/y September -3.2% -2.3% -
01:19
USD/CAD: Options market remains bearish for seventh week ahead of BOC
One-month risk reversal (RR) on USD/CAD, a measure of the spread between call and put prices, drops for the seventh consecutive week per the data source Reuters.
A call option gives the holder the right but not obligation to buy the underlying asset at a predetermined price on or before a specific date. A put option represents a right to sell. That said, the weekly RR drops to -0.012 by the press time of early Wednesday.
The options market signal contrast the latest USD/CAD price performance as the Loonie pair pokes weekly high while keeping the last week’s rebound from a four-month low, grinding higher around 1.2390 by the press time.
Given the likelihood of the Bank of Canada’s (BOC) tapering announcements, USD/CAD prices may witness further downside. However, any surprise may follow the firmer US dollar moves to favor the pair buyers.
Read: USD/CAD Price Analysis: Grinds higher around 1.2400, BOC Interest Rate Decision eyed
-
01:16
AUD/USD Price Analysis: Bulls in charge pre-CPI, eye 0.7530/50
- AUD/USD is in focus as CPI looms, with bulls eyeing 0.7550 and the bears 0.7480.
- 0.7530 is a key options level that could give way if data comes in surprisingly hot.
Aussie CPI is out at the top of the hour and a preview of the event can be read here.
The following is a snapshot of the hourly chart and market structure to offer traders some insight as to how the price might react to the various scenarios laid out in the above analysis. 0.7530 is a key level according to options markets while a hotter than expected print could well see the price advance significantly higher on Reserve Bank Australia expectations.
AUD/USD 1 HR chart
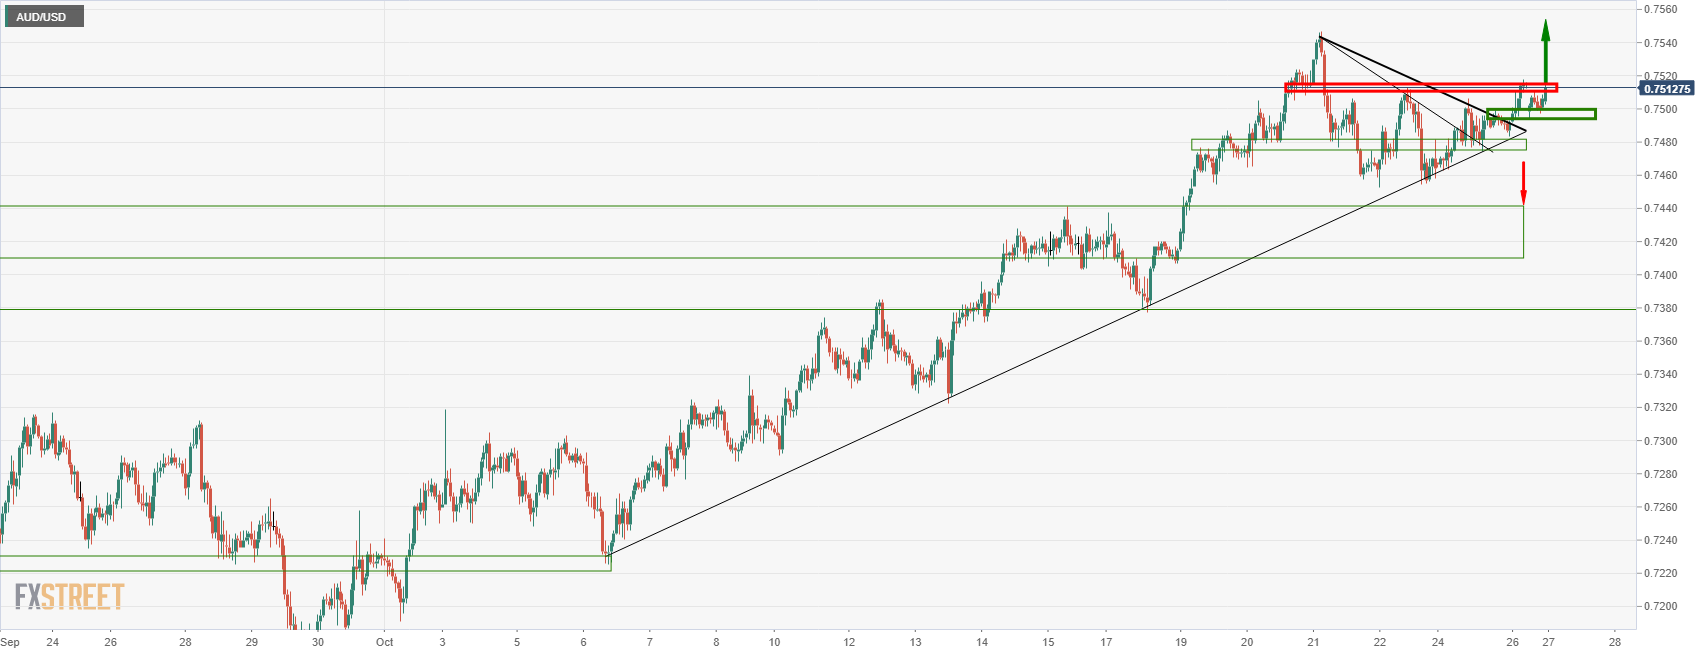
The price is attempting a continuation of the longer-term bullish trend following a break of the prior dynamic trendline resistances. A positive CPI outcome will likely accelerate the bulls through the horizontal resistance that has so far anchored the pair below it near 0.7515 to at least 0.7550. If, on the other hand, we see a miss, the price will likely be forced back to test the old dynamic resistance as a counter-trendline near 0.7480.
AUD/USD, 1HR, a closer look
Positive CPI prospects:

Negative CPI prospects:
-
01:15
Currencies. Daily history for Tuesday, October 26, 2021
Pare Closed Change, % AUDUSD 0.74979 0.1 EURJPY 132.274 0.22 EURUSD 1.15917 -0.16 GBPJPY 157.073 0.36 GBPUSD 1.3763 -0.01 NZDUSD 0.7161 0.02 USDCAD 1.23897 0.09 USDCHF 0.91931 0.19 USDJPY 114.118 0.37 -
01:07
Silver Price Analysis: XAG/USD defends $24.00 even as bears lurking for controls
- Silver keeps the previous day’s bound off weekly low.
- Pullback from 200-day EMA, downside break of a fortnight-old support line favor bears.
- Sellers eye one-month-old ascending trend line, seven-week-long horizontal resistance adds to the upside filters.
Silver (XAG/USD) remains range-bound above $24.00 amid Wednesday’s Asian session. That said, the quote prints $24.15 level after posting the heaviest daily fall in a month while stepping back from 200-day EMA.
In addition to the quote’s U-turn from the key moving average, receding bullish bias of the MACD and a break of an ascending support line from October 13, near $24.25 by the press time, also favor sellers.
Hence, the bright metal seems set to retest the monthly support line, around $23.50. However, the $24.00 threshold may offer an intermediate halt during the fall.
It should be observed that a clear downside past $23.50 won’t hesitate to break the $23.00 round figure.
On the flip side, an upside clearance of the previous support line close to $24.25 will aim for the 200-day EMA level of $24.55 before directing the XAG/USD bulls toward a horizontal area established since early September around $24.80-90.
In a case where the silver prices remain firmer past $24.90, the $25.00 psychological magnet and August month’s high of $26.00 will be in focus.
Silver: Daily chart
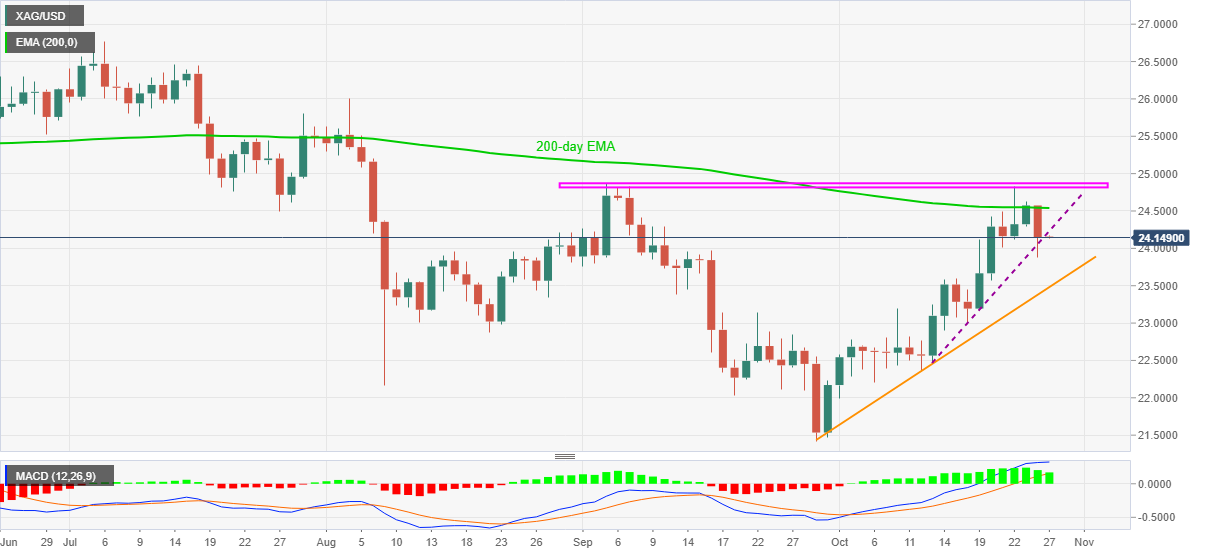
Trend: Further weakness expected
-
01:03
New Zealand ANZ Activity Outlook: 21.7% (October) vs previous 26.2%
-
01:02
EUR/JPY Price Analysis: Bulls consolidate below 132.50
- EUR/JPY trades cautiously on Wednesday in the early Asian trading session.
- A break above 132.50 would entice more upside for the pair in the near term.
- Momentum oscillator signals caution before placing any aggressive bids.
EUR/JPY accumulates gains in the middle of the week. The pair stayed in a very narrow trade band despite the previous session’s upside momentum. At the time of writing, EUR/JPY is trading at 132.41, up 0.02% for the day.
EUR/JPY daily chart
-637708895974175160.png)
On the daily chart, the EUR/JPY cross-currency pair has been on the continuous upside after testing the low of 128.33 on June 10. The spot peaked at a four-month high at 133.48 on October,20 before retreating toward the low made on Monday at 131.86.
If the price breaks above the intraday high it could test Thursday’s high of 132.79. The Moving Average Convergence (MACD) indicator holds above the overbought zone. Any uptick in the MACD would prompt EUR/JPY bulls to meet the 133.00 horizontal resistance zone. Upon successful testing of the mentioned level, the spot would attempt to extend gains beyond toward the four-month highs of 133.48.
Alternatively, if the price reverses direction it could fall back to the 132.00 horizontal support level. Next, the market participants would keep their eyes on the low of October,15 at 131.82, followed by the 131.20 horizontal support zone.
EUR/JPY additional levels
-
01:01
New Zealand ANZ Business Confidence declined to -13.4 in October from previous -8.6
-
00:45
AUD/NZD seesaws around 1.0460-80 range ahead Australian CPI figures
- Australia’s inflation figures for the third quarter could boost the AUD/NZD.
- Worse than expected, New Zealand Trade Balance figures strengthened the kiwi but gave back its gains.
- AUD/NZD: In the 1-hour chart, a break above 1.0500 would open the doors for a 1.0600 test.
The AUD/NZD barely climbs during the Asian session, is up 0.10%, is trading at 1.0485. Futures in Asia are mixed, with the FTSE China A50 and the Hang-Seng futures in the red, whereas the Nikkei 225, Topix, and the S&P/ASX 200 futures record gains.
As the Asian session began, the AUD/NZD dropped to 1.0460 on worse than expected New Zealand macroeconomic data but reversed its course towards current levels once investors dissected data.
The New Zealand Trade Balance deficit widened from $-2139M to $-2171M in September on a monthly basis. Furthermore, Imports rose to $6.495 billion, outpacing Exports which expanded by $4.4 billion, as portrayed by the abovementioned. Both figures were higher than expected.
On Wednesday, the Australia macroeconomic docket will feature the RBA Trimmed Mean Core Price Index, and the Consumer Price Index for the Q3 is estimated at 0.5% and 0.8%, respectively.
AUD/NZD Price Forecast: Technical outlook
The 1-hour chart depicts the AUD/NZD pair is trading within the 1.0450-80 range. The simple moving averages (SMA’s) are below the spot price, suggesting the pair has an upward bias, but as long as it remains below 1.0500 remains at risk of further downside pressure. The Relative Strength Index (RSI) momentum indicator at 58 aims higher, confirming the upward bias.
Nevertheless, a clear break above 1.0500 would open the door for further gains. In that outcome, the first resistance level would be the R3 pivot point level at 1.0521. A breach of the latter could expose 1.0562, followed by 1.0600.
On the flip side, a sustained break below 1.0450 could open the door for AUD/NZD sellers to push the pair towards 1.0400.
AUD/NZD ADDITIONAL LEVELS TO WATCH
-
00:38
When is the Australia CPI data and how could it affect the AUD/USD?
Australian CPI overview
Early on Wednesday, at 00:30 GMT, markets will see the 2021’s third quarter (Q3) inflation data for the Australian economy.
The headline Consumer Price Index (CPI) QoQ is likely to stay unchanged around 0.8% but the YoY figures may ease to 3.1% versus 3.8% previous readouts.
On the contrary, the Reserve Bank of Australia's (RBA) trimmed-mean CPI is expected to rise from 1.6% to 1.8% on a yearly basis while likely staying unchanged at 0.5% on QoQ.
Although the latest RBA meeting minutes stated that an inflation target of 2-3% will not be hit until 2024, the policymakers’ concerns over rising inflation highlight today’s CPI data for AUD/USD traders.
Ahead of the release, TD Securities said,
We are more hawkish on inflation in Q3 and expect CPI inflation to rise to 1.0% q/q, 3.3% y/y (mkt:0.8% q/q, 3.1% y/y) from 0.6% q/q, 1.1% y/y in Q2. In Q3, new dwelling prices are expected to rise sharply as the dampening effect from the HomeBuilder grants fades, while transport costs are expected to increase notably due to higher fuel and motor vehicle prices. Supply-chain disruptions globally may also result in broad-based inflationary pressures which could push CPI trimmed mean inflation to 0.6% q/q, 1.9% y/y which is close to RBA 2% target. If our forecasts are correct, a pickup in inflation momentum, despite strict state-level lockdowns, should put the RBA's dovish inflation outlook in question with more pain for AUD front-end rates to come.
How could it affect the AUD/USD?
AUD/USD prints a three-day uptrend around 0.7510 ahead of the stated inflation data on Wednesday. The risk barometer cheers the mildly bid S&P 500 Futures to remain firmer amid a so-far quiet Asian session. However, firmer US Dollar Index (DXY) and recently rising inflation expectations seem to probe the AUD/USD bulls of late.
Hence, any surprise uptick in either the headlines CPI or the RBA Trimmed Mean CPI becomes necessary for the AUD/USD bulls to keep the reins. In absence of this, the RBA policymakers’ rejection of the reflation fears may dent the Aussie upside amid the caution mood before the advance estimation of the US Q3 GDP.
Technically, the monthly support line of around 0.7495 keeps the AUD/USD buyers hopeful amid bullish MACD signals. However, a convergence of 200-DMA and a four-month-old resistance near 0.75460-65 becomes a tough nut to crack for them.
Key Notes
AUD/USD Forecast: Eyes on Australian inflation figures
AUD/USD bulls engage and target a higher high on CPI day
About the Australian CPI
The Consumer Price Index released by the RBA and republished by the Australian Bureau of Statistics is a measure of price movements by the comparison between the retail prices of a representative shopping basket of goods and services. The purchasing power of AUD is dragged down by inflation. The CPI is a key indicator to measure inflation and changes in purchasing trends. A high reading is seen as positive (or bullish) for the AUD, while a low reading is seen as negative (or Bearish).
-
00:27
GBP/JPY Price Analysis: Bullish impulse eyes double tops
- GBP/JPY bulls take a breather after two-day uptrend.
- Firmer RSI backs sustained trading beyond monthly support line, 200-SMA to keep buyers hopeful.
GBP/JPY picks up bids inside an immediate trading range surrounding 157.00, following a pullback from the weekly high. That said, the quote remains sidelined after rising for the last two days.
However, the quote’s ability to bounce off an ascending support line from October 01 on Monday joins sturdy RSI and successful trading above 200-SMA to favor the bulls.
Hence, the latest peak around 157.70 is on the cards before the double tops near 158.20 challenge GBP/JPY upside.
It’s worth noting that a clear run-up past 158.20 will aim for the 160.00 psychological magnet with the late June 2016 peak of 159.21 acting as a buffer.
Meanwhile, a downside break of the immediate support line, near 156.85, will direct GBP/JPY sellers towards the 200-SMA level of 155.13.
In a case where the cross-currency remains weak past 155.13, October 12 swing low around 153.70 will be in focus.
GBP/JPY: Four-hour chart
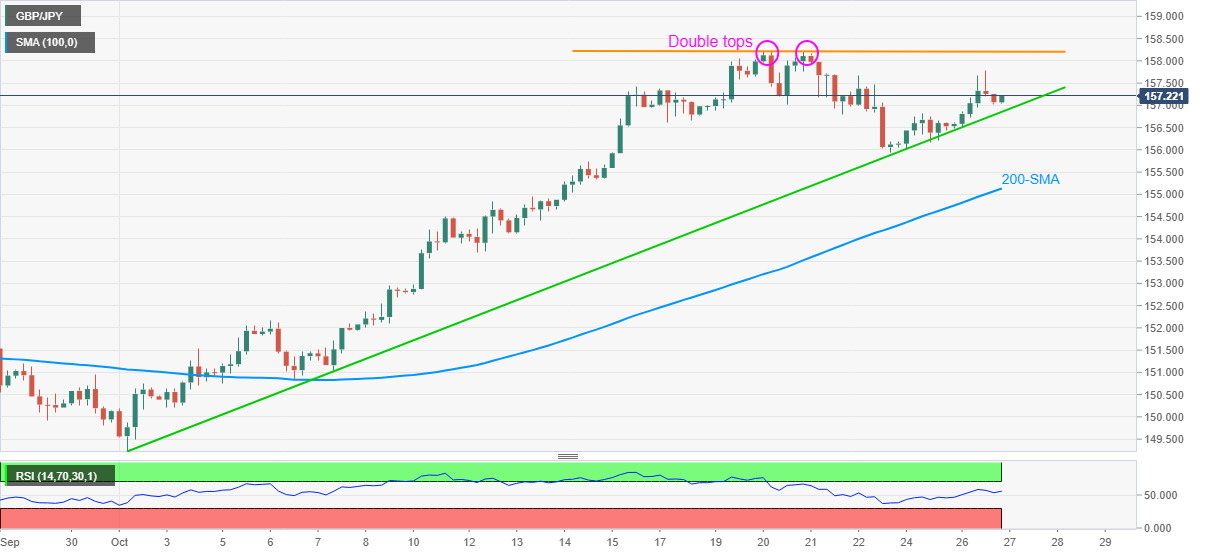
Trend: Further upside expected
-
00:16
Gold Price Forecast: $1,830's remain elusive, but bull momentum intact
- Gold has been offered in a mixed session for the US dollar, again.
- The risk-on sentiment has dented the allure of the safe-haven metal.
- Central banks and economic data could love the needle over the next couple of weeks.
The price of gold has been offered on Tuesday, but it was established in the New York sessions and has found an equilibrium near the 10-day EMA in the current range. XAU/USD is sat in the $1,790s in a quiet start to the Asian session.
The price fell on Tuesday from a high of $1,808 and made a low of $1,782 before settling back to the close of $1,792. The markets were overall risk-on with US equities marginally higher but printing fresh record highs amid strong reported company earnings. In the same bullish light, US data on Housing, Consumer Confidence and Manufacturing all beat expectations, yet, the greenback was mixed, leaning bullish into the close on Wall Street.
The markets are waiting for news from upcoming central bank meetings that might spark volatility over the next couple of weeks while economic data could also move the needle and shift views on interest rates, inflation and growth rates.
In this regard, the US yields on 10-year kept in a narrow range before sliding to 1.610% in the afternoon in New York. With that being said, the yield is now meeting a dynamic support line on the daily chart as follows, so the trajectory from here could be to the upside:
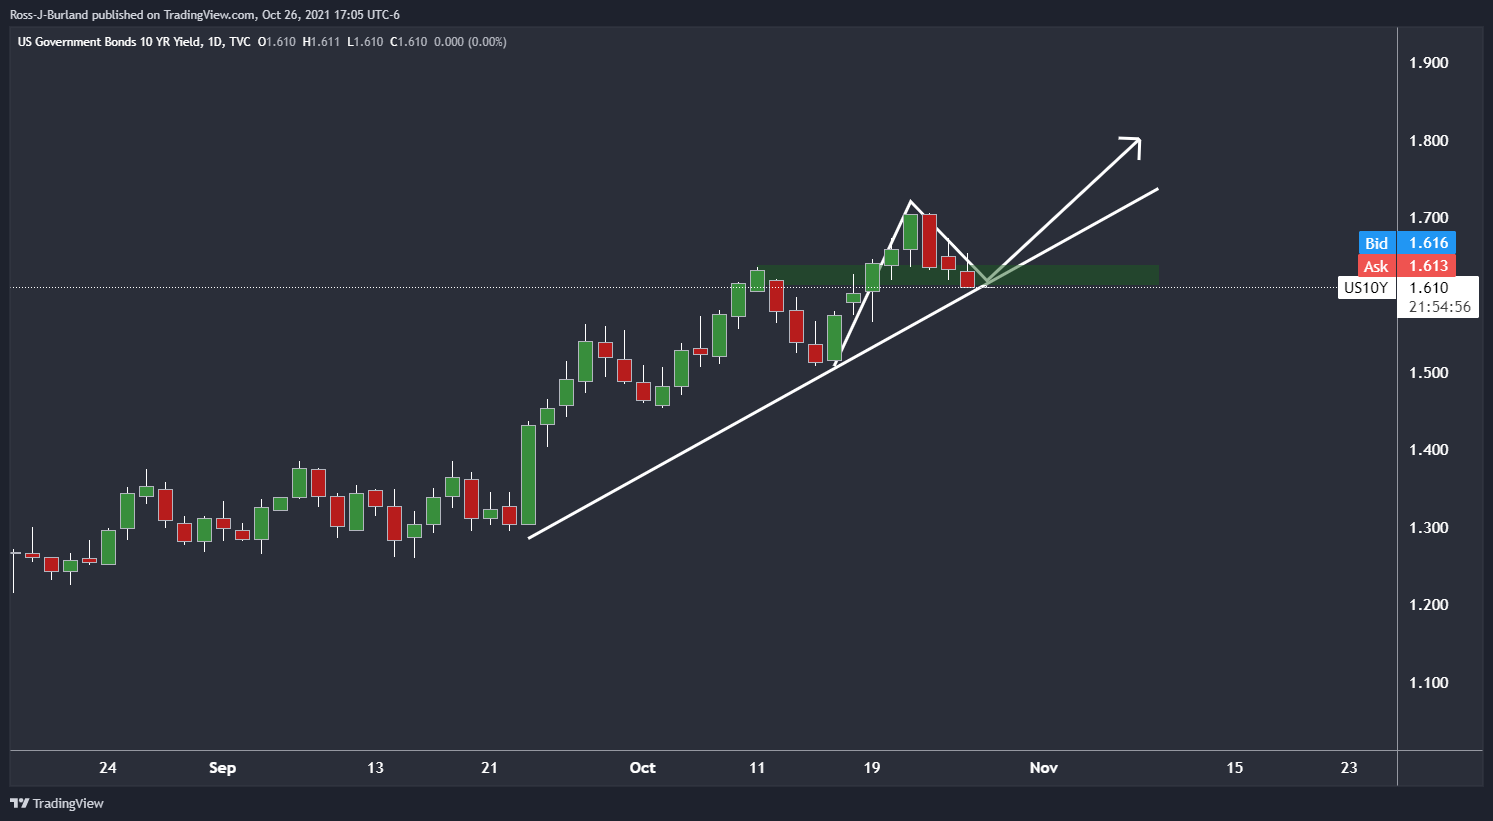
Meanwhile, the positive earnings season is hurting the safe-haven assets such as gold. Nevertheless, concerns that inflation is becoming more persistent should provide some support to gold prices.
Reasons to own the yellow metal, more compelling
'Ten-year breakeven yields continue to firm at their highest levels since 2012, as speculators brace for inflation. In this context, global markets remain intensely focused on pricing the Fed's exit, with the recent surge in market-based inflation expectations fueling bets for an earlier Fed hike.''
''Yet, we continue to argue that market pricing for Fed hikes remains far too hawkish as it fails to consider that a rise in inflation tied to a potential energy shock and lingering supply chain shortages would be unlikely to elicit a Fed response,'' the analysts argued.
''In fact,'' they said, ''the market is increasingly pricing in a policy mistake which is unlikely to take place, considering that central banks are likely to look past these disruptions as their reaction functions have been historically more correlated to growth than inflation.''
''In this sense,'' the analyst concluded, ''reasons to own the yellow metal are growing more compelling as Fed pricing is likely to unwind. While this narrative has yet peaked, we expect a deceleration in US economic activity, as a result of a growing fiscal drag, to catalyze a repricing.''
Gold technical analysis
From a daily perspective, the price has been trying to move higher, as Friday's price action shows, and the wick's high of the daily candle was a likely target for the sessions ahead, as illustrated in the following pre-market open analysis: Chart of the Week: Gold bears lurk at weekly trend line resistance
''$1,835 guards territory to $1,880 as follows:
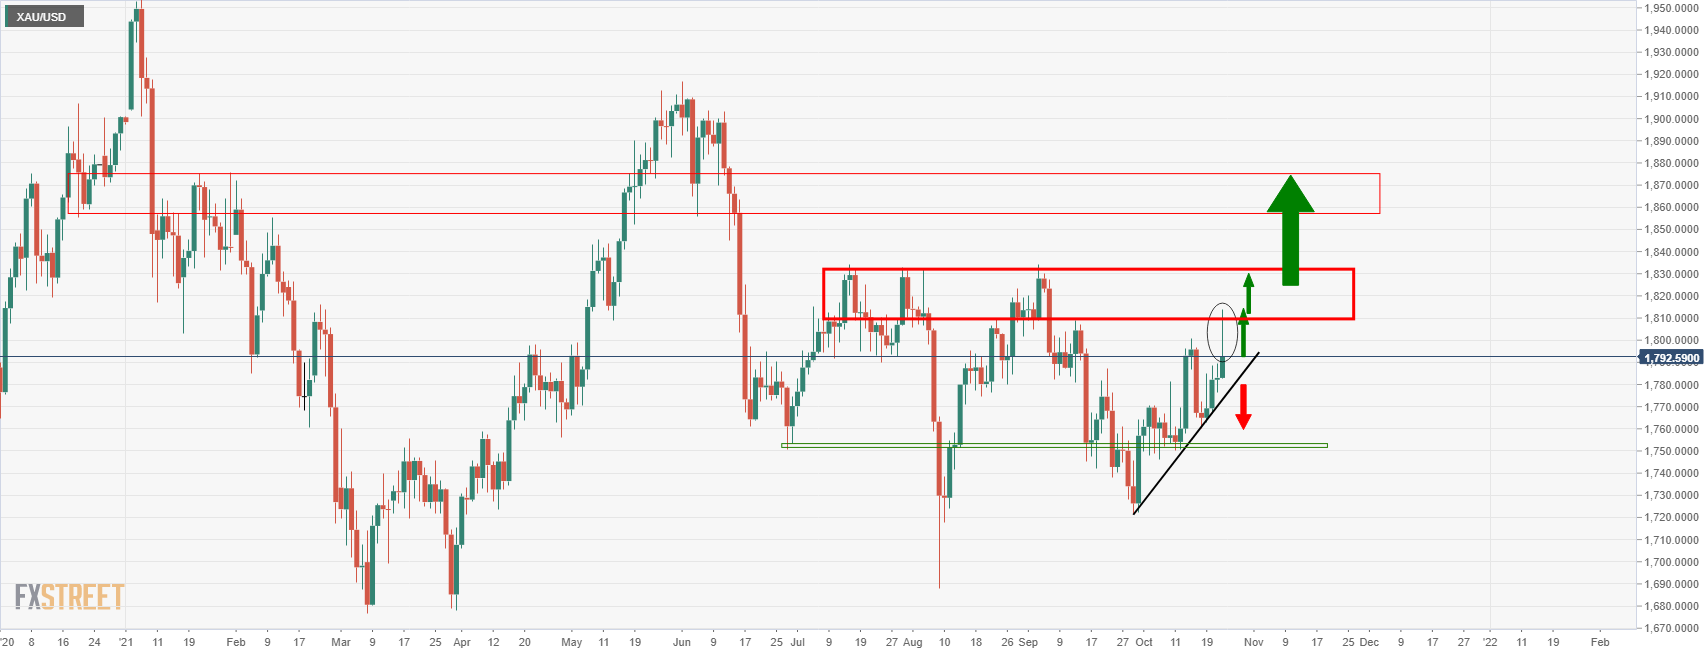 ''
''Gold bulls were making progress
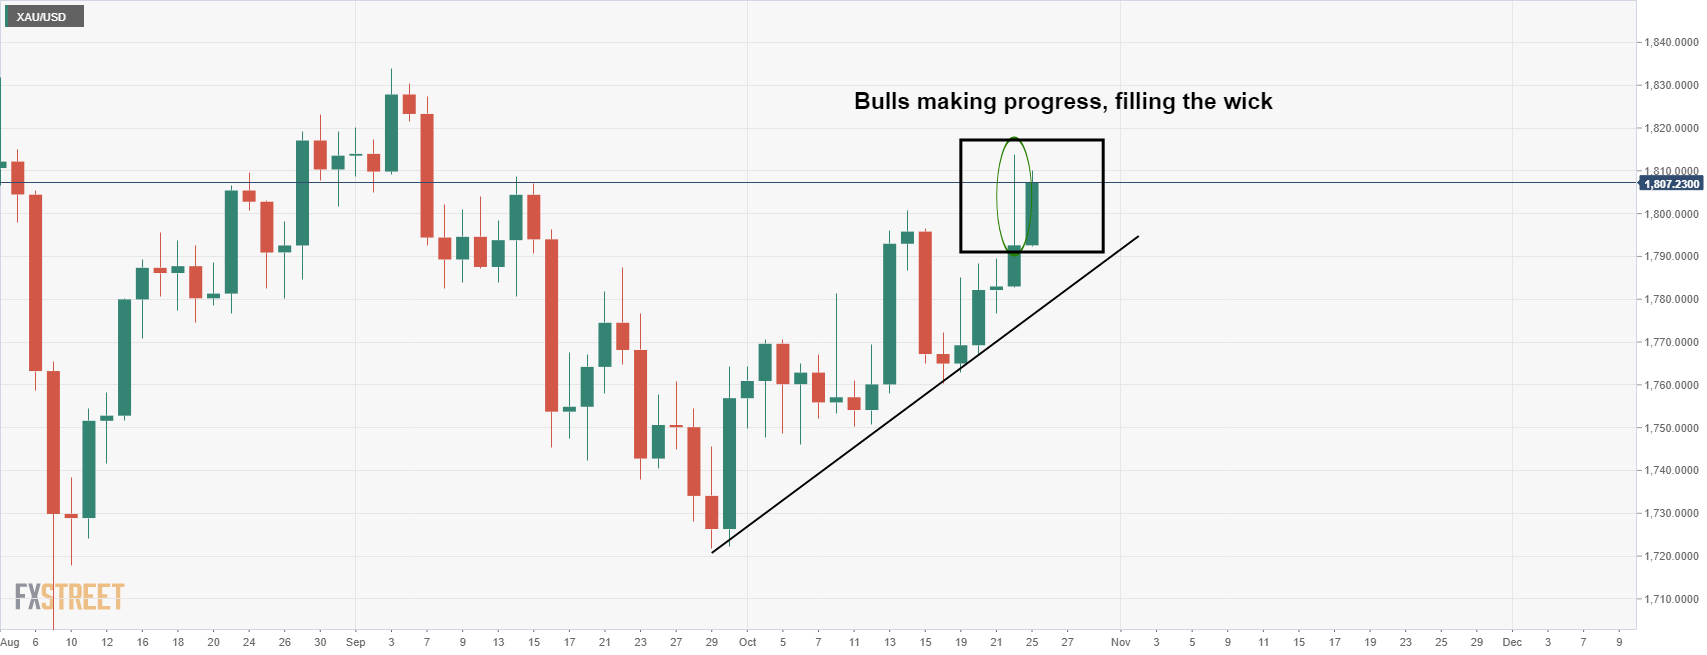
The price action on Tuesday, however, has moved in for a significant test of the dynamic support as follows:
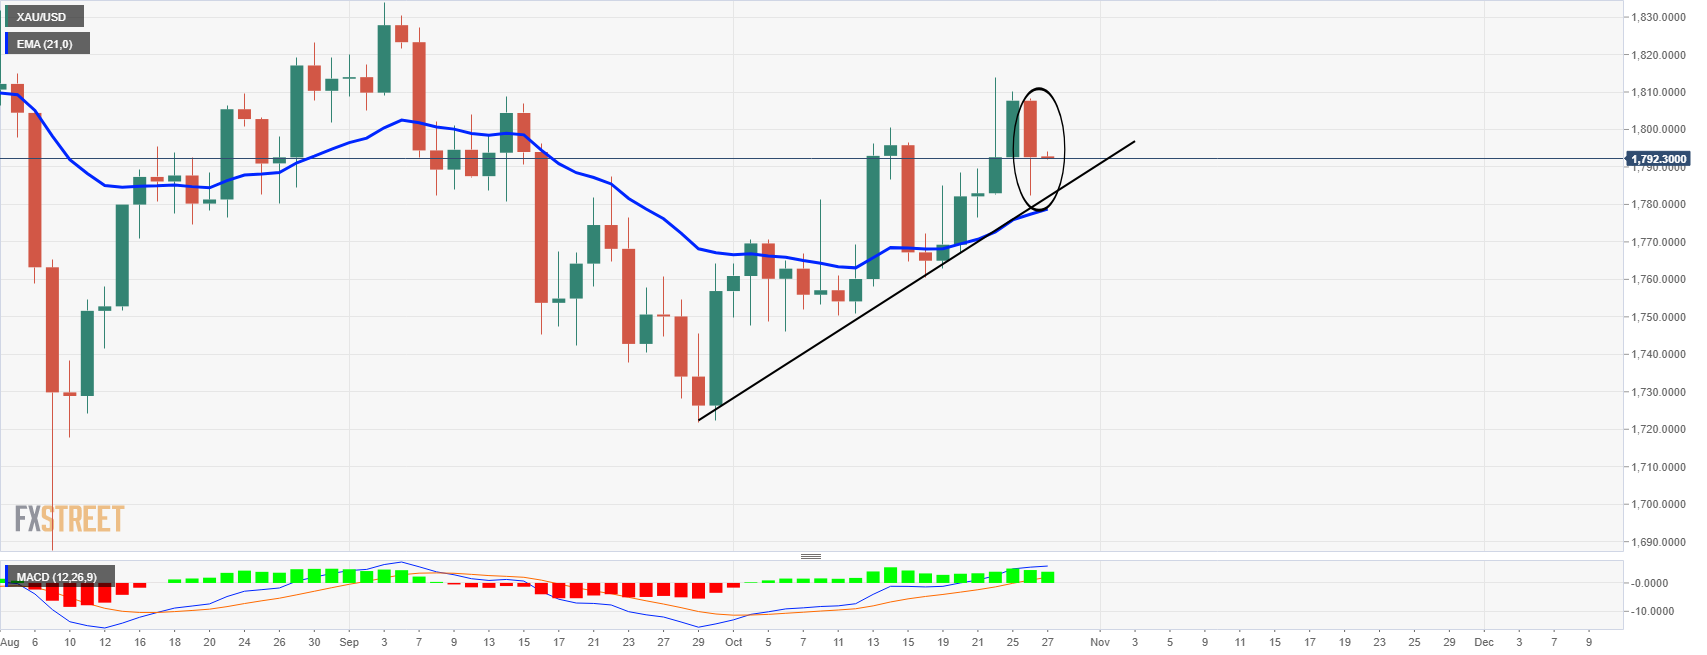
The price has left a tweezer top which indicates that the price could move in for another test of the dynamic support and the 21-day moving average in the forthcoming sessions. So long as this structure holds, the bias remains with the upside as MACD remains bullish.
-
00:15
USD/CHF Price Analysis: Bulls meet critical resistance near 0.9200
- USD/CHF edges lower on Wednesday in the early Asian session.
- The pair trades below the 21-day and 50-day SMA’s confluence.
- Upside momentum faces pressure in the 0.9220 and 0.9220 zone.
USD/CHF remains muted in the middle of the week. After testing the high of 0.9226 in the US session, the pair retreated and closed below 0.9200. At the time of writing, USD/CHF is trading at 0.9200, down 0.07% for the day.
USD/CHF daily chart
-637708867972907897.png)
On the daily chart, after testing 5-month highs at 0.9368 on September, 30, the pair has been under downward pressure. The bearish sloping line from the mentioned level acts as a barrier for the USD/CHF bulls. Further, the spot trades below the 21-day and 50-day Simple Moving Average (SMA) confluences.
If the price breaks below the intraday low then it would test the 0.9155 horizontal support level. A daily close below the crucial 0.9150 mark could drag the spot toward the September, 3 low at 0.9115. Next, the bears will keep their eyes on the low of August 30 at 0.9101.
Alternatively, the Moving Average Convergence Divergence (MACD) trades below the midline. Any uptick in the MACD could reverse the prevailing trend with the first upside target at 0.9240 horizontal resistance level. A break above the descending trendline would see a high of October, 13 at 0.9310, followed by the 0.9350 horizontal resistance level.
USD/CHF additional levels
-
00:10
WTI extends pullback below $84.00 on higher API inventories, EIA data eyed
- WTI flirts with intraday low, seesaws around seven-year high.
- Weekly API inventory data came in higher-than-expected, firmer USD also probe oil buyers.
- EIA data, US Durable Goods Orders will direct short-term moves ahead of US GDP.
WTI crude oil remains pressured around $83.80, down 0.30% on a day during Wednesday’s Asian session. The black gold cheered risk-on mood the previous day before the API stockpile figure joined firmer USD to trigger a pullback.
Weekly Crude Oil Stock data from the American Petroleum Institute (API) rose past 1.65M expected to 2.318M previous readouts for the period ended on October 22. The private inventory numbers were still lower than the previous build of the 3.294M.
In addition to the inventory build, cautious mood ahead of the key US data/events, as well as an absence of major news in Asia, also weigh on the WTI prices. It should be noted, however, that the recently better economics from the US and stronger inflation expectations keep a lid on the energy benchmark.
On Tuesday, the US CB Consumer Confidence unexpectedly recovered in October while figures concerning New Home Sales for September and Richmond Fed Manufacturing Index for the last month also flashed better-than-forecast numbers. Further, the US inflation expectations, as measured by the 10-year breakeven inflation rate per the St. Louis Federal Reserve (FRED) data jumped to the highest levels last seen during May 2006 by the end of Tuesday’s North American session.
Contrasting to the US data and reflation fears, the Wall Street benchmarks tease record tops and the US 10-year Treasury yields stay depressed ahead of the key US advance Q3 GDP.
In addition to the US GDP data, today’s Durable Goods Orders for September, expected -1.1% versus +1.8% prior, as well as the weekly official inventory figures from the Energy Information Administration (EIA), expected 1.65M versus -0.431M prior, will also entertain the oil traders. Furthermore, chatters surrounding geopolitical tension between the US and Iran join the fears of supply outage and increasing energy demand as global economies bounce back from the pandemic-led activity restrictions should be watched carefully for fresh impulse.
Technical analysis
Unless declining back below a five-week-old support line, around $82.70 by the press time, WTI buyers remain hopeful.
-
00:02
United Kingdom BRC Shop Price Index (YoY) increased to -0.4% in September from previous -0.5%
-