Notícias do Mercado
-
23:41
GBP/USD Price Analysis: Stays range-bound near 1.3750, closer to monthly support
- GBP/USD keeps pullback from weekly top, grinds lower of late.
- Downside break of 50-SMA, sluggish Momentum keep sellers hopeful.
- 200-DMA adds to the upside filters, 200-SMA restricts short-term downside.
GBP/USD remains on the back foot around 1.3765, keeping the weekly trading range during Wednesday’s Asian session. In doing so, the cable pair inches closer to an ascending support line from September 29.
Given the sluggish Momentum and the quote’s latest break below the 50-SMA, the sellers are sneaking in for entries. However, the weekly trading range and the stated support line, respectively around 1.3750 and 1.3740, restrict the short-term declines.
Should GBP/USD bears manage to conquer the aforementioned supports, 200-SMA near 1.3685 will challenge the further downside.
Alternatively, an upside break of 50-SMA, around 1.3770 by the press time, will redirect the GBP/USD buyers toward the recent range resistance, near 1.3835.
Though, the 200-DMA level surrounding 1.3855 on the daily chart becomes a tough nut to crack for the bulls afterward, a break of which will challenge the previous month’s top near 1.3915.
GBP/USD: Four-hour chart
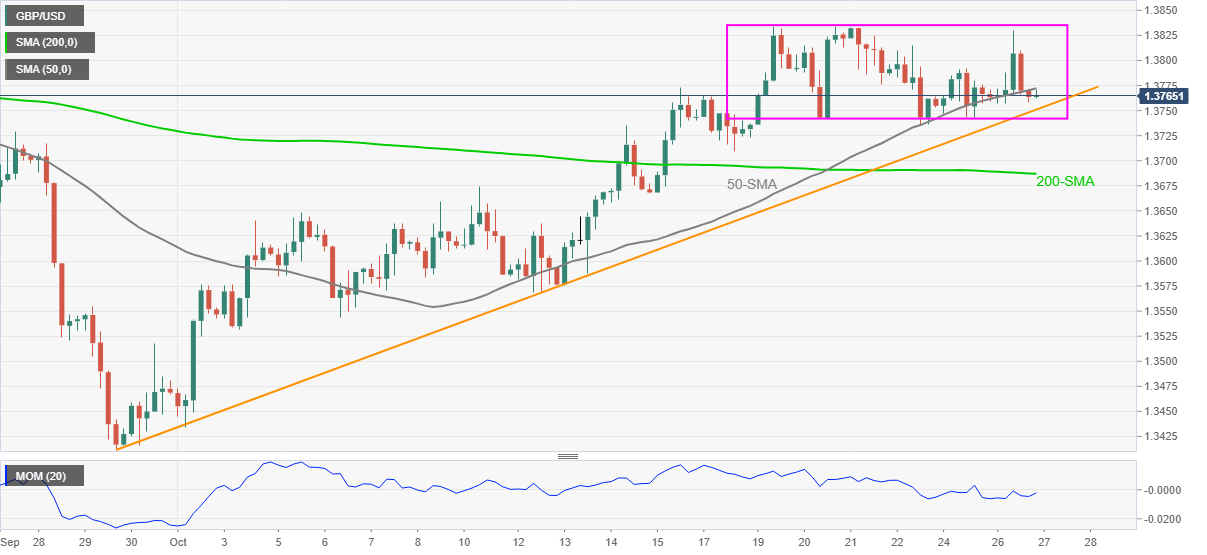
Trend: Further downside expected
-
23:34
USD/JPY consolidates above 114.00 amid lower US Treasury yields
- USD/JPY consolidates in the middle of the week in the initial Asian session.
- Lower US Treasury yields undermine the demand for the US dollar.
- Major issues remain unresolved as Democrats seek a deal on spending.
USD/JPY continue to move higher following the previous two session’s upside movement. The pair stayed in a narrow trading range. At the time of writing USD/JPY is trading at 114.15, up 0.02% so far.
The US benchmark 10-year T bond yields trades lower at 1.61% which undemins the demand for the greenback. Investors digested the November Fed’s tapering with a less hawkish view on interest rate hikes.
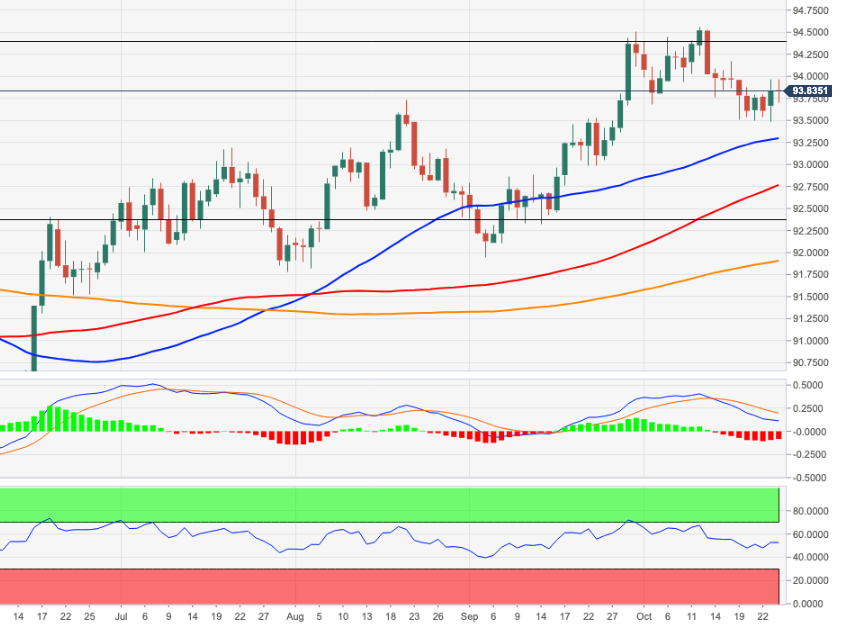
The greenback remains steady near 93.70 as the market awaits updates from upcoming central bank meetings.
On the other hand, the Japanese yen lost the ground, follwoing the Bank of Japan (BoJ) policy preview. The BoJ is expected to maintain its massive stimulus program and cut this year’s inflation forecasts at its meeting on Thursday.
It is worth noting that, S&P 500 Futures are trading at 4,566,up 0.03% so far.
As for now traders are waiting for the US Durable Goods Orders, and Goods Trade Balance to gauge the market sentiment.
USD/JPY additional levels
-
23:23
Goldman Sachs CEO: There is a risk of higher inflation and slower growth globally
“There will be consequences for having accommodative monetary policy for a long time,” said Goldman Sachs (GS) Chief Executive David Solomon at the Future Investment Initiative conference in Saudi Arabia's capital, Riyadh, per Reuters.
“There is a risk of higher inflation and slower growth globally,” adds the GS leader said Reuters.
FX implications
Given the multi-year high inflation expectations in the US and Eurozone, the monetary policy consolidation is back on the table, which in turn challenges the latest run-up in the equities.
Read: Uneven economic recovery vs inflation
-
23:08
New Zealand Exports rose from previous $4.351B to $4.4B in September
-
23:08
New Zealand Imports increased to $6.57B in September from previous $6.495B
-
23:08
New Zealand Trade Balance NZD (YoY) declined to $-4090B in September from previous $-2.944B
-
23:04
AUD/JPY Price Analysis: Retreats from Tuesday’s daily highs around 86.00, steady at 85.60
- AUD/JPY extends its two-day rally but faces strong resistance at 86.00.
- AUD/JPY price action is driven by market sentiment and Australian macroeconomic figures.
- AUD/JPY: The daily and hourly charts are tilted to the upside, but both time-frames RSI’s figures are closing to overbought levels.
The AUD/JPY slides as the New York session ends, barely down 0.01%, trading at 85.61 at the time of writing. On Tuesday, the Australian dollar extended its rally against the Japanese yen, for the second consecutive day, up in the week 1.53%.
Risk-on market sentiment keeps investors propelling the US stock market, as portrayed by the S&P 500 reaching an all-time high during the New York session, contrarily US T-bond yields fell across the board, with the 10-benchmark note falling two and a half basis points, sits at 1.61%.
That said, the AUD/JPY pair will lie for the remainder of the week on market sentiment, and in macroeconomic figures, like Australia CPI figures.
AUD/JPY Price Forecast: Technical outlook
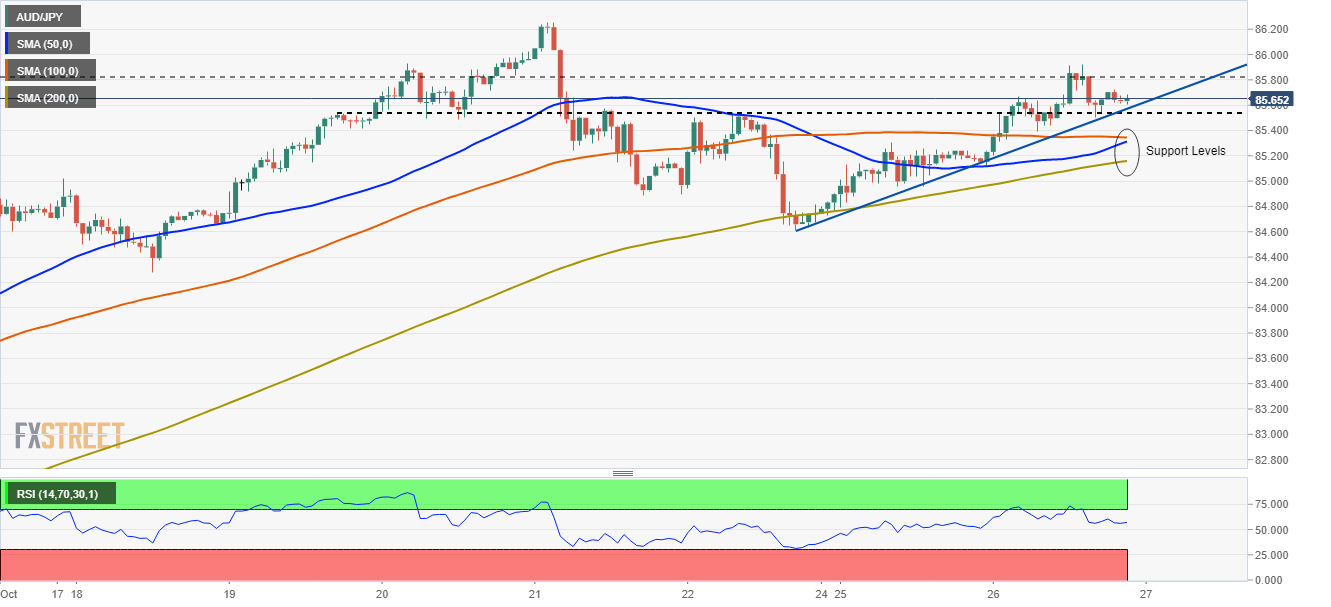
Daily chart
The daily chart portrays the cross-currency has an upward bias, depicted by the daily moving averages (DMA’s) remaining below the spot price with an up slope confirming the actual trend.
The pair is testing the 61.8% Fibonacci retracement at press time, which coincided with the May 10 high around the 85.60-75 area. An upside break of the latter would expose the October 26 high at 85.92, immediately followed by the October 21 at 86.25.
On the flip side, failure at the 61.8% Fibonacci retracement could lead to an AUD/JPY slide towards 84.60, as the RSI exits overbought levels.
The Relative Strenght Index (RSI) at 72 flattish in overbought levels indicates the AUD/JPY might consolidate before determining which direction to take. However, the potential of an upside bias is supported by the DMA’s.

1-hour chart
The hourly chart shows that the AUD/JPY pair is in consolidation, just retreated from daily highs threatening to form a head-and-shoulders pattern. The hourly simple moving averages (HSMA) lie below the spot price, with the 50-HMA trapped within the 100 and the 200-HMA’s, confirming a sideways trend. A break below an upslope trendline around the 85.40 area confirms the pair’s head-and-shoulders pattern and exerts additional downward pressure on the AUD/JPY.
The first supply zone on the downside would be the 100-HSMA at 85.34, immediately followed by the 50-HSMA at 85.31, and then the 200-HSMA at 85.16.
The Relative Strength Index (RSI) is at 57 is edging slightly low, but as it remains above the 50-midline, it will refrain sellers from opening fresh downward bets on the AUD/JPY pair.
-
23:03
NZD/USD drops back to 0.7150 on New Zealand’s record trade deficit
- NZD/USD consolidates weekly gains after Tuesday’s sluggish performance.
- New Zealand trade deficit refresh record top, Imports and Exports grow in September.
- Market sentiment dwindles as DXY stays firm despite softer Treasury yields, mildly bid equities near record top.
- Aussie Inflation numbers, ANZ monthly sentiment data eyed ahead of US Durable Goods Orders.
NZD/USD remains pressured around 0.7155 after the dismal New Zealand trade deficit release, having reversed the upside momentum towards 0.7200 the previous day.
New Zealand (NZ) Trade Balance shrank more than $-2139M (revised) prior to $-2171M in September to mark the all-time low MoM figures. However, the Imports and Exports were better than their previous readouts as the former rose past $6.495 billion to $6.57 billion whereas the latter grew to $4.4 billion versus $4.351 billion.
In addition to the downbeat NZ data, mixed sentiment in the market and the US dollar strength also weigh on the NZD/USD prices.
Although hopes of the US stimulus and Sino-American talks join the receding coronavirus fears to keep the market’s mood positive, strong US data and caution ahead of the US advance estimation for Q3 GDP and Fed tapering woes challenge the optimists.
It should be noted that the firmer earnings and recently positive US data helped Wall Street benchmarks to cling to record tops, backed by softer US 10-year Treasury yields around 1.61%. However, the US Dollar Index (DXY) refreshed its weekly top during the second consecutive daily upside, recovering from the monthly low, while poking the 94.00 threshold by the end of Tuesday’s North American session.
Talking about data, US CB Consumer Confidence unexpectedly recovered in October while figures concerning New Home Sales for September and Richmond Fed Manufacturing Index for the last month also flashed better-than-forecast numbers.
Having witnessed the initial reaction to NZ trade numbers, NZD/USD traders will pay attention to the Australia and New Zealand Banking Group’s (ANZ) monthly sentiment data for October before the Q3 inflation figures for Australia. Following that, US Durable Goods Orders for September may entertain markets before the key US GDP figures, up for publishing tomorrow.
Regarding Aussie inflation and its impact on NZD/USD, ANZ said, “While not directly relevant to the NZD, any surprises will impact the AUD, and by correlated association, the NZD. Chief among the market’s fears: a big upside surprise like that seen here last week. If that were to happen, the AUD would likely spike sharply higher, taking NZD with it.”
Technical analysis
NZD/USD pair’s latest pullback is yet to negate the previous rebound from the 5-day EMA, which in turn directs the bulls toward a four-month-old resistance line near 0.7220 but nearly overbought RSI conditions may challenge further upside. On the contrary, a downside break of the immediate EMA support, around 0.7150 by the press time, should trigger a short-term pullback targeting late September highs near 0.7090. Though, the latest swing low of 0.7130 may act as an extra filter to the south.
-
22:45
New Zealand Trade Balance NZD (MoM) down to $-2171M in September from previous $-2144M
-
22:45
New Zealand: Trade Balance, mln, September -2171
-
22:30
USD/CAD Price Analysis: Grinds higher around 1.2400, BOC Interest Rate Decision eyed
- USD/CAD remains sidelined around weekly top as bulls brace for BOC.
- MACD, RSI joins sustained break of 10-DMA, 61.8% Fibonacci retracement to keep buyers hopeful.
- July’s low acts as immediate hurdle ahead of five-week-old resistance line.
- Bank of Canada Rate Decision Preview: Inflation prospects headline policy review
USD/CAD stays on the way to the second consecutive weekly run-up following its successful break of 10-DMA and 61.8% Fibonacci retracement (Fibo.) of June-August upside. That said, the quote edges higher around 1.2390 by the press time of early Wednesday morning in Asia.
With the MACD line teasing bulls and the RSI also gradually recovering, the pair buyers can extend the latest rebound towards July’s low surrounding 1.2425.
However, any further upside will be questioned by a descending resistance line from September 20, near 1.2460, 50% Fibo. level of 1.2478 and 200-SMA close to 1.2500.
Alternatively, a convergence of the 10-DMA and 61.8% Fibo. around 1.2368 offers immediate support to the Loonie pair ahead of the monthly bottom near 1.2290, also the lowest since late June.
In a case where the Bank of Canada (BOC) propels the CAD, dragging the quote back below 1.2290, June 23 low close to 1.2250 and the mid-May’s top near 1.2200 will be in focus ahead of the yearly bottom of 1.2007.
USD/CAD: Daily chart
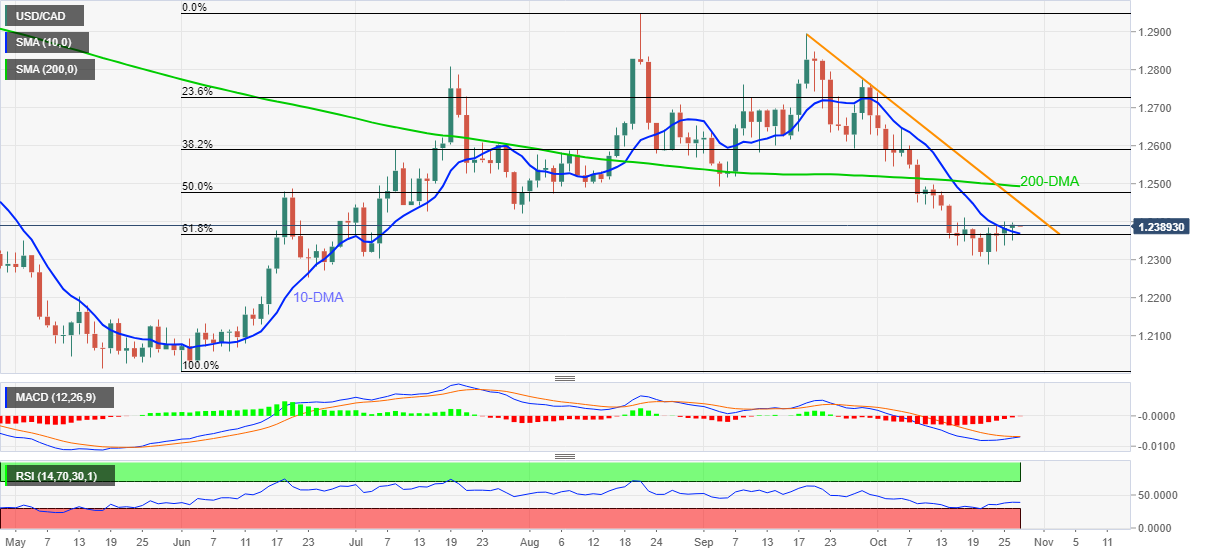
Trend: Further recovery expected
-
22:24
United States API Weekly Crude Oil Stock registered at 2.318M above expectations (1.65M) in October 22
-
22:24
AUD/USD bulls engage and target a higher high on CPI day
- AUD/USD is building a bullish case ahead of CPI.
- Aussie CPI could be make or break time for the near term for AUD.
AUD/USD has been trading in firmer hands towards the North American close and has travelled from a low of 0.7484 to a high of 0.7525 on the day. The market's attention will now turn to the Asian sessions key data in the Australian third quarter Consumer Price Index. It will then it’s in the hands of the RBA next week.
Commodity prices were higher again on Tuesday with the CRB Index by 0.25% which has helped the Aussie keep its head above water. AUD/USD traded above $0.75 against the greenback for the first time since July. This happened despite the US dollar edging up on Tuesday. Traders are awaiting news from upcoming central bank meetings that might attract some forex volatility.
Meanwhile, a report showed that US consumers were more confident about the economy than expected. This gives rise to a higher US dollar when considering the effect consumer confidence at the highest of the covid 4th wave had on the greenback. For now, the US dollar is between its one-year high that was reached earlier this month and the one-month low touched early on Monday.
AUD's domestic risks
Domestically, the risks for AUD stay with the Evergrande story in China which appears to have taken a less concerning path, and this has clearly benefited the highly exposed AUD. However, it is unlikely that there can be any more - significant upside room for AUD on the back of improving sentiment in China. Instead, the Aussie currency with face today's 3Q CPI data out of Australia.
Traders are bracing for deceleration from the 3.8% 2Q figure as Covid restrictions generated some deflationary pressures in late summer. Consensus is reported at 3.1% for the headline rate, but given the massive surprise in New Zealand’s very strong (4.9%) read for the same quarter, there could be some follow-through here for Australia. If there is a disappointment, however, this will underpin the RBA’s dovish stance and likely weigh heavily on the Aussie, sending AUD/NZD back into its consolidation depths and AUD/USD back into a correction of the current bullish impulse on the daily chart.
AUD/USD technical analysis
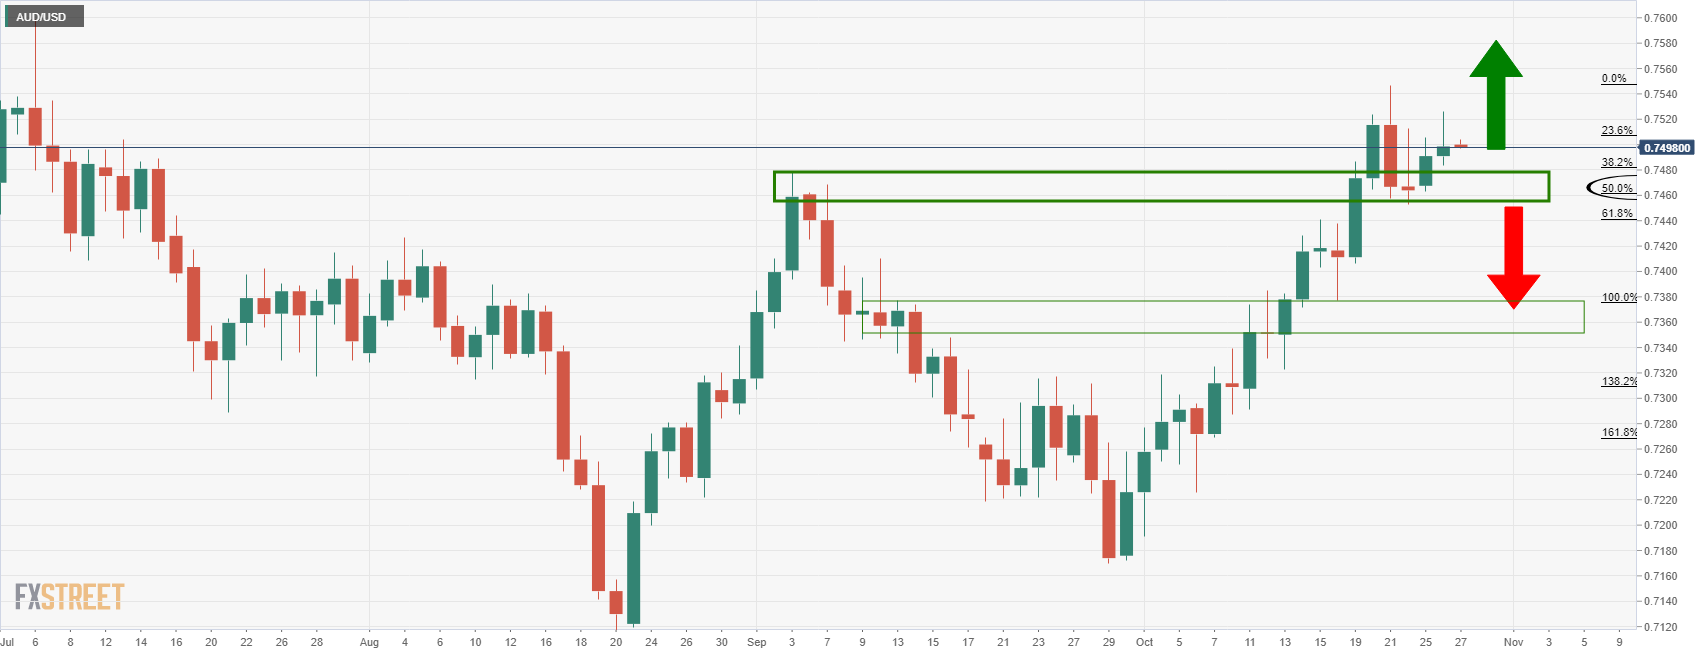
As seen in the chart above, the 50% mean reversion has acted as support and the price is building a bullish case from here. However, a break of support will open risk back towards 0.7350 again.
-
22:00
South Korea Consumer Sentiment Index climbed from previous 103.8 to 106.8 in October
-
21:13
Google Earnings: GOOG beats Q3 estimates on top and bottom line
Alphabet (GOOG) scored solidly on its third quarter results released after the market close on Tuesday, October 26. The search leader reported earnings per share of $27.99 per share, well above estimates, on revenues of $65.1 billion. Analyst consensus expected EPS of $23.48 per share on revenue of $63.3 billion.
Google Cloud revenue came in just below $5 billion compared to estimates of $3.4 billion. YouTube revenue also came in above expectations at $7.2 billion vs. $5 billion. The stock rose 0.6% on the beat and is up 58.4% YTD.
-
21:08
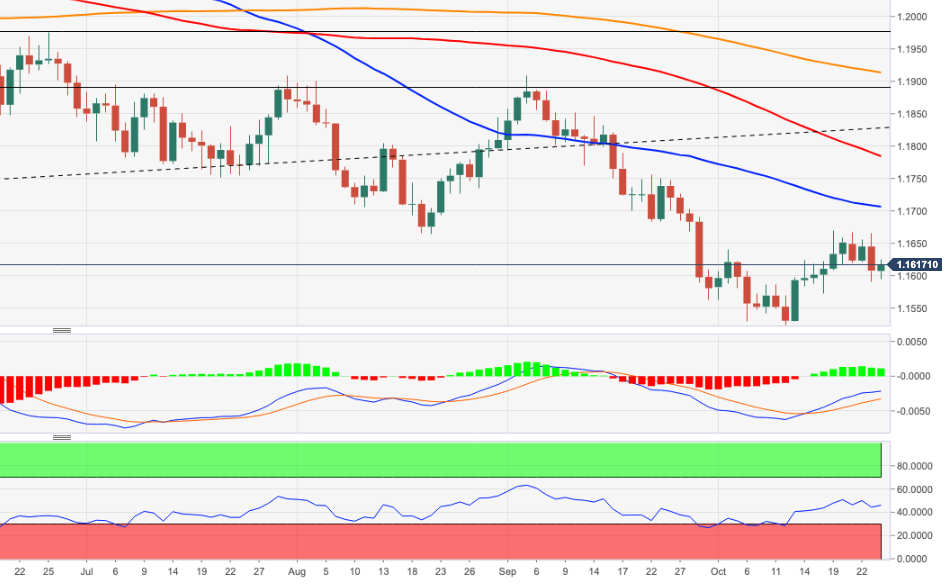
EUR/USD Price Analysis: A mixed technical picture leaning with slight bearish bias
- EUR/USD is leaning slightly bearish when taking into account a multi-time-frame analysis.
- EUR/USD 4-hour bearish structure includes the 21-EMA, resistance and tweezer tops.
- EUR/USD daily chart leans bullish above the dynamic support line.
EUR/USD is a mixed picture across the weekly, daily and 4-hour time frames. The following is a top-down analysis that arrives at both a bear and bullish conclusion depending on the time frames. Overall, the bias leans to the downside, however.
EUR/USD weekly chart
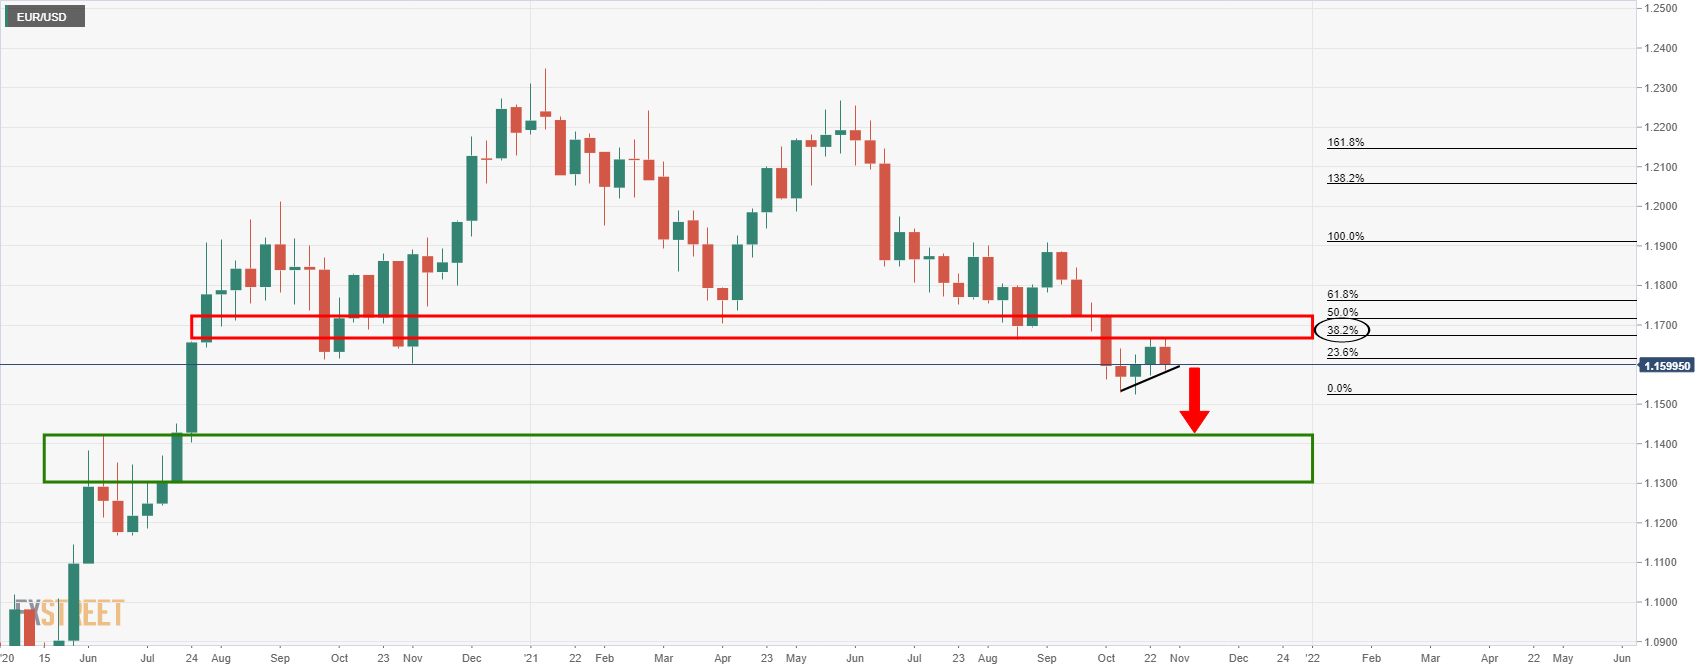
From a weekly perspective, the price is being pressured at resistance and by the 38.2% Fibonacci retracement level of the prior bearish impulse. This could equate to a downside continuation in the coming weeks and towards prior highs expected to act as a support zone near 1.1420.
EUR/USD daily chart
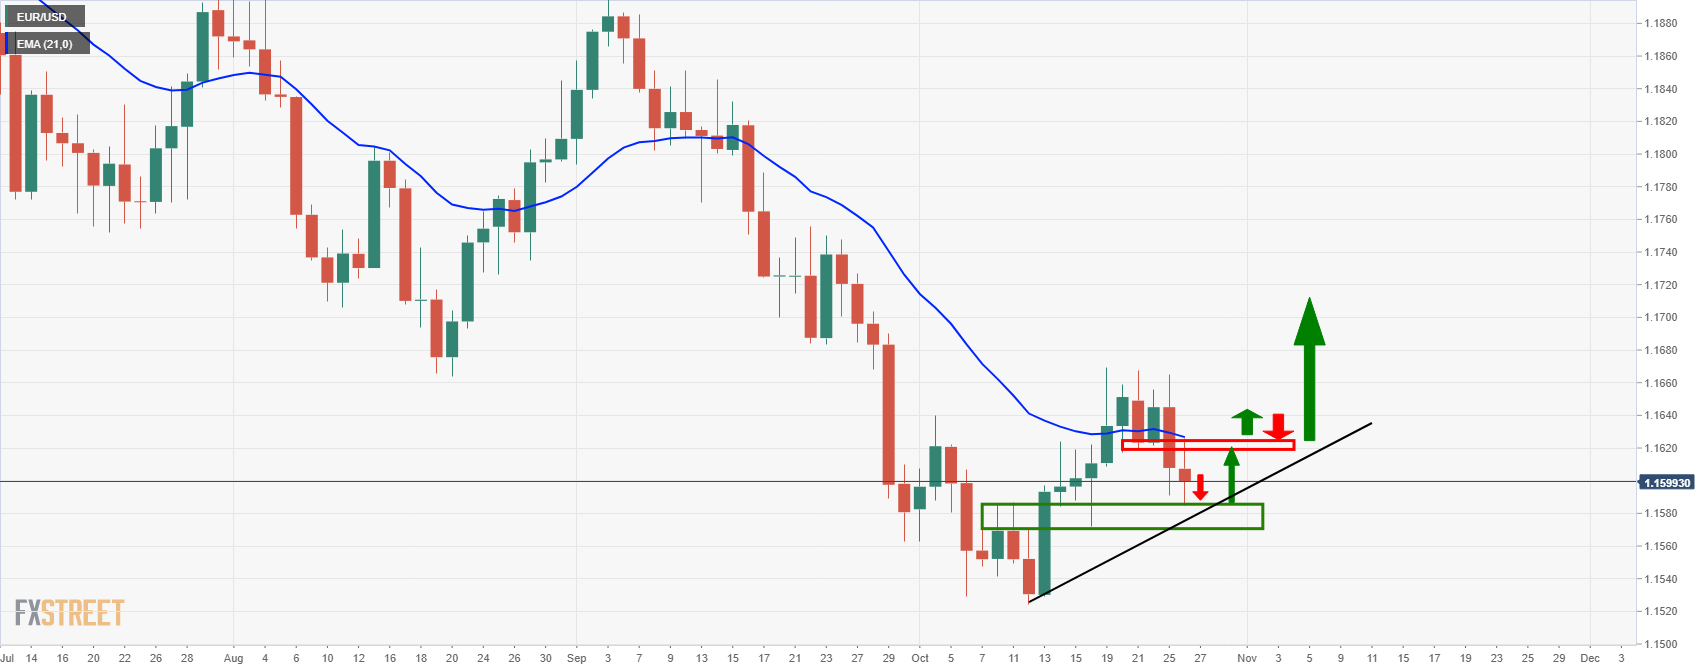
The daily chart, however, is on the verge of a test of support that could result in a move back to the upside to test the M-formation's neckline where it meets the 21-day EMA that would be expected to resist on first attempts. A break of the horizontal support, however, will pressure the dynamic and potentially lead to a downside continuation.
EUR/USD 4-hour chart
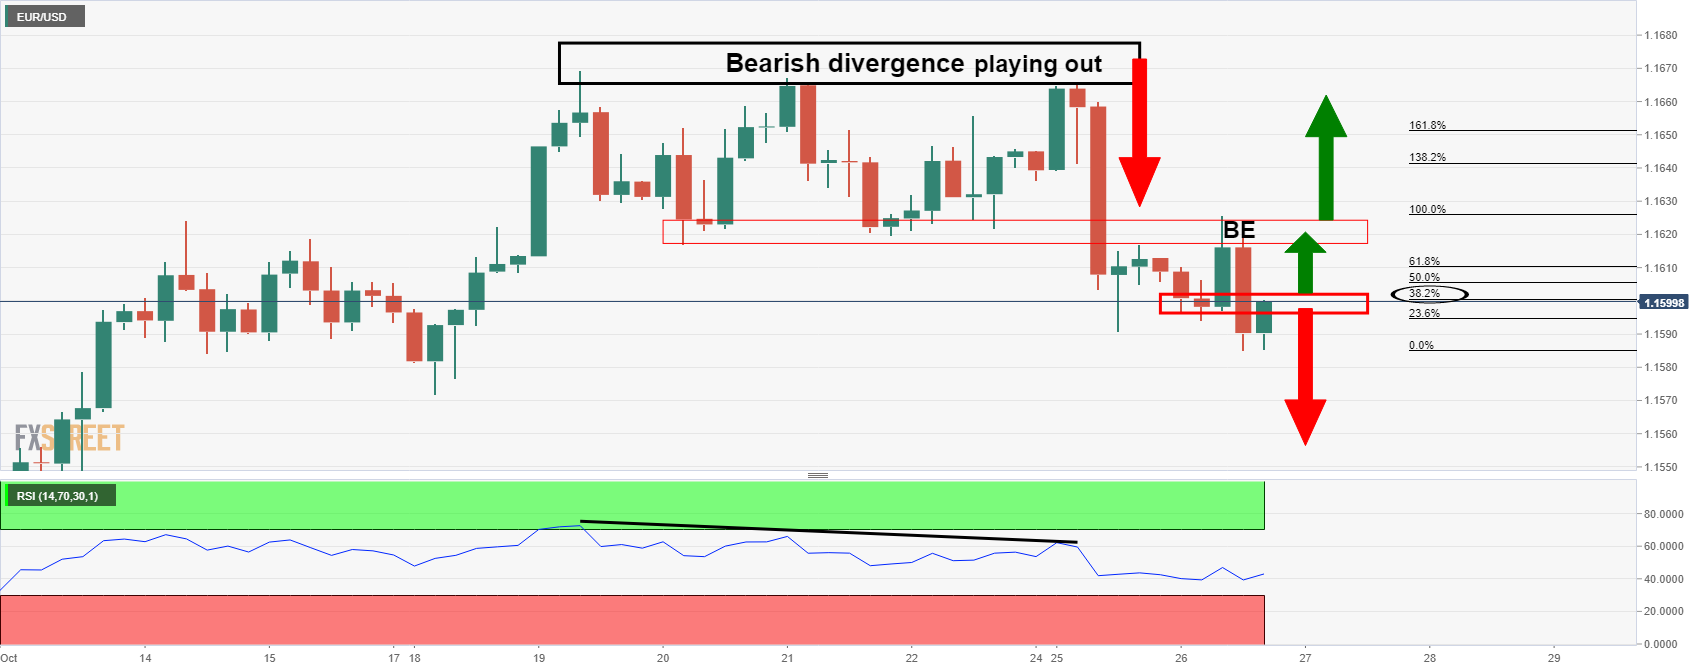
As illustrated above, the bearish divergence with the RSI has already played out. However, the confluence of the bearish engulfing candle is worth noting with the price below the bearish structure as per the 21-EMA, resistance and tweezer tops.
-
20:45
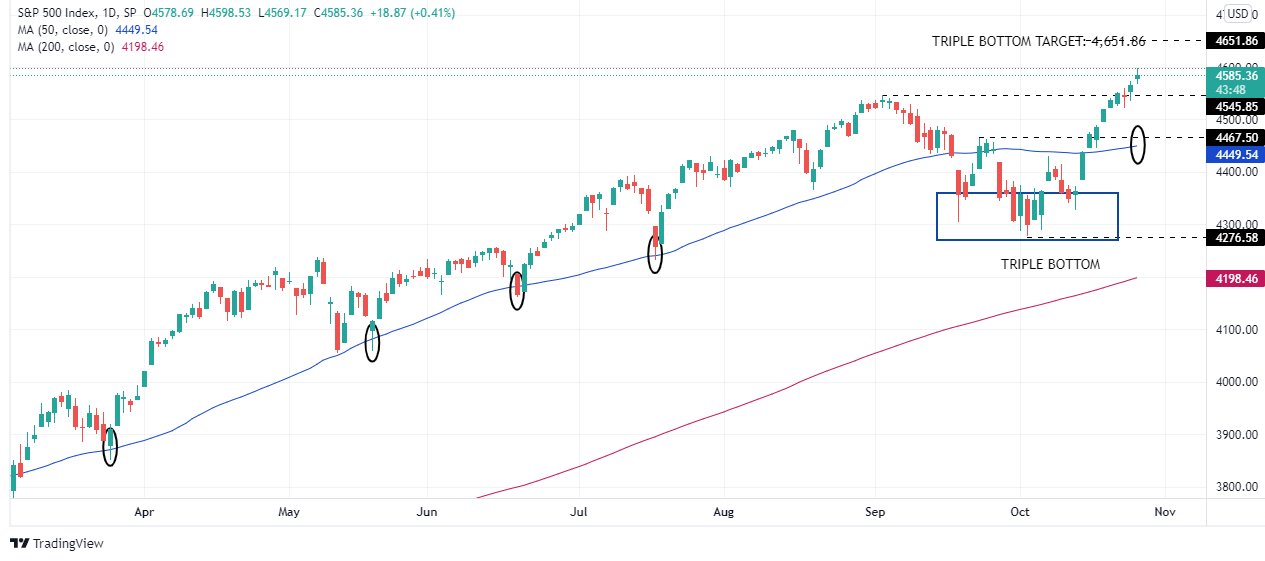
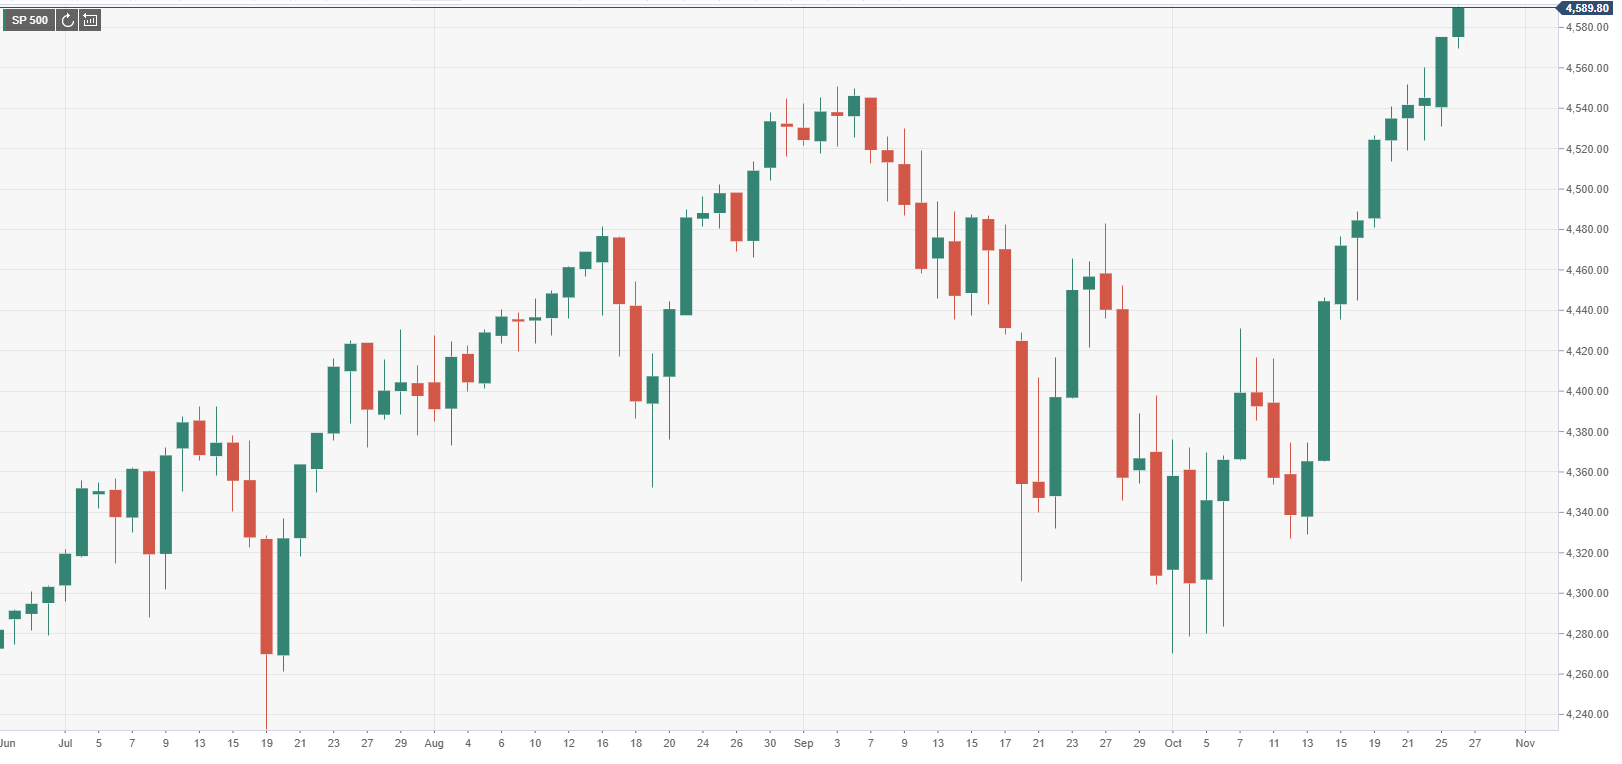
S&P 500 Price Forecast: Triple bottom around 4,300, puts 4,650 as the next target for bulls
- S&P 500: A weekly close above the mid-point of an ascending channel opens the doors for a further upside move.
- S&P 500: A triple bottom in the daily chart puts 4,651.86 as the next upside target for bulls.
The S6P advances during the New York session, is up 0.35%, sitting at 4580.93 at the time of writing. The market sentiment is upbeat, portrayed by major US stock indices, rising between 0.26% and 0.35%.
Factors like solid US corporate third-quarter earnings have kept investors positive, despite elevated prices and central bank pandemic-stimulus reduction, which in part tries to curb inflationary pressures around the globe.
S&P 500 Price Forecast: Technical outlook
Weekly chart
The S&P 500 has rallied almost 112%, from March 23, 2020, until October 26, 2021. At press time, it is trading briefly above the mid-point line of an ascending channel, leaving the door open for an upward move towards the top of the ascending channel, which lies around the 4,800-4,900 area. A weekly close above the mid-line would open the door towards the abovementioned, but it would find resistance areas at the round levels, such as 4,600, followed by 4,700.
The Relative Strength Index (RSI), a momentum indicator that approaches 68, aims higher, indicating that the index still has the potential of printing another leg-up before reaching overbought levels.

Daily chart
The S&P 500 is in an overextended upward trend which has found strong support around the 50-day moving average (DMA), which has successfully supported the index eight times before resuming the upward direction. Nevertheless, on September 20, it finally breached below the 50-DMA, finding consolidation around the 4,300-4,500 area, which printed a triple bottom.
The measure of the bottom of the triple bottom to the “neckline” (if it could be called like this) is 186.46 points, which added to the September 23 high at 4,465.40, puts the 4,651.86 figure as the next upside target for the S&P 500.
In the outcome of a downward correction, the first support would be the September 2 high at 4,545.85, followed by the September 23 high at 4,465.40.
The Relative Strenght Index (RSI) is at 69. Edces slightly up, indicates that the S&P 500 might consolidate, before printing another leg-up.
-
20:43
Forex Today: Tensions mount as central banks take center stage
What you need to know on Wednesday, October 27:
The American dollar ended the day mixed, particularly stronger against its European rivals. The EUR/USD pair is down to the lower end of its weekly range, trading in the 1.1590 price zone, while GBP/USD settled around 1.3760, getting additional pressure from European Commissioner for the Internal Market Thierry Breton, who said on Tuesday that Brexit has resulted in an "economic catastrophe" for the UK.
US CB Consumer Confidence unexpectedly bounced in October, printing at 113.8 from an upwardly revised 109.8. According to the official report, “the proportion of consumers planning to purchase homes, automobiles, and major appliances all increased in October—a sign that consumer spending will continue to support economic growth through the final months of 2021.”
Crude oil prices started the day on the back foot but managed to end the day with gains. WTI settled t $84.60 a barrel. On the other hand, gold edged lower and settled around $1,795 a troy ounce.
The DJIA and the S&P 500 reached all-time highs ahead of the opening, although US indexes retreated, to end the day mixed around their opening levels.
US Treasury yields remained subdued, with the benchmark on the 10-year note down to 1.61%.
Australia will publish Q3 inflation data on Wednesday, although expectations point to easing price pressures.
The Bank of Canada is having a monetary policy on Wednesday, with the Bank of Japan and the European Central Bank set to announce their decisions on Thursday. The BOC is expected to taper anticipating the Federal Reserve.
Top 3 Price Prediction Bitcoin, Ethereum, XRP: Small correction ahead of cryptos before next leg up
Like this article? Help us with some feedback by answering this survey:
Rate this content -
20:08
GBP/USD bulls have been sent onto the backfoot as greenback spikes
- GBP/USD spiked but fell back to the start again and sits steady into closing hours on wall Street.
- Brexit, covid and BoE risks are at the forefront of GBP/USD's trajectory.
- US dollar catches a bid as investors weigh the outlook of central banks.
At the time of writing, GBP/USD is flat on the day following a spike to the upside that was met with fierce resistance, sending it all the way back to the start again. GBP/USD is set at 1.3767 after travelling between a low of 1.3757 and a high of 1.3829. Meanwhile, the US dollar has rallied and tested the 94 figures as measured by the DXY index.
The domestic themes in play are positive headlines surrounding coronavirus cases lower in the UK and prospects of lighter restrictions, Brexit, central banks and the UK's budget risks. Across the pond, inflation and the Federal Reserve are propping up the US dollar as investors await the outcome of central bank meetings.
With regards to the Bank of England, money markets are pricing in a rate hike before the end of the year while expectations of further tightening grew as labour market data showed median full-time weekly pay in April was 4.3% above year-ago levels.
Brexit saga continues
On the Brexit front, Britain has threatened to take unilateral action if a solution cannot be found at the ongoing talks, which some reckon could emerge as a serious headwind for the pound. "Uncertainty around the UK's relationship with the EU may intensify in the coming days and possibly act as a check on BoE rate hike bets next week or at the December meeting, as well as set a short-term floor on euro-sterling," Scotiabank analysts said in a note mid-week.
UK budget coming up
However, there are also concerns around potential tax hikes that may be unveiled in Wednesday's budget announcement. Finance Minister Rishi Sunak's budget statement and his plans for higher corporate tax and national insurance contributions alongside more spending are already known in the market, but the fact is yet to be traded. The Chancellor has long been rumoured to be considering bringing capital gains tax rates more in line with income tax, possibly resulting in a switch to 20 per cent rates for people on the basic rate, 40 per cent for the higher bracket and 45 per cent for the additional rate bracket.
Covid Plan B could be avoided
Meanwhile, in recent trade, it has circulated that there could be good news on the coronavirus front. There has been a fall in England's infection rates which raises hopes of avoiding plan B. Expert advising on jabs had warned that the vaccination programme will not be enough to bring current infection rates under control.
However, the British prime minister Boris Johnson has to date resisted pleas from health leaders for tighter restrictions despite the rising number of Covid-19 cases. The PM has been of the mind that vaccines would get the country through the winter and out of the pandemic.
-
19:58
EUR/GBP ticks up from 20-month lows at 0.8400
- The euro edges up after hitting fresh lows at 0.8400.
- The pair remains weak, weighed by BoE tightening expectations.
- EUR/GBP: Attention to the 2019 low ar 0.8239 – Commerzbank.
The euro has trimmed losses during Tuesday’s afternoon US session, returning to the previous range, right above 0.8420, after having hit fresh multi-month lows at 0.8400. From a wider perspective, however, the pair remains on the defensive, after having depreciated about 2.5% in October.
Expectations of a hawkish BoE are underpinning Pound’s strength
The pound remains firmer against the European currency, supported by market expectations the Bank of England will have to accelerate its monetary normalization plan. With yearly inflation accelerating at levels nearly twice the Bank’s target for price stability, investors are starting to price an interest rate in the first half of next year and, probably, others to follow.
On the other hand, the euro remains weighed by the common view that the dovish stance will prevail at the next Thursday’s ECB monetary policy meeting. The Bank is widely expected to maintain its bond-purchasing plan unchanged and the benchmark interest rate near zero, in spite of the persistently high inflation, to avoid creating tensions in some peripheral markets.
EUR/GBP: Attention to the 2019 low at 0.8239 – Commerzbank
Karen Jones, Team Head FICC Technical Analysis Research at Commerzbank expects the pair to resume its downward trend soon, heading towards 0.8239: “EUR/GBP has tested and failed at key nearby resistance at 0.8471, which represents April 2021 low and May 2019. This is negative price action, and while we hold below the 55-DMA at 0.8532 we stay negative for now (…) Attention is on the 0.8239 2019 low and the 200-month ma lies at 0.8159.”
Technical levels to watch
-
19:39
GBP/JPY upward move capped around 157.70 despite a risk-on market sentiment
- GBP/JPY rises for the second day in a row amid risk-on market sentiment.
- Bank of England hiking rate expectations for the November 4 meeting, shed by 50%, but fully priced in for December meeting,
- GBP/JYP: From a technical perspective, there is room for another leg-up as RSI is still short of overbought levels.
The GBP/JPY cross-currency pair advances during the New York session, up 0.38%, trading at 157.15 at the time of writing.
Investors’ mood is upbeat, portrayed by rising US equity indices, rising between 0.19% and 0.36%. Factors like Q3 solid US corporate earnings calm market participants, despite elevated inflation and central bank tightening monetary policy. Furthermore, the risk-on environment undermined the safe-haven Japanese yen status, as it remains the laggard of the session, losing 0.39% during the day against most G8 currencies.
Cable has remained well supported by Bank of England hawkish members, like Governor Andrew Bailey and Chief Economist Huw Pill. They expressed concerns about high inflation, supporting the thesis of tackling inflation before it gets out of control. Nevertheless, on Monday, Silvana Tenreyro, an external member of the Boe, said that inflation pressures from surging energy prices were likely to fade quickly.
According to Brown Brother Harriman (BBH analysts, on a note to clients, expectations of a Bank of England (BoE) rate hike by the November 4 meeting are getting trimmed.
“WIRP suggests only 50% odds of liftoff November 4, down from being fully priced in at the start of last week. However, a hike at the next meeting on December 16 remains fully priced in,” per BBH report.On Monday, on the Brexit front, David Frost said that EU proposals would not offer a more profound solution as the UK wants. Further added, “The problem with the EU proposals on Northern Ireland is that they don’t go far enough.”
That said, GBP/JPY traders will look for market mood sentiment and ongoing developments surrounding the UK. The Bank of England November 4 monetary policy seems priced in, as the cross-currency has rallied almost 6% in the MTD, from 150.00 to 158.00 tops.
GBP/JPY Price Forecast: Technical outlook
Daily chart
The GBP/JPY is trading near last Friday’s tops around 157.20’s, taking a breather after a steep upside move of 800 pips without consolidation. The daily moving averages (DMA’s) are below the spot price, supporting the upward bias, while the Relative Strength Index (RSI) at 67 aims higher, opening the door for another leg-up, potentially towards 158.00.
GBP/JPY ADDITIONAL LEVELS
-
19:21
NZD/USD testing support at 0.7150 on rejection from 0.7195
- The kiwi fails at 0.7195 and returns to the support area at 0.7150.
- The US dollar appreciates further on a risk-on session.
- NZD/USD's upside momentum loses vigour – UOB.
The New Zealand dollar has given away previous gains after pulling back from 0.7195 on Tuesday, to test support at 0.7150. The pair has been moving without a clear direction in a choppy trading session, ahead of key central bank meetings this week.
The US dollar picks up on a risk-on session
The kiwi has been unable to take advantage of moderately positive market sentiment. Stock markets have posted gains on Tuesday on the back of better than expected quarterly earnings reports by UPS and General Electric.
The US Dollar Index has pared losses on Tuesday after a soft opening, extending Monday’s rebound from 93.45, to session highs at 94.00.
Better than expected US new home sales, which surged 14% in September to reach six-month highs with 800,000 units sold, plus the unexpected improvement in US consumer sentiment and the solid increase on the Richmond Fed Manufacturing Index might have offered a fresh boost to the USD during the American trading time.
Major currencies, however, have remained within previous levels, with the investors awaiting key monetary policy decisions by the ECB, BoJ and BoC, due to be released later this week, which might set the near-term direction for FX markets.
NZD/USD’s upside momentum loses vigor – UOB
The FX analysis team at UOB warns that the NZD is losing upside traction: “As highlighted, upward momentum is beginning to wane and a break of 0.7125 (no change in ‘strong support’ level) would indicate that the NZD strength that started more than a week ago has run its course. In order to rejuvenate the flagging momentum, NZD has to move and stay above 0.7180 within these 1 to 2 days, or a break of 0.7125 would not be surprising.”
Technical levels to watch
-
19:17
Silver is under pressure to a critical daily dynamic support
- Silver is under pressure as investors move into the greenback.
- Event risks are looming with critical central banks meetings slated this and next week.
- US yields are adding pressures with the 10-year yield now at critical dynamic support.
The price of silver is down heavily on the day following an aggressive 4-hour candle that extended the drift from Asian flows back into the US dollar. At the time of writing, XAG/USD is trading near $24.0430, down 2.13% after falling from a high of $24.58 to a low near $23.87.
The greenback has been stuck in a narrow range while markets await news from central bankers this and next week which include the European Central Bank on Thursday, the Bank of Canada tomorrow (Wed), and the Federal Reserve next week. The US dollar, as measured by the DXY index, was unchanged bid at 93/95 at the time of writing which is hurting precious metals today. There has been a strong rally in the greenback which has based at a triple bottom low on the 4-hour charts following a breakout from a downtrend that started on Oct 12.
US yields in focus
Investors could well be positing ahead of the slew of central bank meetings and economic critical data that could shift views on interest rates, inflation and growth rates. In this regard, the yields on 10-year U.S. note is testing critical trendline support which could equate to a fresh run to the upside, supportive of the US dollar and a headwind for precious metals:

At the time of writing, this is yielding 1.6263% in the mid-day of the New York session. Meanwhile, analysts at TD Securities argue that the hunt for inflation protection is intensifying.
''Ten-year breakeven yields continue to firm at their highest levels since 2012, as speculators brace for inflation. In this context, global markets remain intensely focused on pricing the Fed's exit, with the recent surge in market-based inflation expectations fueling bets for an earlier Fed hike.''
''Yet, we continue to argue that market pricing for Fed hikes remains far too hawkish as it fails to consider that a rise in inflation tied to a potential energy shock and lingering supply chain shortages would be unlikely to elicit a Fed response,'' the analysts argued.
''In fact,'' they said, ''the market is increasingly pricing in a policy mistake which is unlikely to take place, considering that central banks are likely to look past these disruptions as their reaction functions have been historically more correlated to growth than inflation.''
Silver & DXY technical analysis
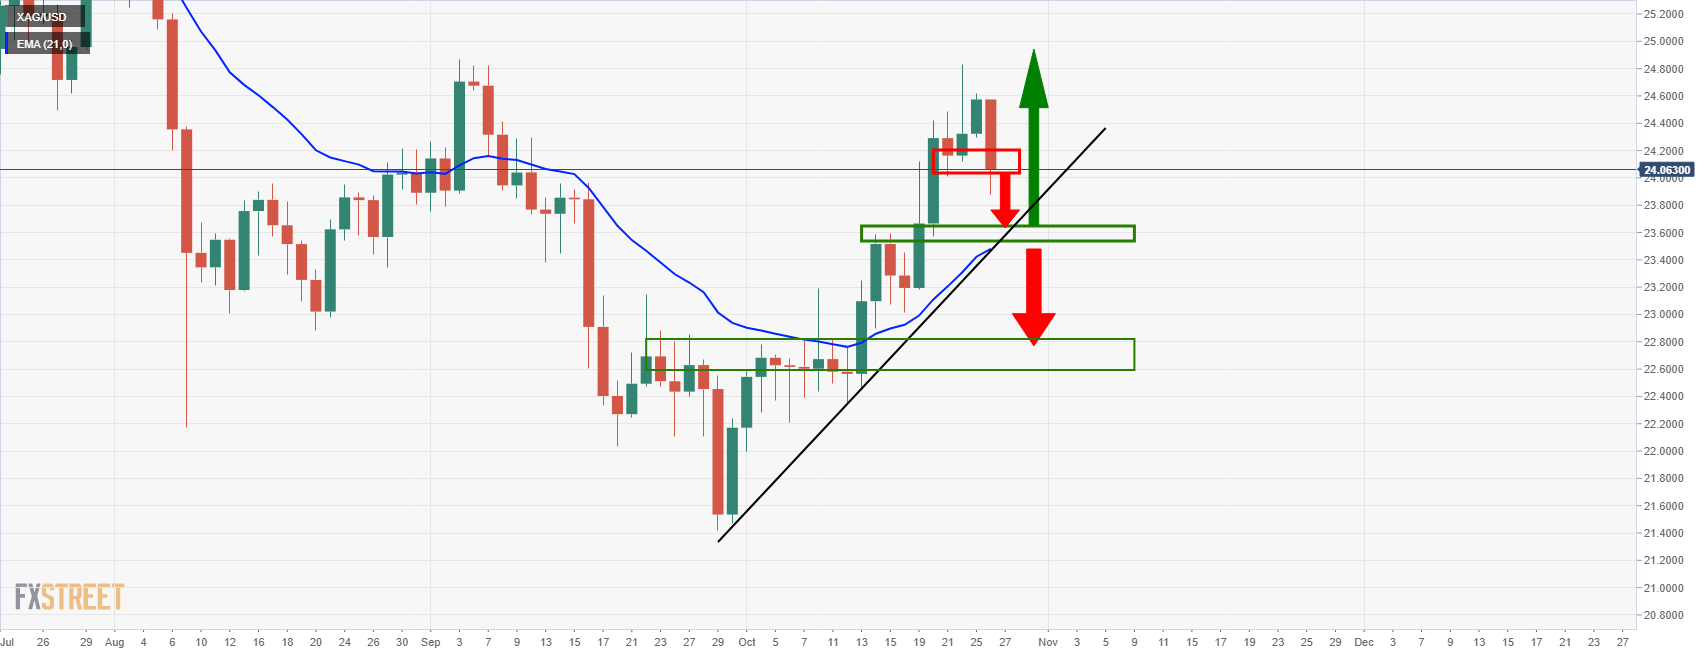
The confluence of the daily dynamic and 21-day EMA is compelling. A break to there could see the price rally. Or, alternatively, there are likely risks below the support to the next layer down near the head and shoulders neckline.
Meanwhile, the US dollar is looking as though it is make or break time:
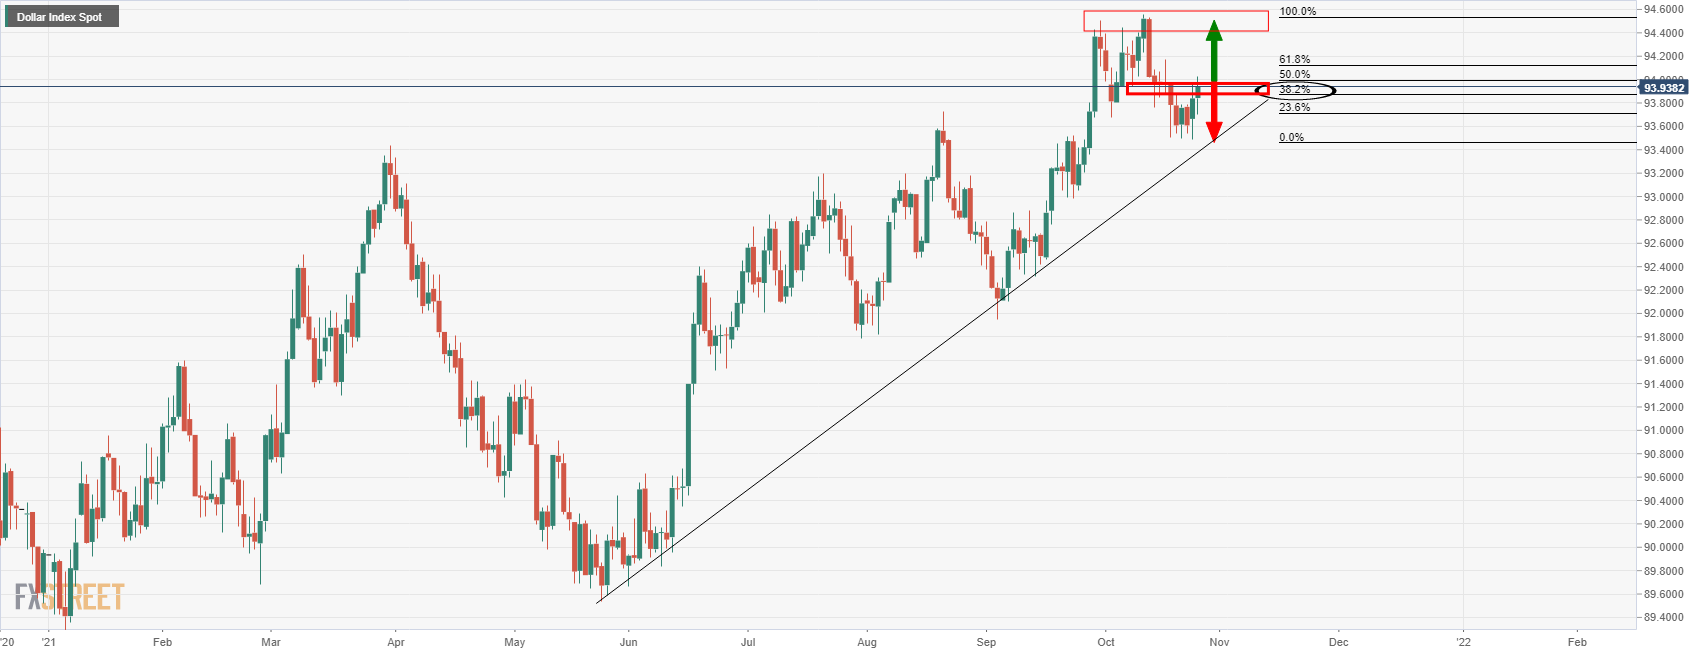
The rally has made a 38.2% Fibo retracement and that could be expected to resist leading to a downside test of the dynamic trendline support. If, on the other hand, it breaks the resistance, then the next layer is located in the highs near 94.50 which would likely cripple the precious metals for the near term.
-
18:48
USD/CHF hesitates around 0.9200 after failure at 0.9225
- The US dollar's recovery from 0.9150 meets resistance at 0.9225.
- The dollar, looking for direction ahead of central banks' meetings.
- USD/CHF biased lower, aiming to 0.9081 – Commerzbank.
The US dollar whipsawed around 0.9200 on Tuesday as the pair’s rebound from 7-week lows at 0.9150 found resistance at 0.9225 earlier today. On a broader view, the USD/CHF remains trapped within a clear downward channel from late September highs at 0.9365.
The US dollar, looking for direction ahead of Central Banks’ meetings
The greenback’s recovery has lost steam on Tuesday, with the pair unable to maintain the positive tone seen on Monday in spite of the upbeat market sentiment seen during the European and US market sessions and the positive US macroeconomic data.
The USD Index has reversed earlier losses, after bouncing at 93.68, returning to 94.00 area, buoyed by the positive market sentiment triggered by upbeat earnings reports. Beyond that, US new home sales surged 14% in September to a six-month high of 800,000 units sold, with the Richmond Fed manufacturing Index improving beyond expectations and consumer confidence improving unexpectedly in October.
In a bigger picture, however, the major currency crosses remain moving within previous ranges, with the market awaiting monetary policy decisions by the ECB, BoJ, and BoC, which might provide a fresh push to currency markets.
USD/CHF remains vulnerable, aiming towards 0.9081 – Commerzbank
From a technical perspective, Karen Jones, Team Head FICC Technical Analysis Research at Commerzbank, maintains its negative outlook and sees the current decline reaching levels below 0.9100: “USD/CHF is vulnerable near-term, it is under pressure and we would allow for further losses (..) It is possible that this is only an ABC correction but intraday Elliott wave counts remain negative and we suspect that the market will see a deeper sell-off to the 0.9142 200-day ma and potentially the 2020-2021 uptrend at 0.9081.”
Technical levels to watch
-
18:39
United States 2-Year Note Auction rose from previous 0.31% to 0.481%
-
18:27
WTI surges above $84.00 for the second day in a row amid broad US dollar strength
- WTI extends its three-month rally, and prices have increased 37% since August 2021.
- The market sentiment is upbeat despite overall US dollar strength across the board.
- Saudi Aramco CEO said that if COVID-19 eases as expected and more people fly, it would be a crude oil supply deficit.
Western Texas Intermediate (WTI) US crude oil benchmark rises during the New York session, short of Monday's tops, trading at $84.30 at the time writing. The market sentiment has remained upbeat as US stock indices remain supported by US Q3 solid corporate earnings, which helped ease investors' nervousness around high inflation and central bank monetary policy tightening.
In the meantime, the US Dollar Index, whose price influences commodity prices, is rising 0.18%, sitting at 93.98 at press time
Crude oil prices lie in the hands of the OPEC+ and the increasing demand for it as the energy crisis worsens. On Tuesday, Amin Nasser, CEO of Saudi Aramco, said that capacity worldwide is dropping quickly, and companies need to invest more in production. His comments come as the US, among other countries, have called OPEC+ to increase the current output.
Nasser added that if the coronavirus pandemic eases as expected and more people fly, the supply deficit could worsen in 2022.
Despite the abovementioned, the Organization of Petroleum Exporting Countries and its partners (OPEC+) stick to the 400,000 daily output increase each month. The group led by Russia and Saudi Arabia will meet on November 4 to decide whether to keep or change the strategy.
WTI Price Forecast: Technical outlook
WTI's upward move is overextended, portrayed by the Relative Strength Index (RSI), which is at 74 and has remained in overbought levels since October 11, showing no signs to move lower. The daily moving averages remain well below the price, with an upward slope, supporting the upward bias.
A sustained upside break above $84.00 could open the way for a $91.00 challenge, but crude oil dynamics also lie in fundamental developments. So, in this case, cautions is warranted. The first resistance level would be $85.00, subsequently followed by $86.00.
In case of a correction lower, the first meaningful support level would be the July 6 high at $77.00.
WTI KEY ADDITIONAL LEVELS TO WATCH
-
17:57
USD/JPY consolidates above 114.00 with upside attempts capped at 114.30
- The US dollar returns above 114.00 to stall right below 114.00.
- Risk appetite, dovish BoJ weigh on the Japanese yen.
- USD/JPY expected to appreciate towards 117.00/10 – Credit Suisse.
The dollar maintains a moderate bid tone on Tuesday, extending its rebound from the 113.40 low hit last Friday. The pair has returned to levels past 114.00, with the safe-haven yen weighed on a risk-on market, before hitting resistance at 114.30 area.
The yen weakens on risk appetite, dovish BoJ
The Japanese yen has opened the week on a soft tone on the back of a moderate appetite for risk with quarterly earnings reports triggering advances in the world’s major equity markets.
Beyond that, the market is bracing for a dovish monetary policy statement by the Bank of Japan later this week, which is adding negative pressure on the yen. With the US Federal Reserve expected to start reducing its stimulus program over the coming months, the widening yield differential between the US and Japanese Treasury bonds has been one of the main reasons behind the nearly 5% rally performed by the USD/JPY since late September.
On the macroeconomic front, US new home sales have surged 14% in September, hitting a six-month high rate of 800,000 units, well above the 620,000 units anticipated by market experts. Furthermore, the Richmond Fed Manufacturing Index has improved to 12, from -3 in the previous month, with all components, shipments, new orders and employment showing improvements. On the negative side, The US Home Prices index and S&P Case-Schiller home prices have increased below expectations.
USD/JPY expected to rally towards 117.00/10 – Credit Suisse
From a wider angle, economists at Credit Suisse observe the pair in a consolidation phase, ahead of further appreciation: “With a major base in place above the 112.40 high of 2019 we look for an eventual break above 114.73/92 in due course for a move to 115.51 initially and then the long-term downtrend from April 1990 at 117.00/10. We look for a potentially lengthy consolidation phase to emerge here.”
Technical levels to watch
-
17:24
AUD/USD retreats from 0.7520 as US T-bond yields rise
- AUD/USD shed 30 pips in the last hour, as US T-bond yields rise amid risk-on market mood.
- Broad US Dollar strength across the board weighs on the AUD/USD pair.
- US Consumer Confidence rose more than expected by economists, the AUD/USD barely moved.
The AUD/USD barely advances during the New York session, is up 0.08%, trading at 0.7497 at the time of writing. Earlier in the day, the pair dipped to 0.7483, yet bounced off the daily lows to print a daily high at 0.7524, finally settling at current levels.
The market sentiment is upbeat due to robust US Q3 corporate earnings, with almost 81% of the S&P 500 companies reporting earnings, beating expectations. Additional factors like inflationary pressures and tightening monetary policy conditions remain in the backseat.
However, in the last hour, rising US T-bond yields seem to change the tone of risk-sensitive currencies, like the aussie dollar. The US 10-year Treasury yield is advancing 0.07%, sitting at 1.636%, putting a lid on the AUD/USD pair upbreak move above 0.7500. Also, the US Dollar Index reclaims the 94.00 level, up 0.18%, at press time.
US mixed macroeconomic, ignored by AUD/USD traders
The US economic docket unveiled the US Housing Price Index for August (MoM) reading which rose by 1%, lower than the 1.3% foreseen. Further, the S&P/Case-Shiller Home Price Indices (YoY) expanded by 19.7% less than the 20.1% expected.
Further, US New Home Sales for September increased by 0.8M, better than the 0.76M estimated by analysts. The US Consumer Confidence for October improved to 113.8 versus 108.3 expected.
The AUD/USD pair reaction was muted, but as US T-bond yields started to rise, the pair shed 30 pips, trading at current levels.
Next ahead on the Australian economic docket, the RBA Trimmed Mean CPI for the Q3 is expected at 0.5%, while the Consumer Price Index for the same period is estimated to increase by 0.8%.
KEY ADDITIONAL LEVELS TO WATCH
-
17:10
USD/CAD bounces up from 1.2350 and approaches 1.2400
- The US dollar, contained at 1.2350, returns to levels near one-week highs at 1.2400.
- The greenback bounces up after upbeat housing, manufacturing data.
- USD/CAD is expected to rally towards 1.25/26 after BoC – Scotiabank.
The US dollar has shrugged off previous weakness and bounced up from session lows at 1.2350 against its Canadian counterpart, returning to levels right below 1.2400 and turning positive on daily charts.
The dollar bounces up after US data
The greenback has bounced up, to regain lost ground following a soft performance during the Asian and European trading sessions. Better than expected US new home sales and the strong performance of the Richmond Fed Manufacturing Index seem to have reactivated confidence in the US dollar, pushing the pair back to levels near the one-week top, at 1.2400.
Sales of new homes have surged 14% in the US in September, hitting a six-month high rate of 800,000 units and beating market expectations of 620,000 units sold. Furthermore, the Richmond Fed Manufacturing Index improved to 12, from -3 in the previous month, with all components: shipments, new orders, and employment showing advances. On the negative side, home prices have increased below expectations.
The Canadian dollar had edged up earlier, buoyed by higher oil prices and improved market sentiment on the back of strong corporate earnings. The CAD, however, remains heavy, with the market positioning for a dovish BoC monetary policy statement later this week.
USD/CAD to appreciate towards 1.25/26 after BoC – Scotiabank
The FX Analysis team at Scotiabank expects the pair to advance further this week, with a dovish BoC increasing negative pressure on the CAD: “We look for narrow range trading for the CAD ahead of tomorrow’s policy decision and feel the risk of soft-pedaling nearer-term rate expectations might nudge the CAD somewhat lower in the short-run. USD gains to the 1.25/1.26 will very likely be met with renewed USD supply, however.”
Technical levels to watch
-
16:59
Brazil: Central bank to raise key rate by 150bps with some risk of an even more aggressive move – TD Securities
The central bank of Brazil (BCB) will meet this week. Market consensus point to an increase in the main policy rate to 7.75%, an 150bps hike. According to analysts from TD Securities there is some risk of an even more aggressive move.
Key Quotes:
“We expect the BCB to make a more aggressive policy rate adjustment by hiking rates by 150bps, aimed at containing inflation expectations and stabilizing BRL. There is some risk of an even more aggressive move in our view.”
“The risk to BRL is skewed to the downside. We believe that a 150bp rate hike, with a commitment of another equivalent hike at the December meeting, will be required to bolster BRL. Anything less risks a resumption of BRL selling.”
“The rates market has priced-in an assumption of an aggressive shift in the BCB's stance, leaving a terminal rate near 13.00% by late 2022.”
-
16:52
Fed: Taper announcement in November, no rate hikes until 2023 – Wells Fargo
Next week, the Federal Reserve will have its monetary policy meeting. Analysts at Wells Fargo, expect the FOMC to formally announce plans to taper asset purchases. They don’t expect higher rates until 2023.
Key Quotes:
“Our working assumption is that the FOMC announces a taper on November 3, with the actual tapering of purchases beginning at the start of December. From there, we assume that the Federal Reserve reduces its asset purchases each month by $10B for Treasury securities and $5 billion for MBS. At this pace, the Fed would complete its asset purchase program by the end of June 2022. The Fed's balance sheet, which is currently about $8.5T, would be slightly above $9T by mid-2022.”
“It is likely Chair Powell will pair the tapering announcement with another firm reminder that the bar for increasing short-term interest rates is much higher. At August's rate of job growth it would take a little more than two years to recoup 100% of the jobs lost during the pandemic, and even then the economy would still be several million jobs short of its pre-pandemic trend. Even with our faster projected pace of job growth, we still expect the labor market to face a meaningful employment gap for the entirety of 2022. In our view, this employment gap, paired with our projected slowdown in inflation, will keep the Fed from raising rates until 2023.”
-
16:49
BoC Preview: Progress has been made – TDS
On Wednesday, the Bank of Canada (BoC) will announce its decision on monetary policy. The base case scenario according to analysts at TD Securities is for the BoC to keep to broader narrative intact and guidance unchanged; and signal inflation is largely transitory. They see the BoC announcing a shift to QE reinvestment, starting in November.
Key Quotes:
“We expect the BoC to argue that inflation is largely transitory, and to maintain its current forward guidance for the overnight rate. We also look for the BoC to announce that its QE program will transition to the reinvestment phase in November.”
“We like USDCAD higher into the BoC. While the stagflation theme has oddly benefited CAD, it's likely moved too far, too fast. CAD is trading at a 1-sigma premium on our dashboard and is the most overbought currency in the G10. We look for better selling levels ahead of the 1.2850 pivot point.”
-
16:36
US: Easing in COVID cases boosted optimism – Wells Fargo
US economic data released on Tuesday came in above expectation, with a Consumer Confidence measure rising unexpectedly. According to analysts at Wells Fargo, favourable views of the labor market helped to fuel gains in both the present situation and expectation measures and lifted the Consumer Confidence headline index to 113.8 from 109.8.
Key Quotes:
“Consumer confidence rose for the first time in four months, jumping four points to 113.8 in October, as concerns that drove confidence to a seven-month low in September eased. COVID cases are again receding from their more-recent peak and the onslaught of negative news in September, which ranged from natural disasters to fiscal uncertainty and the wind-down of the war in Afghanistan, has subsided. There was an improvement in consumers views of both current conditions and expectations for the future.”
“Higher optimism around income may be boosting spending in the near-term. Retail sales surprised to the upside in September, and while some of that is likely due to higher prices, it is an indication demand has not fallen off a cliff headed into the holiday shopping season. Buying intentions suggest a similar conclusion, as plans to buy automobiles, major appliances and even homes over the next six months all improved from September.”
“On Friday, we'll get the personal income & spending report for September which will shed some light on the price versus spending dynamics. Even if spending intentions to not materialize, and we see lackluster sales to end the year, holiday sales are still set for a record year-over-year gain this year.”
-
16:34
EUR/USD, rejected at 1.1625, approaches one-week lows at 1.1590
- The euro pulls back from 1.1625, returns to 1.1600.
- Upbeat US figures trigger a dollar rebound.
- EUR/USD expected to dive below 1.1600 after ECB's meeting – Scotiabank.
The euro’s upside attempt seen during the European trading session has been short-lived. The pair failed at 1.1625 to give away gains following the release of US home sales and manufacturing data, returning to levels right below 1.160 and nearing the 1.1590 support area.
The US dollar appreciates on upbeat macroeconomic data
A slew of better than expected figures in the US has strengthened a hitherto softer dollar, dashing the tame euro recovery attempt supported by positive market sentiment and the pause on US T-Bonds rally.
US new home sales have surged 14% in September to a six-month high rate of 800,000 units, beating market expectations of 620,000 units. The median price, however, accelerated 18,7% year on year and remains at levels beyond $400,000, which is hampering the possibilities of first-time buyers.
Furthermore, the Richmond Fed Manufacturing Index improved to 12, from -3 in the previous month, well above the 3 reading forecasted by the analysts. All components of the index, shipments, new orders, and employment have improved this month, which has eased concerns about the impact of supply disruptions.
The US dollar has bounced up on the back of these releases, although the major currency crosses remain contained within previous ranges, with all eyes on the monetary policy decisions and US GDP figures, due later this week.
EUR/USD: Dovish ECB decision to push the pair returning 1.1600 – Scotiabank
The FX Analysis team at Scotiabank, sees the pair closing this week below 1.1600, weighed by a dovish ECB: “Even a moderately less dovish statement will stand starkly in contrast to next week’s Fed decision, so room for EUR gains is limited and selling the currency on a post-ECB gain is the most sensible strategy.”
Technical levels to watch
-
16:32
Gold Price Forecast: XAU/USD fails to hold above $1800, tumbles toward $1780
- Recovery of the US dollar triggers sell-off in metals.
- Gold tumbles losing more than $10 in a few minutes, later trims losses.
Gold dropped below $1800 and tumbled to $1782, reaching the lowest level since Thursday. It then trimmed losses and rose toward $1790. It still remains under pressure, as the US dollar strengthens across the board.
The greenback gained momentum during the American session following the release of better-than-expected US economic data. US bond yields bounced to the upside with the 10-year rising from the lowest in a week at 1.61 to 1.66%. The DXY turned positive and rose toward 94.00, to test the weekly top.
The decline in metals during the last hours was significant. Silver is down by more than 2%, trading under $24.00. XAG/USD reversed sharply, extending the retreat from monthly highs. XAU/USD is falling 1.05%.
The sharp decline in gold adds doubts to the current upside short-term bias. A recovery above $1790 would be a positive development, but in order to keep the doors open to more gains, XAU/USD needs to regain $1800.
A break under $1777 should sign to further losses and to a deterioration in the technical outlook; targeting $1770 initially and then $1760.
Technical levels
-
16:19
GBP/USD struggles for the fourth day out of six, at 1.3830, retreats below 1.3800
- The British pound advances for the second day in a row amid risk-on market sentiment.
- GBP/USD: Faces strong resistance at 1.3830, despite BoE hawkish comments.
- US Q3 corporate earnings, keep investors mood in risk-on mode, boosts the risk-sensitive GBP.
- Brown Brother Harriman (BBH): Expectations of a Bank of England November 4 hike, trimmed by 50%.
The British pound climbs during the New York session is trading at 1.3789 at the time of writing. Earlier in the Asian session, the GBP/USD dipped to 1.3756, but as European traders got to their desks, the pair jumped to 1.3829, faced strong resistance, and retreated towards current levels.
US Q3 corporate earnings, keep investors mood in risk-on mode
Sterling’s recovery during the European session lies on the back of the positive market sentiment. Factors like follow-through from last week’s US corporate third-quarter earnings, with Alphabet, Amazon, and Apple Microsoft, left to report earnings this week, keep the market on a positive tone. Investors are gauging from those reports if companies are passing higher production prices to customers, leaving macroeconomic developments on the side.
Additionally, earnings season remains in the driver seat, with elevated inflation and tightening monetary policy, staying in the backseat for the time being,
During the European session, UK Chancellor Sunak will reportedly unfreeze public sector salaries next April. Reports suggest that Sunak will also announce an increase in the national minimum wage to GBP 9.50 per hour. He is due to unveil his budget speech on Wednesday.
According to Brown Brother Harriman (BBH), on a note to clients, expectations of a Bank of England (BoE) rate hike by the November 4 meeting are getting trimmed.
“WIRP suggests only 50% odds of liftoff November 4, down from being fully priced in at the start of last week. However, a hike at the next meeting on December 16 remains fully priced in,” per BBH report.Additionally, on Monday, Silvana Tenreyro, an external member of the Bank of England, said that she needed more time to judge how the furlough scheme would affect the labor market, signaling that she was not in a rush to lift rates. Furthermore, she added that inflation pressures from surging energy prices were likely to fade quickly.
That said, it seems the GBP/USD pair will remain around the 1.3700-1.3850 levels until the November 4 BoE monetary policy meeting. A hawkish “surprise” could propel the British pound through the 1.3830 strong resistance area, but as investors trimmed their bets of a hike rate, it may well be priced in.
US mixed macroeconomic data, ignored by investors
An absent UK economic docket left the GBP/USD pair at the mercy of US dollar dynamics. In the meantime, the US economic docket featured the US Housing Price Index for August (MoM) reading which rose by 1%, lower than the 1.3% foreseen. Further, the S&P/Case-Shiller Home Price Indices (YoY) expanded by 19.7% less than the 20.1% expected.
Moreover, US New Home Sales for September increased by 0.8M, better than the 0.76M estimated by analysts. The US Consumer Confidence for October improved to 113.8 versus 108.3 expected.
-
15:40
US Sen. Maj. Leader Schumer: Confident deal on domestic investment bill is within reach
US Senate Democratic Leader Chuck Schumer said on Tuesday that Democrats are continuing to make progress on US President Joe Biden's economic plan, as reported by Reuters.
"I remain confident a deal is within reach on the large domestic investment bill," Schumer added.
Market reaction
Risk flows continue to dominate the financial markets following these comments. As of writing, the S&P 500 and the Dow Jones Industrial Average indexes were trading at new record highs, rising 0.6% and 0.4% on a daily basis, respectively.
-
15:14
US: New Home Sales surge by 14% in September vs. 1.5% expected
Following a contraction of 1.4% in August, New Home Sales in the US surged by 14% in September, the data published by the US Commerce Department showed on Tuesday. This reading surpassed the market expectation for an increase of 1.5% by a wide margin.
Further details of the publication revealed that the median sale price rose by 18.7% on a yearly basis to $408,000.
Market reaction
The dollar stays resilient against its major rivals after this report. As of writing, the US Dollar Index was up 0.05% on a daily basis at 93.87.
-
15:08
US: CB Consumer Confidence improves to 113.8 in October vs. 108.3 expected
- US CB Consumer Confidence Index rose more than expected in October.
- US Dollar Index stays in a consolidation phase below 94.00.
Consumer confidence in the US strengthened in October with the Conference Board's Consumer Confidence Index rising to 113.8 from 109.8 in September. This reading came in higher than Reuters' estimate of 108.3.
Further details of the publication revealed that the Present Situation Index edged higher to 147.4 from 144.3 and the Consumer Expectations Index improved to 91.3 from 86.7.
Market reaction
This report doesn't seem to be having a significant impact on the dollar's performance against its rivals. As of writing, the US Dollar Index was up 0.03% on the day at 93.85.
-
15:00
United States Richmond Fed Manufacturing Index came in at 12, above forecasts (3) in October
-
15:00
United States New Home Sales Change (MoM) came in at 14%, above expectations (1.5%) in September
-
15:00
United States New Home Sales (MoM) came in at 0.8M, above expectations (0.76M) in September
-
14:42
EUR/GBP to drop substantially below 0.84 if BoE sets on a tightening path – Scotiabank
EUR/GBP nears 0.84. If the Bank of England (BoE) lays out a tightening path in its next week's meeting, the pair would slide below the mentioned 0.84 level.
EUR/GBP to suffer a major fall below 0.84
“Next week may see the EUR/GBP firmly fall under the 0.84 mark if the BoE sets on a tightening path.”
“EUR/GBP is nearing key support at 0.84 after it held through multiple sessions to the 0.8420 mark. Below 0.84, only big figure psychological and 0.8277/82 (2019/2020 lows) support stand.”
-
14:40
S&P 500 Index notches new record-high after the opening bell
- Wall Street's main indexes opened in the positive territory on Tuesday.
- All major sectors of the S&P 500 push higher.
After managing to post gains on the first day of the week, major equity indexes in the US opened in the positive territory as risk flows continue to dominate the financial markets. Reflecting the upbeat market mood, the CBOE Volatility Index (VIX) touched its lowest level since early July at 15.
As of writing, the S&P 500 and the Dow Jones Industrial Average indexes were trading at new record highs, rising 0.42% and 0.25%, respectively. The Nasdaq Composite is up 0.71% at 15,338.
After the opening bell, all major sectors of the S&P 500 push higher with the Technology Index leading the rally by rising more than 1%.
Later in the session, the Conference Board's Consumer Confidence Index for October and September New Home Sales data will be featured in the US economic docket.
S&P 500 chart (daily)
-
14:34
USD/CAD to climb to the 1.25/26 zone as BoC may dampen rate expectations – Scotiabank
The Canadian dollar unwinds yesterday’s loss but the Bank of Canada (BoC) risks linger. Economists at Scotiabank expect the loonie to weaken following the BoC meeting, rising USD/CAD to the 1.25/26 area.
BoC to cool down rate expectations
“The CAD is one currency that we fully expect to hold its own– and even improve somewhat – against a more robust USD going forward, given our forecast for a relatively rapid tightening in the BoC policy rate once that tightening cycle gets started (we assume H2 next year).”
“We fully expect a further reduction in asset purchases but policy makers might try to dampen rate expectations somewhat in order to avoid disappointing market participants and creating more volatility down the road.”
“We look for narrow range trading for the CAD ahead of tomorrow’s policy decision and feel the risk of soft-pedaling nearer-term rate expectations might nudge the CAD somewhat lower in the short-run. USD gains to the 1.25/1.26 will very likely be met with renewed USD supply, however.”
-
14:30
US Senator Manchin: $1.5 trillion for spending bill is more than fair
Democratic US Senator Joe Manchin said on Tuesday he thinks that a $1.5 trillion for spending bill is "more than fair," as reported by Reuters.
Manchin further added that he doesn't know if the domestic investment bill will rise above the $1.5 trillion he wants.
Commenting on the Senate filibuster rule, Manchin noted that the debt limit increase should be decided by the US President with Congress having the power to override it.
Market reaction
These comments don't seem to be having a noticeable impact on the dollar's market valuation. As of writing, the US Dollar Index was unchanged on the day at 93.81.
-
14:27
EUR/USD Price Analysis: Further losses likely below 1.1590
- EUR/USD regains some ground following Monday’s drop.
- The breakdown of 1.1590 should allow for a deeper pullback.
EUR/USD regains some composure and looks to extend the bounce above the 1.1600 mark on a more sustainable fashion.
In the meantime, the inability of spot to move higher in the short-term horizon could trigger some corrective move to, initially, the weekly low at 1.1590 (October 25). A drop beyond this level is seen exposing another weekly low near 1.1570 (October 18), all prior to the 2021 low at 1.1524 (October 12).
In the meantime, the near-term outlook for EUR/USD is seen on the negative side below the key 200-day SMA, today at 1.1911.
EUR/USD daily chart
-
14:26
EUR/USD: Dovish ECB meeting to drag the pair below the 1.16 level – Scotiabank
EUR/USD is steady to marginally higher with the 1.16 zone acting as an anchor against broad losses in the dollar today. According to economists at Scotiabank, markets may be preparing for another dovish European Central Bank (ECB) meeting this week, which would leave the pair pointing to losses extending below the 1.16 mark.
Room for EUR gains is limited
“Even a moderately less dovish statement will stand starkly in contrast to next week’s Fed decision, so room for EUR gains is limited and selling the currency on a post-ECB gain is the most sensible strategy.”
“EUR/USD is currently trading against ~1.1620 resistance to be followed by the mid 1.16s zone that stands as a clear area to breach that would signal a firmer rejection of downward pressure – resistance at 1.17 (50-day MA at 1.1702) follows.”
“Support is 1.1572 after the 1.16 area.”
-
14:10
Gold Price Forecast: XAU/USD slides further below $1,800 mark, downside seems limited
- The risk-on mood prompted fresh selling around the safe-haven gold on Tuesday.
- Hawkish Fed expectations further exerted pressure on the non-yielding XAU/USD.
- Fresh COVID-19 jitters, worries about global economic growth helped limit losses.
- Gold Price Forecast: Acceptance above 100/200-day SMAs favours XAU/USD bulls
Gold added to its intraday losses and weakened further below the $1,800 mark during the early North American session. The XAU/USD has now reversed a major part of the previous day's positive move back closer to six-week tops and was last seen flirting with the 100/200-day SMA confluence resistance breakpoint. The dominant risk-on mood in the markets was seen as a key factor that dented demand for traditional safe-haven assets and exerted some pressure on the safe-haven precious metal.
Meanwhile, the latest leg of a sudden drop over the past hour or so could be attributed to a modest US dollar strength, which tends to undermine dollar-denominated commodities, including gold. The USD drew some support from elevated US Treasury bond yields, bolstered by the prospects for an early policy tightening by the Fed. The markets have been pricing in the possibility of a potential interest rate hike in 2022 amid worries about a faster than expected rise in inflationary pressures.
However, a combination of factors should hold traders from placing aggressive bearish bets around the XAU/USD and limit any deeper losses, at least for the time being. The latest COVID-19 outbreak in China has raised fears about the imposition of economically damaging lockdowns. Against the backdrop of the recent power shortages in China, this could lead to production stoppages/shortages of products down the supply chain and derail the global economic recovery. This, in turn, should continue to act as a tailwind for the gold prices ahead of this week's key event/data risks.
The Bank of Japan and the European Central Bank (ECB) are scheduled to announce their policy decision on Thursday. Neither of the central banks is anticipated to announce a change in the policy stance, though warn about a faster than expected rise in inflation. Beyond this, the market focus will be on the release of the Advance US Q3 GDP growth report, which will set the tone heading into the FOMC policy meetings next week and infuse some volatility around gold.
In the meantime, traders on Tuesday will take cues from the US economic docket – featuring the releases of the Conference Board’s Confidence Index, Richmond Manufacturing Index and New Home Sales. Apart from this, the US bond yields, the USD price dynamics and the broader market risk sentiment should assist traders to grab some short-term opportunities around gold.
Technical outlook
From a technical perspective, gold, so far, has managed to defend the 100/200-day SMAs confluence resistance breakpoint. The mentioned resistance-turned-support, currently around the $1,795-90 area, should act as a key pivotal point for short-term traders. A convincing breakthrough, leading to a subsequent slide below the $1,782 horizontal support, will shift the bias in favour of bearish traders. The XAU/USD might then accelerate the fall towards the next relevant support near the $1,760 region before eventually dropping to monthly swing lows, around the $1,746-45 zone.
On the flip side, the $1,810 region, closely followed by multi-week tops, around the $1,814 area now seems to act as immediate resistance. Some follow-through buying should set the stage for an extension of the recent appreciating move and push gold beyond the $1,825-26 intermediate hurdle. Bulls could eventually aim to challenge the $1.832-34 heavy supply zone, which has been acting as a strong barrier since mid-July.
Levels to watch
-
14:03
US: Housing Price Index rises by 1% in August vs. 1.3% expected
- US FHFA Housing Price Index rose less than expected in August.
- US Dollar Index continues to move sideways below 94.00.
The Housing Price Index released by the US Federal Housing Finance Agency (FHFA) arrived at +1% in August following July's increase of 1.4%. This reading fell short of the market expectation of 1.3%.
Meanwhile, the S&P/Case-Shiller Home Price Indices edged lower to +19.7% on a yearly basis in August from 20%, missing analysts' estimate of 20.1%.
Market reaction
These figures don't seem to be having a significant impact on the dollar's performance against its rivals. As of writing, the US Dollar Index was virtually unchanged on the day at 93.80.
-
14:00
United States Housing Price Index (MoM) below forecasts (1.3%) in August: Actual (1%)
-
14:00
United States S&P/Case-Shiller Home Price Indices (YoY) below forecasts (20.1%) in August: Actual (19.7%)
-
13:55
United States Redbook Index (YoY) climbed from previous 15.4% to 15.6% in October 22
-
13:43
US Dollar Index Price Analysis: Extra range bound looks likely
- DXY fails once again to reclaim the 94.00 area on Tuesday.
- The mid-93.00s emerge as a strong support so far.
DXY extends the erratic performance recorded as of late and comes under some selling pressure following another unsuccessful attempt to re-visit the 94.00 yardstick.
In the meantime, the greenback looks poised for further consolidation as long as the 93.50 region holds. On the other hand, the surpass of 94.00 – ideally in the very near term – could motivate the index to initiate a more convincing recovery to initially, the weekly top at 94.17 (October 18) followed by the 2021 high at 94.56 (October 12).
Looking at the broader picture, the constructive stance on the index is seen unchanged above the 200-day SMA at 91.90.
DXY daily chart
-
13:12
USD/JPY sticks to modest gains near 114.00 mark ahead of US data
- USD/JPY edged higher for the second successive day, though lacked any follow-through.
- The risk-on mood undermined the safe-haven JPY and remained supportive of the move.
- Retreating US bond yields weighed on the USD and kept a lid on any meaningful gains.
The USD/JPY pair maintained its bid tone heading into the North American session, albeit struggled to find acceptance or build on the momentum beyond the 114.00 mark.
The pair built on the overnight rebound from the 113.40 area, marking ascending trend-line support extending from September swing lows, and gained some follow-through traction on Tuesday. This marked the second successive day of a positive move and was sponsored by the prevalent risk-on mood, which tends to undermine the safe-haven Japanese yen.
The uptick, however, lacked bullish conviction amid the emergence of fresh selling around the US dollar, weighed down by an extension of the recent decline in the US Treasury bond yields. In fact, the yield on the benchmark 10-year US government bond has now dropped closer to the 1.60% threshold, though hawkish Fed expectations should act as a tailwind.
The Fed chair Jerome Powell reaffirmed on Friday that the US central bank remains on track to begin tapering its bond purchases by the end of this year. The markets have also been pricing in the possibility of a potential interest rate hike in 2022 amid worries that the recent widespread rally in commodity prices will stoke inflation.
The fundamental backdrop seems tilted in favour of bullish trades and supports prospects for additional gains. That said, investors are likely to refrain from placing aggressive bets ahead of Thursday's Bank of Japan policy meeting and the Advance US Q3 GDP report. This, in turn, warrants some caution for aggressive bullish traders.
Market participants now look forward to the US economic docket, featuring the releases of the Conference Board’s Confidence Index, Richmond Manufacturing Index and New Home Sales. This, along with the US bond yields and the broader market risk sentiment, should assist traders to grab some short-term opportunities around the USD/JPY pair.
Technical levels to watch
-
13:12
More USD strength into year-end, another leg lower in early 2022 – TDS
The market remains on the tensions between stagflation and reflation, shifting a bit to the latter recently. Although the USD could remain on the back foot for the next few weeks, economists at TD Securities expect the greenback to end the year on a solid foot.
MSCI World is within striking distance of recent peak, S&P 500 marks fresh highs
“Global equities, proxied through the MSCI World, are within striking distance of the recent highs. US equities have already posted new highs, likely informed by a solid start to earnings season. A relatively upbeat Q3 earnings season would probably support the reflation environment, even if central bank rhetoric leaned on the hawkish side.”
“We're biased towards more USD strength into year-end for the low yielders, like CHF, JPY, and EUR, though things have moved pretty far in JPY.”
“Given the back-and-forth, flip-flopping state of markets now, we see a step back for the USD followed by a step forward in the final two months of the year. In other words, the USD should consolidate into year-end before starting another push lower in early 2022.”
See: The case for a stronger USD is compelling against the low yielding EUR, CHF and JPY – MUFG
-
13:00
Brazil Mid-month Inflation came in at 1.2%, above expectations (0.97%) in October
-
12:53
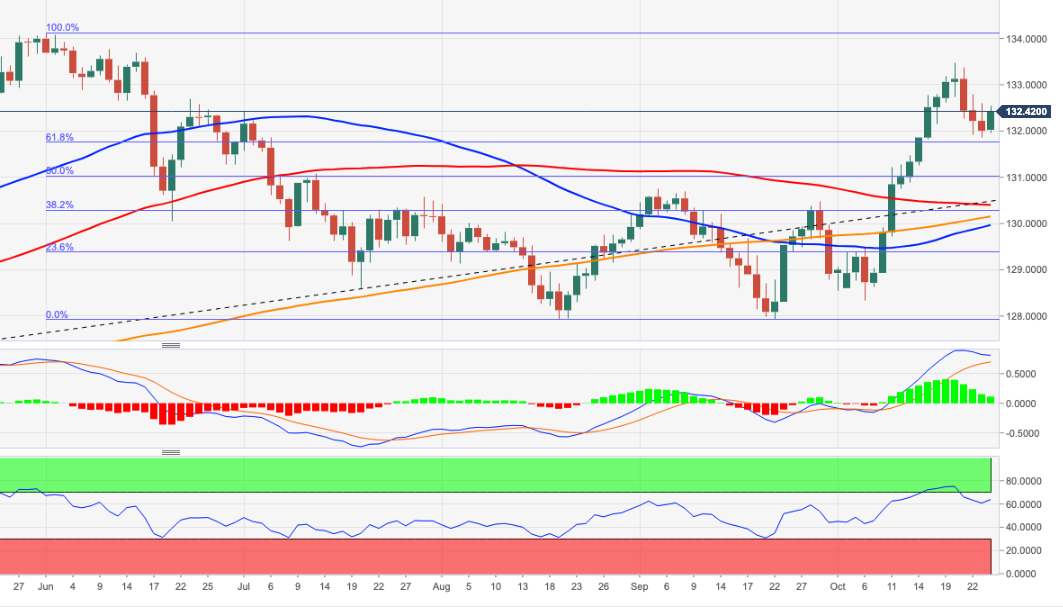
EUR/JPY Price Analysis: Recovery could attempt a move to 133.50
- The sharp move higher in EUR/JPY meets resistance near 133.50.
- Bets for a near-term test of 2021 high remain well in place.
EUR/JPY seems to have regained some upside traction and so far reverses three consecutive daily pullbacks on Tuesday.
The rebound from the sub-132.00 levels (October 25) now looks to revisit the next hurdle at the Fibo level at 132.79 ahead of the monthly peak around 133.50 (October 22). Further up, there are minor hurdles at 133.68 (June 15) and 133.76 (June 10) prior to the more relevant YTD high at 134.12 (June 1).
In the broader scenario, while above the 200-day SMA at 130.11, the outlook for the cross is expected to remain constructive.
EUR/JPY daily chart
-
12:26
USD/CAD slides to fresh session lows, around mid-1.2300s
- A combination of factors prompted fresh selling around USD/CAD on Tuesday.
- The risk-on mood, retreating US bond yields weighed on the safe-haven buck.
- Bullish crude oil prices underpinned the loonie and contributed to the decline.
The intraday USD selling bias picked up pace in the last hour and dragged the USD/CAD pair back closer to mid-1.2300s during the first half of the European session.
Having faced rejection near the 1.2400 mark, the USD/CAD pair met with some fresh supply on Tuesday and for now, seems to have stalled its recent bounce from four-month lows touched last week. The downtick was sponsored by the emergence of fresh selling around the US dollar and a modest uptick in crude oil prices, which tend to underpin the commodity-linked loonie.
The dominant risk-on mood in the markets failed to assist the safe-haven USD to capitalize on the previous day's goodish rebound from one-month lows. Apart from this, a modest decline in the US Treasury bond yields undermined the greenback. That said, expectations for an early policy tightening by the Fed should limit the USD losses and lend support to the USD/CAD pair.
The Fed Chair Jerome Powell reaffirmed last Friday that the US central bank remains on track to begin tapering its bond purchases by the end of this year. Investors also seem convinced that the Fed would be forced to adopt a more aggressive policy response to contain stubbornly high inflation. This supports prospects for the emergence of some dip-buying around the USD.
Market participants now look forward to the US economic docket, featuring the releases of the Conference Board’s Confidence Index, Richmond Manufacturing Index and New Home Sales. This, along with the US bond yields and the broader market risk sentiment, will influence the USD. Traders will further take cues from oil price dynamics for some impetus around the USD/CAD pair.
Technical levels to watch
-
12:23
USD/JPY set to surge as high as 117.00/10 – Credit Suisse
The setback in USD/JPY following its rejection from 114.73/92 has been contained at its rising 13-day exponential average at 113.46. Economists at Credit Suisse look for the core uptrend to resume from here towards the 117.00/10 area.
Support at 113.46/41 to hold for an eventual break above 114.73/92
“USD/JPY weakness has been contained at its rising short-term 13-day exponential average, now seen at 113.46 and we look for a resumption of the core uptrend. Above 114.21 should add weight to our view for a fresh look at 114.73/92 – the high of November 2017 and 78.6% retracement of the December 2016/March 2020 fall just.”
“With a major base in place above the 112.40 high of 2019 we look for an eventual break above 114.73/92 in due course for a move to 115.51 initially and then the long-term downtrend from April 1990 at 117.00/10. We look for a potentially lengthy consolidation phase to emerge here.”
“Below 113.46/41 would warn of a deeper corrective setback to 113.29/21, with the 38.2% retracement of the October rally at 113.08/00 ideally holding.”
-
12:19
EUR/USD: Rejection at 1.1671 reasserts the downtrend towards 1.1495 – Credit Suisse
EUR/USD has posted a bearish “reversal day” to mark a more decisive rejection of 38.2% retracement resistance at 1.1671. Economists at Credit Suisse look for a resumption of the downtrend to the 1.1495/93 mark.
Resistance at 1.1671 to cap for a resumption of the downtrend
“Support moves to 1.1590 initially, then 1.1571/66, below which should clear the way for a fall back to 1.1529/24, then our 1.1495/93 first objective – the key March 2020 high and 50% retracement of the 2020/2021 bull trend.”
Whilst we would look for the 1.1495/93 to hold at first for a fresh consolidation phase, below in due course should clear the way for a move to 1.1290.”
“Above 1.1671 would reassert an upward bias for a test of the 55-day average at 1.1706/11. Suspect though we still need to see a close above here to raise the prospect of a more concerted recovery to 1.1756, then the 38.2% retracement of the May/October fall at 1.1808.”
-
12:15
Global equities to yield mid to high single digits returns for the coming year – Citibank
Citi analysts expect growth to endure. The 28% price rise for global equities over the past 12 months is a source of risk for investors but they believe global stocks could produce yields of high single digits in the next year.
Be not afraid of slower growth
“The most likely scenario is that global EPS growth rates could average 7%-8% over the next two years.”
“Global equities, with dividends and price appreciation, could generate mid to high single digits returns for the coming year. But for bond investors, the yield environment points to another year of negative real returns for global bondholders, but less negative than in 2021.”
“Global growth may exceed 5.5% in 2021 and fall below 4.0% in 2022.”
-
11:46
USD/IDR: Still room for further gains – UOB
According to Quek Ser Leang at UOB Group’s Global Economics & Markets Research, USD/IDR could still edge higher, although a tough resistance is located at 14,250.
Key Quotes
“We highlighted last Monday (18 Oct, spot at 14,095) that ‘further weakness is not ruled out’. We added, ‘in view of the deeply oversold conditions, a break of the round-number support at 14,000 appears unlikely”’ While our view was not wrong as USD/IDR did not break 14,000 (low of 14,020), we did not anticipate the sharp and swift rebound from the low.”
“Daily MACD has turned back up quickly but it appears too early to expect a major reversal. That said, there is room for the rebound to extend but a break of the solid resistance at 14,250 (declining trend-line that sits close to the 55-day exponential moving average) would come as a surprise. Support is at 14,080, the low at 14,020 is not expected to come into the picture this week.”
-
11:46
GBP/USD spikes to three-day tops, around 1.3825 region
- GBP/USD gained strong positive traction for the second successive day on Tuesday.
- BoE rate hike expectations, fresh USD selling bias provided a goodish lift to the pair.
- Hawkish Fed, Brexit jitters might keep a lid on any meaningful upside for the major.
The GBP/USD pair surged past the 1.3800 mark during the first half of the European session and shot to three-day tops in the last hour. The pair was last seen trading around the 1.38125 region, up nearly 0.40% for the day.
The pair built on the previous day's rebound from the vicinity of ascending channel support and gained strong positive traction for the second successive day on Tuesday. The dominant risk-on mood prompted fresh selling around the safe-haven US dollar, which, in turn, was seen as a key factor that provided a goodish lift to the GBP/USD pair.
On the other hand, the British pound continued drawing some support from the recent hawkish remarks by the Bank of England officials, signalling an imminent interest rate hike this year. In fact, the BoE Governor Andrew Bailey had said that the UK central bank will have to act soon amid increasing risks to medium-term inflation expectations.
The money markets suggest a 62% chance that the MPC will hike rates by 25 bps at the upcoming BoE monetary policy meeting next week. Apart from this, the sterling further benefitted from some cross-driven strength stemming from a fresh leg down in the EUR/GBP pair, which tumbled to the lowest level since February 2020 on Tuesday.
That said, a fresh row over the Northern Ireland protocol might hold bulls from placing aggressive bullish bets around the GBP/USD pair. This, along with the prospects for an early policy tightening by the Fed, might further collaborate to cap the upside amid absent relevant market moving economic releases from the UK.
Meanwhile, the US economic docket releases of the Conference Board’s Confidence Index, Richmond Manufacturing Index and New Home Sales later during the early North American session. This, along with the US bond yields and the broader market risk sentiment, will influence the USD price dynamics and provide some impetus to the GBP/USD pair.
Technical levels to watch
-
11:29
UK: CBI Retail Sales Balance improves to 30 in October vs. 13 expected
The Confederation of British Industry's (CBI) latest Distributive Trades Survey showed on Tuesday that the Retail Balance in the UK improved to 30 in October from 11 in September. This reading came in better than Reuters' estimate of 13.
Further details of the publication revealed that the Sales Expectations Balance advanced to 35 for November, compared to 29 for October. Finally, the stock levels in relation to expected sales dropped to a record low of -23.
Market reaction
The upbeat data provided a boost to the British pound during the European trading hours and the GBP/USD pair was last seen rising 0.4% on a daily basis at 1.1823.
-
11:20
Gold Price Forecast: XAU/USD to go on the topside once above $1813/42 – Commerzbank
Gold climbed above $1,800 on Monday and seems to have gone into a consolidation phase. As Karen Jones, Team Head FICC Technical Analysis Research at Commerzbank, notes, there are still some hurdles to deal with at $1813/42 to really get going on the topside.
Encouraging signs
“XAU/USD is about to hit the 55-week ma at $1813 and the $1842 2020-2021 resistance line.”
“The $1813/42 region remains the key break point on the topside to $1917/22 then $1959/66.”
-
11:13
Silver Price Analysis: XAG/USD flirts with session lows, 100-DMA continues to cap
- Silver witnessed some selling on Tuesday and erased the previous day’s modest gains.
- A mixed technical setup warrants some caution before placing aggressive directional bets.
Silver dropped to fresh daily lows, around the $24.25 region during the first half of the European session, reversing the previous day's positive move.
Despite the pullback, the XAG/USD, so far, has managed to defend the 38.2% Fibonacci level of the $28.75-$21.42 downfall. The comes on the back of the recent sustained strength beyond a short-term descending trend-line resistance and an inverted head and shoulders bullish breakout. The set-up supports prospects for an extension of an upward trajectory witnessed over the past one month or so.
That said, last week's turnaround from an intermediate hurdle near the $24.80-85 region and the commodity's inability to find acceptance above the 100-day SMA warrants caution for bullish traders. The emergence of fresh selling on Tuesday further makes it prudent to wait for a strong follow-through buying before positioning for any further appreciating move amid absent fundamental catalysts.
From current levels, any further decline might continue to find decent support and attract some buying near the $24.00 mark, which now seems to act as a strong base for the XAG/USD. A convincing break below might accelerate the corrective slide towards mid-$23.00s. This is followed by the $23.20-15 confluence support, comprising of the descending trend-line breakpoint and the 23.6% Fibo. level.
On the flip side, the $24.50-60 region (100-day SMA) now seems to have emerged as an immediate strong hurdle. This is followed by the monthly swing highs, around the $24.80-85 region, above which the XAG/USD seems all set to reclaim the key $25.00 psychological mark. The latter coincides with the 50% Fibo. level, which if cleared decisively should pave the way for additional near-term gains.
Silver daily chart
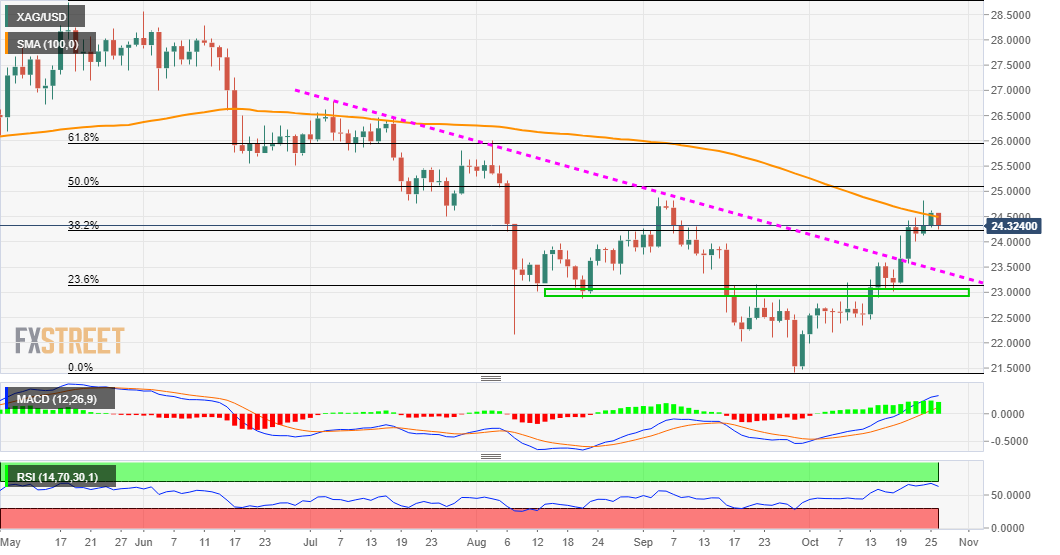
Technical levels to watch
-
10:58
USD/MYR: Weakness looks limited around 4.1370 – UOB
Quek Ser Leang at UOB Group’s Global Economics & Markets Research notes that selling pressure in USD/MYR should appear limited around the 4.1370 level.
Key Quotes
“Last Monday (11 Oct, spot at 4.1670), we highlighted that ‘there is little scope for USD/MYR to break the major support at 4.1400’. We added, USD/MYR ‘is more likely to consolidate and trade between 4.1480 and 4.1760’. Our view was not wrong even though USD/MYR subsequently traded within a narrower range than expected (4.1480/4.1695). The underlying tone has weakened somewhat and for this week, a breach of the rising trend-line support (level has moved higher to 4.1420 from 4.1400) would not be surprising.”
“As downward pressure is not strong for now, any weakness is likely limited to a test of 4.1370. On the upside, a breach of 4.1630 would indicate that the current mild downward pressure has eased.”
-
10:33
GBP/JPY retakes 157.00 mark and beyond, climbs to two-day tops
- GBP/JPY gained strong follow-through traction for the second successive day on Tuesday.
- The dominant risk-on mood weighed on the safe-haven JPY and provided a goodish boost.
- BoE rate hike expectations continued underpinning the sterling and remained supportive.
The GBP/JPY cross continued scaling higher through the early part of the European session and surged past the 157.00 mark in the last hour. The cross was last seen trading near two-day tops, around the 157.20-25 region, up over 0.40% for the day.
A combination of supporting factors assisted the GBP/JPY cross to build on the overnight rebound from sub-156.00 levels and gain some follow-through traction for the second straight session on Tuesday. The dominant risk-on mood in the markets undermined the safe-haven Japanese yen. This, along with a modest pickup in demand for the British pound, provided a goodish lift to the cross.
The British pound remained well supported by the recent hawkish remarks from the Bank of England officials, signalling an imminent interest rate hike this year. In fact, the BoE Governor Andrew Bailey warned recently that rising energy prices means inflation will last longer and that the UK central bank will have to act amid increasing risks to medium-term inflation expectations.
Moreover, the BoE’s new chief economist Huw Pill also said last week that inflation in the UK could rise above 5% by early next year. Pill added that the MPC is finely balanced over whether to raise rates in November. Currently, the markets suggest a 62% chance that the MPC will hike rates by 25 basis points, increasing the relevance of the upcoming BoE monetary policy meeting next week.
Meanwhile, the ongoing positive move seemed rather unaffected by a fresh row over the Northern Ireland protocol. It is worth reporting that the UK's Brexit minister has rejected a compromise plan over the question of how much power EU judges should have in Northern Ireland. Lord Frost further noted that the EU's current proposals don't go far enough and has set a December deadline to find a solution.
This, in turn, warrants some caution for aggressive bullish traders and positioning for any further appreciating move. Hence, any subsequent positive move is more likely to confront a stiff resistance and remain capped. Nevertheless, the GBP/JPY cross still seems poised to climb further towards reclaiming the 158.00 mark, which is followed by over five-year tops, around the 158.20 region.
Technical levels to watch
-
10:30
Eurozone inflation expectations hit fresh seven-year highs above ECB’s 2% target
Against the backdrop of rising energy prices and supply chain bottlenecks, Eurozone inflation expectations reached the highest levels in seven years at 2.0509% on Tuesday.
After several months of high inflation readings in the Eurozone, the inflation expectations amongst the old continent’s bond investors have surged past the European Central Bank's (ECB) target of 2%.
However, the ECB policymakers continue to downplay concerns over rising inflation, as the focus this week remains on the central bank’s plan on the withdrawal of the pandemic support measures.
Analysts at ING Bank note, “rising inflation swaps will be a key topic at Thursday's ECB meeting. The persistent inflation scare is seeing expectations tilt towards tighter policies, and any pushback by the ECB may remain confined to the very front-end pricing."
Across the Atlantic, “US inflation expectations, as measured by the 10-year breakeven inflation rate per the St. Louis Federal Reserve (FRED) data jumped to the highest levels last seen during August 2006 by the end of Monday’s North American trading,” FXStreet Analyst Anil Panchal explains.
Related reads
- Eurozone Preliminary CPI jumps 3.4% YoY in September, beats estimates
- EUR/USD leaps to daily highs past 1.1610, looks to US data
-
10:14
AUD/USD consolidates gains around 0.7500 ahead of US data, Australian inflation
- AUD/USD flirting with 0.7500, as the bulls cheer risk-on mood.
- The US dollar holds firmer, capping the aussie’s upside attempts.
- All eyes on the US CB Consumer Confidence and Australian CPI data.
AUD/USD is picking up fresh bids in the European session, recapturing the 0.7500 level, although the bulls appear to lack follow-through amid a broadly firmer US dollar.
The pair is well off the three-day highs reached at 0.7518 in the Asian trades, as the greenback continues to hold onto its recent advance amid the renewed optimism on the US infrastructure spending bill.
However, the prevailing risk-on market mood keeps the buoyant tone intact around the aussie dollar. Surging iron-ore prices in China also remain one of the main catalysts behind the aussie’s upbeat momentum.
The Dalian iron ore prices extend their rebound from multi-week lows amid a set of weekly industry data that showed a drop in iron ore shipments to China from Australia and Brazil due to escalating energy crisis worldwide.
Further, the extended correction in the US Treasury yields from five-month tops also benefits the AUD due to its increased attractiveness as an alternative higher-yield asset.
Investors also cheer the resumption of the US-China talks, with the US Treasury Secretary Janet Yellen and Chinese Vice Premier Liu He having discussed macroeconomic and financial developments during their virtual call, earlier on.
Next of relevance for the pair remains the US CB Consumer Confidence data due later in the NA session. The aussie traders will also closely follow the sentiment on Wall Street for fresh trading opportunities ahead of the Australian Q3 CPI report. The Reserve Bank of Australia’s (RBA) Trimmed Mean CPI is seen arriving at 0.5% QoQ in Q3 vs. 0.5% previous.
AUD/USD technical levels
With the persisting bullish momentum, the aussie needs to take out the daily highs at 0.7518 to test the three-month tops of 0.7548. On the flip side, the immediate support is seen at the previous week’s low of 0.7452. The next target for the sellers is placed at 0.7400, the round number.
AUD/USD additional levels to consider
-
09:51
GBP/USD Price Analysis: Clings to gains below 1.3800, lacks follow-through
- GBP/USD gained traction for the second consecutive session on Tuesday.
- A modest USD strength seemed to cap the upside amid fresh Brexit jitters.
- Bears need to wait for a sustained break below ascending channel support.
The GBP/USD pair gained traction for the second consecutive session on Tuesday and climbed to 1.3800 neighbourhood during the early European session, albeit lacked follow-through. The uptick could be solely attributed to some cross-driven strength stemming from a fresh leg down in the EUR/GBP cross. That said, a modest US dollar strength kept a lid on any further gains for the major amid fresh Brexit jitters.
From a technical perspective, the GBP/USD pair has been showing some resilience near the 200-hour SMA. This is closely followed by the lower boundary of an ascending channel extending from the vicinity of the 1.3400 mark, or September swing lows. The latter, currently around mid-1.3700s, should now act as a key pivotal point for short-term traders. A convincing break below will set the stage for an extension of the recent rejection slide from the very important 200-day SMA.
GBP/USD 1-hour chart
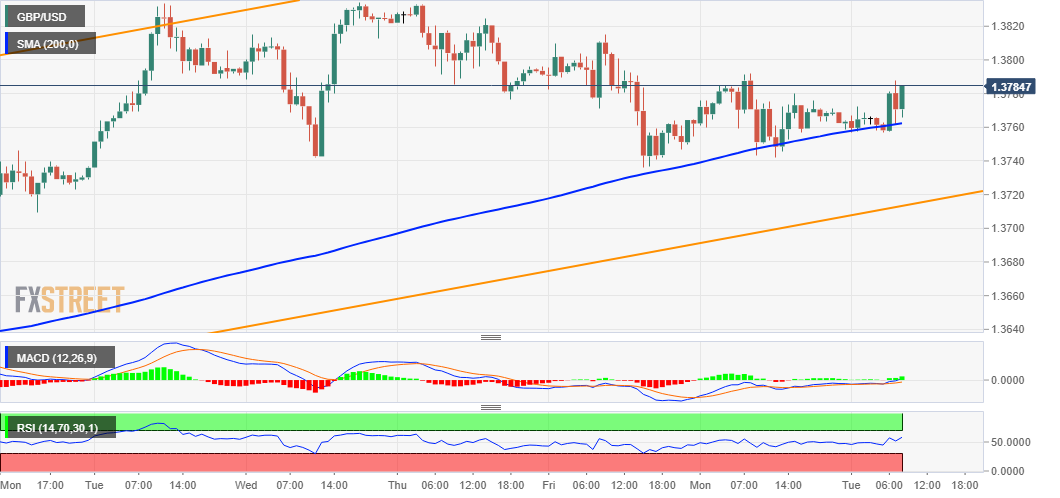
The GBP/USD pair might then accelerate the corrective decline towards testing the 1.3700 round-figure mark. The next relevant support is pegged near the 1.3675-70 horizontal zone, which if broken decisively would turn the pair vulnerable. Meanwhile, technical indicators on the daily chart – though have been losing positive traction – are still holding comfortably in the bullish territory. This, in turn, warrants caution before placing aggressive bearish bets around the GBP/USD pair.
On the flip side, any meaningful positive move beyond the 1.3800 mark might continue to confront stiff resistance near the 1.3830-35 confluence region. This comprises 200-day SMA and a downward sloping trend-line extending from late July. Some follow-through buying has the potential to lift the GBP/USD pair further towards challenging the trend-channel hurdle, currently around the 1.3885 region. A sustained strength beyond will be seen as a fresh trigger for bullish traders.
GBP/USD daily chart
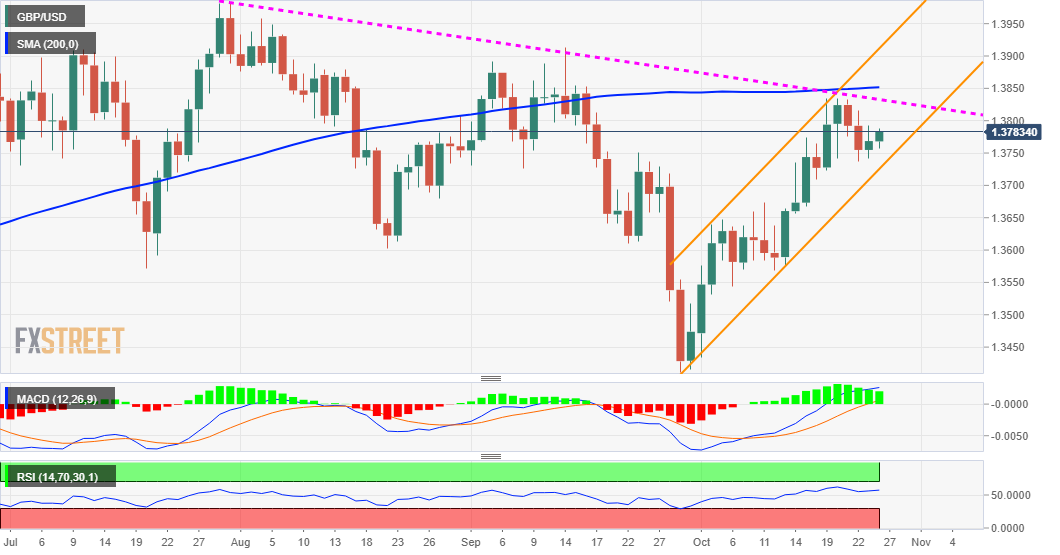
Technical levels to watch
-
09:38
Malaysia: Inflation bounces in September – UOB
UOB Group’s Senior Economist Julia Goh and Economist Loke Siew Ting comment on the latest inflation figures in the Malaysian economy.
Key Takeaways
“Headline inflation reversed course and edged up to 2.2% y/y in Sep after easing for four straight consecutive months to a 5-month low of 2.0% y/y in Aug. The reading also came in a tad higher than our estimate and Bloomberg consensus of 2.1%. It was primarily due to higher food prices, costlier household maintenance & repair of dwelling, as well as year-ago low base effects in electricity and transport components.”
“We expect inflationary pressures to remain manageable in 4Q21 as cushioned by government relief measures. This will bring full-year inflation to an average of 2.5% for 2021 (BNM’s forecast: 2.0%-3.0%). That said, heading into 2022, upside risks to the inflation outlook have emerged following a global energy crunch, prolonged global supply chain bottlenecks, and labour shortage post-pandemic, which could lead to more persistent inflation and second-round effects. While utility discounts, fuel and cooking oil subsidies are expected to be extended into 2022, regulators are due to firm up the next base electricity tariff adjustment for the period beginning Jan 2022 to Dec 2024 amid surging fuel costs. Hence, we reiterate our inflation outlook for 2022 at 2.5%.”
-
09:35
USD/INR: Upside risks to persist amid higher energy prices – SocGen
USD/INR broke out of its tightly held range to move back above 75, in line with higher energy prices. As economists at Société Générale note, higher oil prices is the key near-term risk for USD/INR.
Trade deficit widens to multi-year highs
“The recent surge in oil prices has been detrimental to the INR, and as such the currency should remain under pressure until the supply-related bottlenecks causing the energy crisis abate.”
The trade deficit widened to a record high in September amid surging commodity prices, exacerbating the INR’s recent weakness.”
The RBI recently stopped its bond purchasing programme (GSAP), a clear indication of policy normalisation, and as such we believe that monetary policy should be supportive of the INR in the medium-term, especially with the RBI poised to deliver a rate hike by 2Q22.”
“Foreigners remain net buyers of Indian equities, while they turned net sellers of Indian bonds in October following a couple of months of strong inflows. As such, portfolio flows, despite losing some momentum this month, remain supportive of the currency.”
-
09:34
EUR/USD leaps to daily highs past 1.1610, looks to US data
- EUR/USD leaves behind Monday’s weakness above the 1.1600 yardstick.
- The greenback falters once again just ahead of the 94.00 barrier.
- ECB-speak, US Consumer Sentiment next on tap in the docket.
EUR/USD manages to reverse the initial weakness and advances to session tops in the 1.1610/15 band on turnaround Tuesday.
EUR/USD looks to US data, risk trends
EUR/USD bounces off weekly lows near 1.1590 and looks to reverse the pessimism seen at the beginning of the week, all against the backdrop of unclear risk appetite trends and higher US yields.
Indeed, US yields in the belly of the curve regain some traction and flirt with the 1.64% area as opposed by the poor performance of yields in the German 10y Bunds, which recede to the -0.12% area so far on Tuesday.
While the greenback loses ground vs. rivals like the sterling, the yen and the Aussie dollar, it so far manages well to keep daily gains vs. the single currency.
Tuesday’s empty docket in the euro area will likely shift the attention to the participation of ECB Board member A.Enria in a panel discussion later in the European afternoon. The US calendar looks quite interesting following the releases of house prices tracked by the FHFA Index and the S&P/Case-Shiller Index seconded by New Home Sales and the October Consumer Confidence measured by the Conference Board.
What to look for around EUR
The bull run in EUR/USD still remains capped by the 1.1670 region (October 19). While the improvement in the sentiment surrounding the risk complex lent extra wings to the par in past sessions, price action is expected to keep looking to dollar dynamics for the time being, where tapering chatter remains well in centre stage. In the meantime, the idea that elevated inflation could last longer coupled with the loss of momentum in the economic recovery in the region, as per some weakness observed in key fundamentals, are seen pouring cold water over investors’ optimism as well as bullish attempts in the European currency.
Key events in the euro area this week: German GfK Consumer Confidence (Wednesday) – German labour market report, EMU final Consumer Confidence, ECB meeting, German flash CPI (Thursday) – Advanced German Q3 GDP, flash EMU CPI (Friday).
Eminent issues on the back boiler: Asymmetric economic recovery post-pandemic in the region. Sustainability of the pick-up in inflation figures. Probable political effervescence around the EU Recovery Fund in light of the rising conflict between the EU, Poland and Hungary. ECB tapering speculations.
EUR/USD levels to watch
So far, spot is gaining 0.02% at 1.1609 and faces the next up barrier at 1.1669 (monthly high Oct.19) followed by 1.1704 (55-day SMA) and finally 1.1755 (weekly high Sep.22). On the other hand, a break below 1.1590 (weekly low Oct.25) would target 1.1571 (low Oct.18) en route to 1.1524 (2021 low Oct.12).
-
09:33
Germany’s Altmaier: Will cut 2021 GDP forecast, raise 2022 GDP forecast
Germany’s Economy Minister Peter Altmaier said on Tuesday, his government will cut the 2021 GDP forecast to 2.6% from 3.5% previously estimated in April, Reuters reports, citing two sources.
Meanwhile, he said to lift the 2022 GDP forecast to 4.1% vs. 3.6% predicted in April, the sources added.
Altmaier, however, declined to comment on the GDP forecasts.
On Monday, the German central bank, the Bundesbank, highlighted that the 2021 GDP outlook is likely to be significantly below the June forecast of 3.7% due to a slowdown in activity in Q4.
EUR/USD struggles with 1.1600
EUR/USD is unfazed by the above comments, defending minor bids at 1.1609, as of writing.
-
08:42
NZD/USD surrenders modest intraday gains, slides back closer to mid-0.7100s
- NZD/SUD struggled to capitalize on its modest intraday uptick amid stronger USD.
- Hawkish Fed expectations acted as a tailwind for the buck and exerted pressure.
- Rising bets for an additional RBNZ rate hike warrants caution for bearish traders.
The NZD/USD pair surrendered its modest intraday gains and retreated to the lower end of its daily trading range during the early European session. The pair was last seen hovering just above mid-0.7100s, nearly unchanged for the day.
The pair gained some traction during the early part of the trading action on Tuesday amid the dominant risk-on mood in the markets, which tends to benefit the perceived riskier kiwi. That said, the ongoing US dollar recovery from one-month lows capped the upside for the NZD/USD pair, rather prompted fresh selling at higher levels.
The USD continued drawing some support from growing acceptance about the prospects for an early policy tightening by the Fed. The market expectations were reaffirmed by Fed Chair Jerome Powell on Friday, saying that the US central bank will begin rolling back its massive pandemic-era stimulus by the end of this year.
Moreover, investors have been pricing in the possibility of a potential interest rate hike in 2022 amid worries that the recent widespread rally in commodity prices will stoke inflation. This was reinforced by the recent runaway rally in the US Treasury bond yields, which continued acting as a tailwind for the greenback.
The downside, however, remains cushioned amid rising bets that the RBNZ will hike interest rates further to contain stubbornly high inflation. This warrants some caution for aggressive bearish traders and makes it prudent to wait for a strong follow-through selling before positioning for any further depreciating move.
Market participants now look forward to the US economic docket – featuring the releases of the Conference Board’s Confidence Index, Richmond Manufacturing Index and New Home Sales. This, along with the US bond yields and the broader market risk sentiment, will influence the USD price dynamics and provide some impetus to the NZD/USD pair.
Technical levels to watch
-
08:39
USD/MXN to see a rebound towards the 20.50 level – SocGen
USD/MXN has pulled back towards the 200-day moving average (DMA) today seen at 20.1780. Nonetheless, economists at Société Générale expect the pair to stage a rebound towards 20.50, then the recent high of 20.90.
Bounce expected
“A large decline is not envisaged; recent trough at 19.85 and 19.60/19.53 are near term supports.”
“The pair looks poised to head higher towards 20.50 and recent peak at 20.90.”
-
08:32
USD/INR to climb towards last year's high of 77.00 – SocGen
USD/INR has retracted after hitting the upper band of recent consolidation zone at 75.55/75.70. Although this level remains an interim hurdle, economists at Société Générale expect the pair to lurch higher towards 76.40 and last year's high of 77.00.
Ascending trend line at 74.20 provides support
“Ascending trend line at 74.20 should provide support.”
“The up move could persist towards 76.40 and last year's high of 77.00.”
-
08:30
Sweden Producer Price Index (MoM) below expectations (2.5%) in September: Actual (1.5%)
-
08:30
Sweden Producer Price Index (YoY) below forecasts (17.8%) in September: Actual (17.2%)
-
08:25
EUR/USD: Holding 1.1570 is essential for further rebound – SocGen
EUR/USD is struggling to hold 1.16. Economists at Société Générale note that the pair needs to stay above the 1.1570 level to see further gains.
Break above 1.1730/1.1750 resistance zone to open up 1.1910
“Reclaiming multi month channel at 1.1730/1.1750 will be essential for extended rebound towards 1.1910.”
“First support is at 1.1570.”
-
08:19
USD/CNH: Holding above 6.35 is critical to avoid a sharp decline – SocGen
USD/CNH has consistently struggled to reclaim the 200-day moving average (DMA) at 6.47 which has resulted in retraction of all the gains since May. Economists at Société Générale expect the pair to suffer a deep fall on a break below the 6.35 key support.
USD/CNH to stage a meaningful uptrend above the 200-DMA at 6.4650/6.4700
“The low formed earlier this year near 6.3500 remains a crucial support.”
“An initial rebound can’t be ruled out towards daily Kijun line at 6.4250.” “Reclaiming the 200-DMA at 6.4650/6.4700 is critical for a meaningful uptrend.”
“In the event the pair breaks below 6.3500, next potential support levels could be at projections of 6.3200 and 6.2940.”
-
08:14
USD/CNH still risks a drop to 6.3525 – UOB
In light of the recent price action, USD/CNH could still slip back to the 6.3525 level in the next weeks, suggested FX Strategists at UOB Group.
Key Quotes
24-hour view: “Yesterday, we held the view that ‘bias is on the downside but any USD weakness is likely limited to a test of 6.3700’. Our expectations did not quite materialize as USD dropped to 6.3750 before recovering. Downward pressure has eased and USD is likely to trade sideways for today, expected to be between 6.3730 and 6.3910.”
Next 1-3 weeks: “After the outsized sell-off in USD, we highlighted last Wednesday (20 Oct, spot at 6.3780) that while the sell-off appears to be overdone, there is scope for USD to drop to May’s low near 6.3525. There is no change in our view for now. The downside risk is intact as long as USD does not move above the ‘strong resistance’ level at 6.4200 (no change in level).”
-
08:13
GBP/USD points to the downside while below 200-DMA at 1.3851 – Commerzbank
GBP/USD is struggling to gain traction as the 200-day moving average (DMA) at 1.3851 caps for now. Karen Jones, Team Head FICC Technical Analysis Research at Commerzbank, expects the cable to remain under pressure.
GBP/USD to see furthe gains to 1.3914 on a move above the 200-DMA at 1.3851
“GBP/USD continues to hold steady just below the 200-DMA at 1.3851, we are concerned that this will continue to cap the topside and are alert to the idea of failure here.”
“Interim support lies at 1.3720, the 55-DMA then 1.3569, the 12th October low ahead of the 1.3411 recent low.”
“A move above the 200-DMA should see further gains to 1.3914 (mid-September high) and we suspect that we will need to regain this resistance to regenerate further upside momentum.”
“Resistance at 1.3914 guards the more important 1.3984/1.4018 medium-term pivot.”
-
08:11
US Dollar Index clings to gains near 94.00 ahead of data
- The index adds to Monday’s gains and approaches 94.00.
- Solid support for the dollar emerged in the mid-93.00s so far.
- Consumer Confidence, housing data next of note in the calendar.
The US Dollar Index (DXY), which gauges the greenback vs. a bundle of its main competitors, extends the weekly bounce and gradually approaches the key 94.00 barrier on turnaround Tuesday.
US Dollar Index focuses on yields and data
The index advances for the second session in a row and extends the optimism witnessed at the beginning of the week following the mild bounce in US yields and alternating risk appetite trends.
In fact, yields in the front end and the belly of the curve advance modestly near the 0.45% yardstick and the 1.64% mark, respectively, on Tuesday, both reversing the recent weakness and now retargeting earlier tops.
Looking at the broader scenario, the persistent elevated inflation continues to put the transitory narrative around higher consumer prices to the test for the time being, while persevering supply disruptions amidst rising demand seems to underpin the “higher for longer” view around inflation. The recent strong pick-up in breakevens also collaborate with the latter.
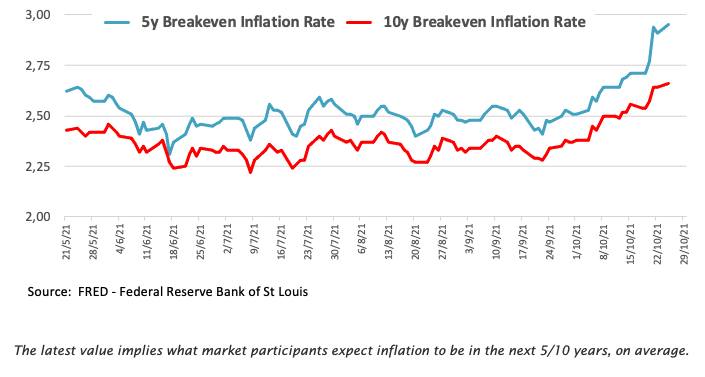
Later in the US docket, housing data will include the House Price Index measured by the FHFA, the S&P/Case-Shiller Index and New Home Sales for the month of September. In addition, the Conference Board will publish its Consumer Confidence print ahead of the Richmond Fed Manufacturing Index.
What to look for around USD
The index manages to regain some upside traction after meeting decent contention in the 93.50 zone for the time being. The positive performance of US yields, supportive Fedspeak regarding the start of the tapering process as soon as in November or December (also bolstered by Friday’s comments by Chief Powell) and the rising probability that high inflation could linger for longer remain as key factors behind the constructive outlook for the buck in the near-to-medium term.
Key events in the US this week: CB’s Consumer Confidence, New Home Sales (Tuesday) – Durable Goods Orders, Advanced Trade Balance (Wednesday) – Flash Q3 GDP, Initial Claims, Pending Home Sales (Thursday) – PCE, Core PCE, Personal Income/Spending, Final Consumer Sentiment (Friday).
Eminent issues on the back boiler: Discussions around Biden’s multi-billion Build Back Better plan. US-China trade conflict under the Biden’s administration. Tapering speculation vs. economic recovery. Debt ceiling debate. Geopolitical risks stemming from Afghanistan.
US Dollar Index relevant levels
Now, the index is gaining 0.10% at 93.91 and a break above 94.17 (weekly high Oct.18) would open the door to 94.56 (2021 high Oct.12) and then 94.74 (monthly high Sep.25 2020). On the flip side, the next down barrier emerges at 93.49 (monthly low October 21) followed by 93.28 (55-day SMA) and finally 92.98 (weekly low Sep.23).
-
08:08
AUD/USD: Further gains are likely to be elusive over the near-term – HSBC
Recent AUD gains reflect the rebound in broad risk sentiment, strong exports, and a reopening boost. Market hawkishness has likely been helpful for the aussie but a dovish Reserve Bank of Australia (RBA) and the broader USD backdrop indicate that the AUD’s uptrend is likely to be unsustainable, in the view of economists at HSBC.
Unsustainable gains
“We expect the economic upswing in Australia in Q4 (following the Delta outbreak) to be more gradual than last year (following the initial COVID-19 shock).”
“In the next meeting on 2 November, we expect the RBA to remain dovish.”
“Much of the good may be priced in, limiting further AUD gains over the near-term. We believe the broader USD backdrop and the RBA’s continued dovishness mean that the AUD’s uptrend is likely to be unsustainable over the longer-term.”
-
08:04
Fundamental picture for stocks deteriorates as the Fed begins to tighten monetary policy – Morgan Stanley
The forecast for inflation still appears hot for both consumers and corporates, but when it comes to earnings and economic growth, the outlook looks a bit chilly. Mike Wilson, chief investment officer and chief US equity strategist for Morgan Stanley, believes that the outlook for equities is deteriorating.
An icy winter for investors?
“We think the gross slowdown will be worse and last longer than expected as the payback in demand arrives early next year with a sharp year over year decline in personal disposable income.”
“The fundamental picture for stocks is deteriorating as the Fed begins to tighten monetary policy and growth slows further into next year. However, asset prices remain elevated as the upper income cohort of retail investors continues to plow money into these same investments.”
“With seasonal trends positive this time of year, institutional investors are forced to chase prices higher. If our analysis is correct, we think this can continue into Thanksgiving, but not much longer.”
-
08:03
USD/CAD consolidates in a range below 1.2400 mark
- USD/CAD remained confined in a range through the first half of the trading action on Tuesday.
- Retreating oil prices undermined the loonie and extended some support amid stronger USD.
- The fundamental backdrop supports prospects for an extension of the recent recovery move.
The USD/CAD pair lacked any firm directional bias on Tuesday and oscillated in a narrow trading band, below the 1.2400 mark through the early European session.
The pair, so far, has struggled to capitalize its recent bounce from four-month lows touched last week and remained capped near the 1.2400 mark, though a combination of factors acted as a tailwind. A modest pullback in crude oil prices from multi-year tops undermined the commodity-linked loonie. This, along with a pickup in the demand for the US dollar, extended some support to the USD/CAD pair.
The USD drew some support from the emergence of heavy selling around the shared currency. This comes amid expectations for an early policy tightening by the Fed, which further assisted the buck to build on the overnight rebound from one-month lows. The Fed Chair Jerome Powell reiterated on Friday that the US central bank remains on track to begin rolling back its massive pandemic-era stimulus.
Moreover, the recent widespread rally in commodity prices has been fueling speculations about a potential interest rate hike in 2022. Investors now seem convinced that the Fed would be forced to adopt a more aggressive policy response to contain stubbornly high inflation. Nevertheless, the fundamental backdrop favours bulls and supports prospects for some meaningful appreciating move for the USD/CAD pair.
Market participants now look forward to the US economic docket – featuring the releases of the Conference Board’s Confidence Index, Richmond Manufacturing Index and New Home Sales. This, along with the US bond yields and the broader market risk sentiment, might influence the USD. Traders will further take cues from oil price dynamics for some short-term impetus around the USD/CAD pair.
Technical levels to watch
-
07:55
Japan PM Kishida urges panel to craft proposals for “new capitalism” soon
Japanese Prime Minister Fumio Kishida said on Tuesday, he has asked his government economic panel to compile "urgent proposals" by early November to flesh out his signature "new capitalism" vision, per Reuters.
Key takeaways
The proposals will include promoting the development of advanced technologies for digitalization and decarbonization and economic security issues, including securing semiconductor supplies as "top priorities."
"We shared the view of aiming to improve productivity through growth strategies and increase the levels of people's income through redistribution of the fruits" of that growth.”
Market reaction
USD/JPY is testing 114.00, unperturbed by these comments, as it remains at the mercy of the US dollar’s price action.
The spot was last seen trading at 113.95, higher by 0.22% on the day.
-
07:53
EUR/USD loses upside impetus, scope for a free-fall to 1.1395 – Commerzbank
EUR/USD lost nearly 40 pips on Monday. Karen Jones, Team Head FICC Technical Analysis Research at Commerzbank, expects the world’s most popular currency pair to edge lower following an outside day to the downside.
1.1721 four-month downtrend to cap
“EUR/USD charted an outside day to the downside yesterday and seems to have lost upside impetus, the stop is a profit stop but we have a sell signal on the DMI, which is worrying.”
“The intraday Elliott wave counts remain positive still and for now we cannot rule out a test of the 1.1721 four-month downtrend, but look for that to hold.”
“Below 1.1522 (last week's low) lies the 50% retracement of the move from 2020 and the March 2020 high at 1.1492/95.”
“Key support is the previous downtrend (from 2008) which is now located at 1.1395.”
-
07:46
GBP/USD to strengthen considerably towards 1.50 throughout much of 2022 – ANZ
The Bank of England (BoE) looks poised to join the early rate tighteners soon. That said, current market pricing for policy rates by end-2022 looks too aggressive (bank rate 1.25%). Economists at ANZ Bank think there are solid macroeconomic justifications for GBP appreciation to do some of the heavy lifting.
GBP appreciation makes solid macroeconomic sense
“We had previously expected the BoE to raise interest rates by 15bps to 25bps around the middle of next year, but we have now brought that expectation forward to this quarter as an early, modest tightening by the BoE seems appropriate. The signal it would send from an inflation expectations perspective is important.”
“However, market pricing that three-month money will rise to 1.25% by the end of next year looks stretched. Such a sharp rise in the bank rate could have serious implications for financing conditions for both corporates and households and could risk an abrupt end to the expansion. We are therefore not convinced that the current degree of tightening priced into markets is warranted.”
“We continue to forecast GBP appreciation versus USD. We project a move back into the 1.40s vs USD in coming months, with progress towards 1.50 throughout much of 2022.”
-
07:41
EUR/USD Price Analysis: 21-DMA support appears at risk amid bearish RSI
- EUR/USD is clinging onto the 21-DMA support, downside appears compelling.
- RSI inches lower below the midline, pointing to additional losses for the pair.
- 1.1700 remains a tough nut to crack for the EUR bulls, with all eyes on ECB.
EUR/USD is holding steady around 1.1600, lacking any bullish potential amid a broadly stronger US dollar.
The greenback resumes its Monday’s recovery rally, as the US Treasury yields pause their latest corrective pullback.
Mixed market sentiment, in the wake of growing inflation fears, strong American earnings reports and US stimulus progress, keeps the dollar’s safe-haven appeal underpinned.
The pair now awaits Thursday’s European Central Bank (ECB) monetary policy decision to break out of the recent 1.1570-1.1670 price range.
In the meantime, the divergent monetary policy outlooks between the Fed and the ECB could continue to undermine the euro.
Looking at EUR/USD’s daily chart, the bulls have been defending the critical short-term 21-Daily Moving Average (DMA) at 1.1600 since October 20.
Meanwhile, the upside attempts are guarded by the 1.1670 supply zone.
Now, with the 14-Day Relative Strength Index (RSI) edging lower below the midline, the major is likely to extend Monday’s sell-off towards the previous week’s low of 1.1571.
If the latter gives way, then the floors will open up towards the yearly troughs of 1.1524.
EUR/USD: Daily chart
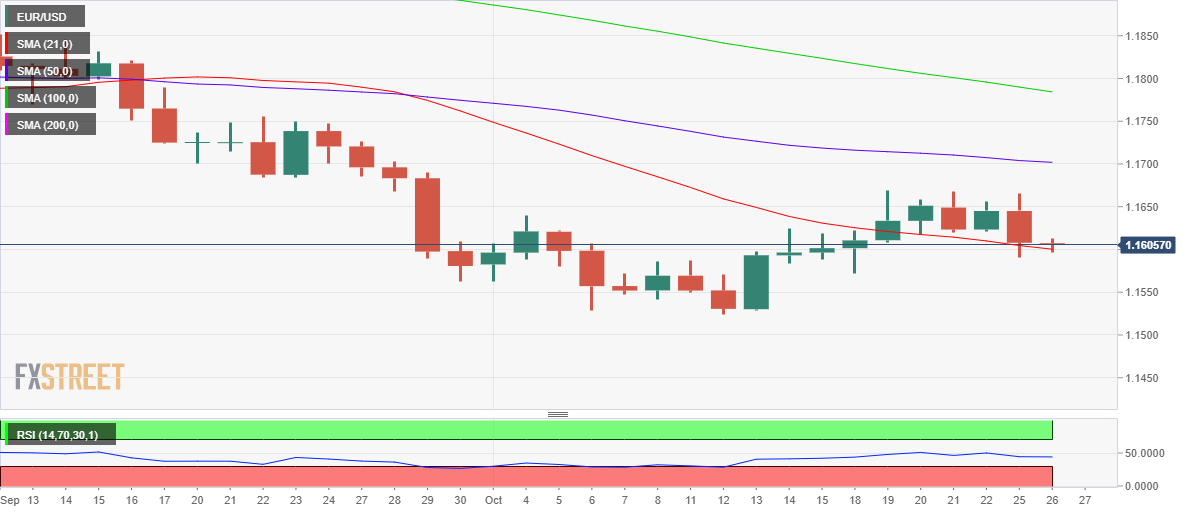
Alternatively, gold bulls await acceptance above the recent range highs near 1.1670, above which the 1.1700 threshold will come into play, where the mildly bearish 50-DMA hangs around.
The next stop for EUR buyers is seen at the 1.1750 psychological level.
EUR/USD: Additional levels to consider
-
07:35
EUR/GBP fails at the 0.8471 resistance, attention is on the 0.8239 2019 low – Commerzbank
EUR/GBP has failed at initial resistance and is under pressure. Karen Jones, Team Head FICC Technical Analysis Research at Commerzbank, expects the pair to pungle towards the 0.8239 2019 low.
Bearish bias while below 55-day moving average at 0.8532
“EUR/GBP has tested and failed at key nearby resistance at 0.8471, which represents the April 2021 low and the May 2019. This is negative price action, and while we hold below the 55-DMA at 0.8532 we stay negative for now.”
“Attention is on the 0.8239 2019 low and the 200-month ma lies at 0.8159.”
“The near-term bounce is viewed as corrective for now. EUR/GBP will need to regain the 55-DMA at 0.8532 in order to alleviate downside pressure and to challenge the 0.8659/73 highs since May.”
-
07:15
Forex Today: Dollar keeps firm footing, key events awaited
Here is what you need to know on Tuesday, October 26:
The greenback managed to outperform its European rivals on the back of rising US Treasury bond yields on Monday but stayed weak against risk-sensitive currencies. As investors gear up for this week's high-impact events, the dollar holds its ground. The market sentiment remains relatively upbeat ahead of New Home Sales and CB Consumer Confidence Index data from the US. Brexit talks are set to continue in London and the European Central Bank (ECB) will release the findings of its Bank Lending Survey.
Risk mood: The S&P 500 hit a new record high of 4,572 on Monday and risk flows continue to dominate financial markets early Tuesday with US stock index futures rising between 0.2% and 0.5%. US President Joe Biden signed an order to lift travel restrictions on China, India and many European countries on Monday. Moreover, Democrats are reportedly closing in on a deal on the spending bill, that will be worth between $1.5 and $2 trillion.
On a concerning note, coronavirus cases are on the rise again. China warned that the latest COVID-19 outbreak is likely to spread further and Russia reported a record-high number of 37,930 cases on Monday.
After failing to break above 1.7% last week, the benchmark 10-year US Treasury bond yield gained more than 1% during the day on Monday before closing flat around 1.65%, where it continues to move sideways on Tuesday.
EUR/USD lost nearly 40 pips on Monday as the latest data from Germany showed a deterioration in sentiment and Bundesbank revised its 2021 growth forecast lower. Currently, the pair is testing 1.1600.
GBP/USD is struggling to gain traction since David Frost, the British minister responsible for implementing the Brexit deal, said that the EU's proposal on the Northern Ireland protocol was not going "far enough" to free up trade in the region.
Despite the renewed USD strength, gold climbed above $1,800 on Monday and seems to have gone into a consolidation phase. The sharp upsurge witnessed in XAU/USD and XAU/GBP pairs suggests that investors moving away from European currencies are ramping up the demand for the precious metal.
USD/JPY is clinging to modest gains around 114.00 as the safe-haven JPY fails to attract investors in the current market atmosphere.
Cryptocurrencies: After staging a correction toward $60,000, Bitcoin started to edge higher on reports claiming that Mastercard is looking to offer crypto services to banks and merchants in its network. Ethereum continues to edge higher toward $4,400, where the all-time high is located.
-
07:11
FX option expiries for October 26 NY cut
FX option expiries for October 26 NY cut at 10:00 Eastern Time, via DTCC, can be found below.
- EUR/USD: EUR amounts
- 1.1600-10 1.5b
- 1.1700 272m
- 1.1720-30 849m
- GBP/USD: GBP amounts
- 1.3800 278m
- USD/JPY: USD amounts
- 113.55-60 626m
- 113.85-114.00 1b
- 114.20-25 500m
- 114.50 1.1b
- AUD/USD: AUD amounts
- 0.7400 772m
- USD/CAD: USD amounts
- 1.2300 370m
- 1.2400 1b
- 1.2500 258m
- 1.2550 651m
-
07:06
Gold Price Forecast: XAU/USD's strength beyond the $1,800 mark favours bullish traders
Gold regained positive traction on Monday and inched back closer to multi-week tops. As FXStreet’s Haresh Menghani notes, acceptance above 100/200-day SMAs favours XAU/USD bulls.
Pullback towards the $1,795-90 region seen as a buying opportunity
“Traders will take cues from Tuesday's US economic docket, featuring the releases of the Conference Board's Consumer Confidence Index, Richmond Manufacturing Index and New Home Sales. This, along with the US bond yields, will influence the USD price dynamics and provide some impetus to gold.”
“Repeated failures near the $1,812-14 intermediate hurdle warrant some caution before positioning for any further gains. Nevertheless, the bias remains tilted in favour of bullish traders and supports prospects for a move towards challenging the $1,832-34 heavy supply zone.”
“Any meaningful pullback towards the technically significant moving averages confluence resistance breakpoint, around the $1,795-90 region, should be seen as a buying opportunity. This, in turn, should help limit the downside near the $1,782-81 horizontal support. Some follow-through selling will negate the positive outlook and drag gold prices back towards the $1,760 support zone.”
-
07:00
EUR/GBP Price Analysis: Bearish RSI threatens move above 0.8430
- EUR/GBP consolidates on Tuesday in the early European trading hours.
- Additional gains for the pair if price decisively breaks 0.8440.
- The Momentum oscillator holds onto the oversold zone with an upward bias.
EUR/GBP trades cautiously on Tuesday in the European trading hours. The pair confided in a narrow trade band with no meaningful traction. At the time of writing, EUR/GBP is trading at 0.8432, down 0.02% for the day.
EUR/GBP daily chart
-637708246609746991.png)
On the daily chart, the EUR/GBP cross currency pair fell sharply after testing the high of 0.8658 on September 29, this also constituted a double top formation with a high made on July 21. A double top candlestick technical formation is a bearish pattern. Furthermore, the spot slipped below the 21-day Simple Moving Average (SMA) at 0.8567, which strengthened the case for the probable downside momentum. However, the price found shelter near the critical support near 0.8330.
If the price breaks above 0.8440, the immediate upside target would emerge at the 0.8465 horizontal resistance level. The Moving Average Convergence Divergence (MACD) holds onto the oversold zone. Any uptick in the MACD would intensify buying pressure toward the 21-day Simple Moving Average (SMA) at 0.8495.
A daily close above the psychological 0.8500 level would see the 0.8525 horizontal resistance level as the next upside target.
However, the Relative Strength Index (RSI) trades at 33, suggesting that the downside risks persist. If the price reverses direction, it could move back to Friday’s low of 0.8421. Next, on the horizon would be the February, 2020 low of 0.8282.EUR/GBP additional levels
-
06:56
Palladium Price Analysis: XPD/USD directs nearby resistance breakout towards 200-EMA
- Palladium picks up bids, extends previous day’s break of weekly resistance line.
- Bullish MACD, sustained trading above 61.8% Fibonacci retracement favor buyers.
Palladium (XPD/USD) remains on the front foot around $2,045, up 0.18% intraday during the early European session on Tuesday.
The precious metal crossed a downward sloping trend line from October 14 the previous day. The same joins upbeat MACD signals to keep buyers hopeful.
However, a clear upside break of the 200-EMA, around $2,070 by the press time, becomes necessary for the commodity bulls before challenging the monthly peak of $2,176.
During the rise, the $2,100 threshold will become an intermediate halt.
Meanwhile, pullback moves remain less important until staying beyond the previous resistance line, close to $2,025 at the latest.
Also acting as a downside filter is the $2,000 psychological magnet and 61.8% Fibonacci retracement of the early October advances, near $1,974.
Overall, palladium prices are likely to extend recovery moves but a bumpy road ahead challenge the buyers.
Palladium: Four-hour chart
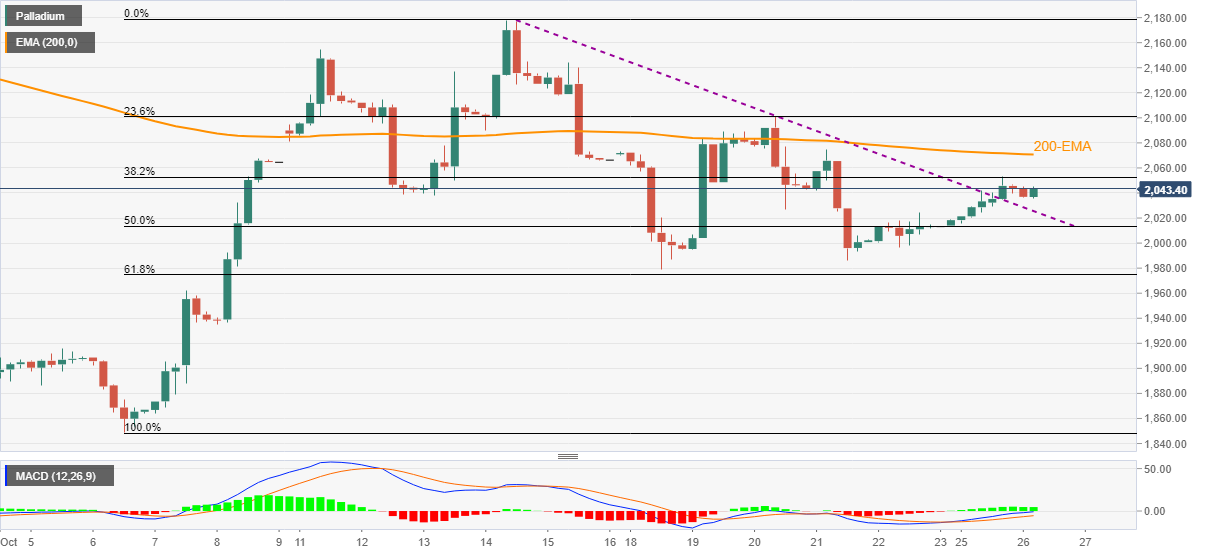
Trend: Further upside expected
-
06:56
USD/JPY now faces some consolidation – UOB
According to FX Strategists at UOB Group, USD/JPY is forecast to keep the consolidative mood well and sound for the time being and likely within the 113.20-114.70 range.
Key Quotes
24-hour view: “We highlighted yesterday that ‘the risk is still on the downside but any weakness is unlikely to break the major support at 113.20’. Our expectations did not materialize as USD traded between 113.45 and 113.90. Momentum indicators are turning flat and USD is likely to trade sideways for today, expected to be within a range of 113.55/114.00.”
Next 1-3 weeks: “There is no change in our view from last Friday (22 Oct, spot at 114.00). As highlighted, the recent USD strength has come to an end. The current movement is viewed as part of a consolidation phase and USD is likely to trade between 113.20 and 114.70 for now. Looking ahead, a clear break of 113.20 could trigger a sizeable pullback in USD.”
-
06:52
Natural Gas Futures: Further upside in the pipeline
Open interest in natural gas futures markets rose for the first time on Monday after six daily pullbacks in a row, this time by around 15.2K contracts. Volume followed suit and rose by around 150.5K contracts after five consecutive daily drops.
Natural Gas looks to 2021 highs near $6.50
Monday’s sharp advance in prices of natural gas was in tandem with increasing open interest and volume, which is indicative that further gains appear likely in the very near term. On this, natural gas now shift their focus of attention to the YTD highs near the $6.50 mark per MMBtu (October 6).
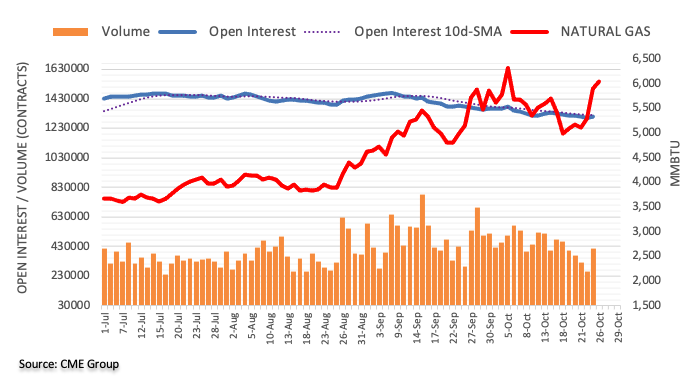
-
06:48
Germany’s IFO: Supply problems with the preliminary products impacting industry exports
Having unveiled a fourth consecutive fall in the German Business Confidence Index the previous day, the IFO says, per Reuters, “Supply problems with the preliminary products are now having impact on exports of industry.”
“German export expectations fell to 13 points in October from 20.5 points in September,” adds the IFO.
Fx implications
The news exerts additional downside pressure on the EUR/USD prices, down 0.06% intraday around 1.1600 by the press time. However, risk-on mood challenges the pair sellers.
Read: EUR/USD remains poised to extend losses below 1.1600 amid USD rebound
-
06:40
NZD/USD: Upside pressure loses vigour – UOB
The buying interest is seen fading if NZD/USD breaches the 0.7125 level in the short-term horizon, noted FX Strategists at UOB Group.
Key Quotes
24-hour view: “NZD traded between 0.7130 and 0.7177 yesterday, slightly narrower than our expected sideway-trading range of 0.7130/0.7180. Further sideway-trading would not be surprising even though the slightly firmed underlying tone suggests a higher range of 0.7140/0.7185.”
Next 1-3 weeks: “We continue to hold the same view from last Friday (22 Oct, spot at 0.7160). As highlighted, upward momentum is beginning to wane and a break of 0.7125 (no change in ‘strong support’ level) would indicate that the NZD strength that started more than a week ago has run its course. In order to rejuvenate the flagging momentum, NZD has to move and stay above 0.7180 within these 1 to 2 days or a break of 0.7125 would not be surprising.”
-
06:35
Crude Oil Futures: A sustainable pullback looks unlikely
CME Group’s flash data for crude oil futures markets noted traders trimmed their open interest positions for the third consecutive session on Monday, now by around 13.6K contracts. On the other hand, volume went up for the third straight session, this time by around 234.7K contracts.
WTI now looks to $86.00
Crude oil prices started the week on the defensive despite hitting fresh cycle highs past the $85.00 mark per barrel. The uptick, however, was on the back of shrinking open interest, indicative that a deeper/convincing pullback appears out of favour for the time being. Against this, the WTI continues to target the round level at the $86.00 mark in the near term.

-
06:30
USD/JPY Price Analysis: Upside needs validation above 114.00 along with ascending trendline
- USD/JPY extends the previous session’s gains on Tuesday in the European session.
- The ascending trendline from the lows of 109.21 acts as a defensive for the bulls.
- The Momentum oscillator holds onto the overbought zone warrants caution for the pair.
USD/JPY picks up the momentum in the European trading hours. The pair opened lower but recovered swiftly to touch intraday high at 113.97, where it currently hovers.
USD/JPY daily chart
-637708229554695370.png)
On the daily chart, the USD/JPY pair has been riding higher after testing the low of 109.12 on September 22. The pair rallied toward a four-year high at 114.69 on Wednesday. The pair retreated toward the low of 113.45 in a span of three days, before bouncing back to near 114.00.
If the price breaks above 114.00 then the USD/JPY bulls could advance toward the 114.50 horizontal resistance level. Further, a daily close above the mentioned level could bring March, 2017 highs of 115.50 back into the picture.
Alternatively, a decisive break of the ascending trendline from the lows of 109.12, would seek the 113.50 horizontal support level, followed by the low made on October, 12 at 113.00. Any downtick in the overbought Moving Average Convergence Divergence (MACD) could bring more selling opportunities toward the 112.50 horizontal support level.
USD/JPY additional levels
-
06:21
Citibank cuts 2022 global GDP growth forecast to 4.2% from 4.4%
Citibank cuts 2022 global GDP growth forecast to 4.2% from 4.4%.
More to come....
-
06:20
GBP/USD sticks to the range bound theme – UOB
In opinion of FX Strategists at UOB Group, GBP/USD should keep navigating between 1.3690 and 1.3840 for the next weeks.
Key Quotes
24-hour view: “Our expectations for ‘the rapid decline in GBP to extend’ did not materialize as it traded in a relatively quiet manner between 1.3742 and 1.3790 before closing largely unchanged at 1.3768 (+0.09%). The underlying tone still appears to be a tad soft and GBP could drift lower from here. However, a clear break of 1.3725 is unlikely. Resistance is at 1.3790 followed by 1.3810.”
Next 1-3 weeks: “There is no change in our view from yesterday (25 Oct, spot at 1.3755). As highlighted, the recent GBP strength has come to an end. The current movement is viewed as part of a consolidation phase and GBP is likely to trade between 1.3690 and 1.3840.”
-
06:17
US inflation expectations jump to 15-year high, confirm Fed Chair Powell’s view
US inflation expectations, as measured by the 10-year breakeven inflation rate per the St. Louis Federal Reserve (FRED) data jumped to the highest levels last seen during August 2006 by the end of Monday’s North American trading.
In doing so, the risk barometer extends recovery moves from late September while flashing the 2.66% mark at the latest.
The same favors US Treasury yields to stay firmer despite risk-on mood. The reason could be linked to Friday’s speech from Federal Reserve (Fed) Chair Jerome Powell. “"Risks are clearly to longer, more persistent bottlenecks, and thus to higher inflation,” said the policymakers per Reuters.
It’s worth noting that the US dollar witnessed a rally in the past when the US 10-year Treasury yields crossed the 1.70% mark.
That said, the US Dollar Index (DXY) keeps the previous day’s rebound from monthly low, up 0.07% intraday around 93.90 at the latest.
Given the firmer expectations, the Fed tapering concerns elevate and hence Thursday’s preliminary US GDP for the third quarter (Q3) becomes all the more important.
-
06:16
Gold Futures: Extra gains appear on the cards
Open interest in gold futures markets increased for the second session in a row on Monday, this time by around 10.1K contracts considering preliminary readings from CME Group. In the same line, volume shrank by nearly 166K contracts, partially reversing the previous build.
Gold now targets the $1,830 region
Monday’s decent advance in prices of the precious metal was on the back of rising open interest, opening the door to the continuation of the recovery at least in the very near term. That said, if gold breaks above Monday’s top around $1,813 it could expose a move to the key resistance area near $1,830 per ounce troy (July/August/September highs).
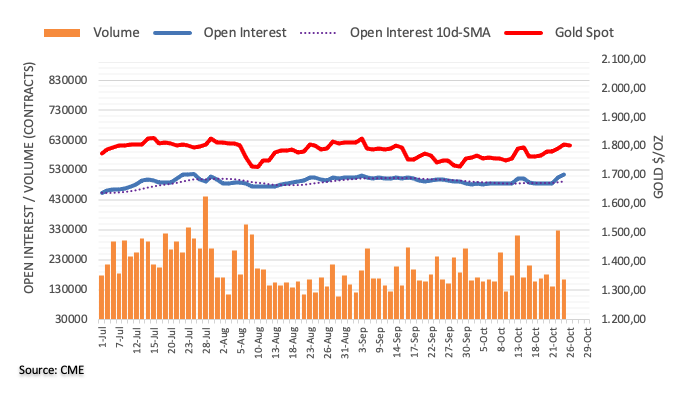
-
06:03
EUR/USD now seen within the 1.1555-1.1670 range – UOB
FX Strategists at UOB Group noted EUR/USD now moved into a consolidative phase, likely between 1.1555 and 1.1670 in the next weeks.
Key Quotes
24-hour view: “Our view for EUR to ‘trade sideways’ yesterday was incorrect as it plummeted to 1.1589 before closing on a soft note at 1.1606 (-0.35%). Despite the decline, downward momentum has not improved by all that much. That said, EUR could dip to 1.1580 first before a rebound can be expected. For today, the major support at 1.1555 is not expected to come into the picture. Resistance is at 1.1630 followed by 1.1645.”
Next 1-3 weeks: “We have expected a higher EUR for more than a week now. After rising to a high of 1.1669, EUR struggled to extend its gains. Last Friday (22 Oct, spot at 1.1625), we highlighted that upward momentum has eased and a break of the ‘strong support’ at 1.1590 would indicate that 1.1680 is out of reach this time round. EUR dropped to 1.1589 yesterday (25 Oct) and despite the slight breach of the ‘strong support’, upward momentum has more or less dissipated. In other words, EUR strength has run its course. EUR has likely moved into a consolidation phase and is expected to trade between 1.1555 and 1.5670 for now.”
-
06:00
Singapore Industrial Production (YoY) came in at -3.4% below forecasts (-0.5%) in September
-
06:00
Singapore Industrial Production (MoM) registered at -2.8%, below expectations (0.3%) in September
-
05:59
Asian Stock Market: Nikkei outshines, China dwindles amid a sluggish day
- Asian shares trade mixed as China real-estate pokes bulls.
- Climate change talks fail to entertain traders, stimulus hopes join Sino-American headlines to portray mild optimism.
- Dow, S&P 500 refreshed record tops on earnings optimism, Tesla news.
Asia-Pacific equities struggle to track the S&P 500 Futures as European traders brace for Tuesday’s bell.
Although the US-China diplomatic talks and earnings optimism joins the optimism at Wall Street to keep the buyers hopeful, fears relating to the Beijing-based property shares and steady US Treasury yields challenge the bulls.
Amid these plays, MSCI’s index of Asia-Pacific shares outside Japan rise 0.16% whereas Japan’s Nikkie jumps near 2.0% at the latest. Optimism in Tokyo could be linked to the easing of virus-led restrictions after 11 months of tighter activity controls, as well as hopes of further stimulus to overcome the pandemic-led economic hardships.
Elsewhere, Australia’s ASX 200 and New Zealand’s NZX 50 remain lackluster amid indecision in China, as well as fears that the climate controls may escalate the inflation pressure and push policymakers towards tapering and rate hikes. “China has said it will roll out a pilot real estate tax in some regions, adding to existing investor concerns about real estate in the mainland,” said Reuters in this regard.
It’s worth noting that receding covid fears in India and Indonesia helps their respective equity markets whereas the S&P 500 Futures refresh record tops following the Wall Street benchmarks. That being said, Dow and S&P 500 renewed all-time high on Monday as US policymakers, including President Joe Biden, backed expectations. Also fueling the American equities was Tesla’s stellar performance and a firmer start to the earnings season.
Against this backdrop, US 10-year Treasury yields pause after a two-day downtrend while the US Dollar Index (DXY) extends the previous day’s rebound from the monthly low.
Given the mixed performance and wait for the US Q3 GDP, Asian traders should track Wall Street and earnings calendar for fresh impulse.
Read: S&P 500 Future track Wall Street gains to refresh record top, ignore US Treasury yields
-
05:52
USD/TRY Price Analysis: Bulls keep eyes on 9.7000 above 21-day SMA
- USD/TRY shrugs off the previous day’s decline on Tuesday.
- The cross-currency pair peaked all time high at 9.8505 before retreating toward 9.5418.
- The receding momentum oscillator warns caution before placing aggressive bids.
USD/TRY edges higher in the early European session on Friday. The cross-currency pair peaked at an all time high around 9.8595 in the previous session. The pair confides in a very narrow trade band with an upward bias. At the time of writing, USD/TRY is trading at 9.6050, up 0.25% for the day.
USD/TRY daily chart
-637708205842232176.png)
On the daily chart, the USD/TRY cross-currency pair has been in the upside momentum since September, 7. The pair peaked to an all time high on Monday at 9.8505, after forming a strong bullish candle on Thursday. USD/TRY bulls are not ready to give up any time soon.
If the price sustains the session’s high it could again test the 9.8000 horizontal resistance level and then keep an eye on the 10.000 mark.
Alternatively, if the price reverses direction, it could first test the previous session’s low at 9.5418, followed by the 9.4000 horizontal support zone. The Moving Average Convergence Divergence (MACD) indicator holds onto the overbought zone with stretched buying conditions. Any downtick in the MACD could bring Thursday’s low at 9.2098 back into action. A break below 9.2000, the bears would seek the 9.0000 horizontal support zone.
-
05:44
RBNZ’s Orr: Current price increases are proving more persistent
There could be a prolonged period of faster inflation that requires a monetary policy response, courtesy of climate change, Reserve Bank of New Zealand (RBNZ) Governor Adrian Orr warned at a virtual press briefing Tuesday in Wellington after the central bank released a report on climate change.
Key quotes
“Some of the price pressures we will see will lead to quite sustained, higher generalized prices.”
“We’re already seeing that in food prices globally and energy prices, transport, at present.”
“We will have to look through some very obvious price shocks but to the extent that they are persistent and truly changing the price of the basket of goods and services we consume, then there will be monetary policy reactions.”
“We’ve all talked about them, we all knew they were coming, we all said they may be temporary.”
“Now the general discussion is wow, these are persistent. Imagine that continuing now for the next 20-plus years. That is the world that we will be living in.”
Market reaction
NZD/USD is little affected by Orr’s comments, keeping its range around 0.7170, up 0.16% on the day.
-
Tesla’s Musk and Twitter’s Dorsey warn over rising inflationary pressures
-
-
05:31
USD/INR Price News: Rupee bears poke 75.00 with eyes on India cabinet meeting
- USD/INR prints a four-day uptrend, remains sidelined of late.
- India reports lower active coronavirus cases in eight months.
- PM Modi to chair meeting of cabinet committee on investment and growth.
- US dollar stays firmer despite risk-on mood, sluggish Treasury yields.
USD/INR defends the 75.00 threshold during the fourth day of advances heading into Tuesday’s European session. In doing so, the Indian rupee (INR) pair tracks the US dollar gains while paying a little heed to the recent positive catalysts from India ahead of the key cabinet meeting.
As per the latest updates from an anonymous Indian official, shared by Reuters, “India Prime Minister (Narendra Modi) to chair meeting of the cabinet committee on investment and growth at 10:30 am today (India time).” The details suggest that India Finance Minister, Commerce Minister, Niti Aayog CEO be part of the cabinet panel meeting.
It should be observed that the nation’s fundamentals have recently been improving amid a strong vaccination drive. The same weighs on the on covid infections and allowed the Reserve Bank of India (RBI) to stay optimistic during the latest monetary policy meeting.
However, a jump in the energy prices and inflation fears have been spotted of late, which in turn could push policymakers towards any major decision ahead of the festival season.
That being said, India’s active coronavirus cases fall to the lowest since February 27, per Reuters. Further information hints at the 356 covid fatalities versus 443 reported yesterday whereas 12,428 daily run-up in cases, the lowest since March 02, compared to 14,306 reported the previous day.
On the other hand, US Dollar Index (DXY) keeps the previous day’s rebound from a monthly low, up 0.06% intraday around 93.90 by the press time. The greenback gauge seems to portray the market’s cautious mood ahead of the all-important US advance GDP release for the third quarter (Q3), up for publishing on Thursday.
Looking forward, risk catalysts are likely to entertain the USD/INR traders, mostly keeping the bullish impulse ahead of the US GDP data.
Technical analysis
A clear upside break of a two-week-old descending resistance line, now support around 74.98, keeps USD/INR buyers hopeful.
-
04:59
USD/CAD Price Analysis: Pressured towards 1.3750 inside rising wedge
- USD/CAD pulls back from weekly top inside bearish chart pattern.
- Descending RSI line directs intraday sellers towards 200-HMA.
- Last weekly high, 61.8% Fibonacci retracement challenge short-term upside.
USD/CAD fails to extend the previous day’s rebound while taking offers around 1.2375, down 0.08% intraday ahead of Tuesday’s European session.
The Loonie pair’s pullback portrays a bearish chart pattern, namely rising wedge, on the hourly play. The same joins downward sloping RSI line to highlight the 200-HMA level of 1.2362 as immediate support.
However, the quote’s weakness past 1.2362 needs validation from the stated wedge’s support line, near 1.2355 by the press time, a break of which will direct the USD/CAD bears towards the monthly low of 1.2288 before pressuring the prices towards late June’s low of 1.2252.
Alternatively, recovery moves remain less important below the wedge’s resistance line, close to the 1.2400 threshold at the latest.
Also challenging the short-term USD/CAD recovery is the October 18 top of 1.2410 and 61.8% Fibonacci retracement of October 12-21 declines, near 1.2420.
Overall, USD/CAD remains on the back foot and hence confirmation of the rising wedge will add strength to the bearish impulse.
USD/CAD: Hourly chart
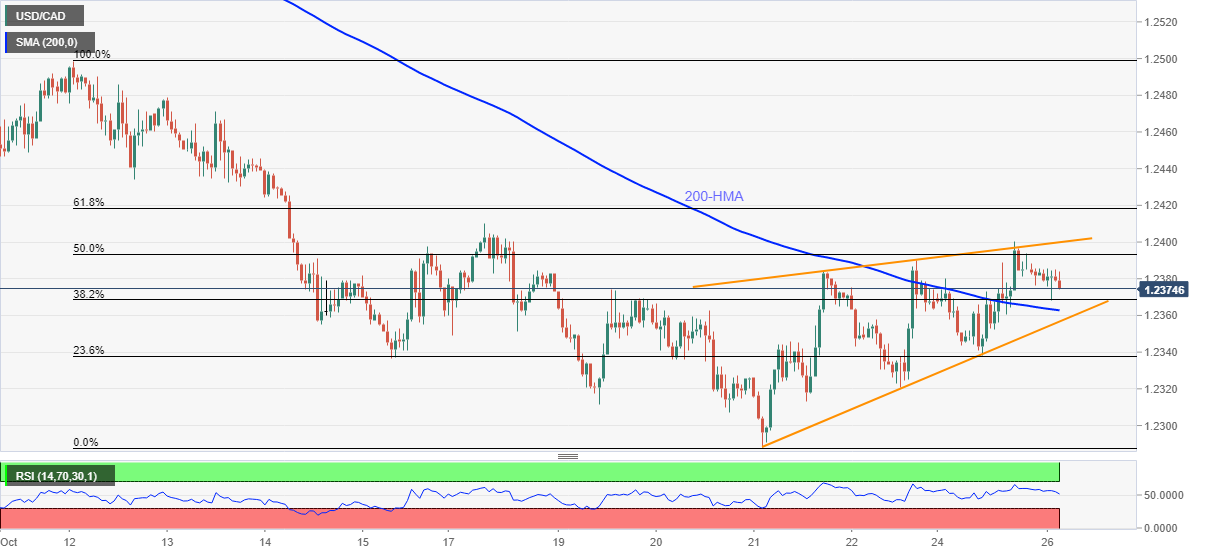
Trend: Further weakness expected
-
04:57
GBP/USD hovers around 1.3750, Brexit talks in London eyed
- GBP/USD struggles for clear direction, fails to extend Monday’s rebound.
- UK’s Brexit Minister Frost says EU’s NI proposal not enough, gives December deadline to solve the row.
- Market sentiment improves on stimulus hopes, US-China headlines but US dollar remains firmer, covid woes escalate in Britain.
- Brexit chatters in London, second-tier US data eyed for fresh impulse, US Q3 GDP will be the key.
GBP/USD stays defensive around 1.3765 heading into Tuesday’s London open. In doing so, the cable pair fades the previous day’s positive performance, the first in three, amid a cautious mood ahead of the key Brexit talks in the UK.
UK Brexit Minister David Frost conveyed his dissatisfaction from the latest Brexit talks and the European Union’s (EU) fresh proposal to overcome the Northern Ireland (NI) border issues to a parliamentary committee on Monday, per Bloomberg. On the other hand, Sky News reports, “The EU's current proposals to reform the Northern Ireland Protocol ‘don't go far enough’, the UK's Brexit minister has said, as he set a December deadline for the two sides to find a solution.”
On a different page, fears of faster virus mutations in the UK and the latest jump in the covid cases also weigh on the GBP/USD prices. “UK has seen close to 40,000 new cases per day for the last 4 days. UK health secretary has warned people of not letting their guard down as there could be 100,000 COVID cases per day as the country heads into the winter season,” said CNBC.
Elsewhere, upbeat sentiment probes the lackluster US Treasury yields but the US Dollar Index (DXY) remains firm, extending the previous day’s rebound from the monthly low. The reason could be linked to the hawkish Fedspeak and expectations of a firmer US Q3 GDP print backing the Fed taper tantrums.
Amid these plays, the US 10-year Treasury yields remain indecisive around 1.64% after a two-day downtrend whereas the stock futures print mild gains to refresh record tops.
Looking forward, a group of EU diplomats are up for visiting London on Tuesday, making the Brexit headlines more important for the GBP/USD traders. Given the lesser likelihood of a positive outcome, amid the US dollar strength, the cable pair may remain pressured and can look to the second-tier US data, like Consumer Confidence and housing numbers, for fresh impulse.
Technical analysis
Given the GBP/USD pair’s inability to cross the 100-DMA and 200-DMA, coupled with the steady RSI, the quote is likely to retest the previous resistance line around 1.3740-35. Also adding to the support’s strength is an ascending trend line from September 30.
-
04:55
Japan’s Yamagiwa: Urgent proposal will include economic stimulus for pandemic-hit society
Japan’s Economy Minister Daishiro Yamagiwa said on Tuesday, an urgent proposal will include economic stimulus for pandemic-hit people and sectors as well as a budget for innovation in post-covid society.
developing story ...
-
04:31
Tesla’s Musk and Twitter’s Dorsey warn over rising inflationary pressures
Amid growing concerns over elevated inflation and its impact on the post-pandemic economic recovery, the latest warnings from America’s billionaire entrepreneurs are adding to the policymakers’ misery while aggravating the investors’ concerns.
Tesla Inc.’s founder Elon Musk, in a Twitter response, said, “I don’t know about long-term, but short-term we are seeing strong inflationary pressure.”
Meanwhile, Twitter CEO Jack Dorsey predicted that the US could soon be hit by " hyperinflation " and warned that it "is going change everything".
These comments come after Fed Chairman Jerome Powell said last Friday that inflation pressures "are likely to last longer than previously expected", and could last "well into next year".
Market implications
The US Treasury yields are looking to stabilize after the two-day correction, with the benchmark 10-year rates hovering around 1.64%.
The S&P 500 futures gain 0.25% on the day, riding higher on a record Wall Street close amid stronger earnings reports. Meanwhile, the US dollar index is resuming its upbeat momentum, closing in on the 94.00 level once again.
-
04:31
EUR/USD remains poised to extend losses below 1.1600 amid USD rebound
- EUR/USD reverses the initial gains on Tuesday in the Asian trading hours.
- US Dollar Index trades at 93.90 following an uptick in the US T-bond yields.
- US-China optimism, pre-major central banks volatility supports the greenback.
EUR/USD remains subdued in the Asian session on Tuesday. The pair continued to move in a narrow trade band of 1.1600 and 1.1670 for the past week. At the time of writing, EUR/USD is trading at 1.1599, down 0.06% for the day.
The greenback trades near 94.00, tracking higher US 10-year benchmark Treasury yields. Investors cheered the positive talks between China’s Vice Premier Liu He and US Treasury Secretary Janet Yellen, as they discussed bilateral relations and macroeconomic situation. In addition to that, Investors are bracing up for Fed’s tapering and a delayed rate hike expectation.The shared currency remained under pressure owing to a number of factors. The European Central Bank (ECB) Governor Council member and Spanish central bank chief Pablo Hernandez de Cos remained concerned about the economic recovery pace due to supply-chain issues and rising raw material prices.
In addition to that, the German October IFO Survey suggested that the Business Climate contracted by more than anticipated to 97.7. Also, the Bundesbank monthly report showed that the full-year growth in 2021 was likely to be significantly lower than the June forecast of 3.7%.
Furthermore, the five-year forward inflation swap, a key market gauge of Eurozone inflation, jumped 10-basis points to 2.0528%, the highest since 2014 and above the ECB’s inflation target of 2%. Traders assessed the reading could alter the current dovish EBC’s stance in the monetary policy meeting due on Thursday.
As for now, traders are waiting for the ECB Bank Lending Survey, German Gfk Consumer Confidence, US Housing Price Index, and Consumer Confidence to take fresh trading impetus.
EUR/USD additional levels
-
03:39
US Treasury: Yellen 'frankly raised issues of concern' in call with China’s Liu
US Treasury Secretary Janet Yellen and Chinese Vice Premier Liu discussed macroeconomic and financial developments in the US and Sino-America, the US Treasury confirmed in a statement on Tuesday.
US Treasury Secretary Yellen "frankly raised issues of concern" in a virtual meeting on Monday with Chinese Vice Premier Liu He, the statement said.
The Treasury, however, did not throw any hints on the concerns discussed during their virtual call.
Related reads
- China’s Vice-Premier Liu, US Treasury Sec Yellen discussed bilateral and global cooperation
- AUD/USD: Bulls testing 0.7500 ahead of Australian CPI
-
03:30
USD/JPY: Rally unlikely to continue beyond 116.00 – Goldman Sachs
Analysts at Goldman Sachs believe USD/JPY is unlikely to advance beyond 116.00 amid ongoing expectations of tighter monetary policy globally.
Key quotes
"Looking ahead, given the relatively more aggressive policy expectations now priced across the G10, we see a higher bar for the USD/JPY rally to continue much further. “
“On our models, if the market were to pull forward the Fed hiking cycle- akin to the recent shift in BoE pricing-it could push USD/JPY up to 116, but the further upside would likely require a move higher in the market's view of the terminal rate.”
“For this reason, investors might consider expressing yen downside views in EUR/JPY instead, where our rates strategists see a case for a steeper 2s5s.”
-
03:22
USD/CNH prints four-day downtrend near $6.3800 on Sino-American, PBOC news
- USD/CNH remains pressured around weekly bottom, fades bounce off intraday low.
- US-China talks highlight the need for communication and coordination on macroeconomic policies.
- PBOC injects 190 billion yuan for the second consecutive day.
- Market sentiment cheers equity rally, stimulus hopes ahead of the key data/events.
USD/CNH stays on the back foot for the fourth day in a row during early Tuesday. In doing so, the offshore Chinese currency (CNH) pair benefits from the risk-on mood while also relying on the news concerning the Sino-American dialogues and the People’s Bank of China’s (PBOC) moves.
Early Tuesday in Asia, China's Vice Premier Liu He spoke with US Treasury Secretary Janet Yellen via video call and talked about the macroeconomic situation and bilateral relations, according to a readout from China's commerce ministry shares by Reuters. The news quotes the readout saying, “Both sides said it was important for the two countries to strengthen communication and coordination on macroeconomic policies,” to print fruitful discussions.
Further, the PBOC injects 200 billion yuan into the banking system via seven-day reverse repo on Tuesday when the 10 billion yuan worth of reverse repo contracts expire, suggesting a net 190 billion yuan of liquidity injection. This becomes the second straight day when the Chinese central bank intervened in the markets to keep them liquid.
Elsewhere, firmer prints of the US equity indices joined the resumption of a few cites by China’s Evergande to keep the markets optimistic. It should be noted that S&P 500 Futures refresh record top and the US 10-year Treasury yields pause two-day downtrend by the press time, helping the DXY to keep the previous day’s rebound from the monthly low.
However, hawkish Fedspeak before the blackout period and caution before the advance reading of the US Q3 GDP probe the market bulls, also challenging the USD/CNH bears.
Moving on, USD/CNH traders should pay attention to further qualitative headlines ahead of the US GDP data for fresh direction. Given the risk-on mood and the US dollar’s failure to stay strong, the Chinese currency pair seems to target the yearly low of late.
Technical analysis
Unless crossing the previous support line from mid-July, around $6.3980 by the press time, USD/CNH traders remain directed towards the yearly low of $6.3524.
-
03:12
China’s Commerce Ministry: Vice-Premier Liu, US Treasury Sec Yellen discussed bilateral and global cooperation
China's Commerce Ministry said in a statement on Tuesday, the country’s Vice Premier Liu He spoke with US Treasury Secretary Janet Yellen on October 26.
Key quotes
Discussion centred on the economy, and both bilateral and global cooperation.
US and China having coordination on policy are important.
Will strengthen coordination on macroeconomic policies.
China also expressed its concerns over US tariffs and the fair treatment of Chinese companies.
Market reaction
Amidst US-China talks, AUD/USD is paring back gains, as it slips back below 0.7500. At the time of writing, the aussie is trading at 0.7497, up 0.09% on the day.
-
03:03
AUD/USD pierces 0.7500 as market sentiment improves
- AUD/USD extends previous day’s rebound, refreshes weekly high.
- S&P 500 Futures renew all-time peak ignoring rebound in US Treasury yields.
- US-China talks add to the equity-led market optimism.
- Aussie Q3 inflation, US Q3 GDP become the key data to watch.
AUD/USD portrays risk-on mood amid a sluggish Tuesday morning, up 0.10% on a day around the intraday top of 0.7512. While the Sino-American talks of cooperation seem to be the latest catalyst behind the pair’s run-up, firmer prints of the US equity indices join firmer commodities to please the quote buyers during the crucial week.
“China's Vice Premier Liu He spoke with US Treasury Secretary Janet Yellen on October 26 via video call and talked about the macroeconomic situation and bilateral relations, according to a readout from China's commerce ministry,” said Reuters. The news quotes the readout saying, “Both sides said it was important for the two countries to strengthen communication and coordination on macroeconomic policies,” to print fruitful discussions.
It’s worth noting that China’s failures to match the phase one deal obligation previously challenged the trade relations between the world’s top two economies.
On a different page, recovery in China’s Evergande and the People’s Bank of China’s (PBOC) sustained liquidity injection also keep AUD/USD pair buyers hopeful.
Furthermore, global equity run-up and firmer commodity prices, despite the recent rebound in the US Treasury yields and the US Dollar Index (DXY), underpin the quote’s upside momentum.
Earlier in the day, Australia’s Roy Morgan Business Confidence data jumped the most in 2021. That said, the figures rose 10.7 points to 115.3 for October 2021. On the other hand, Dallas Fed Manufacturing Business Index rose past market consensus and prior readings in October but the Chicago Fed National Activity Index turned negative, -0.13 versus +0.05 previous readouts.
Against this backdrop, S&P 500 Futures refresh record top and the US 10-year Treasury yields pause two-day downtrend, helping the DXY to keep the previous day’s rebound from the monthly low.
Looking forward, AUD/USD traders will keep their eyes on Australia’s Q3 Consumer Price Index (CPI) for fresh impulse, expected 3.1% YoY versus 3.8% prior. However, major attention will be given to Thursday’s advance reading of US Q3 GDP and risk catalysts amid Fed tapering concerns and US stimulus chatters.
Technical analysis
Despite the latest uptick, the AUD/USD stays inside nearly a 65-pip trading range above 0.7450 since late Thursday, grinding higher close to July’s peak. The pair’s latest rebound from the monthly support also gains strength from the 10-DMA around 0.7440, suggesting further advances until the quote drops past 0.7440 support convergence. Meanwhile, an upside clearance of 0.7515 will aim for 0.7550 and July’s peak of 0.7600.
-
02:59
USD/INR Price News: Indian Rupee bulls making headway on potential flag breakout
- USD/INR bulls breaking the flag resistance on a daily basis.
- Above 0.7440, the bias remains bullish as US dollar firms.
As illustrated in analysis at the start of the week, USD/INR was contained in a flag pattern as it moved towards the support area as marked an eclipse. However, we are starting to see signs of a breakout and the following is an analysis of the US yields and dollar supporting a bullish bias for the week ahead.
USD/INR daily charts
Before...
-637707234615053772.png)
After...
-637708102222957178.png)
On the downside, however, the price would still need to break below 0.7440.
DXY daily charts
It was explained that the US dollar was meeting a critical support structure which would be expected to hold and potentially lead to a break back towards 94.50.
Before...
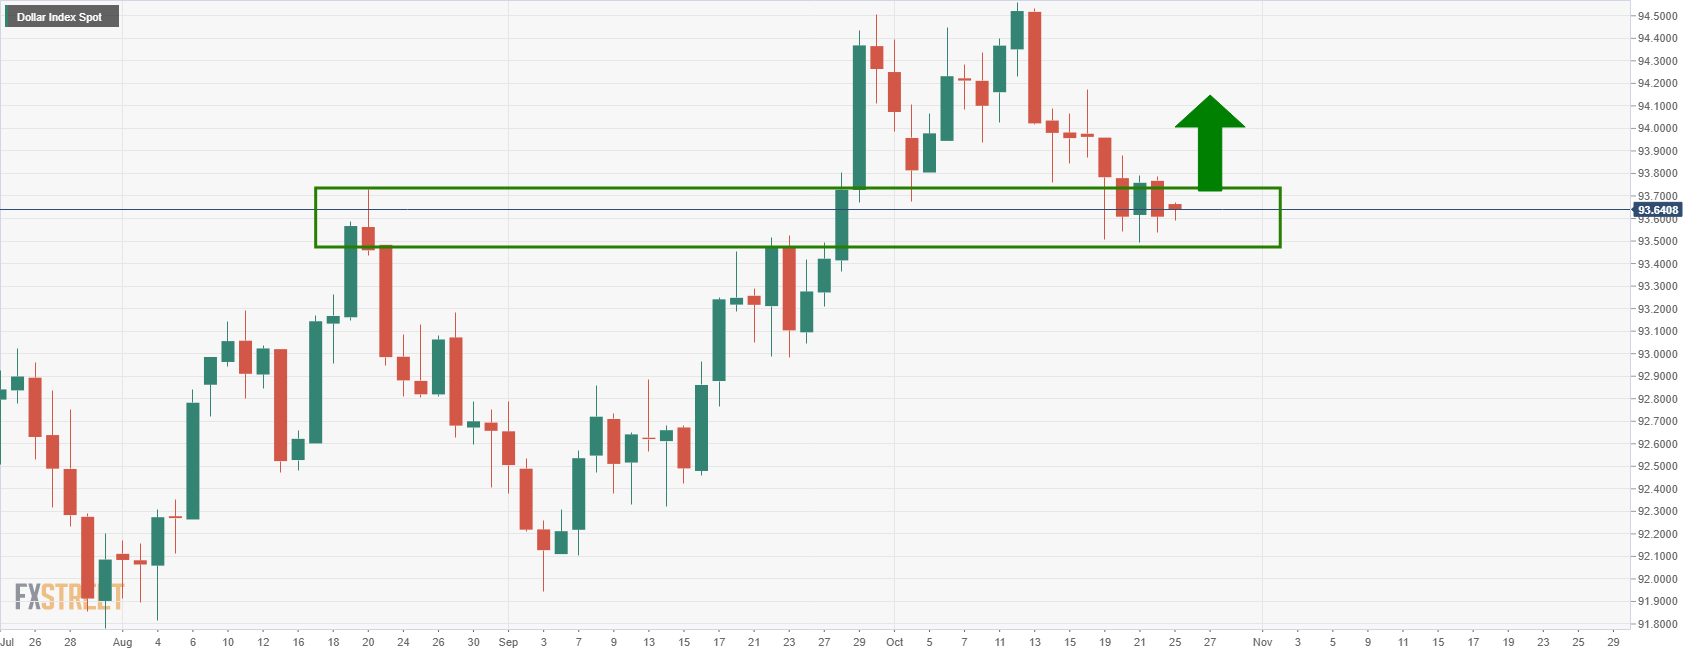
After...
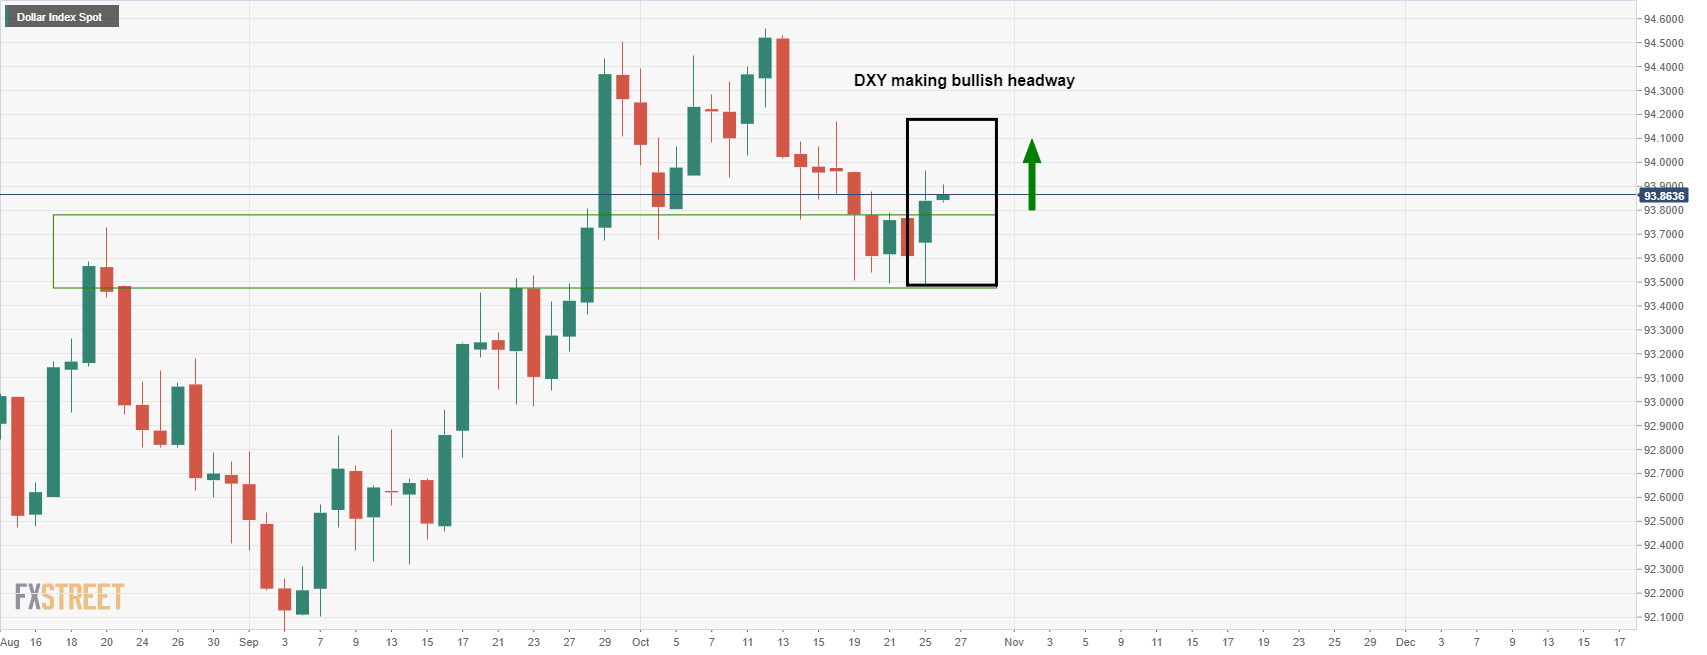
It was also explained that a move higher would be more probable should the US yields continue to climb in the current bullish form of late as follows:Before...
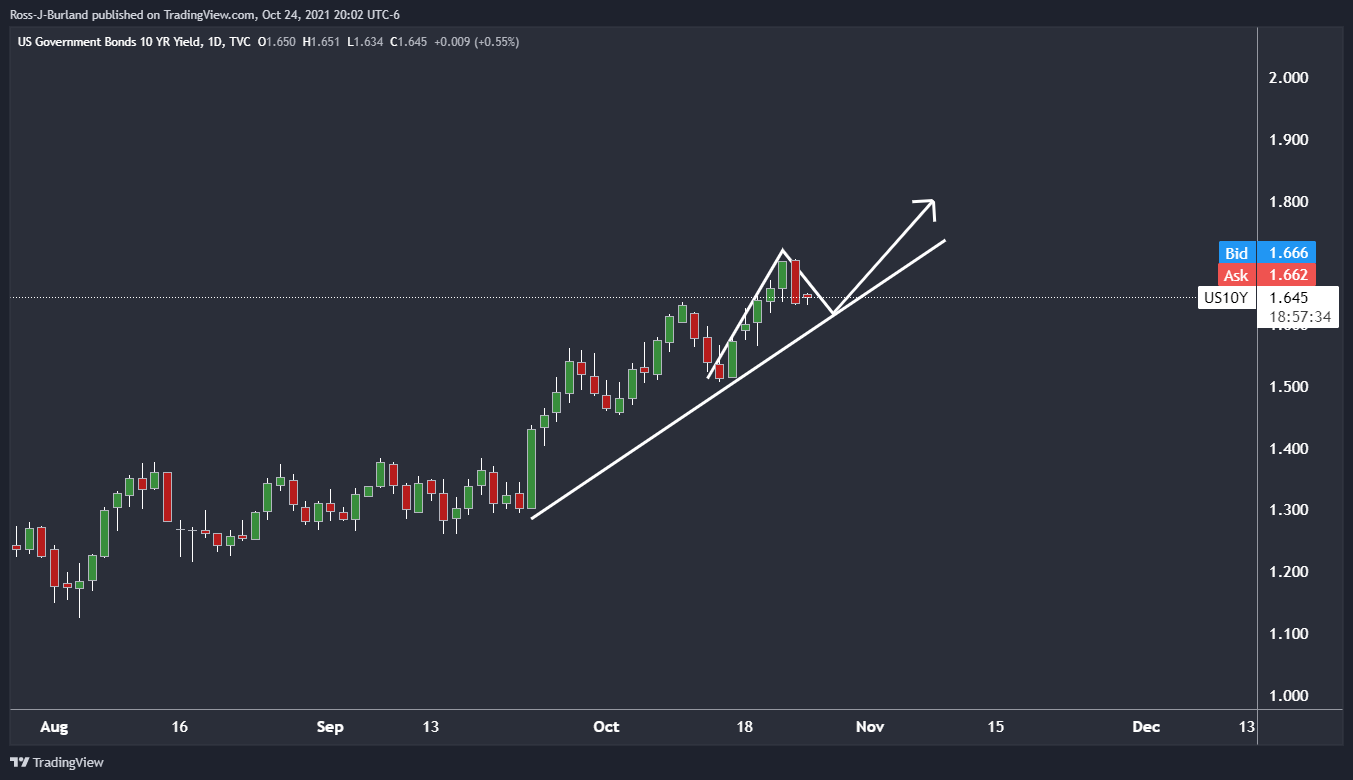
The US 10-year yield continues to climb in a classic impulse, correction, impulse shape and the current dynamic trendline support have been closed in upon, so this lead to the next bullish impulse:
After...
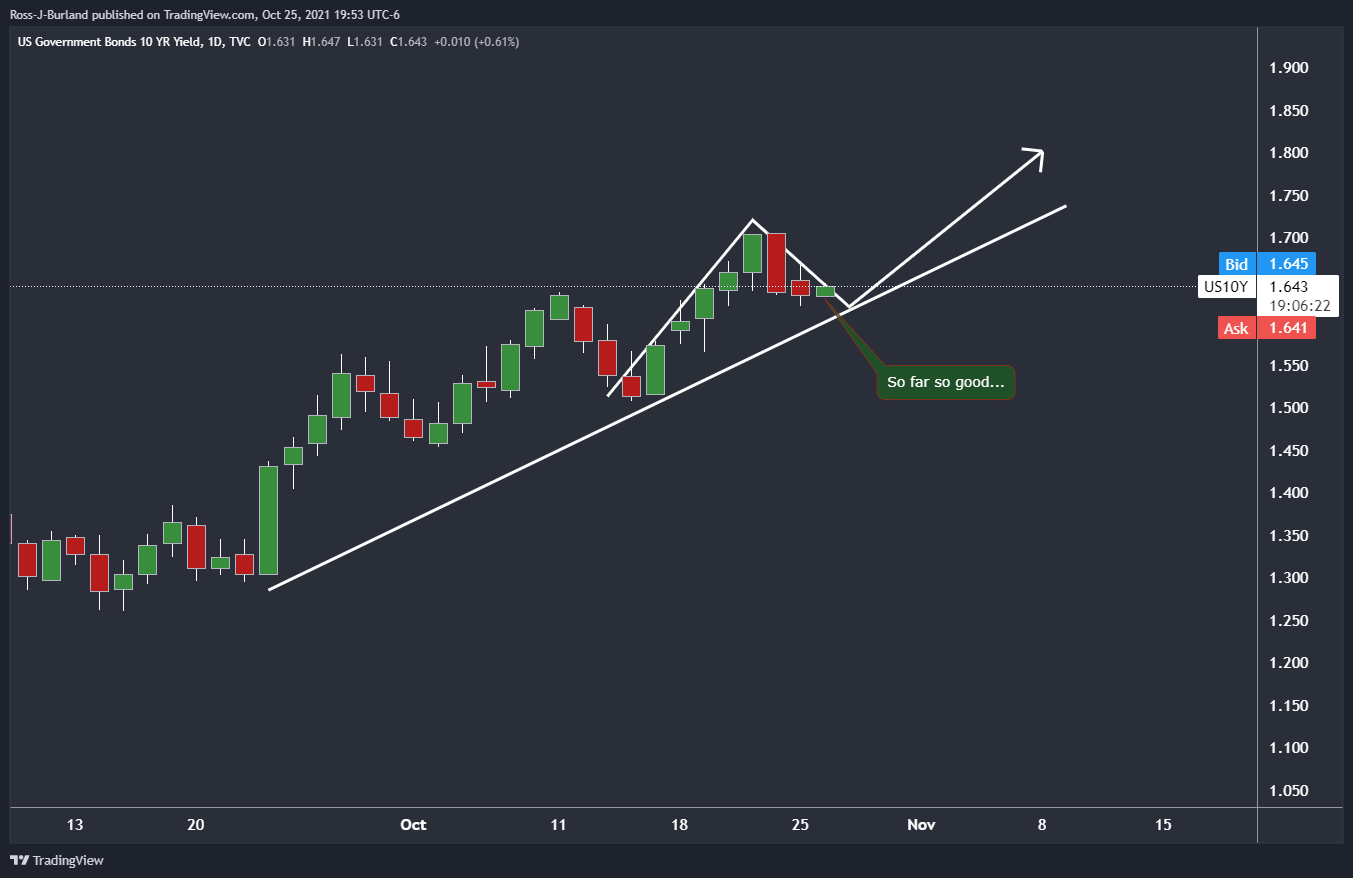
-
02:36
NZD/USD Price Analysis: Bulls testing descending triangle to aim for 0.7200
- NZD/USD refreshes intraday low, teasing confirmation of a bullish chart pattern.
- Weekly support line, 200-HMA joins firmer RSI to challenge bears.
- Monthly top, early June’s swing high lure pair buyers.
NZD/USD pokes resistance line of a two-day-old descending triangle around 0.7170, up 0.15% intraday, during early Tuesday.
Given the Kiwi pair’s ability to rebound from an ascending trend line from October 14, not to forget staying beyond 200-HMA, amid a firmer RSI line, the kiwi buyers are likely to keep the reins.
Even so, a clear upside break of 0.7170 becomes necessary for the NZD/USD buyers to aim for the 0.7200 threshold.
Following that, the monthly high near 0.7220, also a four-month peak, will challenge the quote’s further upside ahead of the June 07 high surrounding 0.7245.
Meanwhile, the stated weekly support line and the triangle’s lower line, respectively around 0.7140 and 0.7130, restrict short-term NZD/USD downside.
Also acting as downside filters are the 200-HMA level of 0.7117 and the 0.7100 psychological magnet, a break of which will direct the pair sellers toward the mid-month low close to 0.7020.
NZD/USD: Hourly chart
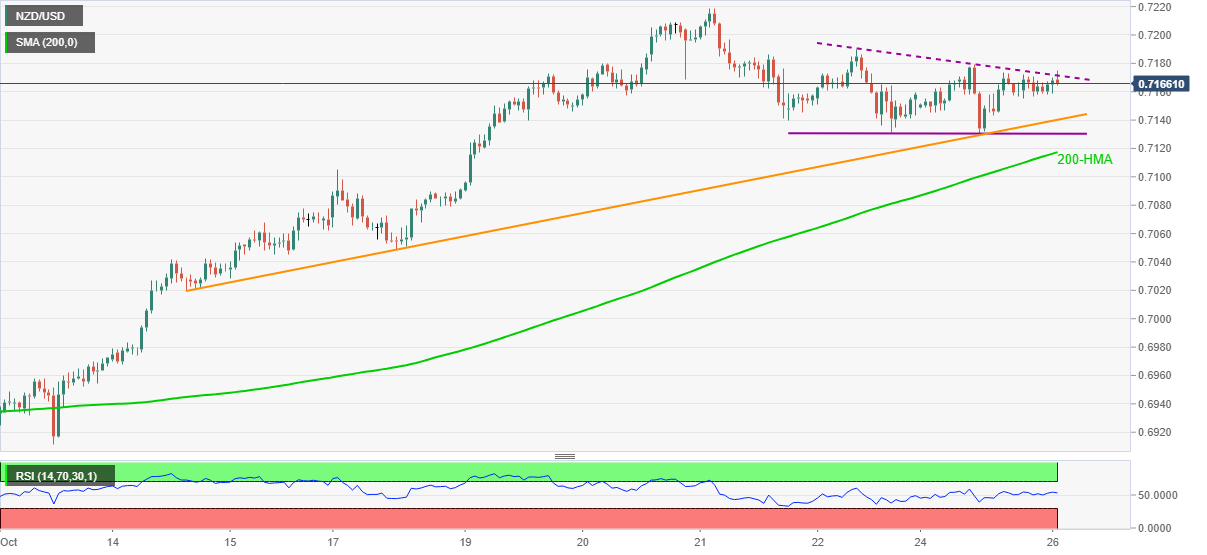
Trend: Further upside expected
-
02:27
AUD/NZD Price Analysis: Swings in between 21-day and 50-day SMA confluence
- AUD/NZD edges higher on Tuesday in the Asian trading hours.
- The cross-currency pair faces a resistance barrier near 1.0500.
- The Momentum oscillator holds above the midline, which indicates underlying bullish sentiment.
AUD/NZD fails to sustain the previous session’s gains on Tuesday. The cross-currency pair stayed in a narrow trade band with an upside bias. At the time of writing, AUD/NZD is trading at 1.0458, up 0.06% for the day.
AUD/NZD daily chart
-637708083719970341.png)
On the daily chart, the AUD/NZD cross-currency pair has been under selling pressure after testing high above 1.0615 on October, 12. The downside took a breather near the 50-day Simple Moving Average (SMA) at 1.0429.
A successful daily close above the 21-day Simple Moving Average (SMA) at 1.0488 would mean the 1.0550 horizontal resistance level for the spot.
The Moving Average Convergence (MACD) trades above the midline. Any uptick in the MACD suggests the possibility of the high made on October, 14 at 1.0610. Further, a close above the October, 12 high would bring the levels last seen in July back into action at the 1.0650 horizontal resistance zone.
.
Alternatively, if the price moves lower, it would first retest the 50-day SMA at 1.0436. Next, on the bear’s radar will be the 1.0380 horizontal support level and then September, 27 low of 1.0334.AUD/NZD additional levels
-
02:22
USD/CNY fix: 6.3890 vs the last close of 6.3856
In recent trade today, the People’s Bank of China (PBOC) set the yuan (CNY) at 6.3890 vs the last close of 6.3856.
About the fix
China maintains strict control of the yuan’s rate on the mainland.
The onshore yuan (CNY) differs from the offshore one (CNH) in trading restrictions, this last one is not as tightly controlled.
Each morning, the People’s Bank of China (PBOC) sets a so-called daily midpoint fix, based on the yuan’s previous day closing level and quotations taken from the inter-bank dealer.
-
02:19
S&P 500 Future track Wall Street gains to refresh record top, ignore US Treasury yields
- S&P 500 Futures print 10-day uptrend to new all-time high.
- US Treasury yields rebound after two-day downside, DXY extends recovery from monthly low.
- Sluggish session awaits US second-tier data ahead of the key Q3 GDP.
S&P 500 Futures portrays equity traders’ optimism, refreshing all-time high to 4,570, up 0.30% intraday, during early Tuesday. In doing so, the US stock futures follow Wall Street’s upbeat performance, also paying a little heed to the US Treasury yields’ latest consolidation.
US equities extend Friday’s upbeat performance, backed by sentiment-positive news from Tesla to kick-start the heavy reporting week. On the contrary, the US 10-year Treasury yields snap two-day downturn near 1.64% at the latest.
The optimism of the equity traders, ahead of the big reporting week, takes clues from the hopes of US stimulus backed by comments from US President Joe Biden and House Speaker Nancy Pelosi. However, the hawkish Fedspeak and a blackout period preceding the advance estimation of US Q3 GDP probe the optimists of late.
Amid these plays, the US Dollar Index (DXY) keeps the previous day’s advances, up 0.06% on a day near 93.90 by the press time, taking clues from the firmer US Treasury yields.
It’s worth observing that a phone call between China’s Vice Premier Liu He and US Treasury Secretary Janet Yellen also keeps the buyers hopeful in Asia-Pacific. On the same line are the efforts of the People’s Bank of China (PBOC) to defend the monetary system from Evergrande like risks, as well as globally receding covid fears.
Although equity earning and stock-specific news can keep investors hopeful, cautious sentiment ahead of Thursday’s US GDP may challenge the bulls. For now, second-tier releases like US Consumer Confidence and Durable Goods Orders may entertain gold traders. On the qualitative side, US Treasury yields and headlines from China, as well as relating to the US stimulus, will be important to watch for fresh impulse.
Read: Wall Street Close: Stocks cheer risk-on mood, Tesla propels S&P 500 to fresh record top
-
02:11
NZD/CHF Price Analysis: Bulls looking for a daily extension
- NZD/USD is on the verge of a bullish extension from a daily persp[ective.
- Hidden bullish divergence indicates a trend continuation on the 4-hour time frame.
NZD/CHF has been making strong progress over the course of the month on the back of risk-on markets and prospects of a faster rate of tightening at the Reserve Bank of New Zealand.
The following is a top-down analysis of the technical outlook from a daily point of view. The bulls are seeking an upside extension at this juncture following a pullback into the horizontal daily support that is competed of the 38.2 Fibonacci retracement level and prior daily highs.
NZD/CHF daily chart
-637708067149671480.png)
NZD/CHF 4-hour chart
-637708067761690950.png)
The price on the 4-hour chart has been supported with hidden bullish divergence with the RSI and that is likely to underpin the move to the upside as it is regarded as a trend continuation signal. With that being said, there are prospects of a pullback into the supporting territory that is comprised of the dynamic counter trendline and horizontal support. In such a scenario, it will offer the bulls a discount by engaging at the supporting structure.
-
01:58
EUR/GBP remains pressured near 0.8420 amid risk-on mood
- EUR/GBP trades with caution on Tuesday in the early Asian trading hours.
- German October IFO Survey, dovish ECB, and downbeat data weighs on the euro
- UK Brexit Minister sets December deadline to resolve NI border issue.
EUR/GBP remains subdued on Tuesday in the Asian session. The cross-currency touched the high of 0.8469 in the US session but failed to sustain the momentum. At the time of writing, EUR/GBP is trading at 0.8429, up 0.06% for the day.
The prospect of the shared currency was weighed down by worrisome German headlines. The October IFO Survey showed that the Business climate shranked by more than estimated to 97.7. The assessment of the current situation improved to 100.1, although expectations were sharply down, to 95.4.
In addition to that, the Bundesbank monthly report suggested that the full-year growth in 2021 was likely to be lower than the June forecast of 3.7%, due to persistent supply chain constraints. The projections strengthen the European Central Bank’s (ECB) dovish stance on monetary policy. The ECB Governing Council member and Spanish central bank chief Pablo Hernandez de Cos said recent developments anticipate a significant downward economic outlook revision for 2021 while pointing at the supply-chain issues and rising costs.
It is worth mentioning that, S&P 500 Futures are trading at 4,568, up 0.24% for the day.
On the other hand, the sterling gains were limited, following the UK’s Brexit Minister David Frost concern about delay to finalising UK’s participation in £80bn Horizon Europe scheme, which blew open a fresh Brexit row with Brussels. As per Sky news, the UK Brexit Minister has issued a December deadline for the European Union (EU) to resolve the Northern Ireland Protocol.
As for now, traders are waiting for the European Central Bank (ECB) Lending Survey, and German Gfk Consumer Confidence to gauge market sentiment data.
EUR/GBP additional levels
-
01:52
Gold Price Forecast: XAU/USD struggles to defend $1,800 breakout on firmer USD
- Gold snaps five-day uptrend, refreshes intraday low of late.
- Market sentiment dwindles amid pre-GDP caution, light calendar.
- US Treasury yields rebound, add strength to the greenback.
- Gold Price Forecast: Bulls eyeing the 1,830 price zone
Gold (XAU/USD) consolidates recent gains around $1,805, refreshing intraday low during early Tuesday following a five-day uptrend. Although risk-on mood underpinned the yellow metal to stay firmer of late, the US dollar rebound challenges the buyers ahead of important data/events of the week.
Having recovered from a fresh monthly low, the US Dollar Index (DXY) keeps the previous day’s advances, up 0.06% on a day near 93.90 by the press time. The hawkish Fedspeak and a blackout period preceding the advance estimation of US Q3 GDP probe the optimists and direct the cautious traders toward the greenback.
Also recently contributing to the DXY strength, weighing on the gold prices, were the recently positive US Treasury yields. That said, the US 10-year Treasury yields snap two-day downturn near 1.64% at the latest.
Market sentiment stayed firmer the previous day as comments from US President Joe Biden and House Speaker Nancy Pelosi propelled stimulus hopes, joining positive headlines from China’s Evergrande and Tesla’s fresh record high.
While portraying the mood, Wall Street benchmarks refreshed all-time high while the S&P 500 Futures print mild gains by the press time.
Given the lack of major data/events ahead of Thursday’s US GDP, second-tier releases like US Consumer Confidence and Durable Goods Orders may entertain gold traders. Also important will be the moves of the US Treasury yields and headlines from China, as well as relating to the US stimulus.
Technical analysis
Despite the recent pullback, gold keeps upside break of the key hurdle comprising 200-DMA and a descending trend line from early June, now support around $1,793.
Given the bullish MACD signals and an absence of the overbought RSI conditions, not to forget the metal’s sustained trading beyond the $1,800 threshold, gold prices are likely rushing towards the $1,834 resistance, comprising tops marked since July.
During the quote’s upside past $1,834 will aim for the $1,900 round figure with the mid-$1,800s likely probing gold buyers on their way.
In a case of the latest declines dragging gold below $1,793 resistance-turned-support, bulls may not lose hope until the commodity remains beyond the monthly support line, around $1,777 by the press time.
Overall, gold is up for pleasing the bulls before the next test around $1,834.
Gold: Daily chart
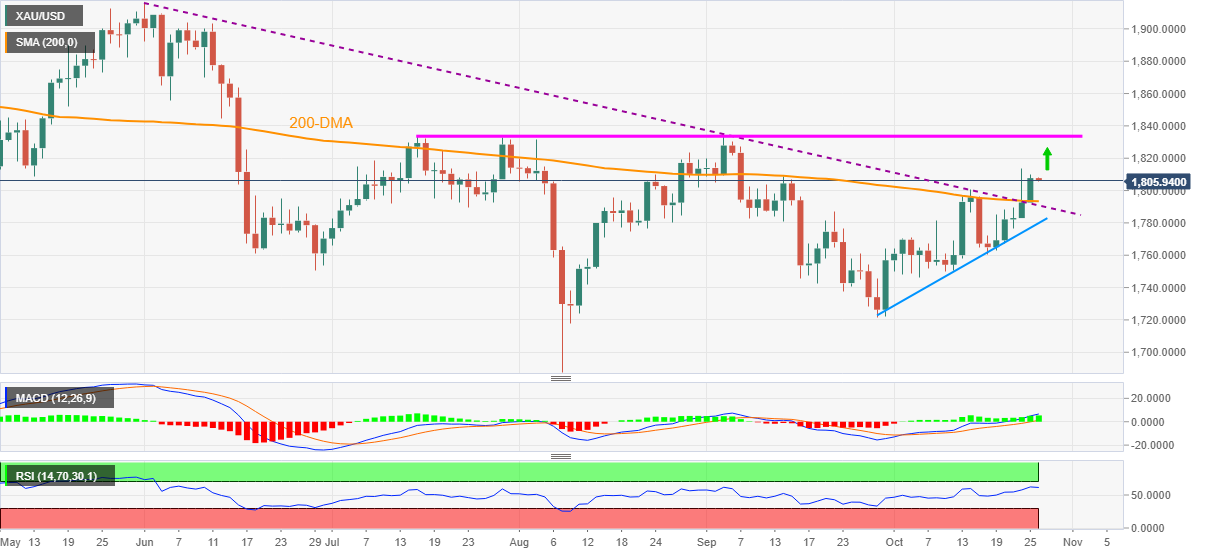
Trend: Bullish
-
01:35
US Dollar Index picks up bids towards 94.00 as US Treasury yields rebound
- DXY extends Monday’s gains, the biggest in two weeks.
- Markets turn sluggish ahead of the key US GDP, Treasury yields snap two-day fall.
- Second-tier US data, risk catalysts eyed ahead of crucial weekly data/events.
US Dollar Index (DXY) keeps the previous day’s advances, up 0.06% on a day near 93.90 during early Tuesday. The greenback gauge refreshed monthly low the previous day before posting the heaviest daily gains since October 11.
While mixed sentiment concerning the US Federal Reserve’s (Fed) next moves and US stimulus seemed to have underpinned the DXY’s run-up the previous day, the US Treasury yields’ consolidation of recent losses favors the latest upside. That said, the US 10-year Treasury yields snap two-day downturn near 1.64% by the press time.
Risk appetite improved the previous day as comments from US President Joe Biden and House Speaker Nancy Pelosi propelled stimulus hopes. Also adding to the risk-on mood were positive headlines from China’s Evergrande and Tesla fresh record high, which fuelled Wall Street benchmarks and commodities.
Even so, hawkish Fedspeak and a blackout period preceding the advance estimation of US Q3 GDP probe the optimists and direct the cautious traders toward the greenback. Also confusing the investors were mixed US data. The Dallas Fed Manufacturing Business Index rose past market consensus and prior readings in October but the Chicago Fed National Activity Index turned negative, -0.13 versus +0.05 previous readouts.
Moving on, US housing data, Consumer Confidence and Richmond Manufacturing Index may entertain the traders but major attention will be given to the US stimulus and GDP news.
Technical analysis
DXY’s ability to regain past 10-DMA after two weeks suggests the quote’s further upside towards the 21-DMA hurdle surrounding the 94.00 threshold. Meanwhile, US Dollar Index bears need to wait for a clear downside break of 93.50 for fresh entries.
-
01:30
Schedule for today, Tuesday, October 26, 2021
Time Country Event Period Previous value Forecast 10:00 (GMT) United Kingdom CBI retail sales volume balance October 11 13:00 (GMT) U.S. Housing Price Index, m/m August 1.4% 13:00 (GMT) U.S. Housing Price Index, y/y August 19.2% 13:00 (GMT) U.S. S&P/Case-Shiller Home Price Indices, y/y August 19.9% 20.1% 14:00 (GMT) U.S. Richmond Fed Manufacturing Index October -3 14:00 (GMT) U.S. New Home Sales September 0.74 0.755 14:00 (GMT) U.S. Consumer confidence October 109.3 108.8 21:45 (GMT) New Zealand Trade Balance, mln September -2144 -
01:18
Silver Price Analysis: XAG/USD bulls seek validation around $24.50
- Silver remains sidelined after two-day uptrend to seven-week high.
- Short-term horizontal resistance, downbeat Momentum line challenge bulls.
- Previous resistance from early October, 200-SMA guard short-term downside.
Silver (XAG/USD) bulls seem tiring around $24.55 following the two-day run-up to the multi-day high.
That said, the quote seesaws during Tuesday’s Asian session while keeping the last week’s upside break of the resistance line from October 03, now support around $24.25, as well as the 200-SMA level of $23.03.
However, descending Momentum line and failures to cross September’s peak challenge the XAG/USD buyers around $24.90.
Also acting as an upside barrier is the $25.00 round figure, a break of which will direct silver buyers towards the August month’s top near $26.00.
On the contrary, the stated resistance-turned-support and 200-SMA, respectively near $24.25 and $23.00, restrict short-term declines of the metal.
Should the quote drops below $23.00, the bearish momentum could escalate towards the monthly low of $21.99 before challenging the previous month’s trough surrounding $21.40.
Silver: Four-hour chart
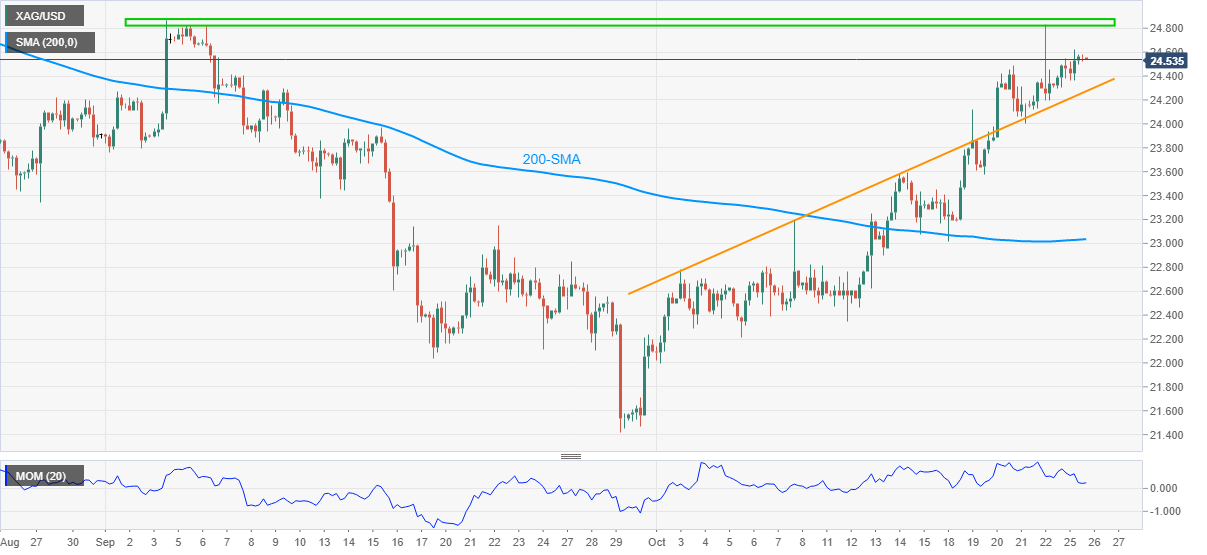
Trend: Pullback expected
-
01:15
Currencies. Daily history for Monday, October 25, 2021
Pare Closed Change, % AUDUSD 0.74894 0.34 EURJPY 131.982 -0.09 EURUSD 1.16097 -0.22 GBPJPY 156.507 0.29 GBPUSD 1.37645 0.13 NZDUSD 0.7156 0.2 USDCAD 1.23779 0.14 USDCHF 0.91773 0.16 USDJPY 113.695 0.16 -
01:00
USD/CHF Price Analysis: Buyers seek validation above 0.9200
- USD/CHF edges higher on Tuesday in the early Asian session.
- The lower-highs and lower-lows formation depicts the downward trend in the pair since September 30.
- Additional gains for the pair if price decisively breaks 0.9200.
USD/CHF consolidates gains on Tuesday morning's Asian trading hours. The pair stayed in a relatively narrow trading band after posting solid gains of more than 40-pips in the US session. At the time of writing, USD/CHF is trading at 0.9199, up 0.01% for the day.
USD/CHF daily chart
-637708030334209217.png)
On the daily chart, after testing 5-month highs at 0.9368 on September, 30, the pair has been under downward pressure. The lower highs and lower lows trend can be identified within the downward trend channel. Furthermore, the spot showed a weakening trend after it slipped below the 50-day Simple Moving Average (SMA) at 0.9217.
If the price sustains the intraday high it could immediately test the 0.9225 horizontal resistance zone, followed by Wednesday’s high at 0.9252. In addition to that, the Moving Average Convergence Divergence (MACD) trades below the midline. Any uptick in the MACD would encourage the USD/CHF bulls to test the 0.9273 horizontal resistance level.
Alternatively, if the price reverses direction then the possibility of meeting the 0.9170 horizontal support level emerges and then the previous day’s low of 0.9150.
Next, the market participant would retest the 0.9125 horizontal support level.
USD/CHF additional levels
-
00:59
GBP/JPY seesaws around 156.50 amid fresh Brexit jitters, downbeat yields
- GBP/JPY struggles to keep rebound from one-week low.
- UK Brexit Minister doubts EU proposals, sets December deadline to solve NI border issue.
- Covid cases jump in Britain, Virus-led restrictions ease in Japan.
- Risk catalysts are the key amid a light calendar.
GBP/JPY takes rounds to 156.50, fading the previous day’s recovery moves during Tuesday’s Asian session. The cross-currency pair struggles for a clear direction as mixed concerns for yen joins Brexit woes and coronavirus fears from the UK.
Risk appetite improved headlines from China and concerning Evergrande joined hopes of US stimulus, backed by US President Joe Biden and House Speaker Nancy Pelosi.
While upbeat sentiment weighed on the US Treasury yields and should have helped the Japanese yen (JPY), fears that recently easy activity restrictions in Tokyo and surrounding prefectures after 11 months of hardships may renew the COVID-19 cases probe the pair bears.
Elsewhere, UK Brexit Minister conveys dissatisfaction with the Eurozone’s Brexit proposals and gives time until December 2021 to solve the Northern Ireland (NI) issue. “The EU's current proposals to reform the Northern Ireland Protocol "don't go far enough", the UK's Brexit minister has said, as he set a December deadline for the two sides to find a solution,” said Sky News. It's worth noting that a delegation from Brussels will arrive in London on Tuesday to discuss the matter.
Additionally weighing on the cable is the fears of faster virus mutations in the UK and the latest jump in the covid cases. “UK has seen close to 40,000 new cases per day for the last 4 days. UK health secretary has warned people of not letting their guard down as there could be 100,000 COVID cases per day as the country heads into the winter season,” said CNBC.
Against this backdrop, Wall Street benchmarks closed positive, refreshing records, while the US 10-year Treasury yields seek further clues following two days of downside. That said, S&P 500 Futures print mild gains by the press time.
Given the light calendar and mixed catalysts, the Brexit talks and covid updates are important to forecast short-term GBP/JPY moves.
Technical analysis
Despite bouncing off 10-day EMA, around 156.15 by the press time, GBP/JPY remains below the previous support line from October 01, close to 157.15, keeping bears hopeful.
-
00:52
Japan Corporate Service Price Index (YoY) below forecasts (1%) in September: Actual (0.9%)
-
00:49
AUD/USD Price Analysis: Bulls testing 0.7500 ahead of CPI
- AUD/USD is testing the waters in the 0.75 area.
- Weekly resistance is a conundrum for the bulls at this juncture.
AUD/USD is on the verge of a break of 0.75 psychological resistance, but the longer-term time frames are less than favourable given the amount of weekly resistance ahead.
Meanwhile, the event for the day is the Consumer Price Index and the following is the hourly picture leading into the event:
AUD/USD 1-HR chart
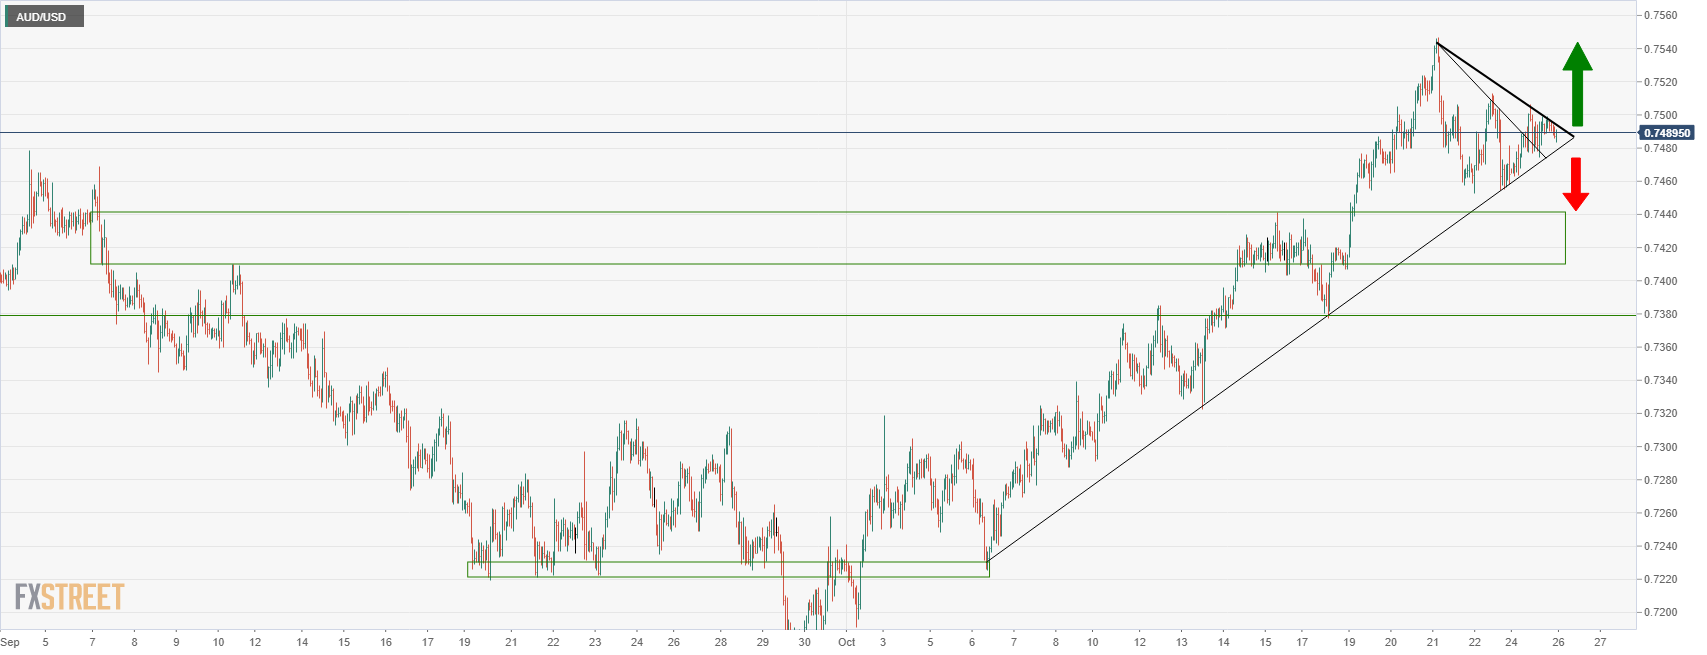
The price broke the trendline resistance in 0.7485 during the start of the European session ad has since carved a fresh dynamic resistance near 0.75 the figure. A break of that will open risk towards 0.7505. On the downside, and should the data disappoint, the bears will be seeking a break below 0.7480 for a run towards 0.7440.
Meanwhile, the following is a top-down analysis of the weekly and daily charts that illustrate the predicament for the bulls.
Daily chart
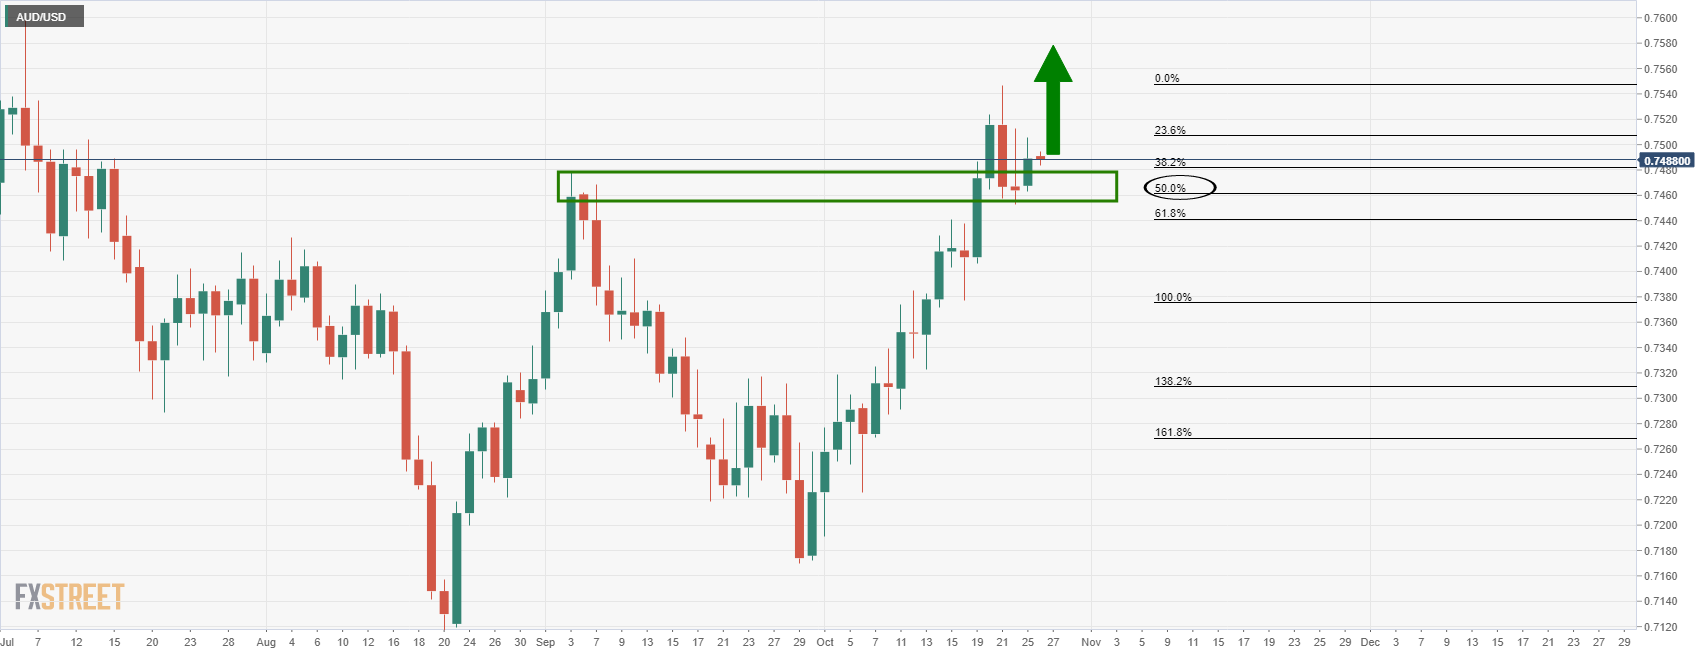
The daily chart is offering prospects of an upside continuation and while it is probable that the market will indeed continue higher, the weekly resistance must be noted.
Weekly chart
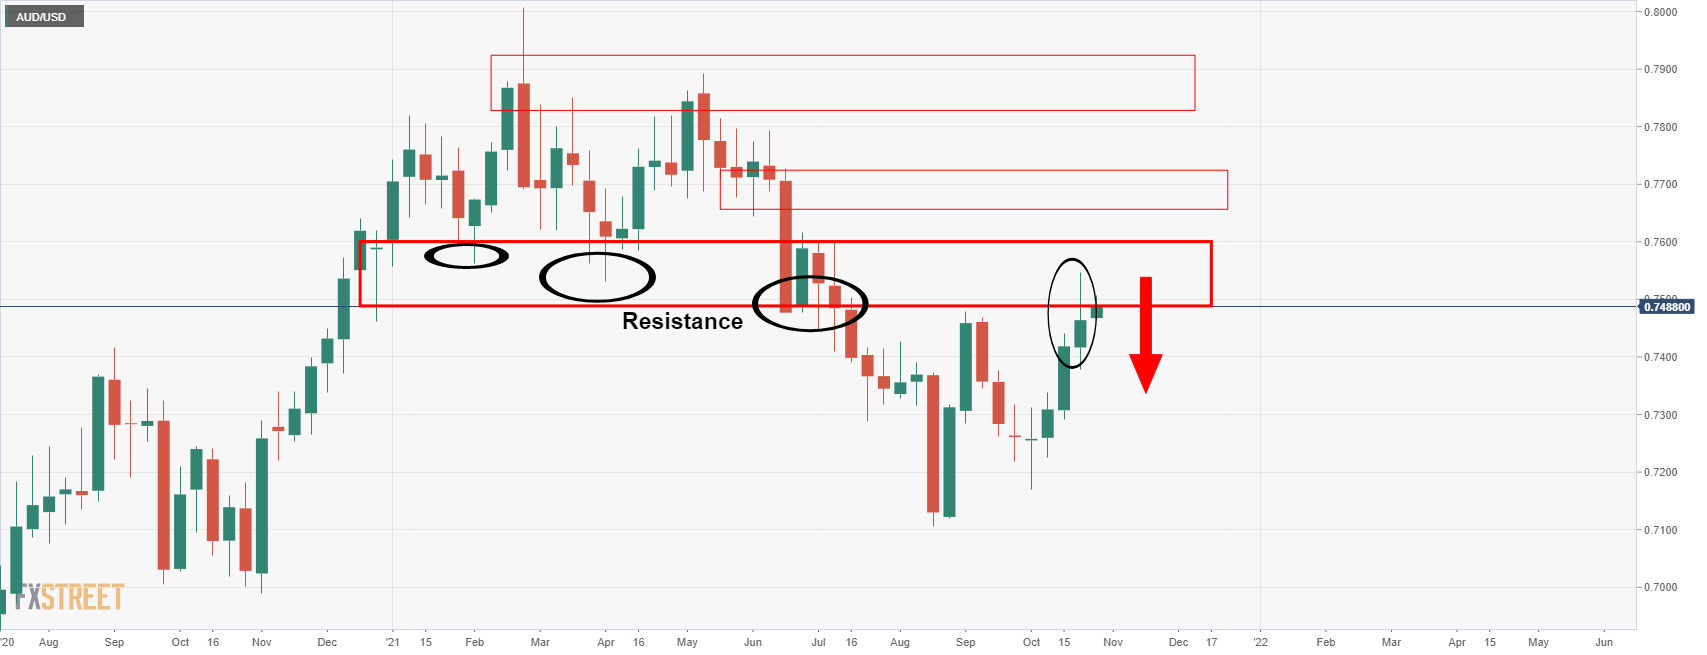
As illustrated on the weekly chart above for AUD/USD, the price is testing a wall of resistance. There is room to move a touch higher but last weeks' candle was lacking bullish momentum which leaves a bearish bias while below 0.7550.
-
00:37
AUD/JPY Price Analysis: Stays defensive above 85.00
- AUD/JPY fades rebound from 50-SMA, stays inside short-term ascending triangle.
- MACD teases bulls, monthly support line adds to the downside filters.
AUD/JPY retreats towards 85.00, down 0.05% intraday around 85.15 during Tuesday’s Asian session.
In doing so, the cross-currency pair fails to keep the last week’s recovery moves from 50-SMA. However, a two-week-old rising trend line, forming part of a short-term triangle, joins the stated short-term moving average and MACD conditions to keep buyers hopeful.
Hence, the latest pullback moves may aim to rest 50-SMA level of 85.00 while the stated triangle’s support line will also challenge the AUD/JPY bears around 84.85.
Should the quote drops below 84.85, it confirms the bearish chart pattern and signals downside towards the 84.00 round figure and monthly support line near 83.30.
On the contrary, an upside clearance of 85.55 horizontal hurdle will direct AUD/JPY prices toward the latest peak near 86.25.
In a case where the pair buyers keep reins past 86.25, March 2016 peak surrounding 86.70 and the 87.00 round figure will be in focus.
AUD/JPY: Four-hour chart

Trend: Bullish
-
00:22
USD/CAD consolidates below 1.2400 amid steady US dollar
- USD/CAD trades cautiously following the previous session’s gains on Tuesday.
- WTI retreats from $84.00 and is exerting pressure on the Canadian dollar.
- Fed/ BoC rate hike bets, inflation, and higher commodity prices take the center stage.
The USD/CAD pair accumulates gains on Tuesday in the early Asian trading hours. The pair touched the 1.2400 mark in the US session. At the time of writing, USD/CAD is trading at 1.2383, up 0.03% for the day.
The appreciative move in the US dollar keeps USD/CAD higher. The US Dollar Index (DXY), which measures the performance of the greenback against its six major rivals, trades at 93.81, up 0.21%. Investors anticipate Fed’s tapering while digesting delay in rate hike expectations. US corporate results remained strong despite inflation concerns, which helped the greenback in finding some traction.
Crude oil, a key Canadian export, retreated from fresh 7-year highs, which pushed the loonie lower against the USD. In addition to that, a Reuters poll reported that the Bank of Canada (BoC) will raise interest rates as early as Q3, 2022, at least three months earlier than previously expected. The Market is already pricing in the first hike as early as April.
As for now, traders are waiting for the US Housing Price Index, S&P/Case-Shiller Home Price Indices, and New Home Sales data to take fresh trading impetus.
USD/CAD additional levels
-
00:16
EUR/USD traders on high alert into the ECB this week
- EUR/USD trades below the 4-hour 10 & 20 EMA bearish crossover.
- The US dollar is finding its form into critical events this week, including the ECB.
EUR/USD is trading in a tight range ahead of the Tokyo open near to 1.1610. EUR/USD fell from 1.1645 to 1.1610 overnight and remains capped by the 4-hour 10/20 EMA bearish crossover. The downside came from the dollar steadying on Monday afternoon after bouncing off a one-month low. Traders now look ahead to key data events for the week ahead, including the European Central Bank meeting this Thursday.
The forex space is being governed by markets that are weighing the prospects of higher interest rates for different currencies. This makes this weeks calendar critical as it may set the stage for many weeks to come. So far, the rebound in the greenback has come at the expense of the euro, the Japanese yen and the Swiss franc in the main.
ECB in focus
For today, bar the Aussie inflation readings, will be a quieter day for economics whereby we will see markets focused on US New Home Sales and a speech by the ECB's Villeroy on Tuesday. The bigger event, however, will be the ECB that meets this week and comments from the bank could shift views on how many inflationary pressures could impact interest rates.
''Whilst it has signalled that December is the meeting to expect a comprehensive update on post-PEPP plans, the current rise in inflation demands attention,'' analysts at ANZ Bank argued. ''Our analysis estimates inflation will prove more persistent than transitory next year, though we also think that the ECB will push back against expectations of rates rises in 2022.''
-
00:09
WTI stays pressured towards $83.00 ahead of API inventories
- WTI keeps pullback from seven-year high, retreats of late.
- Saudi Arabia outlines Mideast Green initiative, shows readiness to ease supply constraints.
- US-Iran tussles could renew on chatters over Syrian done attack.
- Risk-on mood, geopolitics may challenge oil bears, weekly API stockpiles eyed.
WTI holds lower grounds following a U-turn from a fresh multi-day high, pressured around $83.25 during Tuesday’s Asian session. In doing so, the black gold struggles to justify headlines from the Middle East, as well as risk-on mood, amid the US dollar rebound.
The US Dollar Index (DXY) refreshed three-week lows before posting the heaviest daily jump in two weeks on Monday. The greenback gauge seems to have benefited from the market’s cautious sentiment ahead of Thursday’s advance estimation of the US Q3 GDP amid hawkish Fedspeak and mixed data.
On the other hand, market sentiment improved headlines from China and concerning Evergrande joined hopes of US stimulus, backed by US President Joe Biden and House Speaker Nancy Pelosi.
More recently, doubts that Iran was behind the drone attack on the US airbase in Syria should have probed the oil sellers. However, Saudi Arabia’s “aims to reach "net zero" emissions of greenhouse gases, mostly produced by burning fossil fuels, by 2060,” per Reuters, challenge the energy buyers.
Even so, "We would need prices to rise to $110 /bbl to stifle demand enough to balance the market deficit we currently see in 1Q22 given our expectation that OPEC+ continues on the current path of +0.4 mb/d per month increases in quotas," said Goldman Sachs per Reuters.
Amid these plays, Wall Street closed positive and the S&P 500 Futures print mild gains by the press time.
Moving on, WTI traders should wait for the weekly oil stockpile data from the American Petroleum Institute (API), prior 3.294M, for fresh impulse. Though, qualitative factors and the US dollar moves will also be important to watch.
Technical analysis
10-DMA precedes monthly support line, respectively around $82.30 and $81.90 to restrict short-term WTI downside. Meanwhile, bulls need a daily closing beyond November 2012 lows near $84.10 to excel further.
-