Notícias do Mercado
-
16:42
Foreign exchange market. American session: the U.S. dollar traded mixed to higher against the most major currencies after the mixed U.S. economic data
The U.S. dollar traded mixed to higher against the most major currencies after the mixed U.S. economic data. The Reuters/Michigan consumer sentiment index was revised up to 82.5 in August from a preliminary reading of 79.2, exceeding expectations a final reading of 80.1.
The Chicago purchasing managers' index rose to 64.3 in August from 52.6 in July, beating forecasts for a rise to 56.3.
Personal spending in the U.S. fell 0.1% in July, missing forecasts of a 0.2% gain, after a 0.4% rise in June. That was the first decline since January.
Personal income increased 0.2% in July, missing expectations for a 0.3% rise, after a 0.5% gain in June. June's figure was revised up from a 0.4% increase. That was the smallest monthly gain of this year.
The personal consumption expenditures price index, excluding food and energy, climbed at an annual rate of 1.5% in July. The index is the preferred inflation gauge of the Fed. The Fed's inflation target is 2.0%.
On a monthly basis, the personal consumption expenditures price index, excluding food and energy, rose 0.1% in July.
The euro declined against the U.S. dollar despite the weak economic data from the Eurozone. Eurozone's unemployment rate remained unchanged at 11.5% in July, in line with expectations.
Eurozone's preliminary harmonized consumer price index declined to an annual rate of 0.3% in August from 0.4% in July, in line with expectations.
German retail sales fell 1.4% in July, missing expectations for a 0.1% gain, after a 1.0% rise in June. June's figure was revised down from a 1.3% increase.
Investors speculate that the European Central Bank will add new stimulus measures to support the economy.
The British pound traded mixed against the U.S. dollar after the better-than-expected Nationwide house price index. The Nationwide house price index increased 0.8% in August, after a 0.2% gain in July. July's figure was revised up from a 0.1% rise. Analysts had expected the index to be flat.
On a yearly basis, the Nationwide house price index climbed 11.0% in August, after a 10.6% increase in July.
The Swiss franc traded lower against the U.S. dollar. The KOF leading indicator rose to 99.5 in August from 97.9 in July. July's figure was revised down from 98.1.
The Canadian dollar traded mixed against the U.S. dollar ahead of the Canadian gross domestic product (GDP). The GDP rose at an annual rate of 3.1% in the second quarter, after a 0.9% gain in the first quarter. The first quarter's figure was revised down from a 1.2% rise.
That was the largest quarterly increase since the third quarter of 2011. The increase was driven by household spending.
On a monthly basis, Canadian GDP rose 0.3% in June, in line with expectations, after a 0.5% increase in May. May's figure was revised up from a 0.4% gain. The monthly rise was driven by mining, oil and gas, construction, wholesale and retail trade.
Canadian raw material price index decreased 1.4% in July, missing expectations for a 0.7% increase, after a 1.1% gain in June.
The New Zealand dollar traded mixed against the U.S dollar. The ANZ business confidence index in New Zealand fell to 24.4 in August from 39.7 in July. That was the sixth straight decrease in six months.
The total number of building permits in New Zealand rose 0.1% in July, after a 3.5% gain in June.
The Australian dollar traded lower against the U.S. dollar. Private sector credit in Australia increased 0.4% in July, missing expectations for a 0.5% rise, after a 0.7% gain in June.
The Japanese yen traded mixed against the U.S. dollar. Japan's national consumer price index (CPI), excluding fresh food, climbed at an annual rate of 3.3% in July, in line with expectations, after a 3.3% gain in June.
Japan's national CPI rose 3.4% in July, after a 3.6% rise in June.
Household spending in Japan dropped 5.9% in July, missing forecasts of a 2.7% decline, after 3.0% decrease in June.
Retail sales in Japan increased 0.5% in July, exceeding expectations for a 0.1% decline, after a 0.6% fall in June.
Japan's unemployment rate rose to 3.8% in July from 3.7% in June. Analysts had expected the unemployment rate to remain unchanged at 3.7%.
Preliminary industrial production in Japan climbed 0.2% in July, missing expectations for a 1.4% rise, after a 3.4% decline in June.
Housing starts in Japan plunged 14.1% in July, missing forecasts of a 10.5% decrease, after a 9.5% drop in June.
-
14:55
U.S.: Reuters/Michigan Consumer Sentiment Index, August 82.5 (forecast 80.4)
-
14:45
U.S.: Chicago Purchasing Managers' Index , August 64.3 (forecast 56.3)
-
14:30
Option expiries for today's 1400GMT cut
EUR/USD: $1.3150(E346mn), $1.3200(E1.14bn), $1.3215(E300mn), $1.3235-40(E677mn), $1.3250(E2.0bn)
USD/JPY: Y102.50-102.90($3.0bn), Y103.00($2.5bn), Y103.20($600mn), Y103.25($1.27bn), Y103.35($275mn), Y103.50($267mn), Y103.75-85($450mn), Y104.00($580mn), Y104.50($1.0bn)
EUR/JPY: Y136.50(E676mn), Y136.75(E200mn), Y138.15(E646mn)
GBP/USD: $1.6550(stg110mn), $1.6600(stg110mn), $1.6690($211mn)
EUR/GBP: stg0.7900(E140mn), stg0.7950(E120mn), stg0.8005(E334mn)
USD/CHF: Chf0.9120($220mn), Chf0.9150($355mn)
AUD/USD: $0.9290-95(A$265mn), $0.9310-15(A$270mn), $0.9350(A$232mn)
NZD/USD: $0.8350(NZ$110mn), $0.8400(NZ$600mn), $0.8440-50($310mn)
USD/CAD: C$1.0800($230mn), C$1.0870($870mn), C$1.0900($305M), C$1.0915-25($500M), C$1.0940-50($250mn)
-
14:29
U.S. personal spending declines 0.1% in July
The U.S. Commerce Department released personal spending and personal income data on Friday. Personal spending in the U.S. fell 0.1% in July, missing forecasts of a 0.2% gain, after a 0.4% rise in June. That was the first decline since January.
Personal income increased 0.2% in July, missing expectations for a 0.3% rise, after a 0.5% gain in June. June's figure was revised up from a 0.4% increase. That was the smallest monthly gain of this year.
The personal consumption expenditures price index, excluding food and energy, climbed at an annual rate of 1.5% in July. The index is the preferred inflation gauge of the Fed. The Fed's inflation target is 2.0%.
On a monthly basis, the personal consumption expenditures price index, excluding food and energy, rose 0.1% in July.
-
14:10
Canadian gross domestic product increased 3.1% in the second quarter
Statistics Canada released Canadian gross domestic product (GDP) on Friday. The GDP rose at an annual rate of 3.1% in the second quarter, after a 0.9% gain in the first quarter. The first quarter's figure was revised down from a 1.2% rise.
That was the largest quarterly increase since the third quarter of 2011. The increase was driven by household spending.
On a monthly basis, Canadian GDP rose 0.3% in June, in line with expectations, after a 0.5% increase in May. May's figure was revised up from a 0.4% gain. The monthly rise was driven by mining, oil and gas, construction, wholesale and retail trade.
-
13:33
U.S.: Personal spending , July -0.1% (forecast +0.2%)
-
13:32
U.S.: PCE price index ex food, energy, Y/Y, July +1.5%
-
13:31
Canada: Industrial Product Prices, m/m, July -0.3% (forecast +0.2%)
-
13:31
Canada: Raw Material Price Index, July -1.4% (forecast +0.7%)
-
13:31
U.S.: PCE price index ex food, energy, m/m, July +0.1% (forecast +0.1%)
-
13:30
Canada: GDP (m/m) , June +0.3 (forecast +0.3%)
-
13:30
U.S.: Personal Income, m/m, July +0.2% (forecast +0.3%)
-
13:04
Foreign exchange market. European session: the euro traded higher against the U.S. dollar despite the weak economic data from the Eurozone
Economic calendar (GMT0):
(Time/ Region/ Event/ Period/ Previous/ Forecast/ Actual)
01:00 New Zealand ANZ Business Confidence August 39.7 24.4
01:30 Australia Private Sector Credit, m/m July +0.7% +0.5% +0.4%
01:30 Australia Private Sector Credit, y/y July +5.1% +5.1%
05:00 Japan Housing Starts, y/y July -9.5% -10.5% -14.1%
06:00 United Kingdom Nationwide house price index August +0.1% 0.0% +0.8%
06:00 United Kingdom Nationwide house price index, y/y August +10.6% +11.0%
06:00 Germany Retail sales, real adjusted July +1.0% Revised From +1.3% +0.1% -1.4%
06:00 Germany Retail sales, real unadjusted, y/y July +0.4% +0.7%
07:00 Switzerland KOF Leading Indicator August 98.1 97.9 99.5
09:00 Eurozone Unemployment Rate July 11.5% 11.5% 11.5%
09:00 Eurozone Harmonized CPI, Y/Y (Preliminary) August +0.4% +0.3% +0.3%
The U.S. dollar traded mixed against the most major currencies ahead of the U.S. economic data. Personal income in the U.S. is expected to rise 0.3% in July, after a 0.4% gain in June.
Personal spending in the U.S. is expected to increase 0.2% in July, after a 0.4% rise in June.
The euro traded higher against the U.S. dollar despite the weak economic data from the Eurozone. Eurozone's unemployment rate remained unchanged at 11.5% in July, in line with expectations.
Eurozone's preliminary harmonized consumer price index declined to an annual rate of 0.3% in August from 0.4% in July, in line with expectations.
German retail sales fell 1.4% in July, missing expectations for a 0.1% gain, after a 1.0% rise in June. June's figure was revised down from a 1.3% increase.
Investors speculate that the European Central Bank will add new stimulus measures to support the economy.
The British pound traded mixed against the U.S. dollar after the better-than-expected Nationwide house price index. The Nationwide house price index increased 0.8% in August, after a 0.2% gain in July. July's figure was revised up from a 0.1% rise. Analysts had expected the index to be flat.
On a yearly basis, the Nationwide house price index climbed 11.0% in August, after a 10.6% increase in July.
The Swiss franc traded higher against the U.S. dollar after the better-than-expected KOF leading indicator. The KOF leading indicator rose to 99.5 in August from 97.9 in July. July's figure was revised down from 98.1.
The Canadian dollar traded slightly higher against the U.S. dollar ahead of the Canadian gross domestic product (GDP). The Canadian GDP is expected to climbs 0.3% in June, after a 0.4% rise in May.
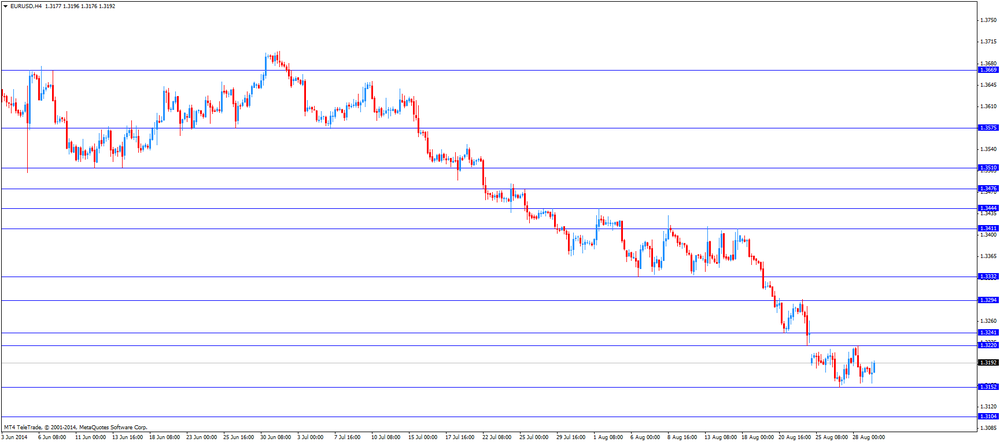
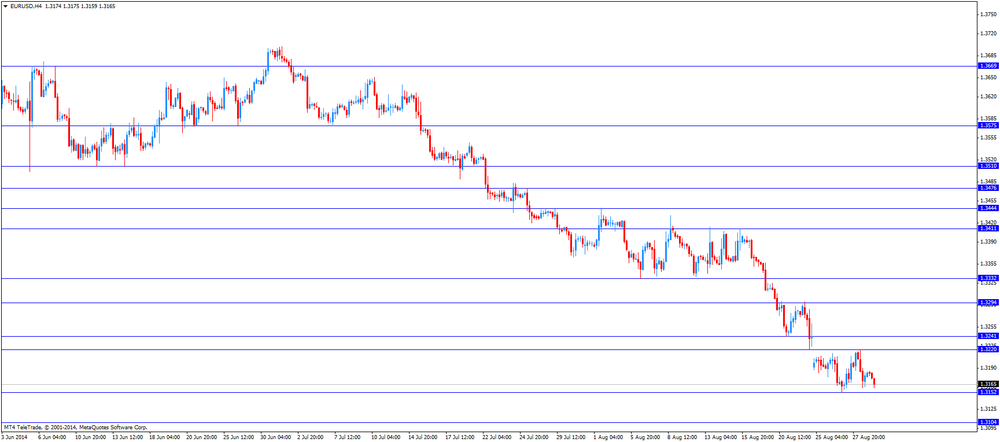
EUR/USD: the currency pair rose to $1.3196
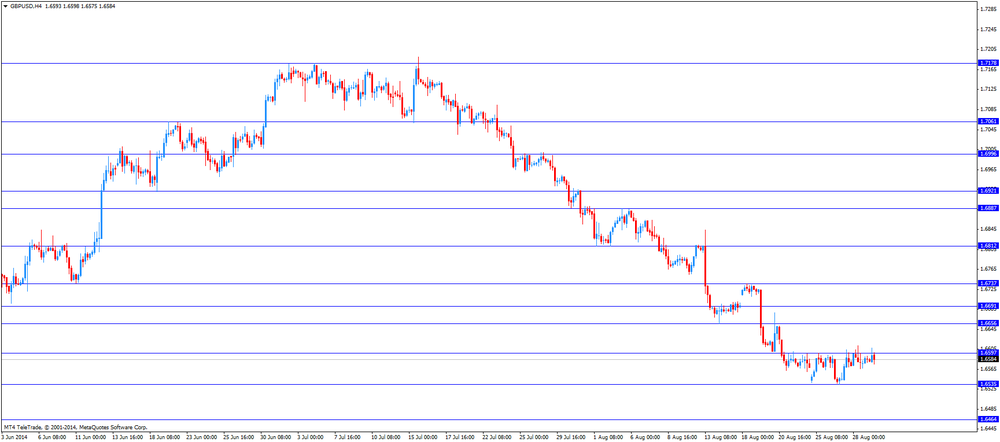
GBP/USD: the currency pair traded mixed
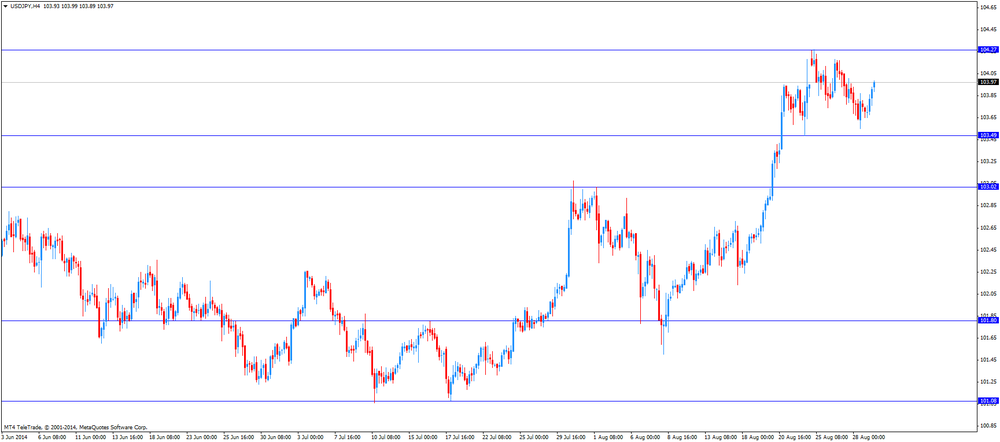
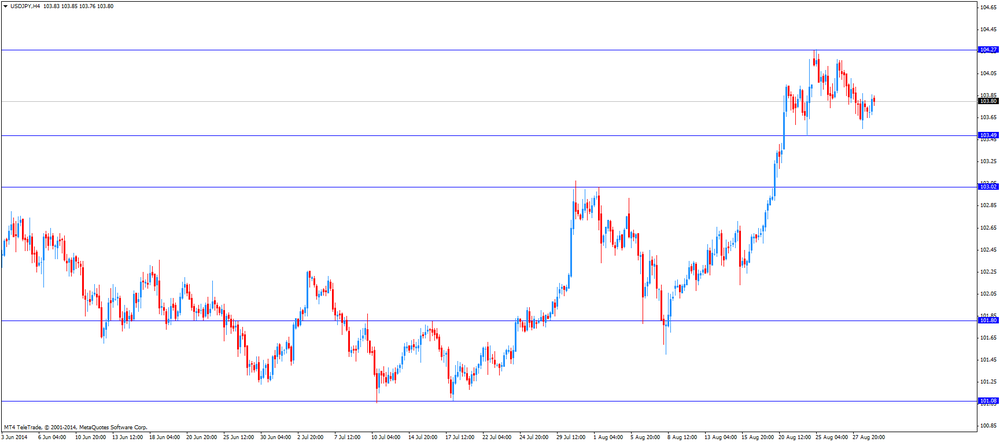
USD/JPY: the currency pair increased to Y103.99
The most important news that are expected (GMT0):
12:30 Canada Raw Material Price Index July +1.1% +0.7%
12:30 Canada GDP (m/m) June +0.4% +0.3%
12:30 U.S. Personal Income, m/m July +0.4% +0.3%
12:30 U.S. Personal spending July +0.4% +0.2%
12:30 U.S. PCE price index ex food, energy, m/m July +0.1% +0.1%
12:30 U.S. PCE price index ex food, energy, Y/Y July +1.5%
13:45 U.S. Chicago Purchasing Managers' Index August 52.6 56.3
13:55 U.S. Reuters/Michigan Consumer Sentiment Index (Finally) August 79.2 80.4
-
13:00
Orders
EUR/USD
Offers $1.3350, $1.3325/35, $1.3250/60, $1.3220-40
Bids $1.3160-50, $1.3135, $1.3110-00
GBP/USD
Offers $1.6700
Bids $1.6500
AUD/USD
Offers $0.9450, $0.9415/20, $0.9400, $0.9370/80
Bids $0.9325/20, $0.9300, $0.9280, $0.9255/50
EUR/JPY
Offers Y138.20, Y137.90/00, Y137.50
Bids Y136.50, Y136.20, Y136.00, Y135.50
USD/JPY
Offers Y105.00, Y104.50, Y104.20/25, Y104.00
Bids Y103.50, Y103.20, Y103.00, Y102.80
EUR/GBP
Offers stg0.7980-85, stg0.7970
Bids stg0.7900
-
10:19
Option expiries for today's 1400GMT cut
EUR/USD: $1.3150(E346mn), $1.3200(E1.14bn), $1.3215(E300mn), $1.3235-40(E677mn), $1.3250(E2.0bn)
USD/JPY: Y102.50-102.90($3.0bn), Y103.00($2.5bn), Y103.20($600mn), Y103.25($1.27bn), Y103.35($275mn), Y103.50($267mn), Y103.75-85($450mn), Y104.00($580mn), Y104.50($1.0bn)
EUR/JPY: Y136.50(E676mn), Y136.75(E200mn), Y138.15(E646mn)
GBP/USD: $1.6550(stg110mn), $1.6600(stg110mn), $1.6690($211mn)
EUR/GBP: stg0.7900(E140mn), stg0.7950(E120mn), stg0.8005(E334mn)
USD/CHF: Chf0.9120($220mn), Chf0.9150($355mn)
AUD/USD: $0.9290-95(A$265mn), $0.9310-15(A$270mn), $0.9350(A$232mn)
NZD/USD: $0.8350(NZ$110mn), $0.8400(NZ$600mn), $0.8440-50($310mn)
USD/CAD: C$1.0800($230mn), C$1.0870($870mn), C$1.0900($305M), C$1.0915-25($500M), C$1.0940-50($250mn)
-
10:00
Eurozone: Unemployment Rate , July 11.5% (forecast 11.5%)
-
10:00
Eurozone: Harmonized CPI, Y/Y, August +0.3% (forecast +0.3%)
-
09:59
Foreign exchange market. Asian session: the Japanese yen traded slightly lower against the U.S. dollar after mixed economic reports from Japan
Economic calendar (GMT0):
(Time/ Region/ Event/ Period/ Previous/ Forecast/ Actual)
01:00 New Zealand ANZ Business Confidence August 39.7 24.4
01:30 Australia Private Sector Credit, m/m July +0.7% +0.5% +0.4%
01:30 Australia Private Sector Credit, y/y July +5.1% +5.1%
05:00 Japan Housing Starts, y/y July -9.5% -10.5% -14.1%
06:00 United Kingdom Nationwide house price index August +0.1% 0.0% +0.8%
06:00 United Kingdom Nationwide house price index, y/y August +10.6% +11.0%
06:00 Germany Retail sales, real adjusted July +1.0% Revised From +1.3% +0.1% -1.4%
06:00 Germany Retail sales, real unadjusted, y/y July +0.4% +0.7%
07:00 Switzerland KOF Leading Indicator August 98.1 97.9 99.5
The U.S. dollar traded mixed to higher against the most major currencies. The greenback was supported by Thursday' better-than-expected U.S. economic data. The U.S. revised gross domestic product jumped 4.2% in the second quarter instead of the previously reported 4.0%. That was the fastest increase since the third quarter of 2013. Analysts had expected an increase of 3.9%.
The number of initial jobless claims in the week ending August 22 fell by 1,000 to 298,000 from 299,000 in the previous week.
The U.S. pending home sales rose 3.3% in July, exceeding expectations for a 0.6% gain, after a 1.3% fall in June. That was the highest level since August 2013.
The New Zealand dollar traded lower against the U.S dollar due to the weak economic data from New Zealand. The ANZ business confidence index in New Zealand fell to 24.4 in August from 39.7 in July. That was the sixth straight decrease in six months.
The total number of building permits in New Zealand rose 0.1% in July, after a 3.5% gain in June.
The Australian dollar traded mixed against the U.S. dollar after the weaker-than-expected economic data from Australia. Private sector credit in Australia increased 0.4% in July, missing expectations for a 0.5% rise, after a 0.7% gain in June.
The Japanese yen traded slightly lower against the U.S. dollar after mixed economic reports from Japan. Japan's national consumer price index (CPI), excluding fresh food, climbed at an annual rate of 3.3% in July, in line with expectations, after a 3.3% gain in June.
Japan's national CPI rose 3.4% in July, after a 3.6% rise in June.
Household spending in Japan dropped 5.9% in July, missing forecasts of a 2.7% decline, after 3.0% decrease in June.
Retail sales in Japan increased 0.5% in July, exceeding expectations for a 0.1% decline, after a 0.6% fall in June.
Japan's unemployment rate rose to 3.8% in July from 3.7% in June. Analysts had expected the unemployment rate to remain unchanged at 3.7%.
Preliminary industrial production in Japan climbed 0.2% in July, missing expectations for a 1.4% rise, after a 3.4% decline in June.
Housing starts in Japan plunged 14.1% in July, missing forecasts of a 10.5% decrease, after a 9.5% drop in June.
EUR/USD: the currency pair fell to $1.3173
GBP/USD: the currency pair traded mixed
USD/JPY: the currency pair rose to Y103.86
The most important news that are expected (GMT0):
09:00 Eurozone Unemployment Rate July 11.5% 11.5%
09:00 Eurozone Harmonized CPI, Y/Y (Preliminary) August +0.4% +0.3%
12:30 Canada Raw Material Price Index July +1.1% +0.7%
12:30 Canada GDP (m/m) June +0.4% +0.3%
12:30 U.S. Personal Income, m/m July +0.4% +0.3%
12:30 U.S. Personal spending July +0.4% +0.2%
12:30 U.S. PCE price index ex food, energy, m/m July +0.1% +0.1%
12:30 U.S. PCE price index ex food, energy, Y/Y July +1.5%
13:45 U.S. Chicago Purchasing Managers' Index August 52.6 56.3
13:55 U.S. Reuters/Michigan Consumer Sentiment Index (Finally) August 79.2 80.4
-
08:00
Switzerland: KOF Leading Indicator, August 99.5 (forecast 97.9)
-
07:01
United Kingdom: Nationwide house price index , August +0.8% (forecast 0.0%)
-
07:01
United Kingdom: Nationwide house price index, y/y, August +11.0%
-
07:00
Germany: Retail sales, real unadjusted, y/y, July +0.7%
-
07:00
Germany: Retail sales, real adjusted , July -1.4% (forecast +0.1%)
-
06:27
Options levels on friday, August 29, 2014:
EUR / USD
Resistance levels (open interest**, contracts)
$1.3279 (3028)
$1.3249 (2504)
$1.3210 (343)
Price at time of writing this review: $ 1.3174
Support levels (open interest**, contracts):
$1.3136 (6049)
$1.3109 (4357)
$1.3075 (6426)
Comments:
- Overall open interest on the CALL options with the expiration date September, 5 is 65467 contracts, with the maximum number of contracts with strike price $1,3400 (6599);
- Overall open interest on the PUT options with the expiration date September, 5 is 63116 contracts, with the maximum number of contracts with strike price $1,3100 (6426);
- The ratio of PUT/CALL was 0.96 versus 0.99 from the previous trading day according to data from August, 28
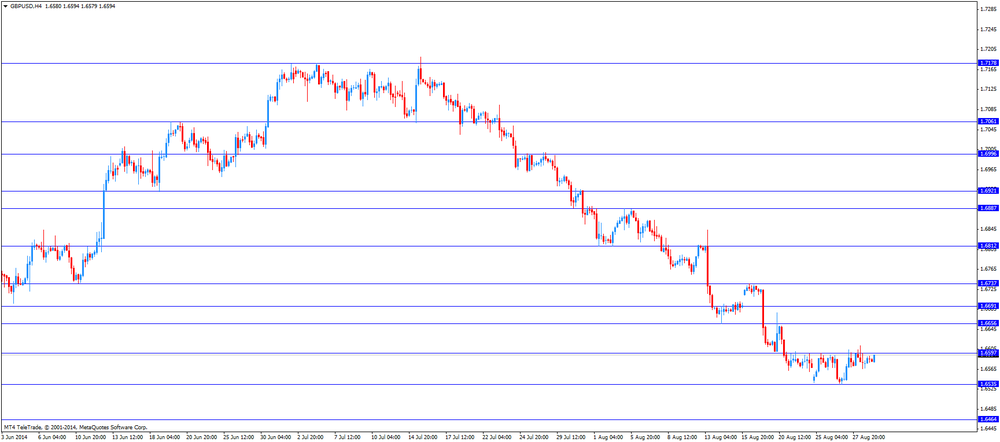
GBP/USD
Resistance levels (open interest**, contracts)
$1.6800 (2560)
$1.6701 (910)
$1.6604 (808)
Price at time of writing this review: $1.6581
Support levels (open interest**, contracts):
$1.6498 (2002)
$1.6400 (1001)
$1.6300 (705)
Comments:
- Overall open interest on the CALL options with the expiration date September, 5 is 30508 contracts, with the maximum number of contracts with strike price $1,7000 (2760);
- Overall open interest on the PUT options with the expiration date September, 5 is 29884 contracts, with the maximum number of contracts with strike price $1,6800 (4025);
- The ratio of PUT/CALL was 0.98 versus 0.98 from the previous trading day according to data from August, 28
* - The Chicago Mercantile Exchange bulletin (CME) is used for the calculation.
** - Open interest takes into account the total number of option contracts that are open at the moment.
-
06:02
Japan: Housing Starts, y/y, July -14.1% (forecast -10.5%)
-
02:30
Australia: Private Sector Credit, y/y, July +5.1%
-
02:30
Australia: Private Sector Credit, m/m, July +0.4% (forecast +0.5%)
-
02:00
New Zealand: ANZ Business Confidence, August 24.4
-
00:51
Japan: Industrial Production (YoY), July -0.9%
-
00:50
Japan: Retail sales, y/y, July +0.5% (forecast -0.1%)
-
00:50
Japan: Industrial Production (MoM) , July +0.2% (forecast +1.4%)
-
00:31
Japan: Tokyo CPI ex Fresh Food, y/y, August +2.8% (forecast +2.7%)
-
00:30
Japan: Tokyo Consumer Price Index, y/y, August +2.8%
-
00:30
Japan: Unemployment Rate, July 3,8% (forecast 3.7%)
-
00:30
Japan: Household spending Y/Y, July -5.9% (forecast -2.7%)
-
00:30
Japan: National Consumer Price Index, y/y, July +3.4%
-
00:30
Japan: National CPI Ex-Fresh Food, y/y, July +3.3% (forecast +3.3%)
-
00:05
United Kingdom: Gfk Consumer Confidence, August 1 (forecast -1)
-